Article

Research on Automatic Power Generation Control and Primary Frequency Regulation Parameter Characteristics of Hydropower Units

1
Baihetan Hydropower Plant, China Yangtze Power Co., Ltd., Liangshan 615400, China
2
China Institute of Water Resources and Hydropower Research, Beijing 100038, China
*
Author to whom correspondence should be addressed.
Water 2025, 17(20), 2944; https://doi.org/10.3390/w17202944
Submission received: 29 July 2025 / Revised: 16 September 2025 / Accepted: 19 September 2025 / Published: 13 October 2025
(This article belongs to the Special Issue Research Status of Operation and Management of Hydropower Station)

Abstract

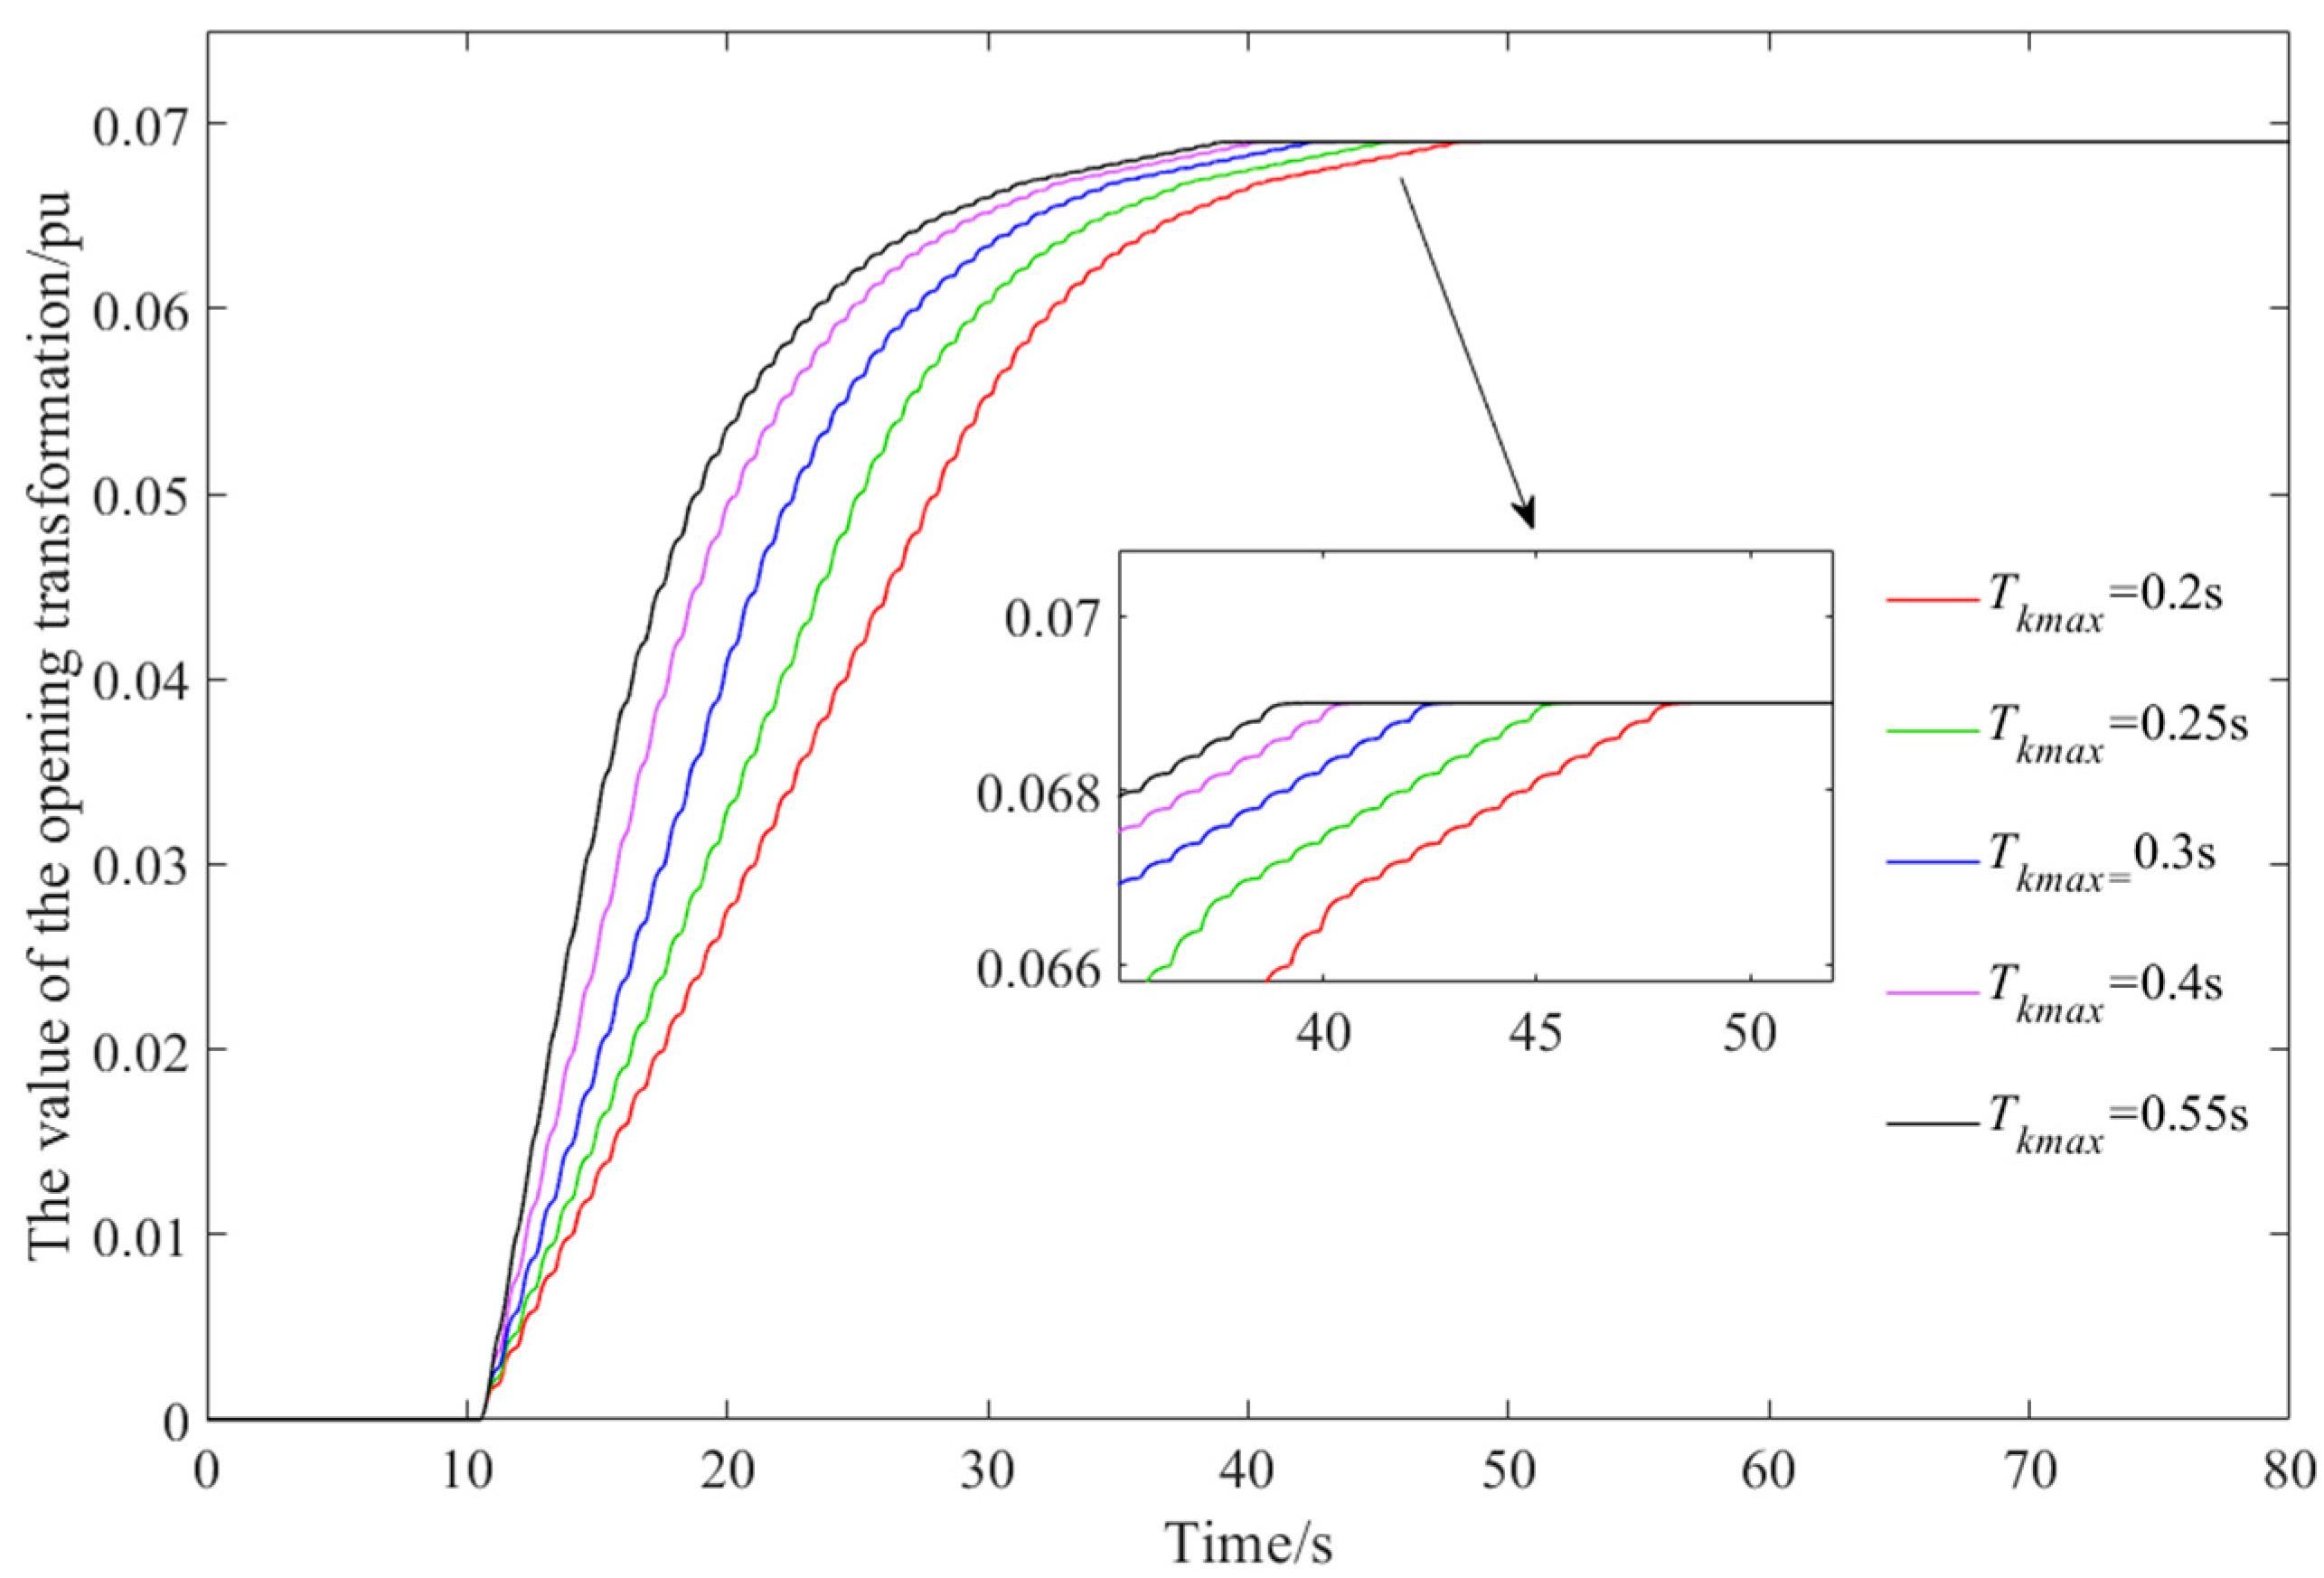
With the increasing integration of variable renewable energy into power systems, the frequency regulation capability of hydroelectric units has become crucial for ensuring grid stability. In response to grid disturbances, where Primary Frequency Regulation (PFR) and Automatic Generation Control (AGC) are activated sequentially in actual operation, this paper employs parameter characteristic analysis to systematically investigate the influence of several factors—including turbine operating head, PWM parameters, and governor parameters—on the active power regulation process of hydroelectric units. The study first compares the response characteristics under different heads and PWM/pulse parameters within the AGC framework. It then examines the effects of pulse duration limits and integral adjustments on guide vane movement and correction efficiency. Finally, under the PFR framework, the impacts of head, steady-state slip coefficient, and integral gain on the amplitude and speed of frequency response are analyzed. Simulation results demonstrate that as the set value of Tkmax increases, the operating range of the guide vane opening within the pulse cycle expands, and the time required for power correction is significantly reduced. Specifically, when Tkmax is increased from 0.2 to 0.55, the regulation time is shortened by 44%. These findings offer theoretical guidance and practical insights for parameter optimization and operational scheduling of hydropower units.

1. Introduction

1.1. Research Background and Significance

In recent years, with the large-scale consumption of traditional fossil fuels, issues such as air pollution and extreme weather have become increasingly prominent, accelerating the pace of energy structure optimization and adjustment. The transition to low-carbon and clean energy has become an irreversible trend. Decarbonization, referring to the systematic reduction of carbon emissions in energy production and consumption, has become a central strategy to mitigate global climate change and achieve sustainable development goals [1,2]. The transition to low-carbon and clean energy is therefore regarded as an irreversible trend, wind energy has been widely utilized due to its abundance and significant development potential. However, wind turbines face complex operating conditions and environmental challenges during long-term operation, such as gear system faults and extreme offshore loads [3,4], and hydropower capacity has also demonstrated a steady growth trajectory worldwide [5]. In line with this trend, diverse research efforts have been conducted to support the safe and efficient utilization of renewable and sustainable energy systems. For instance, a text-driven decision analysis framework has been proposed for safety risk pre-control in large-scale hydropower projects, specifically targeting falling accidents and providing actionable insights for risk management [6]. In distribution systems, a coordinated AC/DC voltage margin control strategy has been developed to alleviate voltage violations in rural power grids with interconnected DC busbars [7]. From the perspective of energy markets, a blockchain-based operation and trading optimization scheme has been introduced for multi-microgrids, ensuring both operational efficiency and market fairness [8]. Furthermore, in wind power forecasting, recent studies have investigated the extraction and application of intrinsic predictability in day-ahead forecasting of wind farm clusters [9], as well as a very short-term forecast error correction method for wind power clusters based on load peak–valley characteristics [10]. These contributions collectively highlight the significance of integrating advanced data-driven techniques, optimization models, and intelligent control strategies to facilitate the decarbonization transition and enhance the reliability of renewable energy systems.
Hydropower units are particularly well-suited for frequency regulation due to several inherent advantages: rapid start-up and load adjustment capabilities, high operational flexibility, and the ability to provide rotational inertia and fast reserve response. These characteristics make hydropower an effective solution for mitigating frequency deviations caused by fluctuations in renewable generation or load demand. Hydropower plants can quickly modulate active power output through primary frequency control (PFC), which serves as the first line of defense against frequency instability. Although PFC can dampen frequency oscillations, it may not fully restore the system frequency to its nominal value. Therefore, secondary frequency regulation, commonly implemented via Automatic Generation Control (AGC), is necessary to fine-tune power output according to dispatch commands and achieve active power balance across the grid.
From a system-wide perspective, frequency regulation methods are typically organized in a hierarchical structure consisting of primary, secondary, and tertiary frequency regulation. Primary frequency regulation is an automatic response: the turbine governor adjusts output in real time based on speed deviations to counteract sudden frequency fluctuations. Secondary frequency regulation, commonly implemented through Automatic Generation Control (AGC), fine-tunes unit output to restore the frequency to its rated value and ensures scheduled power exchanges across interconnections. Finally, tertiary frequency regulation involves centralized dispatch decisions or optimization programs that reallocate generation among units to maintain system balance while also achieving economic efficiency.
However, in some practical scenarios—especially when hydropower units are operated in small grid opening modes—the performance of both PFC and AGC may be compromised [11]. In such modes, the proportional–integral–derivative (PID) parameters of the turbine governor are often reduced, leading to degraded frequency regulation performance in terms of response time, regulation rate, accuracy, and accumulated energy contribution. This decline fails to meet the requirements for grid ancillary service performance assessments and operational analysis. Moreover, under small grid opening conditions, AGC commands are typically executed via intermittent pulse-width modulation through the station monitoring system [12,13]. This strategy is constrained by the processing efficiency of the local control unit (LCU), the response characteristics of the actuators, and inherent control limitations, resulting in slower regulation, reduced accuracy, and occasional reverse regulation phenomena. Under the small grid opening mode, the implementation of automatic generation control relies on the monitoring system to regulate power, and power regulation commands can only be achieved through intermittent pulse width modulation [14]. This is constrained by the processing efficiency of the on-site control unit program of the hydroelectric unit, the response speed of the actuators, and the inherent drawbacks of this control strategy, resulting in a significant decline in power regulation quality compared to the previous large grid power mode. Issues such as slow regulation speed, poor accuracy, and frequent reverse regulation phenomena arise.
These challenges significantly delay grid frequency recovery after disturbances and increase operational risks. To address these practical issues, this paper adopts a parameter-oriented analytical approach to gain deeper insight into the control characteristics of hydropower systems during frequency regulation. We consider the integrated process of PFC and AGC and identify key influencing parameters—such as turbine working head, LCU settings, and controller gains—to establish comprehensive evaluation indices using both numerical and graphical methods. Through this approach, we aim to clarify the impact of various parameters on regulation performance and provide actionable insights for improving the frequency regulation capabilities of hydropower units in future power systems.

1.2. Current State of Research

Ensuring the quality of power transmission is a critical task that power systems must undertake during operation. Grid frequency, as an important standard for evaluating power quality, must be controlled within a reasonable range around the rated value [15]. Once the balance between the power supply side and the consumption side is disrupted, grid frequency will fluctuate, deviating from a stable operating state. The power consumption on the load side is not constant. Therefore, the essence of real-time control of grid frequency is: based on the direction and magnitude of the difference between the actual grid frequency value and the rated value, the power supplied by the generating units connected to the grid is adjusted online through their own control systems and the AGC system on the grid side to track the changes in power consumption on the load side, ultimately achieving a balance between power supply and consumption. According to grid operation standards, all grid-connected hydroelectric units must have the capability to perform primary frequency regulation. Primary frequency regulation is achieved by utilizing the control characteristics of the governor to achieve self-regulation of grid frequency. Specifically, this involves using PID control laws to real-time adjust the unit’s power output, thereby eliminating grid frequency deviations in real time [16]. Secondary frequency regulation also relies on the governor’s actuator to achieve its objectives, but it is not self-regulated. but rather involves the grid side considering various influencing factors such as unit economic operation and power exchange between regional grids, and then issuing power command values to the generating units, serving as a macro-control measure.
The hydraulic transition process for primary frequency regulation in grid-connected units is relatively complex, involving numerous factors such as hydraulic, mechanical, and electrical aspects. When studying primary frequency regulation in hydroelectric units, it is essential to comprehensively consider these elements for in-depth analysis. The most critical component in achieving primary frequency regulation is the turbine governor. Currently, there are two mainstream control modes for the governor system of grid-connected hydroelectric units: power mode and opening mode [17,18]. When the turbine governor is in power mode, it bypasses the monitoring system and directly receives active power regulation commands to achieve the power regulation transition process [19]. When the governor is in opening mode, the monitoring system takes over the task of implementing power closed-loop regulation. The plant-wide active power commands from the dispatch center are transmitted through the monitoring system and distributed to the local-level control devices, i.e., the Local Control Unit (LCU), according to pre-set load allocation rules. The LCU calculates the active power difference between the target value and the actual value at that moment, and uses pulse width modulation to send pulses of a certain size to the governor according to the pre-set relationship between pulses and power conversion.
Upon receiving these continuous periodic pulse commands, the governor modifies the guide vane opening setpoint through the pre-set pulse/guide vane opening integral conversion circuit, entering the active power adjustment transition process [20]. The opening control mode has the advantages of good adaptability and smooth regulation, and was the regulation mode chosen by most hydropower units during this period. Establishing the primary frequency regulation and automatic generation control model for hydropower units under the opening mode is the foundation for subsequent research on AGC characteristics and new strategies for coordinating with primary frequency regulation. There has been long-term research on primary frequency regulation characteristics both domestically and internationally. For example, Reference [21] abandoned the coefficients previously used to describe the primary frequency regulation capability of power systems and instead used the PFCA (Primary Frequency Control Ability) indicator to characterize the dynamic characteristics of primary frequency regulation from a physical perspective. It also derived static and dynamic PFCA expressions using a model. Other studies have focused on the stability and regulation quality of primary frequency control, as well as the relationship between primary frequency control parameters and low-frequency oscillations in the power grid [22,23]. However, research on the regulation of active power characteristics in monitoring systems for hydroelectric units has not received the same level of attention from scholars. Most studies have focused on power closed-loop regulation of governors, optimization of AGC load allocation strategies, methods to avoid operation in vibration zones, and frequency oscillations caused by AGC instability [24,25]. As time has passed, the structure of China’s power grid has become increasingly complex, and the grid now has higher standards for the dynamic performance of hydroelectric unit AGC load regulation processes. Hydroelectric units achieve active power regulation through speed governors, monitoring systems, and other components, a process that involves various strong nonlinear factors. Numerical simulation methods can provide a more in-depth understanding of the system’s various characteristics.
Based on the provided literature review, the research gaps can be summarized as follows:
Although significant research has been conducted on primary frequency regulation (PFC)—such as the development of new evaluation metrics like PFCA, stability and regulation quality analyses, and the relationship between PFC parameters and grid low-frequency oscillations—there is a notable lack of in-depth studies focusing on the active power regulation characteristics within the monitoring systems of hydroelectric units under opening control mode.
Specifically, the research gaps include the following:
(1)
Inadequate attention to active power regulation via monitoring systems in opening mode: While many studies concentrate on governor power closed-loop control or AGC allocation strategies, the process by which the monitoring system and LCU achieve power regulation through pulse modulation and integral conversion in opening mode remains underexplored.
(2)
Lack of detailed modeling and simulation of the full AGC process under opening control: A comprehensive model integrating setpoint distribution, pulse modulation, guide vane actuation, and nonlinear turbine dynamics is essential—yet currently insufficient—for analyzing dynamic performance and control interactions.
(3)
Limited understanding of how nonlinear factors impact regulation quality: the inherent nonlinearities in hydraulic turbines, actuators, and control conversion processes (e.g., pulse-to-opening integration) under opening mode require further systematic numerical and experimental investigation.
(4)
Absence of effective strategies to improve dynamic performance and avoid issues like reverse regulation: As grid standards become stricter, there is a pressing need for new control methods tailored to opening operation that can enhance speed, accuracy, and stability during AGC and PFC.
These gaps motivate the need for more focused research on the characteristics and regulation optimization of monitoring-based power regulation in hydroelectric units operating under opening mode.

1.3. Innovations and Contributions

To comprehensively consider all relevant elements of the subsystems involved in the process and conduct a more thorough analysis, it is necessary to establish a refined model of primary frequency regulation and automatic generation control for all subsystems of a hydropower station. Additionally, simulations of the primary frequency regulation process of hydropower units and the active power regulation transition process of the monitoring system should be conducted. Based on the simulation results, an analysis should be performed to examine the extent and way various parameters influence the transition process, laying the foundation for further analysis. This paper makes the following key contributions:
(1)
Develops an Integrated High-Fidelity Simulation Model: this paper establishes a refined, integrated model of a hydropower station that combines both the Primary Frequency Regulation (PFR) and Automatic Generation Control (AGC) subsystems. This holistic model allows for a more comprehensive and realistic simulation of the complex interactions during grid frequency stabilization and power adjustment processes, which is often overlooked in studies that treat these systems in isolation.
(2)
Provides a Systematic Parameter Characteristic Analysis: through extensive numerical simulations based on the established model, this study systematically analyzes the influence patterns of critical but often neglected parameters—such as operating head, PWM settings, governor parameters, steady-state slip coefficient, and integral gain—on both the AGC power transition and PFR response. The results clearly delineate the distinct and unique impact of each parameter on regulation performance.
(3)
Offers Practical Insights for System Optimization: the findings provide valuable practical guidance for the parameter configuration of hydroelectric units, especially those operating under complex conditions like small grid opening modes. By identifying how specific parameters affect regulation capability, the study lays a foundational basis for optimizing control strategies to enhance the speed, accuracy, and stability of both PFR and AGC.
The overall analysis flowchart of this study is shown in Figure 1.
To the best of our knowledge, the specific integration of turbine head, PWM pulse parameters, and governor parameters in the joint analysis of AGC and PFR processes has not been reported in existing literature, which highlights the novelty of this study.

2. Materials and Methods

2.1. Modeling of PFC and AGC Systems for Hydroelectric Power Generation Units

Mathematical models are an essential foundation for conducting effective scientific research. Only by establishing mathematical models that can reflect the operational mechanisms and characteristics of the research object within reasonable assumptions can a solid foundation be laid for further in-depth exploration of the research object. Therefore, before studying the control characteristics of primary frequency regulation and AGC, it is first necessary to study the mathematical models of the objects involved in these two processes.
Primary frequency regulation and automatic generation control are two important functions through which hydroelectric units participate in grid regulation. When performing their functions through certain processes, they exhibit varying degrees of hydraulic-mechanical-electrical coupling, resulting in complex dynamic characteristics. In this chapter, considering the operational characteristics of a domestic power grid under the current small-scale grid opening mode, a mathematical model for primary frequency regulation and automatic generation control of hydroelectric units, incorporating LCU, is established for the theoretical analysis in this paper.

2.1.1. Modeling of PFR System

Grid-connected hydroelectric units utilize the characteristics of their control systems, namely governors, to achieve primary frequency regulation. Specifically, this involves online identification of the difference between the actual grid frequency and the rated frequency. When this difference exceeds the preset frequency deadband, the governor automatically controls the active power of the unit. This process is a hydraulic transition process involving the coordinated regulation of multiple subsystems. To study its control characteristics, mathematical models must be established for each subsystem.
Water Diversion System Model
The essence of modeling the water supply system of a hydroelectric power unit is to analyze the transmission laws of water hammer pressure generated by the directed flow of water within the water supply pipeline based on the principles of fluid mechanics, thereby achieving the objective of calculating the water hammer pressure and flow rate at any cross-section within the water supply pipeline. The linear mathematical model currently used to calculate water hammer pressure has advantages such as simple and clear expressions and convenient calculations, and is commonly used for calculating small-scale transient processes in short water supply pipelines with a single-pipe, single-unit configuration. When neglecting the elasticity of the pipeline walls and internal water, as well as the friction resistance of the water flow, the following rigid water hammer differential equations and transfer functions can be established [25,26]:
h = T w 0 d q t d t T w 0 = Q 0 L w t g H 0 f w t
G w s = H s Q t s = T w 0 s
In the equation, t(s) is the calculation time, Q0 (m3/s) is the flow rate at the initial moment of the water turbine, H0 (m)is the working head at the initial moment of the water turbine, Lwt is the length of the pressure water supply pipeline, fwt is the cross-sectional area of the pressure water supply pipeline, and g (N/kg) is the local gravitational acceleration.
When the design length of the water supply pipeline is relatively long, and the elasticity of the pipeline wall and internal water body as well as the friction resistance of the water flow are ignored, the functional expression is as follows:
G w ( s ) = H ( s ) Q t ( s ) = 2 σ wt e T r 2 s e T r 2 s e T r 2 s + e T r 2 s = 2 σ wt sh T r 2 s ch T r 2 s = 2 σ wt tanh T r 2 s
σ wt 0 = T wt 0 T r
T r = 2 L wt Q t A wt
where σ wt 0 is the pipeline characteristic coefficient; Tr is the water hammer phase length. e is the base of natural logarithm.
Expanding Equation (3) using a Taylor series expansion and ignoring head loss yields a third-order elastic water hammer model for the water supply system [27], as shown in:
G w 3 dim ( s ) = H ( s ) Q t ( s ) = σ wt 0 1 24 T r 3 s 3 + T r s 1 8 T r 2 s 2 + 1
Speed Governor System Model
The hydro turbine governor system established in this section is a microcomputer governor model widely used in engineering. The hydro turbine governor is a core component for ensuring safe and efficient production of hydro turbines. It mainly consists of two parts: a microcomputer regulator and a hydraulic actuator. Its components are shown below:
Most of the existing microcomputer controllers in China use PID control strategies, and the parallel PID control strategy is the most widely used strategy. Its block diagram is shown below:
The speed regulator block diagram shown in Figure 2 is converted into the corresponding transfer function as shown below:
G PID s = u s x c s x s = K D s 2 + K P s + K I b p K D s 2 + K P + 1 b p s + K I
In the equation: s is the Laplace operator, Kp is the proportional coefficient, KI is the integral coefficient, KD is the differential coefficient, and bp is the steady-state slip coefficient.
After grid connection, the PI control law is generally used. At this point, the differential equation and transfer function of the governor are simplified to [26]:
b p K I + 1 d u d t + b p K I = K p d x d t + K I x
G PID ( s ) = K P s + K I b p K p + 1 b p s + K I
After receiving the low-voltage control signal from the microcomputer controller, the signal is converted into a mechanical hydraulic signal suitable for the hydraulic actuator through the integrated amplification and power-hydraulic signal conversion stages. This signal then controls the corresponding equipment, such as the auxiliary relay, main pressure-regulating valve, and main relay, to achieve the desired control of the water turbine guide vane opening and closing. The hydraulic actuator can be described by the following differential equation and transfer function, neglecting the response time constant of the auxiliary relay:
T y d y d t + K 0 y = K 0 u
G s e r v o ( s ) = K 0 T y s + 1
In the equation, K0 is the comprehensive amplification coefficient, Ty is the reaction time constant of the main relay, and u is the control signal input.
Hydraulic Turbine Model
The flow of water within a hydro turbine is extremely complex, exhibiting intricate hydraulic-mechanical coupling characteristics. The intrinsic relationships between key input and output parameters such as rotational speed, flow rate, and mechanical torque continuously evolve as operating conditions change. In principle, dynamic characteristics should be used when analyzing the transient processes of a hydro turbine. However, obtaining accurate dynamic characteristics of a hydro turbine remains a challenging issue in engineering practice. Therefore, for cases where the rate of change in operating conditions is small and the speed change does not exceed a certain value (ω < 1 s(−1)), static characteristics can be used to replace dynamic characteristics for modeling and analysis. The specific relationships between parameters are as follows [28]:
M t = M t ( Y , n , H ) Q t = Q t ( Y , n , H )
In the equation, Y, n, H, Qt, and Mt represent the guide vane opening (°), rotational speed (r/min), working head (m), flow rate (m3/s), and torque of the water turbine (N·m), respectively.
Expanding Equation (12) using a Taylor series, and considering that the range of parameter changes is small, we can omit the second order and higher order terms to derive a six-parameter linear model for the water turbine as shown in Equation (12), where the parameters are expressed as relative deviation values [29]:
m t = e y y + e x x t + e h h q t = e qy y + e qx x t + e qh h
In the formula:
e h = m t / h , e x = m t / x , e y = m t / y e qh = q t / h , e qx = q t / x , e qy = q t / y
mt, qt, y, xt, and h represent the torque (N·m), flow rate (m3/s), guide vane opening (°), rotational speed (r/min), and head of the water turbine (m), respectively;
ey, ex, and eh represent the transmission coefficients of the torque of the water turbine to the guide vane opening, rotational speed, and working head, respectively;
eqy, eqx, and eqh represent the transmission coefficients of the flow rate of the water turbine to the guide vane opening, rotational speed, and working head, respectively;

2.1.2. Modeling of AGC Systems

The power closed-loop regulation process of the hydroelectric power plant in the opening mode is shown in the figure. First, the overall active power command of the hydroelectric power plant at a certain moment is transmitted through the power grid dispatch center to the next level, i.e., the control level of the hydroelectric power plant (PCL). The PCL distributes the power targets of all units in the plant according to the previously established load allocation rules and issues power adjustment commands to the LCUs of the units responsible for regulation. The LCU, as the on-site unit control unit, uses the pre-set PWM method in the equipment to complete the task of correcting the active power. The specific control rules are as follows: when the current actual active power output of the unit deviates from the active power command distributed by the LCU by more than the set power dead zone, the difference between the two power values is taken and the absolute value is used as the basis for the LCU to send power pulses, while the increase/decrease pulses are selected based on the direction of the deviation. The final criterion for determining whether the current regulation cycle has ended is whether the newly measured real-time power deviation value has once again entered the power deadband range. These continuous active power correction pulses from the LCU are converted by the governor into commands to adjust the guide vane opening, which are ultimately executed by the hydraulic actuator to control the guide vane to move in the specified direction, thereby achieving active power correction.
The typical monitoring system control scheme widely used in power grids is shown in Figure 3 [30]. Since the opening mode is the most basic and reliable control method for hydro turbine regulation systems at present, the LCU active power control and speed control systems of most main hydropower units in China operate according to the second method shown in the figure. The specific model diagram of LCU active power control is shown in Figure 4 and Figure 5.
Mathematical Model of Pulse Width Modulation in Surveillance Systems
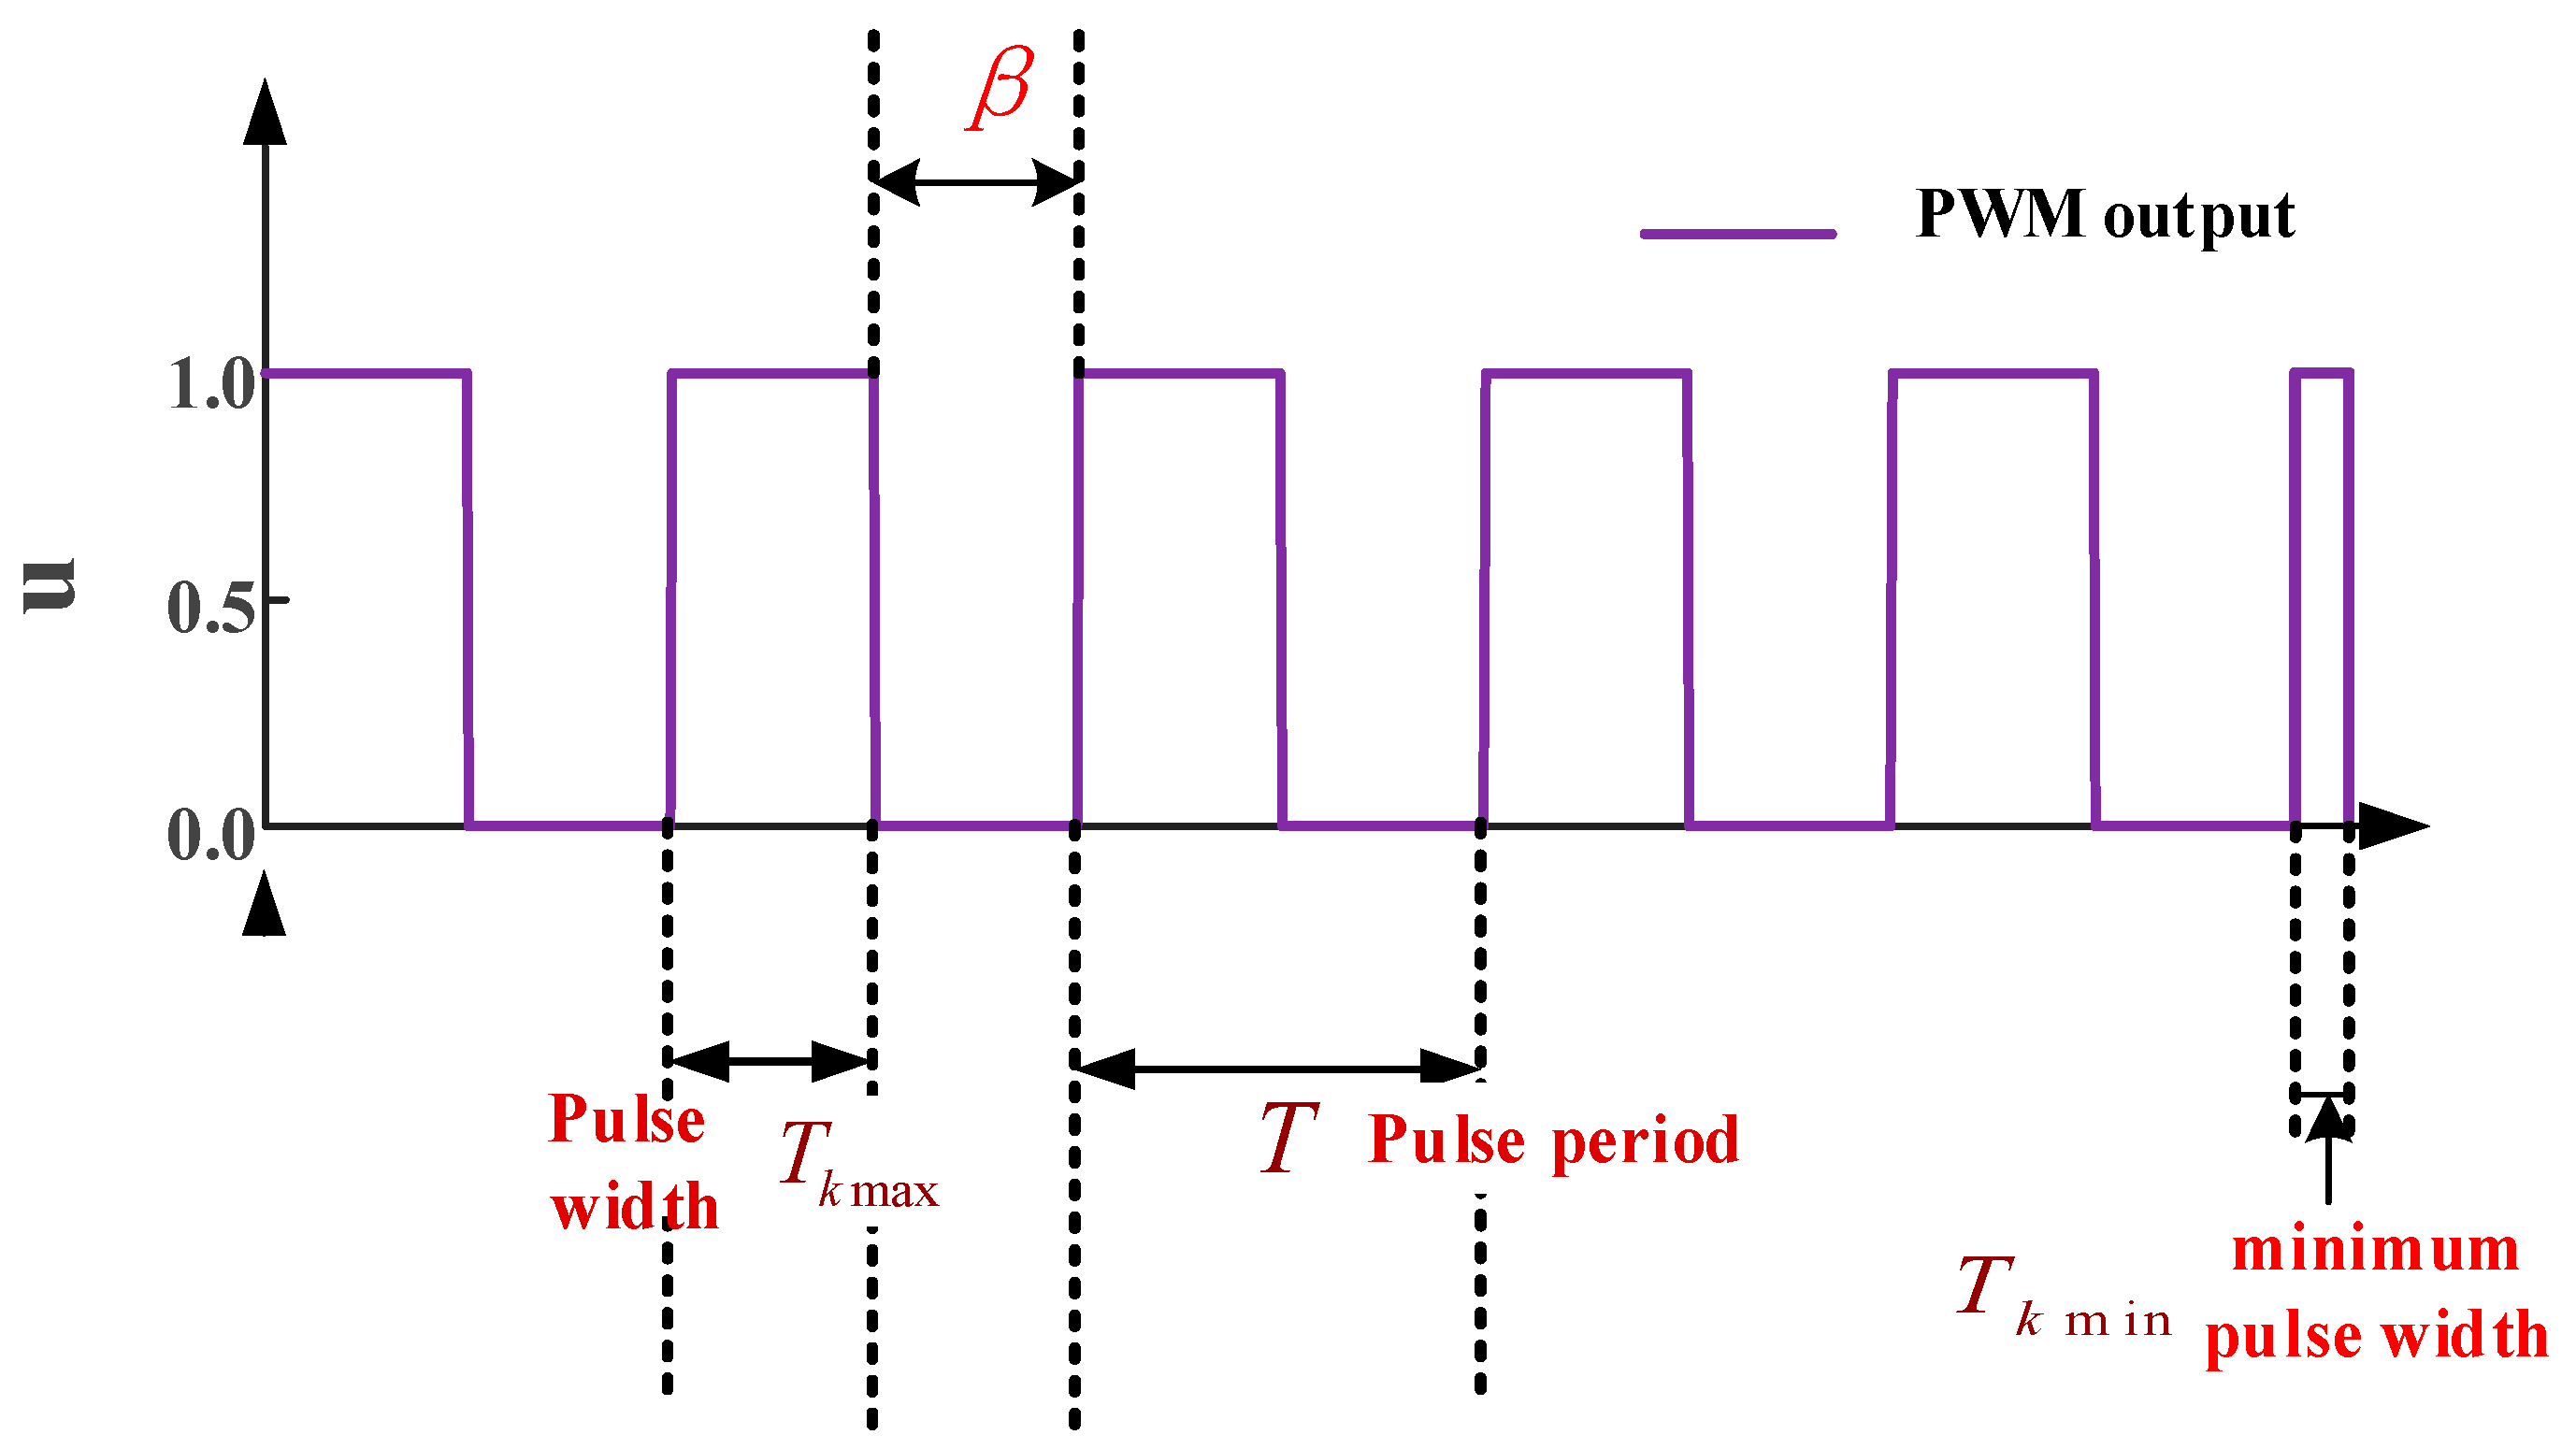
The PWM method is the most important part of adjusting active power. The pulse u(t) output by the PWM method is calculated using the mathematical expression in Equation (14) [31].
u ( t ) = m ( Δ P ) = M sign ( Δ P ) , t k T , k T + T k 0 , otherwise
In the formula: M is the amplitude of the pulse width of the PWM output; T is the pulse generation period of the PWM output; ΔP is the difference between the active power of the unit and the AGC set power target; sign is the sign function; Tk is the pulse width of the PWM output.
The specific calculation method of the sign function is as follows
s i g n ( σ ) = 1 , σ > 0 0 , σ = 0 1 , σ < 0
The calculation method for pulse width Tk is as follows:
T k = 0 , T k T k min T Δ P / β , T k min < T k < T k max T k max , T k > T k max
In the equation, T is the pulse period (s), β is the control parameter, Tkmax is the maximum pulse time limit within the control period (s), and must satisfy TkmaxT; Tkimin is the minimum time limit. To visually illustrate the PWM output characteristics (s), the increase/decrease pulse waveforms generated by the power deviation are shown in the Figure 6.
LCU Active Power Control Mathematical Model
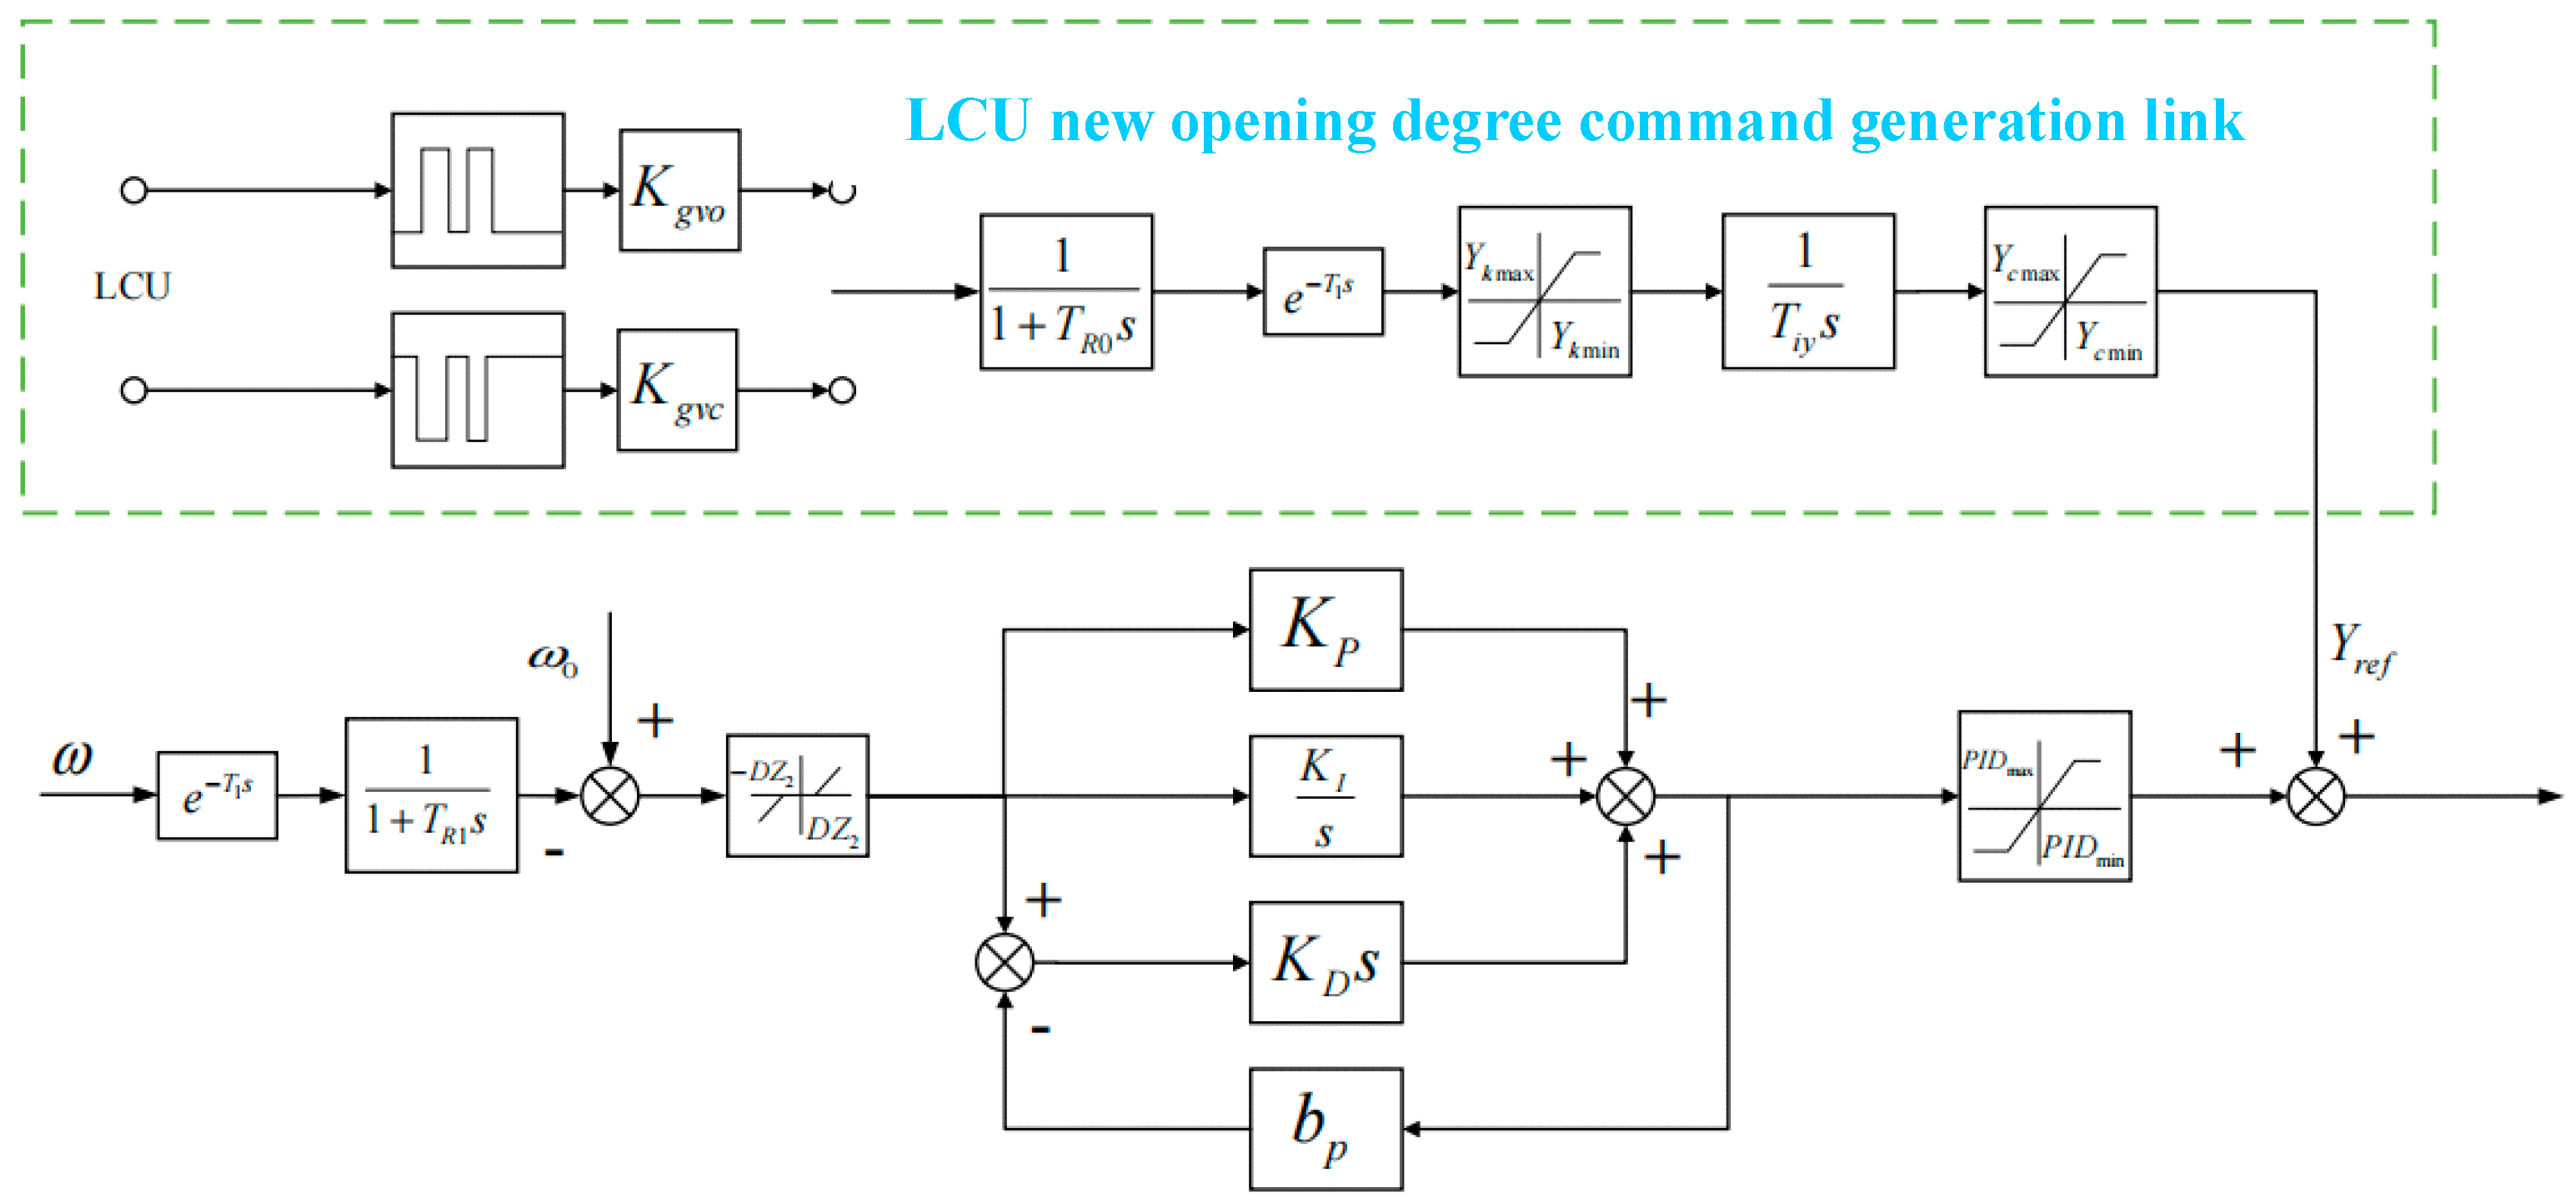
The PWM method outputs a periodic pulse signal to the governor. These signals cannot directly act on the actuator. The governor needs to utilize the time accumulation characteristic of the integral term’s output to convert each pulse step into the guide vane opening of the hydroelectric unit using the corresponding conversion ratio, thereby forming the opening control command Yref. Compared to the commonly used electromechanical transient model of the governor system, the entire governor model adds the opening Yref from the LCU to the final guide vane opening output. The resulting superimposed governor system model is shown in Figure 7.

3. Results

3.1. AGC Parameter Characteristic Analysis

To realize automatic generation control (AGC) functionality, a hydropower unit requires a monitoring system that issues power commands, which are subsequently executed by the governor. The closed-loop correction of power output is a multi-stage process, in which pulse width modulation (PWM) serves as the core mechanism. In addition, the operating head of the hydropower unit significantly influences the system ability to regulate active power. The key control parameters that determine the characteristics of PWM output pulses include: the pulse generation period T, the proportional coefficient β for calculating pulse duration within the period, the maximum pulse duration limit Tkmax within the cycle, the minimum pulse duration limit Tkmin within the cycle, and the integral conversion parameter Tiy in the governor. Examining the dynamic behavior of these parameters during active power regulation, and assessing how specific parameters affect the actuation intensity of guide vanes, provides deeper insights into the control characteristics of AGC in hydroelectric units.
When analyzing the selected parameters, keep all other parameters constant and adjust the values of the selected parameters to simulate the same power regulation process. In this study, the simulation is uniformly defined as a transient process in which the active power of a hydropower unit increases by 10% of its rated value.
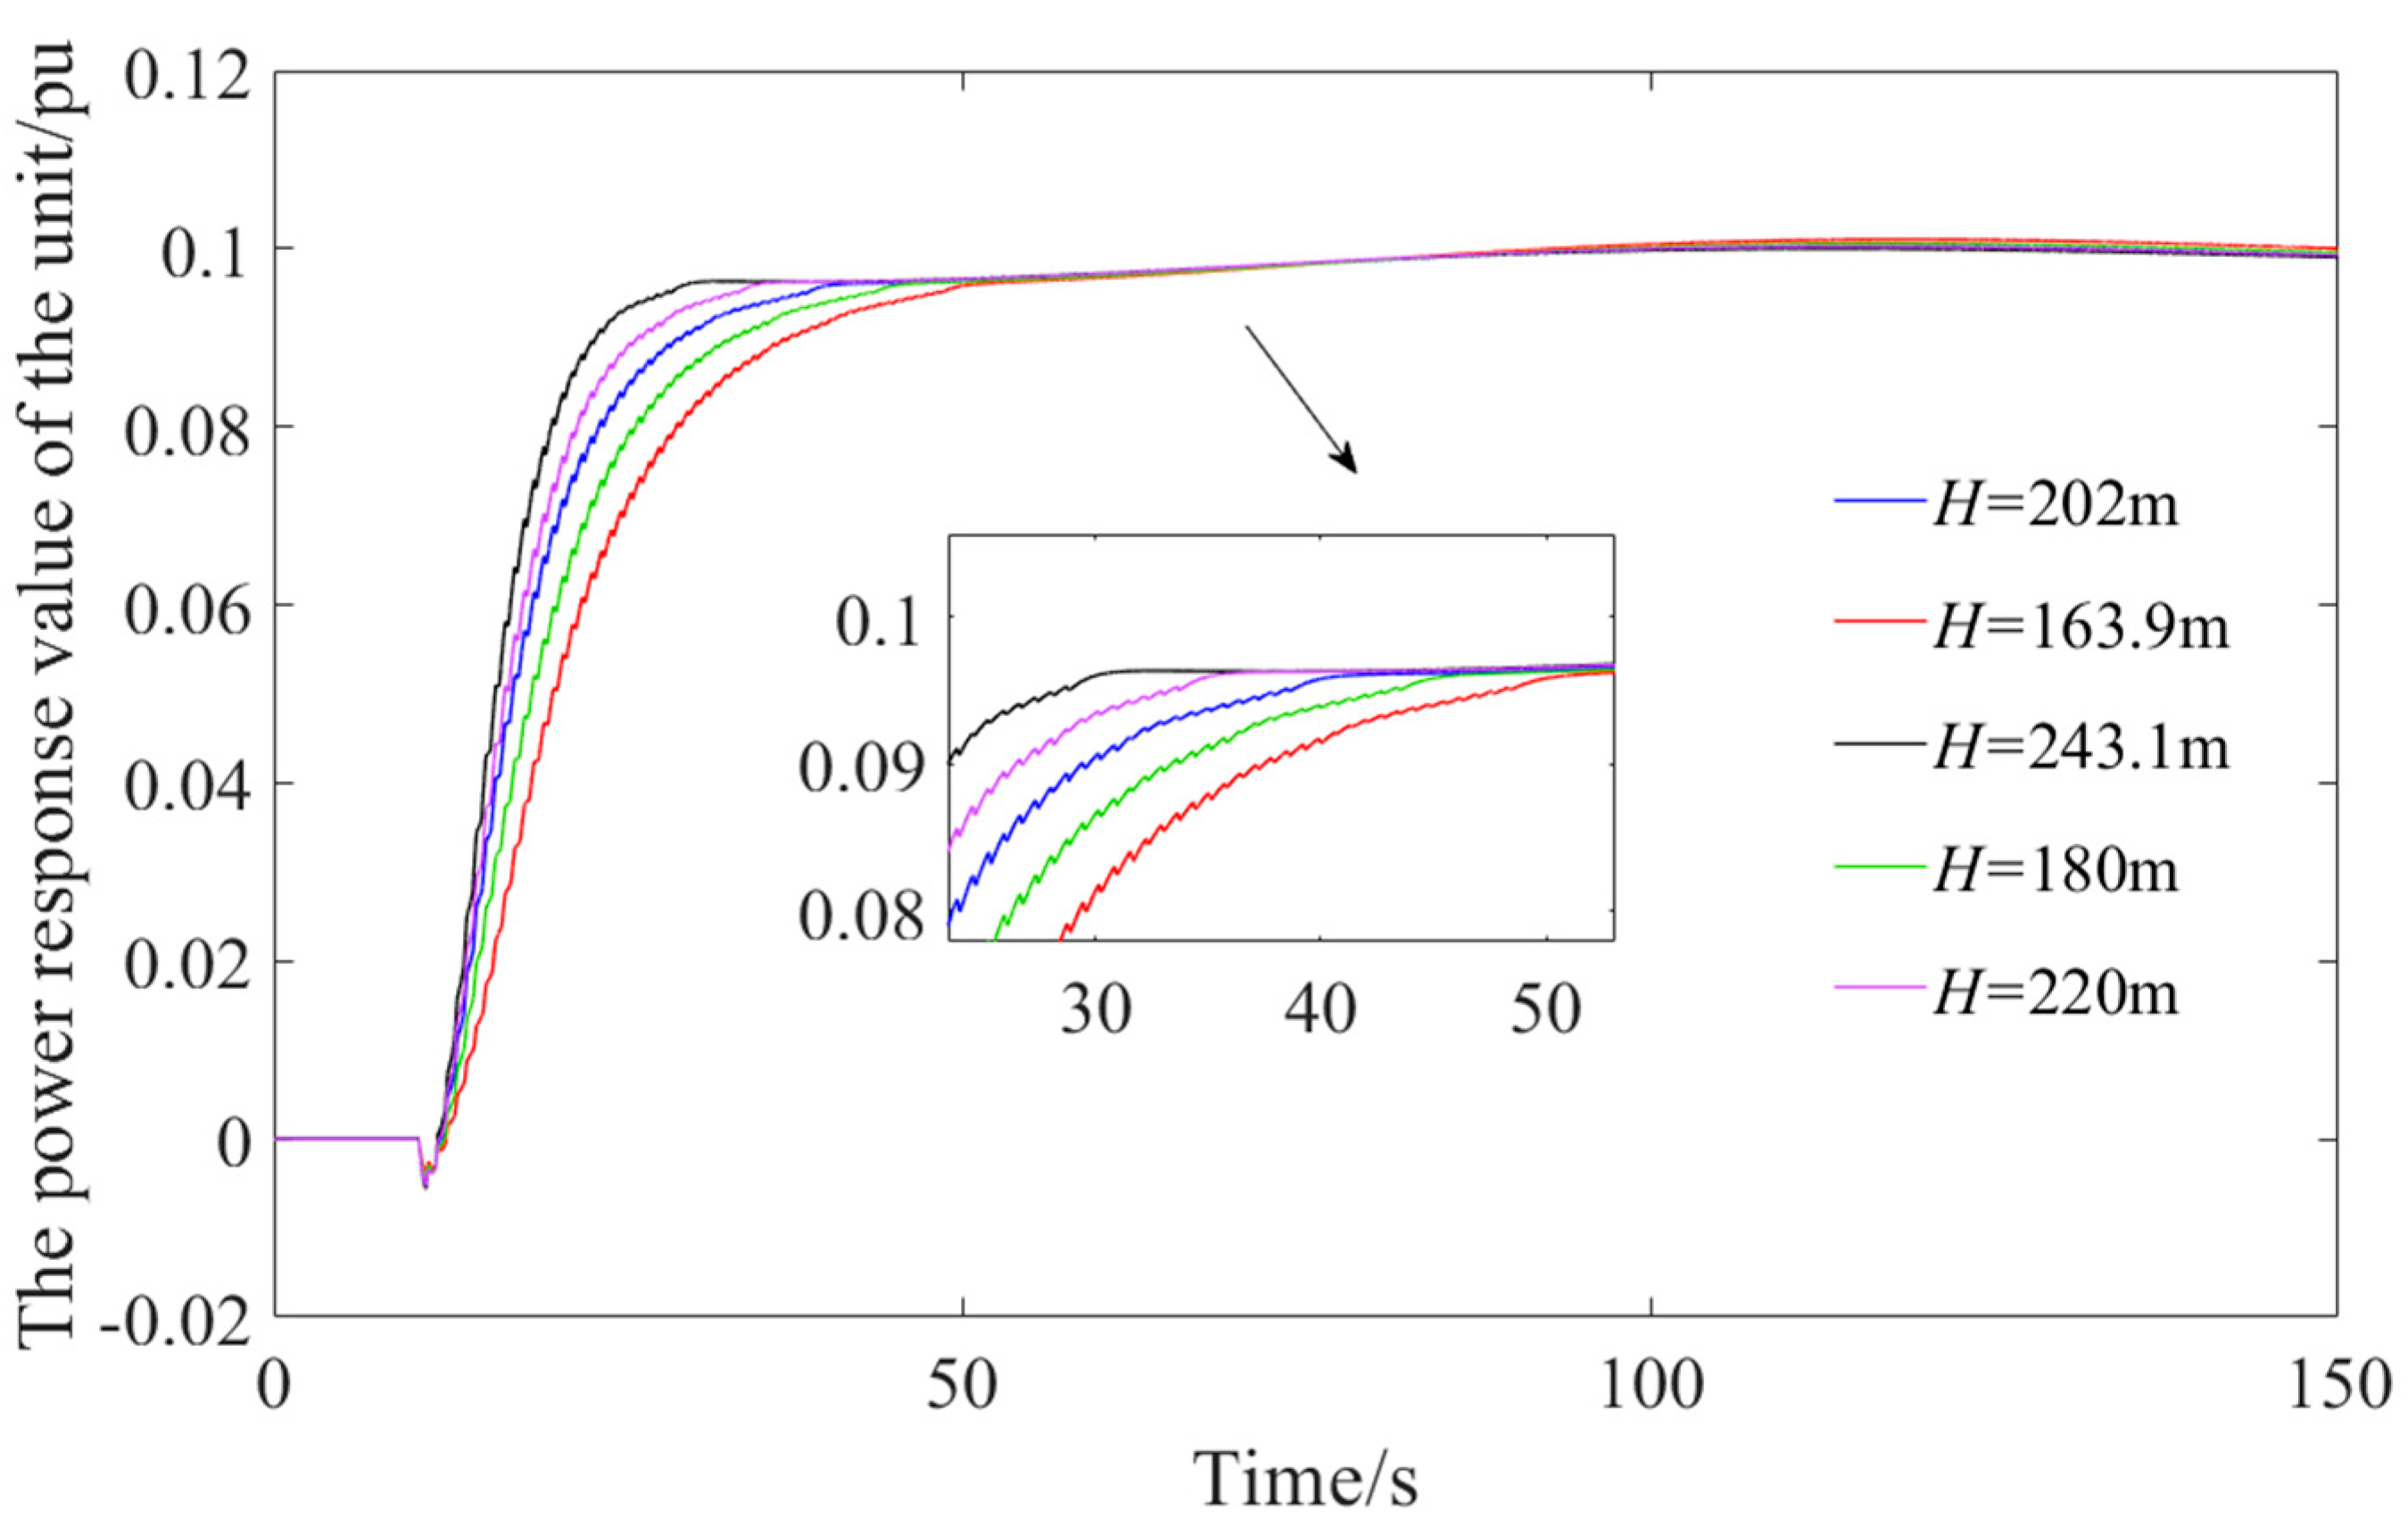
To examine the relationship between hydraulic system parameters and the active power response of hydropower units, particular attention is given to the effect of head on regulation capability. Specifically, the coordinated control characteristics of a hydropower station are investigated by selecting five representative operating heads: the minimum head (163.9 m), the rated head (202 m), the maximum head (243.1 m), and two intermediate values (180 m and 220 m). These conditions are used to model and simulate the unit’s power response.
In the computational analysis, other system parameters are kept unchanged, while the active power regulation trajectories and actual output curves under different head conditions are obtained from the AGC model, which combines a refined hydropower unit model with an equivalent load and network model. Key performance indicators of the regulation process, including regulation time, overshoot, and related metrics, are then evaluated. The definitions of these indicators are as follows:
Regulation time ts: the minimum time required for the response value to reach within ±5% of the steady-state value.
Overshoot δ%: During the response process, the system overshoot is defined as the difference between the peak response output corresponding to the peak time and the steady-state output. If expressed as a normalized value, it is divided by the base steady-state output.

3.1.1. The Effect of Working Head on Power Regulation

The transition process for a 10% increase in selected power is shown below, along with the active power regulation process diagrams and calculation indicators for units under different head conditions:
Figure 8 presents the comparison of the active power regulation process of the unit under different head conditions, with the corresponding regulation indicators summarized in Table 1. The results indicate a clear correlation between the operating head and the unit’s power regulation performance. Specifically, higher head conditions correspond to faster active power response, allowing the unit to reach the target power more rapidly. This observation is further corroborated by the quantitative data in Table 2, which show a monotonic decrease in regulation time as the working head increases.
The underlying mechanism can be attributed to the initial guide vane opening, which is set at 50% of the rated opening. Under higher head conditions, the unit operates closer to its high-efficiency zone, thereby enhancing the responsiveness of the hydraulic–mechanical system and reducing overshoot during the regulation process. In contrast, at the minimum head, the initial operating point deviates significantly from the optimal efficiency region, resulting in pronounced overshoot during power adjustments.
These findings suggest that, in practical operation, maintaining a larger operating head can position the unit near its optimal efficiency point, ensuring rapid active power regulation while minimizing undesirable overshoot. This highlights the critical role of head management in optimizing the dynamic performance of hydroelectric units and underscores the importance of integrating hydraulic characteristics into automatic generation control strategies.

3.1.2. Analysis of the Effect of PWM Parameters on Active Power Regulation

To achieve automatic power generation control, a hydropower unit requires a monitoring system to provide power commands, which are executed by a governor. This power closed-loop correction process involves multiple stages, with the core stage being PWM. Key control parameters affecting the characteristics of PWM output pulses include: pulse generation period T, duration calculation ratio coefficient β, the maximum pulse duration limit Tkmax within the period, the minimum pulse duration limit Tkmin within the period, and the opening integral conversion parameter Tiy in the governor. Analyzing the role of these main control parameters in the active power regulation transition process and the impact of some parameters on the working intensity of the guide vanes can help us further deepen our understanding of the automatic power generation control characteristics of hydroelectric units. The effect of various parameters on PWM output is shown in Figure 9.
The Effect of Fixed Pulse Width Calculation Parameters β
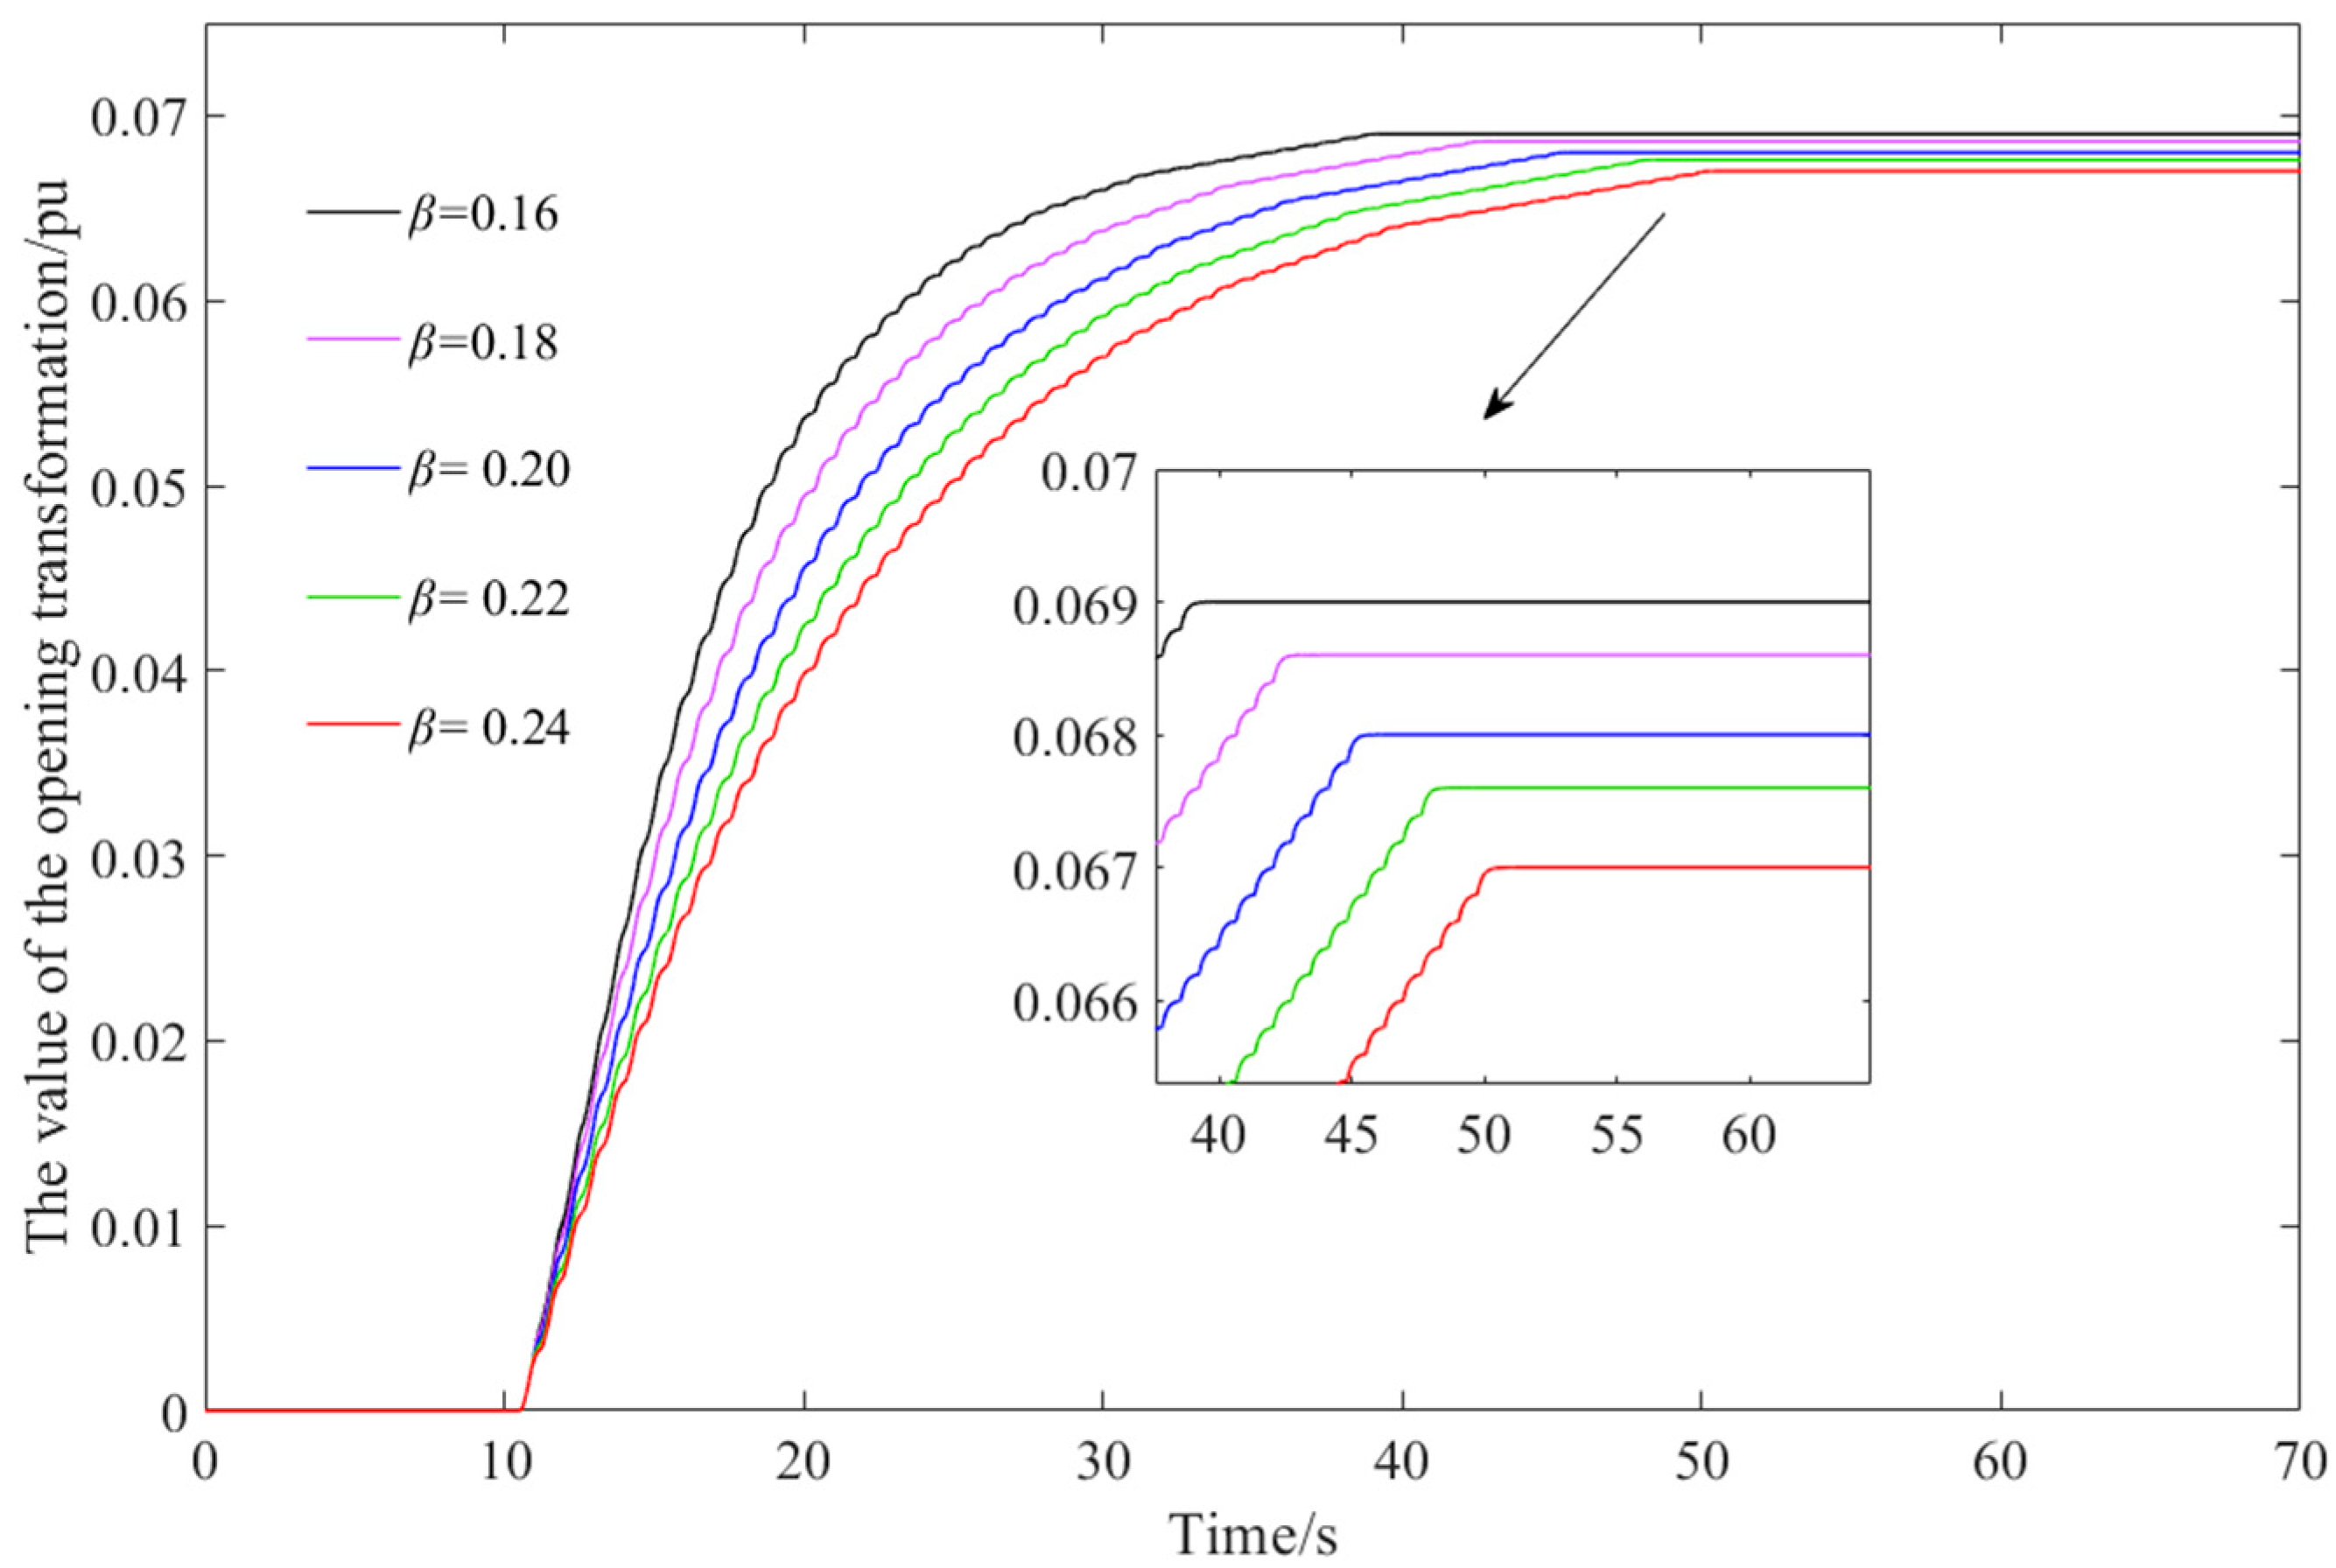
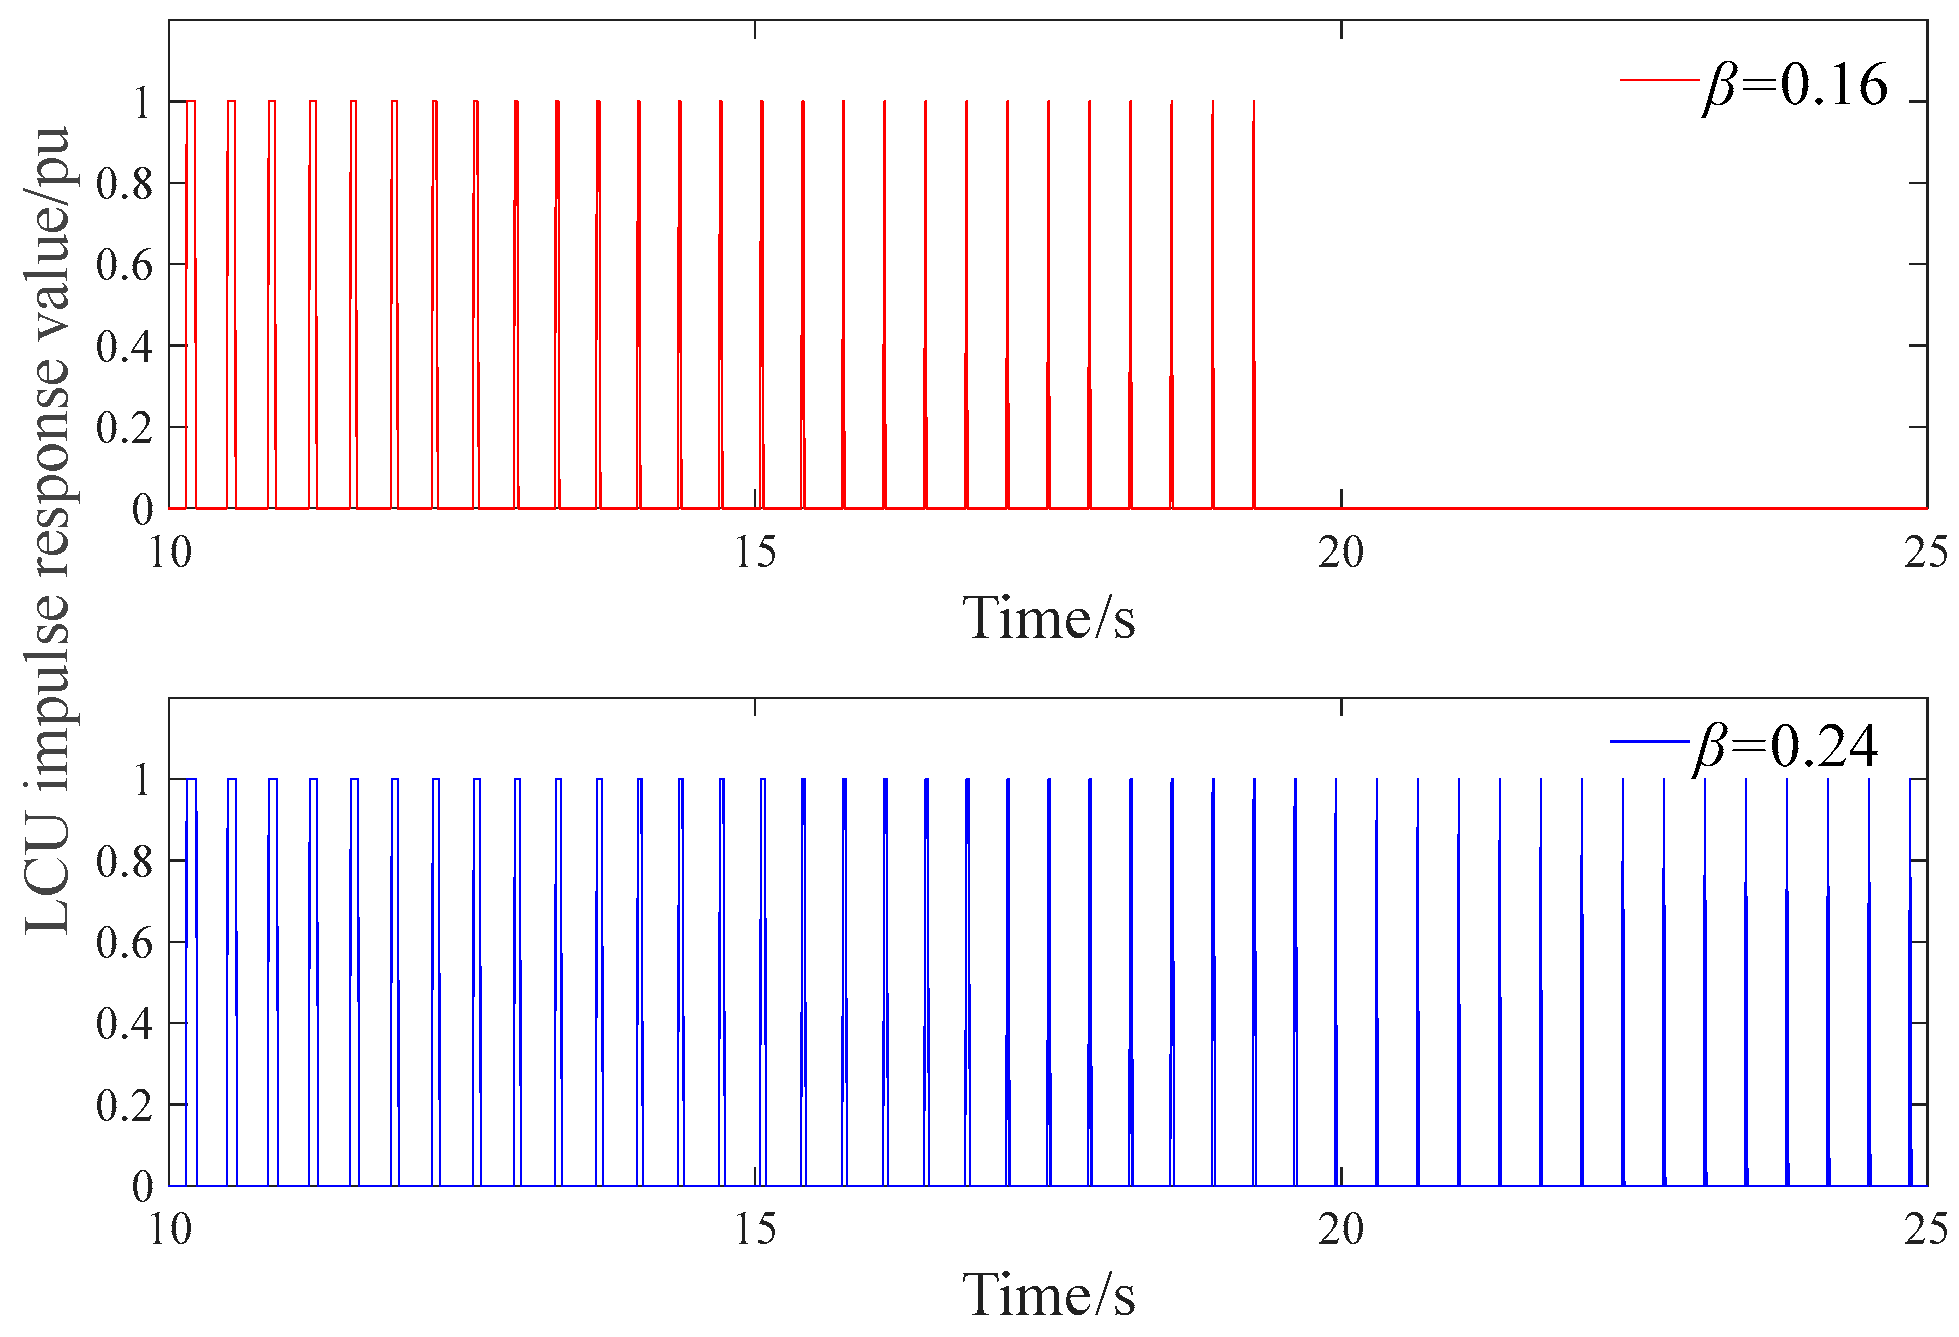
The comparison diagrams of the active power and guide vane opening adjustment processes of the unit under different pulse duration calculation ratio coefficients β are shown in Figure 10 and Figure 11. Some key indicators during the adjustment process are shown in Table 3. As can be seen from the results in the figure, during the initial stage of the adjustment process (i.e., the period from ts = 10 to 20 in the figure), the adjustment processes under different β values are nearly identical. The primary effective period for β is the latter half of the power correction process, i.e., the stage where the target value is approached. Additionally, as shown in Table 3, as the β set value increases, the overshoot in the power adjustment process decreases until it disappears, but the regulation time shows a monotonically decreasing trend. As β increases from 0.16 to 0.24, the regulation time increases from 11.4 s to 17.28 s.
From the above analysis, the pulse duration calculation ratio coefficient β plays a role in the regulation process, primarily to amplify the difference between the actual active power value and the target value. Under identical conditions for all other parameters, the smaller the β value, the larger the amplified difference. During the initial stage of regulation, however, the pulse duration is constrained by the maximum allowable pulse length, causing the initial waveforms of the power regulation process to appear nearly identical across different β values. As the unit approaches the target power, the effect of a smaller β becomes more pronounced: the larger amplified deviation leads to an increased number of regulation cycles, which in turn results in overshoot.
This observation underscores the trade-off inherent in selecting β: while a smaller value can enhance the responsiveness of the regulation system, it also increases the risk of overshoot as the unit approaches the setpoint. Optimizing β therefore requires balancing the speed of convergence against stability, highlighting the importance of carefully tuning PWM parameters in hydroelectric unit control to achieve both fast and stable power regulation.
The Effect of Working Head on Power Regulation
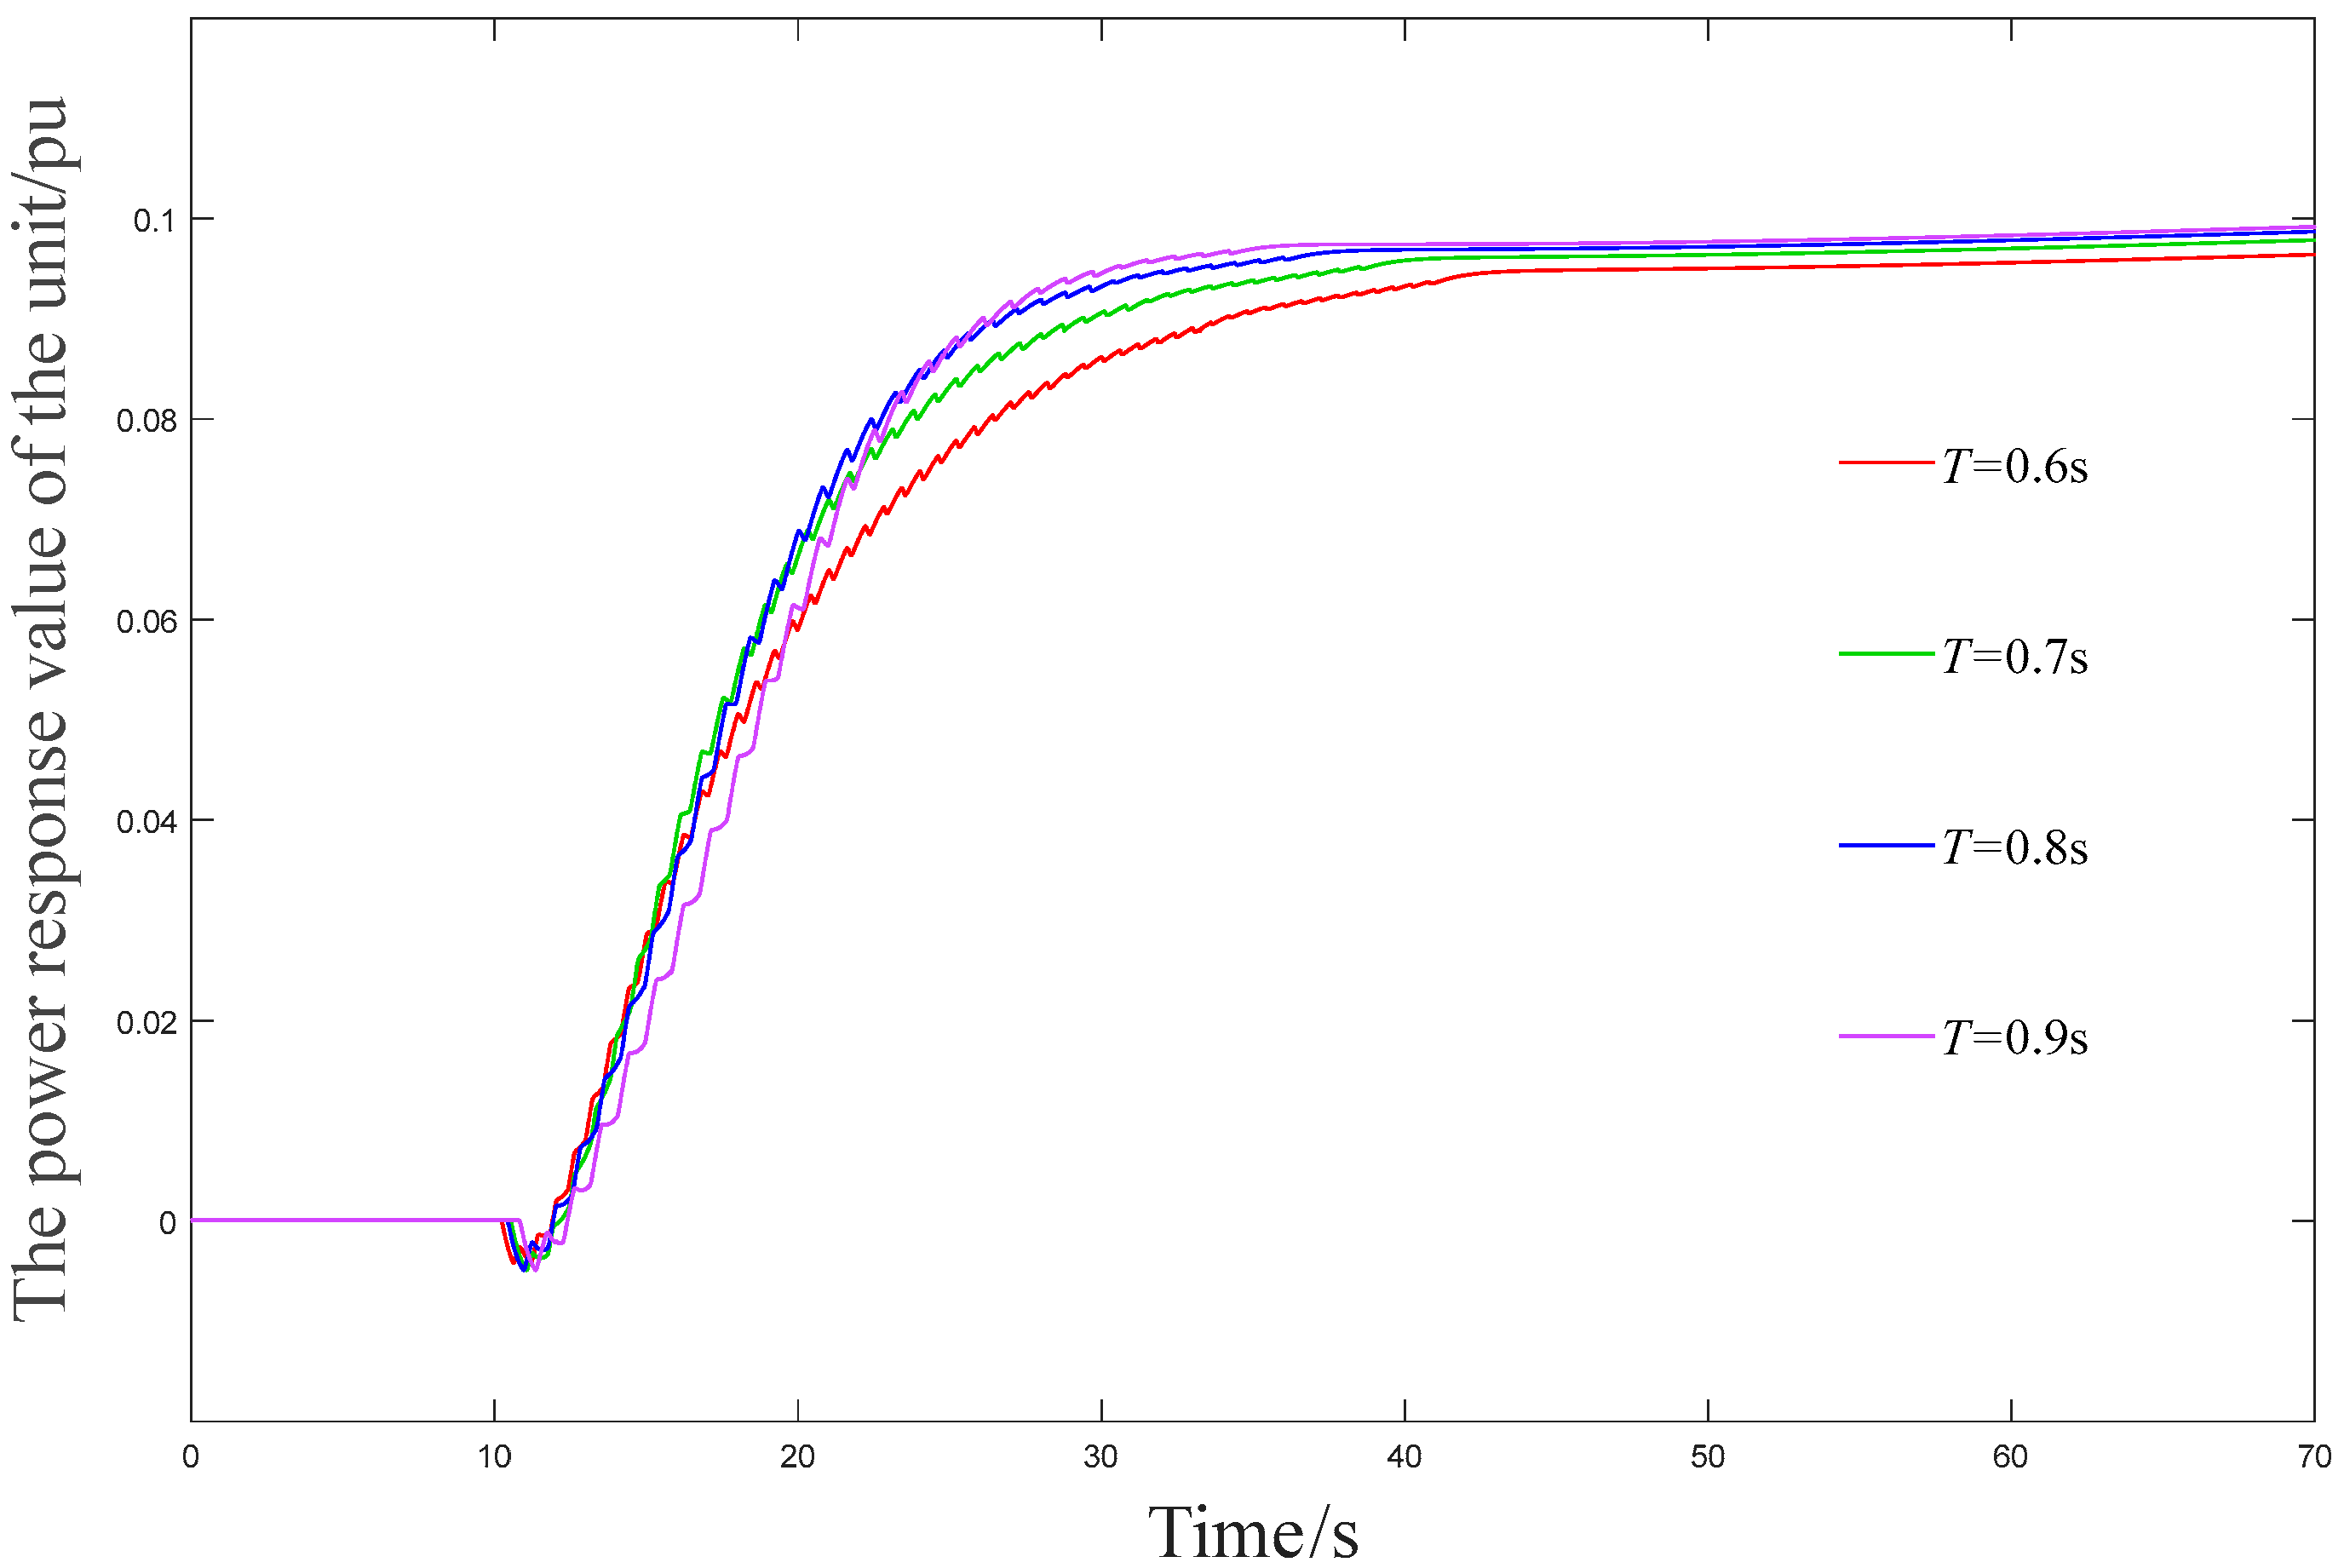
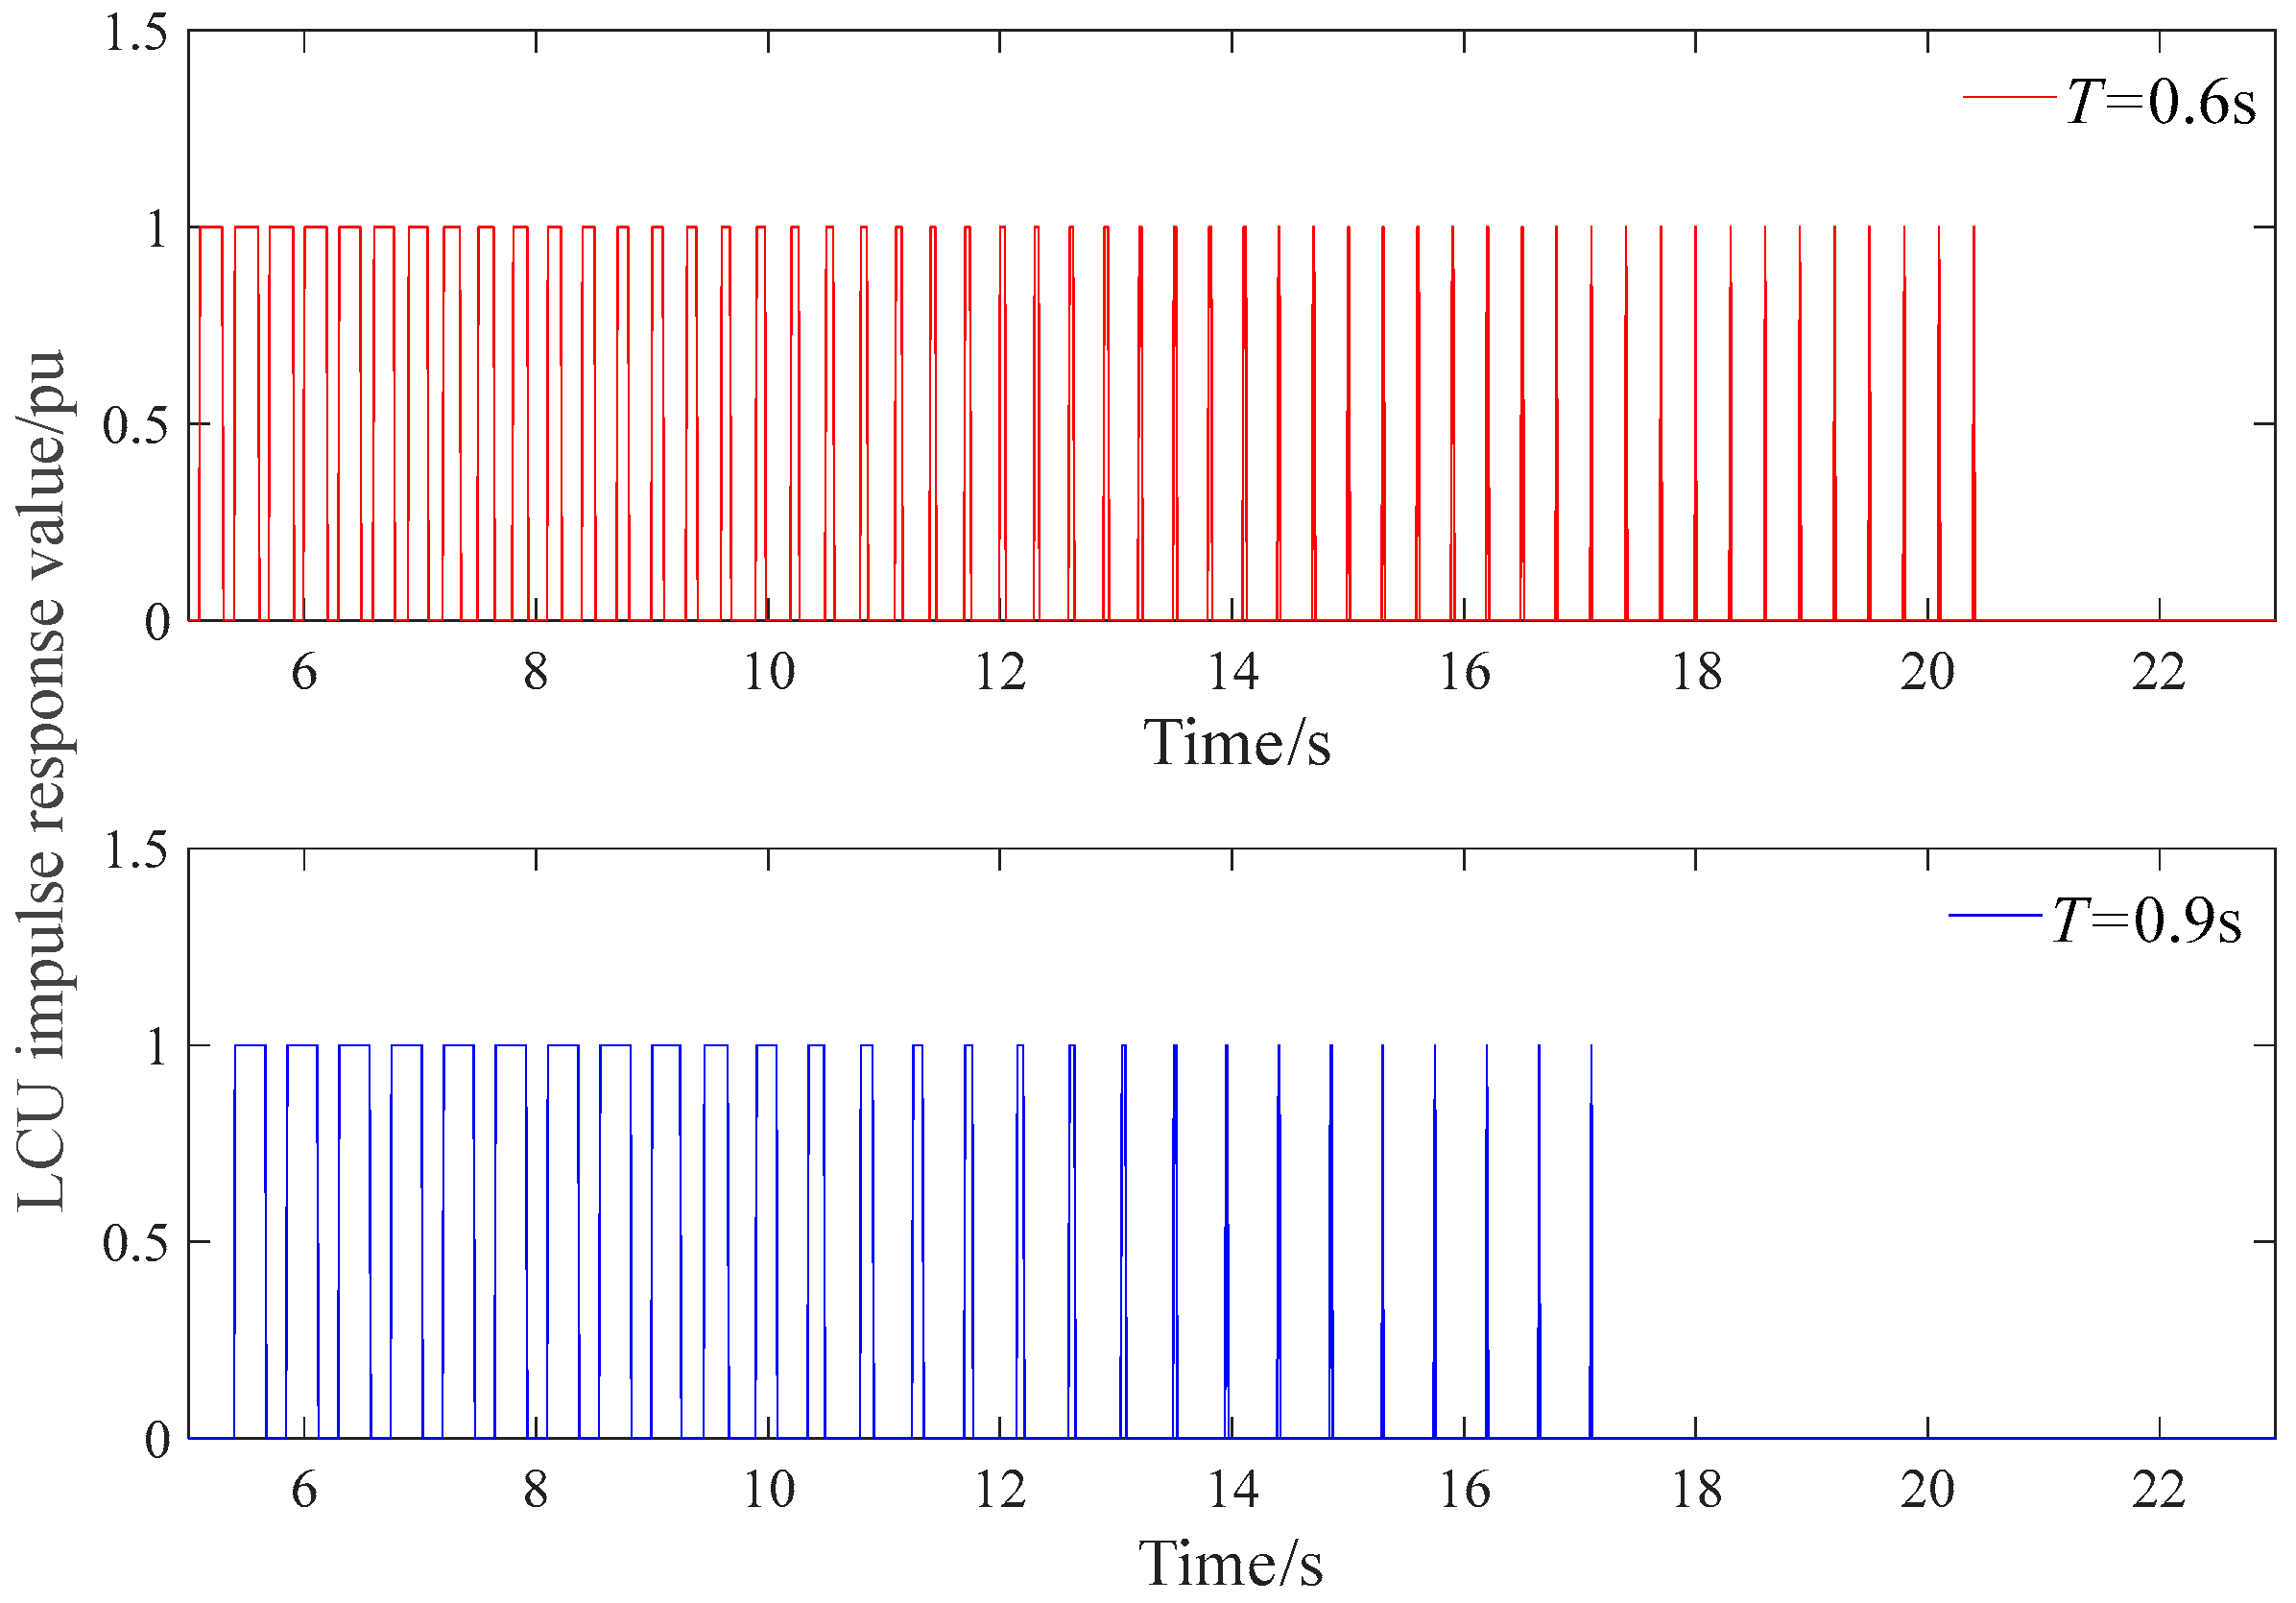
When modifying the pulse generation period T, the simulation comparison diagrams of the active power, guide vane opening, and pulse waveform of the unit over time are shown in Figure 10, Figure 11 and Figure 12. Some key indicators during the regulation process are shown in Table 3. From the waveforms in the figure for ts = 10–30, modifying T affects the entire regulation process of the unit. Because the maximum pulse duration within each cycle remains fixed, the initial pulse widths are identical across cycles, resulting in consistent guide vane movement amplitudes during the early stage of regulation. However, as the regulation cycle increases, the guide vane remains at each intermediate position for a longer period within the cycle, thereby slowing the cumulative adjustment of the unit. This effect manifests as an elongation of the total active power regulation time, with the regulation time gradually increasing from 10.3 s to 11.47 s. These results highlight the trade-off between pulse cycle duration and regulation speed: longer cycles ensure smoother guide vane movement but reduce the overall responsiveness of the active power regulation process.
The Effect of Maximum Pulse Duration Limiting Within a Cycle on Power Regulation
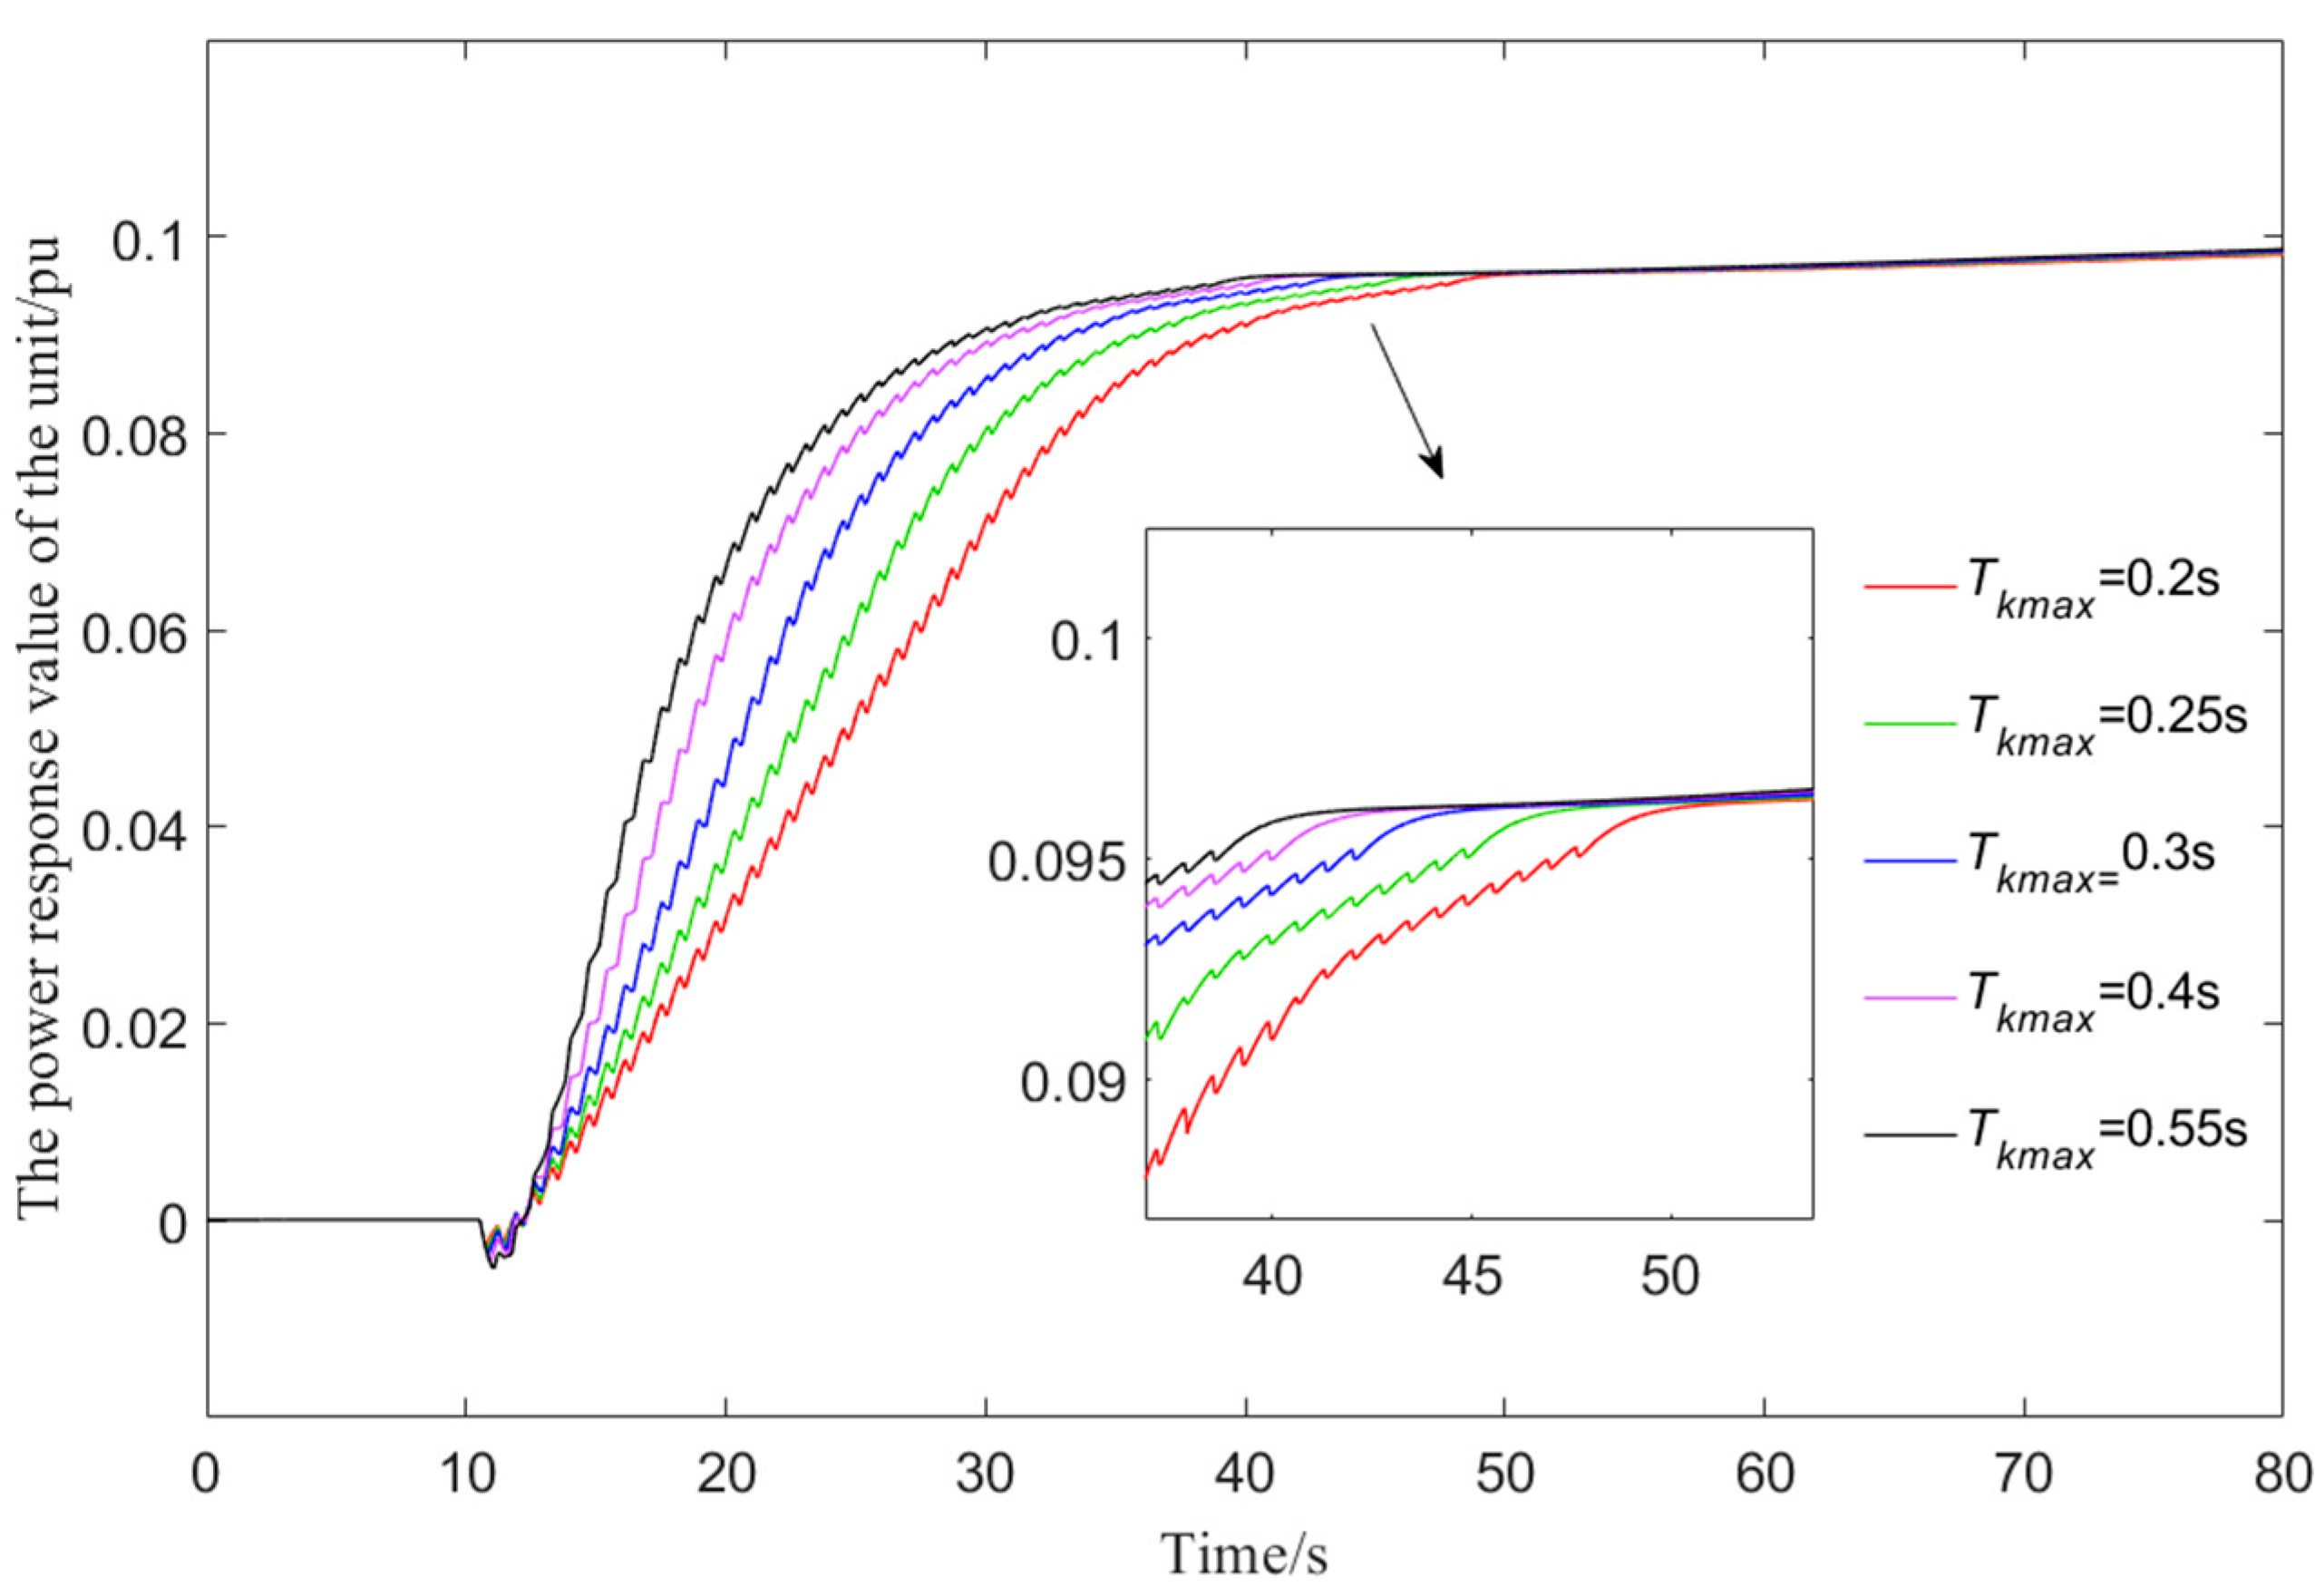
The comparison diagrams of the active power, guide vane opening, and pulse regulation process of the unit under the maximum pulse duration limit Tkmax for different cycles are shown in Figure 12, Figure 13 and Figure 14. Some of the indicators during the regulation process are shown in Table 4. Under the same set target values, as the Tkmax set value gradually increases, the action range of the guide vane opening during the pulse generation cycle gradually increases, and the regulation time consumed by the power correction process also becomes shorter, decreasing from 20.53 s at Tkmax = 0.2 to 11.4 s at Tkmax = 0.55, a reduction of 44% in regulation time. The gradual increase in the Tkmax set value accelerates the overall regulation speed of the power regulation process.
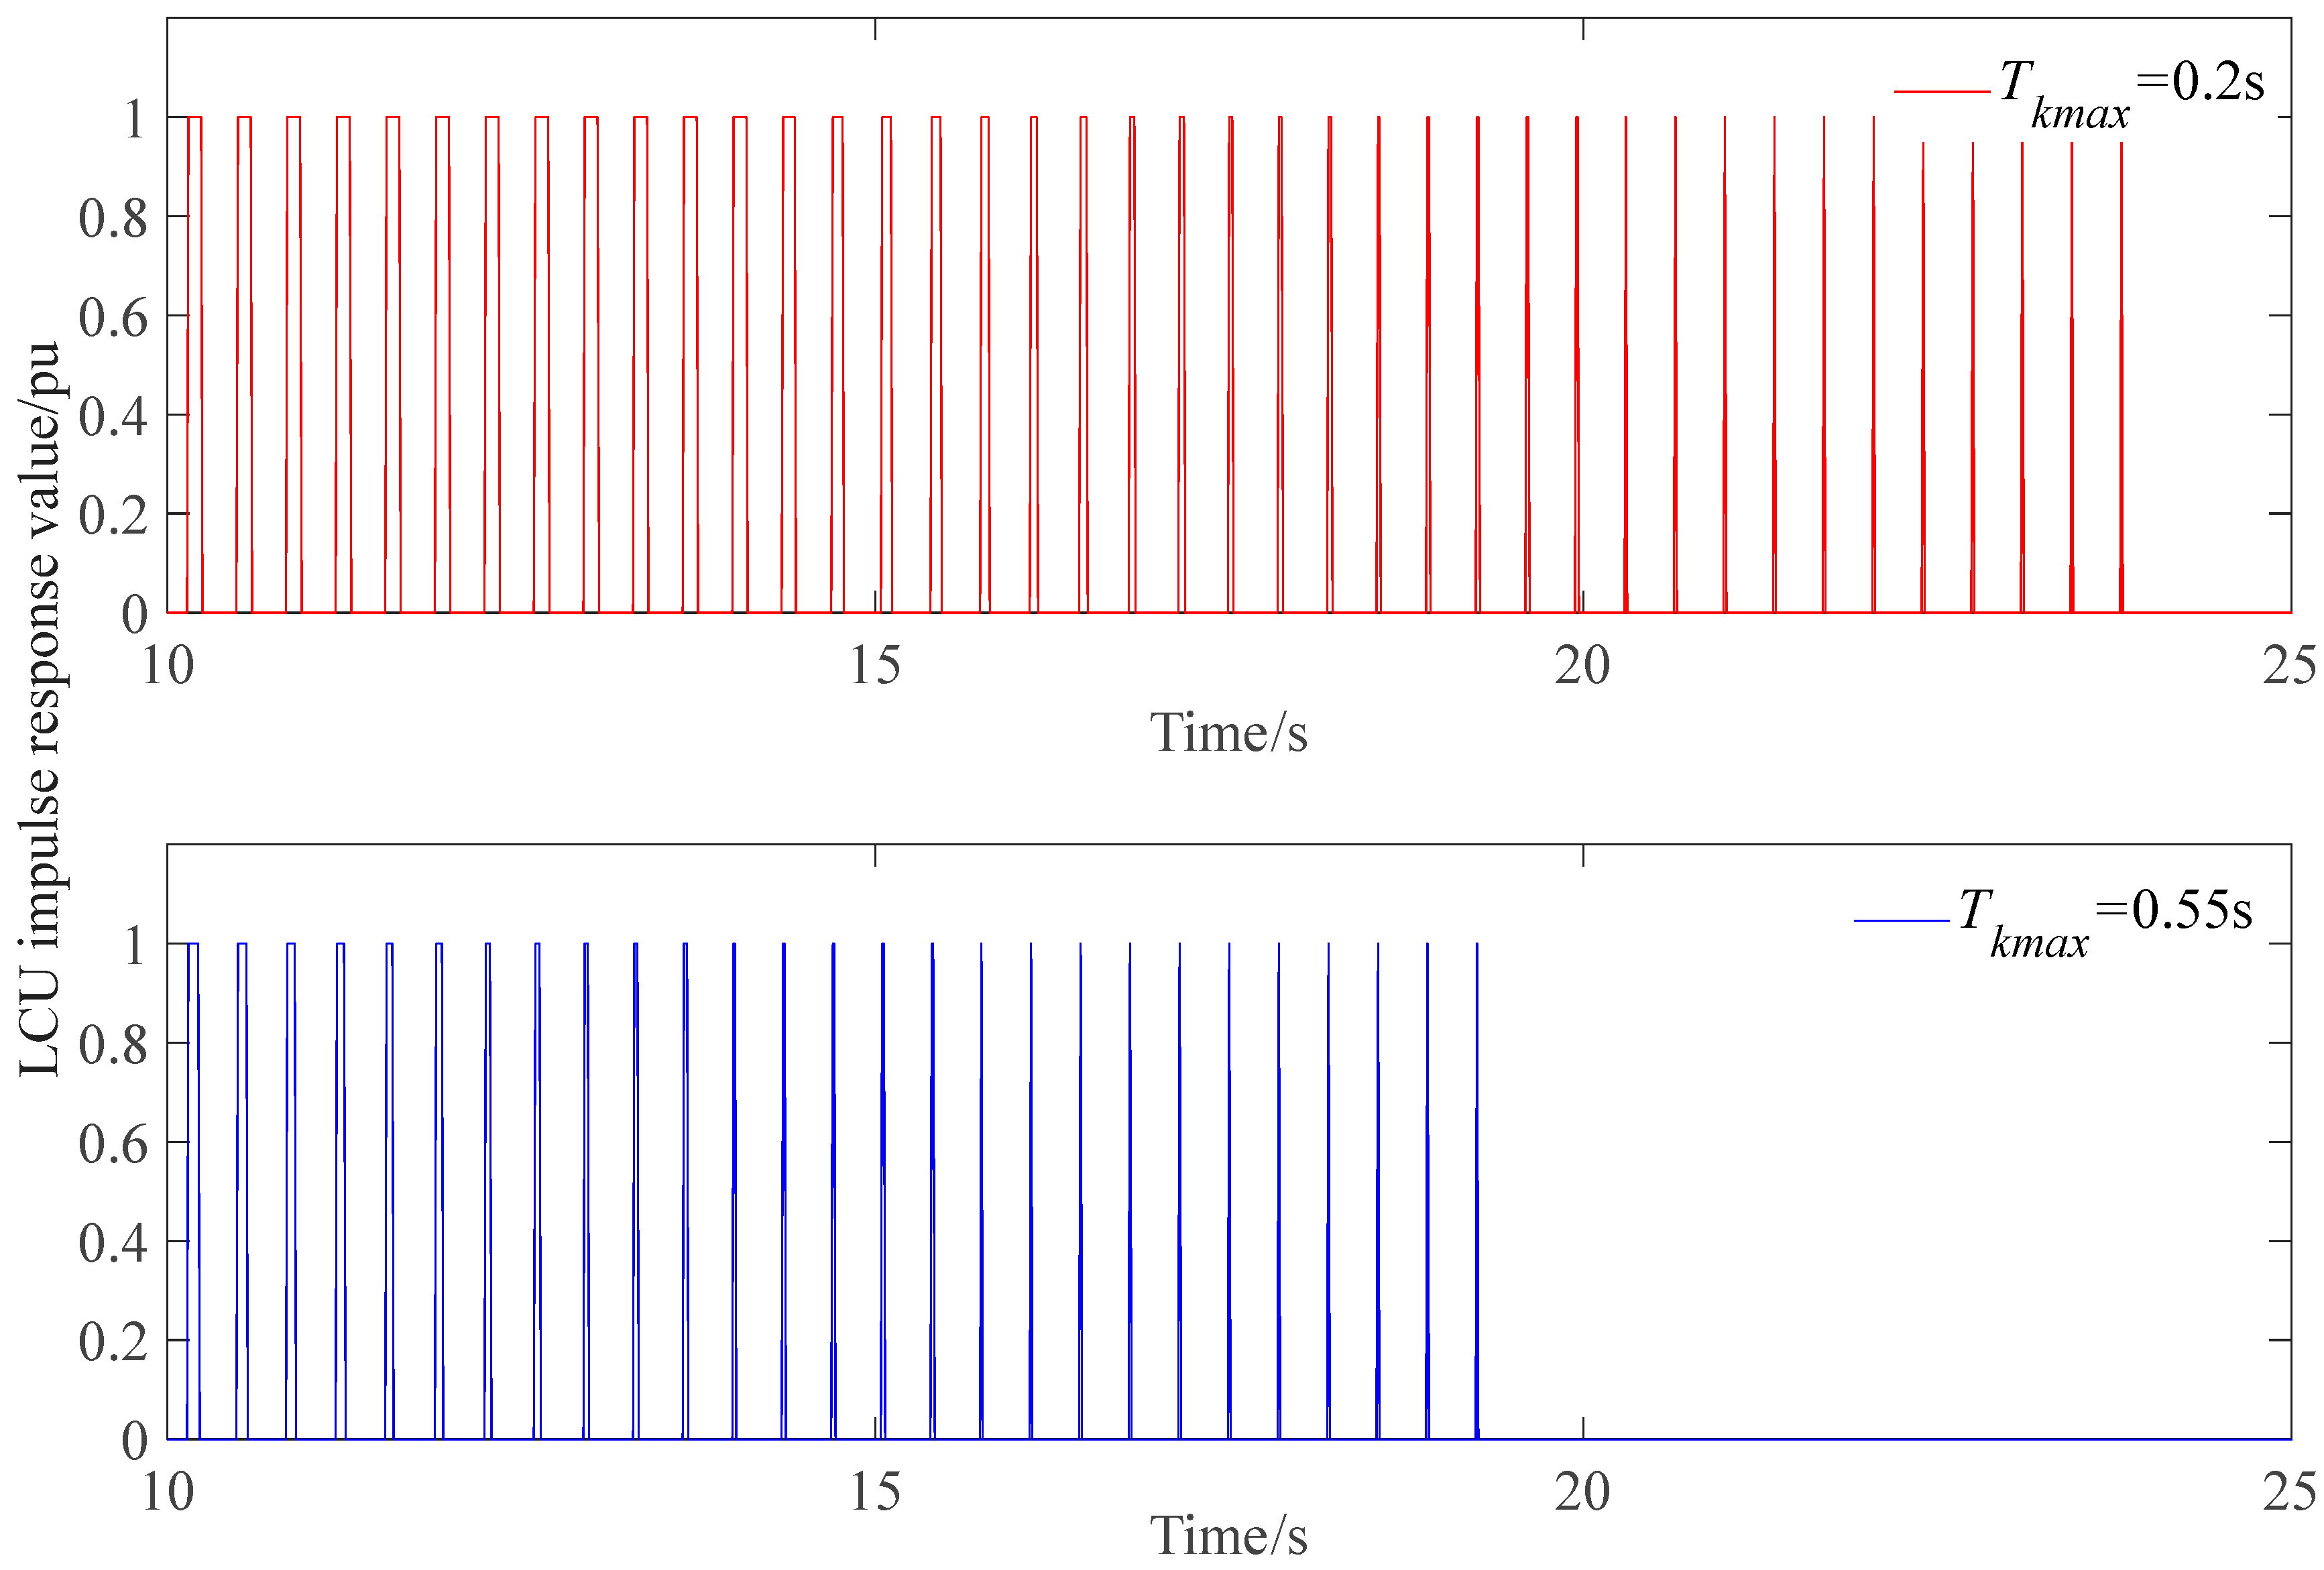
Turbine guide vane adjustment process is shown in Figure 14. To achieve the same target power, the number of pulses at Tkmax = 0.2 is 1.48 times that at Tkmax = 0.55. Since each pulse corresponds to a discrete change in the guide vane opening, it represents a complete actuation of the hydraulic system. Furthermore, at Tkmax = 0.55, as the system approaches the setpoint, numerous pulses with very small widths are emitted, resulting in frequent guide vane movements throughout the regulation process. This increases the operational load on the hydraulic equipment, potentially accelerating wear and reducing service life, which poses a risk to the long-term safe and stable operation of the hydropower plant.
These results highlight a critical trade-off: while increasing Tkmax improves regulation speed, it can also increase the number of small corrective actions near the target, emphasizing the need for careful optimization of Tkmax to balance responsiveness with equipment longevity.
The Effect of Minimum Pulse Duration Limiting Within a Cycle on Power Regulation
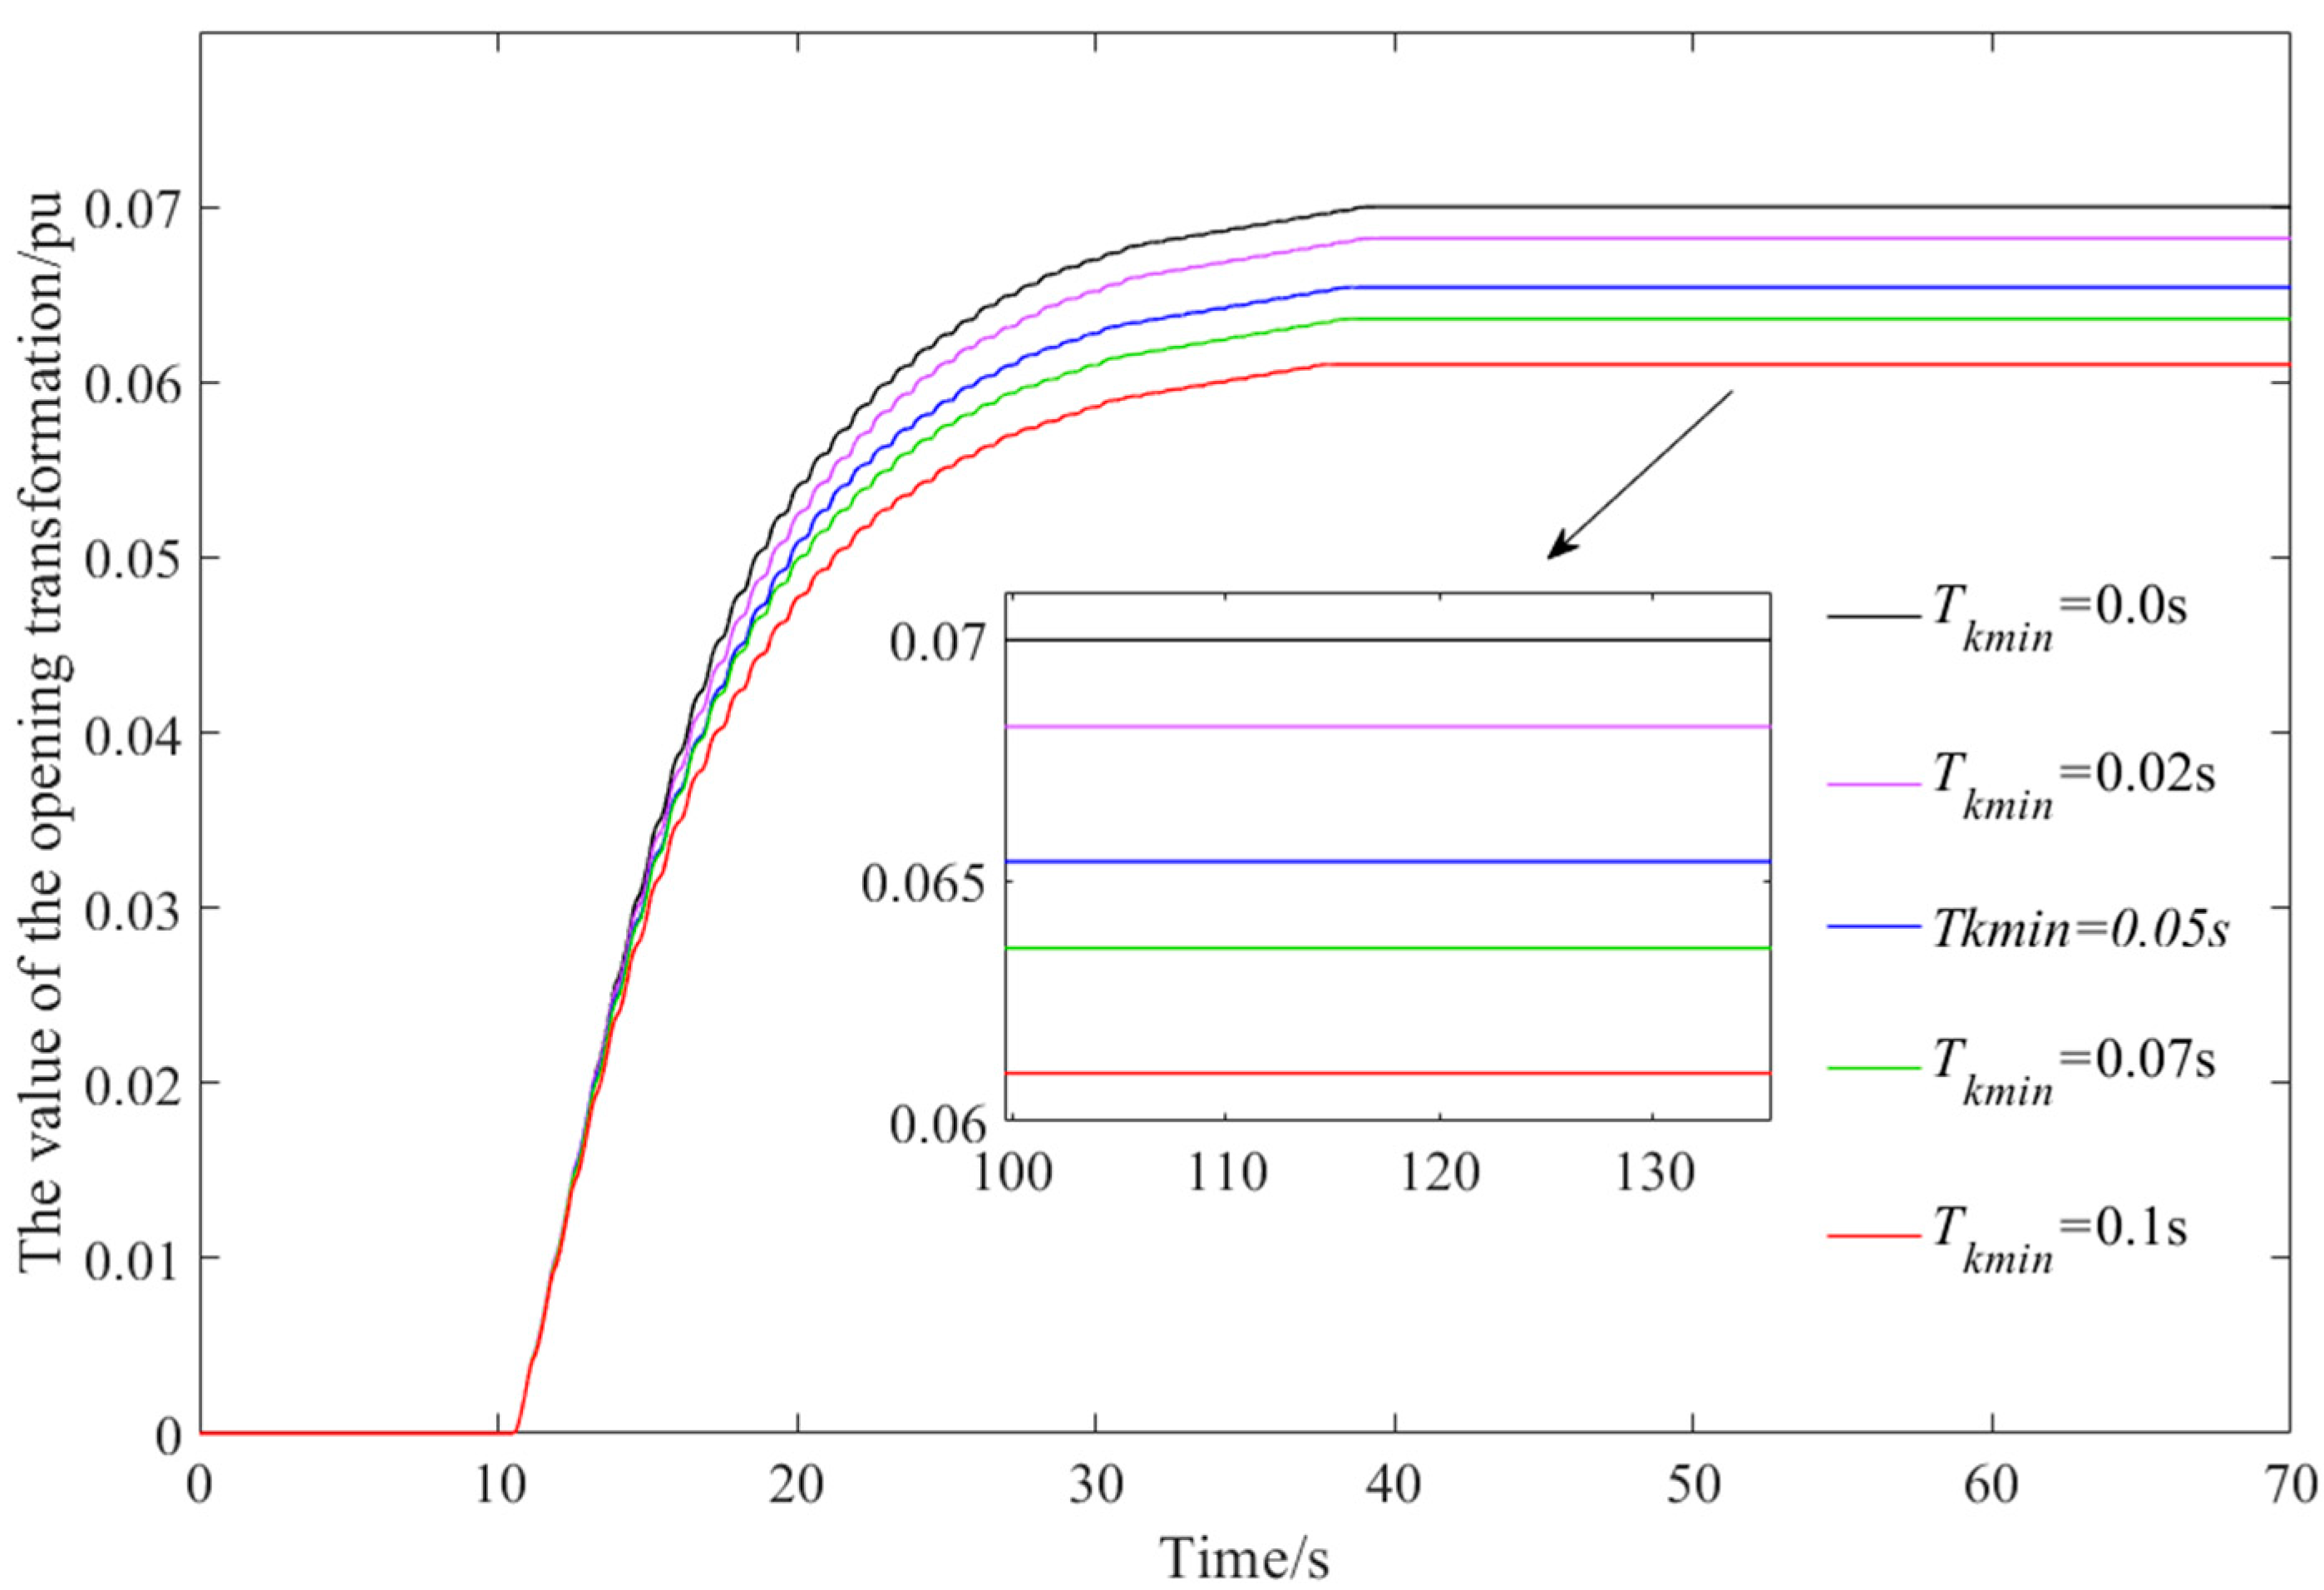
The comparison diagrams of the active power, guide vane opening, and pulse regulation process of the unit under the minimum pulse duration limit Tkmin in different cycles are shown in Figure 15, Figure 16 and Figure 17, with key regulation indicators summarized in Table 5. It is evident that modifying the minimum pulse duration limit Tkmin has a similar effect to modifying β. As shown in Figure 15, when Tkmin is modified, the adjustment processes within ts = 10–15 are nearly identical, indicating that Tkmin primarily takes effect during the latter half of the power correction process, i.e., when the deviation from the target value becomes relatively small. Towards the end of the regulation process, the power deviation value becomes increasingly smaller. At this stage, the minimum pulse duration within each cycle determines the amplitude and frequency of the fine corrective actions, directly influencing the final convergence behavior of the active power, as evidenced by the changes in guide vane opening and pulse generation patterns.
As the minimum pulse duration limit Tkmin within each cycle increases, the steady-state value reached at the end of the adjustment process exhibits noticeable deviations from the target power, with the discrepancy growing larger as Tkmin increases. In contrast, the total adjustment time varies only slightly, ranging from 11 s to 14 s, indicating that Tkmin primarily influences the precision of regulation rather than its speed. A comparison of the LCU pulse diagrams at Tkmax = 0.2 and Tkmax = 0.55 in Figure 18 reveals further insights into the underlying mechanism.
By examining the effects of both maximum and minimum pulse duration limits, it can be observed that during active power regulation, Tkmin primarily affects the accuracy of regulation, while Tkmax primarily affects the speed of regulation. Careful selection of these two parameters in combination allows for a balanced trade-off among regulation speed, accuracy, and the number of regulation cycles. Therefore, the maximum and minimum pulse duration limit parameters within a cycle must be selected reasonably in conjunction with the grid and the AGC evaluation standards for the accuracy of hydroelectric unit regulation, thereby achieving the dual objectives of ensuring regulation accuracy while controlling the number of regulation cycles within a reasonable range.

3.1.3. Analysis of the Impact of Speed Regulator Parameters on Active Power Regulation

The Effect of Opening Integral Conversion Parameters on Power Regulation
In the implementation of automatic generation control (AGC) functions, the speed governor of a hydroelectric unit serves as the primary actuator for executing updated guide vane opening commands. When the local control unit (LCU) issues a pulse corresponding to a required active power correction, the speed governor adjusts the guide vane setpoint in real time according to the pre-defined correction rate associated with the pulse sequence. This pre-set correction rate is determined by the integral conversion parameter Tiy in the opening control link, which directly governs the dynamic response of the guide vane and thereby affects the unit’s active power regulation performance.
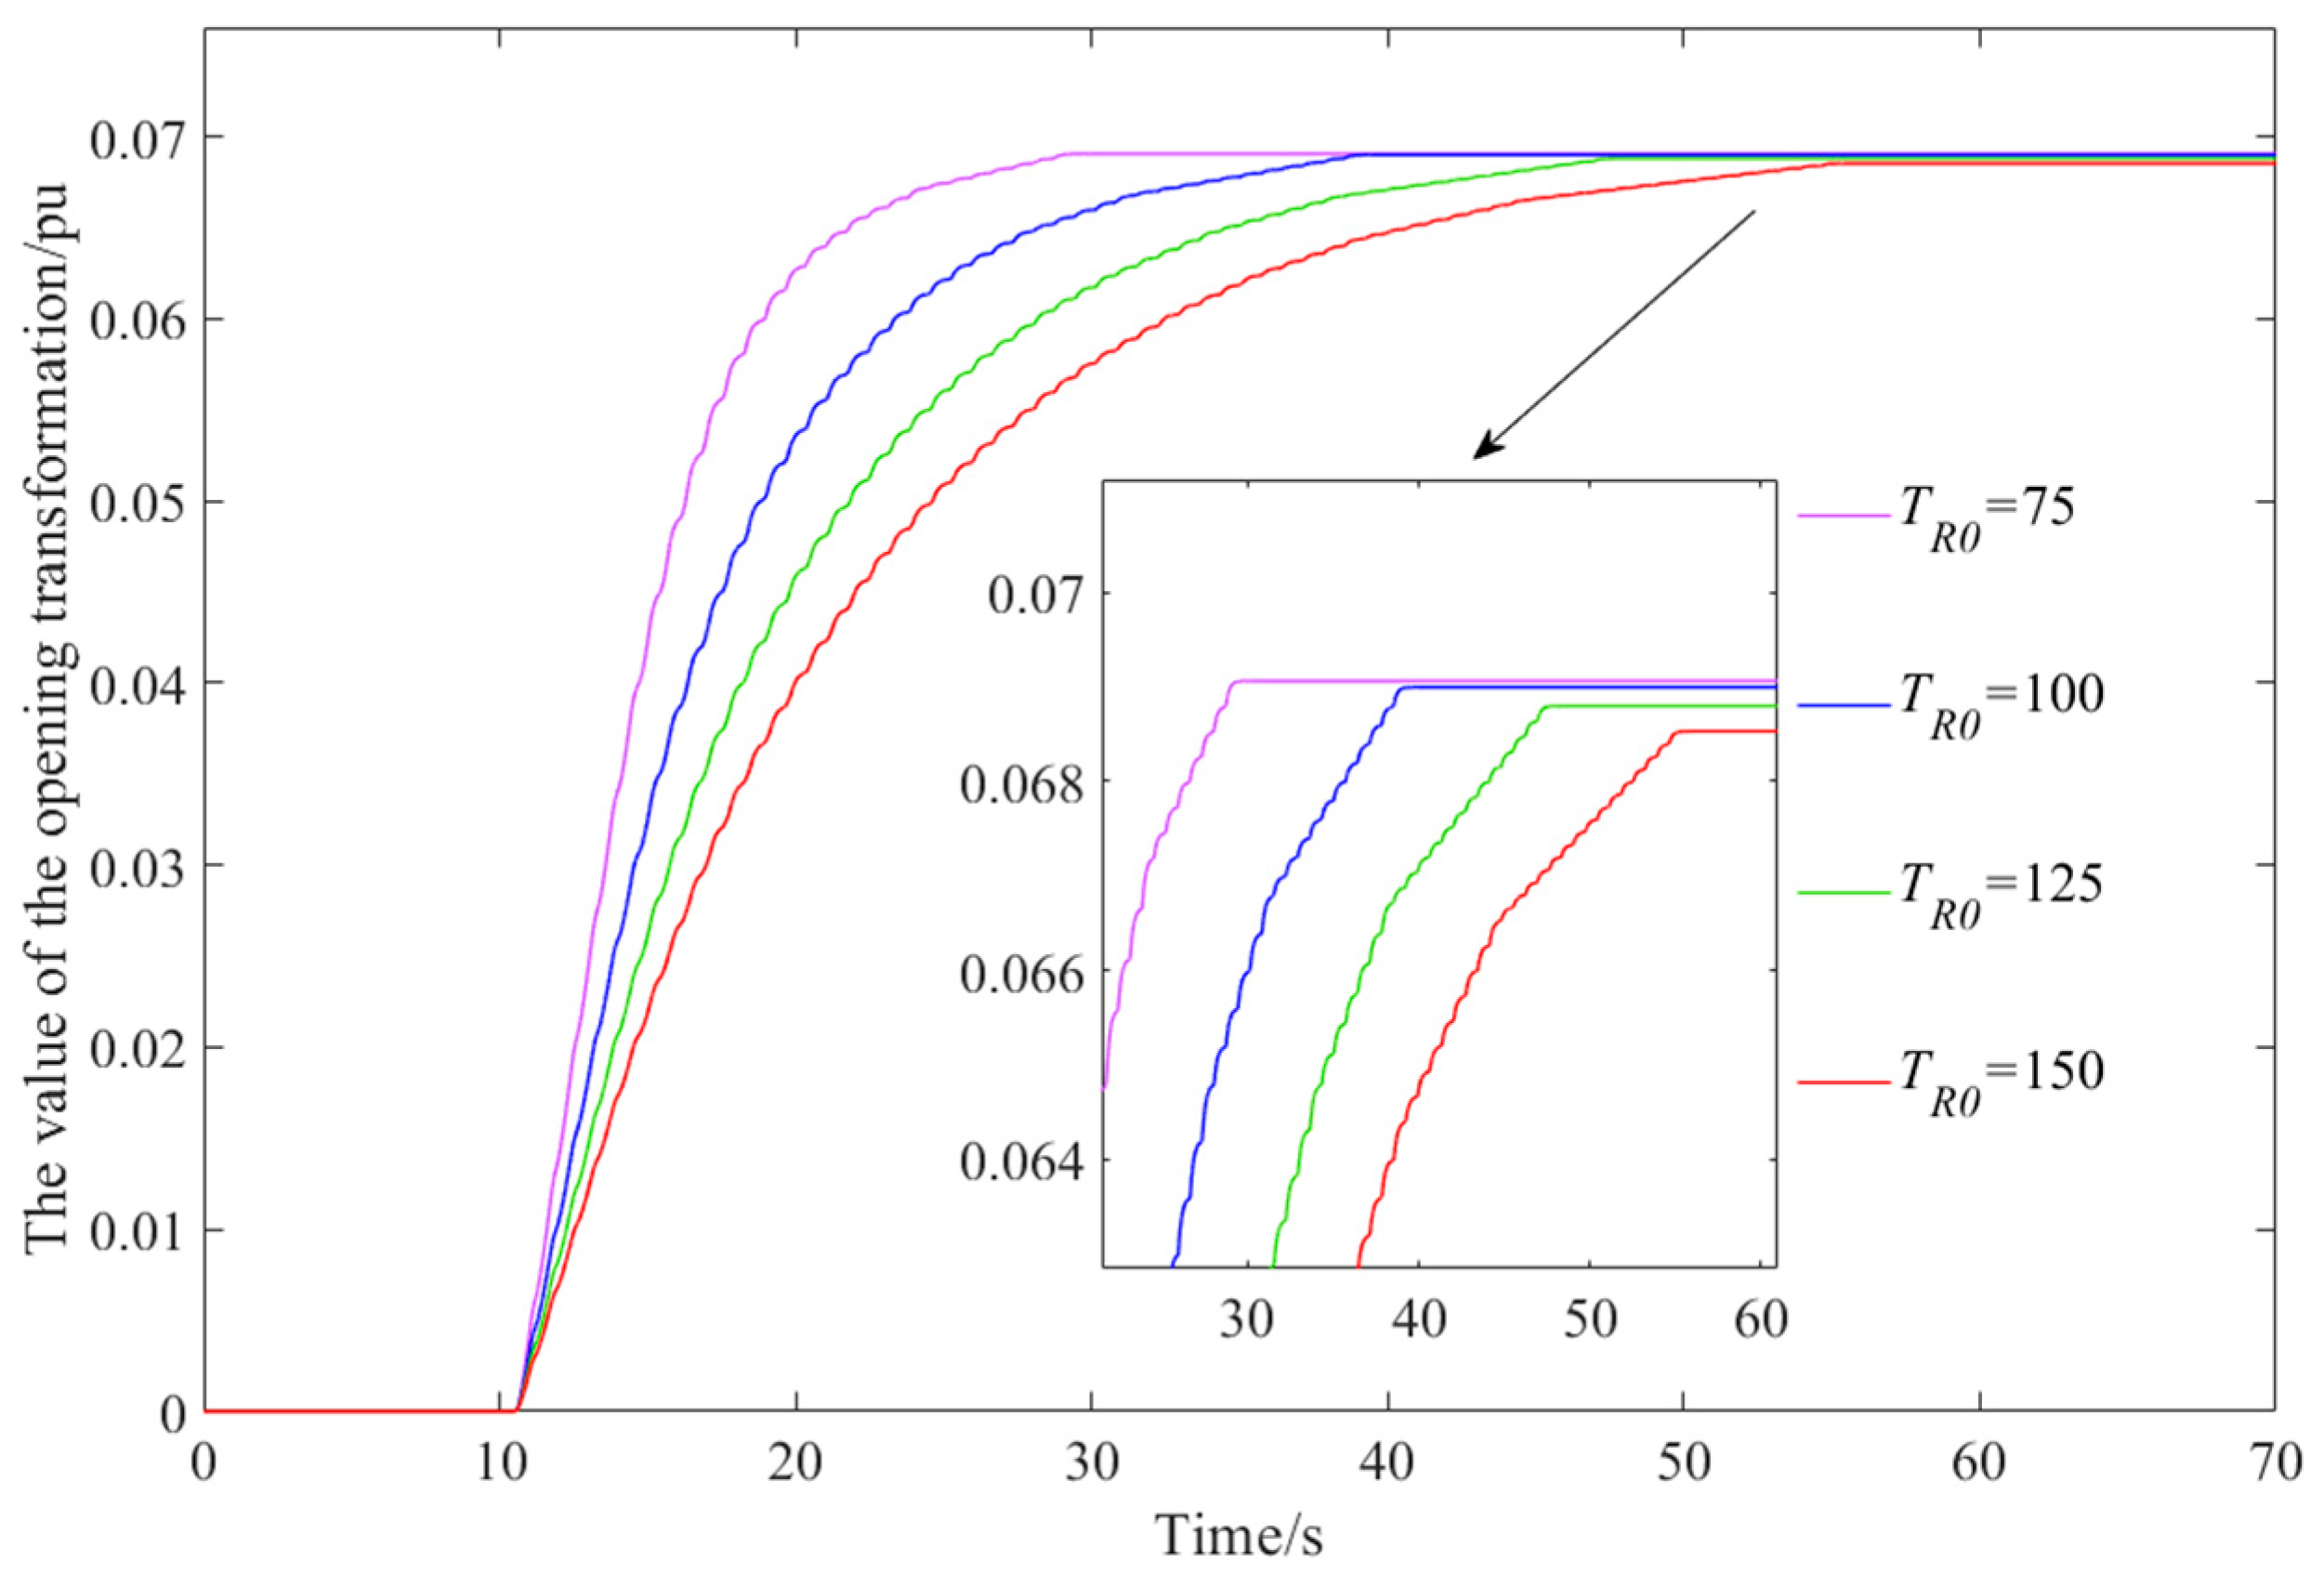
The comparison diagrams of the active power, guide vane opening, and pulse regulation processes of the unit under different Tiy integral conversion parameters are shown in Figure 19 and Figure 20. Some indicators during the regulation process are listed in Table 6. From the results in the figures, Tiy primarily affects the action speed of the guide vanes during power regulation. The larger the Tiy value, the slower the action rate of the guide vanes, and the slower the regulation speed of the unit’s active power. When Tiy is small, such as Tiy = 75, overshoot occurs during the entire regulation process.
These findings suggest that, in practical engineering applications, selecting a smaller integral conversion coefficient can enhance the regulation rate of the unit. However, this must be balanced against the potential for overshoot and the physical limitations of guide vane actuation speed. Therefore, an appropriate Tiy value should be carefully chosen to achieve an optimal trade-off between rapid active power response and the mechanical constraints of the hydraulic system, ensuring both effective regulation and the long-term reliability of the equipment.

3.2. PFR Parameter Characteristic Analysis

In terms of frequency regulation characteristics, the main focus is on studying the power output characteristics of hydroelectric units when the frequency of the sending grid changes. Research is conducted on factors and patterns affecting the power output of hydroelectric units when the frequency of the sending grid changes, including hydraulic system parameters, governor regulation modes, and grid frequency change characteristics.
The quantitative indicators used in this study for the primary frequency modulation process are the regulation time and load regulation amplitude.
Regulation time: the minimum time required for the response value to reach the steady-state value within an error range of ±5%.
Load regulation amplitude: the ratio of the regulation value of the unit’s active power to the unit’s initial active power during the primary frequency modulation process.

3.2.1. The Effect of the Working Head of the Unit on Primary Frequency Modulation

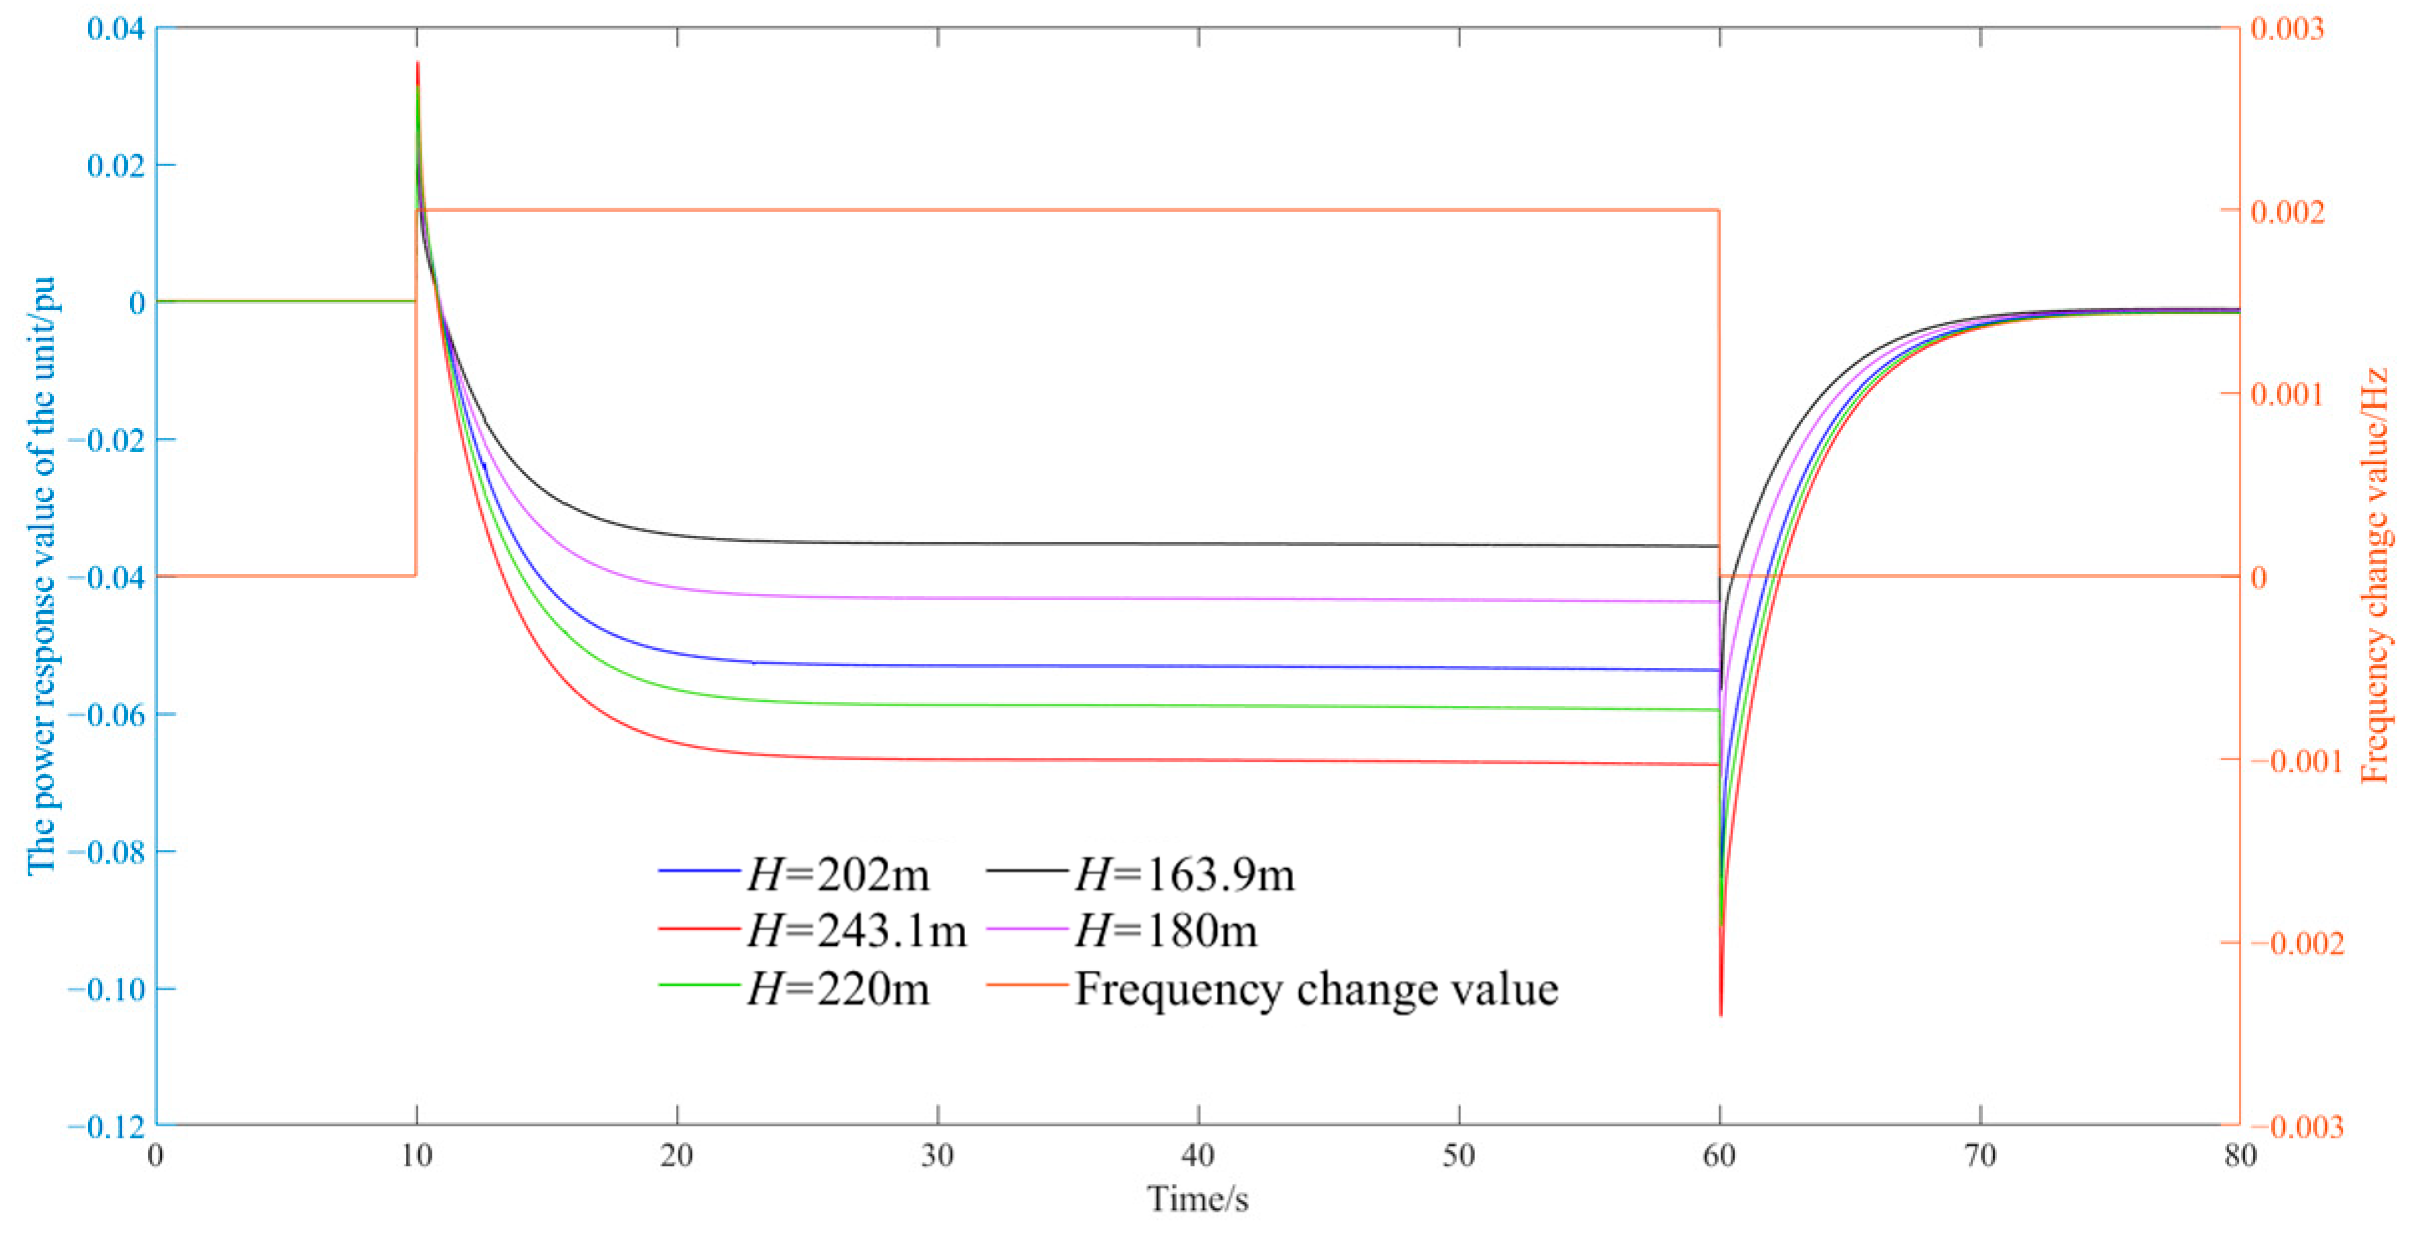
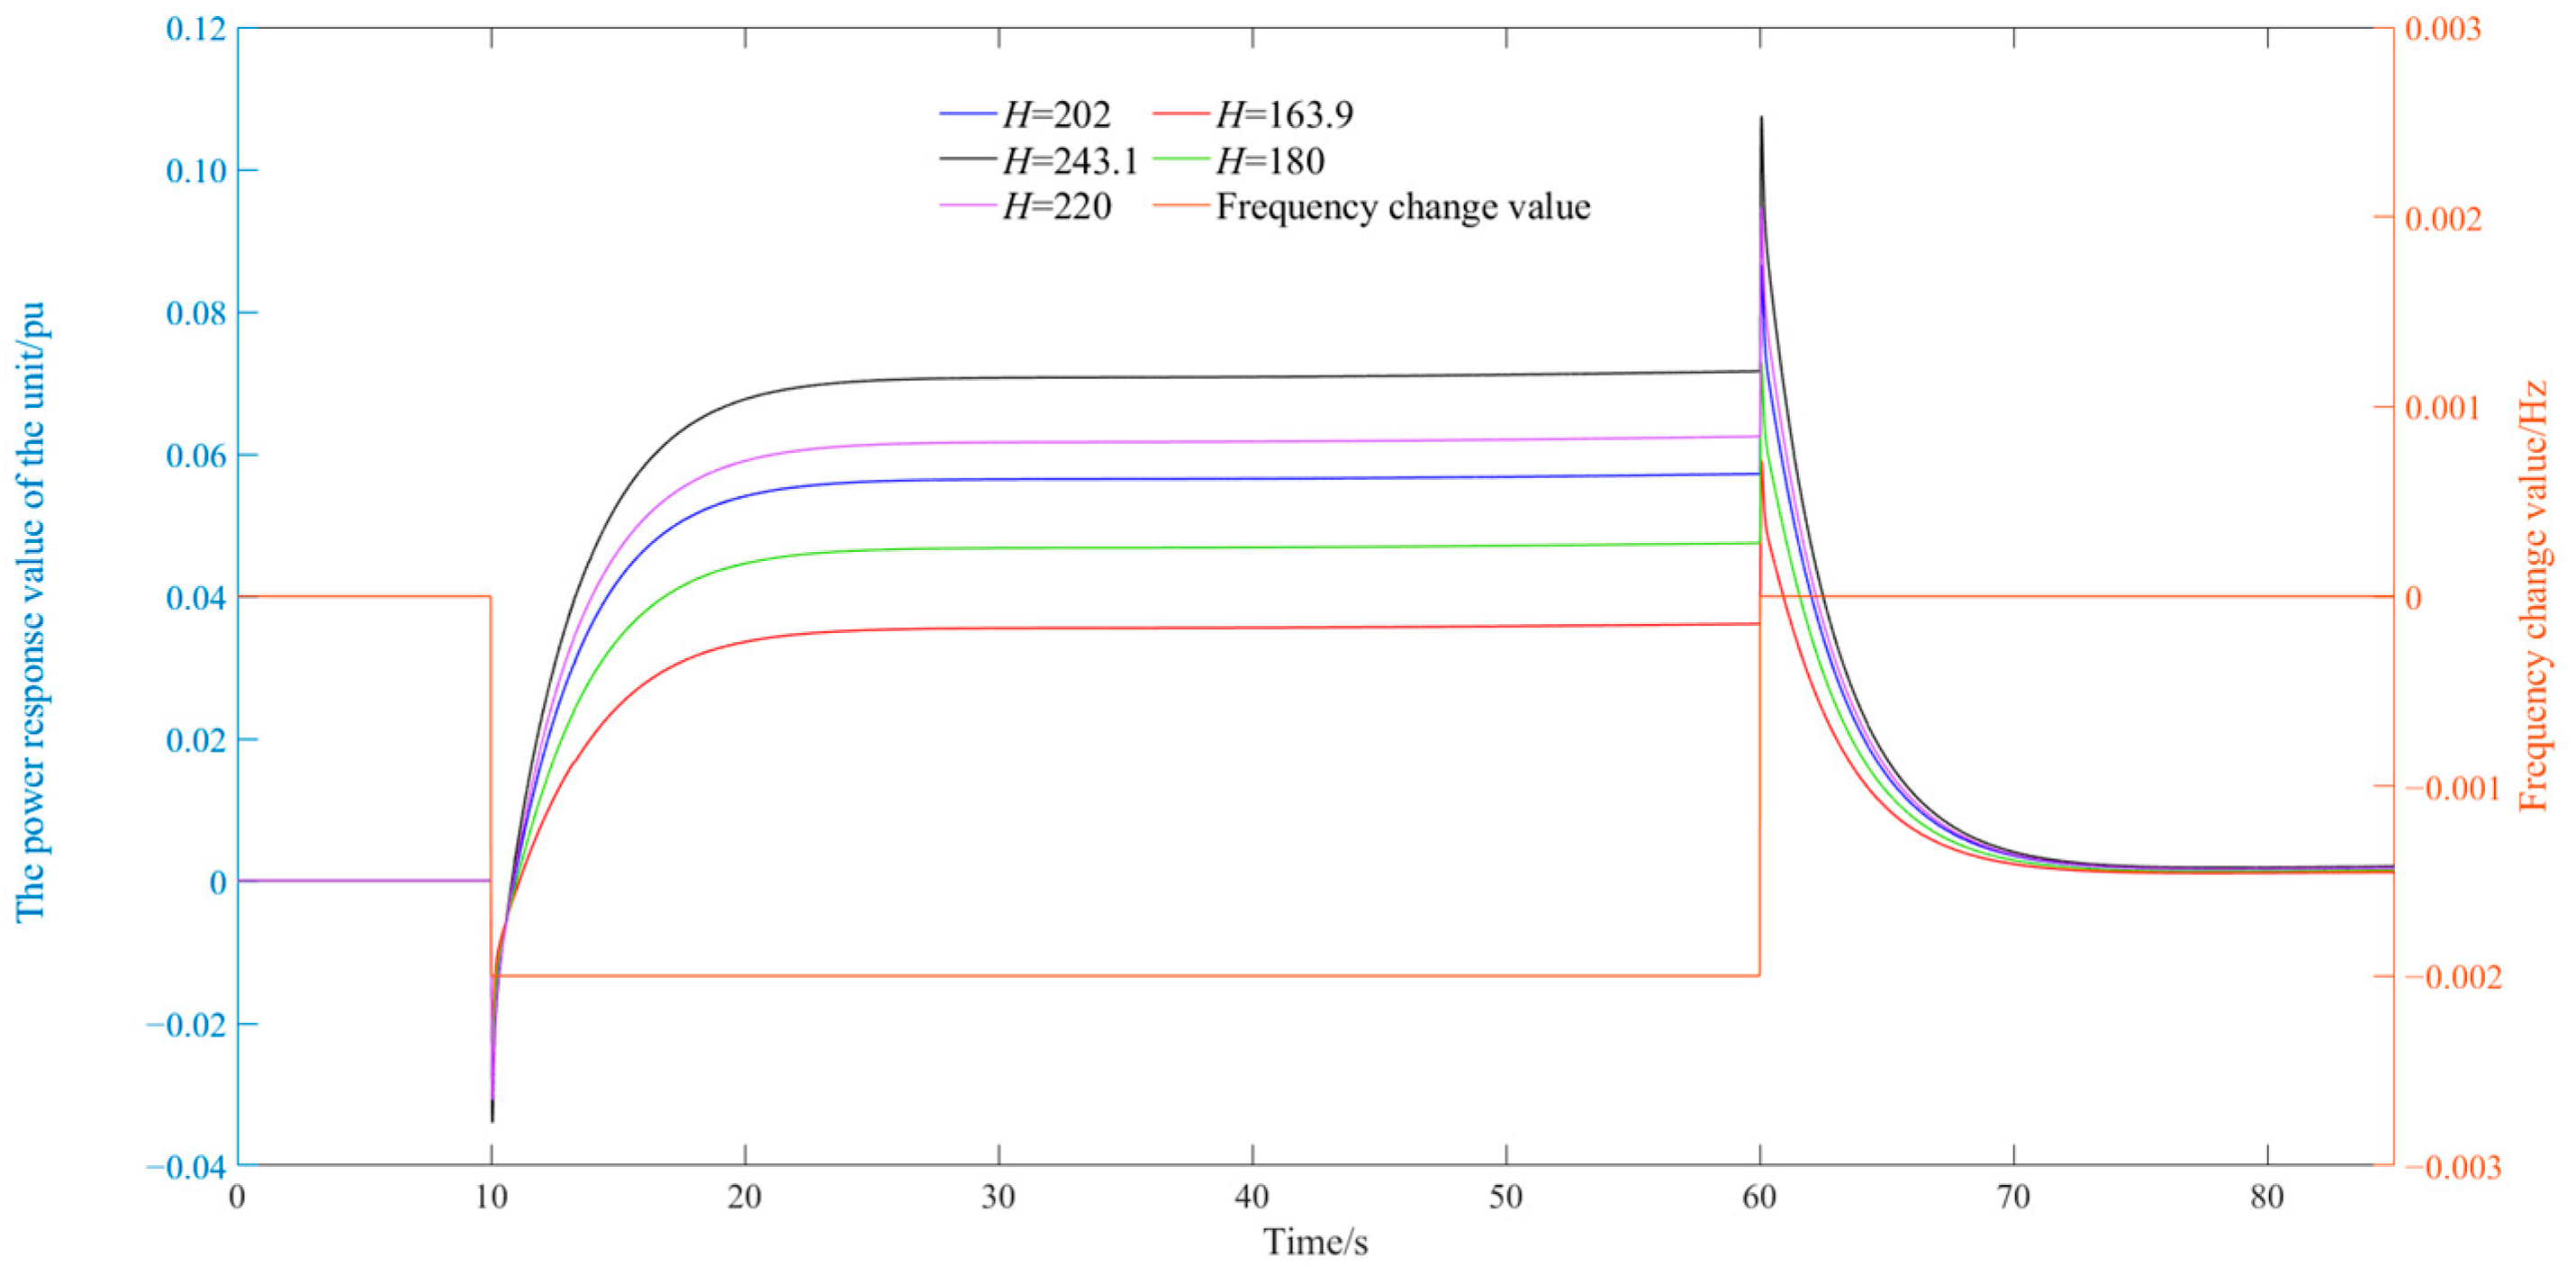
The working head of a hydroelectric unit plays a critical role in defining its operational state and exerts a substantial influence on the primary frequency control performance. In alignment with AGC methodology, simulations were conducted under a constant head condition, introducing grid frequency disturbances of +0.1 Hz and –0.1 Hz, to systematically evaluate how the operating head affects the dynamics of primary frequency regulation.
The unit LCU output pulse diagram is shown in Figure 21. The comparison diagram of the regulation process of the unit’s active power under different head conditions is shown in Figure 22, and the indicators of the regulation process are shown in Table 7. The results indicate that the regulation rates across various head conditions are generally consistent. Under a +0.1 Hz frequency disturbance, the regulation time ranges between 13.5 s and 13.8 s. However, due to differences in the initial operating states under varying heads, the magnitude of power adjustment during primary frequency regulation differs even under identical frequency changes. At lower head conditions, the absolute load adjustment amplitude in response to grid frequency disturbances is reduced. Nevertheless, the relative adjustment amplitude remains comparable to that under higher heads, and the differences in regulation time are marginal. It can thus be concluded that the head primarily influences the load adjustment amplitude during primary frequency regulation. Furthermore, when responding to +0.1 Hz and −0.1 Hz disturbances, the unit operating under a +0.1 Hz frequency change performs closer to the high-efficiency region, resulting in more favorable performance metrics compared to the −0.1 Hz condition.
Therefore, it can be concluded that higher head conditions lead to increased amplitude of power fluctuations resulting from changes in guide vane opening. This results in larger frequency regulation response amplitudes, greater sensitivity, and stronger overall regulation capability in high-head units. For instance, under identical disturbance conditions, a unit operating at 243.1 m head demonstrates a significantly larger power reduction amplitude compared to one at 163.9 m, highlighting its enhanced frequency regulation performance. However, excessively high head may also induce substantial output fluctuations and increase the risk of overshoot. In contrast, low-head units exhibit smoother responses with smaller regulation amplitudes, providing improved operational stability albeit with limited contribution to grid frequency support. Consequently, under varying head conditions, it is essential to balance response characteristics with stability, and to improve overall frequency regulation performance through optimized tuning of speed control system parameters.

3.2.2. The Effect of Steady-State Transfer Coefficient on Primary Frequency Modulation

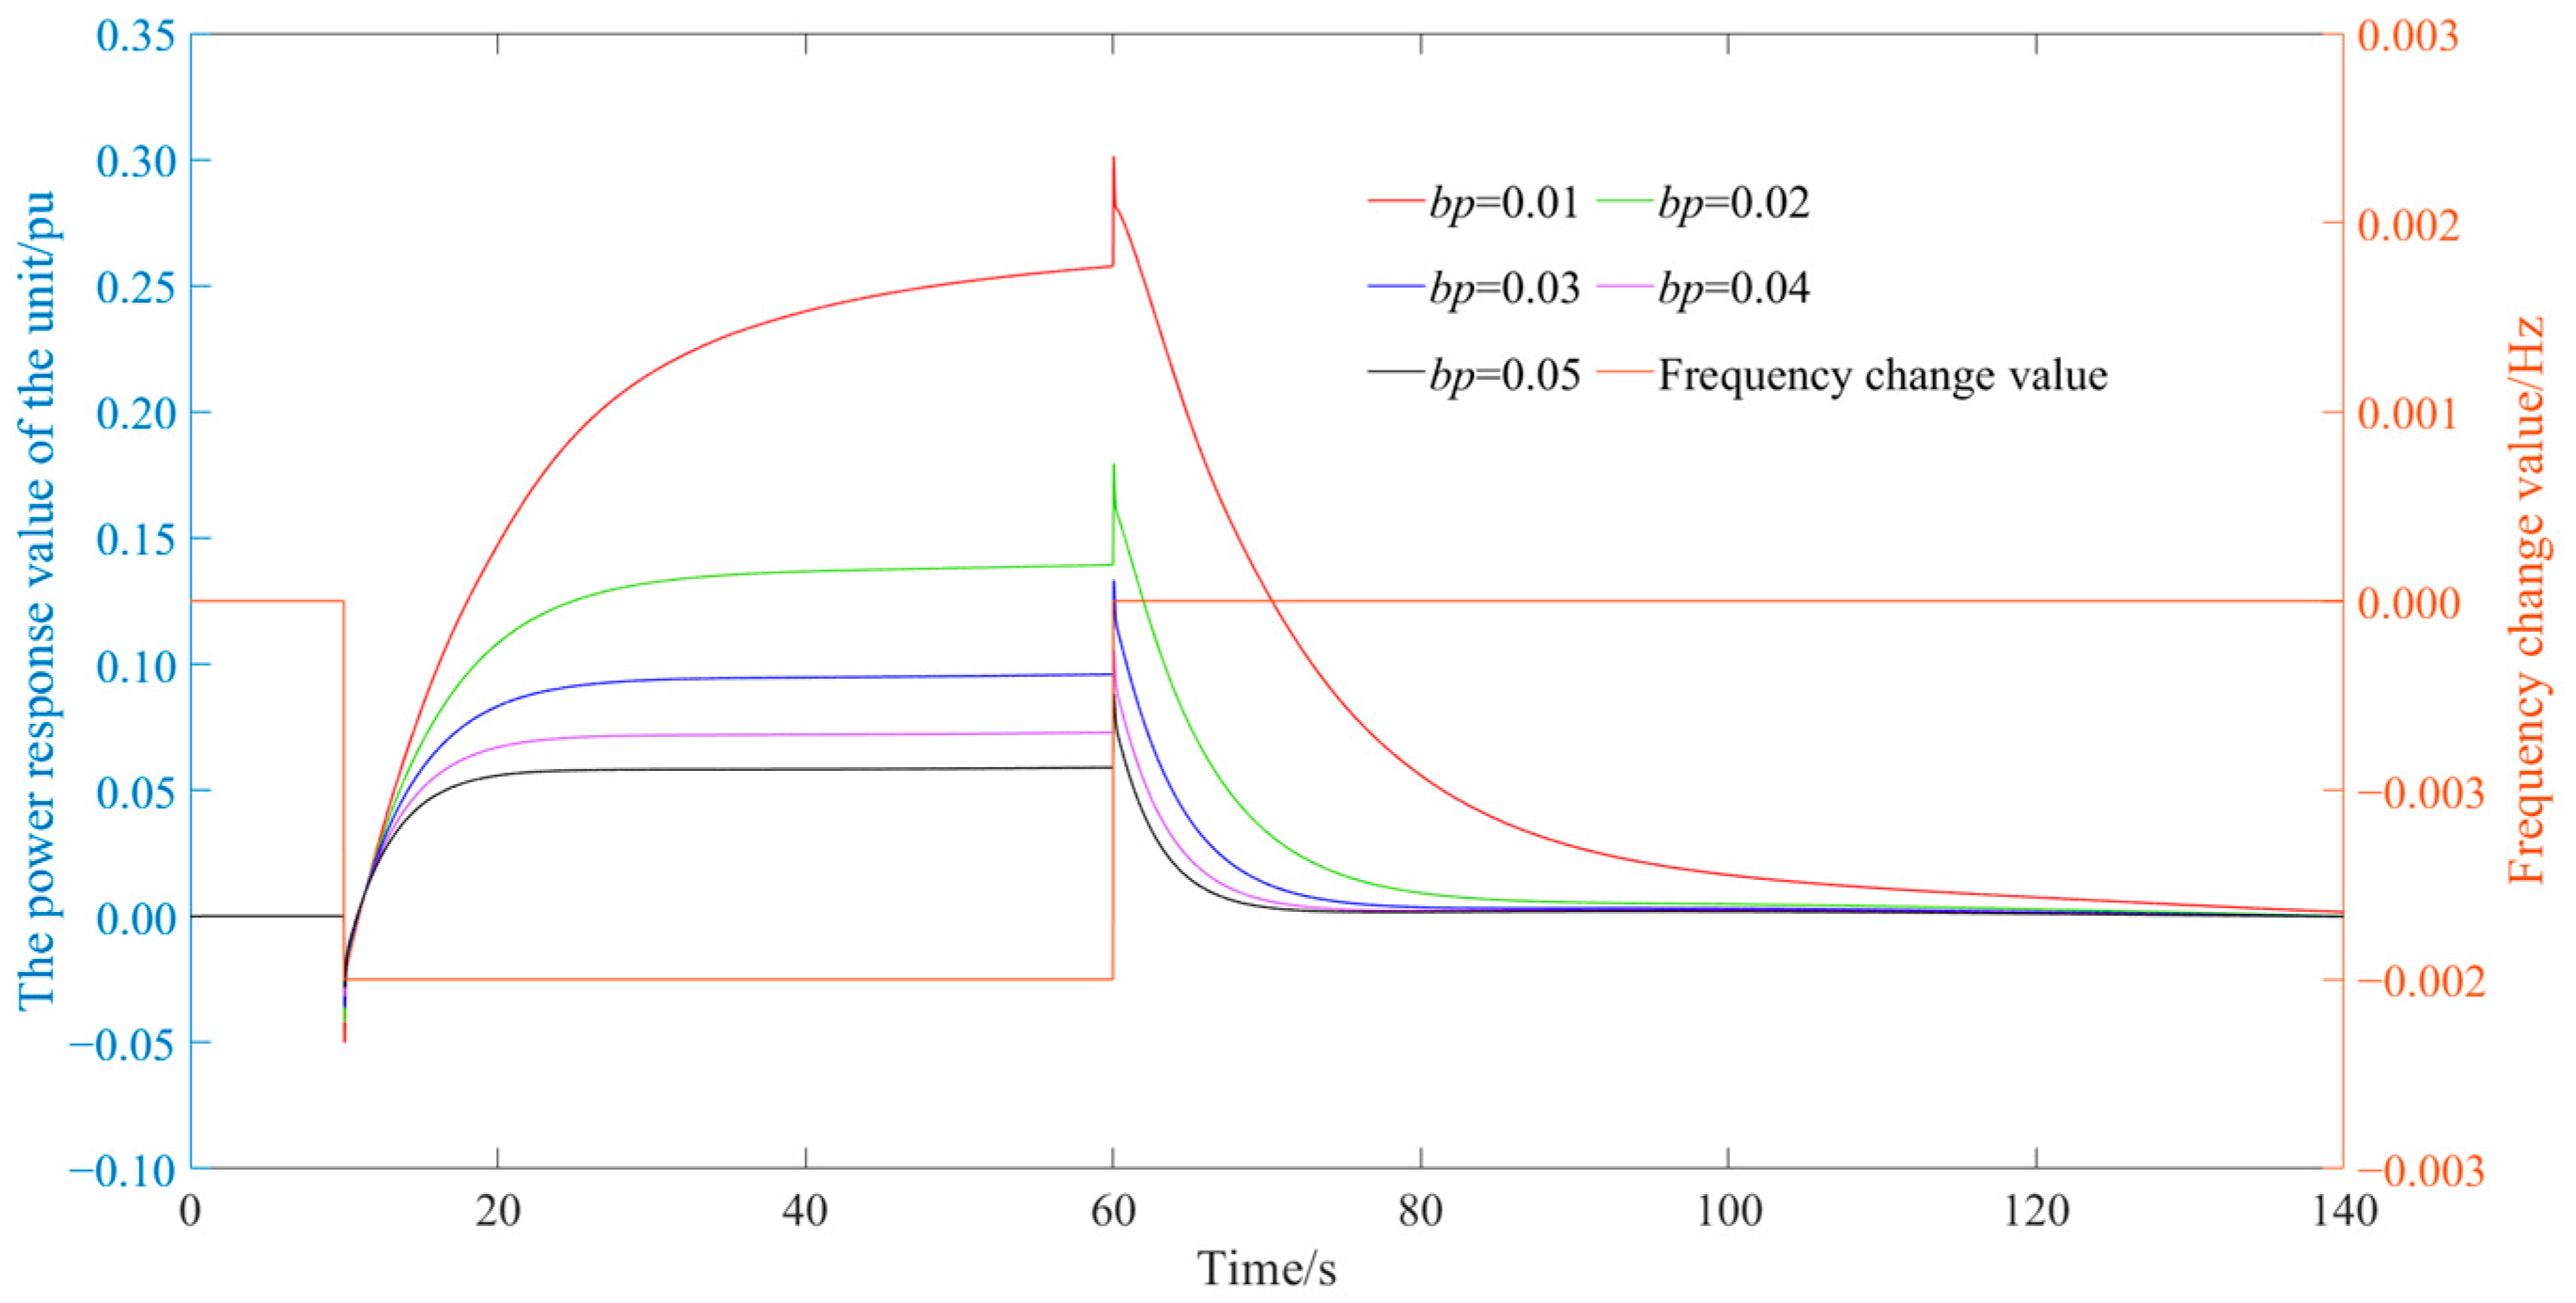
The steady-state slip coefficient (bp) is a core static parameter in a hydro turbine governor. bp directly determines the steady-state response intensity of the unit to frequency deviations. It serves as the core gain coefficient linking the frequency deviation Δf to the target power adjustment ΔP of the unit. It has a decisive influence on the steady-state operational characteristics of the hydroelectric generator set and its ability to participate in primary frequency regulation of the power grid. To systematically evaluate its influence, simulations were conducted under grid frequency disturbances of +0.1 Hz and –0.1 Hz across different bp values, analyzing the effect of bp on the dynamic response and performance of the primary frequency regulation process.
As shown in Figure 23 and Figure 24, both the regulation load amplitude and the regulation time of the primary frequency regulation process decrease as bp increases. Consequently, under the same frequency disturbance, a smaller bp value leads to a larger regulation amplitude and a longer regulation time. This relationship is further supported by the data in Table 8: when subjected to a +0.1 Hz disturbance, the load regulation amplitude at bp = 0.05 is only 48.32% of that at bp = 0.02, while the regulation time is reduced to 51.17%. Additionally, the unit demonstrates better performance in response to a +0.1 Hz disturbance compared to a −0.1 Hz disturbance. These findings indicate that operating the unit close to its high-efficiency zone during actual production can significantly enhance the performance of the primary frequency regulation process.

3.2.3. The Effect of Integral Gain on Single Frequency Modulation

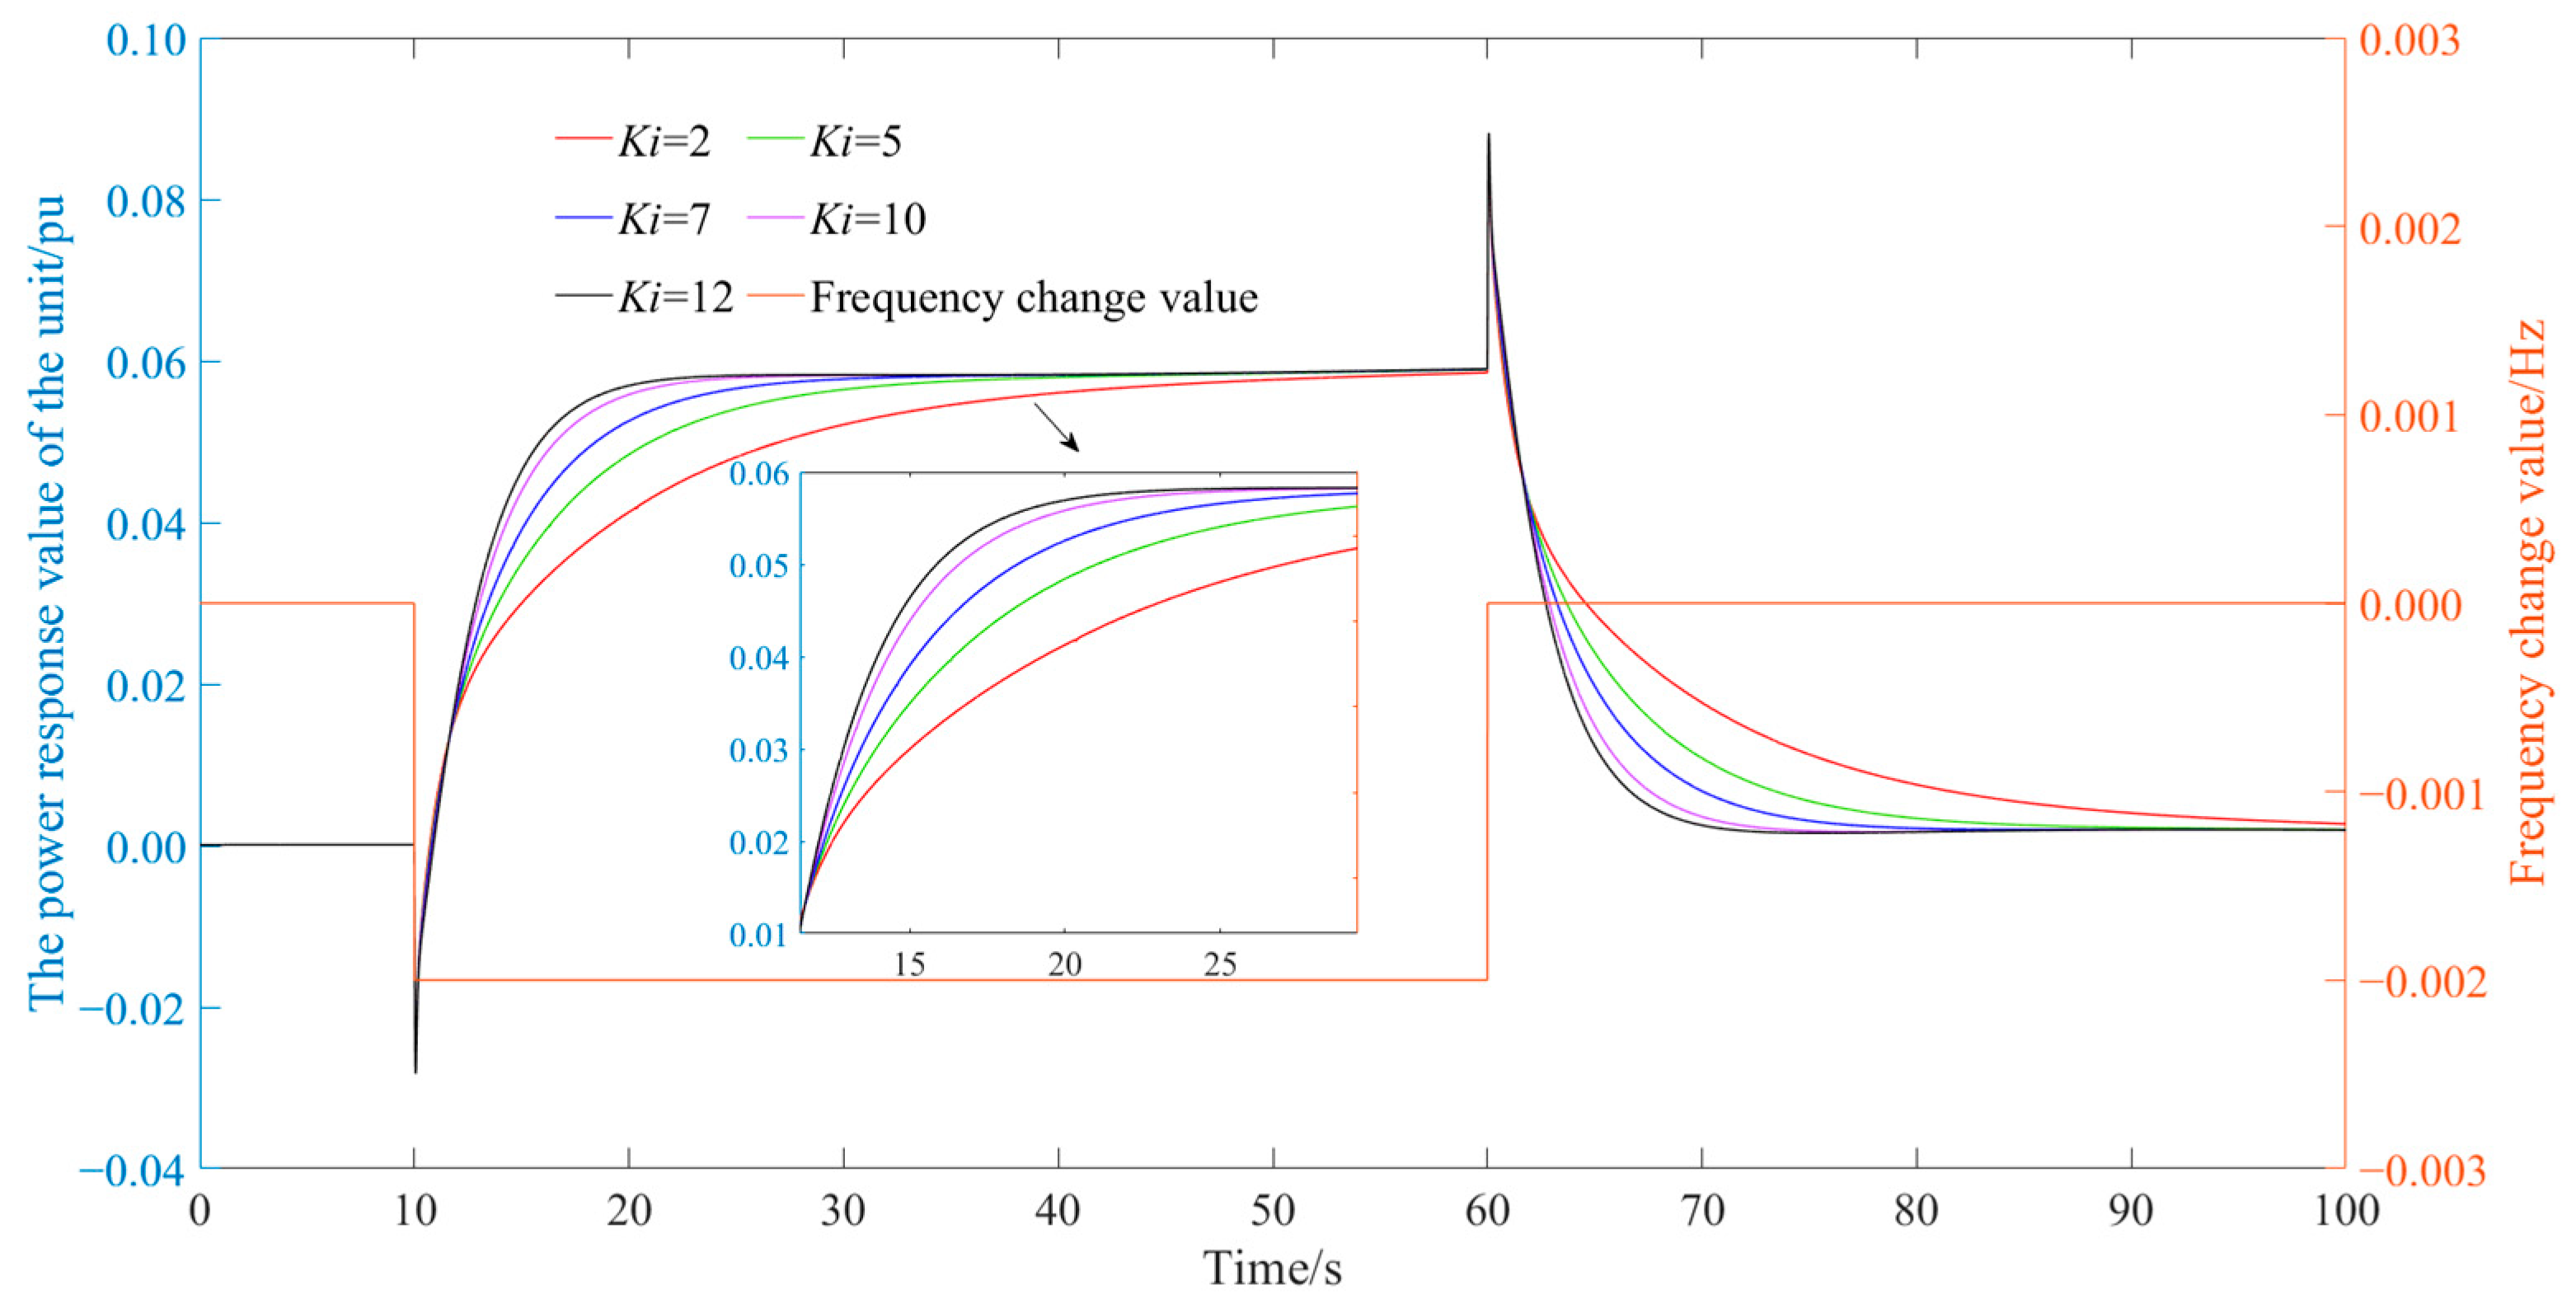
The integral gain (Ki) is a core parameter of the integral term in a PID controller, which accumulates system error over time and substantially influences the performance of primary frequency regulation in hydro turbines. To evaluate its impact, frequency disturbances of +0.1 Hz and –0.1 Hz were simulated in the grid, and the response of the hydro unit under varying Ki values was analyzed.
As shown in Figure 25 and Figure 26, the primary frequency regulation process of the unit under different integral gain settings indicates that as Ki increases, the amplitude of the regulation load remains constant, but the regulation time decreases. The data in Table 9 also confirms this. Under a +0.1 Hz disturbance, the load regulation time at Ki = 12 is 30.9% of that at Ki = 3. Thus, increasing Ki significantly enhances the regulation speed without altering the magnitude of the power adjustment, leading to more rapid frequency stabilization while maintaining consistent regulation amplitude.
The integral term is primarily used to eliminate steady-state errors, and its gain directly affects the speed and accuracy of the regulation process. The results show that as the integral gain increases, the frequency regulation response speed of the unit improves significantly, the power change curve becomes steeper and faster, and the system can more quickly approach and maintain the target output, demonstrating stronger steady-state tracking capability. However, an excessively large Ki may cause the system to respond too quickly initially, leading to significant transient fluctuations, and posing risks of overshoot and reduced system stability. The active power regulation process of the unit under different bp parameters is shown in Figure 27. The active power regulation process of the unit under different Ki parameters is shown in Figure 28 and Figure 29. Different gain factors on the frequency response process index of hydropower stations, as shown in Table 10.

4. Conclusions

This paper investigates the influence of the working head of the hydro turbine, PWM parameters, and governor parameters on the process of regulating the active power of the unit. The performance metrics of the regulation process are quantified from two perspectives: regulation time and overshoot. The main conclusions are as follows:
(1)
Influence of Head on Regulation Speed
The analysis of AGC parameter characteristics indicates that head plays a decisive role in active power regulation. Units operating under high-head conditions demonstrate significantly faster response, as reflected by the calculated regulation time metrics. This advantage is evident in both wet and dry seasons, highlighting the importance of head conditions in practical power plant operations.
(2)
Effects of PWM Parameters
Among the PWM parameters, the pulse ratio coefficient β directly affects the amplification of the deviation between actual and target power values. A smaller β accelerates regulation but increases the risk of overshoot, reflecting a trade-off between speed and stability. Similarly, the pulse period is critical: shorter values reduce regulation time and enhance response, but excessively small periods may cause pulse width superposition, resulting in large guide vane movements that threaten long-term operational stability.
(3)
Roles of Pulse Duration Limits and Integral Conversion
The maximum pulse duration limit (Tkmax) directly influences the regulation range of guide vane opening within each pulse cycle. As Tkmax increases, the effective action range of the guide vane expands, leading to a notable reduction in the regulation time required for power correction. For instance, when Tkmax is increased from 0.20 to 0.55, the regulation time is reduced by approximately 44%. However, this improvement comes at the expense of a lower pulse output frequency and fewer guide vane actions. By contrast, the minimum pulse duration limit (Tkmin) primarily affects regulation accuracy in the later stages of the correction process. If Tkmin is set excessively large, the unit may fail to fully reach the target output, resulting in under-regulation.
(4)
PFR parameter influence
Research on PFR parameter characteristics shows that higher head conditions enhance frequency regulation capability by amplifying power fluctuation response, though excessively high head may induce overshoot risks. The core parameter bp determines both regulation amplitude and time, where larger values shorten response time and reduce load fluctuation but may compromise performance criteria. In addition, the integral gain Ki plays a decisive role, with larger values significantly improving PFR speed.
This paper investigates the influence of parameters such as head and PMW on the active power regulation process and primary frequency regulation process of hydroelectric units from the perspective of parameter characteristic analysis. It compares different performance metrics during the regulation process to more specifically illustrate the influence patterns of parameters on the regulation process. Although this study provides a systematic analysis of turbine head, PWM parameters, and governor parameters on the regulation performance of hydropower units, it still has certain limitations. The investigation is limited to a subset of parameters and performance metrics, without fully considering the coupling effects of multiple parameters, long-term operating stability, or external grid disturbances. Therefore, the findings may not fully capture the complexity of practical operating conditions, and future work should extend the scope to include additional factors and more comprehensive evaluation indicators.

Author Contributions

Conceptualization, Y.L. and X.A.; methodology, Y.L. and J.C.; software, L.L. and Y.S.; validation, D.Z. and Y.S.; formal analysis, J.C. and Y.S.; investigation, Y.L.; resources, Z.Y.; data curation, N.C.; writing—original draft preparation, Z.Y. and L.L.; writing—review and editing, N.C. and L.L.; visualization, D.Z.; supervision, X.A.; project administration, Y.L.; funding acquisition, J.C. All authors have read and agreed to the published version of the manuscript.

Funding

The authors declare that this study received funding from Science and Technology Project of Ningnan Baihetan Power Plant, Three Gorges Jinsha River Yunchuan Hydropower Development Co., Ltd. (Z532402010). The funder was not involved in the study design, collection, analysis, interpretation of data, the writing of this article or the decision to submit it for publication.

Data Availability Statement

The data that support the findings of this study are available on request from the corresponding author, upon reasonable request.

Conflicts of Interest

Author Yingbin Li, Jian Cheng, Lihua Li, Yousong Shi, Dongdeng Zhang, Zhong Yang, Nan Chen was employed by the company Baihetan Hydropower Plant, China Yangtze Power Co., Ltd. The remaining authors declare that the research was conducted in the absence of any commercial or financial relationships that could be construed as a potential conflict of interest.

References

  1. IPCC. Climate Change 2023: Synthesis Report. In Contribution of Working Groups I, II and III to the Sixth Assessment Report of the Intergovernmental Panel on Climate Change (AR6 SYR); IPCC: Geneva, Switzerland, 2023. [Google Scholar]
  2. Zhong, Z.; Ding, Y.; Chen, Y.; Liao, P.; Chen, Q. Improving commercial-scale alkaline water electrolysis systems for fluctuating renewable energy: Unsteady-state thermodynamic analysis and optimization. Appl. Energy 2025, 395, 126183. [Google Scholar] [CrossRef]
  3. Kong, Y.; Wang, T.; Chu, F. Meshing frequency modulation assisted empirical wavelet transform for fault diagnosis of wind turbine planetary ring gear. Renew. Energy 2019, 132, 1373–1388. [Google Scholar] [CrossRef]
  4. Wu, T.; Yang, H.; Wang, P.; Zhang, C.; Zhang, M. Data-driven fatigue reliability evaluation of offshore wind turbines under floating ice loading. J. Struct. Eng. 2024, 150, 05024004. [Google Scholar] [CrossRef]
  5. International Energy Agency (IEA). Renewables 2024: Analysis and Forecast to 2029; IEA: Paris, France, 2024. [Google Scholar]
  6. Cao, K.; Chen, S.; Chen, Y.; Nie, B.; Li, Z. Decision Analysis of Safety Risks Pre-Control Measures for Falling Accidents in Mega Hydropower Engineering Driven by Accident Case Texts. Reliab. Eng. Syst. Saf. 2025, 245, 111120. [Google Scholar] [CrossRef]
  7. Zhang, J.; Ji, Y.; Zhou, J.; Jia, Y.; Shi, G.; Wang, H. Cooperative AC/DC Voltage Margin Control for Mitigating Voltage Violation of Rural Distribution Networks with Interconnected DC Link. IEEE Trans. Power Deliv. 2025, 40, 1–15. [Google Scholar] [CrossRef]
  8. Liu, H.; Lu, T.; Yang, Y.; Guo, Y.; Wu, Q.; Xu, X.; Zeng, H. Blockchain-Based Optimization of Operation and Trading among Multiple Microgrids Considering Market Fairness. Int. J. Electr. Power Energy Syst. 2025, in press. [CrossRef]
  9. Song, Y.; He, X.; Xia, W.; Li, B.; Zeng, M. Extraction and Application of Intrinsic Predictable Component in Day-Ahead Power Prediction for Wind Farm Cluster. Energy 2025, 328, 136530. [Google Scholar] [CrossRef]
  10. Yang, M.; Guo, Y. Wind Power Cluster Ultra-Short-Term Prediction Error Correction Method Based on Load Peak–Valley Characteristics. CSEE J. Power Energy Syst. 2023. early access. Available online: https://ieeexplore.ieee.org/document/10322714 (accessed on 18 September 2025).
  11. Chen, G.; Liu, C.; Wu, G.; Ai, D.; Shi, H.; Li, Y. Research on Simulation Accuracy of Ultra-low Frequency Oscillation in Power System with High Proportion of Hydropower. In Proceedings of the 2019 IEEE Power & Energy Society General Meeting, Atlanta, GA, USA, 4–8 August 2019; pp. 834–838. [Google Scholar]
  12. Tu, R.; Guo, Z.; Liu, L.; Wang, S.; Yang, X. Optimization of primary frequency regulation performance and AGC control strategy for hydroelectric units in southwest power grid. Water Power 2021, 47, 106–111+122. [Google Scholar]
  13. Wang, G.; Geng, Z.; Ai, D.; Wei, W.; Li, Y.; Li, G.; Jin, L.; Li, W.; Tang, Y.; Mostafa, M.; et al. Influence of Hydro Turbine Supervision and Control System on Frequency Characteristics of High Proportion Hydropower System. In Proceedings of the E3S Web of Conferences, Dali, China, 21–23 May 2021; Volume 261, p. 01036. [Google Scholar]
  14. Rodrigo, A.; Kishokumar, G.; Kudahewa, E. Automatic Load-Frequency Control (ALFC) Scheme for Sri Lankan Power System. Eng.-J. Inst. Eng. Sri Lanka 2019, 52, 39–49. [Google Scholar] [CrossRef]
  15. Liu, M.; Jia, Z.; Li, H.; Cheng, Y. Hydropower unit primary frequency control model analysis. In Proceedings of the IEEE Conference, Chengdu, China, 18–20 December 2015; IEEE: Piscataway, NJ, USA, 2015. [Google Scholar]
  16. Wei, S.; Wang, Y.; Luo, P. Power regulation of digital electro-hydraulic governor. Hydropower Autom. Dam Monit. 2003, 4, 20–22. [Google Scholar]
  17. Guo, W.; Yang, J. Stability performance for primary frequency regulation of hydro-turbine governing system with surge tank. Appl. Math. Model. 2018, 54, 82–111. [Google Scholar] [CrossRef]
  18. Fu, L. Optimization of governor power mode for hydroelectric unit with variable top elevation tailrace tunnel. J. Hydroelectr. Eng. 2018, 37, 88–95. [Google Scholar]
  19. Zhang, J.; Li, H.; Xie, H. Analysis and functional improvement of primary frequency control system for hydroelectric units. J. Hydroelectr. Eng. 2009, 28, 206–213. [Google Scholar]
  20. Hao, J.; Xing, Q.; Zhang, L. Simulation of PWM control system based on S-Function. Electr. Power Autom. Equip. 2007, 1, 50–52. [Google Scholar]
  21. Yu, D.; Guo, Y. Online estimation of primary frequency regulation capability in power grid. Proc. CSEE 2004, 24, 77–81. [Google Scholar]
  22. Ju, J.; Nan, H.; Zhao, M.; Chen, Y. The Influence of the Ratio of Hydropower Unit Capacity on the Stability of Primary Frequency Regulation of Power Grid. In Proceedings of the 2018 IEEE 3rd Advanced Information Technology, Electronic and Automation Control Conference (IAEAC 2018), Chongqing, China, 12–14 October 2018; pp. 1388–1392. [Google Scholar]
  23. Liu, B.; Tang, F.; Yu, R.; Liu, F.S.; Zhang, Y.D. Frequency stability coordination control technology and practice of a multi-DC outgoing power grid with a high proportion of hydropower. Power Syst. Prot. Control. 2021, 49, 181–187. [Google Scholar]
  24. Chen, P. Discussion on AGC Optimization for Jinguan Cascade Hydropower Stations. China Rural. Water Hydropower 2018, 12, 184–187+192. [Google Scholar]
  25. Yang, W.; Yang, J.; Guo, W.; Zeng, W.; Wang, C.; Saarinen, L.; Norrlund, P. A mathematical model and its application for hydro power units under different operating conditions. Energies 2015, 8, 10260–10275. [Google Scholar] [CrossRef]
  26. Rezghi, A.; Riasi, A. Sensitivity analysis of transient flow of two parallel pump turbines operating at runaway. Renew. Energy 2016, 86, 611–622. [Google Scholar] [CrossRef]
  27. Guo, W.; Peng, Z. Hydropower system operation stability considering the coupling effect of water potential energy in surge tank and power grid. Renew. Energy 2019, 134, 846–861. [Google Scholar] [CrossRef]
  28. Shen, Z. Regulation of Hydraulic Turbines; China Water Power Press: Beijing, China, 1981. [Google Scholar]
  29. Li, C.; Chang, L.; Huang, Z.; Liu, Y.; Zhang, N. Parameter identification of a nonlinear model of hydraulic turbine governing system with an elastic water hammer based on a modified gravitational search algorithm. Eng. Appl. Artif. Intell. 2016, 50, 177–191. [Google Scholar] [CrossRef]
  30. Li, Y.; Wang, G.; Ai, D.; Wei, W.; Li, G.; Wu, J. Impact of Active Power Coordinated Control of Hydropower Units Considering LCU on Frequency Stability. Proc. CSEE 2021, 41, 167–173. [Google Scholar]
  31. Fu, L.; Bao, H.; Huang, B. Simulation Study on Active Power Regulation of Hydropower Generating Unit Monitoring System. J. Hydroelectr. Eng. 2020, 39, 62–71. [Google Scholar]
Figure 1. The overall analysis flowchart of regulation characteristics of hydropower units.
Water 17 02944 g001
Figure 2. Schematic diagram of the composition of a hydro turbine governor.
Water 17 02944 g002
Figure 3. Parallel PID control strategy block diagram.
Water 17 02944 g003
Figure 4. Typical monitoring system control method block diagram for power grids.
Water 17 02944 g004
Figure 5. Specific model block diagram of LCU active control. In the figure, Pref represents the active power setpoint of the unit, Pe represents the active power feedback value of the unit, e is the natural logarithm, td1, td2, td3 are the time constants of the delay stages in the figure, Td1, Td2, Td3 are the measurement time constants of the pulse measurement stages in the figure, DZ1 is the deadband of the active power difference, Kpe is the proportional gain coefficient of the power closed-loop control, and Ymax and Ymin are the maximum and minimum values of the active power deviation limits.
Water 17 02944 g005
Figure 6. LCU pulse output diagram.
Water 17 02944 g006
Figure 7. Newly added speed regulator model for the opening degree setpoint generation stage. In the figure, Kgvo and Kgvc are the proportional parameters for increasing and decreasing the guide vane opening at a given point, respectively; Ykmax and Ykmin are the maximum and minimum amplitude limits on the input side of the pulse/opening integral conversion link, respectively; Ykmax and Ykmin are the maximum and minimum amplitude limits on the output side of the pulse/opening integral conversion link, respectively; TR0 is the pulse measurement time constant; and T1 is the delay time constant of the measurement pulse.
Water 17 02944 g007
Figure 8. Active power regulation process of the unit.
Water 17 02944 g008
Figure 9. Effect of various parameters on PWM output.
Water 17 02944 g009
Figure 10. Active power regulation process of the unit.
Water 17 02944 g010
Figure 11. Turbine guide vane adjustment process.
Water 17 02944 g011
Figure 12. Turbine guide vane adjustment process.
Water 17 02944 g012
Figure 13. Active power regulation process of the unit.
Water 17 02944 g013
Figure 14. Turbine guide vane adjustment process.
Water 17 02944 g014
Figure 15. Unit LCU output pulse diagram.
Water 17 02944 g015
Figure 16. Active power regulation process of the unit.
Water 17 02944 g016
Figure 17. Turbine guide vane adjustment process.
Water 17 02944 g017
Figure 18. Unit LCU output pulse diagram.
Water 17 02944 g018
Figure 19. Active power regulation process of the unit.
Water 17 02944 g019
Figure 20. Turbine guide vane adjustment process.
Water 17 02944 g020
Figure 21. Unit LCU output pulse diagram.
Water 17 02944 g021
Figure 22. Active power regulation process of the unit.
Water 17 02944 g022
Figure 23. Turbine guide vane adjustment process.
Water 17 02944 g023
Figure 24. Active power regulation process of the unit.
Water 17 02944 g024
Figure 25. Active power regulation process of the unit.
Water 17 02944 g025
Figure 26. Active power regulation process of the unit.
Water 17 02944 g026
Figure 27. Active power regulation process of the unit.
Water 17 02944 g027
Figure 28. Active power regulation process of the unit.
Water 17 02944 g028
Figure 29. Active power regulation process of the unit.
Water 17 02944 g029
Table 1. Advantages of this study compared to others.
AdvantagesReasons for the Advantage
ModelingA comprehensive simulation model for hydroelectric units under all operating conditions, incorporating PFR and AGC, has been established to demonstrate the coupled characteristics of water–mechanical–electrical systems.
Research ParametersThe parameters studied include hydraulic parameters, control system parameters, and AGC system parameters. The parameters studied are comprehensive.
Research ModelThe research model incorporates the characteristics of PFR and AGC.
Calculation IndicatorsThe calculated metrics include grid performance indicators, reflecting both responsiveness and stability.
Table 2. Head response process indicators for active power in hydropower stations.
H (m)Δ (%)ts (s)
202 m0.052011.4
163.9 m0.265919.37
243.1 m0.00247.45
180 m0.129815.05
220 m0.04139.43
Table 3. Fixed pulse width calculation parameters for active power response process indicators in hydropower stations.
βΔ (%)ts (s)
0.160.052011.4
0.180.00712.89
0.2-14.82
0.22-16.33
0.24-17.82
Table 4. Pulse cycle as an indicator of active power response process for hydropower stations.
T (s)Δ (%)ts (s)
0.6-10.3
0.70.052010.4
0.80.208510.74
0.90.312311.47
Table 5. Indicators of the active power response process of hydropower stations under maximum pulse duration limiting in different cycles.
Tkmax (s)Δ (%)ts (s)
0.20.044220.53
0.250.047117.7
0.30.049515.02
0.40.051212.83
0.550.052011.4
Table 6. Indicators of active power response process of hydropower stations under minimum pulse duration limiting in different cycle.
Tkmin (s)Δ (%)ts (s)
00.309411.33
0.02−0.154511.64
0.05−0.877112.29
0.07−1.351212.89
0.1−2.027214.2
Table 7. Indicators of active power response process of hydropower stations under different integral conversion parameters of opening degree.
Tiy (−)Δ (%)Ts (s)
750.07398.5
1000.052011.4
125-14.4
150-17.3
Table 8. Frequency response process indicators of hydropower stations under different water heads.
Frequency Fluctuation ValueWater Head (m)Adjustment Time (s)Load Adjustment Range (%)
+0.1 Hz2029.5712.433
163.99.512.017
243.19.710.8894
1809.6412.6595
2209.8511.5239
−0.1 Hz20210.3612.6573
163.911.2812.3089
243.110.3511.2523
18010.713.278
22010.3511.735
Table 9. Different steady-state transfer coefficients for hydropower station frequency response process indicators.
Frequency Fluctuation Valuebp (−)Adjustment Time (s)Load Adjustment Range (%)
+0.1 Hz0.0131.9653.9
0.0218.725.33
0.0313.5518.28
0.041114.65
0.059.5712.24
−0.1 Hz0.0133.5455.9901
0.0220.0330.76
0.0314.8421.215
0.0411.9516.1234
0.0131.9653.9
Table 10. Different gain factors on the frequency response process index of hydropower stations.
Frequency Fluctuation ValueKiAdjustment Time (s)Load Adjustment Range (%)
+0.1 Hz326.7612.09
517.412.22
712.9212.23
109.5712.24
128.2812.24
−0.1 Hz328.3212.84
518.5513.02
713.8113.04
1010.2513.05
326.7612.09
Disclaimer/Publisher’s Note: The statements, opinions and data contained in all publications are solely those of the individual author(s) and contributor(s) and not of MDPI and/or the editor(s). MDPI and/or the editor(s) disclaim responsibility for any injury to people or property resulting from any ideas, methods, instructions or products referred to in the content.