Article

Long-Term Runoff Prediction Using Large-Scale Climatic Indices and Machine Learning Model in Wudongde and Three Gorges Reservoirs

1
Key Laboratory of Hydrometeorological Disaster Mechanism and Warning of Ministry of Water Resources, Nanjing University of Information Science and Technology, Nanjing 210044, China
2
Hubei Key Laboratory of Intelligent Yangtze and Hydroelectric Science, China Yangtze Power Co., Ltd., Yichang 443000, China
*
Author to whom correspondence should be addressed.
Water 2025, 17(20), 2942; https://doi.org/10.3390/w17202942
Submission received: 25 August 2025 / Revised: 28 September 2025 / Accepted: 10 October 2025 / Published: 12 October 2025
(This article belongs to the Section Hydrology)

Abstract

Reliable long-term runoff prediction for Wudongde and Three Gorges reservoirs, two major reservoirs in the upper Yangtze River basin, is crucial for optimal operation of cascade reservoirs and hydropower generation planning. This study develops a data-driven model that integrates large-scale climate factors with a Gated Recurrent Unit (GRU) neural network to enhance runoff forecasting at lead times of 7–18 months. Key climate predictors were systematically selected using correlation analysis and stepwise regression before being fed into the GRU model. Evaluation results demonstrate that the proposed model can skillfully predict the variability and magnitude of reservoir inflow. For Wudongde Reservoir, the model achieved a mean correlation coefficient (CC) of 0.71 and Kling–Gupta Efficiency (KGE) of 0.57 during the training period, and values of 0.69 and 0.53 respectively during the testing period. For Three Gorges Reservoir, the CC was 0.67 (training) and 0.66 (testing), and the KGE was 0.52 and 0.49 respectively. The model exhibited robust forecasting capabilities across a range of lead times but showed distinct seasonal variations, with superior performance in summer and winter compared to transitional months (April and October). This framework provides a valuable tool for long-term runoff forecasting by effectively linking large-scale climate signals to local hydrological responses.

1. Introduction

Accurate long-term runoff prediction is critically important for water resources management, flood control, drought mitigation, and hydropower generation planning. As climate change intensifies hydrological variability, the demand for robust runoff predictions with extended lead times has grown substantially [1]. The runoff prediction methods can be broadly categorized into physically driven models and data-driven models. The physically based hydrological models, such as Soil and Water Assessment Tool (SWAT) [2], Variable Infiltration Capacity (VIC) [3], and Xin’anjiang [4] models, simulate runoff generation processes based on physical laws describing precipitation, infiltration, evapotranspiration, and river routing. Although such models can provide valuable insights into hydrological processes and are theoretically transferable across different basins [5,6,7], they face several challenges in long-term runoff prediction. Firstly, some process representations (e.g., groundwater dynamics, snowmelt) in these models are simplified, which may not fully capture real-world complexities. Secondly, these models rely on meteorology and detailed watershed characteristics, including topography, soil properties, and land cover, to represent hydrological responses mechanistically. The data input conditions significantly constrain the availability and performance of the physically driven models, which can only achieve good results in regions with complete information [8,9,10]. Furthermore, the errors in meteorological forcings (e.g., precipitation, temperature) and uncertainties in model structure and parameters could lead to a corresponding accumulation of prediction errors [11,12].
In contrast, the data-driven models, including statistical methods (e.g., autoregressive integrated moving average, ARIMA) [13] and machine learning techniques (e.g., random forests [14], long short-term memory networks (LSTMs) [15], gated recurrent unit (GRU) [16]), learn patterns directly from historical hydrological and climatic data without explicitly describing physical processes. These approaches have been widely used due to their ability to handle non-linear relationships and adapt to varying hydrological conditions [17,18]. For example, Hu et al. [19] proposed a Convolutional Neural Network (CNN)-LSTM hybrid model for daily runoff prediction in the source region of the Yellow River Basin based on grid-based precipitation and soil moisture data. Islam et al. [20] combined remote sensing data and a random forest model to predict streamflow in the Rio Grande Headwaters near Del Norte, which showed a higher accuracy than the SWAT-based model. Despite their success in short-term runoff forecasting, data-driven models still face several challenges in long-term (seasonal to annual scales) applications, such as the limited memory and impacts of input features. Recent advances in hydrological forecasting have increasingly incorporated large-scale climate teleconnection patterns, such as atmospheric blocking events, the East Asian Monsoon system, and sea surface temperature anomalies, as critical predictors for long-term runoff prediction [21,22,23,24]. These climate drivers exhibit persistent and lagged effects (ranging from seasonal to decadal scales) on regional hydrological cycles, making them particularly valuable for extending forecast horizons beyond traditional short-term approaches [25,26]. However, long-term runoff predictions usually require more data than short-term and mid-term predictions, and many climate teleconnection indices are interactive. Previous studies have shown that the increase in the amount of input features and their interdependence could introduce more noisy information in the prediction, leading to model overfitting and an increase in the prediction uncertainty [27,28]. Therefore, identifying key predictors that are both statistically independent and skillful for runoff prediction is essential and also a challenging task in hydrological modeling.
This study aims to develop a long-term runoff prediction model combined with large-scale climate teleconnection factors and a machine learning model, and apply it to the upper Yangtze River Basin (UYRB). Specifically, we (1) recognize the key predictors from enormous climate indices using correlation analysis and stepwise regression, (2) use the selected predictors as input features for the GRU machine learning model to construct and train the data-driven prediction model with lead times ranging from 7 to 18 months, and (3) verify its performance by comparing the predictions with observations during both training and testing periods. The paper is organized as follows. Section 2 presents the information of the study area and climate indices, as well as the runoff data used in this study. The framework of the input features selection and model prediction is described in detail in Section 3. The key predictors and predictive skills of the proposed model, as well as some corresponding discussions, are presented in Section 4. Section 5 gives the main conclusions.

2. Study Area and Data

2.1. Study Area

The UYRB, a critical water resource and hydropower generation region in China (Figure 1), encompasses approximately 1 million km2 and contributes over 40% of the Yangtze River’s total discharge. The UYRB exhibits complex hydrological regimes influenced by monsoon climate patterns, snowmelt from the Tibetan Plateau, and large-scale climate oscillations (e.g., El Niño-Southern Oscillation, ENSO; Indian Ocean Dipole, IOD). Two large reservoirs, including Wudongde reservoir and the Three Gorges Reservoir, are located in the UYRB. The Wudongde dam, located downstream of the Jinsha River (the upper reach of the Yangtze), began operation in 2020 with a total storage capacity of 7.4 × 10⁹ m3, playing a pivotal role in flood control, power generation, and sediment regulation. Further downstream, the Three Gorges Dam, the world’s largest hydropower project in terms of installed capacity (22,500 MW), has a storage capacity of 3.93 × 10¹⁰ m3 and significantly influences river discharge, sediment transport, and regional climate. This study focused on the natural inflow runoff prediction for both reservoirs, which is crucial for optimizing reservoir operations and ensuring water supply security.

2.2. Data

Monthly inflow of the Wudongde and Three Gorges reservoirs from 1961 to 2023 was collected from Changjiang Water Resources Commission of the Ministry of Water Resources. The 114 monthly climate indices, including 88 atmospheric circulation indices (e.g., Western Pacific Subtropical High Intensity, Blocking High Index, East Asian Monsoon Index) and 26 sea surface temperature (SST) indices (e.g., Niño regions, Indian Ocean Dipole, Atlantic Multidecadal Oscillation), were provided by the National Climate Center of China Meteorological Administration (https://cmdp.ncc-cma.net/Monitoring/cn_index_130.php (accessed on 1 January 2025)). These indices were derived from observational and reanalysis data, which have been widely applied in climate and hydrological forecasting and extreme event analysis [29,30,31]. The climate indices with more than 30% missing values were excluded. For the remaining indices, gaps in the data were filled using linear interpolation between adjacent values. Finally, 103 climate indices, including 77 atmospheric circulation indices and 26 SST indices, were used in the following analysis. The names and physical meanings of indices used in this study can be found at https://cmdp.ncc-cma.net/Monitoring/cn_index_130.php (accessed on 1 January 2025) and Table S1.

3. Methodology

3.1. The Framework of Runoff Prediction

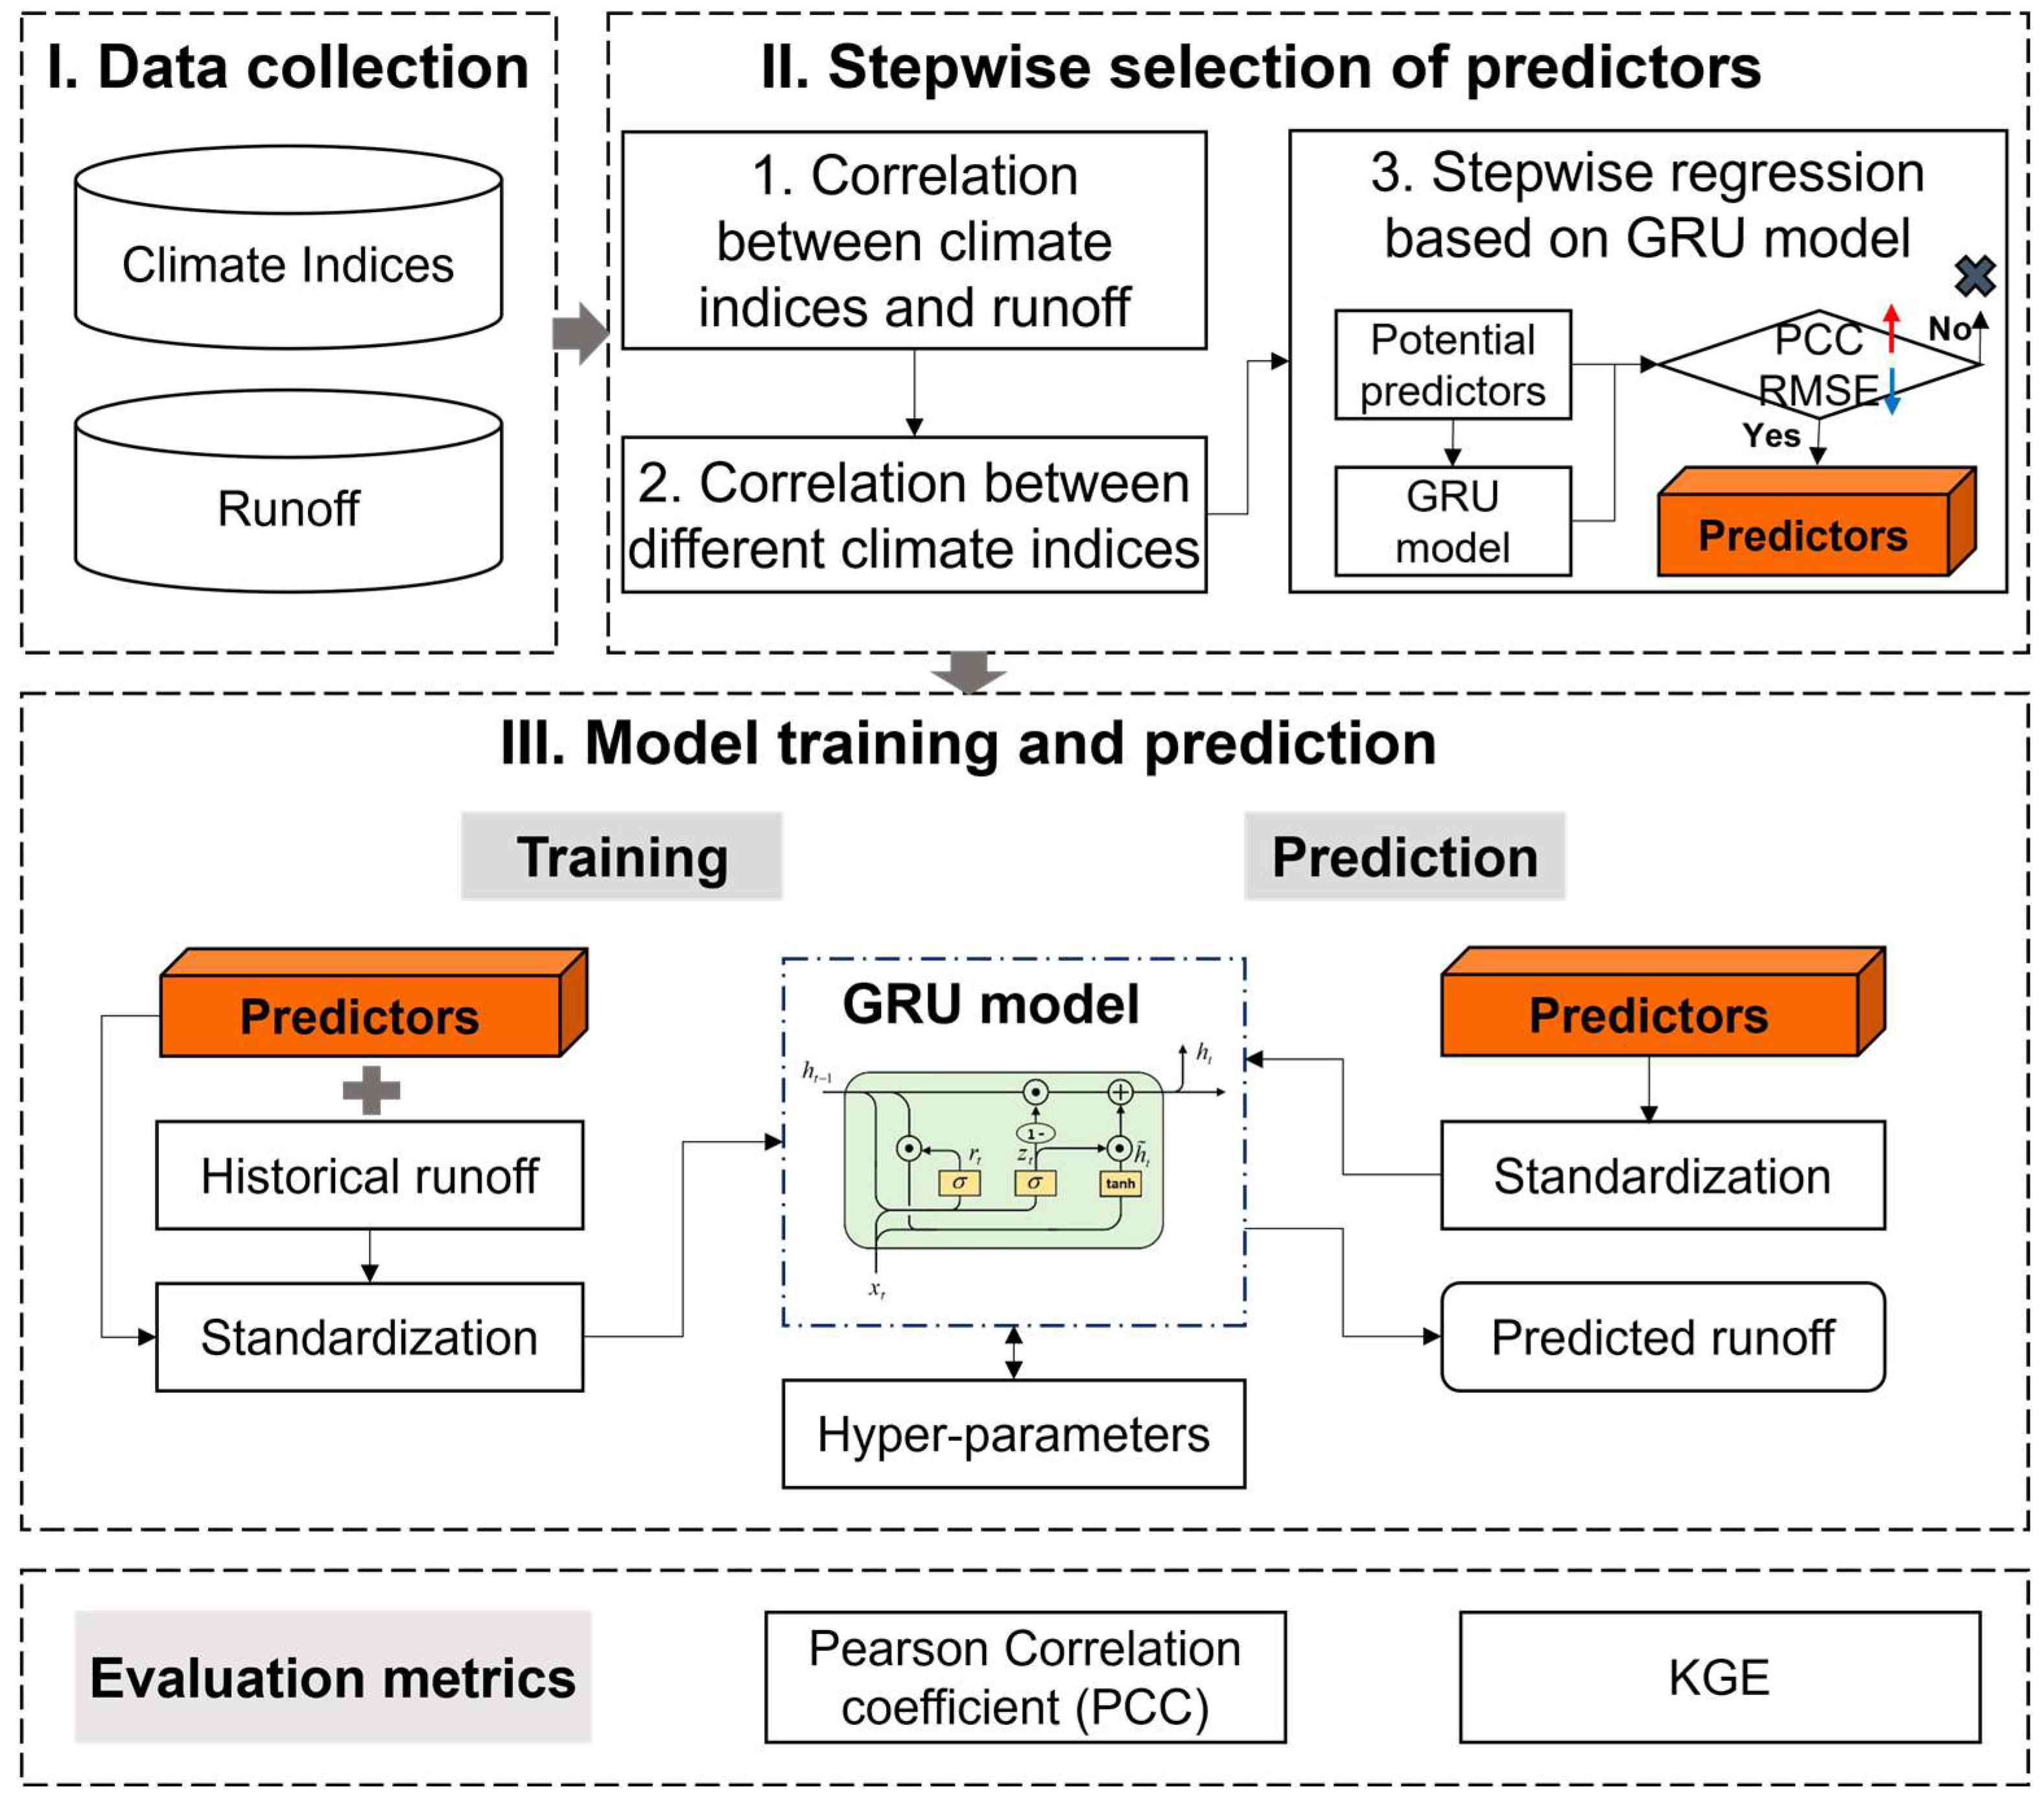
The framework of the runoff prediction model is illustrated in Figure 2 and comprises four main steps: (1) date collection, including climate indices and runoff data, as introduced in Section 2.2; (2) stepwise selection of predictors; (3) development of a runoff prediction model based on the predictors selected in step (2), utilizing a GRU network; and (4) model validation and evaluation. Further details are provided in the subsequent sections.

3.2. Stepwise Selection of Predictors

Identifying the major predictors is critical for improving the accuracy of runoff prediction and avoiding model overfitting. The entire study period was divided into training period (1961–2010) and testing period (2011–2023). During the training period, the predictor selection procedure contains three steps. First, considering the lagged influence of teleconnection factors on the runoff, climate indices from 1 to 24 months prior to the forecast start date were treated as the candidate predictors. Here, a total of 2472 (=103 factors × 24 months) candidate predictors were generated. Then, the Pearson correlation coefficient (PCC_CR) between monthly runoff and these candidate predictors was calculated using Equation (1).
P C C _ C R = i = 1 n ( R R ¯ ) ( I n d e x I n d e x ¯ ) i = 1 n ( R R ¯ ) 2 i = 1 n ( I n d e x I n d e x ¯ ) 2
where, R and Index denote monthly runoff and candidate predictors (i.e., climate indices), and R ¯ and I n d e x ¯ are their means, respectively. The climate factors showing significant correlation (p-value < 0.1) with runoff were retained, and then ranked in descending order based on their absolute PCC_CR with runoff. Sequentially from the first-ranked index, we calculated pairwise correlations between these indices and excluded those showing significant inter-correlation (p-value < 0.05) while retaining the index with stronger runoff correlation. Finally, the best predictors were derived from stepwise regression method. Specifically, the predictor which has the highest correlation with the runoff was initially used in GRU model to predict the runoff. The rest predictors were sequentially introduced into the GRU model, one by one, for the prediction. The PCC and root-mean-square error (RMSE) between predicted and observed runoff was calculated to measure the model’s performance, following Equations (2) and (3).
P C C = i = 1 n ( R o b s R o b s ¯ ) ( R p r e d R p r e d ¯ ) i = 1 n ( R o b s R o b s ¯ ) 2 i = 1 n ( R p r e d R p r e d ¯ ) 2
R M S E = i = 1 n ( R p r e d R o b s ) 2 n
where, Robs and Rpred are observed and predicted runoff, and R o b s ¯ and R p r e d ¯ are their means, respectively. The predictor was included in the best predictors set when it leads to an increase in PCC and reduction in RMSE. Due to different impact of climate patterns and the distinct differences between monthly runoff series in the year, the feature selection was separately conducted for each calendar month and each lead time. Therefore, the best predictors for each month with different lead times were different.

3.3. Model Training and Prediction

For each calendar month and lead time, the best predictors set was selected as the input of the GRU model for forecasting the runoff. The GRU prediction model comprises three fundamental layers: input layer that receives the best predictors series, hidden layer that consists of a single GRU layer, and output layer that implements a fully connected (dense) layer to generate the target predictions. The GRU model was trained during the training period (1961–2010). First, to eliminate the dimensional effect for different types of data, the input predictors and runoff data were both scaled by subtracting the minimum value of each variable and dividing by the difference between their maximum and minimum values, as shown in Equation (4).
x = x m i n ( x ) max x m i n ( x )
where, x denotes the input feature or runoff data, x′ denotes the standardized value.
Here, we employed Adam (Adaptive Moment Estimation) optimizer to optimize the model parameters (weights and biases), and the mean-square error was used as the loss function. Hyper-parameters, such as learning rate, number of neural units, dropout rates, and batch size, also have a large influence on the performance of the GRU model [32]. To improve the computational efficiency, Bayesian Optimization was used for the automatic tuning of these hyper-parameters [33]. The model was implemented in Python 3.9.12 using Keras 3.6.0 and BayesianOptimization 2.0.0.
The GRU model was then validated during testing period (2011–2023) based on the preprocessed selected predictors and parameters during the training period. Subsequently, runoff can be predicted with the selected predictors using the GRU-based model. In this study, to improve runoff forecasting performance, a separate GRU-based prediction model was trained and applied for each calendar month and each lead time.

3.4. Model Evaluation Metrics

In this study, the PCC (Equation (2)) and Kling–Gupta Efficiency (KGE) were used to evaluate the performance of the GRU-based runoff prediction model. The KGE was adopted as it simultaneously accounts for the correlation, variability, and bias between model predictions and observed values, which is calculated as Equation (5).
K G E = 1 ( P C C 1 ) 2 + ( β 1 ) 2 + ( γ 1 ) 2
where PCC is the Pearson correlation coefficient between observations and predictions, β is the ratio of predicted to observed means ( R p r e d ¯ / R o b s ¯ ), γ is the ratio of predicted to observed standard deviations ( σ R p r e d / σ R o b s ). The KGE metric ranges from negative infinity to 1, with values closer to 1 indicating better model performance.

4. Results and Discussion

4.1. The Key Predictors and Performance of Runoff Prediction Model at the Wudongde Reservoir

In this study, we focused on long-term runoff prediction, with lead times ranging from 7 to 18 months. The best predictors set for runoff prediction in Wudongde reservoir varied across different months and lead times (Table S2). The 19-month-ahead AMO (Atlantic Multi-decadal Oscillation Index), 24-month-ahead NAFSHRP (North African Subtropical High Ridge Position Index), 29-month-ahead NHPVCL (Northern Hemisphere Polar Vortex Central Longitude Index), and 26-month-ahead AECWP (Atlantic-European Circulation W Pattern Index) were the key predictors for improving the accuracy of inflow runoff during January–March. In April, the 26-month-ahead NHPVA (Northern Hemisphere Polar Vortex Area Index), 10-month-ahead AECWP, 24-month-ahead ISHRP (Indian Subtropical High Ridge Position Index), and 13-month-ahead SCSHRP (South China Sea Subtropical High Ridge Position Index) were the best predictors, particularly at shorter lead times. In May, the 15-month-ahead SCSHRP, 22-month-ahead EP850-TW (East Pacific 850mb Trade Wind Index), 17-month-ahead ISHRP, 18-month-ahead EPSHI (Eastern Pacific Subtropical High Intensity Index), and 21-month-ahead EPSHRP (Eastern Pacific Subtropical High Ridge Position Index) were important. In June, 29-month-ahead APVA (Asia Polar Vortex Area Index), 12-month-ahead EPSHRP, 21-month-ahead SIOD (South Indian Ocean Dipole Index), and 31-month-ahead AZC (Asian Zonal Circulation Index) were critical for the runoff prediction, with different roles across different lead times. In July, 24-month-ahead PPVA (Pacific Polar Vortex Area Index), 31-month-ahead EAMC (Eurasian Meridional Circulation Index), 13-month-ahead ASHRP (Atlantic Subtropical High Ridge Position Index), 30-month-ahead SCSHRP, and 15-month-ahead NAMSHRP (North American Subtropical High Ridge Position Index) were the major predictors. In August, 18-month-ahead NHPVI (Northern Hemisphere Polar Vortex Intensity Index), 24-month-ahead EATP (East Asian Trough Position Index), 27-month-ahead NAMSHRP, and 31-month-ahead NP pattern (North Pacific Pattern) were more important. In September, 11-month-ahead NHPVCL, 29-month-ahead NA-NASHRP (North American-North Atlantic Subtropical High Ridge Position Index), and 20-month-ahead NHSHRP (Northern Hemisphere Subtropical High Ridge Position Index) were the key predictors. In October, the 21-month-ahead NHPVCI (Northern Hemisphere Polar Vortex Central Intensity Index), 18-month-ahead NHSHRP, 27-month-ahead TSASST (Tropical Southern Atlantic SST Index), and 23-month-ahead AZC were important for improving the runoff predictive skill. In November, the 19-month-ahead AMC (Asian Meridional Circulation Index), 24-month-ahead AZC, and 22-month-ahead NHPVCI were the major predictors. The 17-month-ahead TSASST, 23-month-ahead SCA pattern (Scandinavia Pattern), 25-month-ahead AZC, 20-month-ahead EA/WR pattern (East Atlantic-West Russia Pattern), and 22-month-ahead EAMC were the best predictors for runoff prediction in December.
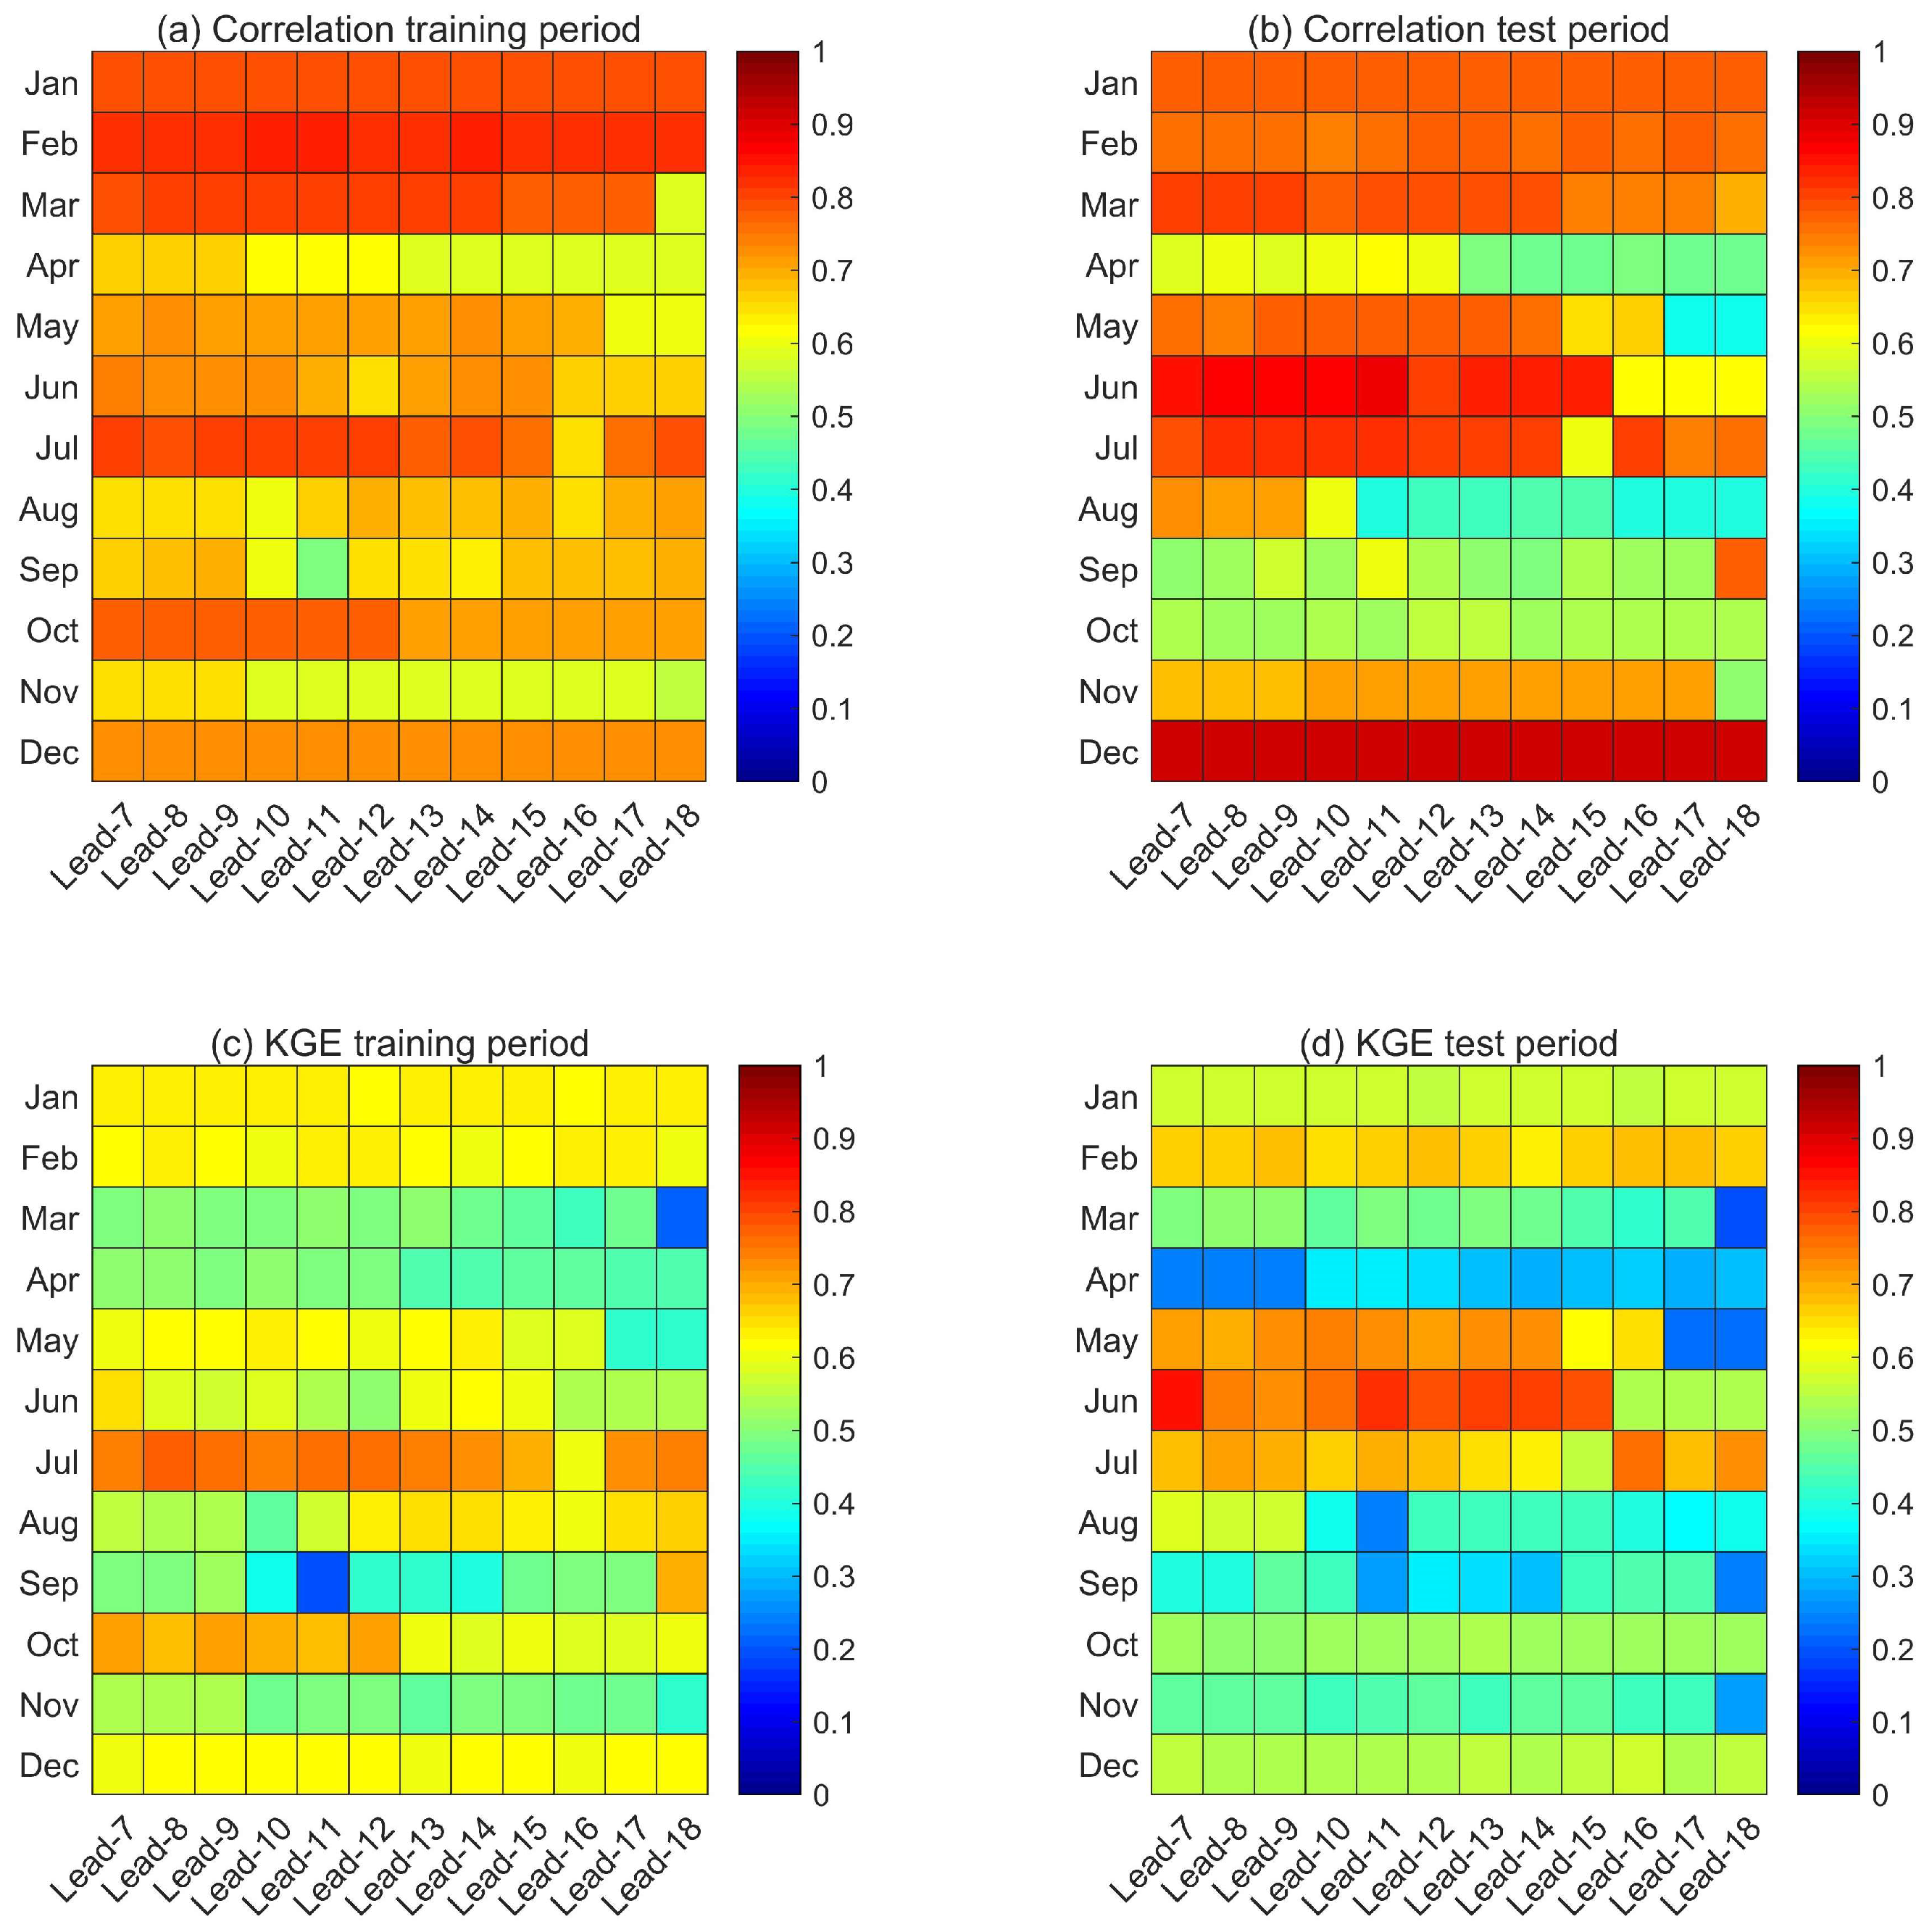
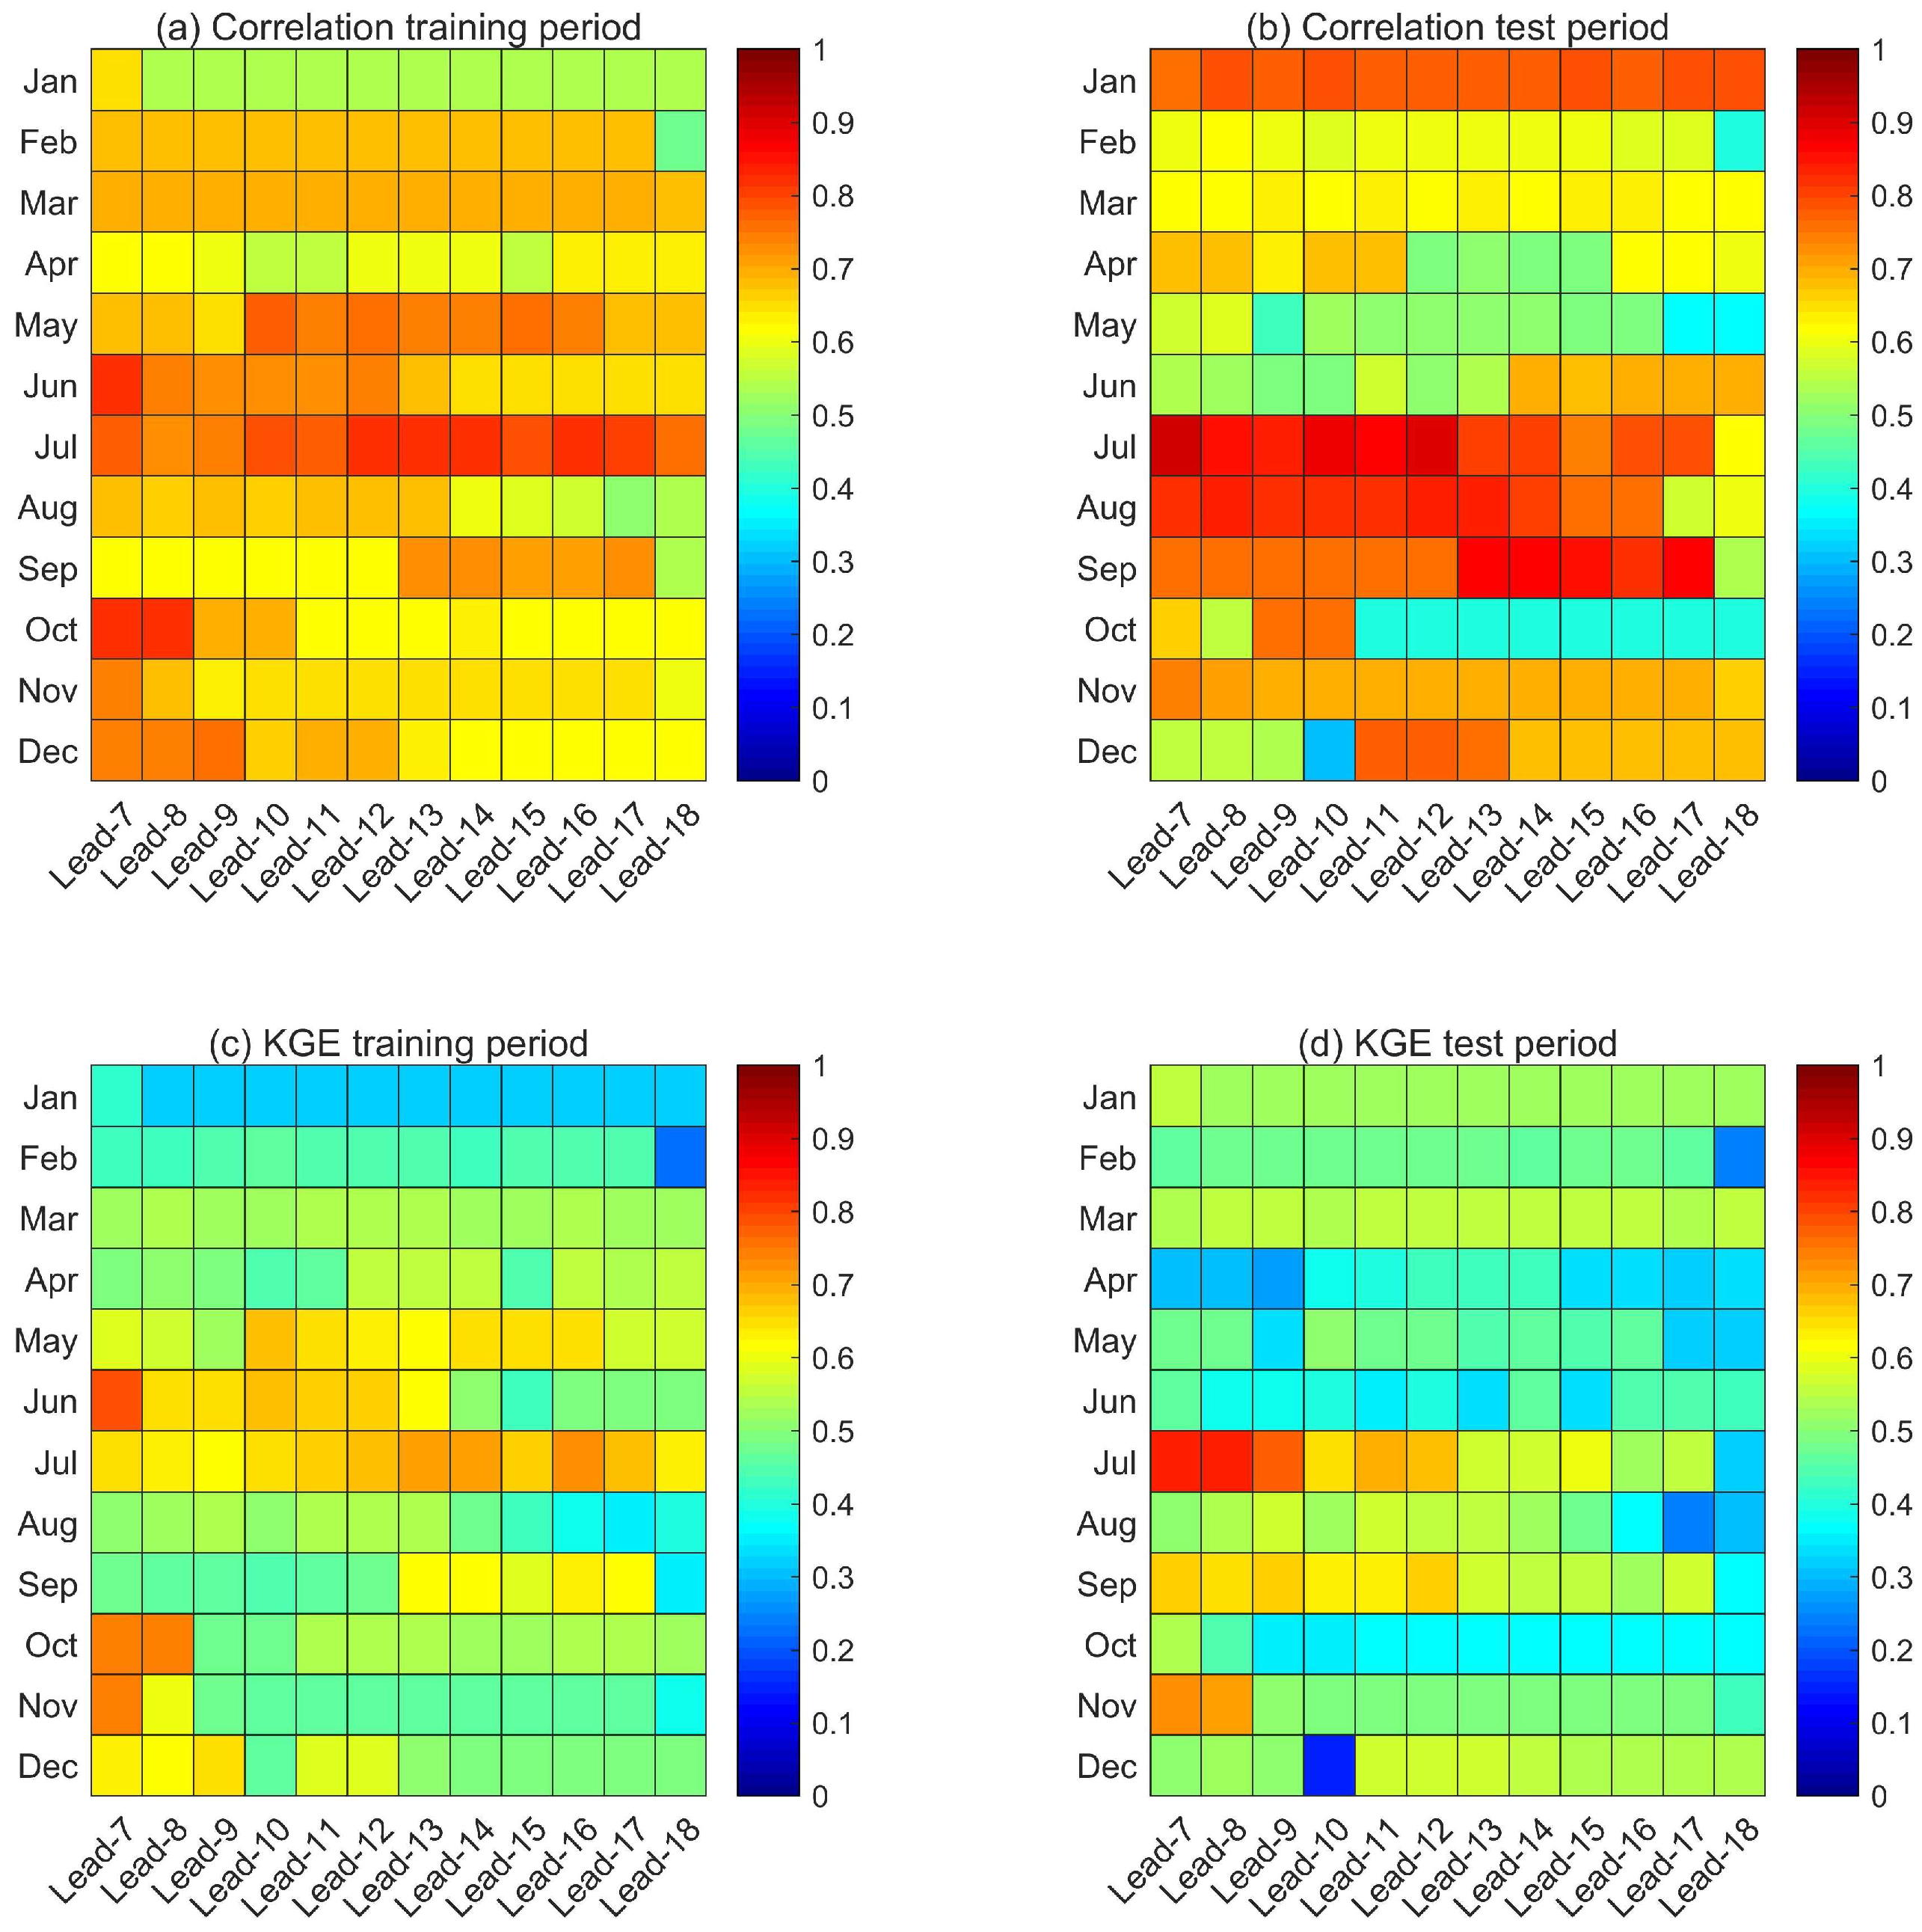
The predictive skills of the GRU-based model, evaluated across various months and lead times for both training and testing periods, are shown in Figure 3. The model demonstrated significant predictive skills, with a mean PCC of 0.71 and a KGE of 0.57 during the training period, which remained high during the testing period at 0.69 and 0.53, respectively (Figure 3). The highest PCC and KGE values during the testing period were 0.92 and 0.85, and most of PCC skills were higher than 0.5 or even 0.6 and most of KGE were more than 0.4. The predictive skills varied across different months, with higher skills (PCC > 0.73 and KGE > 0.5 during the training period and PCC > 0.76 and KGE > 0.45 during the testing period) in January–March, July, and December. The runoff prediction models performed relatively poorly during April and September–October. This may be due to the complexity of the multiple factors affecting the runoff during the transitional seasons, including both climate teleconnection factors and land surface features [34,35,36]. For example, during September–October, the withdrawal of the East Asian monsoon and interactions with mid-latitude westerlies often result in high spatiotemporal variability in rainfall and thus its hydrological response [37,38,39]. In addition, the seasonal snow accumulation, temperature changes, and elevation-dependent melt dynamics in the Jinsha River Basin also have significant impacts on the runoff, particularly in April [36,40,41]. In addition to climate and snow factors, soil water in summer also has a great impact on runoff in dry seasons [35].
It is noteworthy that the predictive skills did not exhibit a significant decline as lead times increased. The well predictions can be consistently maintained for lead times of up to 17 months, particularly during cold seasons. The stability of the machine learning-based runoff forecasting skill across different lead times may be attributed to two key capabilities. First, these models can adaptively screen for key predictors, identifying driving variables that exert significant influence across various scales. Second, they excel at capturing the complex non-linear relationships between runoff and its influencing factors [17,18]. The performance largely depends on the appropriateness of the selected runoff-influencing factors for each lead time.
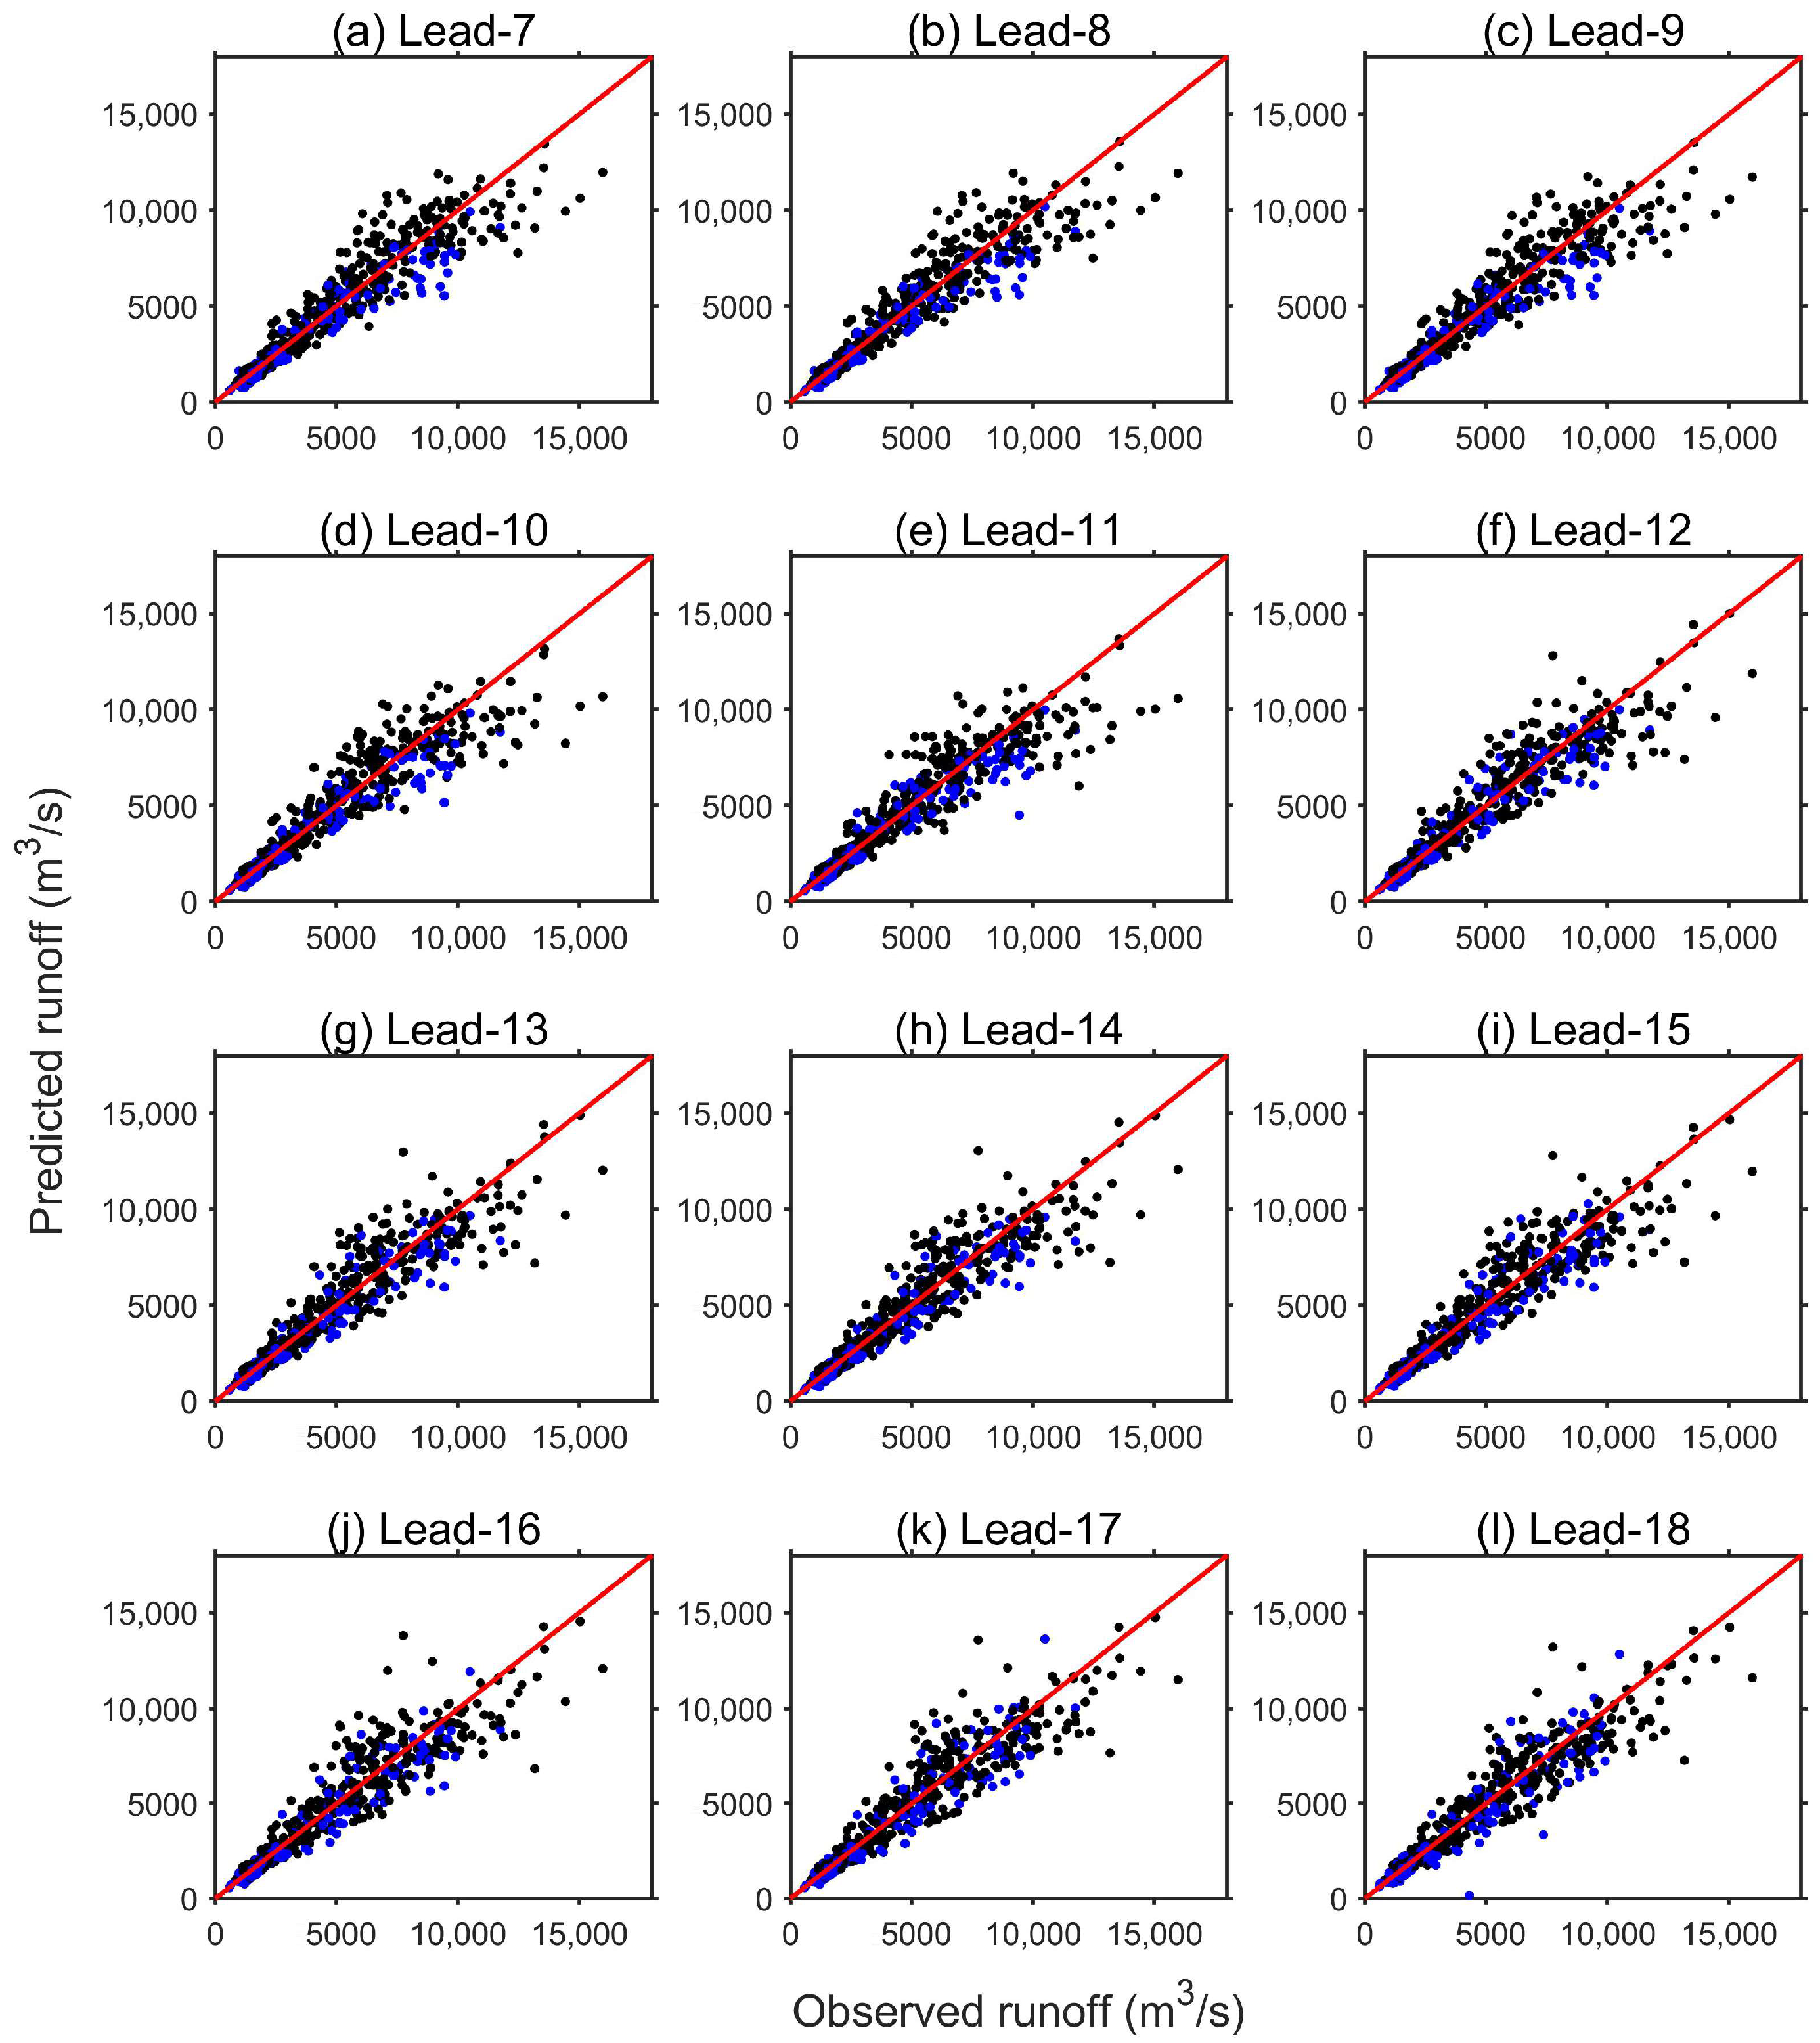
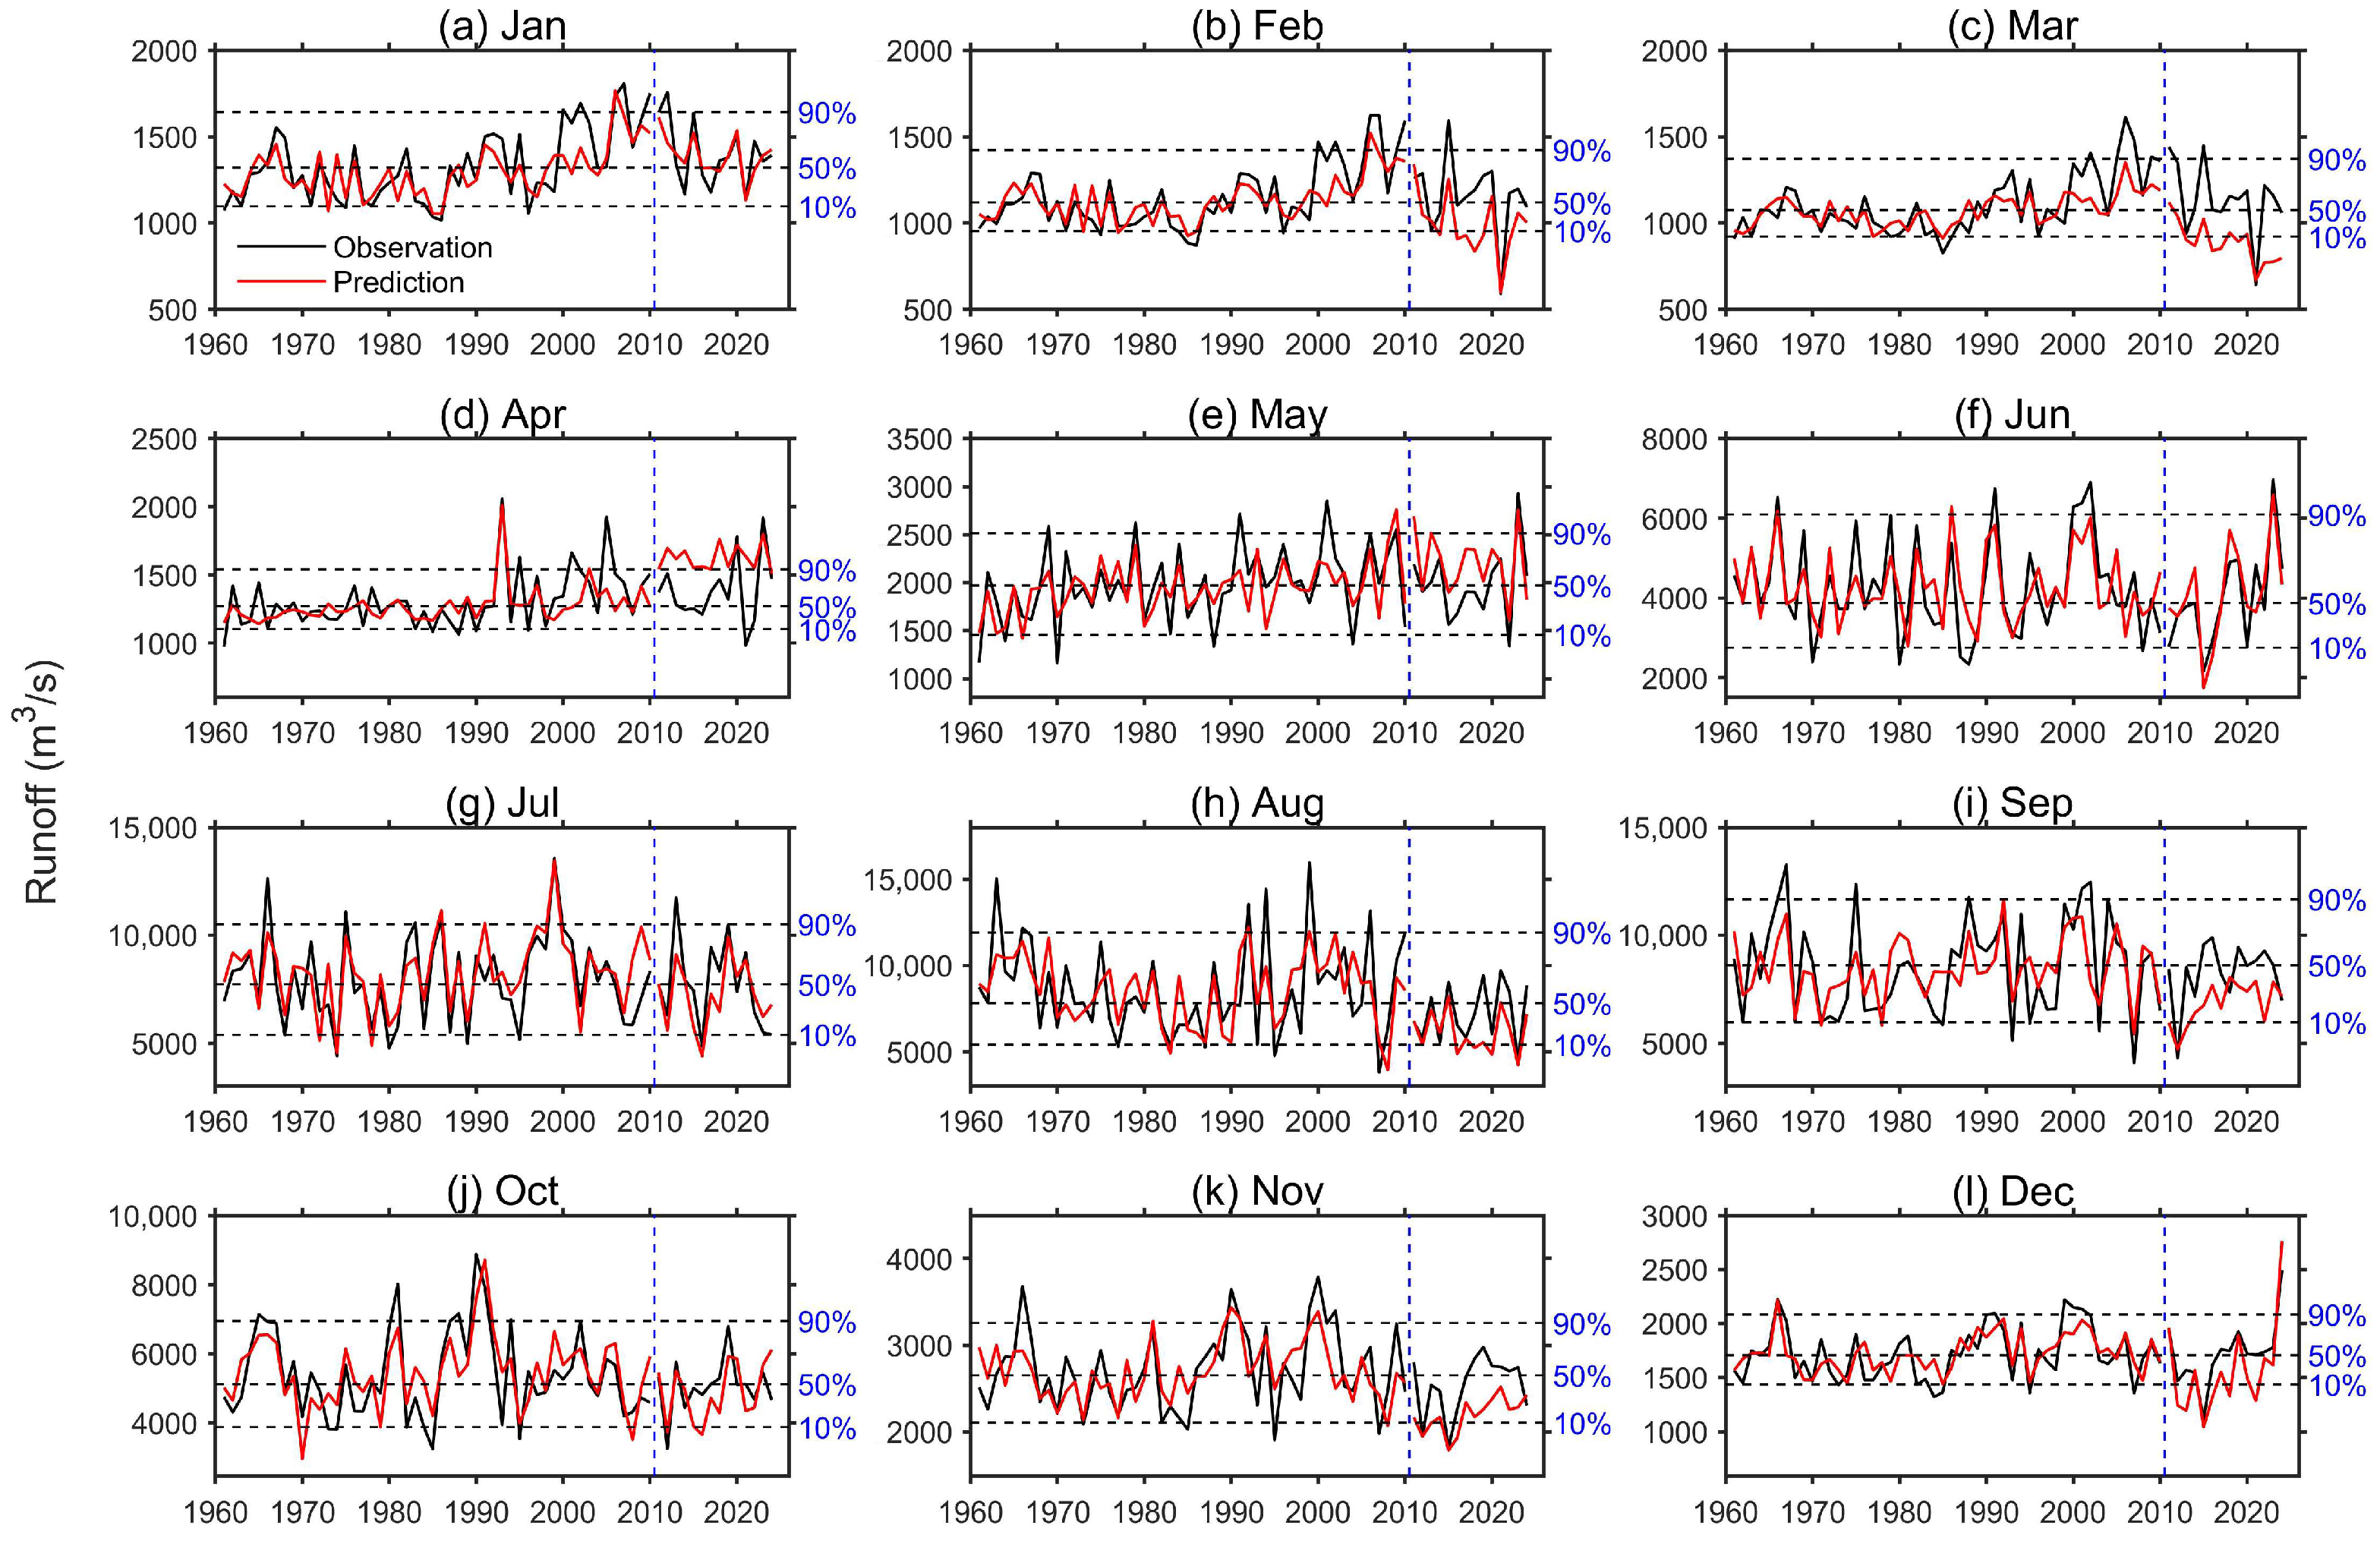
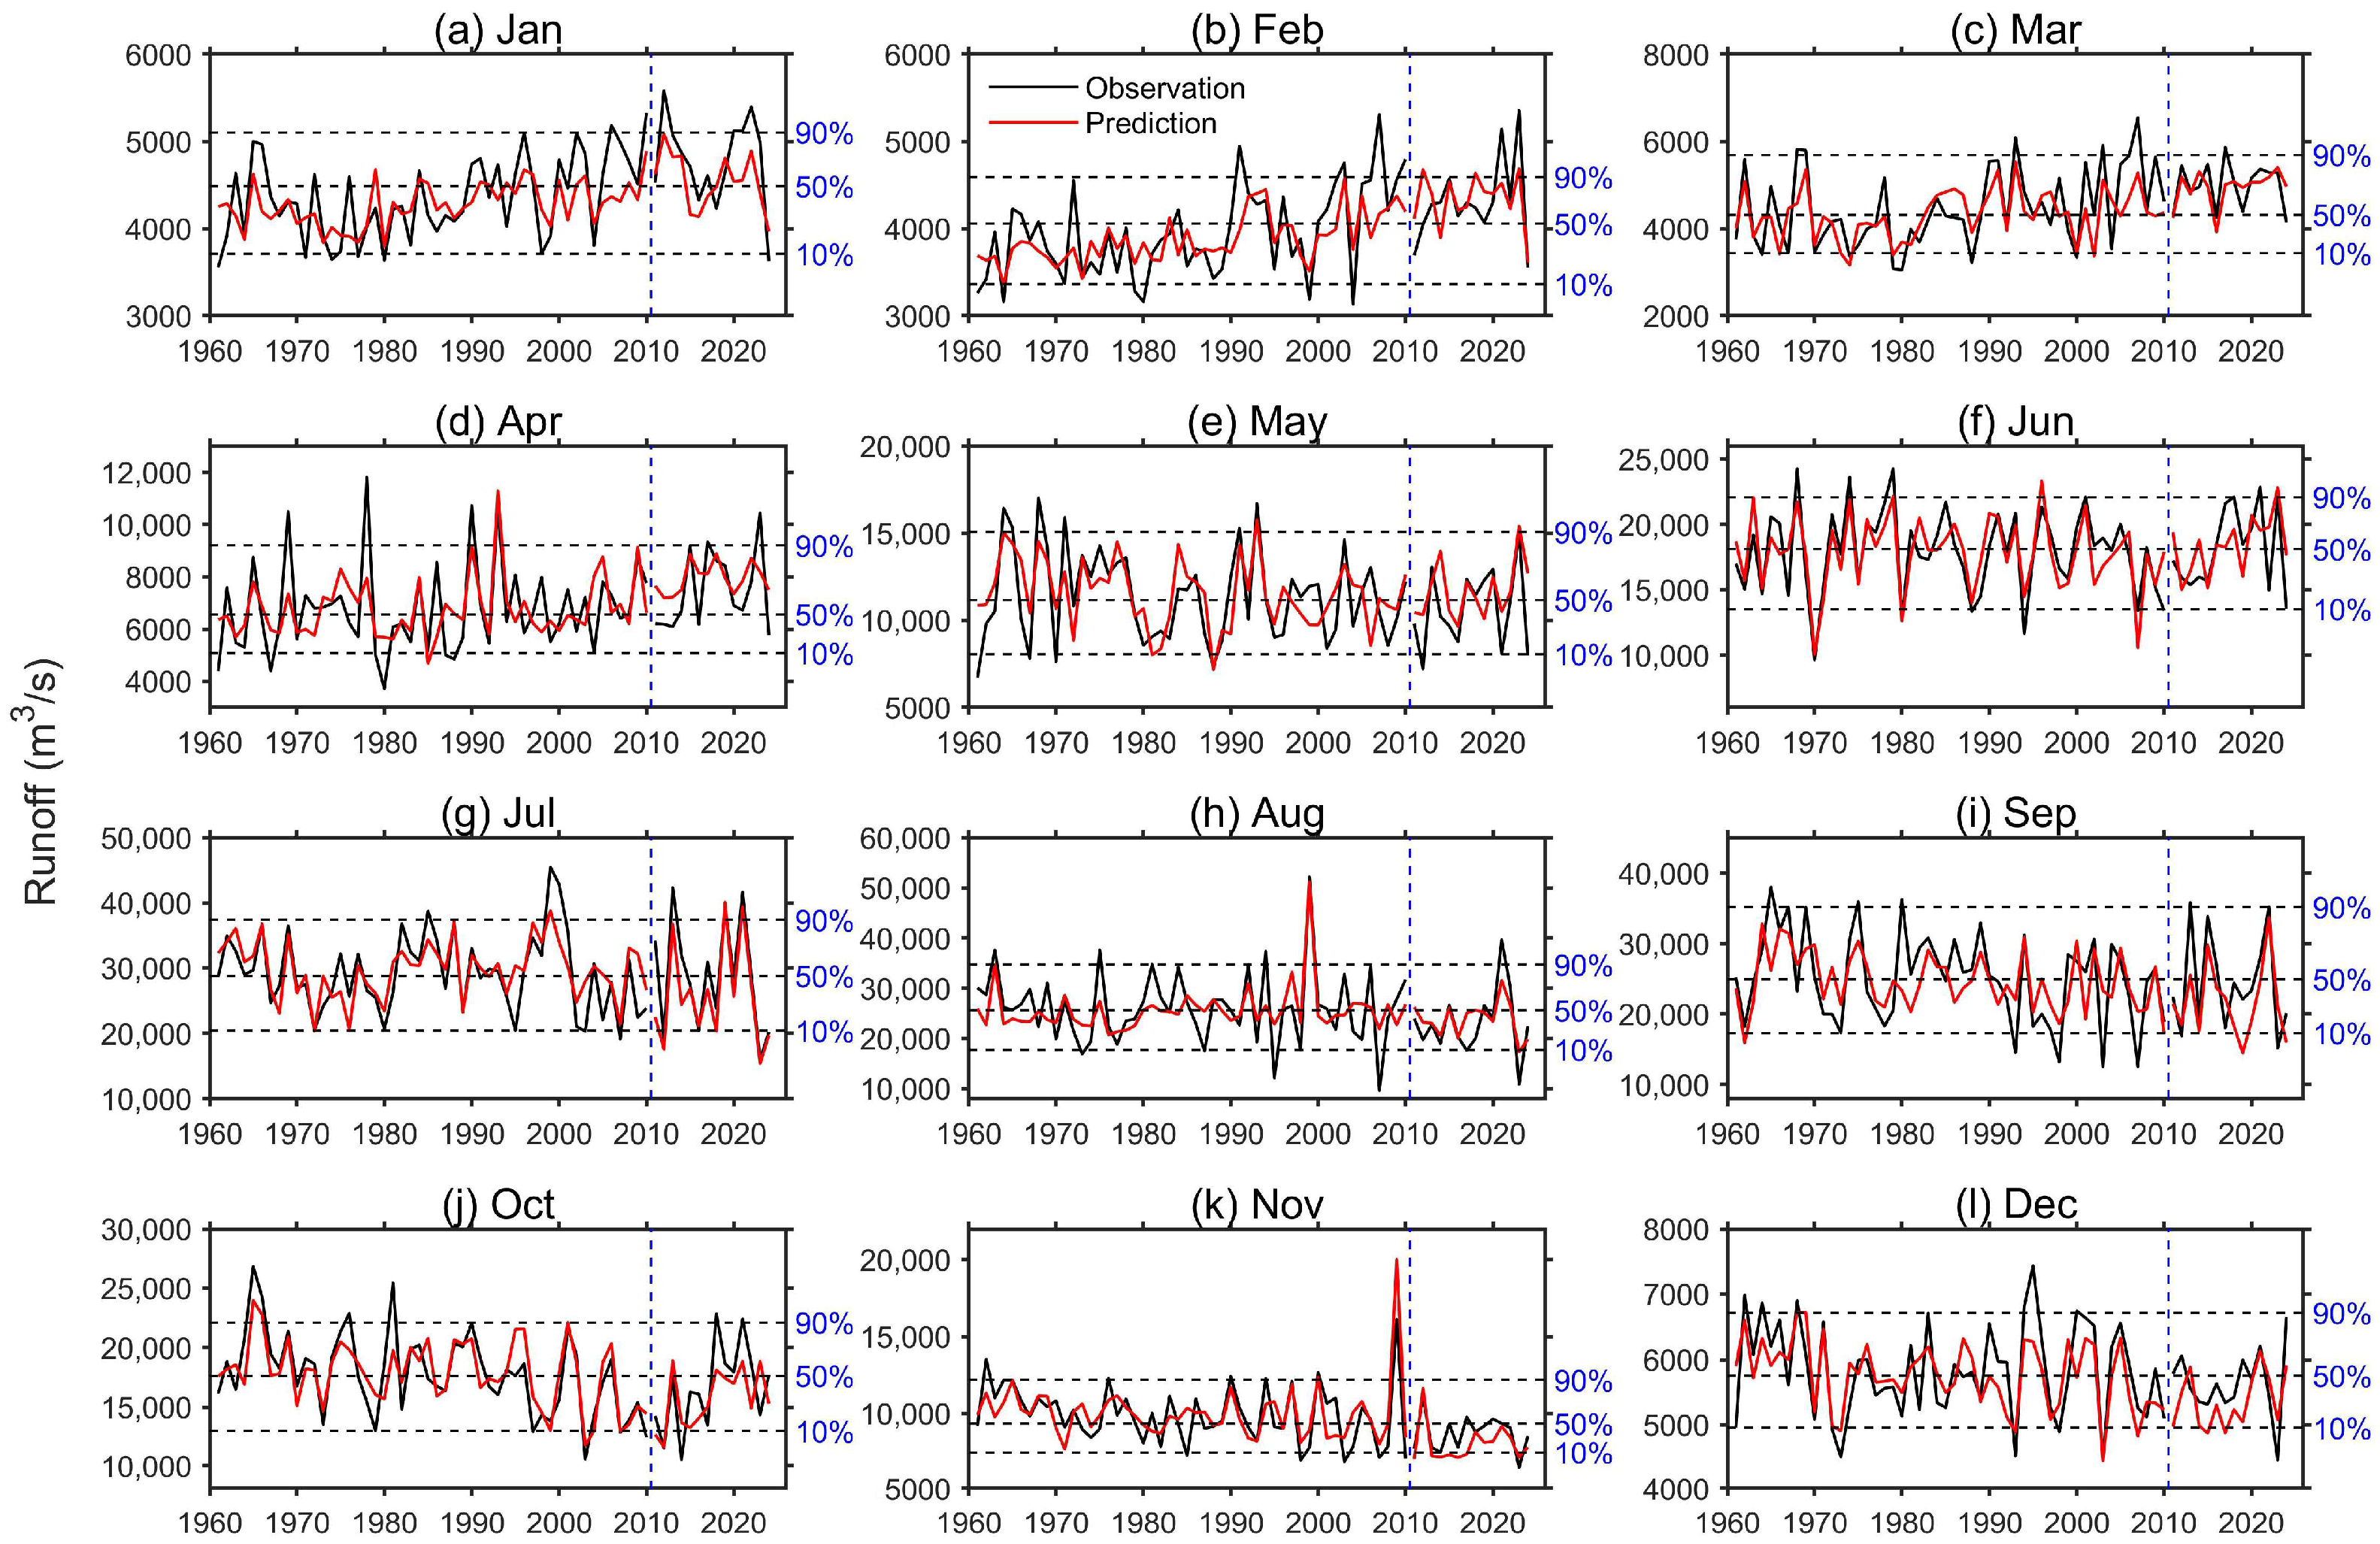
Figure 4 and Figure 5 show the consistency between observed and predicted runoff. As shown in Figure 4 and Figure 5, the runoff prediction models were feasible in capturing the dynamic changes of monthly runoff at the Wudongde reservoir during both training and test periods. Most scatter points clustered closely around the 1:1 diagonal line, demonstrating good agreement between observed and predicted values. The forecasting performance for flows exceeding specific percentile-based thresholds (e.g., the 90th and 10th percentiles, indicating high and low extremes, respectively) is explicitly annotated in Figure 5. The predictions of the model systematically underestimated high flows, with particularly pronounced deviations occurring in February, March, August, September, and November (Figure 4 and Figure 5). This discrepancy may be attributed to the low frequency of high-flow events in the training dataset, which constrained the model’s ability to accurately predict extreme high flows [42,43]. In contrast, most low flows were well captured by the model, such as events in September 2012, February–March 2021, and August 2022. The model well reproduced the timing and magnitude of these low-flow extremes.

4.2. The Key Predictors and Performance of Runoff Prediction Model at the Three Gorges Reservoir

The best predictors set for runoff prediction at the Three Gorges reservoir also varied across different months (Table S3). In January, the 25-month-ahead SCA, 24-month-ahead NHPVCL, 26-month-ahead EATI (East Asian Trough Intensity Index), and 26-month-ahead SIOD were critical for the runoff prediction. In February, the best predictors were 18-month-ahead NHPVA, 26-month-ahead EATI, 22-month-ahead ISHRP, and 22-month-ahead EATP. In March, 26-month-ahead IOWPA (Indian Ocean Warm Pool Area Index), 28-month-ahead APVA, 20-month-ahead NA-NASHRP, 25-month-ahead NHPVCL, and 23-month-ahead ISHRP constituted the best predictors set. In April, the 16-month-ahead NAMSHI (North American Subtropical High Intensity Index), 16-month-ahead NHSHRP, 21-month-ahead NA-NASHRP, and 34-month-ahead AMC were more important. In May, the 33-month-ahead NHSHRP, 13-month-ahead SCSHRP, 29-month-ahead NAPVI (North American Polar Vortex Intensity Index), and 30-month-ahead APVA were important for improving the runoff prediction. In June, the major predictors included 19-month-ahead WPSHRP (Western Pacific Subtropical High Ridge Position Index), 26-month-ahead NINO 1 + 2 SSTA index, 14-month-ahead WPSHWRP (Western Pacific Subtropical High Western Ridge Point Index), 28-month-ahead ISHRP, and 30-month-ahead EAZC (Eurasian Zonal Circulation Index). In July, the 18-month-ahead POL pattern (Polar-Eurasia Pattern), 41-month-ahead SCSHRP, 15-month-ahead 30 hPa zonal wind index, and 15-month-ahead NAFSHRP were important. In August, 30-month-ahead AECEP (Atlantic-European Circulation E Pattern Index), 14-month-ahead 30 hPa zonal wind index, 35-month-ahead EATP, 16-month-ahead SCSHRP, and 17-month-ahead EAMC were the major predictors. In September, the 18-month-ahead NAPVI, 13-month-ahead AAO (Antarctic Oscillation), 24-month-ahead EATP, 23-month-ahead TIOD (Tropic Indian Ocean Dipole Index), and 37-month-ahead WPSHWRP were the main predictors. In October, the major predictors included 30-month-ahead WP pattern (West Pacific Pattern), 20-month-ahead NHPVCI, and 23-month-ahead EAZC. In November, the key predictors contained 22-month-ahead NATSHI (North Atlantic Subtropical High Intensity Index), 24-month-ahead PPVI (Pacific Polar Vortex Intensity Index), 19-month-ahead NHPVCL, and 18-month-ahead AECWP. The 24-month-ahead SCA, 13-month-ahead AECWP, 34-month-ahead NINO W SSTA index, and 24-month-ahead EP200mb-ZW (Mid-Eastern Pacific 200 mb Zonal Wind Index) were important for improving runoff prediction in December.
Overall, for the runoff prediction at the Three Gorges reservoir, similar climate indices as the Wudongde reservoir were identified, such as NHPVCL, ISHRP, AMC, EAMC, and SCSHRP, but with different lead months. In addition, factors related to WPSH, ENSO, EATI, and TIOD were also key for the runoff prediction at the Three Gorges reservoir. It has been confirmed that these identified factors exhibited significant impacts on climate and runoff variabilities in the UYRB [25,26,35,44,45]. They found that tropical and extratropical circulations were both crucial for the climate and hydrological anomalies in the Yangtze river basin (YRB) [46]. For example, the position and intensity of the polar vortex could affect mid- and high-latitude weather and climate not only by its individual influence (e.g., cooling effect) but also in collaboration with other circulation systems, including blocking high and winter monsoon in East Asia [47,48,49]. The WPSH demonstrated significant zonal and meridional shifts across seasonal to interannual to decadal timescales, which are closely linked to corresponding variations in East Asian summer rainfall [50,51]. Huang et al. [52] also showed a negative relationship between annual extreme streamflow in the source and upper reaches of YRB with ENSO, which was a major source of predictability for the summer runoff in the YRB [53].
Figure 6 shows the predictive skills, evaluated across various months and lead times for both training and testing periods, at the Three Gorges reservoir. The mean PCC and KGE values were 0.67 and 0.52 during the training period, and the values were 0.66 and 0.49 during the test period, respectively. The mean predictive skills were slightly lower than those at the Wudonde reservoir. The highest PCC and KGE during the test period were 0.91 and 0.84. The predictive skills also varied across different months, with higher skills in July–September and winter seasons but lower skills in April and October. The lower skills in the spring and autumn transition periods were consistent with the results at the Wudongde reservoir and can be attributed to the climate uncertainties and snowmelt runoff [34,35,36]. We also noted that the PCC skills of the runoff prediction models did not decrease as lead times increased, while the KGE skills showed an acceptable reduction during summer seasons due to increased model bias. This indicates the complexity of the factors affecting long-term runoff during summer [54].
Figure 7 and Figure 8 further shows the consistency between observed and predicted runoff at the Three Gorges reservoir. The runoff prediction models well predicted the interannual variabilities and magnitudes of observed runoff, and the scatter points clustered closely around the 1:1 diagonal line (Figure 7), indicating high predictive skills of these models. Many extreme conditions, such as high flows in summer 2020 [55] and May–June 2022, and low flows in July 2012 and July–August 2022, were also skillfully predicted (Figure 8). Despite the high predictive skills, these prediction models still had some shortcomings in predicting some high and low flows, particularly in dry seasons. This can also be related to the complexity of multiple factors (e.g., climate teleconnection patterns and snow factors) affecting the runoff [34,35,36]. In addition to climate and snow factors, soil water in summer also had a great impact on runoff during dry seasons [35]. Future studies should therefore incorporate a more comprehensive set of predictors, including snow cover variability and land use characteristics. In addition, our models assumed that the predictors and their weights were static, overlooking the dynamic nature of runoff drivers, which exhibit significant temporal variations across different time periods under climate change [42]. Therefore, a more in-depth investigation is needed to understand how these factors affect runoff in the UYRB, and an attention mechanism that could assess the relative importance of factors in the object time series should be applied in future work to further improve the runoff forecasting skills [42].
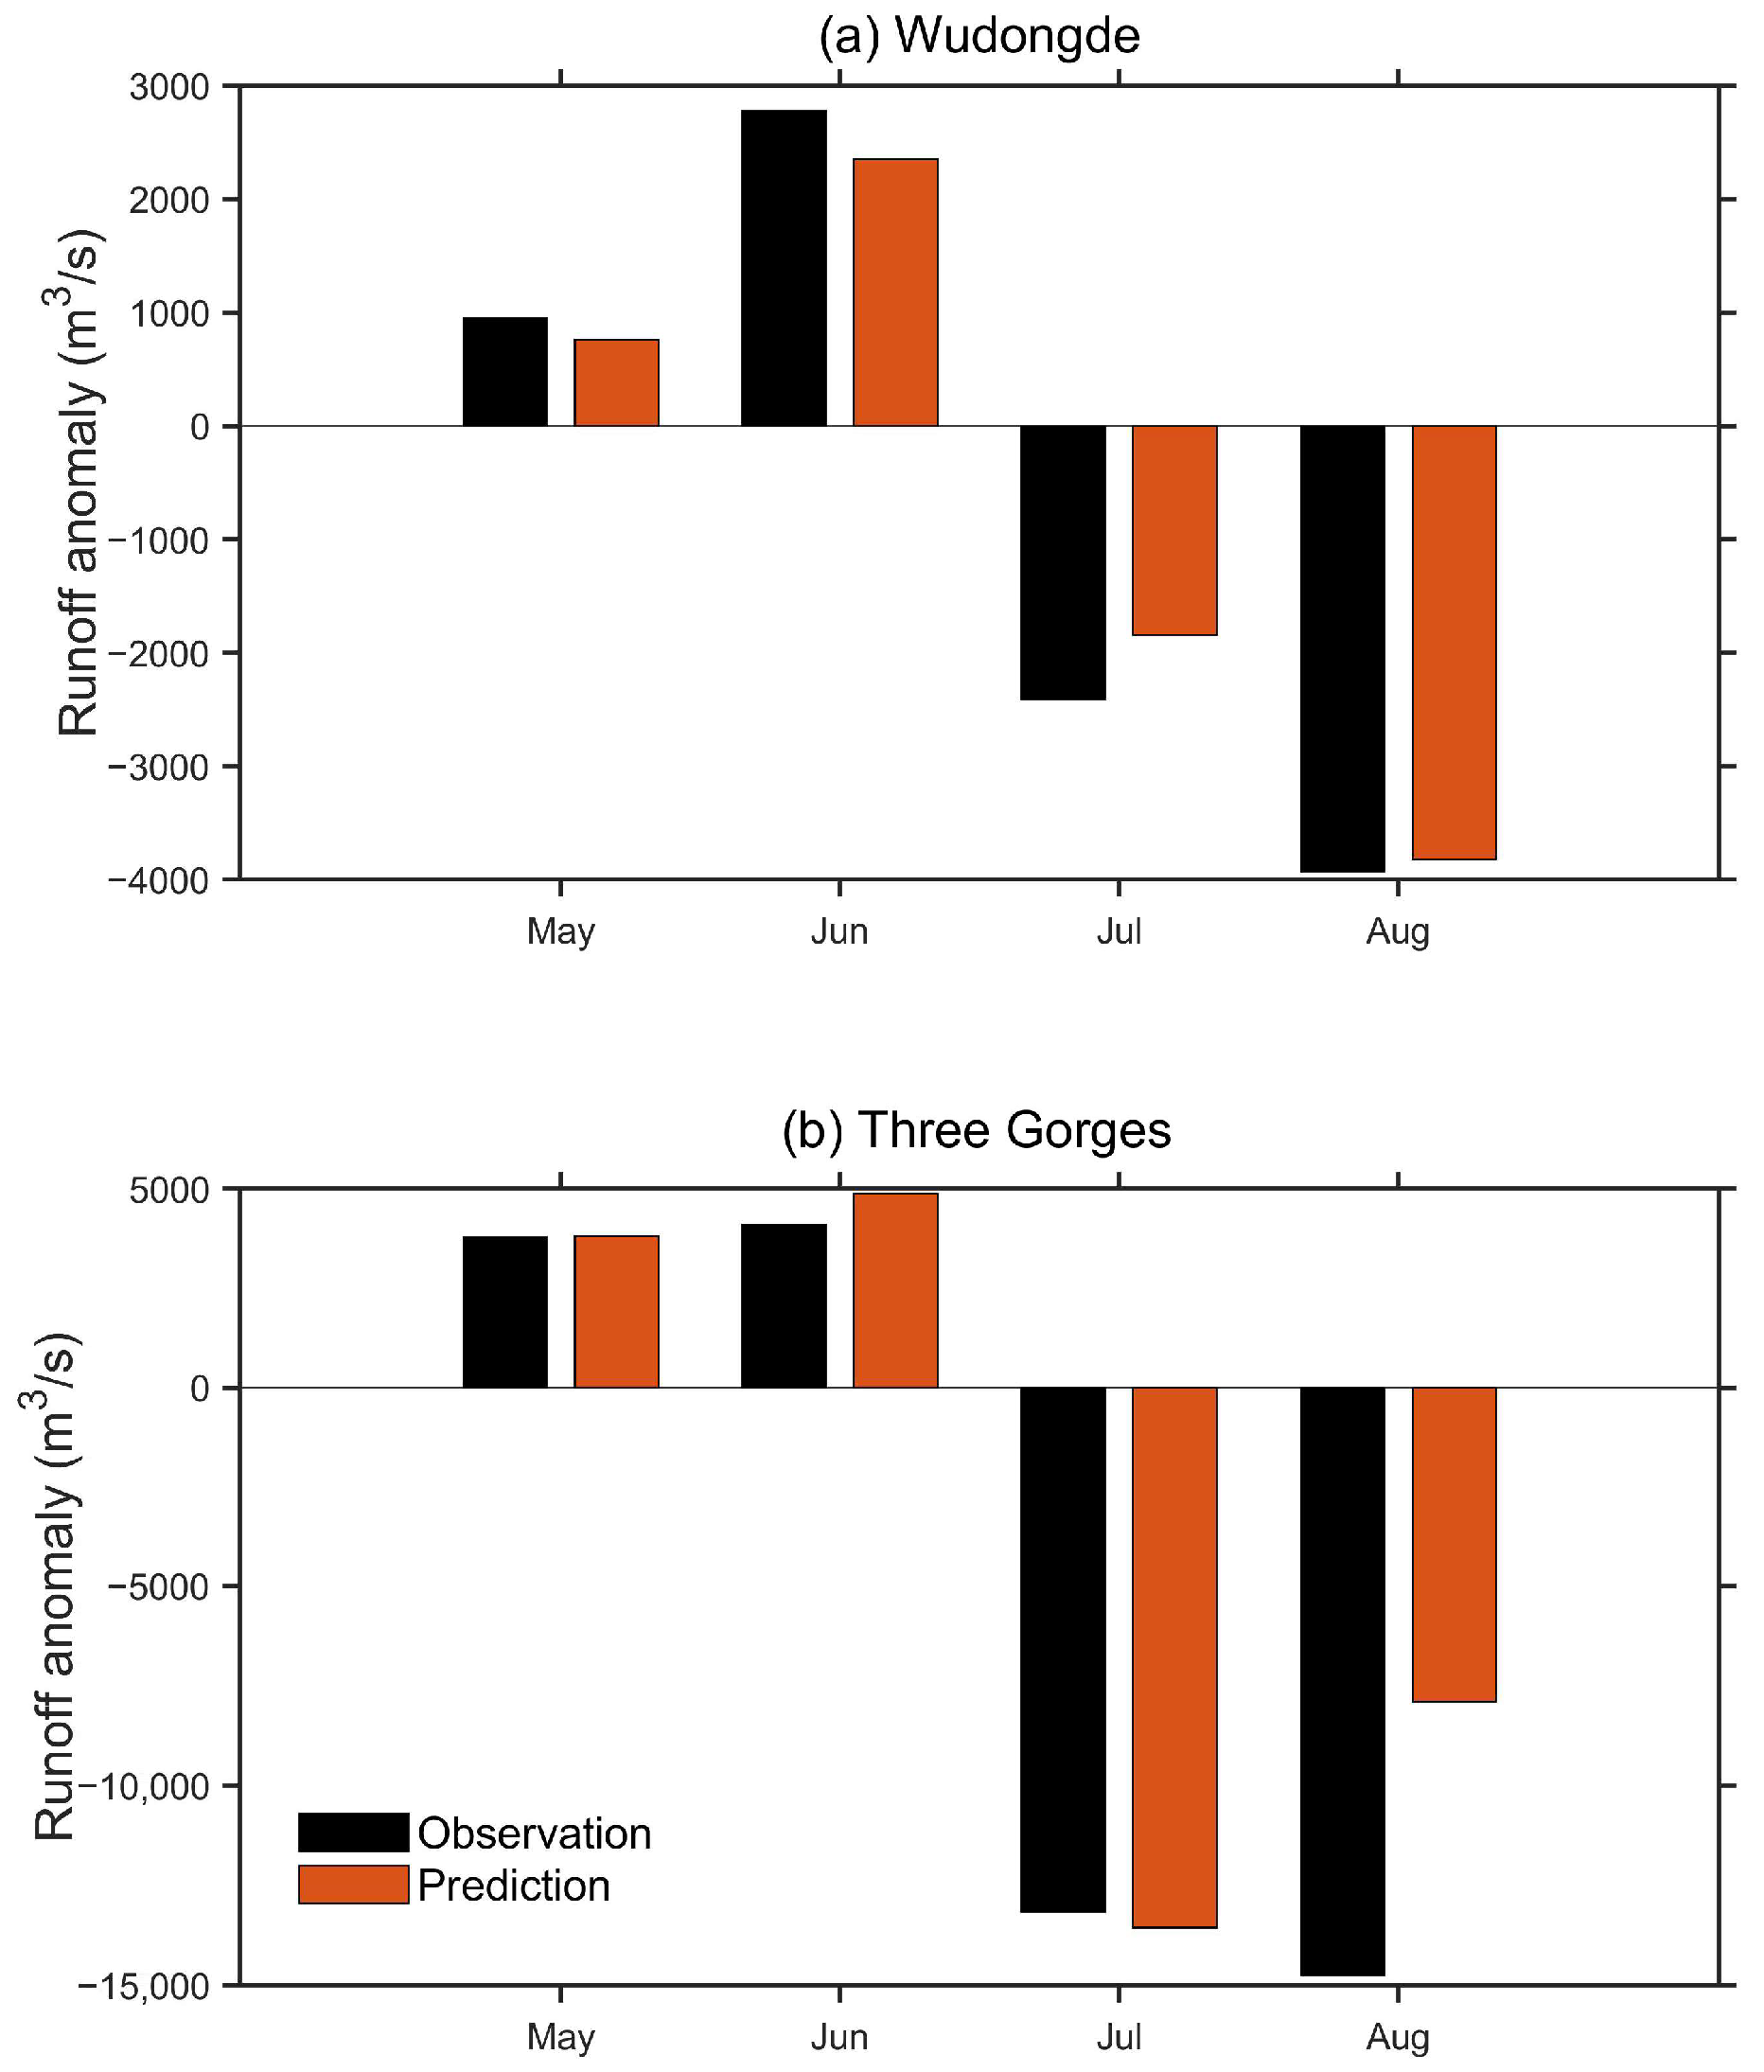
The UYRB experienced a wet–dry abrupt alternation in summer 2022, characterized by wet conditions in June followed by extreme dryness in July and August. The performance of the model in predicting the event is further displayed in Figure 9. This phenomena were successfully captured by the GRU-based model, which reproduced not only the alternation pattern (from June to July) but also its magnitude at both Wudongde and Three Gorges reservoirs.

5. Conclusions

This study developed an effective framework for key predictor selection and long-term runoff prediction utilizing a machine learning model, with application to two major reservoirs (Wudongde and Three Gorges) in the UYRB. Key predictors were identified from 88 atmospheric circulation indices and 26 SST indices through correlation analysis and GRU-based stepwise regression. Significant predictors mainly included Northern Hemisphere Polar Vortex, Eurasian Meridional and Zonal Circulation, Atlantic-European Circulation, Indian Subtropical High, Western Pacific Subtropical High (WPSH), ENSO, IOD, East Asian Trough (EAT), with varying predictor combinations across different months.
Using these selected predictors as input features to a GRU model, the proposed runoff prediction framework demonstrated considerable predictive skill, with a mean PCC of 0.71 and a KGE of 0.57 during the training period, and values of 0.69 and 0.53 respectively during the test period at the Wudongde reservoir. The skills were slightly higher than those at the Three Gorges reservoir, with PCC and KGE values of 0.67 and 0.52 during the training period and corresponding values of 0.66 and 0.49 during the testing period, respectively.
The GRU-based forecasting model also skillfully predicted the temporal variability of runoff and several high-flow and low-flow extremes at both reservoirs, such as a wet-dry abrupt alternation in summer 2022. Models’ predictive skills remained stable across different lead times but exhibited notable seasonal variations, with higher skills in summer and winter and lower skills in April and October. Future work is encouraged to incorporate additional influence factors (e.g., land surface features) and integrate physical mechanism constraints to further enhance the predictive capacity and mechanistic interpretability.

Supplementary Materials

The following supporting information can be downloaded at: https://www.mdpi.com/article/10.3390/w17202942/s1, Table S1. The main climate indices used in this study. Table S2. The key predictors* for runoff prediction at Wudongde reservoir. Table S3. The key predictors* for runoff prediction at the Three Gorges reservoir.

Author Contributions

Conceptualization, F.M.; methodology, F.M.; validation, F.M., X.S. and Z.H.; formal analysis, F.M.; investigation, F.M.; data curation, F.M., X.S. and Z.H.; writing—original draft preparation, F.M.; writing—review and editing, X.S. and Z.H.; visualization, F.M. All authors have read and agreed to the published version of the manuscript.

Funding

This work was supported by China Yangtze Power Co., Ltd. [Project No. 2423020009, Contract No. Z242302020], and Qing Lan Project.

Data Availability Statement

The raw data supporting the conclusions of this article will be made available by the authors on request.

Conflicts of Interest

Authors Xiaoshan Sun and Zihang Han were employed by the China Yangtze Power Co., Ltd. The remaining authors declare that the research was conducted in the absence of any commercial or financial relationships that could be construed as a potential conflict of interest. The authors declare that this study received funding from China Yangtze Power Co., Ltd. The funder was not involved in the study design, collection, analysis, interpretation of data, the writing of this article, or the decision to submit it for publication.

References

  1. Wang, K.; Liu, X.; Cui, P.; Zhang, Y.; Xie, J.; Liu, C.; Gosling, S.N. China’s nationwide streamflow decline driven by landscape changes and human interventions. Sci. Adv. 2025, 11, eadu8032. [Google Scholar] [CrossRef]
  2. Gautam, S.; Costello, C.; Baffaut, C.; Thompson, A.; Svoma, B.; Phung, Q.; Sadler, E. Assessing Long-Term hydrological impact of climate change using an ensemble approach and comparison with global gridded Model-A case study on goodWater creek experimental Watershed. Water 2018, 10, 564. [Google Scholar] [CrossRef]
  3. Liang, X.; Lettenmaier, D.P.; Wood, E.F.; Burges, S.J. A simple hydrologically based model of land surface water and energy fluxes for general circulation models. J. Geophys. Res. 1994, 99, 14415–14428. [Google Scholar] [CrossRef]
  4. Fang, Y.; Zhang, X.; Corbari, C.; Mancini, M.; Niu, G.; Zeng, W. Improving the Xin’anjiang hydrological model based on mass–energy balance. Hydrol. Earth Syst. Sci. 2017, 21, 3359–3375. [Google Scholar] [CrossRef]
  5. Yuan, X. An experimental seasonal hydrological forecasting system over the Yellow River basin-Part 2: The added value from climate forecast models. Hydrol. Earth Syst. Sci. 2016, 20, 2453–2466. [Google Scholar] [CrossRef]
  6. Liu, L.; Xiao, C.; Du, L.; Zhang, P.; Wang, G. Extended-Range Runoff Forecasting Using a One-Way Coupled Climate-Hydrological Model: Case Studies of the Yiluo and Beijiang Rivers in China. Water 2019, 11, 1150. [Google Scholar] [CrossRef]
  7. Fatichi, S.; Vivoni, E.R.; Ogden, F.L.; Ivanov, V.Y.; Mirus, B.; Gochis, D.; Downer, C.W.; Camporese, M.; Davison, J.H.; Ebel, B.; et al. An overview of current applications, challenges, and future trends in distributed process-based models in hydrology. J. Hydrol. 2016, 537, 45–60. [Google Scholar] [CrossRef]
  8. Gao, Y.; Yuan, Y.; Wang, H.; Schmidt, A.R.; Wang, K.; Ye, L. Examining the effects of urban agglomeration polders on flood events in Qinhuai River basin, China with HEC-HMS model. Water Sci. Technol. 2017, 75, 2130–2138. [Google Scholar] [CrossRef]
  9. Chen, Y.; Gao, J.; Bin, Z.; Qian, J.; Pei, R.; Zhu, H. Application study of IFAS and LSTM models on runoff simulation and flood prediction in the Tokachi River basin. J. Hydroinform. 2021, 23, 1098–1111. [Google Scholar] [CrossRef]
  10. Rujner, H.; Leonhardt, G.; Marsalek, J.; Viklander, M. High-resolution modelling of the grass swale response to runoff inflows with Mike SHE. J. Hydrol. 2018, 562, 411–422. [Google Scholar] [CrossRef]
  11. Mo, R.; Xu, B.; Zhong, P.; Zhu, F.; Huang, X.; Liu, W.; Xu, S.; Wang, G.; Zhang, J. Dynamic long-term streamflow probabilistic forecasting model for a multisite system considering real-time forecast updating through spatio-temporal dependent error correction. J. Hydrol. 2021, 601, 126666. [Google Scholar] [CrossRef]
  12. Mo, R.; Xu, B.; Zhong, P.; Dong, Y.; Wang, H.; Yue, H.; Zhu, J.; Wang, H.; Wang, G.; Zhang, J. Long-term probabilistic streamflow forecast model with “inputs–structure–parameters” hierarchical optimization framework. J. Hydrol. 2023, 622, 129736. [Google Scholar] [CrossRef]
  13. Wang, W.C.; Chau, K.W.; Xu, D.M.; Chen, X.Y. Improving forecasting accuracy of annual runoff time series using ARIMA based on EEMD decomposition. Water Resour. Manag. 2015, 29, 2655–2675. [Google Scholar] [CrossRef]
  14. Merz, R.; Tarasova, L.; Basso, S. The flood cooking book: Ingredients and regional flavors of floods across Germany. Environ. Res. Lett. 2020, 15, 114024. [Google Scholar] [CrossRef]
  15. Bian, L.K.; Qin, X.; Zhang, C.L.; Guo, P.; Wu, H. Application, interpretability and prediction of machine learning method combined with LSTM and LightGBM-a case study for runoff simulation in an arid area. J. Hydrol. 2023, 625, 130091. [Google Scholar] [CrossRef]
  16. Dong, J.H.; Wang, Z.C.; Wu, J.H.; Cui, X.F.; Pei, R.L. A Novel Runoff Prediction Model Based on Support Vector Machine and Gate Recurrent unit with Secondary Mode Decomposition. Water Resour. Manag. 2024, 38, 1655–1674. [Google Scholar] [CrossRef]
  17. Mosavi, A.; Ozturk, P.; Chau, K.W. Flood prediction using machine learning models: Literature review. Water 2018, 10, 1536. [Google Scholar] [CrossRef]
  18. Yaseen, Z.M.; El-Shafie, A.; Jaafar, O.; Afan, H.A.; Sayl, K.N. Artificial intelligence based models for stream-flow forecasting: 2000–2015. J. Hydrol. 2015, 530, 829–844. [Google Scholar] [CrossRef]
  19. Hu, F.; Yang, Q.; Yang, J.; Luo, Z.; Shao, J.; Wang, G. Incorporating multiple grid-based data in CNN-LSTM hybrid model for daily runoff prediction in the source region of the Yellow River Basin. J. Hydrol. Reg. Stud. 2024, 51, 101652. [Google Scholar] [CrossRef]
  20. Islam, K.I.; Elias, E.; Carroll, K.C.; Brown, C. Exploring random forest machine learning and remote sensing data for streamflow prediction: An alternative approach to a process-based hydrologic modeling in a snowmelt-driven watershed. Remote Sens. 2023, 15, 3999. [Google Scholar] [CrossRef]
  21. Chen, Y.; Zhai, P. Synoptic-scale precursors of the East Asia/Pacific teleconnection pattern responsible for persistent extreme precipitation in the Yangtze River Valley. Quart. J. Roy. Meteor. Soc. 2015, 141, 1389–1403. [Google Scholar] [CrossRef]
  22. Gao, C.; Niu, Y.; Li, G.; Sun, S.; Lu, B.; Li, C.; Xu, B.; Huang, J.; Sun, X. The Enhancing effect of the East Asian Subtropical Westerly Jet on Summer Extreme High-Temperature events over Central-Eastern China since the late 1990s. Adv. Atmos. Sci. 2025, 42, 453–466. [Google Scholar] [CrossRef]
  23. Zhu, J.; Yu, Y.Y.; Guan, Z.Y.; Wang, X. Dominant Coupling Mode of SST in Maritime Continental Region and East Asian Summer Monsoon Circulation. J. Geophys. Res. Atmos. 2022, 127, e2022JD036739. [Google Scholar] [CrossRef]
  24. Wang, B.; Wu, R.G.; Fu, X.H. Pacific–East Asian teleconnection: How does ENSO affect East Asian climate? J. Clim. 2000, 13, 1517–1536. [Google Scholar] [CrossRef]
  25. Dong, Q.; Zhang, X. Medium and Long-term Runoff Prediction of Three Gorges Reservoir Based on Teleconnection. J. North China Univ. Water Resour. Electr. Power (Nat. Sci. Ed.) 2016, 37, 38–42. [Google Scholar]
  26. Chang, J.; Yan, B.; Sun, M.; Gu, D.; Zhou, X. Integrated forecasting of monthly runoff considering the combined effects of teleconnection factors. J. Hydrol. Reg. Stu. 2025, 58, 102206. [Google Scholar] [CrossRef]
  27. Yue, Z.; Ai, P.; Xiong, C.; Hong, M.; Song, Y. Mid-to long-term runoff prediction by combining the deep belief network and partial least-squares regression. J. Hydroinform. 2020, 22, 1283–1305. [Google Scholar] [CrossRef]
  28. Ji, Y.; Dong, H.; Xing, Z.; Sun, M.; Fu, Q.; Liu, D. Application of the decomposition-prediction-reconstruction framework to medium- and long-term runoff forecasting. Water Supply 2021, 21, 696–709. [Google Scholar] [CrossRef]
  29. Yan, L.; Lei, Q.; Jiang, C.; Yan, P.; Ren, Z.; Liu, B.; Liu, Z. Climate-informed monthly runoff prediction model using machine learning and feature importance analysis. Front. Environ. Sci. 2022, 10, 1049840. [Google Scholar] [CrossRef]
  30. Han, D.; Liu, P.; Xie, K.; Li, H.; Xia, Q.; Cheng, Q.; Wang, Y.; Yang, Z.; Zhang, Y.; Xia, J. An attention-based LSTM model for long-term runoff forecasting and factor recognition. Environ. Res. Lett. 2023, 18, 024004. [Google Scholar] [CrossRef]
  31. Zhu, F.; Hou, T.; Zhu, O.; Sun, Y.; Liu, W.; Zhao, L.; Guo, X.; Li, M.; Zhong, P. Multi-step ahead probabilistic runoff forecasting with SHAP interpretability: A GPR-enhanced deep learning ensemble approach integrating teleconnection factors. Environ. Model. Softw. 2025, 193, 106647. [Google Scholar]
  32. Waqas, M.; Humphries, U.W. A critical review of RNN and LSTM variants in hydrological time series predictions. MethodsX 2024, 12, 102946. [Google Scholar] [CrossRef]
  33. Wu, J.; Chen, X.; Zhang, H.; Xiong, L.; Lei, H.; Deng, S. Hyperparameter Optimization for Machine Learning Models Based on Bayesian Optimization. J. Electron. Sci. Technol. 2019, 17, 26–40. [Google Scholar] [CrossRef]
  34. Zhao, P.; Yang, S.; Yu, R. Long-Term Changes in Rainfall over Eastern China and Large-Scale Atmospheric Circulation Associated with Recent Global Warming. J. Clim. 2010, 23, 1544–1562. [Google Scholar] [CrossRef]
  35. Li, Z.; Liu, M.; Li, Z.; Feng, Q.; Song, L.; Xu, B.; Liu, X.; Gui, J. Where does the runoff come from in dry season in the source region of the Yangtze River? Agric. For. Meteorol. 2023, 330, 109314. [Google Scholar] [CrossRef]
  36. Yi, Y.; Liu, S.; Zhang, X.; Yang, Y.; Zhu, Y.; Cui, F.; Wu, K.; Xie, F. Spring floods and their major influential factors in the upper reaches of Jinsha River basin during 2001–2020. J. Hydrol. Reg. Stu. 2023, 45, 101318. [Google Scholar] [CrossRef]
  37. Xiao, S.; Peng, X.; Tian, Q.; Ding, A.; Xie, J.; Su, J. Interaction between the East Asian summer monsoon and westerlies as shown by tree-ring records. Clim. Past 2024, 20, 1687–1701. [Google Scholar] [CrossRef]
  38. Zhang, Q.; Peng, J.; Xu, C.; Singh, V.P. Spatiotemporal variations of precipitation regimes across Yangtze River Basin, China. Theor. Appl. Climatol. 2014, 115, 703–712. [Google Scholar] [CrossRef]
  39. Singh, S.; Jain, V.; Goyal, M.K. Evaluating climate shifts and drought regions in the central Indian river basins. Sci. Rep. 2025, 15, 29701. [Google Scholar] [CrossRef] [PubMed]
  40. Cao, L.J.; Zhang, Y.; Shi, Y. Climate change effect on hydrological processes over the Yangtze River Basin. Quatern. Int. 2011, 244, 202–210. [Google Scholar] [CrossRef]
  41. Huang, Y.; Xiao, W.; Hou, B.; Zhou, Y.; Hou, G.; Yi, L.; Cui, H. Hydrological projections in the upper reaches of the Yangtze River Basin from 2020 to 2050. Sci. Rep. 2021, 11, 9720. [Google Scholar] [CrossRef] [PubMed]
  42. Han, H.; Morrison, R.R. Improved runoff forecasting performance through error predictions using a deep-learning approach. J. Hydrol. 2022, 608, 127653. [Google Scholar] [CrossRef]
  43. Salaeh, N.; Pinthong, S.; Wipulanusat, W.; Weesakul, U.; Weekaew, J.; Pham, Q.B.; Ditthakit, P. Resampling-driven machine learning models for enhanced high streamflow forecasting. Water Cycle 2026, 7, 99–119. [Google Scholar] [CrossRef]
  44. Gao, T.; Yu, J.; Paek, H. Impacts of four northern-hemisphere teleconnection patterns on atmospheric circulations over Eurasia and the Pacific. Theor. Appl. Climatol. 2016, 129, 815–831. [Google Scholar] [CrossRef]
  45. Zhao, Y.; Cheng, J.; Feng, G.; Zheng, Z.; Zhi, R.; Zhang, Z.; Yan, J.; Zuo, D. Dominant Role of Meridional Circulation in Regulating the Anomalous Subsidence of the Western Pacific Subtropical High in Early Summer 2020. Front. Phys. 2022, 10, 713087. [Google Scholar] [CrossRef]
  46. Li, X.; Lu, R.; Wang, X. Effect of Large-Scale Circulation Anomalies on Summer Rainfall over the Yangtze River Basin: Tropical versus Extratropical. J. Clim. 2023, 36, 4571–4587. [Google Scholar] [CrossRef]
  47. Zhang, H.D.; Gao, S.T.; Liu, Y. Advances of research on polar vortex. Plateau Meteor. 2008, 27, 10. (In Chinese) [Google Scholar]
  48. Shen, B.Z.; Lian, Y.; Zhang, S.X.; Li, S.F. Impacts of arctic oscillation and polar vortex anomalies on winter temperature over Eurasian continent. Progress. Inquisitiones Mutat. Clim. 2012, 8, 434–439. (In Chinese) [Google Scholar]
  49. Lu, C.H.; Zhou, B. Influences of the 11-yr Sunspot cycle and polar vortex oscillation on observed winter temperature variations in China. J. Meteorol. Res. 2018, 32, 367–379. [Google Scholar] [CrossRef]
  50. Zhou, T.; Yu, R.; Zhang, J.; Drange, H.; Cassou, C.; Deser, C.; Hodson, D.L.R.; Sanchez-Gomez, E.; Li, J.; Keenlyside, N.; et al. Why the western Pacific subtropical high has extended westward since the late 1970s. J. Clim. 2009, 22, 2199–2215. [Google Scholar] [CrossRef]
  51. Ren, X.; Yang, X.; Sun, X. Zonal Oscillation of Western Pacific Subtropical High and Subseasonal SST Variations during Yangtze Persistent Heavy Rainfall Events. J. Clim. 2013, 26, 8929–8946. [Google Scholar] [CrossRef]
  52. Huang, A.; Gao, G.; Yao, L.; Yin, S.; Li, D.; Do, H.; Fu, B. Spatiotemporal variations of inter- and intra-annual extreme streamflow in the Yangtze River Basin. J. Hydrol. 2024, 629, 130634. [Google Scholar] [CrossRef]
  53. Ye, X.; Wu, Z.; Wang, Z.; Shen, H.; Xu, J. Seasonal Prediction of the Yangtze River Runoff Using a Partial Least Squares Regression Model. Atmos.-Ocean 2018, 56, 117–128. [Google Scholar] [CrossRef]
  54. Zhang, S.; Qin, J.; Ren, H. The impact and mechanism analysis of preceding sea surface temperature anomalies on summer runoff in the Yangtze River basin and its southern region. Int. J. Climatol. 2024, 44, 1440–1453. [Google Scholar] [CrossRef]
  55. Chen, X.; Dong, J.; Huang, L.; Chen, L.; Li, Z.; You, N.; Singha, M.; Tao, F. Characterizing the 2020 summer floods in South China and effects on croplands. iScience 2023, 26, 107096. [Google Scholar] [CrossRef] [PubMed]
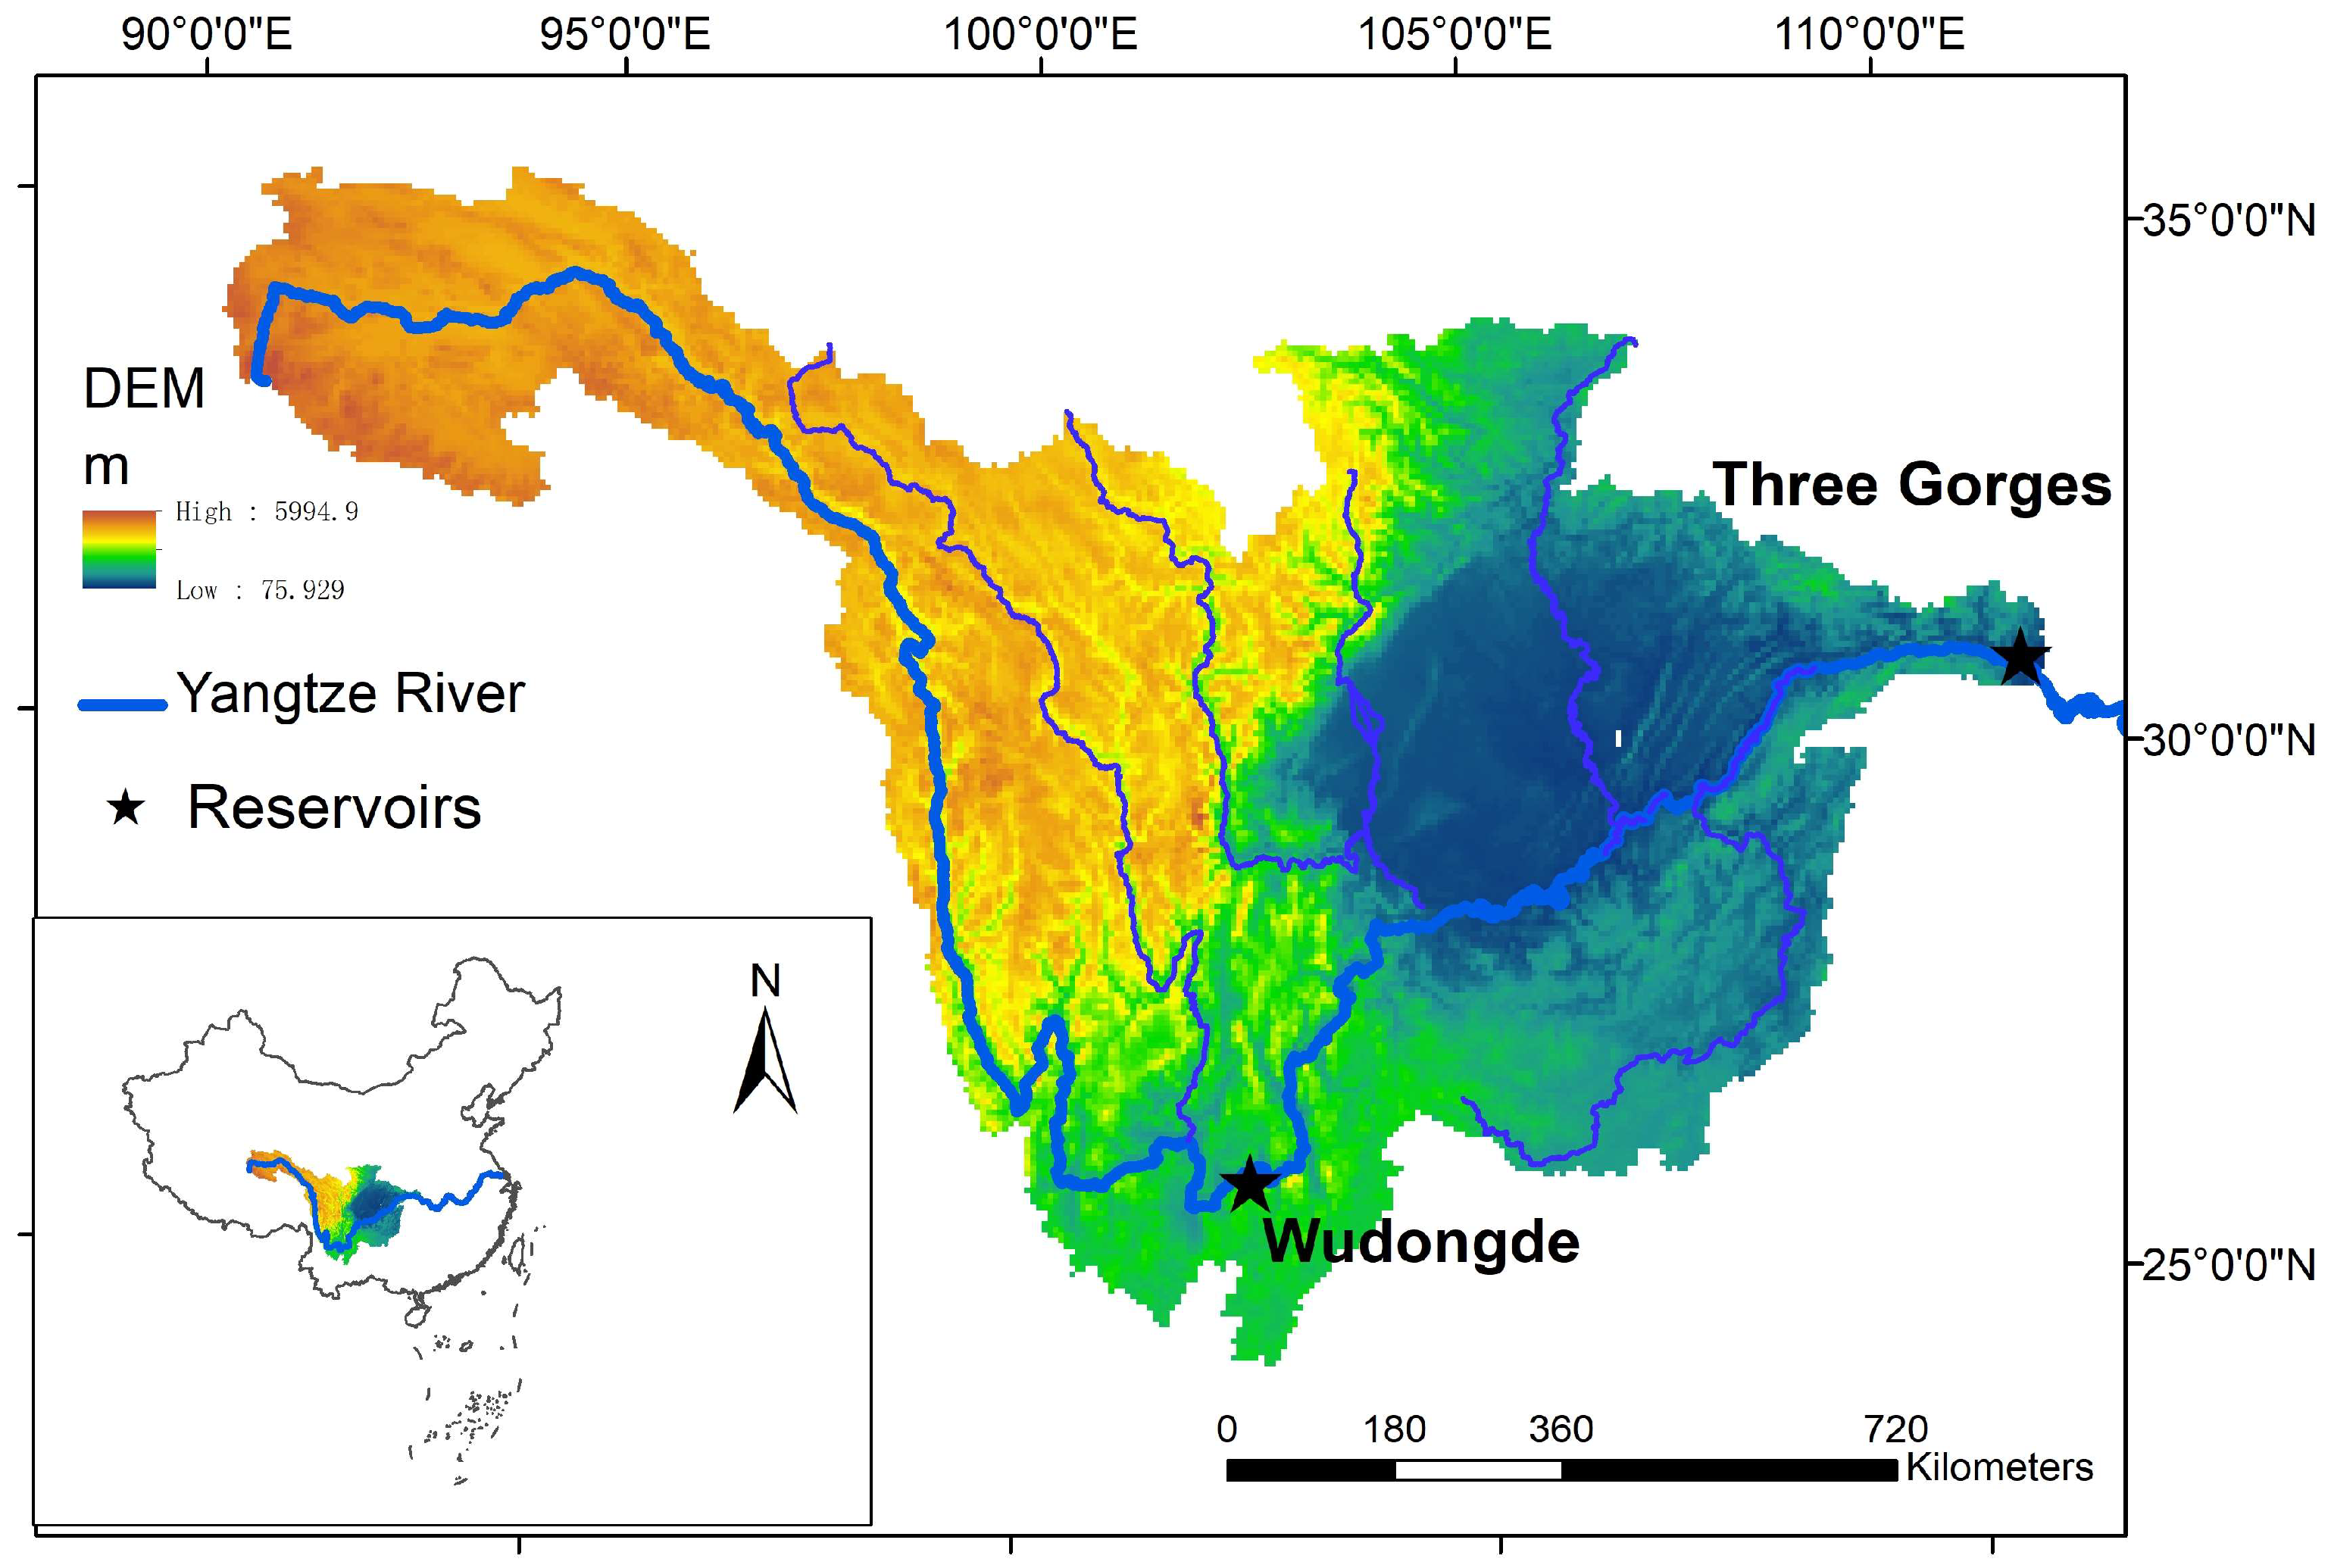
Figure 1. The location of the study area.
Water 17 02942 g001
Figure 2. The framework of long-term runoff prediction. In the GRU model, the dot (·) denotes the multiplication operator.
Water 17 02942 g002
Figure 3. The evaluation metrics of runoff prediction model at the Wudongde reservoir. (a,b) Pearson correlation coefficient and (c,d) Kling–Gupta Efficiency (KGE) between predicted and observed runoff across different months and lead times (7–18 months) during training and testing periods.
Water 17 02942 g003
Figure 4. The scatter plots of observed and predicted runoff at the Wudongde reservoir at different lead times (7–18 months). Here, black and blue dots denote runoff during training and testing periods, and the red line represents 1:1 diagonal line, respectively.
Water 17 02942 g004
Figure 5. Monthly runoff observations and predictions for the Wudongde reservoir at a 7-month lead time, the training and testing periods demarcated by the blue dotted line (left and right sides, respectively). The horizontal black dotted lines indicate the thresholds corresponding to the 90th, 50th, and 10th percentiles.
Water 17 02942 g005
Figure 6. The evaluation metrics of runoff prediction model at the Three Gorges reservoir. (a,b) Pearson correlation coefficient and (c,d) Kling–Gupta Efficiency (KGE) between predicted and observed runoff across different months and lead times (7–18 months) during training and testing periods.
Water 17 02942 g006
Figure 7. The scatter plots of observed and predicted runoff at the Three Gorges reservoir across different lead times (7–18 months). Here, black and blue dots denote runoff during training and testing periods, and the red line represents 1:1 diagonal line, respectively.
Water 17 02942 g007
Figure 8. Monthly runoff observations and predictions for the Three Gorges reservoir at a 7-month lead time, the training and testing periods demarcated by the blue dotted line (left and right sides, respectively). The horizontal black dotted lines indicate the thresholds corresponding to the 90th, 50th, and 10th percentiles.
Water 17 02942 g008
Figure 9. Observed and predicted runoff anomalies in May–August 2022 at the Wudongde and Three Gorges reservoirs.
Water 17 02942 g009
Disclaimer/Publisher’s Note: The statements, opinions and data contained in all publications are solely those of the individual author(s) and contributor(s) and not of MDPI and/or the editor(s). MDPI and/or the editor(s) disclaim responsibility for any injury to people or property resulting from any ideas, methods, instructions or products referred to in the content.