Article

Assessing Portuguese Public Health Literacy on Legionella Infections: Risk Perception, Prevention, and Public Health Impact

by
Susana Dias
1,
Maria Margarida Passanha
1,
Margarida Figueiredo
2,3 and
Henrique Vicente
2,4,5,*
1
Laboratório Regional de Saúde Pública de Évora, Instituto Nacional de Saúde Doutor Ricardo Jorge, Hospital do Espírito Santo, Edifício do Patrocínio, 4° Piso, Av. Infante D. Henrique, 7000-811 Évora, Portugal
2
Departamento de Química e Bioquímica, Escola de Ciências e Tecnologia, Universidade de Évora, Rua Romão Ramalho, 59, 7000-671 Évora, Portugal
3
CIEP—Centro de Investigação em Educação e Psicologia, Universidade de Évora, Rua da Barba Rala, 1, Edifício B, 7005-345 Évora, Portugal
4
LAQV REQUIMTE—Laboratório Associado para a Química Verde da Rede de Química e Tecnologia, Universidade de Évora, Rua Romão Ramalho, 59, 7000-671 Évora, Portugal
5
LASI—Laboratório Associado de Sistemas Inteligentes, Centro Algoritmi, Universidade do Minho, Campus de Gualtar, Rua da Universidade, 4710-057 Braga, Portugal
*
Author to whom correspondence should be addressed.
Water 2025, 17(20), 2940; https://doi.org/10.3390/w17202940
Submission received: 21 September 2025 / Revised: 6 October 2025 / Accepted: 10 October 2025 / Published: 12 October 2025

Abstract

Legionella is an environmental bacterium capable of causing severe respiratory infections, with outbreaks posing significant public health challenges in developed countries. Understanding public awareness of Legionella transmission, risk perception, and preventive behaviors is crucial for reducing exposure and guiding health education strategies. This study aimed to evaluate the Portuguese population’s knowledge of Legionella infections and their readiness to adopt preventive measures. A structured questionnaire was developed and administered to 239 participants aged 18–76 years across Portugal, collecting socio-demographic data and assessing literacy through statements organized into domains related to Legionella risk, control measures, and public health impact. The results indicate that participants possess moderate to high awareness of Legionella severity, transmission routes, and preventive strategies, yet gaps remain in understanding key risk factors, optimal water system maintenance, and the influence of temperature on bacterial growth. Age, educational attainment, and occupational status were associated with differences in self-assessed literacy levels. Artificial neural network models were applied to classify literacy levels, achieving a near 90% accuracy and demonstrating higher confidence in low and moderate categories. These findings provide insights for designing tailored educational programs, improving public health communication, and enhancing preventive behaviors to reduce Legionella infection risks.

1. Introduction

Legionella is an environmental bacterium widely distributed in aquatic ecosystems, capable of infecting both protozoa and humans. It is considered a significant public health concern worldwide, affecting both developed and developing countries. In developed regions, challenges often stem from complex water systems and aging infrastructure, whereas in developing regions, high population density and inadequate water supply and sanitation infrastructure contribute to the increasing risk of waterborne pathogens such as Legionella [1,2,3]. This bacterium is commonly found in freshwater environments such as lakes and rivers, as well as artificial systems, including water distribution networks, air conditioning systems, cooling towers, and spas. Legionella survives only in humid conditions and does not persist in dry environments [4].
Legionella is a facultative intracellular bacterium that relies on protozoa (e.g., Acanthamoeba, Naegleria, Hartmannella, and Tetrahymena) as natural hosts for replication [5]. This symbiotic relationship provides essential nutrients and protects the bacterium from adverse conditions [6]. Additionally, biofilm formation on aquatic surfaces is a key mechanism for its persistence. These microbial communities, embedded in an extracellular matrix, enhance resistance to disinfectants and facilitate colonization of artificial systems [7,8]. The Legionellaceae family consists of a single genus, Legionella. The number of recognized species and serogroups has steadily increased since the 1976 outbreak in Philadelphia. Currently, over 60 species and 80 serogroups have been identified. Among them, Legionella pneumophila is the primary causative agent of both community-acquired and nosocomial infections [5,9], with L. pneumophila serogroup 1 responsible for 84% of global Legionnaires’ disease cases [10]. These bacteria are Gram-negative bacilli (0.3–0.9 μm wide; 2–20 μm long), motile (with polar flagella), catalase-positive, and urease-negative. Although they do not form spores, they adapt to oligotrophic environments through interactions with protozoa [11].
Human infection occurs through inhalation of contaminated aerosols generated from various water sources, such as showers, cooling towers, decorative fountains, spa pools, humidifiers, and certain medical equipment [3]. In the lungs, Legionella bacteria are phagocytosed by alveolar macrophages, where they evade phagosome–lysosome fusion and replicate within vacuoles [12]. Once the host cell’s resources are depleted, the bacteria induce cell lysis, releasing new bacteria into the extracellular environment and perpetuating the infection cycle. This process triggers pulmonary inflammation, leading to the symptoms of Legionnaires’ disease [13,14]. Legionellosis manifests in two main forms: Legionnaires’ disease, a severe pneumonia characterized by high fever, dry cough, dyspnea, and potential systemic complications (e.g., delirium), with a mortality rate exceeding 10% without treatment [6]; and Pontiac fever, a self-limiting flu-like illness causing fever and myalgia, but without pulmonary involvement [6]. The most vulnerable individuals are men over 50, smokers, immunocompromised individuals, and those with chronic lung diseases. Transmission does not occur through water ingestion, and person-to-person spread has not been documented [15].
Effective strategies to prevent Legionella proliferation include regular maintenance of water systems by avoiding stagnation and controlling temperatures between 20 and 50 °C, the use of corrosion-resistant materials, and periodic disinfection through methods such as chlorination, UV treatment, or copper-silver ionization [16]. In Portugal, legislation mandates the implementation of prevention plans with laboratory monitoring conducted by accredited entities [17]. Detection methods vary in sensitivity and applicability. The cultural method (ISO 11731:2017) is considered the “gold standard”, but obtaining conclusive results may take up to 15 days post-sampling and does not detect viable but non-culturable bacteria [18]. RT-qPCR, i.e., reverse transcription quantitative polymerase chain reaction (ISO/TS 12869:2019), detects bacterial DNA in less than 24 h, but the lack of a direct correlation between genomic units (GU) and colony-forming units (CFU) limits its legal applicability [19]. Alternative methods, such as immunoassays like Legiolert™, quantify Legionella through the most probable number (MPN) approach [20].
European surveillance of Legionnaires’ disease was initially coordinated by the European working group for Legionella infections (EWGLINet), with Portugal participating since 1986. In April 2010, coordination shifted to the European center for disease prevention and control (ECDC) under the European Legionnaires’ disease surveillance network (ELDSNet). Portugal is represented by two collaborating centers. The directorate-general of health (DGS) for epidemiology and the national health institute Dr. Ricardo Jorge (INSA) for microbiology.
Legionella was gradually recognized as a significant cause of pneumonia, with its importance as a pathogen becoming evident after an outbreak during the 58th annual convention of the American Legion in the summer of 1976. Of the 221 members who developed acute respiratory infection, 34 died. After months of epidemiological and microbiological studies, L. pneumophila was isolated from lung tissue samples of four fatal cases [6]. The clinical and epidemiological description of this outbreak was later linked to previous pneumonia epidemics, including those at a meatpacking plant in Minnesota in 1957 and St. Elizabeth Hospital in 1965. The 2021 Annual Epidemiological Report for Legionnaires’ disease, published by the European Center for Disease Prevention and Control in June 2023, is the latest official report currently available. It indicates a disease rate of 2.4 cases per 100,000 inhabitants in the European economic area, with variations between countries. Italy, France, Spain, and Germany account for 75% of cases, with men over 65 being the most affected group. Most cases are community-acquired, but only 11% are culture-confirmed, potentially underestimating cases caused by other Legionella species. In 2021, 19 outbreaks were reported across 8 countries. The travel-associated Legionnaires’ disease surveillance scheme recorded a 38% increase in cases compared to 2020, primarily affecting individuals aged 45 or older [21].
In recent years, some cases of Legionella infection have also been reported in Portugal. In November 2014, the municipality of Vila Franca de Xira experienced the largest outbreak of Legionnaires’ Disease in the country, considered the second-largest documented in the literature. A total of 403 pneumonia cases were identified, 377 of which were confirmed to be caused by L. pneumophila, resulting in 14 deaths. A match was confirmed between the bacterial strain isolated from a cooling tower at Adubos de Portugal and the strain found in patients’ bronchial secretions [22]. Similarly, in March 2017, five cases of Legionnaires’ disease were identified in the municipality of Maia. All affected individuals were employees of Sakthi Portugal SA. Health authorities considered occupational exposure, as the workers may have contracted the infection before the completion of decontamination procedures in the company’s cooling towers [23,24]. In November 2017, another outbreak of Legionnaires’ disease occurred at Hospital S. Francisco Xavier in Lisbon, resulting in 56 confirmed cases and 5 suspected cases. Unfortunately, 6 deaths occurred among the confirmed cases, representing a mortality rate of 11% [25]. Then, in January 2018, Hospital CUF Descobertas, also in Lisbon, was linked to 15 confirmed cases of Legionnaires’ disease. Of these, one patient did not require hospitalization, 12 were discharged, and 2 required intensive care [26].
Public awareness is essential for prevention, and the manner in which information is conveyed to the population is a decisive factor in shaping understanding and mitigating exposure risks [27,28,29]. The World Health Organization (WHO) defines health literacy as the ability to understand and apply health-related information [30]. Informed communities adopt practices such as adjusting hot water temperatures to above 60 °C and regularly cleaning showers to reduce risks. Health institutions should publish clear guidelines to empower the population. Despite challenges and the need for more resources, Portugal has demonstrated leadership in implementing health literacy strategies aligned with behavioral sciences. The new health literacy and behavioral sciences plan 2023–2030 aims to improve preventive and health-promoting behaviors [31]. Controlling Legionella requires a multidisciplinary approach, ranging from environmental surveillance to public education. Investing in health literacy and rapid diagnostic technologies is an essential step to mitigate outbreaks and protect vulnerable populations. To effectively address Legionella infection risks and promote preventive behaviors, it is essential to understand the population’s knowledge and attitudes towards the disease. In this context, providing insights into the public’s awareness of Legionella transmission, their perceptions of risk, and their engagement with prevention measures is crucial. The aim of this study was to evaluate the Portuguese population’s understanding of Legionella infections and their readiness to adopt preventive actions.
The primary contribution of this research is a thorough evaluation of public awareness concerning various aspects of Legionella prevention through a large-scale questionnaire. This evaluation highlights areas where knowledge is insufficient, particularly regarding risk factors and the importance of effective control measures. Additionally, the study introduces methods for assessing overall awareness levels and identifying areas for improvement, which are essential for grouping participants based on similar characteristics and for designing targeted interventions that can enhance public health behaviors and reduce the spread of Legionella.

2. Materials and Methods

This section presents a schematic of the study’s workflow (Figure 1), showing the arrangement of the research, the setting, procedures for collecting information, measurement tools, sample attributes, and methods for analyzing the data. Ethical principles followed throughout the research are also highlighted.

2.1. Research Design

This research was designed to measure Portuguese public literacy on Legionella infections. It also seeks to identify knowledge gaps to guide initiatives aimed at enhancing public understanding. The study addresses the following research questions:
  • What is the level of public health literacy regarding Legionella infections in Portugal?
  • Which aspects of public literacy on Legionella infections require improvement or further clarification?
The questionnaire comprised five domains (i.e., risk perception and knowledge about Legionella, confidence in water supply systems and safety measures, effectiveness of prevention and control measures, willingness to adopt measures and associated costs, and Impact on public health and concern about exposure) specifically designed to allow the implementation of the methodology proposed by Fernandes et al. [32] for converting qualitative responses into quantitative data. The following subsections offer additional details and explanations.

2.2. Study Site Characterization

The study was conducted in mainland Portugal, encompassing all major administrative regions, i.e., Norte, Centro, Lisboa e Vale do Tejo, Alentejo, and Algarve, to ensure a global overview of the Portuguese population’s public health literacy concerning Legionella infections. These regions were included due to their distinct demographic, climatic, and socioeconomic characteristics [33]. Portugal has a Mediterranean climate [34], with humid coastal areas in the west and south and more continental conditions inland [35]. Urban areas were prioritized for data collection due to their higher population density, greater prevalence of large-scale water systems (cooling towers, spas, and public fountains), and history of sporadic Legionella outbreaks reported by national health authorities [22,23,24,25,26].

2.3. Sample Population and Sampling Process

The study population consisted of adult residents (≥18 years old). Recruitment was carried out through in-person questionnaires between February and June 2025. The study used a random sample, with participants recruited across all Portuguese administrative regions, namely North (31.0%), Center (20.0%), Lisbon and Tagus Valley (27.3%), Alentejo (13.1%), and Algarve (8.6%), seeking to ensure that the number of respondents per region reflected the proportion of resident population in those areas [36]. Of the 245 questionnaires distributed, 6 (2.4%) were excluded because they were incomplete, containing no responses to the second and third parts and leaving several questions unanswered in the first part.

2.4. Data Collection Procedures and Data Collection Instrument

The implementation of a survey using questionnaires was chosen after careful consideration of different methodological options, with the decision supported by the method’s practicality and adaptability. Despite providing less contextual depth, it guarantees efficiency, uniformity, and anonymity. Alternative methods (including interviews, focus groups, observations, experiments, and case studies) can yield more detailed findings but tend to demand greater resources, are vulnerable to bias, and may lack broad applicability. The structured design of questionnaires also facilitates the quantification of qualitative responses [37,38,39,40].
To meet the research objectives and questions outlined earlier, a three-part questionnaire was developed. The first part collects sociodemographic information (e.g., gender, age categories, educational attainment, and work status) to facilitate a detailed analysis of variations in literacy levels across distinct population segments. The second part presents a series of statements (Table 1) covering the study’s key domains (i.e., risk perception and knowledge about Legionella, confidence in water supply systems and safety measures, effectiveness of prevention and control measures, willingness to adopt measures and associated costs, and impact on public health and concern about exposure). This section is designed to elicit participant feedback, thereby supporting the study’s objective of identifying areas requiring improvement.
The third part requires participants to undertake a self-assessment of their literacy related to Legionella infections (Figure 2). In addition, responses from the second and third sections form the foundation for developing a predictive model employing artificial neural networks (ANNs). This model is intended to identify the main drivers of literacy variation and to provide a systematic framework for future evaluations and health education strategies.
In contrast with the descriptive method applied in the first part, the second section applies a four-point Likert scale (strongly disagree, disagree, agree, and strongly agree), whereas the third part adopts a three-point scale (high, moderate, and low). In the second part of the questionnaire, besides the previously indicated options, participants could also select I don’t know, representing an uncertain condition where multiple outcomes may be considered possible.
In accordance with Bell’s recommendations [41], the questionnaire underwent a detailed assessment by a team of specialists, whose proposed changes were implemented in an updated edition. The expert panel consisted of six professionals with complementary expertise, convened to evaluate the questionnaire on public health literacy regarding Legionella infections. The panel included a public health specialist with experience in disease surveillance and outbreak prevention, a microbiologist with expertise in Legionella epidemiology, an infectious disease expert familiar with clinical aspects and preventive measures, a health literacy professional skilled in risk communication and health education, an epidemiologist experienced in survey design and data analysis, and a water system management practitioner providing practical insights into Legionella prevention and real-world applicability.
A separate participant cohort, independent of the main sample, was employed to evaluate the validity and clarity of the revised questionnaire. Reliability assessment using Cronbach’s alpha indicated high internal consistency for the second section of the instrument (α = 0.89), supporting the robustness of the measure.

2.5. Qualitative Data Processing

In the second part of the questionnaire, responses were initially measured on a four-point Likert scale (i.e., (1) strongly disagree, (2) disagree, (3) agree, and (4) strongly agree). To enhance the analysis and better reflect response tendencies, the scale was expanded to a seven-level format:
(4) strongly agree, (3) agree, (2) disagree, (1) strongly disagree, (2) disagree,
(3) agree, and (4) strongly agree
The seven-point Likert scale can be interpreted bidirectionally: left-to-middle denotes a progression from strongly agree (4) to strongly disagree (1), while middle-to-right denotes a progression from strongly disagree (1) to strongly agree (4). The former illustrates a negative shift in opinion, and the latter a positive one.
Applying the methodology proposed by Fernandes et al. [32], qualitative information was converted into quantitative form. The approach represents each domain inside a circle of radius 1 / π , partitioned into λ slices corresponding to the number of statements analyzed, with response categories plotted along the axes. This framework establishes an analogy between knowledge representation and thermodynamics, mirroring the phenomenon of energy degradation. To demonstrate the essential principles of the methodology, the first and second laws of thermodynamics are considered, highlighting the temporal dynamics of system evolution. The law of energy conservation (first law) asserts that the energy of an isolated system does not vary. The second law concerns entropy, which represents the system’s disorder and its evolution. In this setting, a data item is considered to exist in an entropic condition, allowing its energy to be divided and used for degradation, though not destroyed, covering:
  • Exergy, defined as the usable portion of energy or available work, indicates the energy a system can convert for work;
  • Vagueness captures energy whose consumption status is uncertain; and
  • Anergy represents the energy potential that remains unconsumed and available, comprising all energy excluding exergy and vagueness [42].
The value of exergy is obtained through the standard formula for the area of a circle (Equation (1)), applying the corresponding radius values.
A = 1 S π r 2
where S represents the number of statements per domain (in this case, S = 6 , for each of the first two domains and S = 5 for each of the remaining three), and r denotes the radius corresponding to the most positive response. The values of vagueness and anergy were determined using the formula for an annulus:
A = 1 S π R 2 r 2
where S represents the number of statements per domain, r is the radius of the inner circle, corresponding to the most positive response, and R is the radius of the outer circle, corresponding to the least positive response. A comprehensive application of this methodology to a particular case is provided in Section 3.4.

2.6. Artificial Neural Networks

ANN models were implemented in WEKA 3-8-6 using default parameter settings (learning rate = 0.3, momentum = 0.2) [43,44]. The learning process utilized the backpropagation algorithm with a logistic activation function [45,46,47]. Each simulation was conducted twenty times, with the dataset divided into a training set (67%) for model development and a test set (33%) for evaluating model generalization.

2.7. Ethical Aspects

All participants were fully informed about the study’s objectives and provided voluntary consent before participating. The Ethics Committee of the University of Évora approved the study (Document 24105) on 18 February 2025, ensuring adherence to the highest ethical standards. Informed consent was obtained from all participants, and their personal data was anonymized.

3. Results

This section reports the results of a study assessing the level of public health literacy regarding Legionella infections in Portugal, based on the responses obtained from a sample of 239 participants.

3.1. Sample Characterization

This study included a random sample of 239 participants, whose ages ranged from 18 to 76 years, with a mean age of 50.6 ± 23.8 years. Table 2 presents the demographic characterization of the participants in terms of gender, age categories, educational attainment, and work status.

3.2. Frequency Analysis of Responses

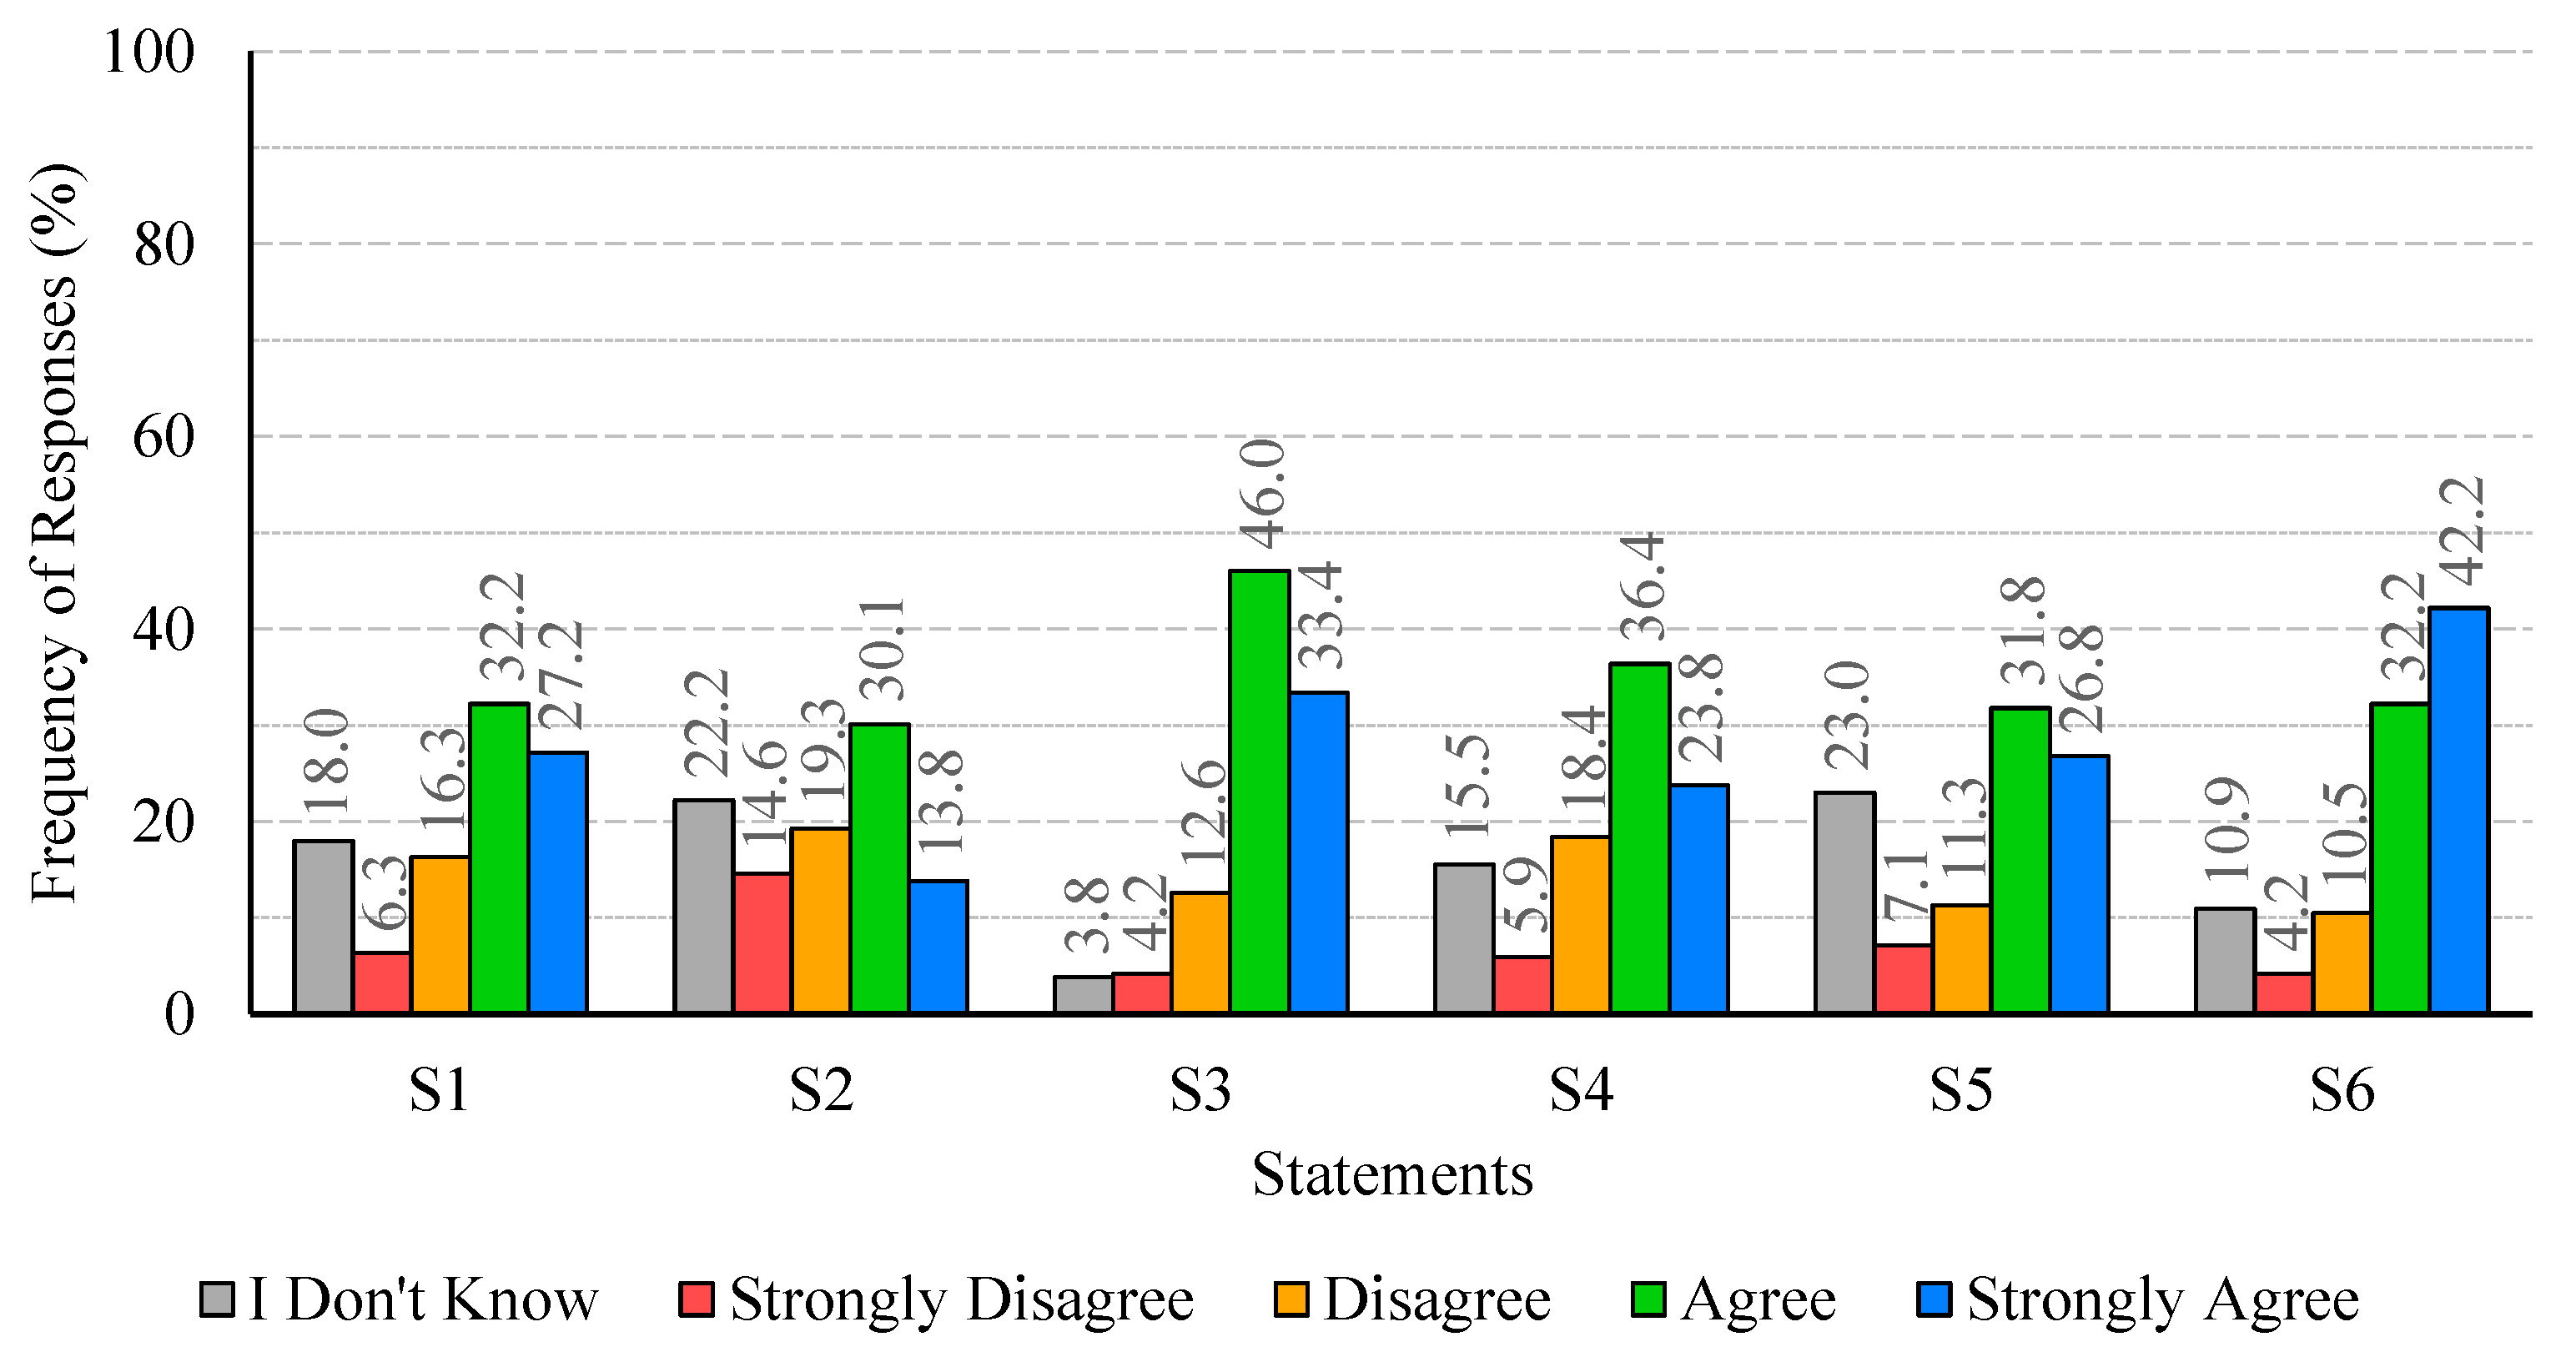
Figure 3 presents the percentage distribution of responses to statements S1–S6 (Table 1), reflecting participants’ risk perception and knowledge regarding Legionella. Overall, most statements received predominantly positive responses (agree or strongly agree), except S2 (primary routes of transmission), which presented lower agreement (43.9%). Positive responses ranged from 58.6% (S5, influence of temperature) to 79.5% (S3, severity of infection), while negative responses varied between 14.7% (S6, risk to vulnerable groups) and 33.8% (S2). For all statements included in this domain, some participants selected the response option I don’t know, with percentages varying from 3.8% (S3) to 23.0% (S5).
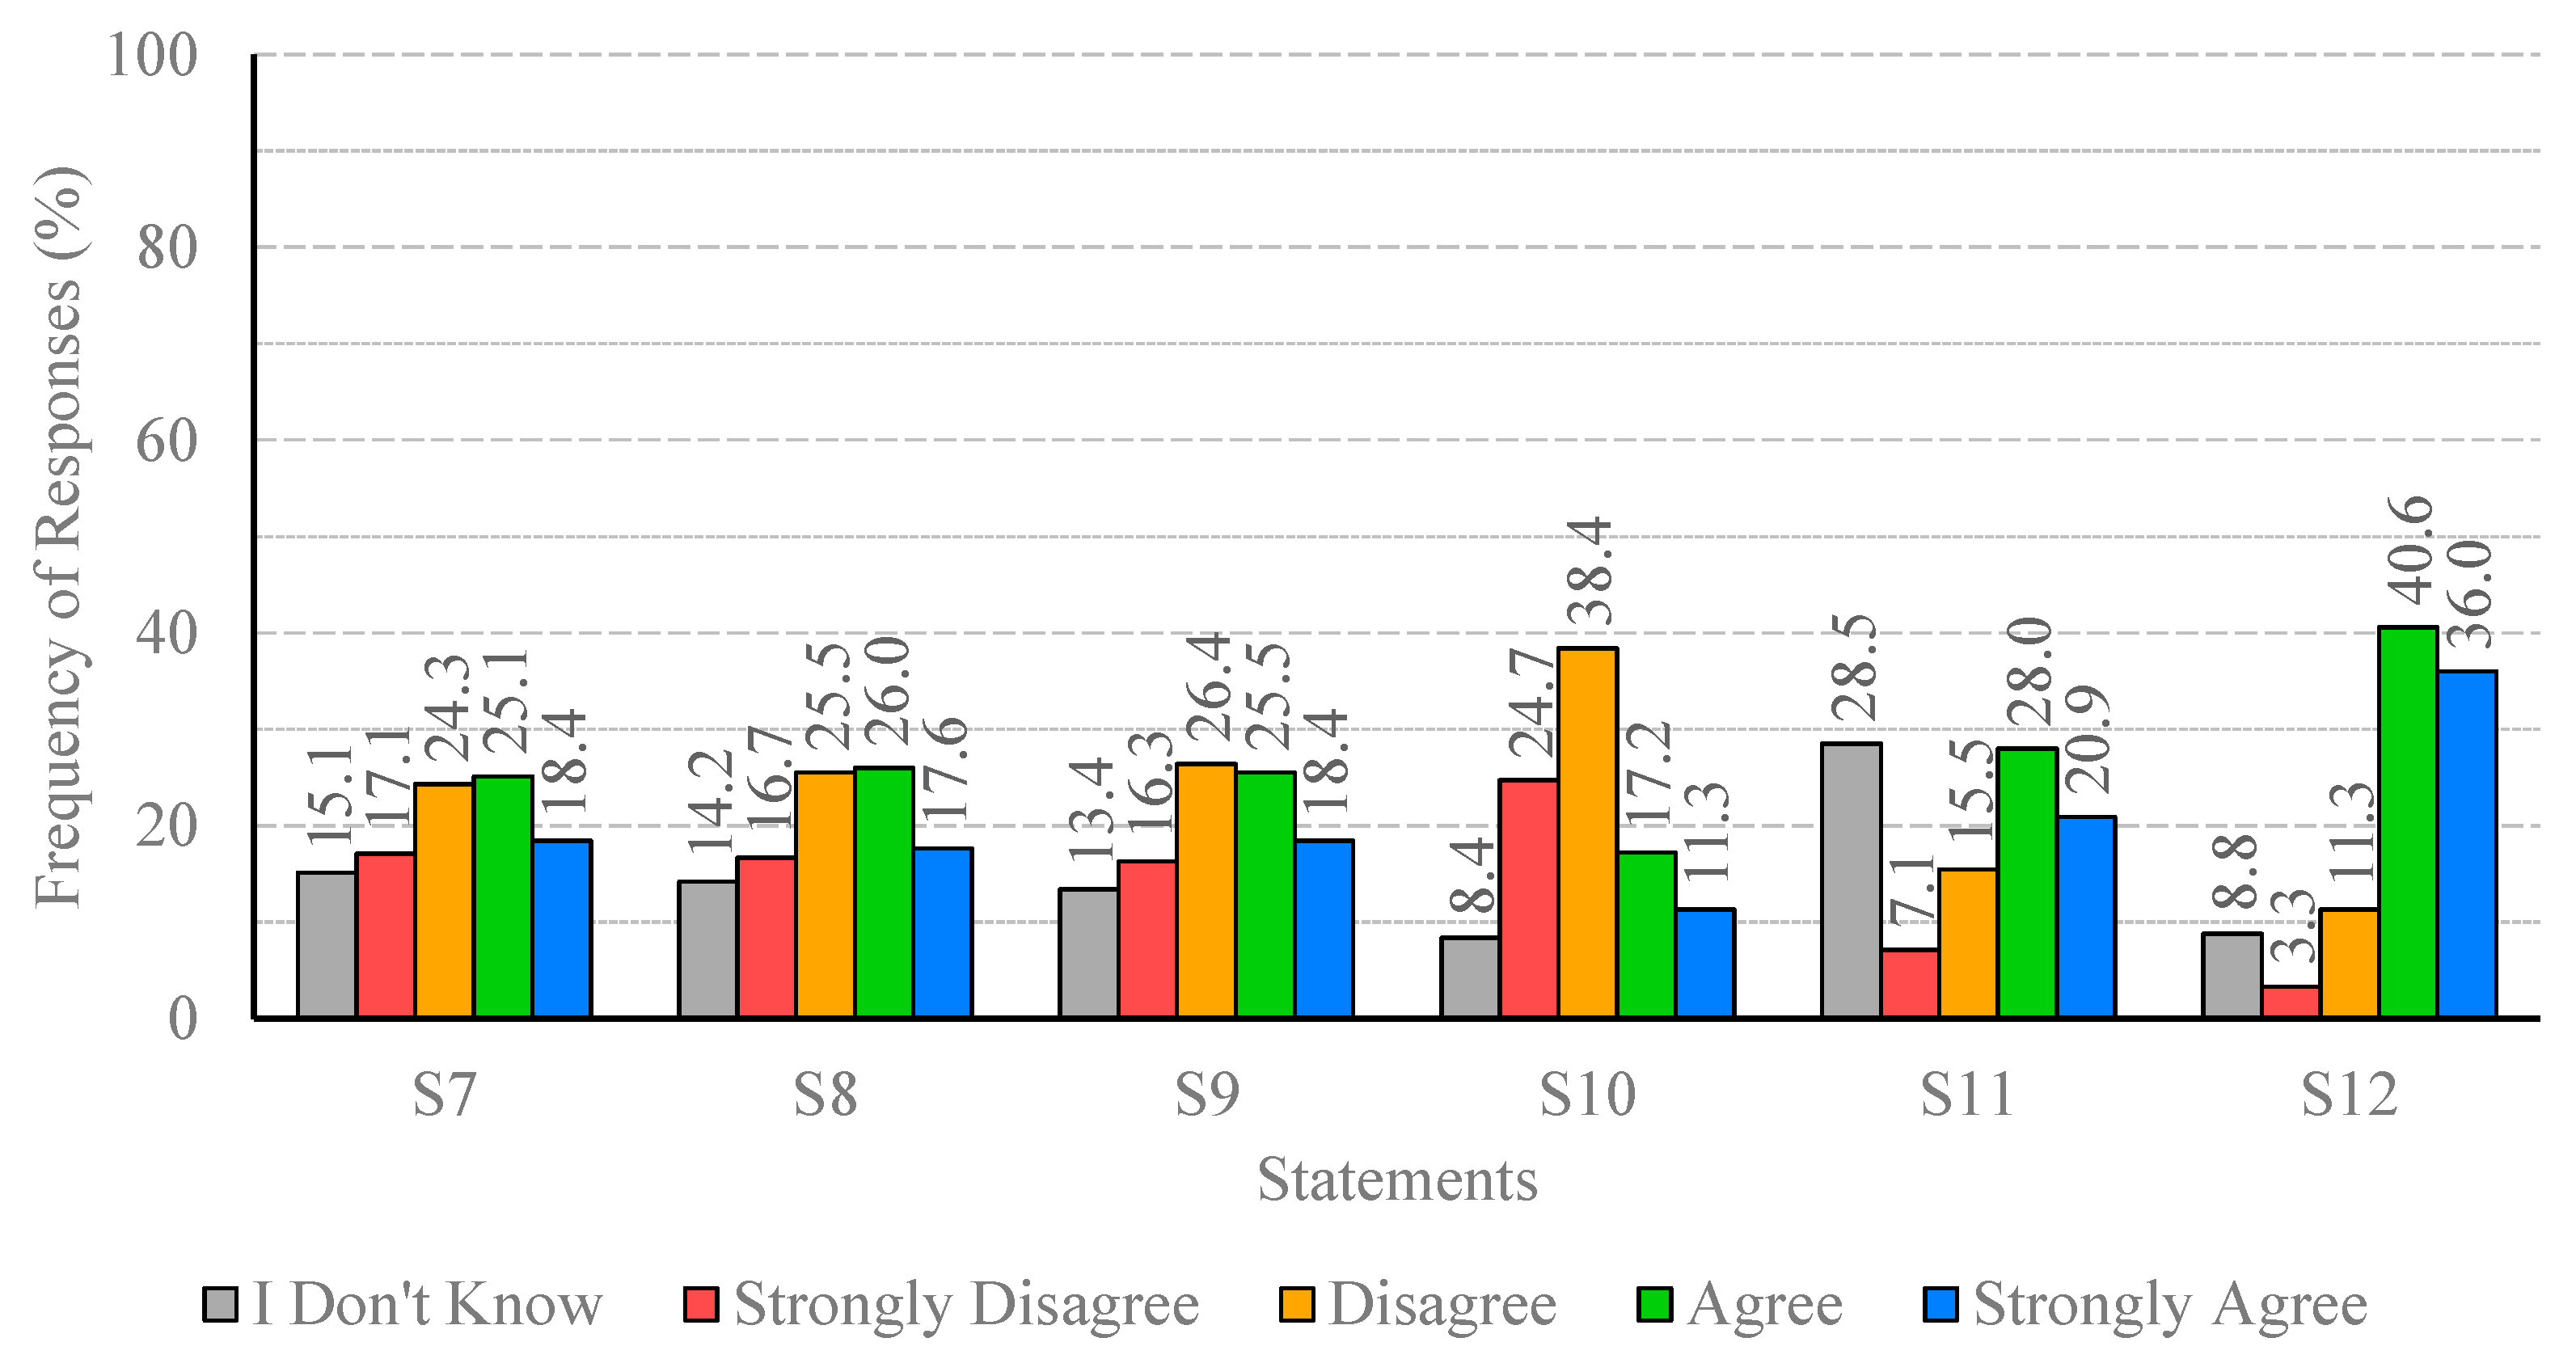
Figure 4 presents the percentage distribution of responses to statements S7–S12 (Table 1), reflecting participants’ confidence in water supply systems and safety measures. Overall, the results are heterogeneous, with considerable variation in agreement and uncertainty across statements. Positive responses ranged from 28.5% (S10, communication of risks and preventive measures) to 76.6% (S12, investigation of suspected cases), while negative responses varied between 22.6% (S11, maintenance and disinfection of public hot water systems) and 63.1% (S10). In addition, the percentage of responses I don’t know is not negligible, spanning from 8.4% (S10) to 28.5% (S11). Among all statements, S12 stands out with the highest percentage of agreement (76.6%) and the lowest levels of both uncertainty (8.8%) and disagreement (14.6%). By contrast, S10 reveals a critical point, with the lowest agreement (28.5%) and the highest prevalence of negative responses (63.1%). Statements S7–S9 (on procedures, maintenance and inspection of water systems) presented near-balanced distributions between agreement and disagreement (≈43–44% vs. ≈41–43%), indicating moderate levels of consensus but still some divergence. S11 presents an intermediate level of agreement (48.9%), but a substantial percentage of respondents expressed uncertainty (28.5%), suggesting a lack of clarity regarding this aspect.
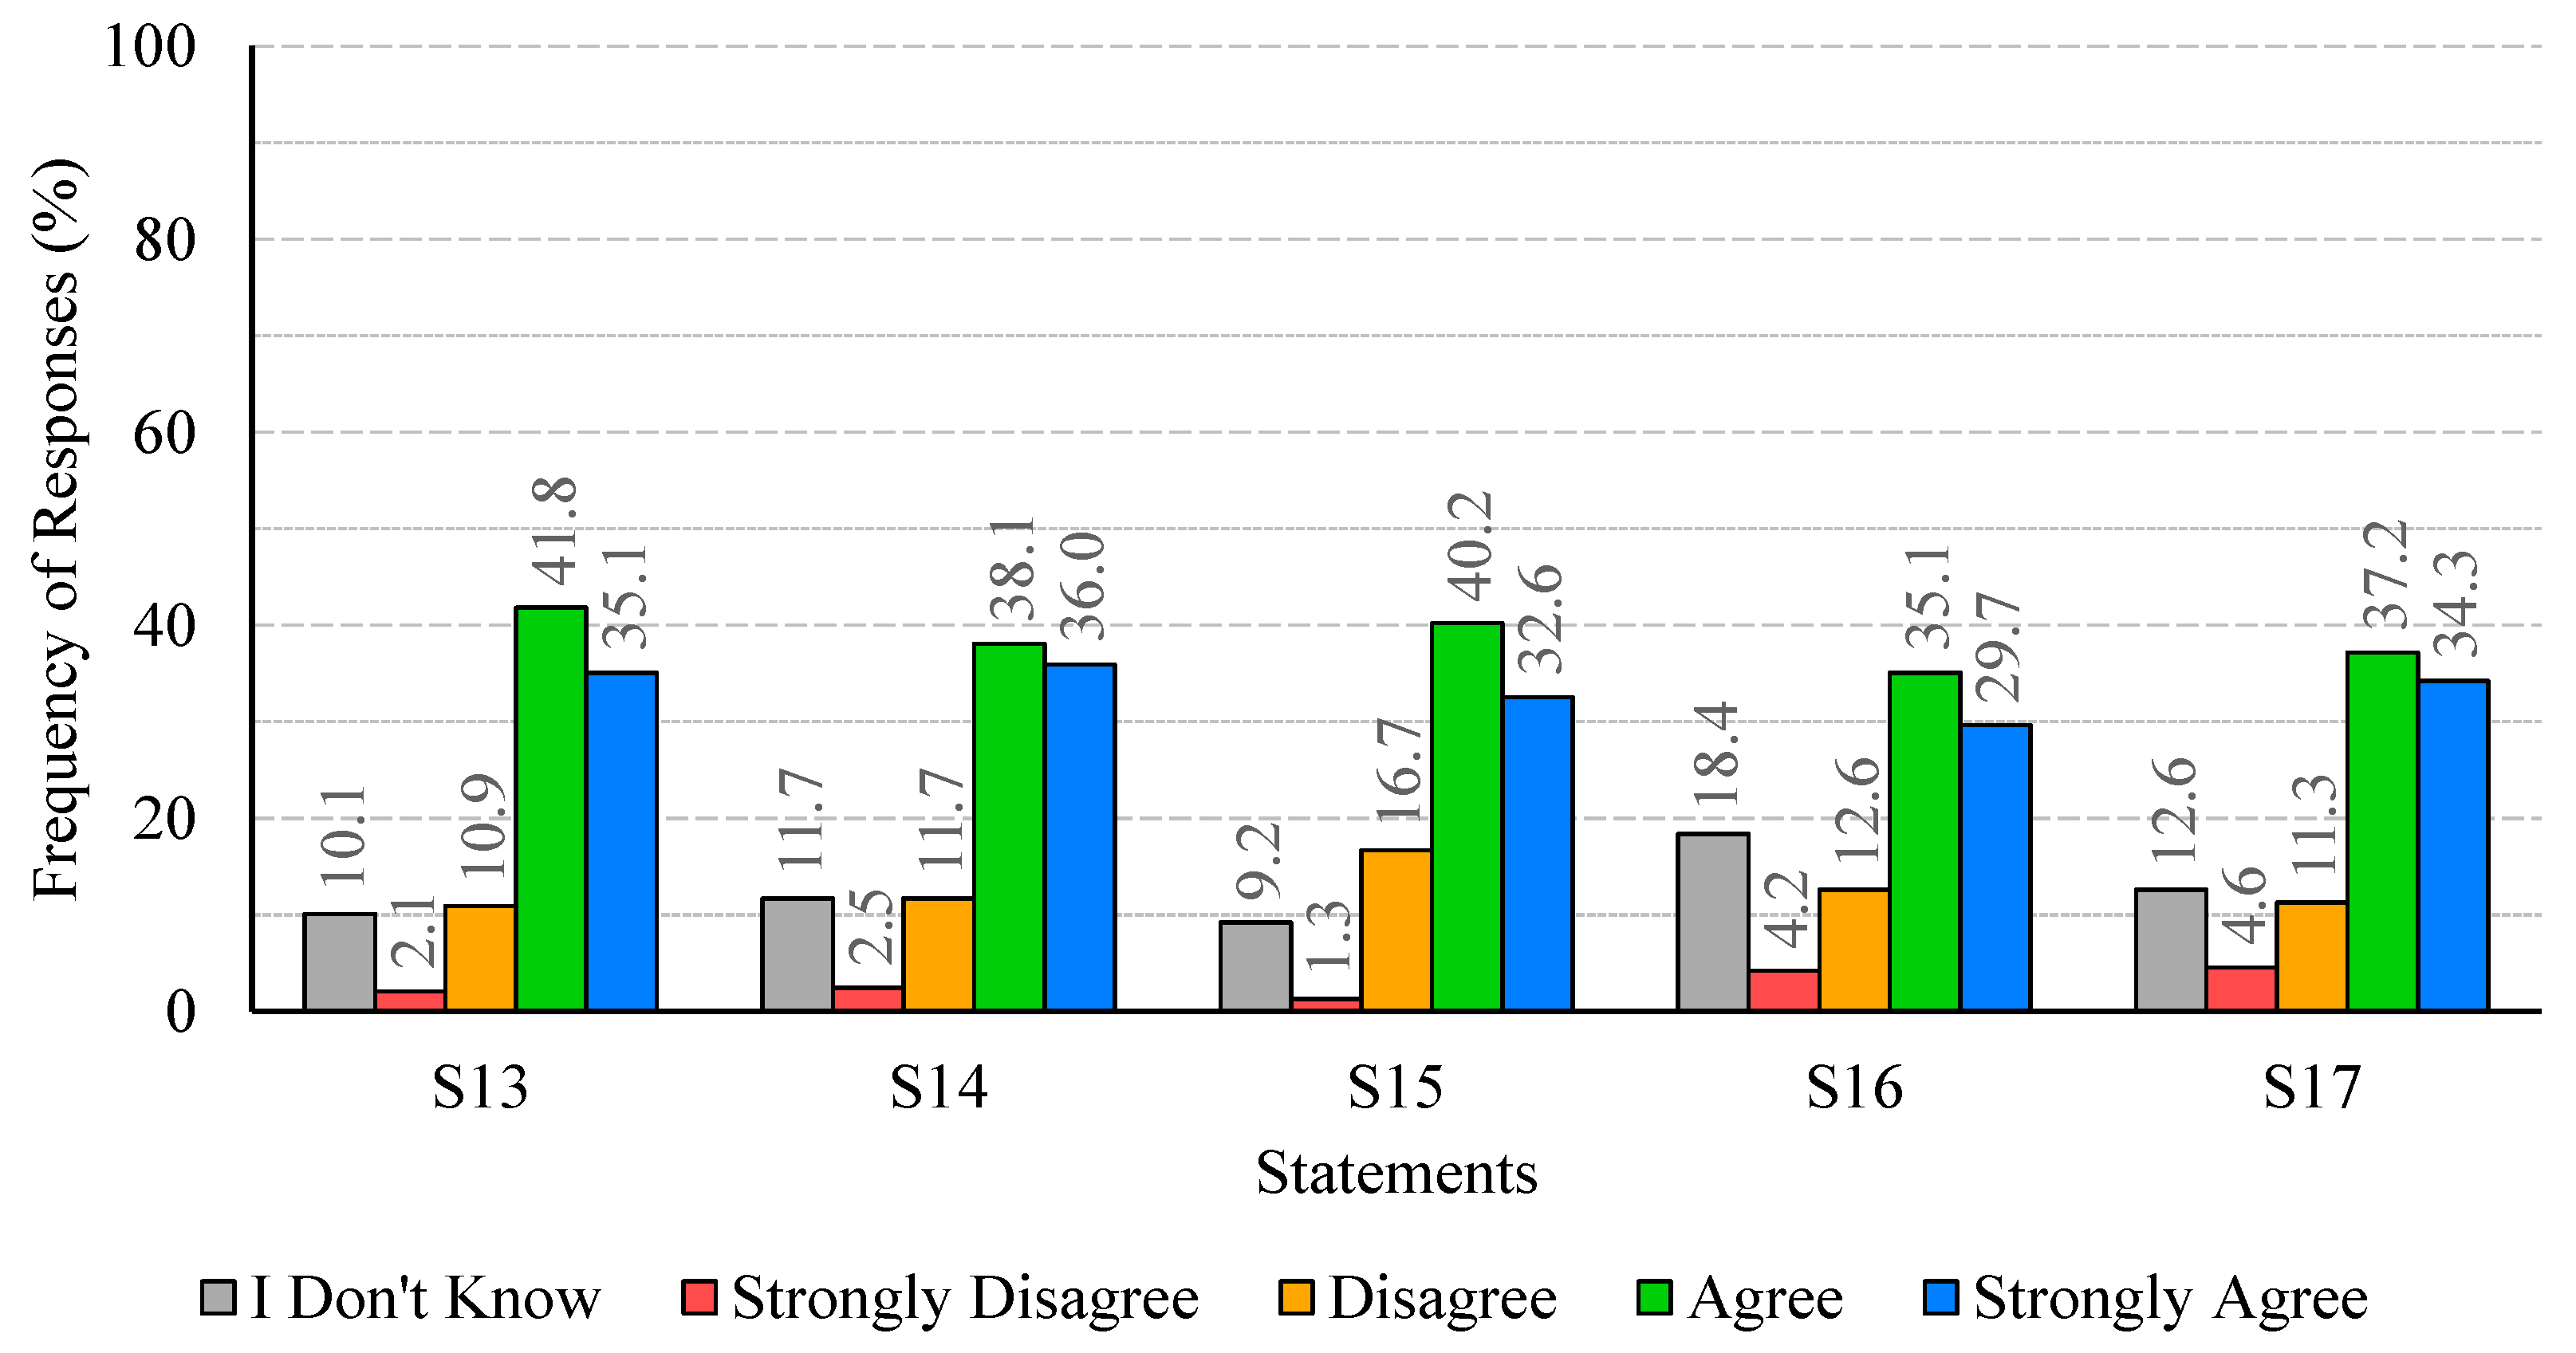
Figure 5 presents the percentage distribution of responses to statements S13–S17 (Table 1), reflecting participants’ opinions on the effectiveness of prevention and control measures. Positive responses (strongly agree and agree) predominated, ranging from 64.8% (S16, use of temperature shocks) to 76.9% (S13, on disinfection as an effective measure), while negative responses (disagree and strongly disagree) ranged from 13.0% (S13) to 18.0% (S15, on the role of maintenance in reducing the risk). For all statements, some participants selected the response option I don’t know, with percentages varying from 9.2% (S15) to 18.4% (S16).
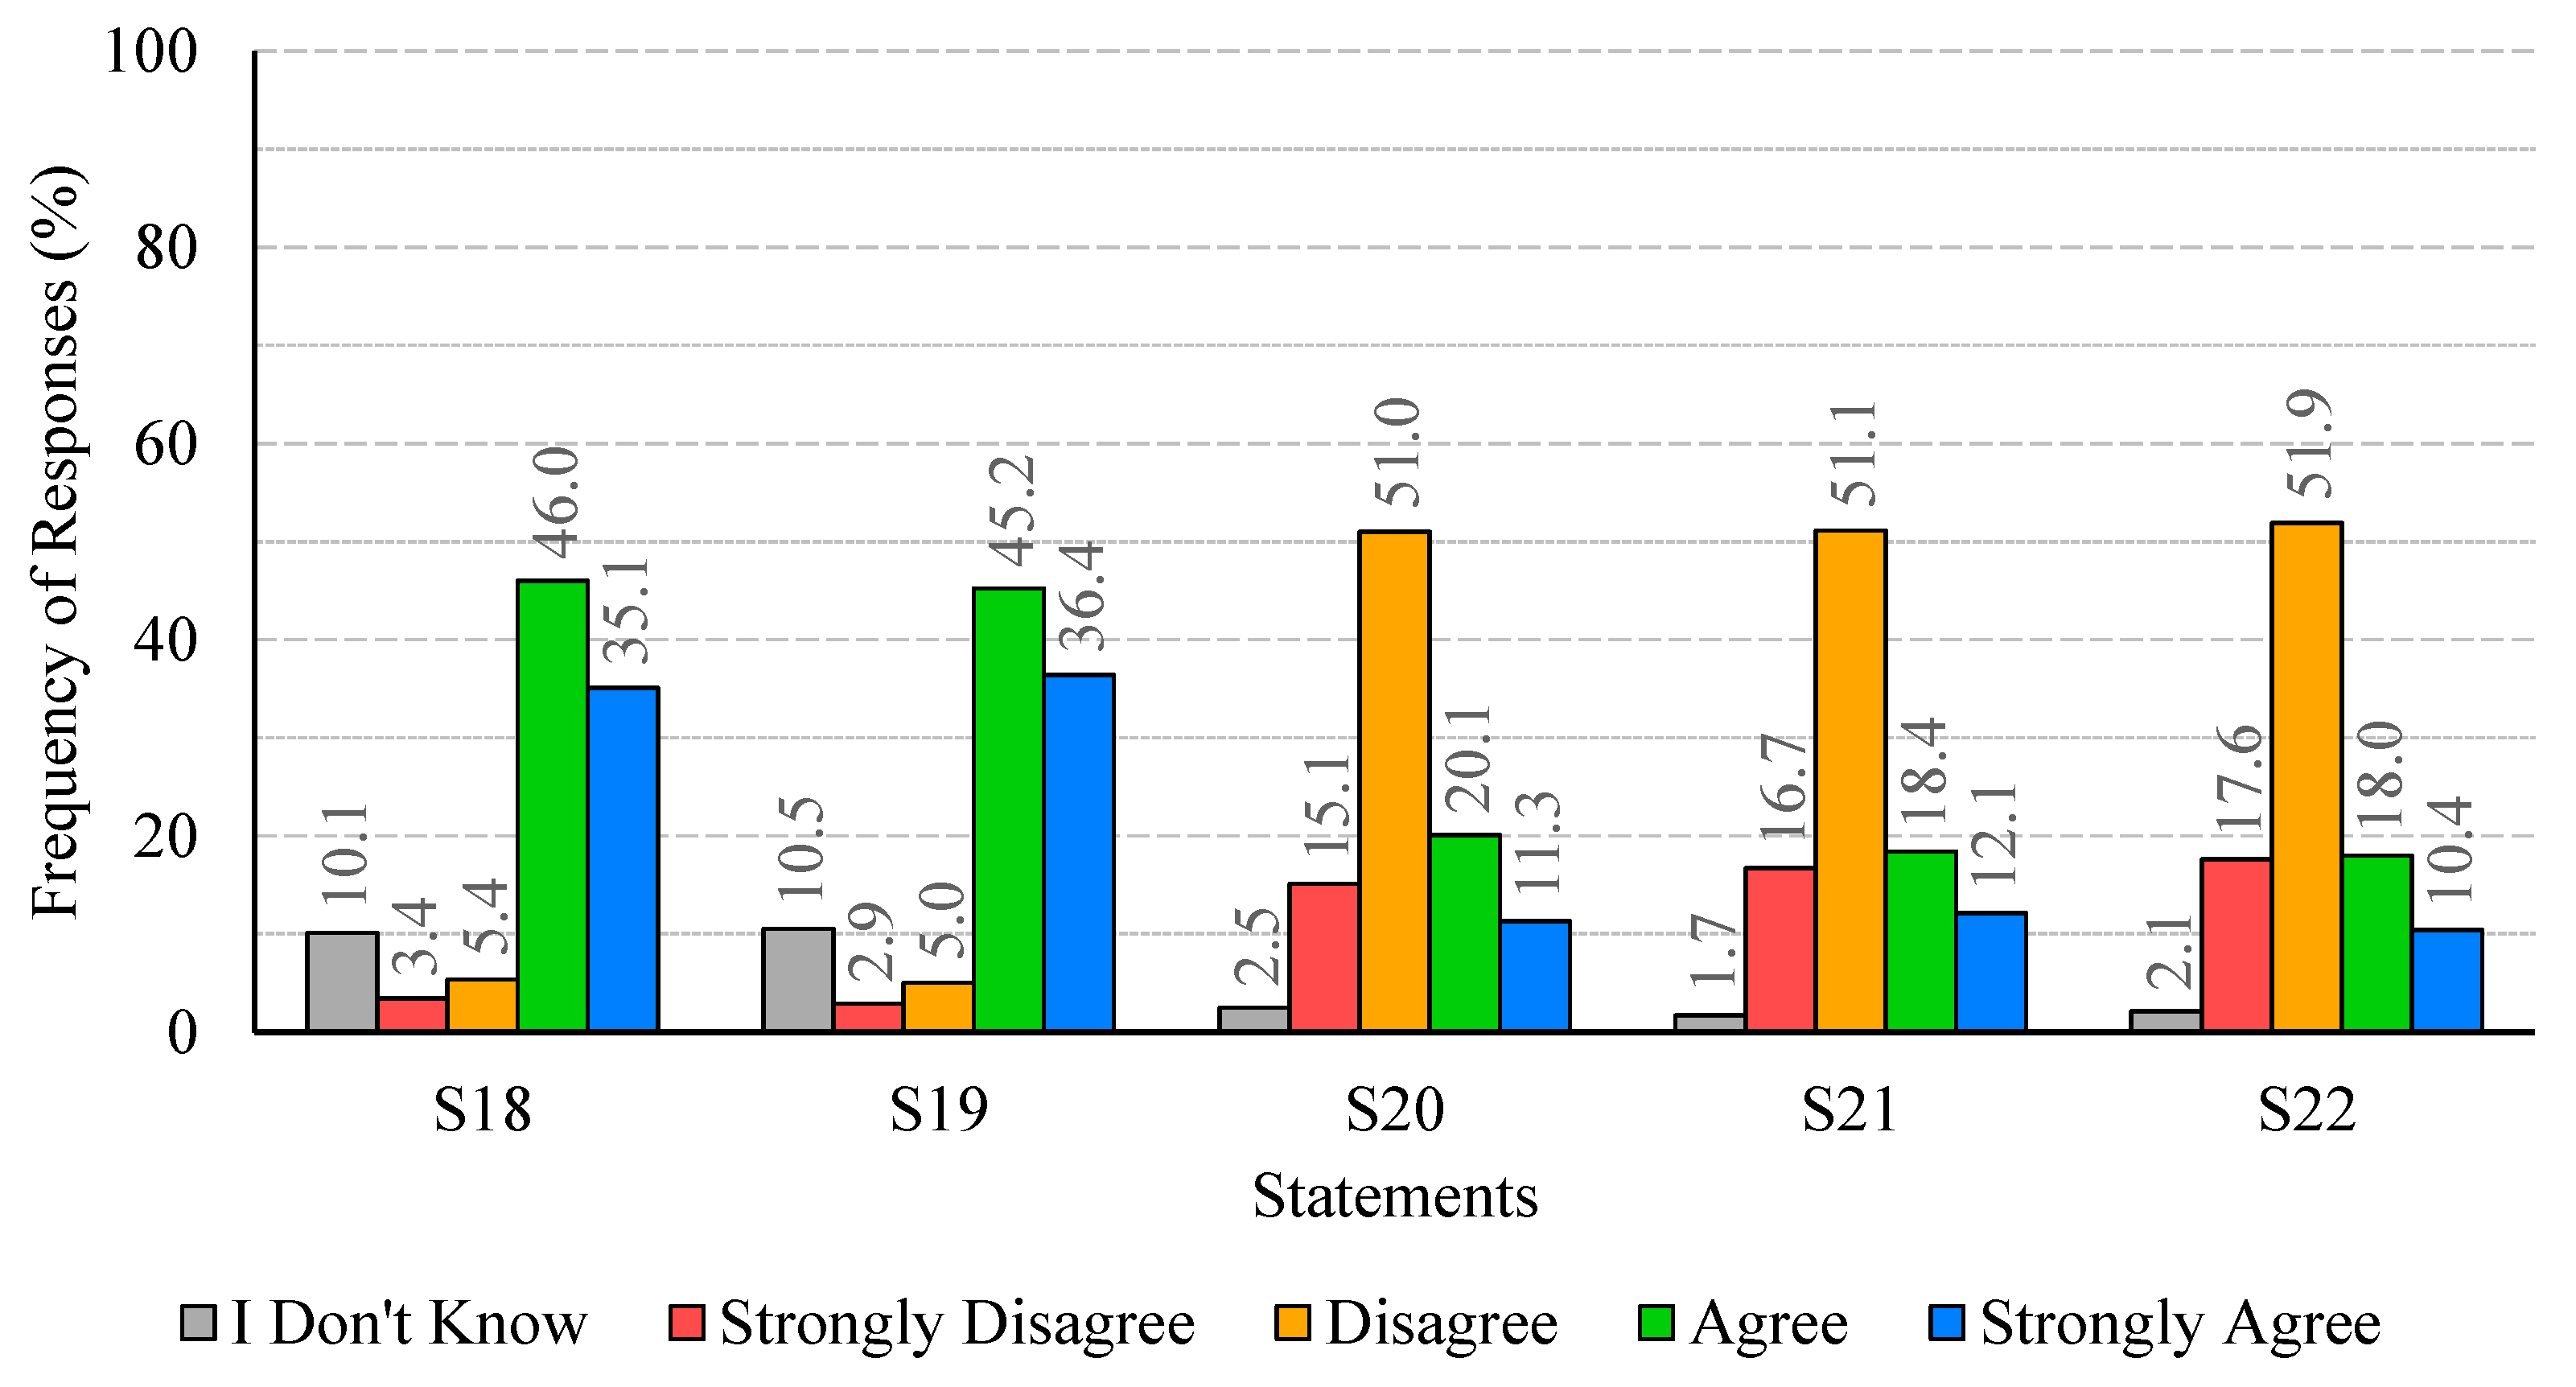
Figure 6 presents the percentage distribution of responses to statements S18–S22 (Table 1), reflecting participants’ willingness to adopt measures and associated costs. The results reveal heterogeneous patterns, with high percentages of negative responses (strongly disagree and disagree) for statements S20–S22 (additional costs, tariff increases, and temporary supply interruptions), ranging from 66.1% to 69.5%. In contrast, high percentages of positive responses (agree and strongly agree) were observed for statements S18 and S19 (investment in new technologies and preventive maintenance), at approximately 82%. Regarding the response option I don’t know, the percentage did not exceed 2.5% for statements S20–S22, while for statements S18 and S19 it was approximately 10%.
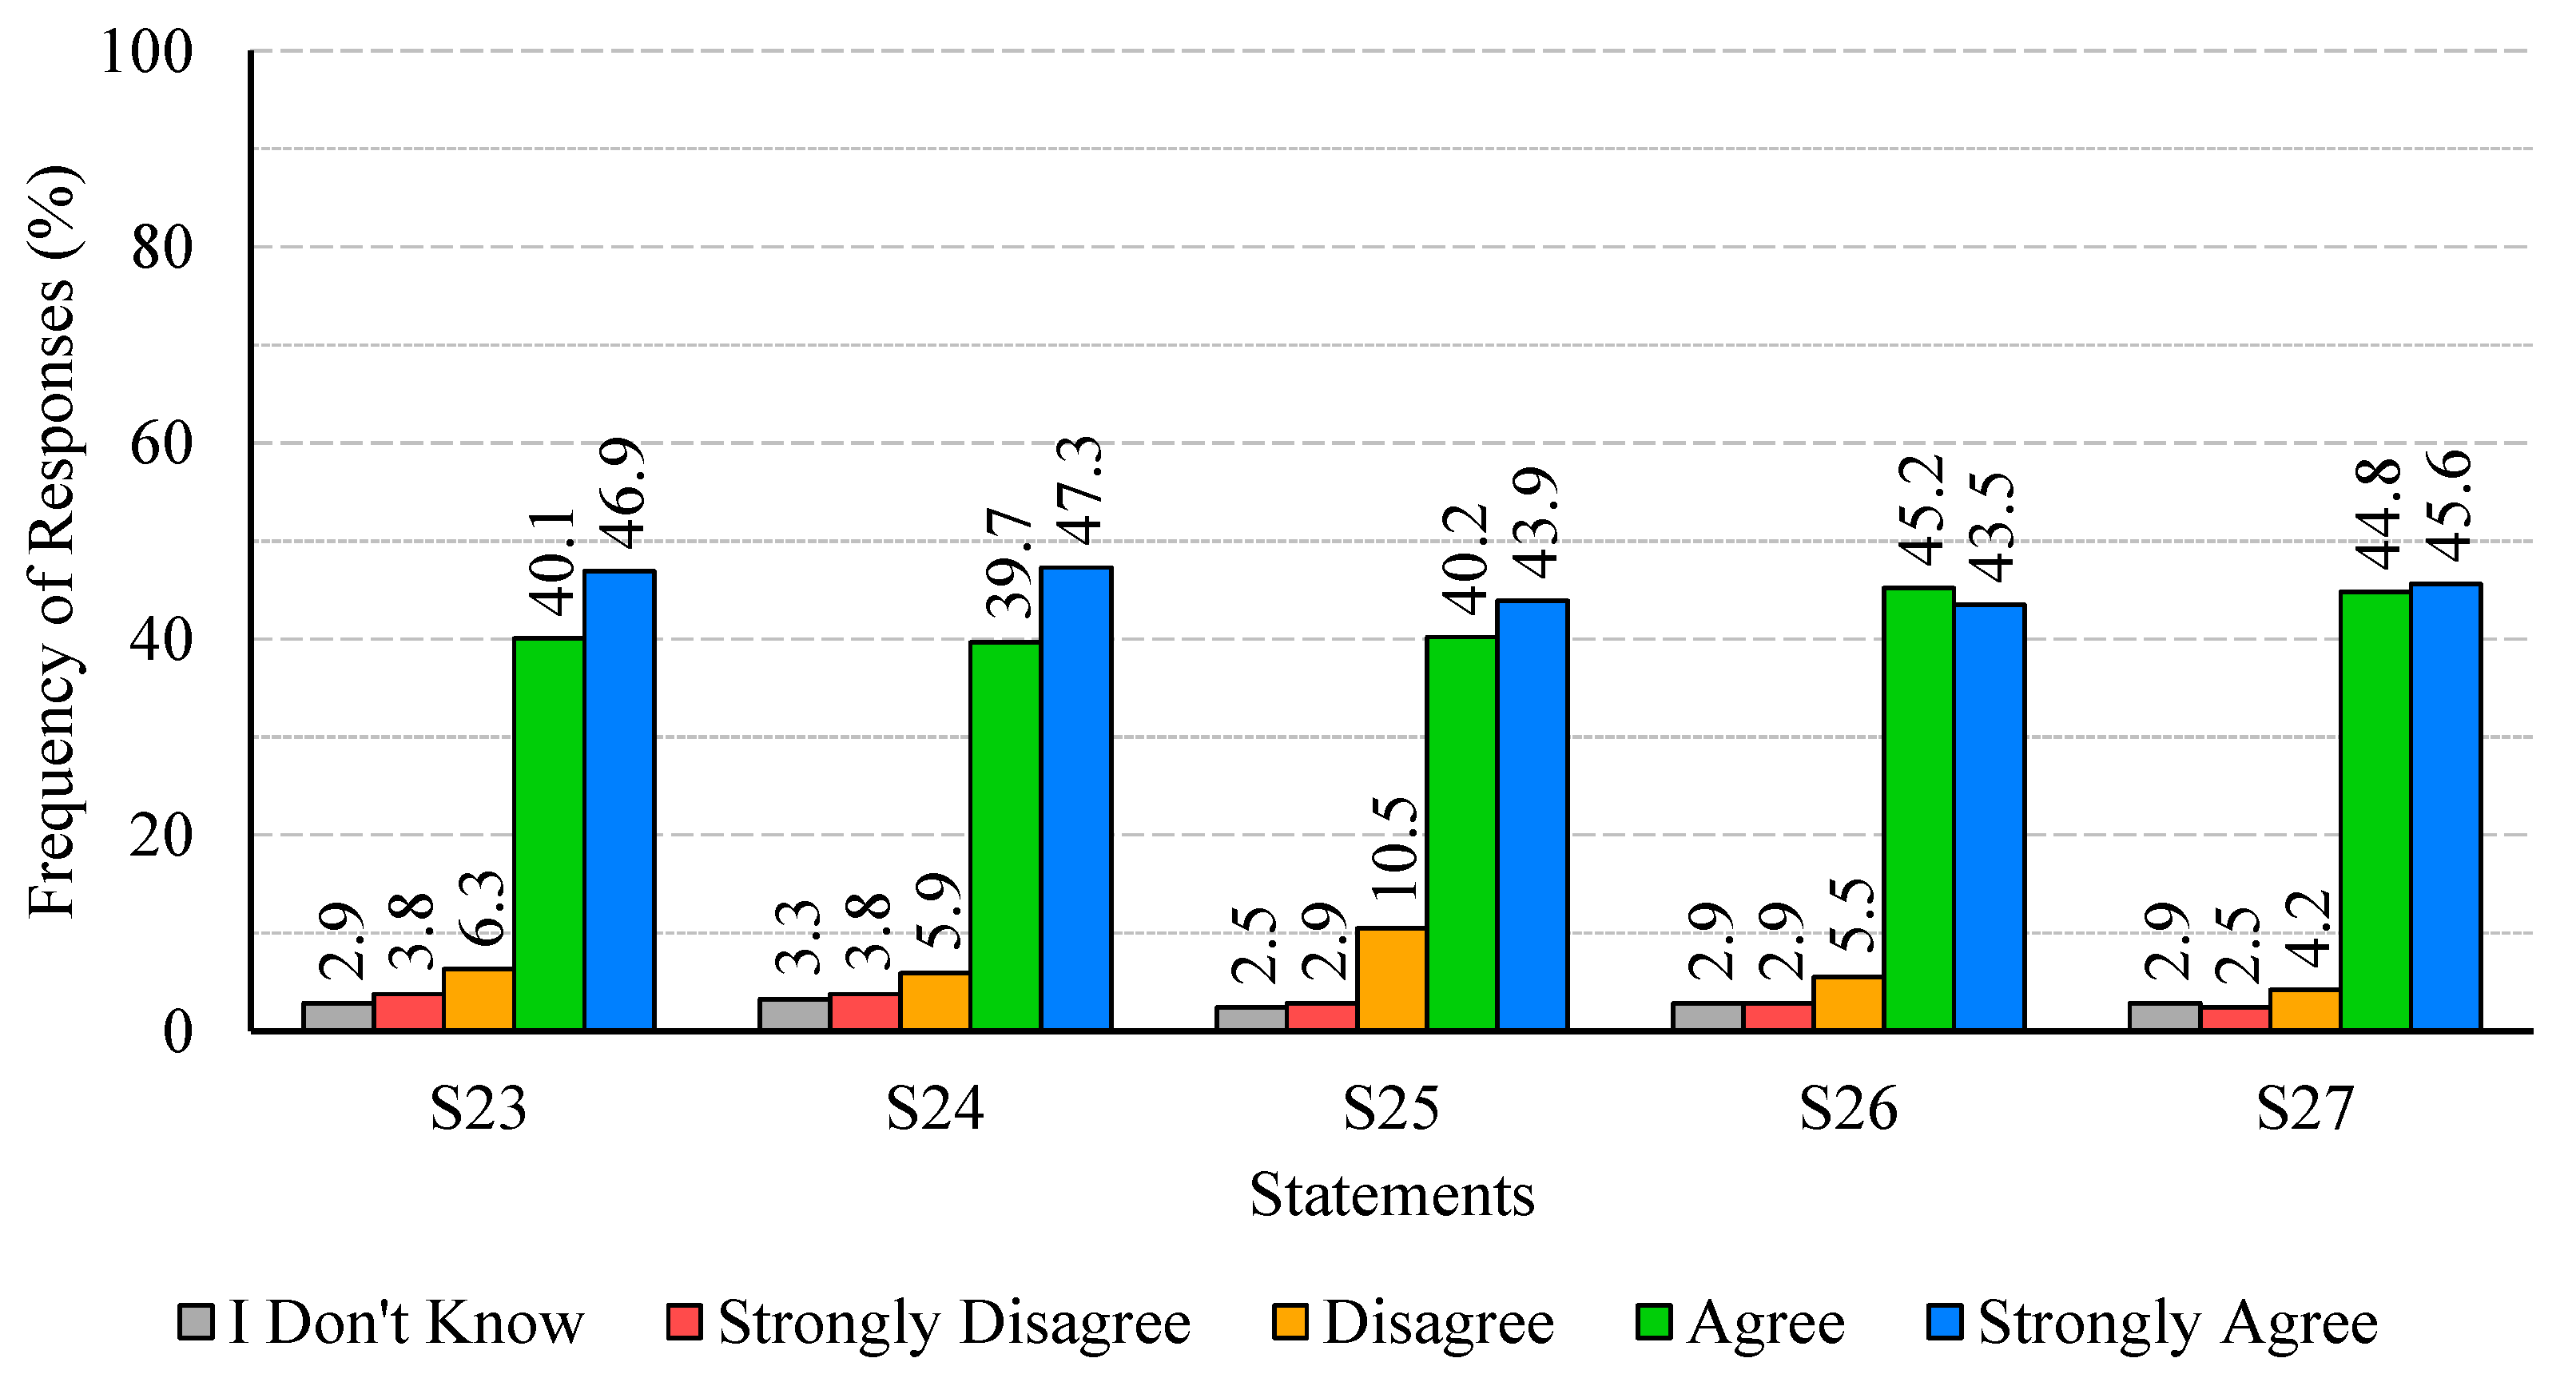
Figure 7 presents the percentage distribution of responses to statements S23–S27, reflecting participants’ opinions on public health impact and concern about Legionella exposure. The analysis shows a clear predominance of positive responses (strongly agree and agree), with low levels of disagreement and uncertainty. Positive responses were consistently high, ranging from 84.1% (S25, risk of exposure in specific environments) to 90.4% (S27, rapid detection of infections). Negative responses (disagree and strongly disagree) were relatively low, varying between 6.7% (S27) and 13.4% (S24, prevention of waterborne diseases). The percentage of participants who selected the option I don’t know was minimal, ranging from 2.5% (S25) to 3.3% (S24).

3.3. Influence of Socio-Demographic Factors on Participants’ Self-Assessed Literacy Regarding Legionella Infections

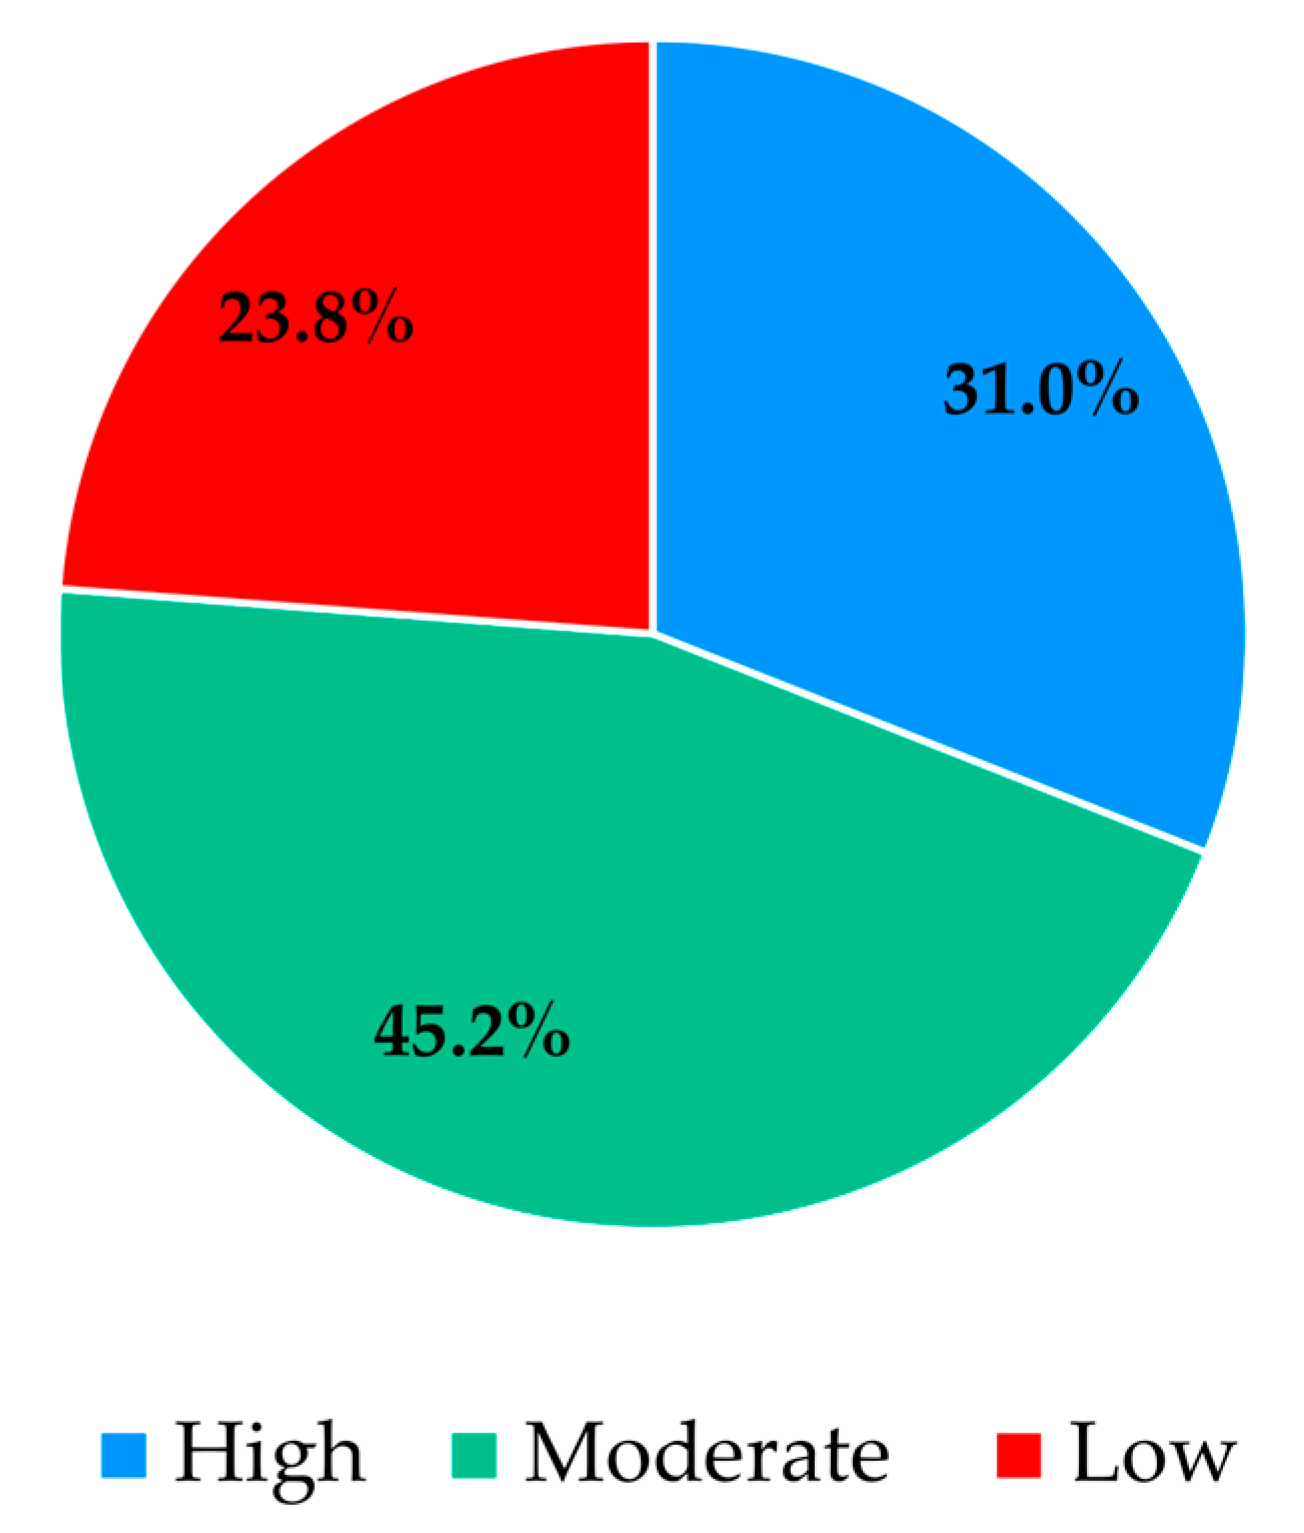
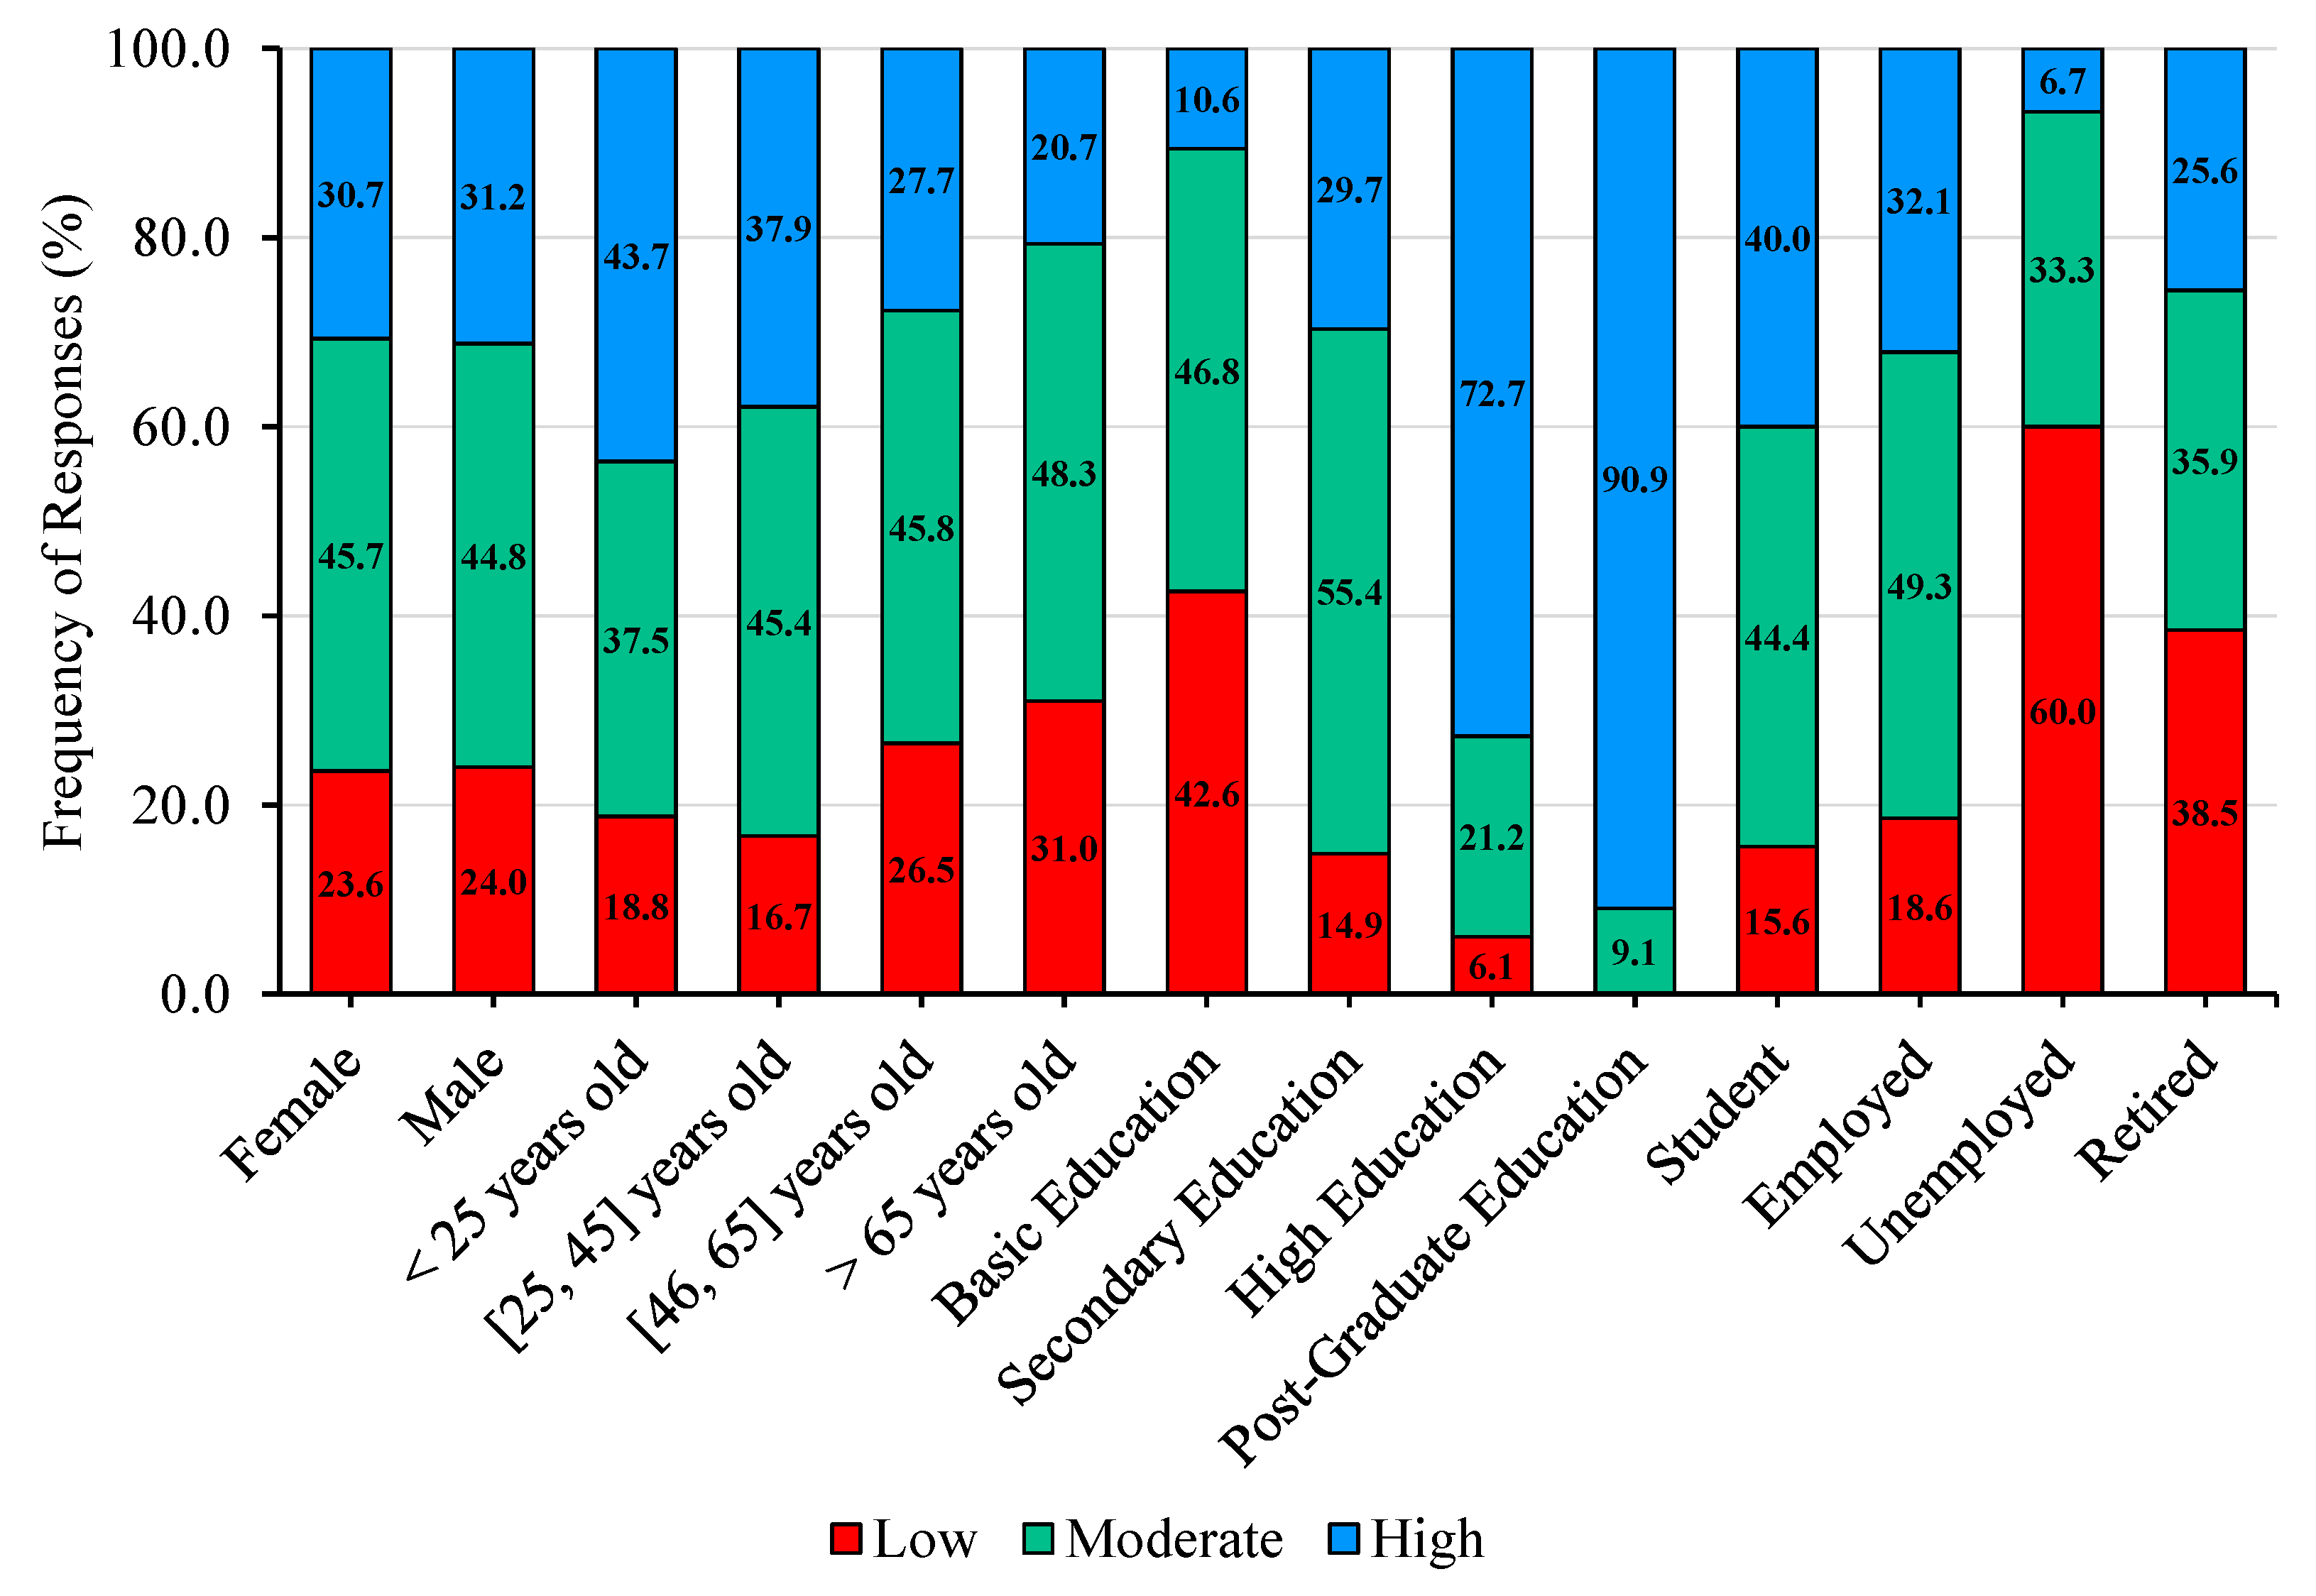
In the final section of the questionnaire, participants were asked to evaluate their own literacy regarding Legionella infections. Figure 8 presents the distribution of responses, revealing that 45.2% of participants rated their literacy as moderate, 31.0% as high, and 23.8% as low. To further explore these findings, the influence of socio-demographic factors on participants’ self-assessed literacy was examined by analyzing responses according to gender, age categories, educational attainment, and work status. The distribution of responses across these variables is shown in Figure 9 providing a comparison of literacy levels among different participant groups.
Analysis of Figure 9 indicates that gender-related differences were minimal, with variations in response percentages below 1%. Examination by age categories reveals that the percentage of participants reporting low literacy regarding Legionella infections differs by 14.3% (31.0% vs. 16.7%), by 10.8% (48.3% vs. 37.5%) for moderate literacy, and by 23.0% (43.7% vs. 20.7%) for high literacy. Analysis of responses by educational attainment shows that the percentage of participants reporting low literacy regarding Legionella infections differs by 42.6% (42.6% vs. 0%), by 37.7% (46.8% vs. 9.1%) for moderate literacy, and by 80.3% (90.9% vs. 10.6%) for high literacy. The data indicate a tendency for participants with lower educational attainment to report low or moderate literacy levels regarding Legionella infections, whereas those with higher qualifications are more likely to report high literacy. Analysis by work status shows that the percentage of participants reporting low literacy regarding Legionella infections differs by 44.4% (60.0% vs. 15.6%), by 16.0% (49.3% vs. 33.3%) for moderate literacy, and by 33.3% (40.0% vs. 6.7%) for high literacy.

3.4. Thermodynamic Framework for Processing Data

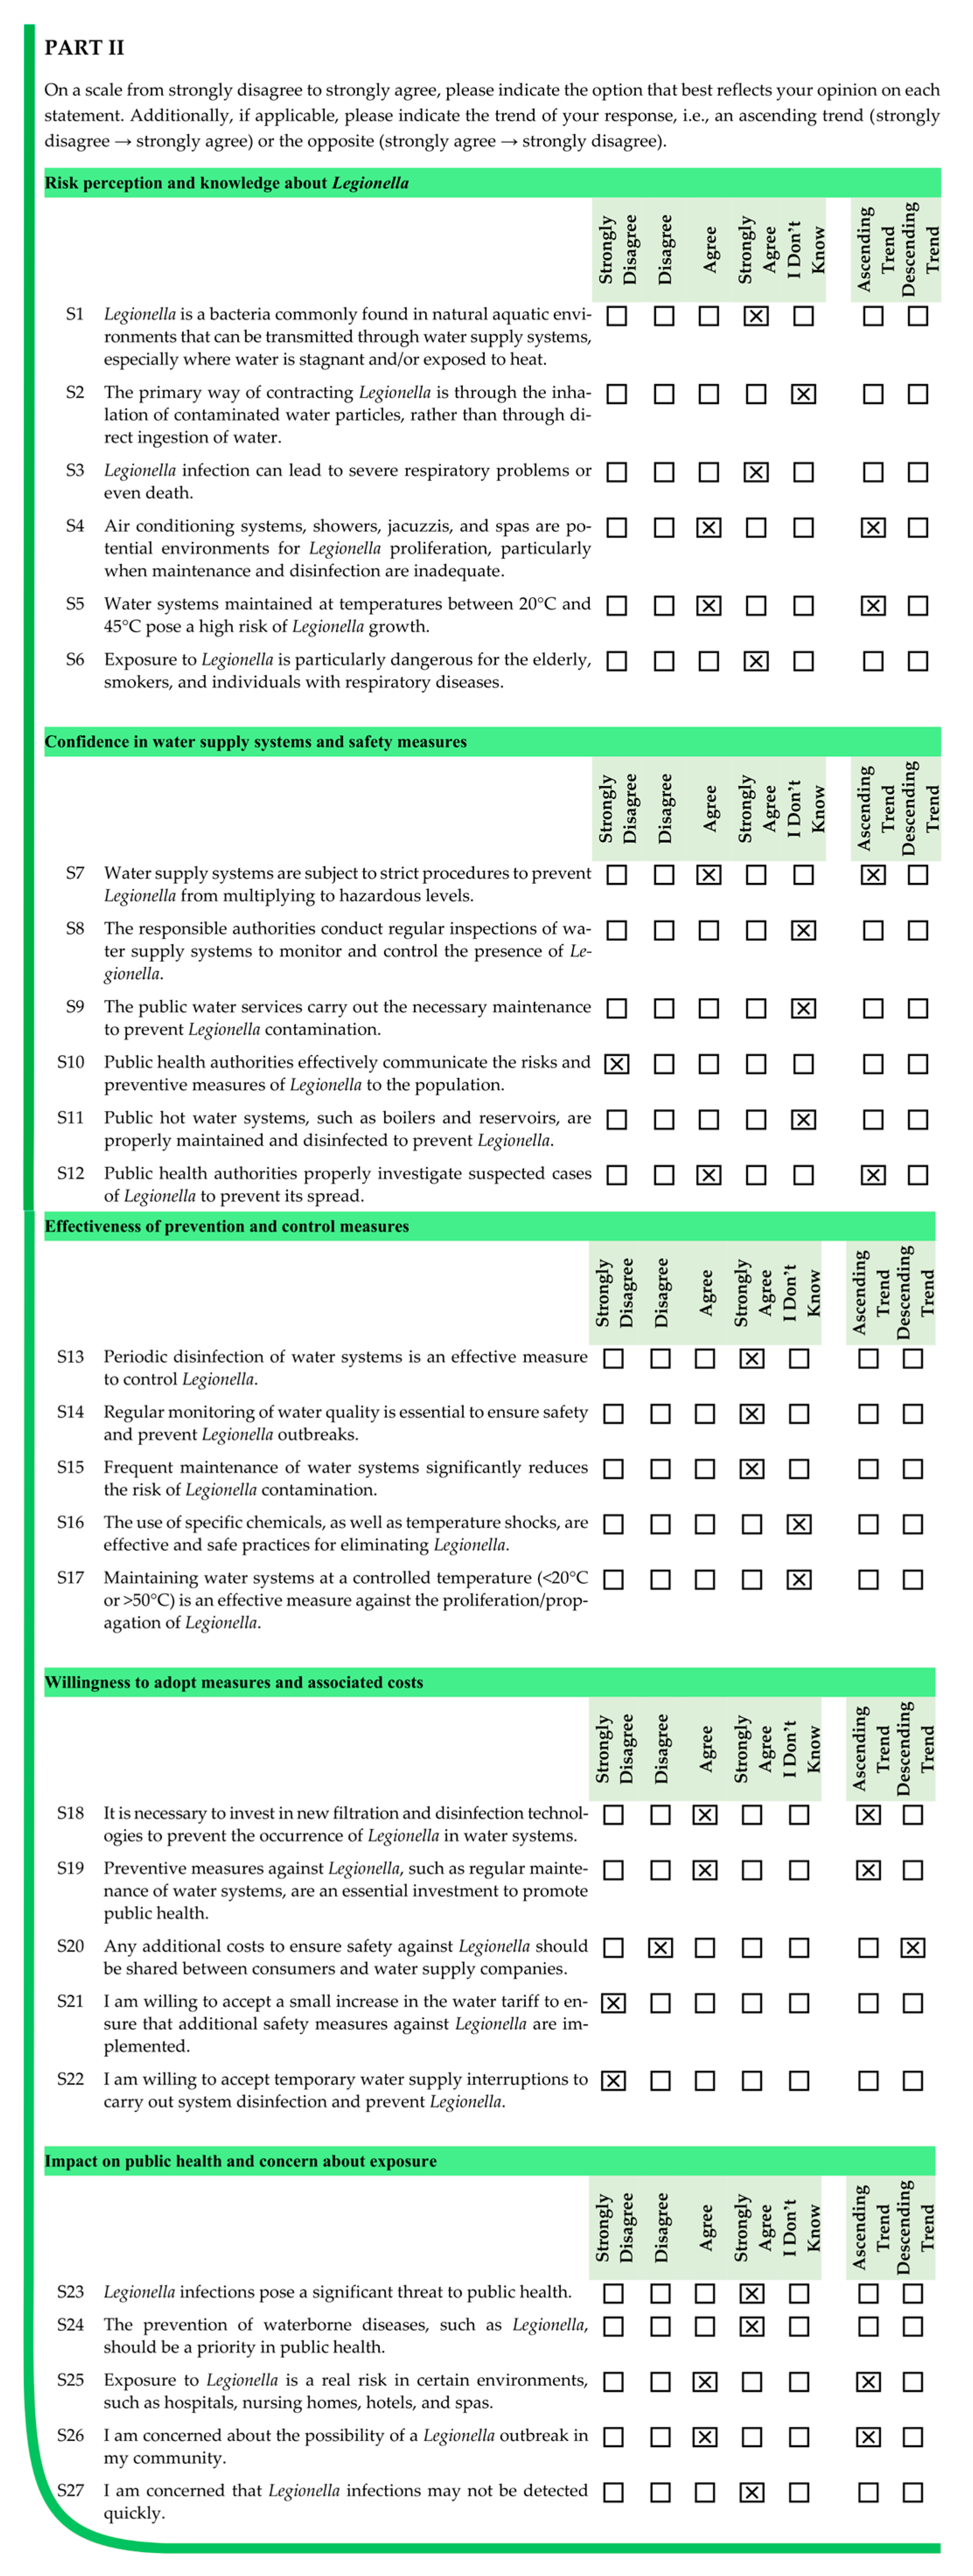
Figure 10 shows how participant one responded to the second part of the questionnaire, along with the trend in the evolution of their responses. To ensure a clear translation of qualitative responses into quantitative data, the risk perception and knowledge about Legionella domain (statements S1–S6) is presented in full detail for participant one. In statements S1, S3, and S6, the participant selected strongly agree. Despite no trends being indicated, the responses should be assessed on a descending scale, as they may remain stable or deteriorate over time (Table 3). In statement S2, the participant chose I don’t know (Figure 10), reflecting a vague situation in which all outcomes remain possible. In this case, the exact values of exergy, vagueness, and anergy cannot be assessed, yet they are assumed to fall within the range of 0 to 1. In statements S4 and S5, the participant selected agree and indicated a positive trend (Figure 10). Accordingly, the responses should be assessed using an ascending scale (Table 3), considering strongly agree as the best-case scenario (BCS) and agree as the worst-case scenario (WCS).
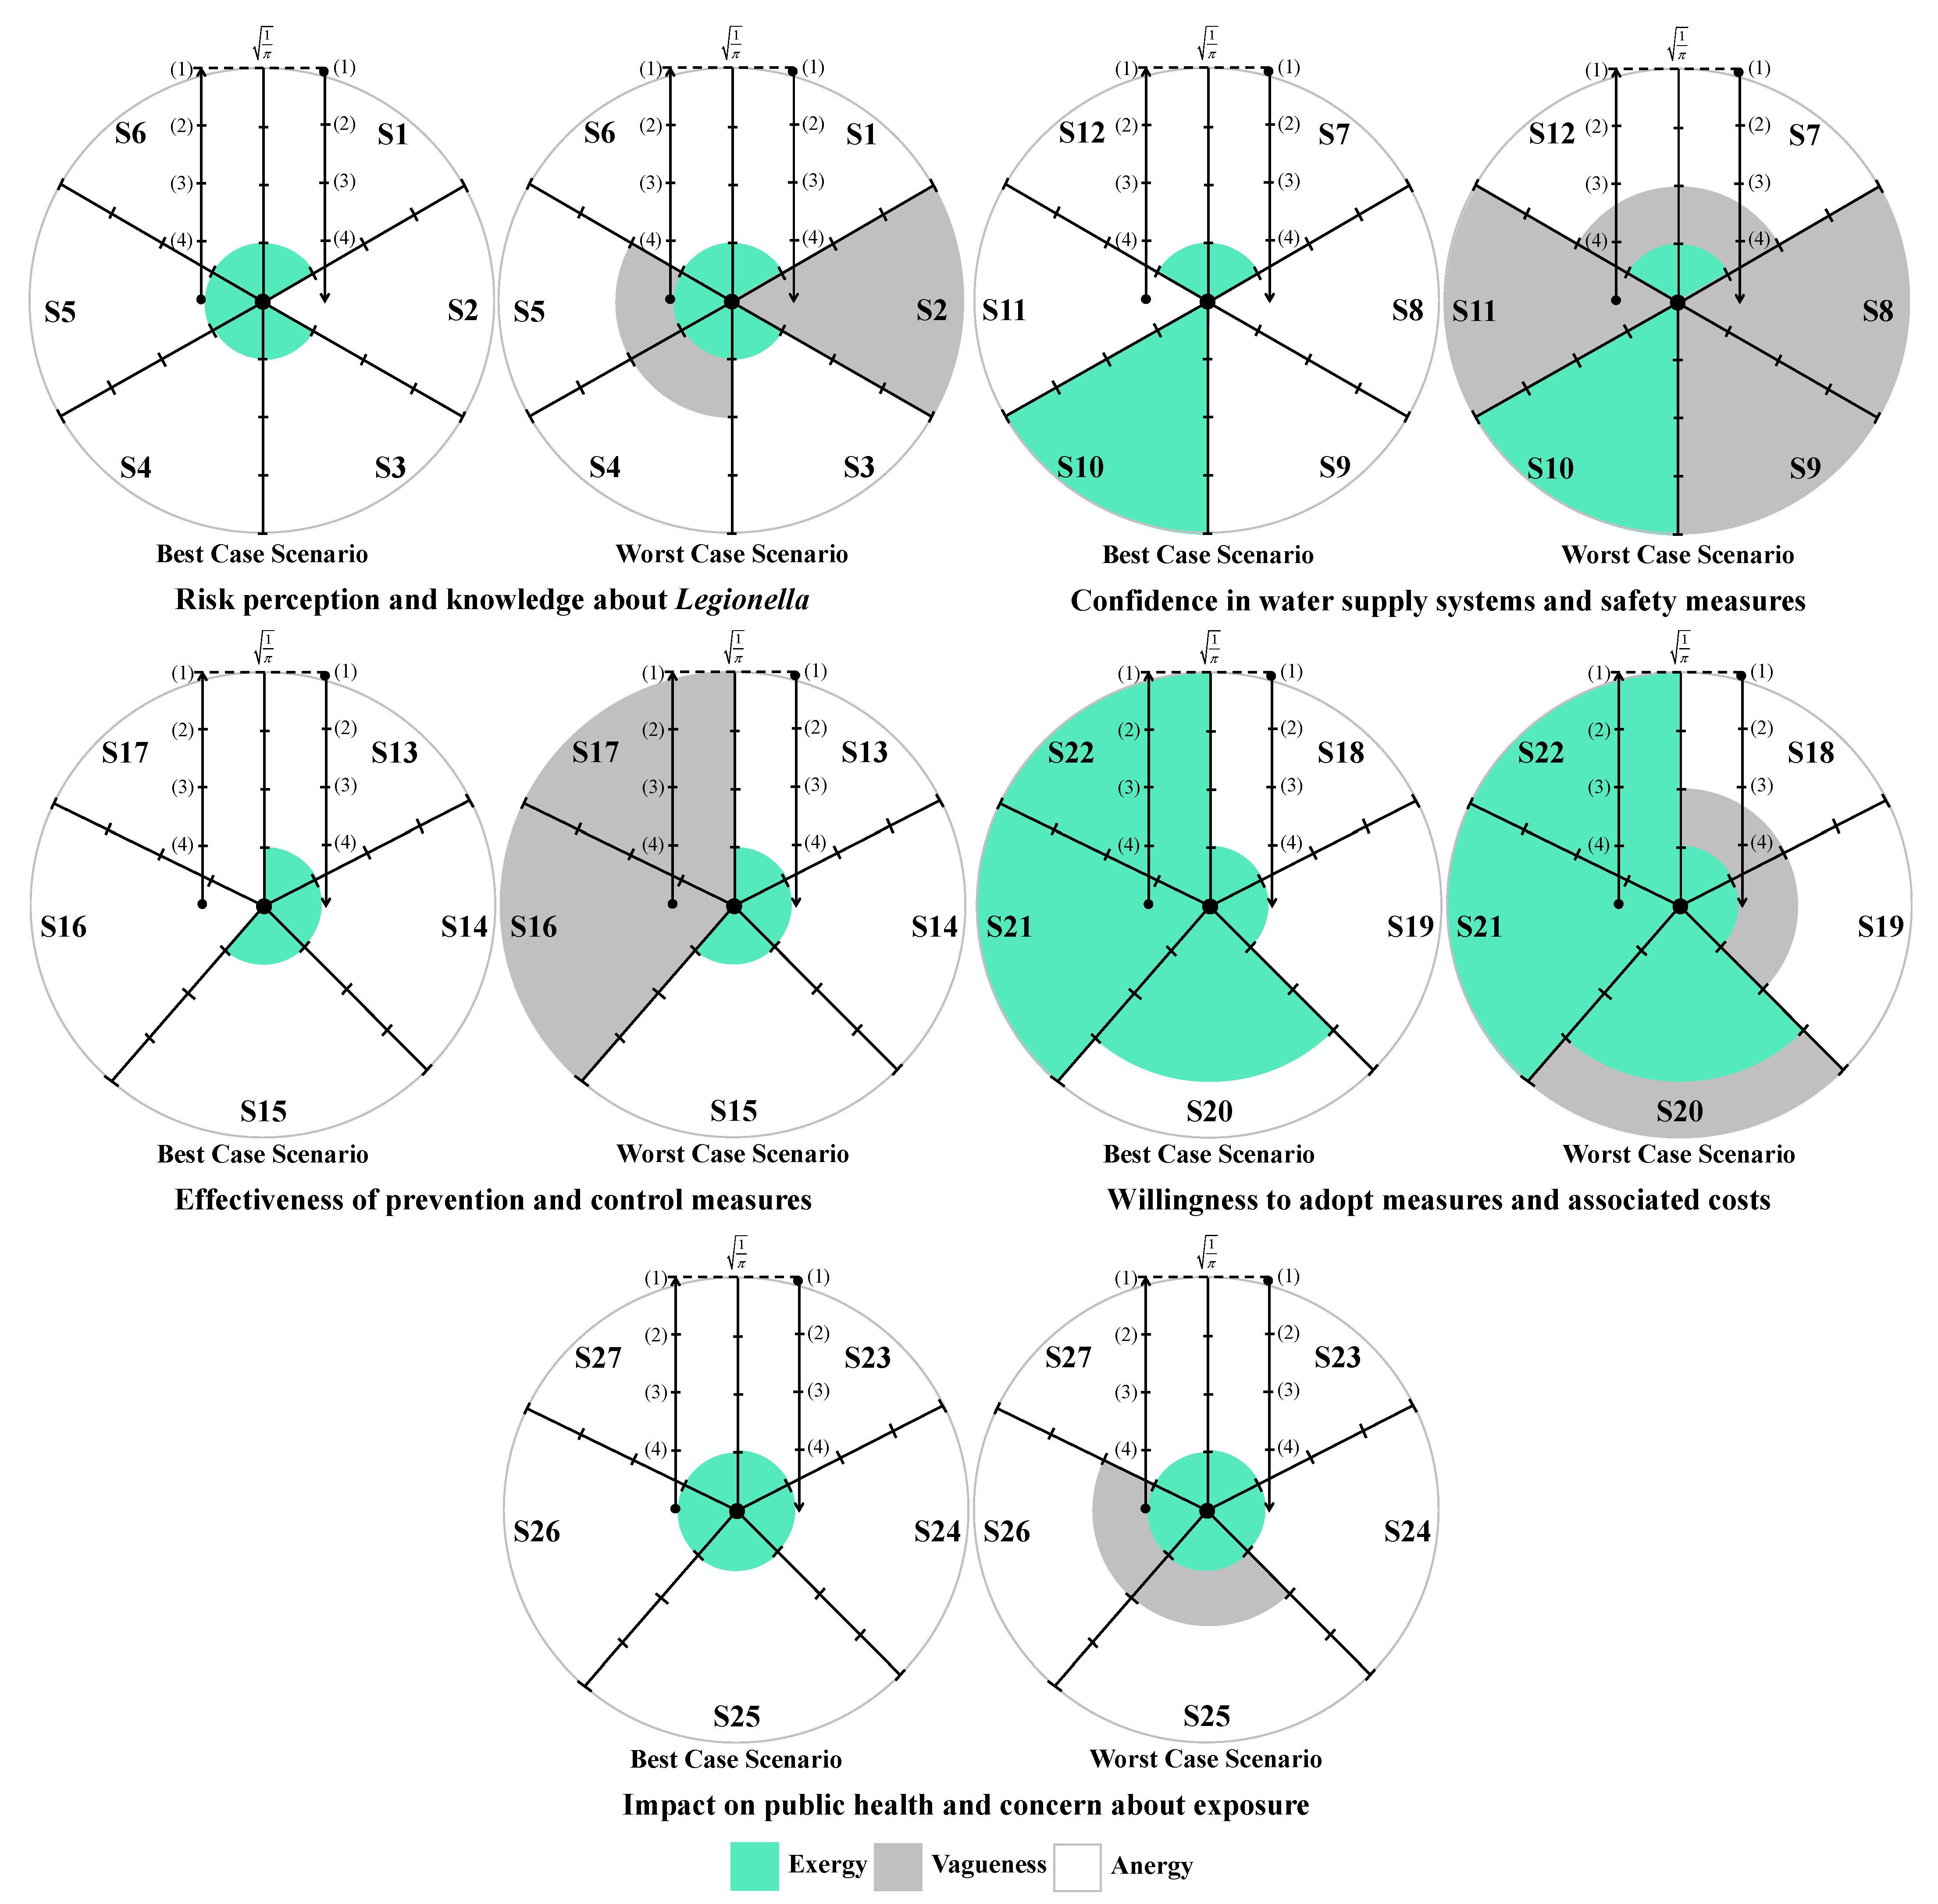
Figure 11 visually summarizes participant one’s responses to the second part of the questionnaire under both BCS and WCS, showing exergy in green (usable energy), vagueness in gray (uncertain energy states), and anergy in white (energy unavailable for work) [48,49,50]. Owing to the inherent symmetry of the seven-point Likert scale, the data may be interpreted in two directions. When examined from the left toward the midpoint, the responses indicate a decline in literacy regarding Legionella infections, whereas reading from the midpoint toward the right reflects an improvement in that literacy. In this context, the axis labels in Figure 11 should be interpreted as follows:
  • From bottom to top (progressing from the most favorable response, i.e., strongly agree, to the least favorable response, i.e., strongly disagree): this trend corresponds to an increasing entropic state;
  • From top to bottom (progressing from the least favorable response, i.e., strongly disagree, to the most favorable response, i.e., strongly agree): this trend corresponds to a decreasing entropic state.
In Figure 11, the colored sections correspond to concentric circular regions. The green zones indicate exergy, whereas the gray and white ring-shaped areas represent vagueness and anergy, respectively. Participant responses are mapped onto a radial axis normalized to 1 / π and partitioned into four equal segments, yielding radii of 1 4 1 π ,   2 4 1 π ,   3 4 1 π ,   4 4 1 π .
Table 4 and Table 5 present the assessment of the colored zones illustrated in Figure 11 for both BCS and WCS, considering the two scales, namely from strongly agree to strongly disagree and in the reverse direction. Thus, based on the responses and the trends indicated by participant one in the second part of the questionnaire on risk perception and knowledge about Legionella domain (Figure 10 and Table 3), one may have:
  • In the calculation of the exergy value (Equation (1)), r = 1 4 1 π , for all statements except in S2, where r = 0 .
  • In calculating the vagueness value (Equation (2)), r = R for the BCS, resulting in a vagueness value of zero, whereas for the WCS, both r and R are set to 1 4 1 π for statements S1, S3, and S6. For S2, r = 0 while R = 4 4 1 π . Finally, for S4 and S5, r = 1 4 1 π and R = 2 4 1 π .
  • In the calculation of anergy values (Equation (2)), R = 4 4 1 π in all cases. For the BCS, r corresponds to the most favorable response ( r = 1 4 1 π , for all statements except in S2, where r = 0 ), whereas for the WCS, r corresponds to the least favorable response, taking the values 1 4 1 π , for statements S1, S3, and S6, 4 4 1 π for S2, and 2 4 1 π for S4 and S5.
By reproducing the earlier calculations, it is possible to obtain the exergy, vagueness, and anergy values for the remaining domains across all participants. Table 6 presents the values for each domain included in the study with reference to participant one. As an illustration, the exergy corresponding to the risk perception and knowledge about Legionella domain in the BCS, measured on the scale from strongly agree (4) to strongly disagree (1), is obtained from the data provided in Table 4, as shown below:
e x e r g y 4 1 = e x e r g y 4 1 S 1 + e x e r g y 4 1 S 2 + e x e r g y 4 1 S 3 + e x e r g y 4 1 S 6 = 0.01 + 0 + 0.01 + 0.01 = 0.03
For the scale from strongly disagree (1) to strongly agree (4), it is:
e x e r g y 1 4 = e x e r g y 1 4 S 4 + e x e r g y 1 4 S 5 = 0.01 + 0.01 = 0.02
Using an identical procedure, energy-related values were obtained for all participants under the WCS. The outcomes for participant one, covering every domain included in the study, are summarized in Table 7.
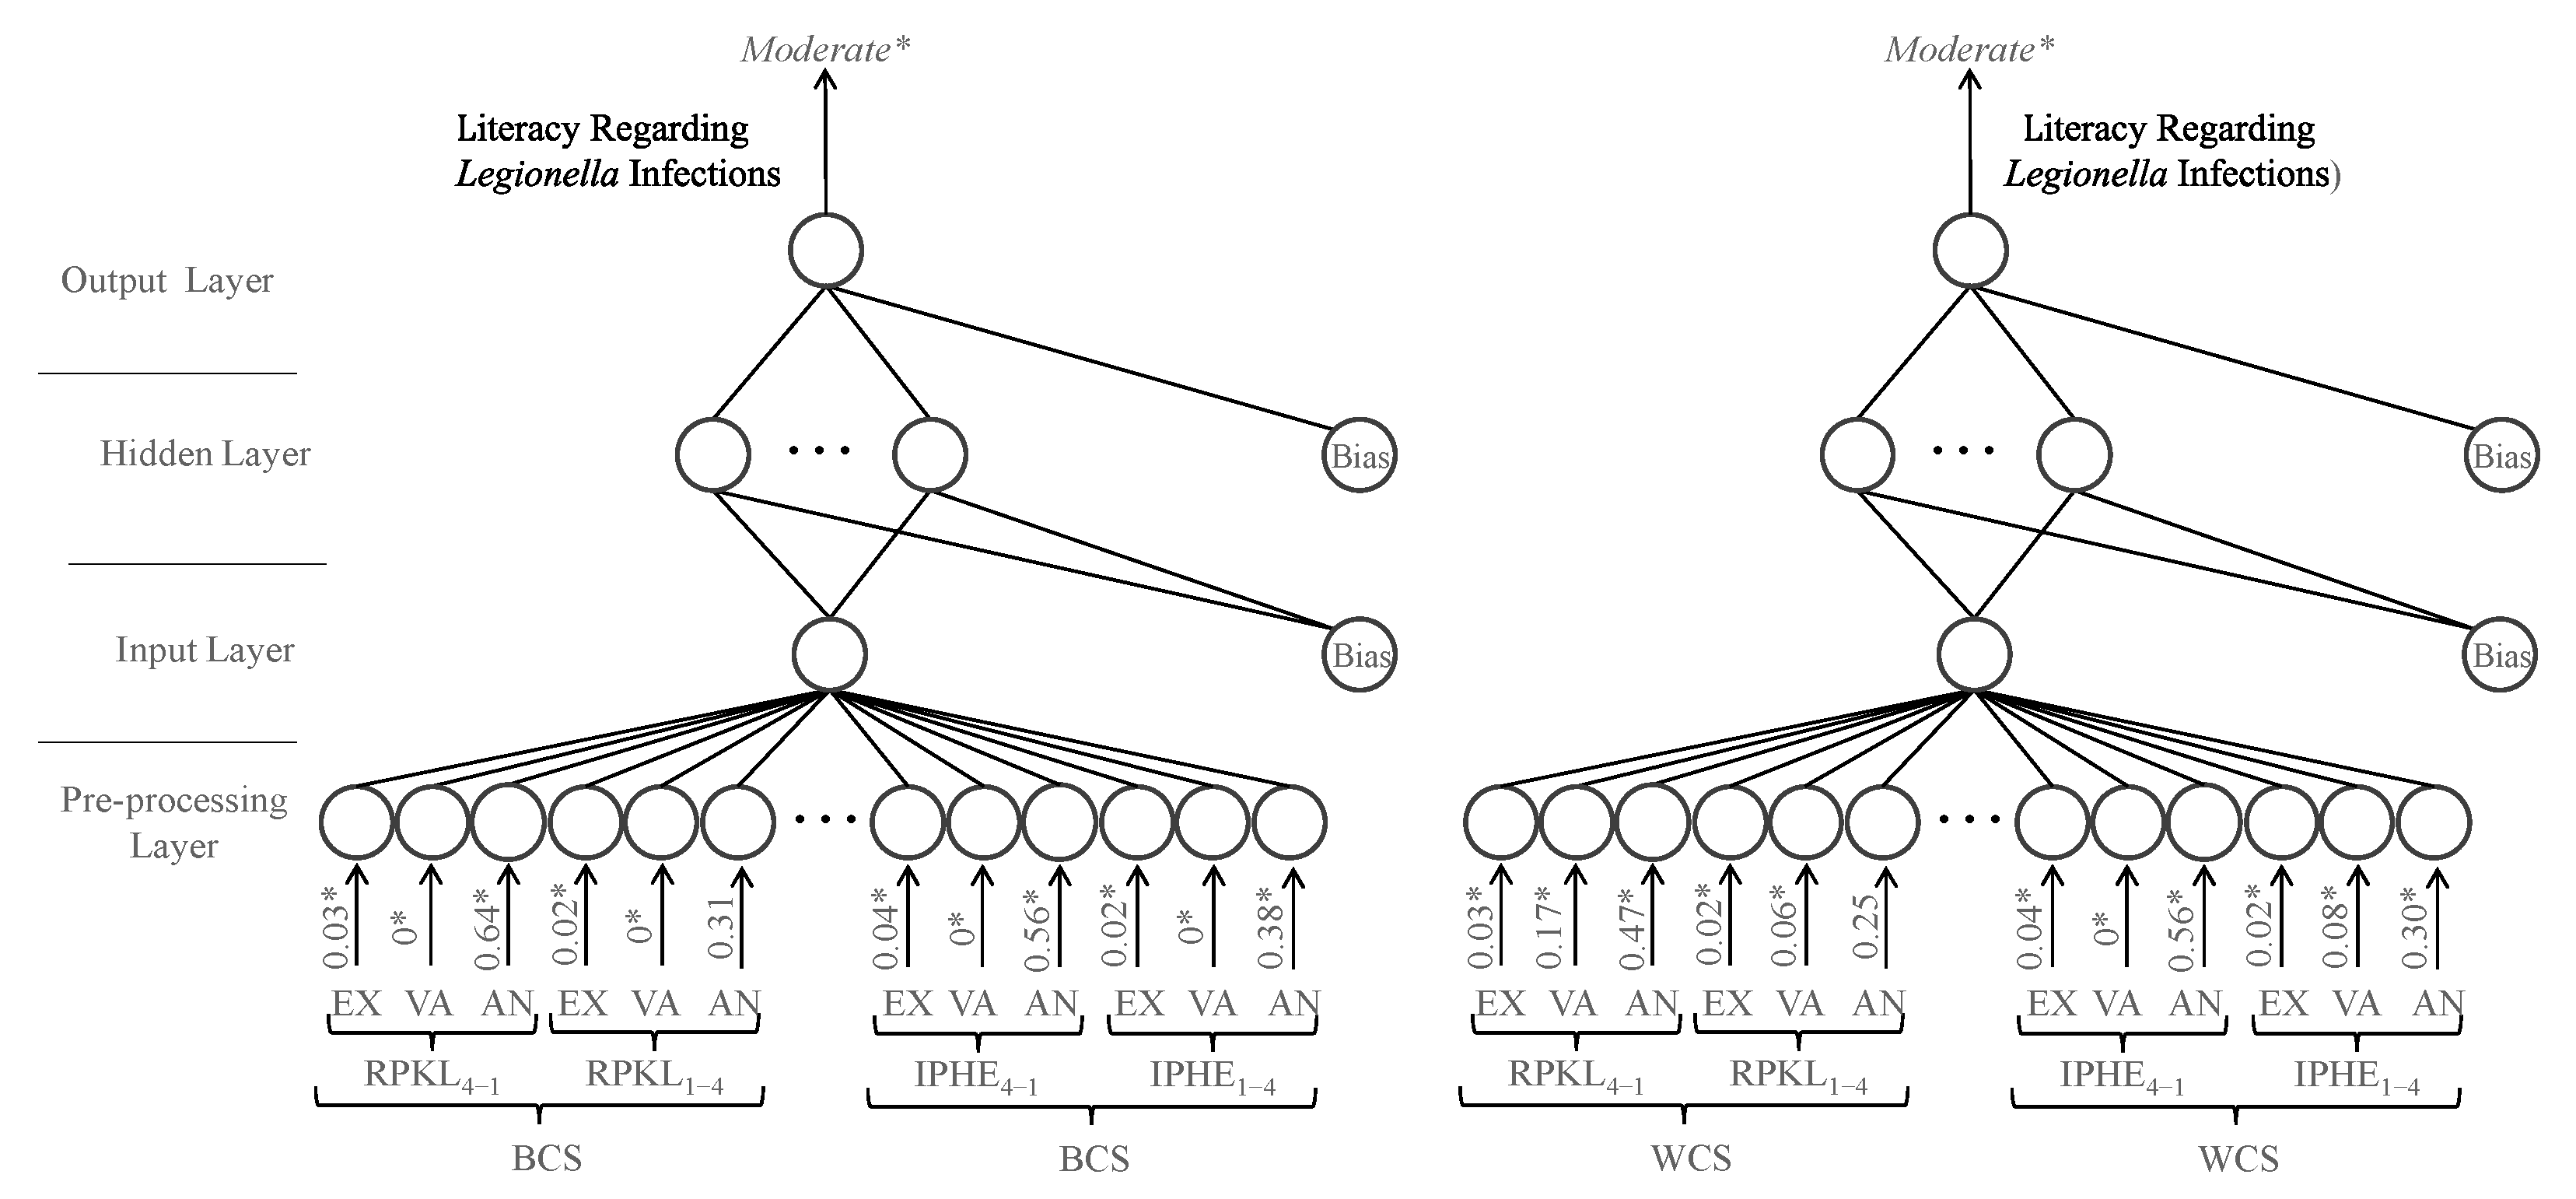
A dataset was created from the calculated values of different energy forms (i.e., exergy, vagueness, and anergy) across the five domains considered in the study for all participants in both BCS and WCS. This dataset was used to train ANNs aimed at predicting public literacy regarding Legionella infections (Figure 12). Model inputs were derived from the second part of the questionnaire, taking into account participants’ responses to each statement and the indicated trends. Outputs (participants’ literacy levels) were obtained from the third part. The ANNs’ performance were then evaluated using the confusion matrices summarized in Table 8.
Both the BCS- and WCS-based ANN models performed well. The BCS-based model correctly classified 147 of 160 training cases and 70 of 79 test cases, attaining accuracy levels of 91.9% and 88.6%, respectively. The WCS-based model achieved the same result in training (147 of 160) and slightly higher accuracy in testing, with 71 of 79 correct classifications (91.9% and 89.9%, respectively).
A column-based analysis of Table 8 provides insight into the model’s confidence in categorizing participants’ literacy on Legionella infections as low, moderate, or high. Considering the BCS, the model recognized 59 participants (24.7% of the sample) as having low literacy on Legionella infections, correctly classifying 50 (35 + 15) of them, with 9 (6 + 3) misassigned to the moderate literacy category. It also identified 112 participants (46.9% of the sample) as having moderate literacy on Legionella infections, correctly classifying 99 (68 + 31) of them, while 13 participants (2 + 5 + 1 + 5) were misassigned, 3 (2 + 1) to the low literacy category and 10 (5 + 5) to the high literacy category. Finally, the model recognized 68 participants (28.4% of the sample) as having high literacy on Legionella infections, all of whom were correctly classified. Accordingly, the model’s prediction confidence under the BCS, derived from a column-wise analysis of Table 8, was 85.4% (training) and 83.3% (testing) for low category, 90.7% (training) and 83.8% (testing) for moderate category, and 100% (both training and testing) for high category.
Considering the WCS, the model recognized 50 participants (20.9% of the sample) as having low literacy on Legionella infections, correctly classifying 49 (38 + 11) of them, with only a single participant misassigned to the moderate literacy category. It also identified 107 participants (44.8% of the sample) as having moderate literacy on Legionella infections, correctly classifying 97 (64 + 33) of them, with 10 participants (6 + 1 + 2 + 1) misassigned, 8 (6 + 2) to the low literacy category and 2 (1 + 1) to the high literacy category. Finally, the model recognized 82 participants (34.3% of the sample) as having high literacy on Legionella infections, correctly classifying 72 (45 + 27), with 10 (5 + 5) misassigned to the moderate literacy category. Consequently, the model’s prediction confidence under the WCS was 97.4% (training) and 100% (testing) for the low category, 90.1% (training) and 91.7% (testing) for the moderate category, and 90.0% (training) and 84.4% (testing) for the high category.
Despite both the BCS- and WCS-based ANN models effectively predicting participants’ literacy on Legionella infections, with accuracy levels close to 90%, the column-based analysis of the confusion matrices (Table 8) shows that the WCS-based model outperformed the BCS model by providing higher prediction confidence for the low and moderate categories, whereas the BCS-based model was superior in classifying participants in the high literacy category, achieving perfect accuracy in this group.
The ANNs models provide valuable insights into participants’ literacy regarding Legionella infections, serving as a practical tool to strengthen public health strategies. By predicting literacy levels across different socio-demographic groups and under multiple scenarios, the model enables health authorities to detect knowledge gaps within the population and to prioritize targeted interventions. Such predictive capability is particularly relevant for developing effective awareness campaigns, optimizing resource allocation, and improving communication between public health institutions and the community. Built on collected data, the model identifies key determinants influencing literacy levels, highlights critical disparities, and anticipates potential challenges in public understanding of Legionella risks. In doing so, it provides a robust foundation for evidence-based decision-making and supports proactive rather than reactive management. With continuous refinement and integration of updated information, the ANN model adapts to evolving public health needs, ultimately enhancing preparedness and fostering trust in the relationship between authorities and the public.

4. Discussion

The analysis of participants’ responses reveals a generally high level of risk perception and knowledge regarding Legionella infections, indicating awareness of the severity and potential health impacts of the disease. Despite this, critical gaps persist, particularly in understanding the main transmission pathways and the influence of temperature on bacterial growth. These gaps suggest that targeted educational interventions are needed to reinforce knowledge on key aspects of infection dynamics and environmental factors that facilitate bacterial proliferation. With regard to confidence in water supply systems and associated safety measures, responses were heterogeneous. While certain procedures, such as the investigation of suspected cases by authorities, were positively recognized, substantial disagreement and uncertainty were observed regarding risk communication and routine maintenance practices. This highlights the importance of not only maintaining safe infrastructure but also providing transparent and clear information to foster public trust and understanding. Regarding the perceived effectiveness of prevention and control measures, participants generally acknowledged disinfection, maintenance, and technological interventions, though some information gaps were observed. Clear explanations regarding the rationale and expected outcomes of these measures may support greater understanding and engagement. Participants’ willingness to adopt preventive measures involving financial costs or service disruptions was limited, despite recognition of the importance of controlling Legionella. Indeed, they show limited acceptance of financial burdens or service disruptions, which are often perceived as unfair or disproportionate. Moreover, the results indicate that participants place particular importance on investment in new technologies and on the regular maintenance of water supply systems, which are perceived as essential responsibilities of system operators. Technological improvements and maintenance may be associated with efficiency gains and enhanced safety, without causing immediate personal inconvenience. The results also show that participants feel more confident in rejecting cost- and disruption-related measures, while expressing greater uncertainty regarding the technical aspects of new technologies and maintenance practices. This pattern reflects a degree of lack of knowledge or unfamiliarity with preventive strategies, underscoring the need for clearer communication from responsible authorities to strengthen public understanding and acceptance of Legionella control measures. Finally, participants exhibited strong awareness of the broader public health impact of Legionella and concern regarding exposure risks. The predominance of positive responses reflects recognition of both the severity of the disease and the importance of timely detection in preventing outbreaks. Nevertheless, a minority of participants underestimated the public health implications or questioned the effectiveness of preventive measures, indicating areas where additional education or clarification could further strengthen understanding, particularly in relation to preventing waterborne diseases.
The study of the influence of socio-demographic factors on participants’ self-assessed literacy reveals a clear pattern, with the percentage of participants reporting high literacy decreasing with increasing age, while the percentage reporting low literacy generally increases across age categories. These results are consistent with the findings of Abu-Shakra [51], who reported in a study conducted in an urban community in North Carolina that age was a strong predictor of awareness, with significant differences across age groups in knowledge regarding the causes, prevention, treatment, and affected body systems of Legionella infections. Regarding educational attainment, the results suggest that participants with lower levels of education tend to report low or moderate literacy, whereas those with higher qualifications tend to report high literacy. This pattern contrasts with Abu-Shakra [51], who found that education had a limited effect on literacy, possibly reflecting contextual or methodological differences between the studies. Finaly, a pattern emerges in which the percentage of participants reporting high literacy decreases among the unemployed and retired, while the proportion reporting low literacy increases. Conversely, students and employed participants exhibit the opposite trend. Overall, the findings highlight variations in self-assessed literacy according to socio-demographic factors, including age, educational attainment, and work status, suggesting that life experience, educational background, and professional engagement play a role in shaping participants’ knowledge about Legionella infections.

5. Conclusions

This study examined the level of public health literacy regarding Legionella infections in Portugal and identified specific areas requiring further improvement. The findings indicate that the Portuguese population demonstrates a generally satisfactory level of literacy, reflected in a solid understanding of the disease’s severity, its public health relevance, and the importance of preventive and control measures. However, the results also reveal important gaps in knowledge concerning the main transmission pathways, the influence of temperature on bacterial proliferation, and the technical aspects of prevention and maintenance practices. Addressing these shortcomings is essential to strengthen community capacity for risk reduction and early detection. These insights highlight the need to enhance educational and communication initiatives on Legionella prevention. Partnerships among governmental authorities, academia, and non-governmental organizations are encouraged to develop targeted interventions, particularly for older and less-educated groups, who exhibited lower literacy levels. The inclusion of Legionella awareness topics within public health education programs, especially at the primary and secondary school levels, could further promote long-term behavioral change and risk mitigation. Future research should include larger and more diverse samples to improve representativeness and examine literacy dynamics over time. Mixed-method and longitudinal approaches are recommended to provide deeper understanding of attitudes and motivations related to Legionella prevention and control.

Author Contributions

Conceptualization, S.D., M.M.P., M.F. and H.V.; methodology, S.D., M.M.P., M.F. and H.V.; software, M.F. and H.V.; validation, S.D., M.M.P., M.F. and H.V.; formal analysis, S.D., M.F. and H.V.; investigation, S.D. and M.M.P.; writing—original draft preparation, S.D.; writing—review and editing, S.D., M.M.P., M.F. and H.V.; visualization, M.F. and H.V. All authors have read and agreed to the published version of the manuscript.

Funding

This research was funded by PT national funds (FCT/MCTES, Fundação para a Ciência e Tecnologia and Ministério da Ciência, Tecnologia e Ensino Superior) through the projects UIDB/50006/2020 and UIDP/50006/2020.

Institutional Review Board Statement

The study was conducted in accordance with the Declaration of Helsinki, and approved by the Ethics Committee of University of Évora (protocol code 24105 on 18 February 2025).

Informed Consent Statement

Informed consent was obtained from all subjects involved in the study.

Data Availability Statement

The original contributions presented in the study are included in the article, further inquiries can be directed to the corresponding author.

Conflicts of Interest

The authors declare no conflicts of interest.

Abbreviations

The following abbreviations are used in this manuscript:
ANNsArtificial neural networks
BCSBest-case scenario
CFUColony-forming units
DGSPortuguese directorate-general of health
DNADeoxyribonucleic acid
ECDCEuropean center for disease prevention and control
ELDSNetEuropean legionnaires’ disease surveillance network
EWGLINetEuropean working group for Legionella infections network
GUGenomic units
INSANational institute of health Doutor Ricardo Jorge
MPNMost probable number
RT-qPCRReverse transcription quantitative polymerase chain reaction
UVUltraviolet
WCSWorst-case scenario
WEKAWaikato environment for knowledge analysis
WHOWorld health organization

References

  1. Cunha, B.A.; Burillo, A.; Bouza, E. Legionnaires’ disease. Lancet 2016, 387, 376–385. [Google Scholar] [CrossRef]
  2. Mnisi, Z.F.; Delair, Z.; Singh, A. Legionella in Urban and Rural Water, a Tale of Two Environments. Water 2025, 17, 1491. [Google Scholar] [CrossRef]
  3. Yao, X.H.; Shen, F.; Hao, J.; Huang, L.; Keng, B. A Review of Legionella Transmission Risk in Built Environments: Sources, Regulations, Sampling, and Detection. Front. Public Health 2024, 12, 1415157. [Google Scholar] [CrossRef]
  4. Bonetta, S.; Bonetta, S. Editorial Comments to the Special Issue: “Legionella Contamination in Water Environment”. Pathogens 2020, 9, 1017. [Google Scholar] [CrossRef]
  5. Nisar, M.A.; Ross, K.E.; Brown, M.H.; Bentham, R.; Whiley, H. Legionella pneumophila and Protozoan Hosts: Implications for the Control of Hospital and Potable Water Systems. Pathogens 2020, 9, 286. [Google Scholar] [CrossRef]
  6. Fields, B.S.; Benson, R.F.; Besser, R.E. Legionella and Legionnaires’ disease: 25 years of investigation. Clin. Microbiol. Rev. 2002, 15, 506–526. [Google Scholar] [CrossRef]
  7. Allison, D.G. The biofilm matrix. Biofouling 2003, 19, 139–150. [Google Scholar] [CrossRef]
  8. Ridgway, H.F.; Olson, B.H. Chlorine resistance patterns of bacteria from two drinking water distribution systems. Appl. Environ. Microbiol. 1982, 44, 972–987. [Google Scholar] [CrossRef] [PubMed]
  9. Miyashita, N.; Higa, F.; Aoki, Y.; Kikuchi, T.; Seki, M.; Tateda, K.; Maki, N.; Uchino, K.; Ogasawara, K.; Kiyota, H.; et al. Distribution of Legionella species and serogroups in patients with culture-confirmed Legionella pneumonia. J. Infect. Chemother. 2020, 26, 411–417. [Google Scholar] [CrossRef] [PubMed]
  10. Newton, H.J.; Ang, D.K.Y.; van Driel, I.R.; Hartland, E.L. Molecular Pathogenesis of Infections Caused by Legionella pneumophila. Clin. Microbiol. Rev. 2010, 23, 274–298. [Google Scholar] [CrossRef] [PubMed]
  11. Jomehzadeh, N.; Moosavian, M.; Saki, M.; Rashno, M. Legionella and legionnaires’ disease: An overview. J. Acute Dis. 2019, 8, 221–232. [Google Scholar] [CrossRef]
  12. Oliva, G.; Sahr, T.; Buchrieser, C. The Life Cycle of L. pneumophila: Cellular Differentiation Is Linked to Virulence and Metabolism. Front. Cell. Infect. Microbiol. 2018, 8, 3. [Google Scholar] [CrossRef] [PubMed]
  13. Khweek, A.A.; Amer, A.O. Factors mediating environmental biofilm formation by Legionella pneumophila. Front. Cell. Infect. Microbiol. 2018, 8, 38. [Google Scholar] [CrossRef]
  14. Khweek, A.A.; Amer, A.O. Replication of Legionella pneumophila in human cells: Why are we susceptible? Front. Microbiol. 2010, 1, 133. [Google Scholar] [CrossRef]
  15. European Centre for Disease Prevention and Control. Factsheet About Legionnaires’ Disease. 2017. Available online: https://www.ecdc.europa.eu/en/legionnaires-disease/facts (accessed on 30 April 2025).
  16. Püle, D. Conventional and Alternative Disinfection Methods of Legionella in Water Distribution Systems—Review. Constr. Sci. 2016, 19, 21–26. [Google Scholar] [CrossRef]
  17. Rodrigues, V. Health literacy. Rev. Port. Cardiol. (Engl. Ed.) 2018, 37, 679–680. [Google Scholar] [CrossRef]
  18. ISO 11731:2017; Water Quality—Enumeration of Legionella. International Organization for Standardization: Geneva, Switzerland, 2017.
  19. ISO/TS 12869:2019; Water Quality—Detection and Quantification of Legionella spp. and/or Legionella pneumophila by Concentration and Genic Amplification by Quantitative Polymerase Chain Reaction (qPCR). International Organization for Standardization: Geneva, Switzerland, 2019.
  20. Niu, C.; Zhang, Y.; Zhang, Y. Evaluation of a Most Probable Number Method for Detection and Quantification of Legionella pneumophila. Pathogens 2022, 11, 789. [Google Scholar] [CrossRef]
  21. European Centre for Disease Prevention and Control. Legionnaires’ Disease—Annual Epidemiological Report for 2021; European Centre for Disease Prevention and Control: Stockholm, Sweden, 2023. [Google Scholar]
  22. George, F.; Shivaji, T.; Pinto, C.S.; Serra, L.A.O.; Valente, J.; Albuquerque, M.J.; Vicêncio, P.C.O.; San-Bento, A.; Diegues, P.; Nogueira, P.J.; et al. A large outbreak of Legionnaires’ Disease in an industrial town in Portugal. Rev. Port. Saúde Pública 2016, 34, 199–208. [Google Scholar] [CrossRef]
  23. Portuguese Directorate-General of Health. Legionnaires’ Disease in the Municipality of Maia. Press Release No. C129_01_v3. 2017. Available online: https://www.dgs.pt/a-direccao-geral-da-saude/comunicados-e-despachos-do-director-geral/atualizacao-doenca-dos-legionarios-no-concelho-da-maia2.aspx (accessed on 30 April 2025).
  24. Portuguese Directorate-General of Health. Legionnaires’ Disease in the Municipality of Maia. Press Release No. C129_01_v4. 2017. Available online: https://www.dgs.pt/a-direccao-geral-da-saude/comunicados-e-despachos-do-director-geral/atualizacao-doenca-dos-legionarios-no-concelho-da-maia6.aspx (accessed on 30 April 2025).
  25. Portuguese Directorate-General of Health. Legionnaires’ Disease at São Francisco Xavier Hospital. Press Release No. C142_07_v1. 2017. Available online: https://www.dgs.pt/a-direccao-geral-da-saude/comunicados-e-despachos-do-director-geral/doenca-dos-legionarios-no-hospital-sao-francisco-xavier-pdf10.aspx (accessed on 30 April 2025).
  26. Portuguese Directorate-General of Health. End of the Legionnaires’ Disease Outbreak at CUF Descobertas Hospital. Press Release No. C144_07_v1. 2018. Available online: https://www.dgs.pt/a-direccao-geral-da-saude/comunicados-e-despachos-do-director-geral/fim-do-surto-de-doenca-dos-legionarios-no-hospital-cuf-descobertas-pdf.aspx (accessed on 30 April 2025).
  27. Lopes, F.; Araújo, R. Why has a large Legionnaires’ disease outbreak been absent from public debate? Interface 2017, 21, 957–967. [Google Scholar] [CrossRef]
  28. Lopes, F.; Araújo, R. Power to health reporters: Health literacy as a tool to avoid pressures from news sources. Port. J. Public Health 2018, 35, 193–201. [Google Scholar] [CrossRef]
  29. Jin, Y.; Austin, L.; Vijaykumar, S.; Jun, H.; Nowak, G. Communicating about infectious disease threats: Insights from public health information officers. Public Relat. Rev. 2019, 45, 167–177. [Google Scholar] [CrossRef]
  30. van der Heide, I.; Wang, J.; Droomers, M.; Spreeuwenberg, P.; Rademakers, J.; Uiters, E. The relationship between health, education, and health literacy: Results from the Dutch Adult Literacy and Life Skills Survey. J. Health Commun. 2013, 18 (Suppl. 1), 172–184. [Google Scholar] [CrossRef]
  31. Arriaga, M.T.; Santos, B.; Leiras, G.; Carvalho, A.; Pinto, A.L.; Raposo, B.; Mata, F.; Monterrozo, M.; Leão, R.; Justo, A.; et al. National Health and Behavioral Sciences Literacy Plan 2023–2030—Strategic Plan; Portuguese Directorate-General of Health: Lisbon, Portugal, 2023. [Google Scholar]
  32. Fernandes, A.; Vicente, H.; Figueiredo, M.; Neves, M.; Neves, J. An evaluative model to assess the organizational efficiency in training corporations. In Future Data and Security Engineering; Lecture Notes in Computer Science; Dang, T., Wagner, R., Küng, J., Thoai, N., Takizawa, M., Neuhold, E., Eds.; Springer: Cham, Switzerland, 2016; Volume 10018, pp. 415–428. [Google Scholar] [CrossRef]
  33. Instituto Nacional de Estatística (INE). Statistical Yearbook of Portugal—2024; INE: Lisbon, Portugal, 2025; Available online: https://www.ine.pt/ngt_server/attachfileu.jsp?look_parentBoui=738814446&att_display=n&att_download=y (accessed on 30 April 2025).
  34. Peel, M.C.; Finlayson, B.L.; McMahon, T.A. Updated world map of the Köppen–Geiger climate classification. Hydrol. Earth Syst. Sci. 2007, 11, 1633–1644. [Google Scholar] [CrossRef]
  35. The Portuguese Institute for Sea and Atmosphere (IPMA). Climate of Portugal: General Characteristics and Regional Variability; IPMA: Lisbon, Portugal, 2021; Available online: https://www.ipma.pt/en/oclima/clima.pt/ (accessed on 5 October 2025).
  36. PORDATA—The Database of Contemporary Portugal. Available online: https://www.pordata.pt/pt (accessed on 30 April 2025).
  37. Cohen, L.; Manion, L.; Morrison, K. Research Methods in Education, 8th ed.; Routledge: New York, NY, USA, 2017. [Google Scholar]
  38. DeKetele, J.-M.; Roegiers, X. Méthodologie du Recueil d’Informations: Fondements des Méthodes d’Observation, de Questionnaire, d’Interview et d’Études de Documents, 5th ed.; DeBoeck Universite: Paris, France, 2016. [Google Scholar]
  39. Patton, M.Q. Qualitative Research and Evaluation Methods: Integrating Theory and Practice, 4th ed.; SAGE Publications Inc: Thousand Oaks, CA, USA, 2015. [Google Scholar]
  40. McMillan, J.; Schumacher, S. Research in Education: Evidence-Based Inquiry, 7th ed.; Prentice Hall: New York, NY, USA, 2009. [Google Scholar]
  41. Bell, J. Doing Your Research Project: A Guide for First-Time Researchers in Education, Health and Social Science, 5th ed.; Open University Press: Maidenhead, UK, 2010. [Google Scholar]
  42. Wenterodt, T.; Herwig, H. The Entropic Potential Concept: A New Way to Look at Energy Transfer Operations. Entropy 2014, 16, 2071–2084. [Google Scholar] [CrossRef]
  43. Frank, E.; Hall, M.; Witten, I.H.; The WEKA Workbench. Online Appendix for “Data Mining: Practical Machine Learning Tools and Techniques” Morgan Kaufmann, Fourth Edition. 2016. Available online: https://www.cs.waikato.ac.nz/ml/weka/Witten_et_al_2016_appendix.pdf (accessed on 25 July 2024).
  44. Hall, M.; Frank, E.; Holmes, G.; Pfahringer, B.; Reutemann, P.; Witten, I.H. The WEKA data mining software: An update. SIGKDD Explor. 2009, 11, 10–18. [Google Scholar] [CrossRef]
  45. Witten, I.H.; Frank, E.; Hall, M.A.; Pal, C.J. Data Mining—Practical Machine Learning Tools and Techniques, 4th ed.; Morgan Kaufmann: Cambridge, MA, USA, 2017. [Google Scholar]
  46. Haykin, S. Neural Networks and Learning Machines, 3rd ed.; Prentice Hall: New York, NY, USA, 2009. [Google Scholar]
  47. Rumelhart, D.; Hinton, G.; Williams, R. Learning Internal Representation by Error Propagation. In Parallel Distributed Processing: Explorations in the Microstructure of Cognition: Foundations; Rumelhart, D.E., McCleland, J.L., Eds.; MIT Press: Cambridge, MA, USA, 1986; pp. 318–362. [Google Scholar] [CrossRef]
  48. Neves, J.; Maia, N.; Marreiros, G.; Neves, M.; Fernandes, A.; Ribeiro, J.; Araújo, I.; Araújo, N.; Ávidos, L.; Ferraz, F.; et al. Employees balance and stability as key points in organizational performance. Log. J. IGPL 2021, 30, 664–678. [Google Scholar] [CrossRef]
  49. Alves, V.; Miranda, J.; Dawa, H.; Fernandes, F.; Pombal, F.; Ribeiro, J.; Fdez-Riverola, F.; Analide, C.; Vicente, H.; Neves, J. An Entropic Approach to Technology Enable Learning and Social Computing. In Machine Learning and Artificial Intelligence; Frontiers in Artificial Intelligence and Applications; Kim, J.-L., Ed.; IOS Press: Amsterdam, The Netherlands, 2022; Volume 360, pp. 140–153. [Google Scholar] [CrossRef]
  50. Neves, J.; Maia, N.; Marreiros, G.; Neves, M.; Fernandes, A.; Ribeiro, J.; Araújo, I.; Araújo, N.; Ávidos, L.; Ferraz, F.; et al. Entropy and Organizational Performance. In Hybrid Artificial Intelligent Systems; Lecture Notes in Computer Science; Pérez García, H., Sánchez González, L., Castejón Limas, M., Quintián Pardo, H., Corchado Rodríguez, E., Eds.; Springer: Cham, Switzerland, 2019; Volume 11734, pp. 206–217. [Google Scholar] [CrossRef]
  51. Abu-Shakra, A. Including a service learning educational research project in a biology course-II: Assessing community awareness of legionnaires’ disease? Eur. J. Educ. Res. 2012, 1, 271–282. [Google Scholar] [CrossRef]
Figure 1. Illustration of the research design applied in the present study.
Water 17 02940 g001
Figure 2. Overview of the content in part III of the questionnaire.
Water 17 02940 g002
Figure 3. Percentage distribution of responses to statements S1–S6, reflecting participants’ risk perception and knowledge regarding Legionella.
Water 17 02940 g003
Figure 4. Percentage distribution of responses to statements S7–S12, reflecting participants’ confidence in water supply systems and safety measures regarding Legionella contamination.
Water 17 02940 g004
Figure 5. Percentage distribution of responses to statements S13–S17, reflecting participants’ opinion about effectiveness of prevention and control measures regarding Legionella infections.
Water 17 02940 g005
Figure 6. Percentage distribution of responses to statements S18–S22, reflecting participants’ willingness to adopt measures and associated costs for Legionella prevention.
Water 17 02940 g006
Figure 7. Percentage distribution of responses to statements S23–S27, reflecting participants’ opinion on public health impact and concern about Legionella exposure.
Water 17 02940 g007
Figure 8. Percentage distribution of responses to the third part of the questionnaire, relating to participants’ self-assessment of their literacy on Legionella infections.
Water 17 02940 g008
Figure 9. Percentage distribution of responses to the third part of the questionnaire, relating to participants’ self-assessment of their literacy on Legionella infections by gender, age categories, educational attainment, and work status.
Water 17 02940 g009
Figure 10. The participant one’s responses in the second part of the questionnaire.
Water 17 02940 g010
Figure 11. Visual summary of participant one’s responses to the second part of the questionnaire under both best-case and worst-case scenarios, showing exergy in green, vagueness in gray, and anergy in white. (1) strongly disagree, (2) disagree, (3) agree, and (4) strongly agree.
Water 17 02940 g011
Figure 12. Neural network models for assessing public literacy on Legionella infections, using exergy (EX), vagueness (VA), and anergy (AN) values across study domains under best-case scenario (BCS) and worst-case scenario (WCS) and both rating scales. RPKL and IPHE represent the domains of risk perception and knowledge about Legionella and impact on public health and concern about exposure, respectively. (* Data from participant one are provided solely as an example).
Water 17 02940 g012
Table 1. Compilation of the items included in Part II of the questionnaire, organized by domains.
Risk perception and knowledge about LegionellaS1Legionella is a bacteria commonly found in natural aquatic environments that can be transmitted through water supply systems, especially where water is stagnant and/or exposed to heat.
S2The primary way of contracting Legionella is through the inhalation of contaminated water particles, rather than through direct ingestion of water.
S3Legionella infection can lead to severe respiratory problems or even death.
S4Air conditioning systems, showers, jacuzzis, and spas are potential environments for Legionella proliferation, particularly when maintenance and disinfection are inadequate.
S5Water systems maintained at temperatures between 20 °C and 45 °C pose a high risk of Legionella growth.
S6Exposure to Legionella is particularly dangerous for the elderly, smokers, and individuals with respiratory diseases.
Confidence in water supply systems and safety measuresS7Water supply systems are subject to strict procedures to prevent Legionella from multiplying to hazardous levels.
S8The responsible authorities conduct regular inspections of water supply systems to monitor and control the presence of Legionella.
S9The public water services carry out the necessary maintenance to prevent Legionella contamination.
S10Public health authorities effectively communicate the risks and preventive measures of Legionella to the population.
S11Public hot water systems, such as boilers and reservoirs, are properly maintained and disinfected to prevent Legionella.
S12Public health authorities properly investigate suspected cases of Legionella to prevent its spread.
Effectiveness of prevention and control measuresS13Periodic disinfection of water systems is an effective measure to control Legionella.
S14Regular monitoring of water quality is essential to ensure safety and prevent Legionella outbreaks.
S15Frequent maintenance of water systems significantly reduces the risk of Legionella contamination.
S16The use of specific chemicals, as well as temperature shocks, is are effective and safe practice for eliminating Legionella.
S17Maintaining water systems at a controlled temperature (<20 °C or >50 °C) is an effective measure against the proliferation/propagation of Legionella.
Willingness to adopt measures and associated costsS18It is necessary to invest in new filtration and disinfection technologies to prevent the occurrence of Legionella in water systems.
S19Preventive measures against Legionella, such as regular maintenance of water systems, are an essential investment to promote public health.
S20Any additional costs to ensure safety against Legionella should be shared between consumers and water supply companies.
S21I am willing to accept a small increase in the water tariff to ensure that additional safety measures against Legionella are implemented.
S22I am willing to accept temporary water supply interruptions to carry out system disinfection and prevent Legionella.
Impact on public health and concern about exposureS23Legionella infections pose a significant threat to public health.
S24The prevention of waterborne diseases, such as Legionella, should be a priority in public health.
S25Exposure to Legionella is a real risk in certain environments, such as hospitals, nursing homes, hotels, and spas.
S26I am concerned about the possibility of a Legionella outbreak in my community.
S27I am concerned that Legionella infections may not be detected quickly.
Table 2. Demographic characterization of the participants in terms of gender, age categories, educational attainment, and work status.
Socio-Demographic CharacteristicsClassFrequency
N%
GenderFemale12753.1
Male11246.9
Age Categories (years old)<253213.4
[25, 45]6627.6
[46, 65]8334.7
>655824.3
Educational AttainmentBasic Education9439.3
Secondary Education10142.3
High Education3313.8
Post-Graduate Education114.6
Work StatusStudent4518.8
Employed14058.6
Unemployed156.3
Retired3916.3
Table 3. Participant one’s responses from second part of the questionnaire mapped to a seven-point expanded Likert scale.
DomainStatementsSeven-Point Expanded Likert Scale *
Descending TrendAscending Trend
Water 17 02940 i001Water 17 02940 i002
4321234Vagueness
Risk perception and knowledge about LegionellaS1
S2
S3
S4
S5
S6
Confidence in water supply systems and safety measuresS7
S8
S9
S10
S11
S12
Effectiveness of prevention and control measuresS13
S14
S15
S16
S17
Willingness to adopt measures and associated costsS18
S19
S20
S21
S22
Impact on public health and concern about exposureS23
S24
S25
S26
S27
Note: * (4) strongly agree, (3) agree, (2) disagree, and (1) strongly disagree.
Table 4. Best-case scenario values of exergy, vagueness, and anergy for participant one, based on her/his responses in the risk perception and knowledge about Legionella domain, across both rating scales, i.e., from strongly agree (4) to strongly disagree (1), and vice versa.
StatementScale (4) → (1)Scale (1) → (4)
S1 e x e r g y S 1 = 1 6 π 1 4 1 π 2 = 0.01
v a g u e n e s s S 1 = 0
a n e r g y S 1 = 1 6 π 4 4 1 π 1 4 1 π 2 = 0.16
S2 e x e r g y S 2 = 0
v a g u e n e s s S 2 = 0
a n e r g y S 2 = 1 6 π 4 4 1 π 0 2 = 0.17
S3 e x e r g y S 3 = 1 6 π 1 4 1 π 2 = 0.01
v a g u e n e s s S 3 = 0
a n e r g y S 3 = 1 6 π 4 4 1 π 1 4 1 π 2 = 0.16
S4 e x e r g y S 4 = 1 6 π 1 4 1 π 2 = 0.01
v a g u e n e s s S 4 = 0
a n e r g y S 4 = 1 6 π 4 4 1 π 1 4 1 π 2 = 0.16
S5 e x e r g y S 5 = 1 6 π 1 4 1 π 2 = 0.01
v a g u e n e s s S 5 = 0
a n e r g y S 5 = 1 6 π 4 4 1 π 1 4 1 π 2 = 0.16
S6 e x e r g y S 6 = 1 6 π 1 4 1 π 2 = 0.01
v a g u e n e s s S 6 = 0
a n e r g y S 6 = 1 6 π 4 4 1 π 1 4 1 π 2 = 0.16
Table 5. Worst-case scenario values of exergy, vagueness, and anergy for participant one, based on her/his responses in the risk perception and knowledge about Legionella domain, across both rating scales, i.e., from strongly agree (4) to strongly disagree (1), and vice versa.
StatementScale (4) → (1)Scale (1) → (4)
S1 e x e r g y S 1 = 1 6 π 1 4 1 π 2 = 0.01
v a g u e n e s s S 1 = 1 6 π 1 4 1 π 2 1 4 1 π 2 = 0
a n e r g y S 1 = 1 6 π 4 4 1 π 1 4 1 π 2 = 0.16
S2 e x e r g y S 2 = 0
v a g u e n e s s S 2 = 1 6 π 4 4 1 π 0 2 = 0.17
a n e r g y S 2 = 1 6 π 4 4 1 π 2 4 4 1 π 2 = 0
S3 e x e r g y S 3 = 1 6 π 1 4 1 π 2 = 0.01
v a g u e n e s s S 3 = 1 6 π 1 4 1 π 2 1 4 1 π 2 = 0
a n e r g y S 3 = 1 6 π 4 4 1 π 1 4 1 π 2 = 0.16
S4 e x e r g y S 4 = 1 6 π 1 4 1 π 2 = 0.01
v a g u e n e s s S 4 = 1 6 π 2 4 1 π 2 1 4 1 π 2 = 0.03
a n e r g y S 4 = 1 6 π 4 4 1 π 2 2 4 1 π 2 = 0.13
S5 e x e r g y S 5 = 1 6 π 1 4 1 π 2 = 0.01
v a g u e n e s s S 5 = 1 6 π 2 4 1 π 2 1 4 1 π 2 = 0.03
a n e r g y S 5 = 1 6 π 4 4 1 π 2 2 4 1 π 2 = 0.13
S6 e x e r g y S 6 1 6 π 1 4 1 π 2 = 0.01
v a g u e n e s s S 6 = 1 6 π 1 4 1 π 2 1 4 1 π 2 = 0
a n e r g y S 6 = 1 6 π 4 4 1 π 1 4 1 π 2 = 0.16
Table 6. Exergy, vagueness, and anergy values for participant one across all domains considered in the study under the best-case scenario, for both rating scales (from strongly agree (4) to strongly disagree (1), and from strongly disagree (1) to strongly agree (4)).
DomainScale (4) → (1) Scale (1) → (4)
ExergyVaguenessAnergyExergyVaguenessAnergy
Risk perception and knowledge about Legionella0.0300.640.0200.31
Confidence in water supply systems and safety measures000.500.1900.31
Effectiveness of prevention and control measures0.0400.96000
Willingness to adopt measures and associated costs0.1100.090.4200.38
Impact on public health and concern about exposure0.0400.560.0200.38
Table 7. Exergy, vagueness, and anergy values for participant one across all domains considered in the study under the worst-case scenario, for both rating scales (from strongly agree (4) to strongly disagree (1), and from strongly disagree (1) to strongly agree (4)).
DomainScale (4) → (1) Scale (1) → (4)
ExergyVaguenessAnergyExergyVaguenessAnergy
Risk perception and knowledge about Legionella0.030.170.470.020.060.25
Confidence in water supply systems and safety measures00.5000.190.060.25
Effectiveness of prevention and control measures0.040.400.66000
Willingness to adopt measures and associated costs0.110.0900.420.080.30
Impact on public health and concern about exposure0.0400.560.020.080.30
Table 8. Confusion matrices of the ANN-based models for predicting participants’ levels of literacy on Legionella infections in both scenarios.
TrainingTest
PredictLowModerateHighLowModerateHigh
Target
Best-Case ScenarioLow35401530
Moderate66803310
High03440324
Worst-Case ScenarioLow38601120
Moderate16450335
High01450127
Disclaimer/Publisher’s Note: The statements, opinions and data contained in all publications are solely those of the individual author(s) and contributor(s) and not of MDPI and/or the editor(s). MDPI and/or the editor(s) disclaim responsibility for any injury to people or property resulting from any ideas, methods, instructions or products referred to in the content.