Article

Evaluating the Effects of Irrigation Water Quality and Compost Amendment on Soil Health and Crop Productivity

1
Department of Civil and Environmental Engineering, New Mexico State University, Las Cruces, NM 88003, USA
2
Department of Electrical Engineering, University of North Texas, Denton, TX 76203, USA
3
Department of Extension Plant Sciences, New Mexico State University, Las Cruces, NM 88003, USA
*
Author to whom correspondence should be addressed.
Water 2025, 17(20), 2927; https://doi.org/10.3390/w17202927
Submission received: 30 July 2025 / Revised: 2 October 2025 / Accepted: 8 October 2025 / Published: 10 October 2025
(This article belongs to the Special Issue Soil Water Use and Irrigation Management)

Abstract

Brackish water is becoming an increasingly important resource for agricultural irrigation due to limited freshwater availability; however, concerns persist regarding its potential to degrade soil quality and reduce crop yields. This study evaluated the combined effects of irrigation water quality (brackish water, electrical conductivity (EC) of 2958 µS/cm; agricultural water, EC 796 µS/cm), soil type (agricultural soil and reclaimed desert soil), and compost treatments (no compost, mulch compost, Johnson-Su compost, and mulch compost incorporation) on soil health and chili pepper (Capsicum annuum) growth under greenhouse conditions. Compost amendments significantly improved plant height by 58–213%, root length by 35–166%, and wet biomass by 154–1400% compared to control treatments. Agricultural water maintained lower soil EC (0.553–0.870 mS/cm) than brackish water (0.751–1.104 mS/cm), while Johnson-Su compost most effectively reduced salinity impact on plant growth. Leached water analysis showed higher Na+, Cl, and SO42− mobility under brackish irrigation, with compost treatments enhancing nutrient retention and soil moisture by buffering salinity stress with carboxylic group and cation exchange capacity. Johnson-Su compost incorporation consistently mitigated the negative effects of brackish irrigation by reducing sodium accumulation, improving chloride mobility, and enhancing soil nitrogen dynamics. These results highlight that combining high-quality irrigation water and biologically active composts improves soil health and plant productivity, while brackish water use requires soil amendments to mitigate salinity risks.

1. Introduction

Soil health is crucial to sustainable agriculture, highlighting long-term crop productivity, environmental resilience, and ecosystem stability. It refers to the soil’s ability to function as a living ecosystem, facilitating plant growth, regulating nutrient cycles, improving water infiltration and retention, and supporting carbon storage [1,2]. These soil functions are essential for sustaining agricultural productivity and environmental stability, but maintaining them requires understanding the complex interactions among management practices, irrigation water quality, and soil amendments [3,4,5,6]. While efforts have been made to improve agricultural productivity through fertilizers, irrigation, and intensive farming techniques, these practices can sometimes degrade soil health if not managed properly [7]. The quality of irrigation water and the type of soil amendments are particularly critical, as they directly influence the soil’s physical, chemical, and biological properties, which in turn affect plant growth, nutrient availability, and water retention [2,6].
The depletion of freshwater resources, coupled with climate change and unsustainable farming methods, has intensified water scarcity in numerous regions across the globe [8]. To address this challenge, farmers in water-scarce regions are increasingly turning to alternative water sources, such as brackish water and reclaimed wastewater, for irrigation [9]. However, using these water sources can be detrimental to soil health, as the salinity and chemical composition of the water may negatively affect soil structure, nutrient availability, and crop growth [10]. Brackish water, characterized by high levels of dissolved salts, can lead to soil salinization, where excessive salt accumulates in the root zone, reducing the soil’s ability to retain water and causing osmotic stress in plants, reducing soil permeability and water infiltration, further limiting water availability to crops [11,12]. Crops such as wheat (with a salt tolerance level of 6300 µS/cm) and corn (1800 µS/cm) have been reported to suffer yield losses of up to 25% when irrigated with high-salinity water [13,14,15]. Approximately 8% yield loss of chili pepper occurred when EC is beyond 2800 µS/cm in the root zone [16]. This reduction in yield is due to the negative impact of salinity on soil structure and the reduced ability of plants to take up water from the soil, although moisture is present.
Another important indicator of water quality is the sodium adsorption ratio (SAR), which measures the relative concentration of Na+ to Ca2+ and Mg2+ in the water [17]. High SAR levels can lead to soil sodification, where Na+ ions replace Ca2+ and Mg2+ in the soil, causing clay particles to disperse and reducing soil porosity [18]. This results in poor soil structure, limited root penetration, and reduced crop productivity [19,20]. Studies have shown that crops like cotton and rice experience yield reductions of 50–90% and 30–35%, respectively, when irrigated with water high in Na+ due to poor water uptake and osmotic stress [21,22]. The composition of salt ions in irrigation water, in addition to factors like EC and SAR, plays a vital role in plant health [23]. These issues underscore the need for more effective irrigation management practices to mitigate the adverse effects of brackish water, ensuring the long-term viability of agricultural production.
Treated wastewater offers a potential alternative irrigation source, particularly in regions with limited freshwater resources, such as the southwest of the United States [24]. Treated wastewater can provide essential nutrients, including nitrogen and phosphorus, reducing the need for chemical fertilizers [25]. However, the contaminants, such as heavy metals, pathogens, residual pharmaceuticals, and contaminants of emerging concerns, pose potential risks to both soil health and human safety [10]. Therefore, while treated wastewater can be an essential resource for agriculture, its use must be carefully managed to minimize risks. In contrast, brackish water, though higher in salinity, poses fewer contamination risks than treated wastewater. Brackish water is a promising alternative for irrigation, especially when combined with effective soil management practices, such as applying organic amendments to mitigate the effects of salinity [26,27].
Organic soil amendments, particularly compost, have been widely recognized as an effective strategy for improving soil health and mitigating the negative effects of poor-quality irrigation water [26,28]. Compost contributes to soil health by increasing soil organic matter, enhancing nutrient availability, stimulating microbial activity, and improving soil structure, water retention, and fertility, while also reducing nutrient leaching and promoting beneficial microbes [29,30]. Most previous studies tested compost under saline irrigation or different soil types separately, often incorporating it deeply or to the surface. In this study, we focused on a more feasible surface application (0–15 cm) and directly compared biologically active compost with mulch compost under contrasting water qualities to address this gap.
Quantitative studies have shown that applying compost can increase soil organic matter and soil organic carbon by over 25% and 58–86% increase in water-holding capacity in compost-amended soils compared to non-amended soils, improving soil structure and water retention capacity [26,31,32]. This increased water retention is critical in areas where water resources are limited or where irrigation water quality is suboptimal [32,33]. Compost contributes significantly to enhancing soil fertility by minimizing nutrient leaching, particularly in sandy soils where nutrient loss is more prevalent [29]. Additionally, mulch compost has been found to regulate soil temperature and moisture levels, fostering a more conducive environment for crop growth, even under brackish water irrigation conditions [34]. Yasmina et al. [35] reported that mulch treatments increased soil moisture content by up to 20%, particularly at depths of 5–10 cm; and mulching also helps control salinity, moderating the effects of poor-quality water and promoting plant growth [36]. Organic mulches such as compost, straw, and wood chips decompose over time, releasing nutrients into the soil and contributing to long-term soil fertility [35].
The combined use of compost amendments and alternative irrigation water has received increasing interest due to its potential to mitigate the negative effects of poor-quality water on soil health and crop productivity. Studies by Nehela et al. [37] have demonstrated the synergistic effects of biochar and brackish irrigation water on soil properties and plant growth. The application of compost as a soil conditioner played a vital role in forming and stabilizing soil aggregates and enhancing the soil cation exchange capacity. This improvement can lead to better nutrient retention, which increases N, P, and K uptake and induces photosynthetic pigments in maize, even under conditions of water stress and soil salinity [37]. Compost also increased soil organic matter and nutrient retention, leading to significantly higher crop yield of potatoes under wastewater irrigation conditions [38]. Omara et al. [39] demonstrated that compost mitigated the adverse effects of salt-affected soil. Compost rich in organic matter has been essential in mitigating the detrimental effects of brackish water irrigation, such as soil degradation and declines in crop productivity. These findings underscore the importance of integrating compost with irrigation management strategies to improve soil health and maximize crop productivity under challenging environmental conditions.
Although existing research shows promising results, more in-depth studies are needed to assess the impacts of integrating different compost types, such as biologically active and mulch compost, with various irrigation water sources. Understanding the complex interactions between different types of compost and water quality is vital for developing sustainable agricultural practices that optimize resource utilization and enhance crop productivity, particularly in regions facing significant water scarcity and poor irrigation water quality.
In this study, we investigated the combined effects of irrigation water quality (brackish water and agricultural freshwater) and compost amendments (commercial mulch compost (MC) and biologically active Johnson-Su compost (JC)) on soil health and crop productivity. Biologically active compost, in this context, refers to compost containing a high population of beneficial microorganisms, such as bacteria and fungi, that enhance nutrient cycling, promote organic matter decomposition, and stimulate soil biological activity. To ensure consistent compost performance under saline irrigation, properties should be within optimal ranges reported in the literature. In this study, JC and MC showed C:N ratios of ~11 and fungal-to-bacterial ratios >1.8, aligning with recommended values for mature and stable composts [40]. Microbial biomass levels of JC (fungi ~2950 µg/g; bacteria ~1590 µg/g) also matched values associated with biologically active composts [41]. Chili pepper (Capsicum annuum-NuMex Odyssey cultivar) was selected for this experiment due to its importance in regional agriculture. Chili pepper is classified as moderately salt-sensitive, with reported threshold values ranging between 0 and 2 mS/cm [16,17], which are appropriate to evaluate the impact of irrigation water with electrical conductivity (EC) of 2958 µS/cm for brackish water and 796 µS/cm for agricultural water in this study.
The objective of this study is to investigate the interactive effects of irrigation water quality, soil type, and compost treatments (MC, Johnson-Su compost, and mulch compost incorporation–JCI and MCI) on soil salinity dynamics, nutrient leaching, and chili pepper growth under controlled greenhouse conditions. We hypothesized that (i) brackish water irrigation would increase soil electrical conductivity (SEC), sodium adsorption ratio (SAR), and ion leaching compared to agricultural water; (ii) compost amendments, particularly biologically active JC, would mitigate these negative impacts by improving soil aggregation, nutrient retention, and plant growth; and (iii) responses would vary with soil type, with agricultural soil expected to buffer salinity better than reclaimed natural desert soil, though both are classified as clay loam. By testing these hypotheses, this study provides novel insights into how combined compost–irrigation strategies can be optimized for sustainable agriculture under brackish water use. Ultimately, this research provides practical strategies for optimizing resource use and enhancing agricultural productivity, particularly in regions facing challenges related to water scarcity and impaired water quality.

2. Materials and Methods

Brackish water, desalinated water, and soil samples were collected from the Brackish Groundwater National Desalination Research Facility (BGNDRF) in Alamogordo, New Mexico, where the research team operates a renewable energy-powered reverse osmosis (RO) desalination system to treat brackish groundwater for agronomic field experiments.

2.1. Experimental Setup

A 70-day greenhouse study was designed to evaluate the combined effects of irrigation water quality, soil quality, and compost treatments on chili pepper (Capsicum annuum) growth. Plants were grown in a controlled indoor greenhouse environment, where artificial lighting (AgroMax F54T5HO, GROW SPECTRUM EM-H20; HTG Supply, Callery, PA, USA) was used to simulate natural sunlight and provide a uniform and measurable light spectrum to support plant growth. A full factorial experimental design was implemented with three factors as shown in Figure 1: (1) irrigation water at two levels, (2) soil quality at two levels, and (3) compost treatment at four levels. The irrigation waters included: (a) brackish water with an EC of 2958 ± 51 µS/cm, sourced from a blend of brackish groundwater from BGNDRF Well 1 with RO concentrate, and (b) agricultural water with an EC of 796 ± 7 µS/cm, created by blending BGNDRF well 1 water and RO permeate. Two clay loam soils (Figure S5) with varying soil quality were used: (a) agricultural soil (AS) from a research site at New Mexico State University (NMSU) and (b) natural desert soil reclaimed after two years of field irrigation experiments in BGNDRF (BS). Compost treatments included four variations: (a) no compost (NC), (b) surface-applied mulch compost (MC), (c) biologically active Johnson-Su compost incorporated into the topsoil (JCI), and (d) mulch compost incorporated into the topsoil (MCI). The Johnson-Su compost used in this study was considered biologically active due to its advanced maturity and microbial richness. Full factorial combination totals 16 conditions, and each condition was replicated 3 times for 48 columns (Figure 1).
Eight seeds of chili pepper were sown per column on day seven, once the columns were saturated, with four healthy seedlings selected for further growth. Greenhouse conditions were maintained at a minimum of 18 °C to ensure successful germination and growth.

2.2. Soil and Compost Preparation

Soils were collected from the AS and BS field sites, and sampled at three depth intervals: 0–15 cm, 15–30 cm, and 30–45 cm. These soils were classified as clay loam. The collected soil was air-dried, sieved through a 3 mm mesh, and packed into polyvinyl chloride (PVC) columns (50 cm in height and 10 cm in diameter) to match field bulk density (1.35–1.40 g/cm3). Compost was incorporated into the topsoil at a ratio of 10% by weight, equivalent to 3% dry weight. Two types of compost were used: (1) mulch compost (MC), a commercially available blend of aged bark and composted plant material aimed at improving soil moisture retention (GRO-WELL Brands Inc., Tempe, AZ, USA), and (2) Johnson-Su compost (JC), produced using yard waste and added with Eisenia fetida worms in an aerobic composting bioreactor designed to enhance nutrient availability and soil microbial activity [42].

2.3. Irrigation and Monitoring

Irrigation commenced on day one of the experiment, with 300 mL of water applied daily until the columns became saturated. Irrigation water EC and pH were measured daily before irrigation; values remained stable over the 70-day period, and Table 1 presents mean ± standard deviation values. The irrigation volume was then adjusted to 200 mL/day to maintain soil moisture levels between 0.200 and 0.350 m3/m3 (expressed in volumetric water content, VWC), measured using TEROS-12 soil moisture sensors (Meter Group, Inc., Pullman, WA, USA), at multiple depths in the columns. This range was selected to avoid both water stress and waterlogging conditions. These sensors also recorded SEC to monitor salinity levels. Irrigation water samples were collected and analyzed for pH, EC, and major ions, with ion chromatography (Dionex ICS-2100, Thermo Fisher Scientific, Pleasanton, CA, USA) and inductively coupled plasma optical emission spectroscopy (ICP-OES, Optima 4300 DV, PerkinElmer, Waltham, MA, USA) used for quantifying cations and anions.

2.4. Flood Irrigation and Leachate Collection

Flood irrigation was applied twice during the study: once on day seven before planting and on day 70 before harvesting. The flood irrigation involved the application of 300 mL of respective irrigation water over two days. Flood irrigation was applied at the beginning and end of the experiment to ensure uniform soil wetting, enable the collection of leachate for ion analysis, and to minimize the risk of secondary salinization in the soil columns. Leachate was collected from the bottom of the columns and filtered through 0.45 µm nylon filters (Cole-Parmer, Vernon Hills, IL, USA) before analysis. A benchtop multi-parameter meter (PCD 650, Oakton Instruments, Vernon Hills, IL, USA) was used to measure leachate pH and EC. A Hach alkalinity test kit (Hach, Loveland, CO, USA) was used to measure alkalinity, while dissolved organic carbon (DOC) was measured using a TOC-V CSH analyzer (Shimadzu, Kyoto, Japan).

2.5. Plant Harvest and Biomass Measurement

At the end of the experiment, the plant biomass was harvested, and wet weights were recorded using a DYMO M25 balance (Tarzana, CA, USA). Measurements were taken for plant height and root length, and leaf chlorophyll content was analyzed using a SPAD 502DL Plus Chlorophyll Meter (Spectrum Technologies, Aurora, IL, USA).
The collection, preservation, shipping, and analysis of all plant, soil, and water samples were performed in accordance with the United States Environmental Protection Agency (EPA) protocols. This ensured that all data collected were accurate, reproducible, and consistent with regulatory standards.

2.6. Calculations, Data Quality, and Statistical Analysis

The following equations were applied for the calculation of key parameters [18] and for comparing the effects of different treatments:
L e a c h i n g   F r a c t i o n   ( L F ) =   E C i E C e
where ECi refers to the EC of the irrigation water, and ECe refers to the EC of the leached water [18].
S A R = [ N a + ] ( m e q / L ) { ( [ C a 2 + ] ( m e q / L )   +   [ M g 2 + ] ) ( m e q / L ) 2 } 1 / 2
The   percentage   increase   =   a b b × 100 %
where a is the new value of the parameter with treatment and b is the baseline value of the parameter without treatment.
Mass Balance Equation for Water and Soil Constituents: The mass balance of nutrients and ions in the leaching process was calculated using:
X s = X i X w
where Xs represents the mass of a constituent retained by or leached from the soil, Xw is the total mass added through irrigation, and Xi is the amount leached from the soil. This method was employed to quantify the retention and movement of ions and nutrients within the soil columns.
All instruments were calibrated according to manufacturer instructions before use, with calibration intervals and precision checks conducted throughout the study. The pH/EC meter was calibrated daily with standard buffers and conductivity solutions, ion chromatography and ICP-OES instruments used multi-point calibrations with mid-run verification standards every ~10 samples, and DOC measurements included blanks and calibration checks. TEROS-12 sensors were verified against reference solutions and gravimetric water content prior to installation. Analytical precision was typically within ±2% for EC, ±0.02 pH units, and ≤5% relative percent difference for ion concentrations. A replication of three per treatment (48 columns total) was used, which is consistent with standard soil column studies and sufficient to detect treatment differences. Data were analyzed using three-way ANOVA (Analysis of Variance) and PCA (Principal Component Analysis) to evaluate the effects of the three experimental factors on soil salinity, plant growth, and nutrient dynamics. Tukey’s post hoc tests were used to compare mean values between treatments, where significant differences (p < 0.05) were found. All statistical analyses were performed using MINITAB version 17.0.

3. Results and Discussion

3.1. Impact of Irrigation Water Quality, Soil, and Compost Quality

The water quality parameters of brackish water and agricultural water used in the greenhouse study demonstrated notable differences, as shown in Table 1, which can significantly impact soil moisture content and overall soil health. In this study, agricultural water (EC 796 µS/cm) refers to low-salinity canal water commonly used by farmers for irrigation in the region, while brackish water (EC 2958 µS/cm) represents moderately saline groundwater with elevated dissolved salts, providing a clear contrast between typical freshwater irrigation sources and more saline alternatives. Brackish water had a higher pH (8.65) than agricultural water (7.61), and a significantly higher EC of 2958 µS/cm versus 796 µS/cm. This indicates markedly higher salinity in brackish water sources used for irrigation in arid and semi-arid regions [43]. Earlier research has indicated that higher irrigation water salinity slows seedling emergence, with noticeable reductions in final emergence percentages occurring once EC levels exceed about 3000 µS/cm. Continued irrigation with water above this threshold can impair plant performance by reducing the time to flowering, limiting photosynthesis and stomatal activity, and lowering fresh shoot and fruit biomass as well as overall water use efficiency [43]. This highlights the practical importance of this classification in brackish water irrigation studies. Alkalinity was also higher in brackish water (480 mg/L as CaCO3) compared to agricultural water (155 mg/L as CaCO3). The SAR (Equation (2)) was notably higher in brackish water (11.7) than in agricultural water (6.1), reflecting a higher potential for soil salination-associated challenges in maintaining soil structure and permeability and plant growth issues in brackish water [12]. These EC and SAR ranges are consistent with brackish irrigation, causing osmotic stress and sodicity risks in arid systems, as widely reported in FAO guidance [18].
Ion concentrations varied significantly between the two water types. Brackish water had higher levels of Cl (120.9 mg/L), NO3 (1.1 mg/L), SO42− (1228.8 mg/L), Ca2+ (107.5 mg/L), Mg2+ (26.8 mg/L), Na+ (522.5 mg/L), and K+ (12.15 mg/L) compared to agricultural water, which had lower respective values of 29.4 mg/L, 0.2 mg/L, 261.7 mg/L, 28.2 mg/L, 6.6 mg/L, 139.0 mg/L, and 3.55 mg/L. These differences likely influenced the soil moisture content observed in the study. These elevated ion concentrations reflect typical brackish water profiles, as reported in previous studies that link such water sources to increased risks of soil salinization and osmotic stress [11,21]. Osmotic stress induced by high salinity can reduce soil moisture retention and hinder plant water uptake, leading to impaired crop growth, as demonstrated in the work of Khorsandi and Anagholi [21] and Li et al. [11], who highlighted significant reductions in plant water availability under brackish conditions in the review. The higher SAR and Na+ concentration in brackish water poses a risk of soil sodicity, potentially leading to soil dispersion and reduced permeability, though the presence of Ca2+ and Mg2+ might mitigate some negative effects. As Yan et al. [17] reported, the presence of divalent cations like Ca2+ and Mg2+ can buffer the effects of high sodium, reducing the risk of soil degradation. The SO42− concentration in brackish water (1229 mg/L), being much higher than in agricultural water (262 mg/L), could influence sulfate availability in the soil, which is essential for plant growth. The complex interplay between water quality and soil health should emphasize the need for careful irrigation planning to enhance soil moisture, health, and crop productivity [44].
AS exhibited more consistent organic matter, nitrate, and essential micronutrients, making it better suited for plant nutrient uptake (Figure S1). In contrast, BS had higher soluble salts and SO42− levels, indicating the need for compost treatments to mitigate salinity effects (Figure S1). JC showed higher nitrate (NO3), phosphorus (P), calcium (Ca2+), and magnesium (Mg2+) levels, which enhance soil structure, fertility, and nutrient retention, particularly under saline conditions (Figure S1). In contrast, mulch compost (MC) had higher potassium (K+), sodium (Na+), and chloride (Cl) levels, which can contribute to salt stress if not managed properly. The cation exchange capacity (CEC), crucial for nutrient retention, was higher in JC and BS, supporting long-term soil health and plant productivity (Figure S1). The physicochemical properties of compost and soils in this study highlight the potential of organic amendments to improve nutrient availability and salinity management. BS soil had higher EC compared to AS, while measured with higher EC than JC, which can cause salinity stress to crop.

3.2. Combined Impact of Irrigation Water Quality and Compost Treatment

The soil moisture content (SM) across different depths (0–15 cm, 15–30 cm, and 30–45 cm) under varying treatments of soil quality, compost application, and irrigation water type was measured from 7th day to the 72nd day of the experiment and presented in Table 2. The analysis using three-way ANOVA revealed significant differences in SM based on these factors.
The SM varied significantly among treatments in the topsoil layer (0–15 cm). The highest moisture content was observed in the AW-AS-MCI treatment (0.284 ± 0.02 m3/m3), indicating that AW combined with AS had the most substantial positive impact on soil moisture retention in the top layer of soil. Conversely, the lowest moisture content was recorded in the AW-BS-MC treatment (0.229 ± 0.01 m3/m3), suggesting that combining AW with BS and mulch compost was less effective in retaining moisture. These differences underscore the importance of soil quality and compost addition methods in determining soil moisture levels at this depth.
The trend continued for the middle layer of the soil with AW-AS-MC (0.315 ± 0.02 m3/m3), AW-AS-JCI (0.314 ± 0.02 m3/m3), and BW-AS-JCI (0.314 ± 0.02 m3/m3) treatments showing the highest SM, indicating that agricultural soil with Johnson-Su compost incorporation was particularly effective. The lowest moisture content was found in BW-BS-MCI (0.249 ± 0.02 m3/m3), reflecting the lower efficacy of brackish water combined with BS and mulch compost incorporation. This highlights the critical role that soil quality and compost incorporation methods play in influencing water retention at the surface layer, where evaporation rates are highest [45].
In the bottom layer, AW-AS-JCI (0.343 ± 0.02 m3/m3) maintained the highest moisture content, while BW-BS-JCI (0.241 ± 0.01 m3/m3) had the lowest. The superior performance of Johnson-Su compost in maintaining moisture at greater depths may be attributed to its role in enhancing soil aggregation and promoting fungal growth, which improves soil structure and water infiltration for AS. In the bottom soil layer, compost-amended AS treatments (MC and JCI) retained more water than the NC control, with JCI performing slightly better than the other compost applications. This depth also showed significant impacts of compost application on AS in the top layer of soil, as treatments with compost consistently outperformed those with no compost addition. This aligns with previous studies [34] that organic amendments like mulch compost improve soil structure and increase water retention by enhancing porosity due to increased organic carbon content [46]. The significant differences among treatments at this depth highlight the long-term effects of water quality and compost application on soil moisture retention. Agricultural soil and compost incorporation consistently showed better moisture retention across all depths. All the treatment columns had significant differences with varying depths. Aggelides and Londra [47] showed that incorporating mixed-source compost at 15 cm improved water retention in both clay and loam soils, with greater effects at higher compost rates. The compost enhanced the porosity; clay soils retained more water than loam. The p-values indicate the significance of individual and interaction effects on SM. Soil quality (S) was highly significant among the treatments across all depths (p = 0.000), emphasizing its critical role. Compost (C) was significant at 15–30 cm (p = 0.020) and irrigation water (IW) was significant at 15–30 cm and 30–45 cm depths, indicating its varying impact with depth. The interaction between irrigation water and soil quality (IW × S) was significant at 0–15 cm (p = 0.011), while the interaction between soil quality and compost (S × C) was significant at all depths, highlighting the complex interplay between these factors. Initial SM after the first flood irrigation (Table S1) was consistently higher in AS than in BS soils across depths, reflecting the greater organic matter content of AS (3.0–3.2%) than BS soil (2.3–2.6%). Composted columns, particularly those with MC (24.5%) and JC (41.5%), also had higher organic matter, which further enhanced water retention relative to no-compost treatments.
The study evaluated the soil electrical conductivity (SEC) across different depths (0–15 cm, 15–30 cm, and 30–45 cm) under various treatments involving different soil quality, compost applications, and irrigation water types, presented in Table 3. SEC showed significant variation among treatments at the top layer due to the significance of IW, and the interaction of IW × S and S × C. The highest SEC was observed in the BW-AS-MC treatment (0.905 ± 0.10 mS/cm), indicating that brackish water combined with mulch compost, which had high soluble salts (0.79 mS/cm), resulted in higher salinity levels in the soil. These findings align with prior research demonstrating that composts with high salt content can deteriorate soil under brackish irrigation conditions [12]. Conversely, the lowest SEC was recorded in AW-AS-NC (0.553 ± 0.07 mS/cm), suggesting that agricultural water without compost had the least impact on soil salinity. The data reveal that brackish water irrigation generally resulted in higher SEC compared to agricultural water treatments due to higher salt concentrations, including Na+, Cl, and SO42−, which contribute to greater salinization of the soil (Table 1). The BW-AS treatment soil was measured with significantly higher SEC than BW-BS, whereas the opposite trend was observed for AW treatments.
In the mid-depth layer, BW-AS-JCI treatment had the highest SEC (1.016 ± 0.08 mS/cm), while AW-AS-NC showed the lowest SEC (0.643 ± 0.10 mS/cm). The higher SEC in brackish water treatments persisted, indicating deeper penetration of salts. In AS, compost treatments (MC, JCI, and MCI) under both BW and AW irrigation showed higher SEC compared to NC, indicating greater salt movement; however, this effect was not observed in BS, where compost did not significantly alter SEC relative to NC. The significant differences between treatments highlight the impact of both irrigation water quality and S × C interaction on soil salinity at this depth. The highest SEC was observed in the BW-AS-MC treatment (1.104 ± 0.10 mS/cm), while the lowest was in AW-BS-MCI (0.696 ± 0.13 mS/cm) at the deepest layer. The IW, S, C, S × C had a significant influence on SEC in the bottom layer of the soil. The persistently higher SEC in brackish water treatments at this depth confirms the prolonged impact of brackish water on soil properties. Agricultural water treatments consistently showed lower SEC values, indicating better suitability for maintaining lower soil salinity levels. Most of the columns with compost had significant differences across the soil depths except BW-BS-JCI, BW-BS-MCI, and AW-BS-MC. The significant differences among treatments underscore the long-term effects of irrigation water quality and compost application on soil salinity management. Table S1 shows that initial SEC was higher in BS than AS across depths, where Figure S1 confirms this pattern, with BS profiles enriched in Ca2+, Mg2+, and SO42− and exhibiting higher EC. The composts also align with these trends; MC has higher Na+, Cl, and EC than JC, explaining the elevated initial SEC observed in MC-amended columns, particularly under BW, relative to JC or no-compost treatments.

3.3. Impact on Soil Leaching of Ions and Organics

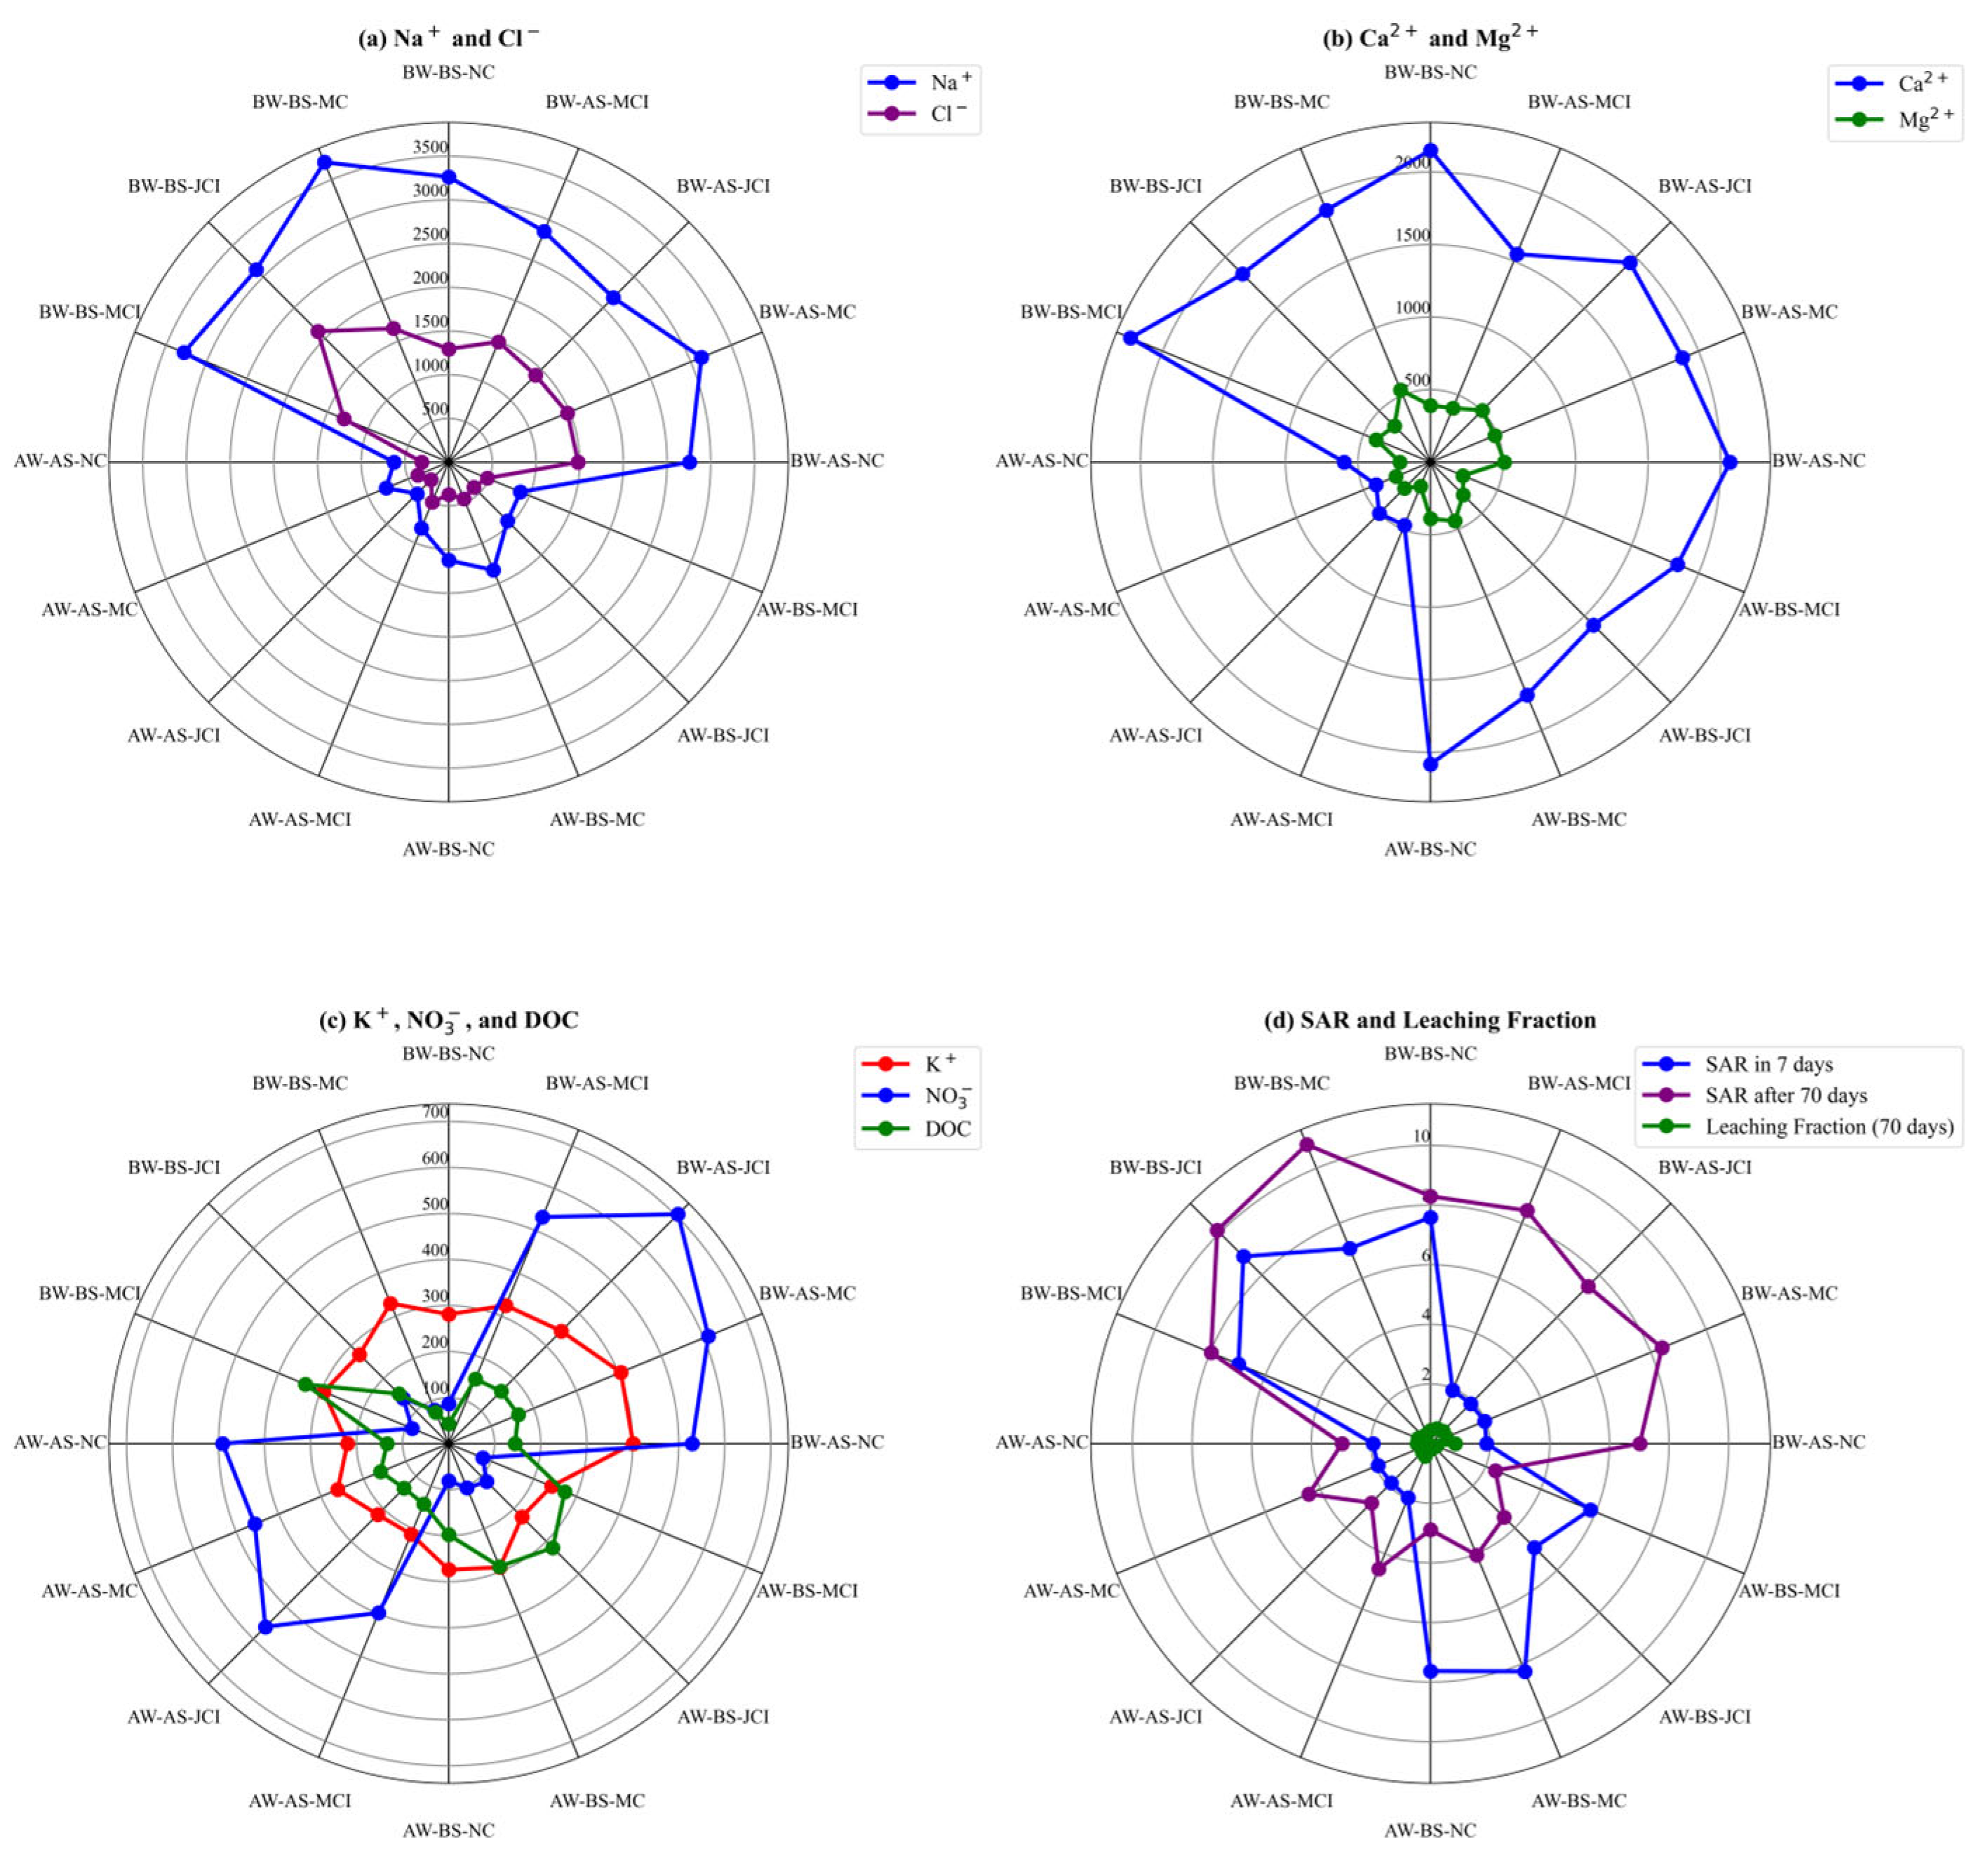
The results in Figure 2 present the mass of leaching of ions (Equation (4)), leaching fraction (LF–Equation (1)), dissolved organic carbon (DOC), and SAR from soil columns treated with different combinations of irrigation water (BW and AW), soil type (AS and BS), and compost treatments, using three-way ANOVA (Table S2). Na+ leaching was the highest in BW-BS-MC (3716 ± 247 mg) and lowest in AW-AS-JCI (511 ± 53 mg), with significant effects of irrigation water, soil quality, and compost (p = 0.000) (Table S2 and Figure 2c). The significant effects of irrigation water (p = 0.000), soil quality, and compost on Na+ leaching align with previous findings that highlight the higher salinity of brackish water and the buffering effect of agricultural soil and compost applications on Na+ mobility [26]. For example, a previous study [48] demonstrated that rice-straw biochar and humic acid reduced Na+ accumulation and improved maize growth under saline soil conditions.
Na+ is a key factor in soil sodicity, and excessive Na+ can lead to soil structure degradation, reduced permeability, and lower water infiltration [49]. This study’s findings align with previous research showing that irrigation with brackish water increases Na+ leaching, while compost, especially Johnson-Su compost, with its higher cation exchange capacity and abundance of carboxylic groups, helps mitigate sodium buildup in soil by enhancing aggregation and retaining exchangeable sites, thereby protecting soil structure and moisture retention [26,50] (Table 2).
Ca2+ leaching reached its maximum in BW-BS-MCI (2239 ± 74 mg) and minimum in AW-AS-MC (407 ± 17 mg), with the influence of IW, S, C, and interactions of IW × S and S × C showing significant effects (p < 0.05), suggest that brackish water, due to its higher salinity and high Ca2+, increases Ca2+ mobility, while agricultural soil and compost retain more Ca2+ in the root zone (Table S2 and Figure 2b). High Ca2+ in irrigation water and soil can help alleviate the negative effects of sodium by displacing it from the soil exchange sites and improving soil structure. Ca2+ plays a critical role in improving soil structure by promoting flocculation, which stabilizes soil aggregates and improves permeability in illite soils [51].
Mg2+ leaching peaked in BW-BS-MC (539 ± 47 mg) and was the lowest in AW-AS-MCI (179 ± 38 mg), influenced significantly by all the factors and interactions excluding IW × C (p = 0.902) (Table S2). Mg2+ is essential for plant growth, as it serves as the central atom in the chlorophyll molecule and aids in enzyme activation [52]. The results show significant effects of IW, S, C, and IW × S (p < 0.05) on Mg2+ leaching, with compost treatments generally reducing Mg2+ leaching, likely due to the improved soil organic matter content, which helps retain nutrients [37]. This further highlights the role of compost in nutrient retention and minimizing leaching losses in soils.
K+ leaching was the highest in BW-AS-MC (405 ± 39 mg) and the lowest in AW-AS-MCI (213 ± 28 mg), with significant main effects but limited interaction effects (p < 0.05 for IW, C, and IW × S) (Table S2). Higher K+ leaching in brackish water treatments, particularly in combination with mulch compost, suggests that brackish conditions promote greater potassium movement in the soil, likely due to the displacement of K+ by Na+. JCI, especially in AS, significantly reduced K+ leaching, demonstrating the ability of organic matter in biologically active compost to bind potassium and retain it for plant use with the value of 225 ± 77 mg.
Cl leaching was the highest in BW-BS-JCI (2118 ± 694 mg) and the lowest in AW-AS-JCI (285 ± 10 mg), with significant main effects (p = 0.000 for IW and S, p = 0.005 for C). Cl is a critical micronutrient for plants but can become toxic at high concentrations, especially in brackish soils. The results suggest that compost, particularly the Johnson-Su compost with high fungi to bacteria ratio, can help mitigate Cl accumulation in BW-BS-JCI, likely by the highest leaching Cl (2118 ± 694 mg) (Table S2). Similar findings have been reported in light-salinity soils cultivated with melon (Cucumis melo L.), where biochar, cow manure, and bio-organic fertilizer reduced salt ion availability and shifted the soil microbial community. BC application in particular decreased soil EC by 19–27% and lowered Na+, K+, and Cl concentrations by 13–15%, indicating that organic materials can effectively mitigate salinity stress through both ion retention and microbial mediation [53].
SO42− leaching reached its highest in BW-BS-MCI (11476 ± 373 mg) and lowest in AW-AS-MCI (849 ± 78 mg), with significant main and interaction effects (IW × S and IW × S × C) (p = 0.000) (Table S2). SO42− is essential for plant protein synthesis and enzyme function [54]. High SO42− can damage the root system and reduce plant growth by hindering NO3 uptake and reducing microbial activity in the soil [55]. Sulfur nutrient availability regulates root elongation by affecting root indole-3-acetic acid levels and the stem cell niche [56]. Therefore, SO42− leaching in treatments with BW-BS, BW-AS, and AW-BS, can be beneficial in preventing sulfate toxicity and maintaining a balanced nutrient profile in the soil (Figure S1).
NO3 leaching was the highest in BW-AS-JCI (705 ± 43 mg) and the lowest in BW-BS-MC (79 ± 9 mg), with significant main effects (p = 0.000) and interaction of IW × S due to high NO3 in AS (Figure S1). NO3 is a critical nutrient for plant growth, as it is the most available form of N in the soil, essential for protein synthesis and overall plant health. Johnson-Su compost maintained high nitrate levels in the soil likely resulting from its microbial activity, which promotes the slow release of NO3. NO2 leaching was the highest in AW-AS-NC (52.29 ± 16.07 mg) and lowest in AW-BS-MC (0.46 ± 0.04 mg), influenced by significant main effects of S and C and interactions of IW × C, S × C, and IW × S × C (p = 0.000) (Table S2 and Figure 2a). This observation can be confirmed by the NO3 and biological composition of Johnson-Su compost in improving N dynamics in soil and AS (Figure S1 and Figure 2). In addition to cation exchange and microbial buffering, previous research has shown that vermicompost and humic acid fertilizers improve soil aggregate stability and the microstructure of macroaggregates, which enhances permeability and facilitates salt leaching in saline-alkali soils, and reduces NO3 losses [57]. These structural improvements are consistent with our observation of enhanced ion movement into deeper layers under compost-amended treatments.
The leaching fraction after 70 days was the highest in BW-AS-NC (0.83 ± 0.02) and the lowest in AW-BS-MC (0.16 ± 0.01), showing significant effects of all factors and their interactions (p < 0.05) (Table S2 and Figure 2d). The addition or incorporation of compost, regardless of the type, assisted in maintaining the leaching fraction by reducing excessive water movement through the soil, keeping the leaching fraction within an optimal range to manage salt buildup [58]. A leaching fraction of around 0.3 is considered favorable in semi-arid regions, as it helps to flush excess salts from the root zone while minimizing water wastage.
DOC values were the highest in BW-BS-MCI (337 ± 32 mg) and the lowest in BW-BS-NC (43 ± 6 mg), with significant main effects and interactions (p = 0.000) (Table S2). These findings are consistent with studies showing that brackish water irrigation, especially when combined with compost treatments, leads to increased DOC leaching due to enhanced microbial activity and organic matter decomposition in the soil [59]. DOC plays a crucial role in soil health by improving nutrient availability, promoting microbial activity, and enhancing soil structure. It is also an important indicator of soil organic matter content, which is essential for long-term soil fertility and carbon sequestration [60].
The SAR after 7 days was the highest in BW-BS-JCI (8.88 ± 1.99) and the lowest in AW-AS-JCI (1.86 ± 0.06), with significance of IW, S, IW × S, IW × C, and IW × S × C interactions (p < 0.05). This observation is due to the higher Na+ in BS soil layers initially compared to AS (Figure S1). Similar trends were observed for SAR after 70 days, with the highest in BW-BS-MC (10.86 ± 0.64) and lowest in AW-BS-MCI (2.36 ± 0.08), highlighting the long-term impact on soil sodicity (Table S2). In comparison, BW-BS-JCI recorded an SAR of 10.12 ± 1.73; however, both compost treatments helped alleviate sodicity in these soils due to their higher cation exchange capacity and the presence of carboxylic functional groups, which reduced sodium availability for plant uptake [26]. In practice, further solutions include applying controlled leaching fractions to flush excess salts and incorporating composts rich in CEC and carboxylic groups to stabilize sodium in exchangeable form and protect soil structure.
Brackish water irrigation significantly increases the leaching of ions and SAR values, indicating greater potential for soil degradation compared to agricultural water. Brackish water combined with compost treatments, particularly Johnson-Su compost, was most effective in minimizing leaching fraction and maintaining lower SAR values, promoting better soil health. Lower SAR values promote better soil health by improving water infiltration, root penetration, and overall plant growth [19]. The total amounts of individual ions supplied by the irrigation waters for each treatment are summarized in Table S3, reflecting the higher Na+, Cl, and SO42− loadings in brackish water compared to agricultural water.

3.4. Impact of Irrigation Water, Soil, and Compost Treatment on the Leaching of Ions Driving Soil Sodicity

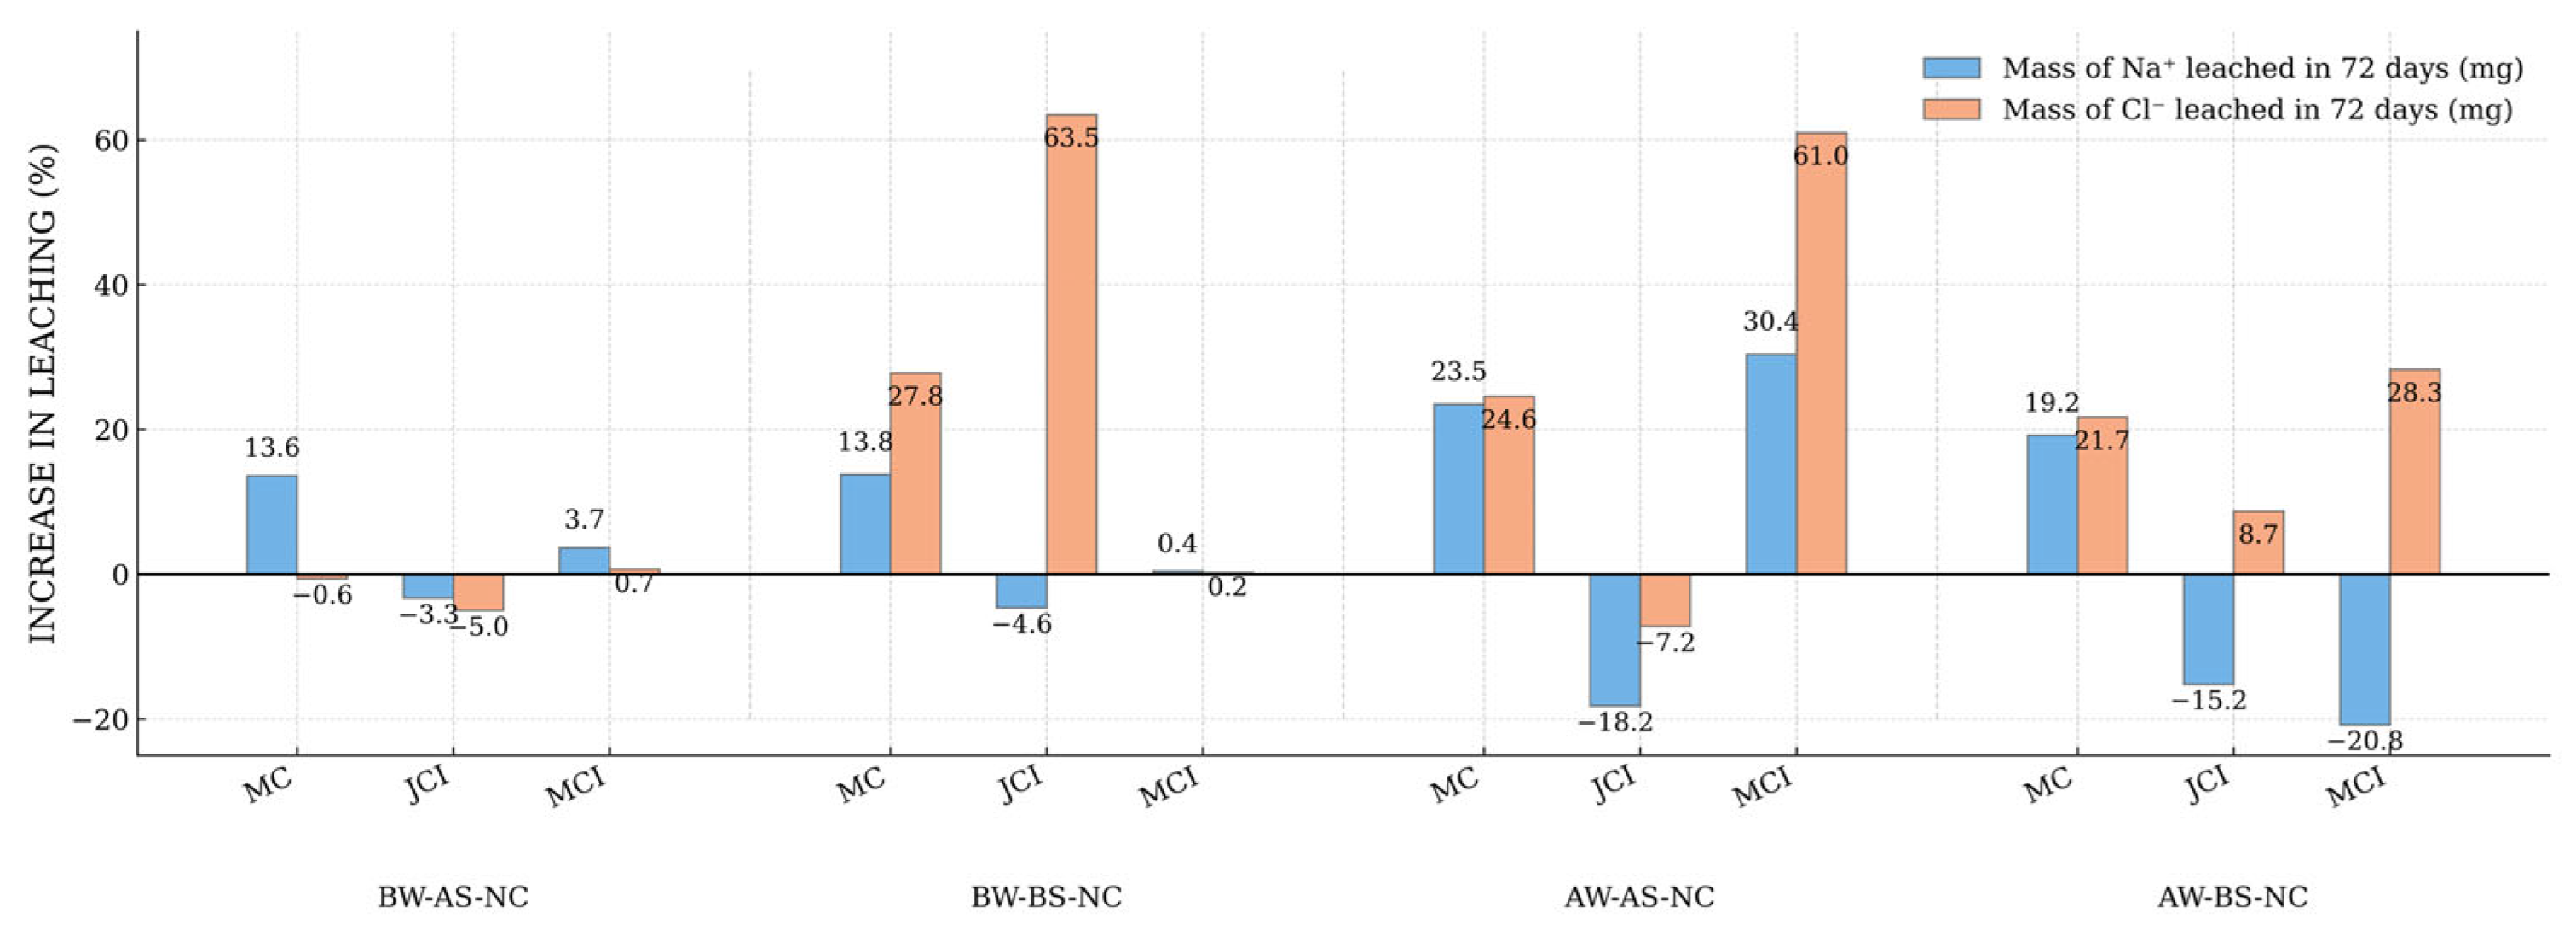
The percentage increase (Equation (4)) in the leaching of Na+ and Cl ions over 72 days, varying with different types of compost incorporation for different types of irrigation water and soil, compared to no-compost (NC) columns, is displayed in Figure 3.
Na+ leaching increased by 13.6% with mulch compost and decreased by 0.6% with Johnson-Su incorporated (JCI) compost over BW-BS-NC columns. Cl leaching exhibited a significant increase of 63.5% with JCI treatment and a slight decrease of 4.6% for Na+ with JCI compost. This behavior indicates that JCI compost tends to retain Na+ due to soil cation exchange capacity (CEC) but enhances Cl mobility, likely due to the anionic nature of Cl, which is less likely to be bound by the organic compounds in compost [61]. Na+ and Cl leaching increased by 13.8% and 27.8%, respectively, with mulch compost compared to BW-BS-NC columns. The chelation of Na+ ions by the carboxylic group in compost or cation exchange capacity may reduce the leaching of Na+ [26,61]. This was further confirmed by the total mass of Na+ in the topsoil layer at the end of the experiment (Figure S3). This finding is consistent with earlier research that identified increased leaching of Na+ and Cl in soils with lower organic matter content and cation exchange capacity when irrigated with brackish water [62].
Na+ leaching increased by 23.5% with mulch compost and decreased by 18.2% with JCI compost over AW-AS-NC treatment columns. Cl leaching showed a significant increase of 61.0% with mulch compost incorporated (MCI) and a decrease of 7.2% with JCI compost. Na+ leaching increased by 19.2% with mulch compost; however, it decreased by 15.2% with JCI compost, while Cl leaching increased by 21.7% with mulch compost and by 8.7% with JCI compost over AW-AS-NC columns. Na+ leaching decreased by 20.8% with MCI further, while Cl leaching increased by 28.3% with MCI. MC and irrigation water added Cl to the soil columns. The results suggest that mulch compost generally increases the leaching of both Na+ and Cl upon AW-AS-NC, indicating that this compost type may facilitate the movement of these ions through the soil profile, potentially due to a lack of sufficient organic matter or microbial activity [62]. Conversely, JCI compost often results in decreased leaching of Na+ and enhanced leaching of Cl. Although JCI increased Cl leaching, most of the elevated Cl was detected in the deeper 30–45 cm soil layer, indicating downward movement rather than accumulation in the root zone. The BS soil increased leaching of Cl and Na+ regardless of the type of compost and irrigation water due to its reduced ability to retain ions compared to AS (Figure S4).

3.5. Principal Component Analysis of Ion Leaching and Sodicity Under Irrigation, Soil, and Compost Treatments

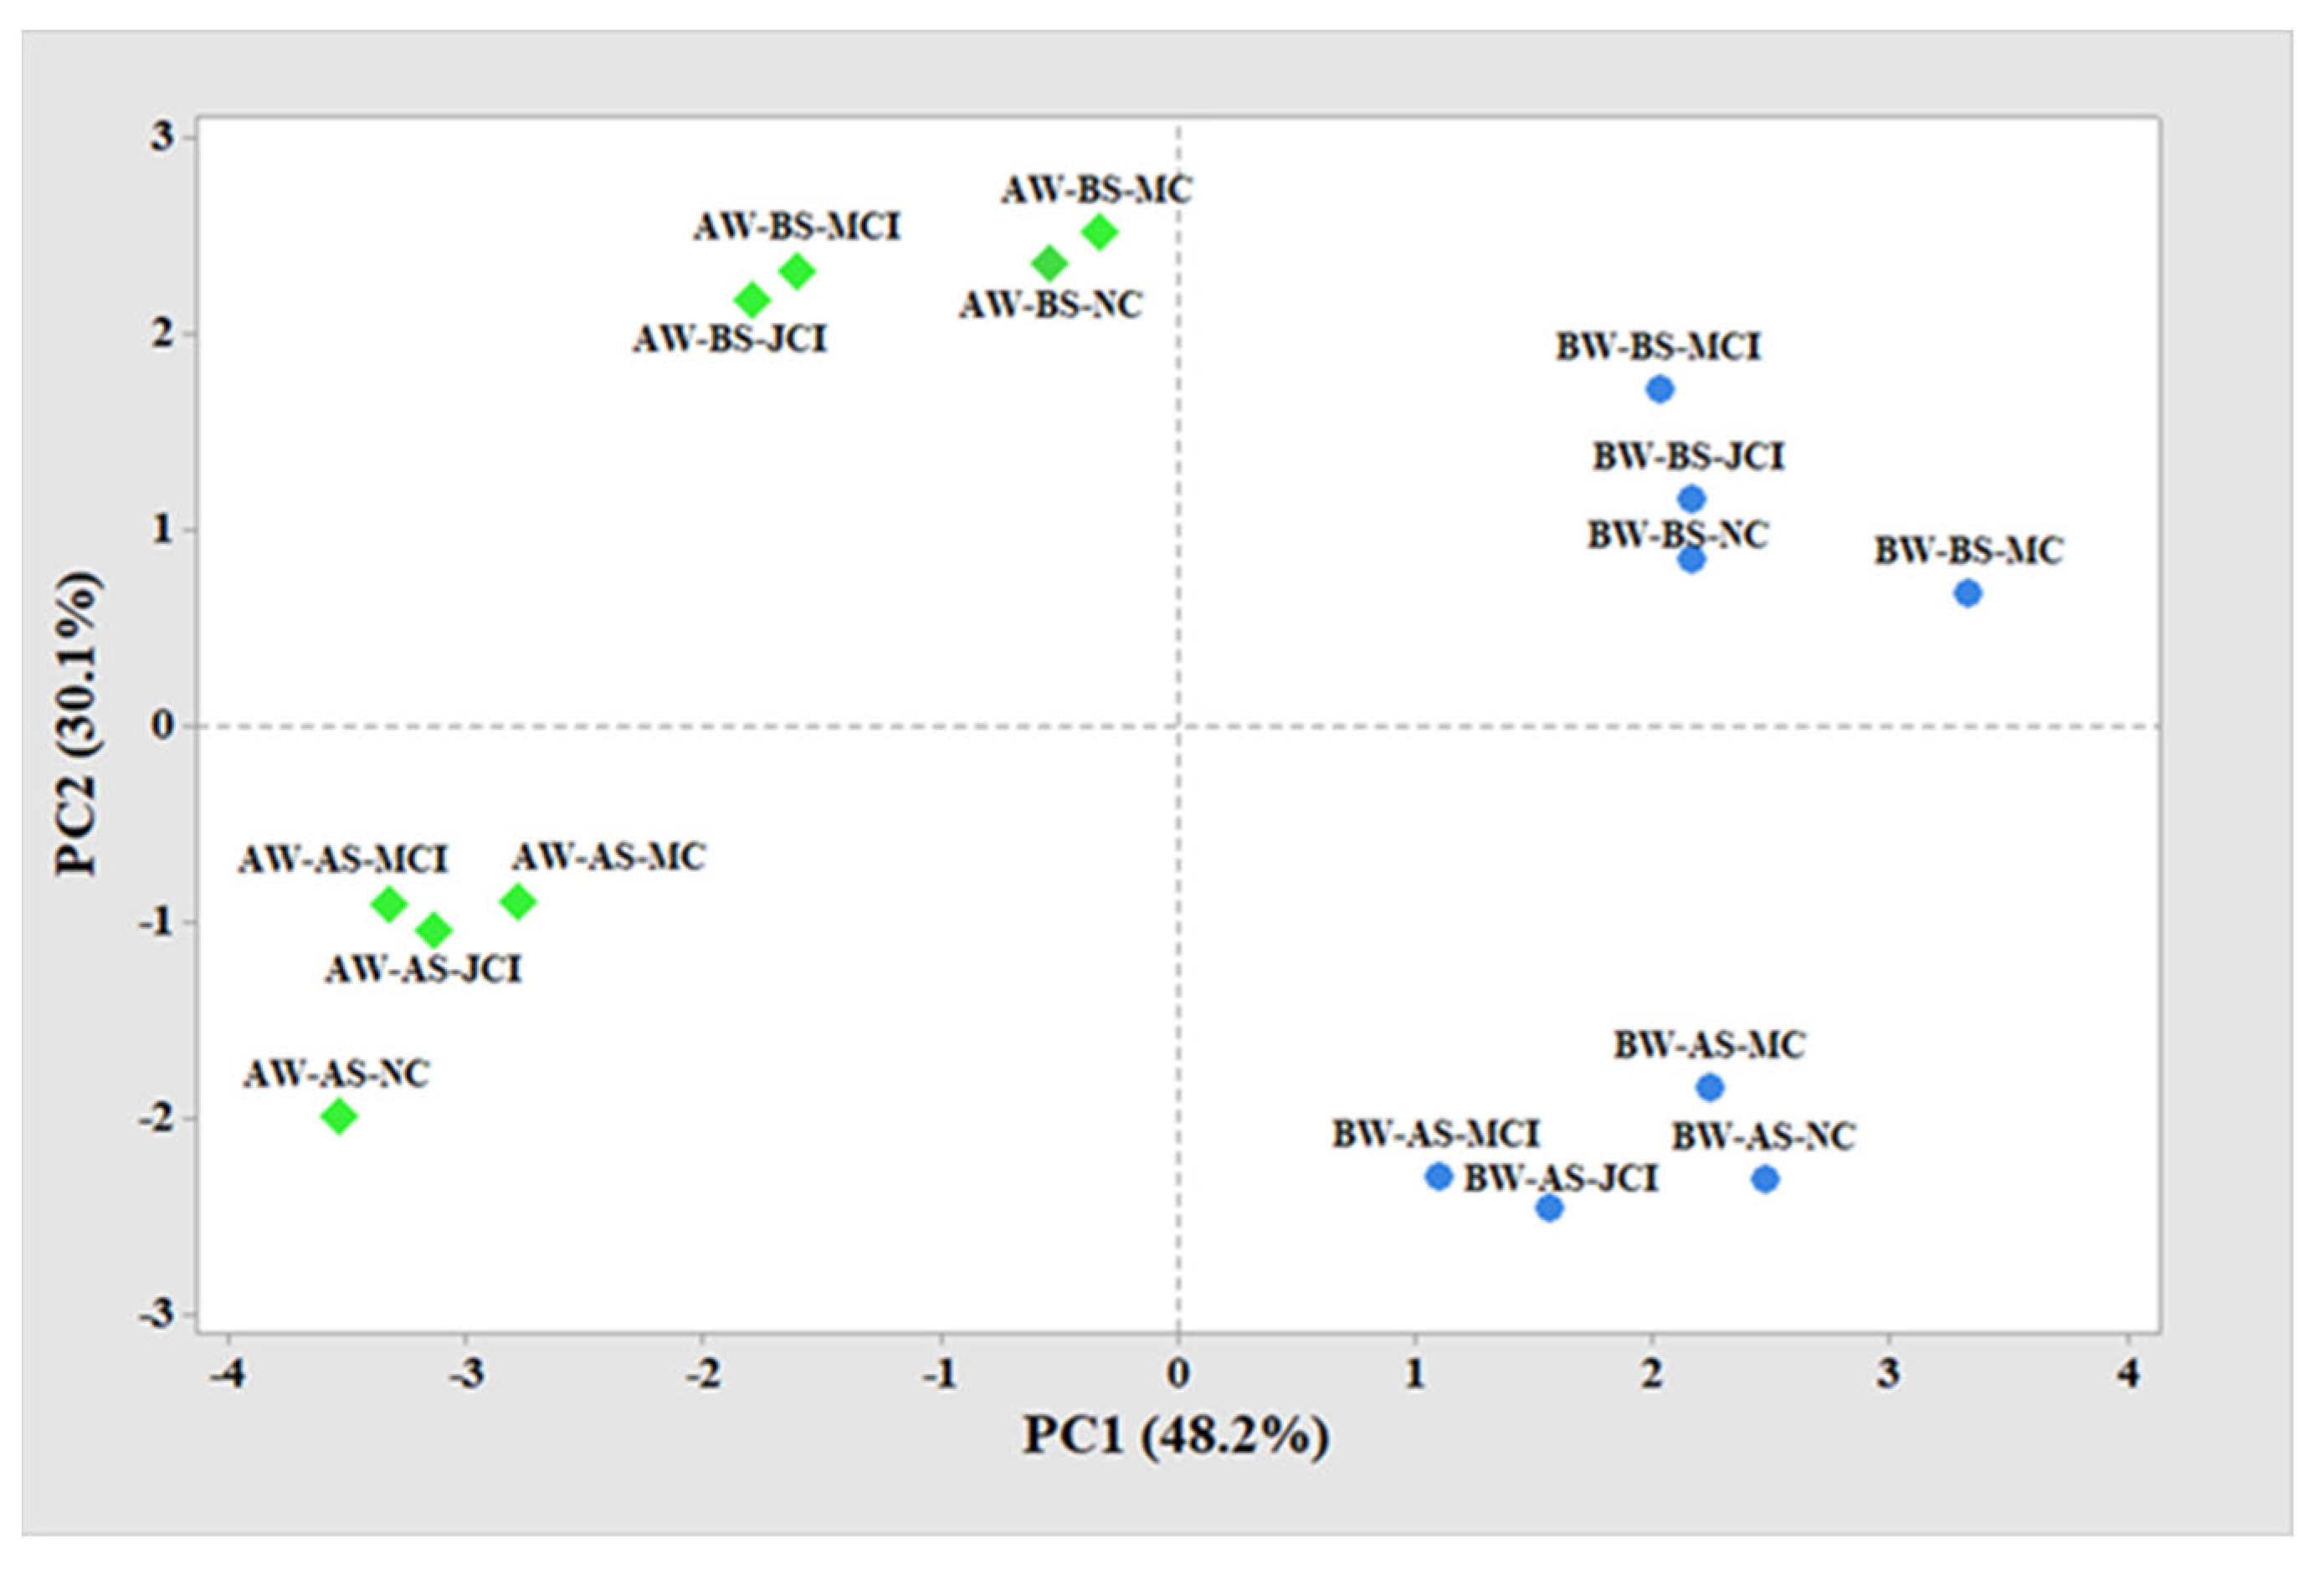
Figure 4 and Table S4 present the results from the Principal Component Analysis (PCA) of leached ions (Na+, Ca2+, Mg2+, K+, Cl, NO3, NO2, SO42−), DOC, SAR at 7 days and 72 days, and leaching fraction after 70 days of irrigation. The PCA score plot (Figure 4) illustrates the clustering of treatment groups based on the multivariate impact of irrigation water, soil quality, and compost treatments on ion leaching. Principal Component 1 (PC1) and Principal Component 2 (PC2) explain 48.2% and 30.1% of the total variance, respectively, cumulatively accounting for 78.3% of the variance in the data. PC1 is primarily associated with the total mass of Na+ (loading = 0.401), Cl (loading = 0.373), SO42− (loading = 0.370), SAR after 72 days (loading = 0.364), DOC (loading = −0.075), NO2 (loading = −0.092), and NO3 (loading = −0.061). PC2 is primarily associated with the total mass of NO3 (loading = −0.492), NO2 (loading = −0.356), SAR in 7 days (loading = 0.455), and DOC (loading = 0.287). The factor loadings (<0.5) indicate moderate correlations of individual variables with the principal components; nevertheless, they provide useful insights into relative variable importance.
This indicates that treatments with high values in PC1 are characterized by higher leaching of Na+, Cl, and SO42−, as well as higher SAR values. This reflects the salinity-sodicity gradient driven by BW irrigation and saline soil conditions. High values in PC2 were characterized by higher SAR in 7 days values, whereas lower values of PC2 and PC2 were indicated by higher NO3 and NO2. Treatments such as BW-BS-NC, BW-BS-MC, BW-BS-JCI, and BW-BS-MCI were clustered on the positive side of PC1 and PC2, indicating higher ion leaching responsible for salinity issues associated with BW and BS combinations.
Treatments like AW-BS-MCI, AW-AS-JCI, and AW-AS-MC are clustered on the negative side of PC2, reflecting lower nitrate leaching and lower SAR in 7 days, indicating better soil and water management practices with AW and AS. PC2 was mainly associated with early SAR (7 days), nitrate, and nitrite, highlighting the nutrient dynamics and short-term nitrogen mobility in the soil profile. The separation of treatment clusters in the PCA plot highlights the distinct effects of irrigation water, soil quality, and compost treatments on ion leaching and soil properties. AS generally exhibited higher leaching of NO3 and NO2 due to the high mass of these ions in the initial soil and induced ion mobility (Figure S1). These interpretations suggest that PC1 captures long-term salinity stress, while PC2 reflects nitrogen cycling and short-term ionic adjustments.

3.6. Impact on Plant Growth Parameters

Table 4 describes the percentage increase in growth parameters, including chlorophyll content, plant height, wet biomass, and root length, with varying types of compost treatment for different irrigation water and soil quality, compared to treatments without compost (NC). These results provide insights into the impact of different treatments on plant growth.
The BW-AS-NC treatment observed a 19.9% increase with JCI treatment, while mulch compost (MC) and MCI treatments resulted in decreases of 4.8% and 20.9%, respectively, in terms of chlorophyll content. The BW-BS-NC treatment showed a 30.9% increase with JCI compost, 15.5% with MC, and a 7.0% decline with MCI treatment. For the AW-AS-NC treatment, chlorophyll content increased by 42.7% with MC and 41.6% with JCI treatment, while MCI treatment caused a 16.9% rise. In the AW-BS-NC treatment, JCI treatment led to a 24.5% increase in chlorophyll content, which was reduced by 21.4% in MCI compost treatment. Regarding plant height, the BW-AS-NC treatment exhibited a 58.4% increase with JCI treatment, while MC and MCI treatments led to decreases of 25.2% and 60.9%, respectively. In the BW-BS-NC treatment, JCI treatment led to an 85.5% growth, MC treatment increased plant height by 38.1%, and MCI treatment diminished it by 20.5%. For the AW-AS-NC treatment, significant increases were observed with MC (110.2%) and JCI (213.5%) treatments, while MCI treatment showed a slight decrease of 2.0%. The AW-BS-NC treatment showed a 56.0% increase with JCI treatment and a significant reduction of 43.9% with MCI treatment. These findings suggest that JCI compost consistently enhances chlorophyll content due to high Mg2+ in JC (Figure S1), while MCI treatment tends to reduce it, particularly in BS soil, likely due to lower organic matter decomposition or nutrient availability. Mg2+ is essential for the production of chlorophyll [52].
The BW-AS-NC treatment showed a substantial 364.3% increase in wet biomass with JCI treatment, whereas MC and MCI treatments resulted in reductions of 3.6% and 58.6%, respectively. The BW-BS-NC treatment showed a significant 709.1% increase with JCI treatment, an increase of 154.5% with MC treatment, and a decrease of 22.7% with MCI treatment. Wet biomass increased significantly in MC treatment (600%) and JCI treatment (1400%), while MCI treatment showed a modest 50% increase for the AW-AS-NC treatment. The different types of compost treatment compared to AW-BS-NC treatments showed a similar trend to BW-BS-NC. The BW-AS-NC treatment revealed a significant increase of 111.3% with JCI treatment, while MC and MCI treatment led to increases of 1.5% and a decrease of 30.3%, respectively, regarding root length. In the BW-BS-NC treatment, JCI treatment increased root length by 47.5%, MC treatment by 35.1%, and MCI treatment led to a decrease of 32.2%. For the AW-AS-NC treatment, root length significantly increased with JCI (166.2%) and MC (58.3%) treatments, while MCI treatment showed an increase of 41.4%. The MCI treatment reduced the growth parameters regardless of the soil quality and IW over NC treatment columns. This reduction is likely attributed to the elevated levels of soluble salts, Na+, and Cl, coupled with the low cation exchange capacity of the mulch compost (MC). The impact was more pronounced when MC was incorporated into the soil rather than applied as a surface layer (Figure S1). The higher soluble salt content of mulch compost likely contributed to increased salinity stress when incorporated into the soil (MCI), as salts were directly introduced into the root zone, reducing biomass and root growth. In contrast, surface application (MC) limited salt contact with roots while still improving soil moisture retention, which explains its comparatively better performance. Few studies observed that composts with elevated soluble salts increased salinity stress when applied directly to the root zone, while surface application reduced salt contact with roots [63,64]. The application of JCI compost significantly increased root length and plant height, along with other growth parameters, even under brackish water (BW) irrigation, by mitigating the adverse effects of soil salinity. This aligns with previous studies that have demonstrated the role of organic composts in enhancing plant growth in brackish conditions by improving soil structure, increasing cation exchange capacity, and promoting nutrient availability [37,61]. The ability of JCI to alleviate salinity stress is likely attributed to its high organic matter content, which enhances ion buffering and reduces sodium uptake by plants, thereby promoting overall plant vigor. JCI for the depth of 0–45 cm showed an increase in plant height by 16%, root length by 121%, wet biomass by 64% and dry biomass by 50% of dundale pea with slightly saline brackish water irrigation [32].
Table S5 further elaborates on the impact of brackish water (BW) and agricultural water (AW) on plant growth. Brackish water irrigation generally led to mixed results with both positive and negative impacts on growth parameters, depending on the compost type and soil. For example, the AW-AS-NC treatment showed significant increases in all growth parameters compared to BW-BS-NC, while the AW-AS-MC treatment demonstrated an increment in growth parameters over BW-AS-MC. When comparing AS with BS soil, BS soil generally showed better growth performance, with notable increases in plant height and wet biomass.

4. Conclusions

This study highlights the critical role of biologically active compost amendments and strategic irrigation practices in mitigating soil salinity and improving agricultural productivity under challenging conditions such as brackish water irrigation in desert and rangeland soils.
The findings demonstrate that biologically active compost, Johnson-Su Compost, significantly enhances soil health and plant productivity through several scientifically proven mechanisms. Johnson-Su Compost incorporation promotes soil aggregation due to fungal growth, which improves soil structure and water infiltration. It reduces Na+ leaching while enhancing Cl leaching, effectively mitigating salinity impacts. Johnson-Su Compost incorporation also improves nitrogen dynamics in the soil, retaining and minimizing NO3 leaching into groundwater, which prevents contamination. These mechanisms collectively result in superior plant growth, even under brackish water irrigation, as evidenced by increased plant height, wet biomass, root length, and chlorophyll content.
Mulch compost (MC) exhibited moderate benefits compared to no-compost treatments by facilitating Na+ and Cl leaching and moderately improving soil health. However, when mulch was incorporated into the soil (MCI), it negatively impacted plant growth, likely due to insufficient organic matter or microbial activity.
Irrigation water quality played a critical role in shaping soil salinity dynamics. Freshwater irrigation consistently maintained lower soil electrical conductivity, indicating its suitability for managing salinity levels. Brackish water irrigation, on the other hand, increased soil salinity and SAR. Despite these challenges, brackish water irrigation enhanced Ca2+ mobility, which helped alleviate sodium’s adverse effects by improving soil structure through ion exchange, particularly when applied to fertile soils in combination with organic compost amendments.
Findings provide critical insights into the interactive effects of water quality, soil type, and biologically enriched composts on salinity control, nutrient leaching, and crop productivity in a controlled environment. This study underscores the value of integrating biologically active composts, such as JCI, with targeted irrigation strategies for sustainable agriculture in desert and semiarid soils irrigated with brackish water. These findings contribute to supporting the use of biologically enriched composts as effective tools for managing soil salinity, protecting groundwater quality, and enhancing crop productivity in arid and semi-arid regions. While these results are promising, the study’s duration (70 days) and greenhouse conditions represent limitations, as long-term impacts and field variability were not fully studied. Practically, the findings suggest that surface or shallow incorporation of biologically active composts can provide farmers with a feasible strategy to manage salinity while minimizing risks associated with high-salt composts. In terms of scalability, further field-based and long-term studies are needed to validate these outcomes across diverse soils and climates and to assess the economic feasibility of compost application at larger scales.

Supplementary Materials

The following supporting information can be downloaded at https://www.mdpi.com/article/10.3390/w17202927/s1: Table S1. Differences in mean ± standard deviation for initial soil moisture content (SM) and soil electrical conductivity (SEC) after first leaching for columns with different water, different soil, and soil compost treatments for brackish and agricultural water irrigation (three-way ANOVA). Table S2: Differences in mean ± standard deviation for the leached ions, Leaching Fraction (LF), DOC, and SAR values from columns of different treatments (three-way ANOVA) for two types of irrigation water and soil with four types of compost treatment. Table S3. Total mass of major ions and dissolved organic carbon (DOC) supplied by brackish water and agricultural water during 72 days of irrigation to the respective columns. Table S4: Principal Component Analysis: NO3−, NO2−, Cl, Na+, DOC, Ca2+, SO42−, Mg2+, K+, SAR in 7-day, SAR after 72 days, and LF after 70 days of irrigation. Table S5: Percentage increase in growth parameters varying types of irrigation water and soil. Figure S1: Physicochemical parameters of compost and soil. Figure S2: Biological nitrogen content in different treatment columns after 72 days of irrigation. Figure S3: Mass of Na+ of soil at the end of the experiment from columns of different treatments for two types of irrigation water and soil with four types of compost treatment. Figure S4: Percentage increase in Na+ and Cl leaching of varying types of soil with No Compost treatment (AS/BS). Figure S5. Soil texture analysis of soils.

Author Contributions

Conceptualization, S.S., S.J.W., M.F.A., B.S. and P.X.; methodology, S.S. and P.X.; validation, S.S., M.F.A. and P.X.; formal analysis, S.S. and P.X.; investigation, S.S. and P.X.; resources, B.S., M.F.A. and P.X.; data curation, S.S.; writing—original draft preparation, S.S. and P.X.; writing—review and editing, S.S., S.J.W., M.F.A., B.S. and P.X.; visualization, S.S.; supervision, P.X.; project administration, B.S., M.F.A., P.X.; funding acquisition, B.S., M.F.A., S.J.W. and P.X. All authors have read and agreed to the published version of the manuscript.

Funding

Funding support was provided by the Innovations at the Nexus of Food, Energy, and Water Systems (INFEWS) program of the National Science Foundation under award number 1856052 to the University of North Texas (UNT), New Mexico State University (NMSU), and Colorado State University (CSU).

Data Availability Statement

Data are contained within the article and Supplementary Materials.

Acknowledgments

The authors thank the Brackish Groundwater National Desalination Research Facility (BGNDRF) for hosting the field experiment and David Johnson for providing Johnson-Su compost.

Conflicts of Interest

The authors declare no conflicts of interest.

References

  1. Sekaran, U.; Kotlar, A.M.; Kumar, S. Soil health and soil water. In Soil Hydrology in a Changing Climate; CSIRO Publishing: Clayton South, Australia, 2022; Volume 39, pp. 39–57. [Google Scholar]
  2. Doran, J.W.; Zeiss, M.R. Soil health and sustainability: Managing the biotic component of soil quality. Appl. Soil Ecol. 2000, 15, 3–11. [Google Scholar] [CrossRef]
  3. Monther, M.T.; Kholoud, M.A.; Yahia, A.O.; DanielI, I.L. Soil health and sustainable agriculture. Sustainability 2020, 12, 4859. [Google Scholar] [CrossRef]
  4. Tarafdar, J. Role of soil biology on soil health for sustainable agricultural production. In Structure and Functions of Pedosphere; Springer: Berlin/Heidelberg, Germany, 2022; pp. 67–81. [Google Scholar]
  5. Yang, T.; Siddique, K.H.; Liu, K. Cropping systems in agriculture and their impact on soil health—A review. Glob. Ecol. Conserv. 2020, 23, e01118. [Google Scholar] [CrossRef]
  6. Aytenew, M.; Bore, G. Effects of organic amendments on soil fertility and environmental quality: A review. Plant Sci 2020, 8, 112–119. [Google Scholar] [CrossRef]
  7. Saha, L.; Bauddh, K. Sustainable agricultural approaches for enhanced crop productivity, better soil health, and improved ecosystem services. In Ecological and Practical Applications for Sustainable Agriculture; Springer: Singapore, 2020; pp. 1–23. [Google Scholar]
  8. Mathur, S. Water Scarcity: Root Causes, Effects, and Possible Solutions. Ascent Int. J. Res. Anal. 2015, VI, 32.1–32.7. [Google Scholar]
  9. Nikolaou, G.; Neocleous, D.; Christou, A.; Kitta, E.; Katsoulas, N. Implementing sustainable irrigation in water-scarce regions under the impact of climate change. Agronomy 2020, 10, 1120. [Google Scholar] [CrossRef]
  10. Delanka-Pedige, H.; Cheng, X.; Munasinghe-Arachchige, S.; Bandara, G.; Zhang, Y.; Xu, P.; Schaub, T.; Nirmalakhandan, N. Conventional vs. algal wastewater technologies: Reclamation of microbially safe water for agricultural reuse. Algal Res. 2020, 51, 102022. [Google Scholar] [CrossRef]
  11. Li, C.; Gao, X.; Li, S.; Bundschuh, J. A review of the distribution, sources, genesis, and environmental concerns of salinity in groundwater. Environ. Sci. Pollut. Res. 2020, 27, 41157–41174. [Google Scholar] [CrossRef]
  12. Shrivastava, P.; Kumar, R. Soil salinity: A serious environmental issue and plant growth promoting bacteria as one of the tools for its alleviation. Saudi J. Biol. Sci. 2015, 22, 123–131. [Google Scholar] [CrossRef]
  13. Hussain, S.; Shaukat, M.; Ashraf, M.; Zhu, C.; Jin, Q.; Zhang, J. Salinity stress in arid and semi-arid climates: Effects and management in field crops. Clim. Change Agric. 2019, 13, 201–226. [Google Scholar]
  14. Katerji, N.; Van Hoorn, J.; Hamdy, A.; Mastrorilli, M. Salt tolerance classification of crops according to soil salinity and to water stress day index. Agric. Water Manag. 2000, 43, 99–109. [Google Scholar] [CrossRef]
  15. Asana, R.; Kale, V. A study of salt tolerance of four varieties of wheat. Indian J. Plant Physiol. 1965, 8, 5–22. [Google Scholar]
  16. Sonneveld, C.; Van der Burg, A. Sodium chloride salinity in fruit vegetable crops in soilless culture. Neth. J. Agric. Sci. 1991, 39, 115–122. [Google Scholar] [CrossRef]
  17. Yan, S.; Zhang, B.; Zhang, T.; Feng, H. A revised saline water quality assessment method considering including Mg2+/Na+ as a new indicator for an arid irrigated area. J. Hydrol. 2024, 639, 131619. [Google Scholar] [CrossRef]
  18. Ayers, R.S.; Westcot, D.W. Water Quality for Agriculture. In FAO Irrigation and Drainage Paper; FAO: Rome, Italy, 1985. [Google Scholar]
  19. Tomaz, A.; Palma, P.; Fialho, S.; Lima, A.; Alvarenga, P.; Potes, M.; Costa, M.J.; Salgado, R. Risk assessment of irrigation-related soil salinization and sodification in Mediterranean areas. Water 2020, 12, 3569. [Google Scholar] [CrossRef]
  20. Demo, A.H.; Gemeda, M.K.; Abdo, D.R.; Guluma, T.N.; Adugna, D.B. Impact of soil salinity, sodicity, and irrigation water salinity on crop production and coping mechanism in areas of dryland farming. Agrosystems Geosci. Environ. 2025, 8, e70072. [Google Scholar] [CrossRef]
  21. Khorsandi, F.; Anagholi, A. Reproductive compensation of cotton after salt stress relief at different growth stages. J. Agron. Crop Sci. 2009, 195, 278–283. [Google Scholar] [CrossRef]
  22. Joseph, E.A.; Mohanan, K. A study on the effect of salinity stress on the growth and yield of some native rice cultivars of Kerala state of India. Agric. Fish 2013, 2, 141–150. [Google Scholar]
  23. Wang, H.; Zheng, C.; Ning, S.; Cao, C.; Li, K.; Dang, H.; Wu, Y.; Zhang, J. Impacts of long-term saline water irrigation on soil properties and crop yields under maize-wheat crop rotation. Agric. Water Manag. 2023, 286, 108383. [Google Scholar] [CrossRef]
  24. Gleick, P.H. Roadmap for sustainable water resources in southwestern North America. Proc. Natl. Acad. Sci. USA 2010, 107, 21300–21305. [Google Scholar] [CrossRef]
  25. Sengupta, S.; Nawaz, T.; Beaudry, J. Nitrogen and phosphorus recovery from wastewater. Curr. Pollut. Rep. 2015, 1, 155–166. [Google Scholar] [CrossRef]
  26. Duong, T.T.T. Compost Effects on Soil Properties and Plant Growth. Ph.D. Thesis, School of Agriculture, Food and Wine, The University of Adelaide, Adelaide, Australia, 2013. [Google Scholar]
  27. El Hasini, S.; De Nobili, M.; Azim, K.; Douaik, A.; Laghrour, M.; El Idrissi, Y.; El Alaoui El Belghiti, M.; Zouahri, A. The influence of compost humic acid quality and its ability to alleviate soil salinity stress. Int. J. Recycl. Org. Waste Agric. 2020, 9, 21–31. [Google Scholar]
  28. Mohammadshirazi, F.; Brown, V.; Heitman, J.; McLaughlin, R. Effects of tillage and compost amendment on infiltration in compacted soils. J. Soil Water Conserv. 2016, 71, 443–449. [Google Scholar] [CrossRef]
  29. Singh, T.B.; Ali, A.; Prasad, M.; Yadav, A.; Shrivastav, P.; Goyal, D.; Dantu, P.K. Role of organic fertilizers in improving soil fertility. In Contaminants in Agriculture: Sources, Impacts and Management; Springer: Cham, Switzerland, 2020; pp. 61–77. [Google Scholar]
  30. Lakhdar, A.; Rabhi, M.; Ghnaya, T.; Montemurro, F.; Jedidi, N.; Abdelly, C. Effectiveness of compost use in salt-affected soil. J. Hazard. Mater. 2009, 171, 29–37. [Google Scholar] [CrossRef] [PubMed]
  31. Gross, A.; Glaser, B. Meta-analysis on how manure application changes soil organic carbon storage. Sci. Rep. 2021, 11, 5516. [Google Scholar] [CrossRef]
  32. Suvendran, S.; Johnson, D.; Acevedo, M.; Smithers, B.; Xu, P. Effect of Irrigation Water Quality and Soil Compost Treatment on Salinity Management to Improve Soil Health and Plant Yield. Water 2024, 16, 1391. [Google Scholar] [CrossRef]
  33. Suvendran, S.; Johnson, D.; Acevedo, M.; Smithers, B.; Xu, P. Electromagnetic Water Treatment and Soil Compost Incorporation to Alleviate the Impact of Soil Salinization. Water 2024, 16, 1577. [Google Scholar] [CrossRef]
  34. El-Beltagi, H.S.; Basit, A.; Mohamed, H.I.; Ali, I.; Ullah, S.; Kamel, E.A.; Shalaby, T.A.; Ramadan, K.M.; Alkhateeb, A.A.; Ghazzawy, H.S. Mulching as a sustainable water and soil saving practice in agriculture: A review. Agronomy 2022, 12, 1881. [Google Scholar] [CrossRef]
  35. Yasmina, M.; Rahmanb, M.; Shikhac, F.; Rahmand, M.; Rahmane, J.; Tipuf, M. Effect of mulch on soil temperature, soil moisture conservation and yield of chilli. J. Clean WAS (JCleanWAS) 2020, 4, 36–39. [Google Scholar] [CrossRef]
  36. Kumar, S.D.; Lal, B.R. Effect of mulching on crop production under rainfed condition: A review. Int. J. Res. Chem. Environ. 2012, 2, 8–20. [Google Scholar]
  37. Nehela, Y.; Mazrou, Y.S.; Alshaal, T.; Rady, A.M.; El-Sherif, A.M.; Omara, A.E.-D.; El-Monem, A.M.A.; Hafez, E.M. The integrated amendment of sodic-saline soils using biochar and plant growth-promoting rhizobacteria enhances maize (Zea mays L.) resilience to water salinity. Plants 2021, 10, 1960. [Google Scholar] [CrossRef] [PubMed]
  38. Mawof, A.; Prasher, S.; Bayen, S.; Nzediegwu, C. Effects of biochar and biochar-compost mix as soil amendments on soil quality and yield of potatoes irrigated with wastewater. J. Soil Sci. Plant Nutr. 2021, 21, 2600–2612. [Google Scholar] [CrossRef]
  39. Omara, A.E.-D.; Hafez, E.M.; Osman, H.S.; Rashwan, E.; El-Said, M.A.; Alharbi, K.; El-Moneim, D.A.; Gowayed, S.M. Collaborative impact of compost and beneficial rhizobacteria on soil properties, physiological attributes, and productivity of wheat subjected to deficit irrigation in salt affected soil. Plants 2022, 11, 877. [Google Scholar] [CrossRef] [PubMed]
  40. Buchanan, M.; Brinton, W.; Shields, F.; West, J.; Thompson, W. Compost Maturity Index; California Integrated Waste Management Board (CIWMB): Sacramento, CA, USA, 2001. [Google Scholar]
  41. Suvendran, S.; Acevedo, M.F.; Smithers, B.; Walker, S.J.; Xu, P. Soil Fertility and Plant Growth Enhancement Through Compost Treatments Under Varied Irrigation Conditions. Agriculture 2025, 15, 734. [Google Scholar] [CrossRef]
  42. Johnson, D. Johnson Su Bioreactor. 2016 March 2016 [cited 2022]. Available online: https://www.youtube.com/watch?v=DxUGk161Ly8 (accessed on 12 March 2022).
  43. Baath, G.S.; Shukla, M.K.; Bosland, P.W.; Walker, S.J.; Saini, R.K.; Shaw, R. Water use and yield responses of chile pepper cultivars irrigated with brackish groundwater and reverse osmosis concentrate. Horticulturae 2020, 6, 27. [Google Scholar] [CrossRef]
  44. Ghimire, R.; Thapa, V.R.; Acosta-Martinez, V.; Schipanski, M.; Slaughter, L.C.; Fonte, S.J.; Shukla, M.K.; Bista, P.; Angadi, S.V.; Mikha, M.M. Soil health assessment and management framework for water-limited environments: Examples from the Great Plains of the USA. Soil Syst. 2023, 7, 22. [Google Scholar] [CrossRef]
  45. Liao, Y.; Cao, H.-X.; Liu, X.; Li, H.-T.; Hu, Q.-Y.; Xue, W.-K. By increasing infiltration and reducing evaporation, mulching can improve the soil water environment and apple yield of orchards in semiarid areas. Agric. Water Manag. 2021, 253, 106936. [Google Scholar] [CrossRef]
  46. Singh, V.K.; Malhi, G.S.; Kaur, M.; Singh, G.; Jatav, H.S. Use of organic soil amendments for improving soil ecosystem health and crop productivity. In Ecosystem Services; Nova Science Publishers, Inc.: Suite N Hauppauge, NY, USA, 2022. [Google Scholar]
  47. Aggelides, S.; Londra, P. Effects of compost produced from town wastes and sewage sludge on the physical properties of a loamy and a clay soil. Bioresour. Technol. 2000, 71, 253–259. [Google Scholar] [CrossRef]
  48. Malik, Z.; Malik, N.; Noor, I.; Kamran, M.; Parveen, A.; Ali, M.; Sabir, F.; Elansary, H.O.; El-Abedin, T.K.Z.; Mahmoud, E.A. Combined Effect of Rice-Straw Biochar and Humic Acid on Growth, Antioxidative Capacity, and Ion Uptake in Maize (Zea mays L.) Grown Under Saline Soil Conditions. J. Plant Growth Regul. 2023, 42, 3211–3228. [Google Scholar] [CrossRef]
  49. Beecher, H. Effect of saline water on rice yields and soil properties in the Murrumbidgee Valley. Aust. J. Exp. Agric. 1991, 31, 819–823. [Google Scholar] [CrossRef]
  50. Phuong, N.T.K.; Khoi, C.M.; Ritz, K.; Linh, T.B.; Minh, D.D.; Duc, T.A.; Sinh, N.V.; Linh, T.T.; Toyota, K. Influence of rice husk biochar and compost amendments on salt contents and hydraulic properties of soil and rice yield in salt-affected fields. Agronomy 2020, 10, 1101. [Google Scholar] [CrossRef]
  51. Yan, S.; Zhang, T.; Zhang, B.; Liu, Z.; Cheng, Y.; Feng, H. Cation composition of saline water affects soil structure by altering the formation of macropores and cracks in illite soils. Soil Tillage Res. 2024, 239, 106052. [Google Scholar] [CrossRef]
  52. Ayyaswamy, G. A Super-Ion Called Magnesium: The Unsung Hero of Vitality and Well-Being; Notion Press: Chennai, India, 2023. [Google Scholar]
  53. Mao, X.; Yang, Y.; Guan, P.; Geng, L.; Ma, L.; Di, H.; Liu, W.; Li, B. Remediation of organic amendments on soil salinization: Focusing on the relationship between soil salts and microbial communities. Ecotoxicol. Environ. Saf. 2022, 239, 113616. [Google Scholar] [CrossRef] [PubMed]
  54. Manohar, A.; Kathula, K. Role of Sulphur Nutrition in Enhancing the Productivity of Pulses and Oilseeds. Indian J. Nat. Sci. 2022, 13, 43172–43182. [Google Scholar]
  55. Likus-Cieślik, J.; Pietrzykowski, M.; Chodak, M. Chemistry of sulfur-contaminated soil substrate from a former Frasch extraction method sulfur mine leachate with various forms of litter in a controlled experiment. Water Air Soil Pollut. 2018, 229, 71. [Google Scholar] [CrossRef]
  56. Zhao, Q.; Wu, Y.; Gao, L.; Ma, J.; Li, C.Y.; Xiang, C.B. Sulfur nutrient availability regulates root elongation by affecting root indole-3-acetic acid levels and the stem cell niche. J. Integr. Plant Biol. 2014, 56, 1151–1163. [Google Scholar] [CrossRef]
  57. Liu, M.; Wang, C.; Liu, X.; Lu, Y.; Wang, Y. Saline-alkali soil applied with vermicompost and humic acid fertilizer improved macroaggregate microstructure to enhance salt leaching and inhibit nitrogen losses. Appl. Soil Ecol. 2020, 156, 103705. [Google Scholar] [CrossRef]
  58. Ning, S.; Zhou, B.; Wang, Q.; Tao, W. Evaluation of irrigation water salinity and leaching fraction on the water productivity for crops. Int. J. Agric. Biol. Eng. 2020, 13, 170–177. [Google Scholar] [CrossRef]
  59. Liu, X.; Rashti, M.R.; Dougall, A.; Esfandbod, M.; Van Zwieten, L.; Chen, C. Subsoil application of compost improved sugarcane yield through enhanced supply and cycling of soil labile organic carbon and nitrogen in an acidic soil at tropical Australia. Soil Tillage Res. 2018, 180, 73–81. [Google Scholar] [CrossRef]
  60. Su, Y.-Z.; Wang, F.; Suo, D.-R.; Zhang, Z.-H.; Du, M.-W. Long-term effect of fertilizer and manure application on soil-carbon sequestration and soil fertility under the wheat–wheat–maize cropping system in northwest China. Nutr. Cycl. Agroecosyst. 2006, 75, 285–295. [Google Scholar] [CrossRef]
  61. Kumaragamage, D.; Warren, J.; Spiers, G. Soil chemistry. In Digging into Canadian Soils: Soil Chemistry; Canadian Society of Soil Science: Ottawa, ON, Canada, 2021. [Google Scholar]
  62. Roy, S.; Chowdhury, N. Effects of leaching on the reclamation of saline soils as affected by different organic and inorganic amendments. J. Environ. Sci. Sustain. Dev. 2020, 3, 329–354. [Google Scholar] [CrossRef]
  63. Reddy, N.; Crohn, D.M. Compost induced soil salinity: A new prediction method and its effect on plant growth. Compos. Sci. Util. 2012, 20, 133–140. [Google Scholar] [CrossRef]
  64. Mahmoodabadi, M.; Yazdanpanah, N.; Sinobas, L.R.; Pazira, E.; Neshat, A. Reclamation of calcareous saline sodic soil with different amendments (I): Redistribution of soluble cations within the soil profile. Agric. Water Manag. 2013, 120, 30–38. [Google Scholar] [CrossRef]
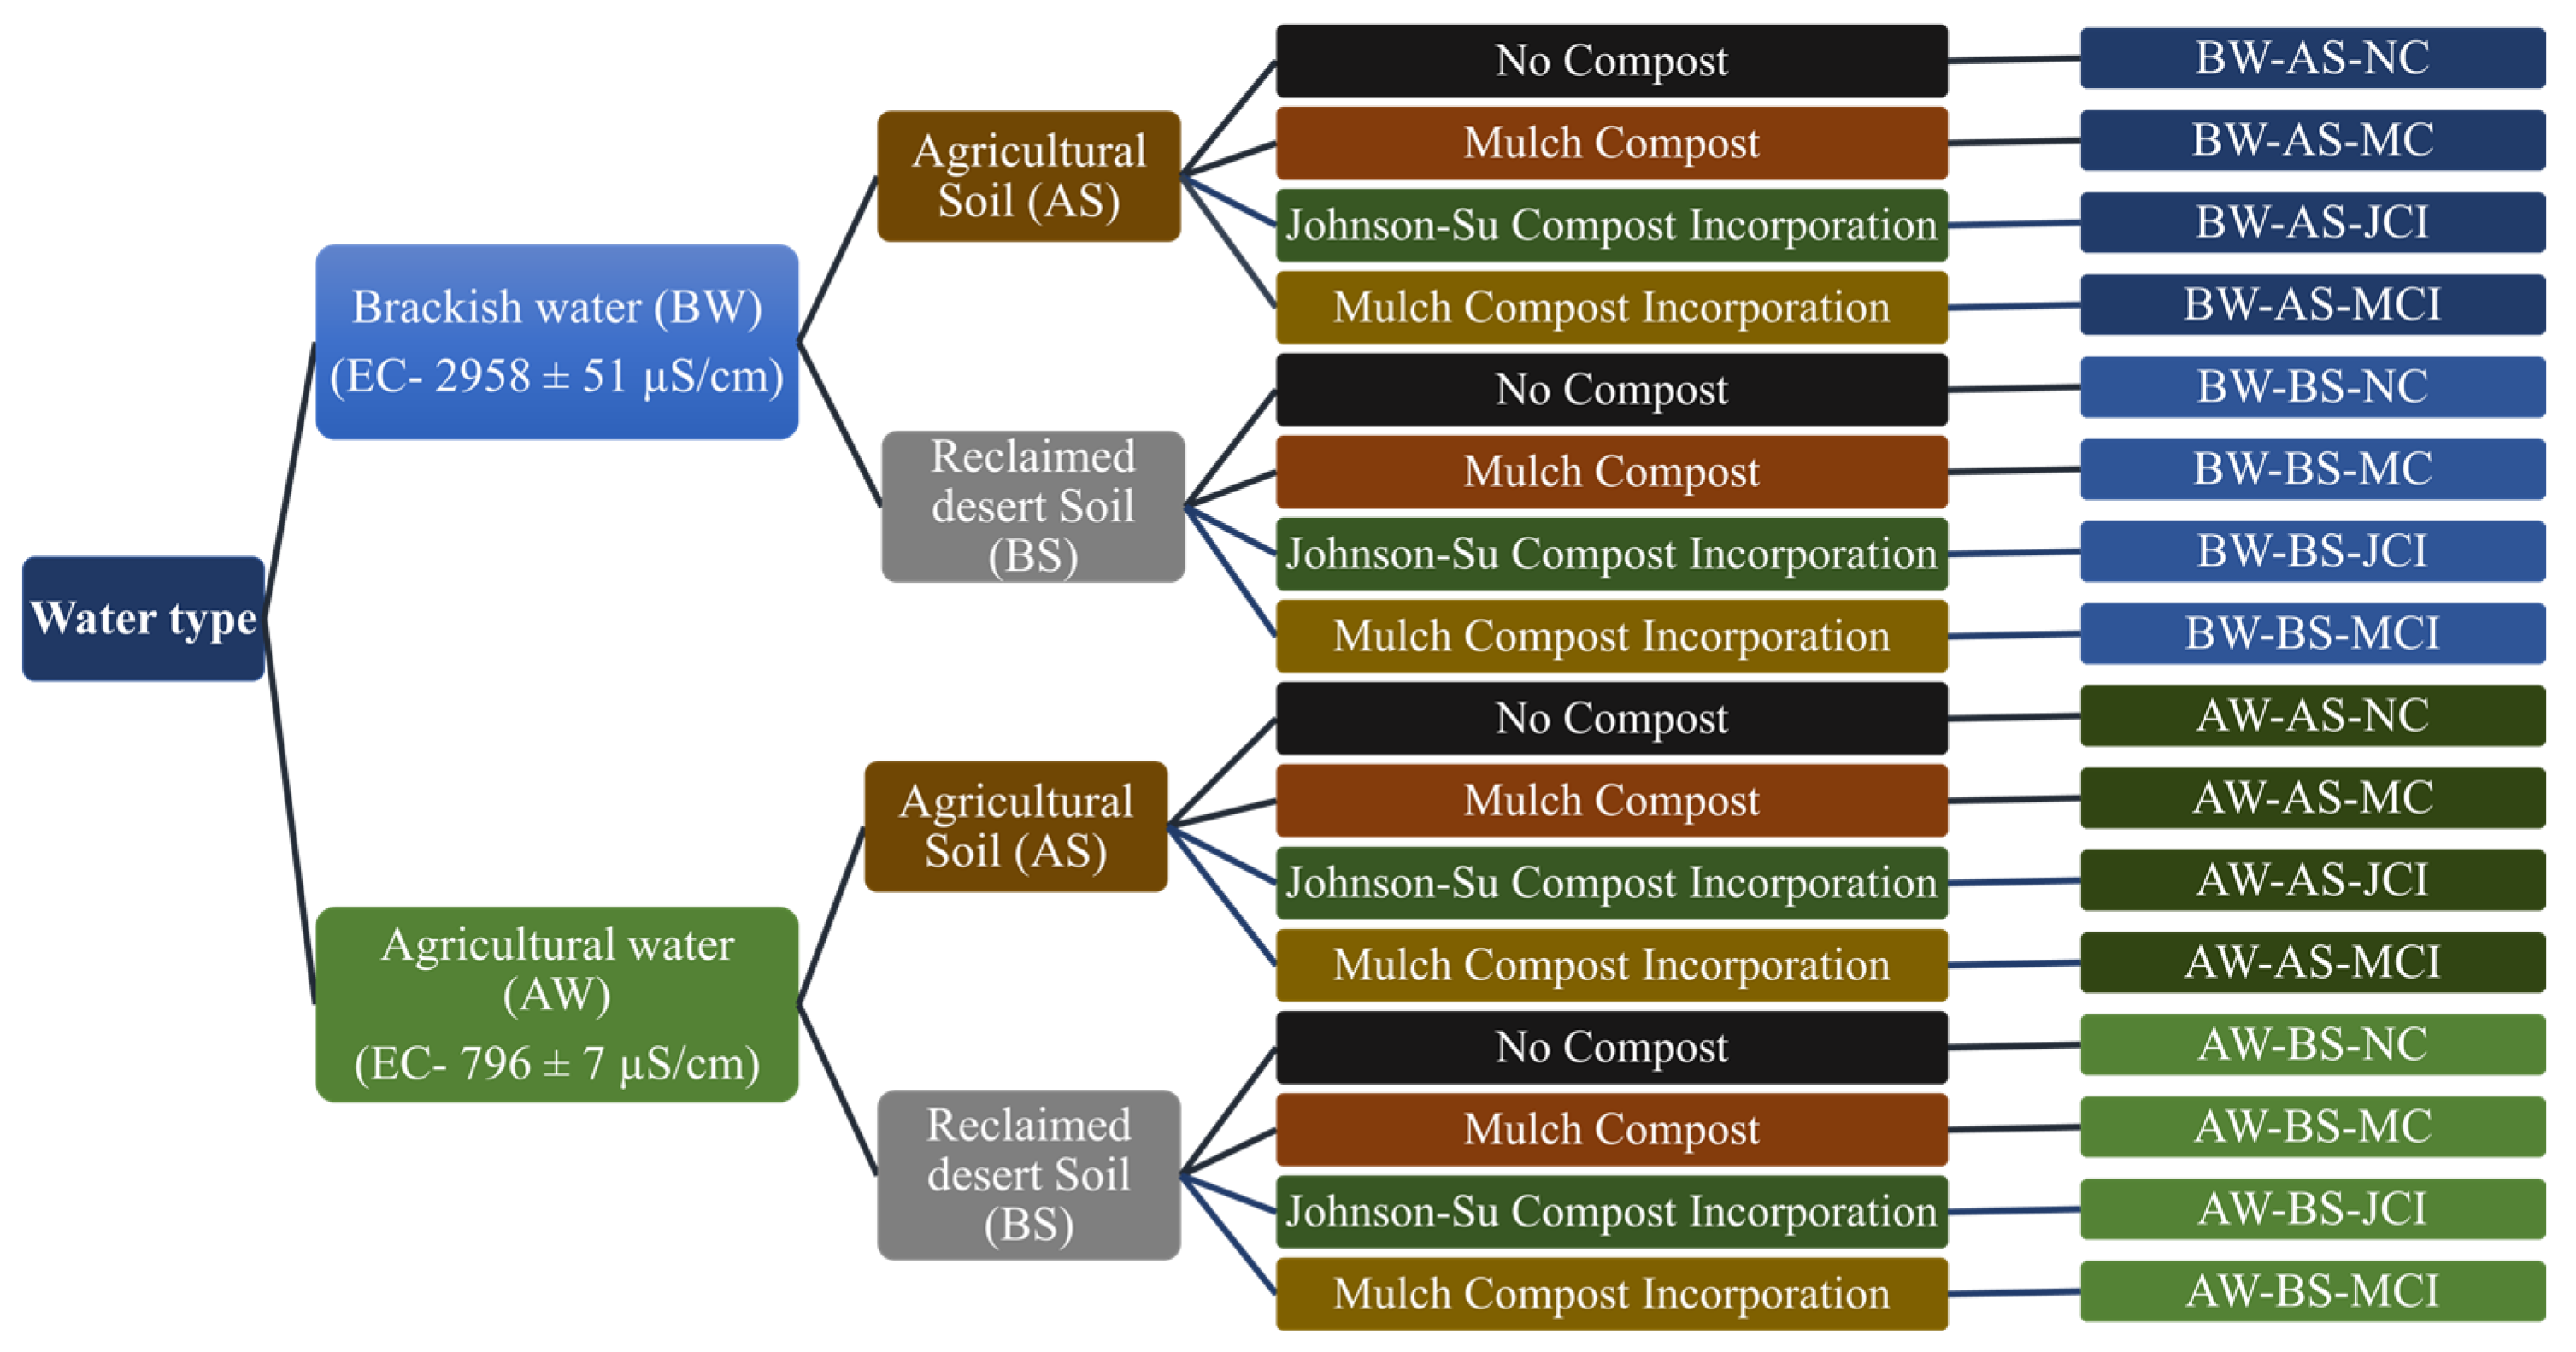
Figure 1. Overview of the experimental design showing the combination of two water types (brackish and agricultural), two soil types (agricultural soil and reclaimed desert soil), and four compost treatments: no compost (NC), mulch compost surface application (MC), Johnson-Su compost incorporation (JCI), and mulch compost incorporation (MCI). Each combination is labeled accordingly, resulting in a total of 16 treatment groups, each with three replicates.
Water 17 02927 g001
Figure 2. The leached ions, leaching fraction, DOC, and SAR values from columns of different treatments for two types of irrigation water and soil with four types of compost treatment.
Water 17 02927 g002
Figure 3. Percentage increase in Na+ and Cl leaching with varying types of compost incorporation for different irrigation water and soil with no-compost treatment.
Water 17 02927 g003
Figure 4. Principal Component Analysis (PCA) score plot displaying the clustering of treatment groups based on the multivariate impact of irrigation water, soil, and compost treatments on the ion leaching. Each point represents a treatment combination, with brackish water (BW) and agricultural water (AW) treatments distinguished by color.
Water 17 02927 g004
Table 1. Water quality parameters of irrigation water.
Irrigation WaterpHECAlkalinitySARClNO3SO42−Ca2+Mg2+Na+K+
(µS/cm)(mg/L as CaCO3) (mg/L)
Brackish water8.65 ± 0.172958 ± 5148011.7120.91.11229107.526.8522.512.15
Agricultural water7.61 ± 0.25796 ± 71556.129.40.226228.26.6139.03.55
Table 2. Differences in mean ± standard deviation for soil VWC (SM) for columns of different water, different soil, and soil compost treatments for brackish and agricultural water irrigation (three-way ANOVA).
TreatmentSoil Moisture Content (m3/m3)
0–15 cm15–30 cm30–45 cm
BW-AS-NC0.250 ± 0.02 bcde0.292 ± 0.03 ab0.300 ± 0.03 bc*
BW-AS-MC0.264 ± 0.03 abc0.302 ± 0.02 a0.329 ± 0.02 ab**
BW-AS-JCI0.271 ± 0.02 ab0.314 ± 0.02 a0.325 ± 0.03 ab**
BW-AS-MCI0.260 ± 0.02 abcd0.292 ± 0.02 ab0.307 ± 0.03 ab*
BW-BS-NC0.242 ± 0.02 cde0.252 ± 0.02 c0.254 ± 0.03 d*
BW-BS-MC0.237 ± 0.02 de0.256 ± 0.03 c0.256 ± 0.03 d*
BW-BS-JCI0.236 ± 0.01 de0.251 ± 0.02 c0.241 ± 0.01 d**
BW-BS-MCI0.241 ± 0.02 cde0.249 ± 0.02 c0.252 ± 0.02 d*
AW-AS-NC0.263 ± 0.02 abc0.302 ± 0.03 a0.313 ± 0.03 ab*
AW-AS-MC0.268 ± 0.03 ab0.315 ± 0.02 a0.335 ± 0.03 ab**
AW-AS-JCI0.275 ± 0.03 ab0.314 ± 0.02 a0.343 ± 0.02 a**
AW-AS-MCI0.284 ± 0.02 a0.299 ± 0.03 a0.328 ± 0.02 ab*
AW-BS-NC0.242 ± 0.02 cde0.258 ± 0.02 c0.256 ± 0.02 d*
AW-BS-MC0.229 ± 0.01 e0.267 ± 0.02 bc0.255 ± 0.02 d**
AW-BS-JCI0.235 ± 0.01 de0.250 ± 0.02 c0.260 ± 0.02 cd**
AW-BS-MCI0.241 ± 0.02 cde0.252 ± 0.02 c0.248 ± 0.02 d*
p-value IW0.0690.0340.015
S0.0000.0000.000
C0.0950.0200.054
IW × S0.0110.6330.176
IW × C0.2090.4760.463
S × C0.0130.0460.028
IW × S × C0.5620.1000.650
Note(s): Mean values indicated by different superscript letters are significantly different from each other (p < 0.05) and mean value a > b > c value, n = 3 replicates; p-value; C—significance of compost; S—significance of soil; IW—significance of irrigation water type; and × shows the interaction between the factors among treatments. And * (p < 0.05) and ** (p < 0.005) are significantly different between soil layers of a treatment column.
Table 3. Differences in mean ± standard deviation for soil electrical conductivity (SEC) for columns with different water, different soil, and soil compost treatments for brackish and agricultural water irrigation (three-way ANOVA).
TreatmentSoil Electrical Conductivity (mS/cm)
0–15 cm15–30 cm30–45 cm
BW-AS-NC0.777 ± 0.11 abc0.866 ± 0.11 abcd0.944 ± 0.11 bcdn.s
BW-AS-MC0.905 ± 0.10 a0.926 ± 0.09 ab1.104 ± 0.10 a**
BW-AS-JCI0.876 ± 0.11 ab1.016 ± 0.08 a1.073 ± 0.09 ab*
BW-AS-MCI0.828 ± 0.09 ab0.933 ± 0.09 ab1.017 ± 0.11 abc*
BW-BS-NC0.818 ± 0.08 ab0.964 ± 1.13 a0.879 ± 0.11 defn.s
BW-BS-MC0.751 ± 0.09 bcd0.875 ± 0.12 abcd0.852 ± 0.10 defg*
BW-BS-JCI0.776 ± 0.07 bc0.825 ± 0.08 abcde0.786 ± 0.08 efghn.s
BW-BS-MCI0.863 ± 0.07 ab0.887 ± 0.08 abc0.919 ± 0.09 cden.s
AW-AS-NC0.553 ± 0.07 e0.643 ± 0.10 e0.782 ± 0.09 fgh**
AW-AS-MC0.586 ± 0.10 e0.683 ± 0.13 cde0.870 ± 0.10 def**
AW-AS-JCI0.602 ± 0.09 e0.722 ± 0.08 bcde0.849 ± 0.08 defg**
AW-AS-MCI0.596 ± 0.08 e0.740 ± 0.08 bcde0.852 ± 0.12 defg**
AW-BS-NC0.644 ± 0.10 de0.680 ± 0.06 cde0.691 ± 0.07 hn.s
AW-BS-MC0.664 ± 0.11 cde0.697 ± 0.08 cde0.707 ± 0.08 hn.s
AW-BS-JCI0.614 ± 0.06 e0.671 ± 0.09 de0.727 ± 0.09 gh**
AW-BS-MCI0.619 ± 0.07 e0.688 ± 0.08 cde0.696 ± 0.13 h*
p-value IW0.0000.0000.000
S0.7940.1490.000
C0.3280.8250.016
IW × S0.0000.4080.103
IW × C0.6700.7820.471
S × C0.0070.0240.002
IW × S × C0.0090.3550.014
Note(s): Mean values indicated by different superscript letters are significantly different from each other (p < 0.05) and mean value a > b > c. n = 3 replicates (p-value); C—significance of compost; S—significance of soil; IW—significance of irrigation water type; and × shows the interaction between the factors among treatments. n.s—not significant, * (p < 0.05) and ** (p < 0.005) are significantly different between soil layers of a treatment column.
Table 4. Percentage increase in growth parameters with varying types of compost incorporation for different kinds of irrigation water and soil with no-compost treatment.
TreatmentCompost TypeChlorophyllPlant Height (cm)Wet Biomass (g)Root Length (cm)
Impact of compost soil treatment (Type of compost/NC) on increase in plant growth in % (values of change)
BW-AS-NCMC−4.8 (36 → 34.3)−25.2 (14.7 → 11)−3.6 (4.7 → 4.5)1.5 (15.3 → 15.5)
JCI19.9 (36 → 43.2)58.4 (14.7 → 23.3)364.3 (4.7 → 21.8)111.3 (15.3 → 32.3)
MCI−20.9 (36 → 28.5)−60.9 (14.7 → 5.7)−58.6 (4.7 → 1.9)−30.3 (15.3 → 10.7)
BW-BS-NCMC15.5 (32.8 → 37.9)38.1 (12.9 → 17.8)154.5 (3.7 → 9.4)35.1 (30.5 → 41.2)
JCI30.9 (32.8 → 42.9)85.5 (12.9 → 23.9)709.1 (3.7 → 29.9)47.5 (30.5 → 45.0)
MCI−7.0 (32.8 → 30.5)−20.5 (12.9 → 10.3)−22.7 (3.7 → 2.9)−32.2 (30.5 → 20.7)
AW-AS-NCMC42.7 (26.3→ 37.5)110.2 (8.2→ 17.2)600.0 (1.3 → 9.1)58.3 (10.5 → 16.6)
JCI41.6 (26.3 → 37.2)213.5 (8.2→ 25.7)1400.0 (1.3 → 19.5)166.2 (10.5 → 28.0)
MCI16.9 (26.3 → 30.7)−2.0 (8.2→ 8.0)50.0 (1.3 → 2.0)41.4 (10.5 → 14.8)
AW-BS-NCMC7.9 (36.3 → 30)−0.1 (17.6 → 17.6)70.0 (6.0 → 10.2)−5.9 (45.0–42.3)
JCI24.5 (36.3 → 45.2)56.0 (17.6 → 27.5)350.0 (6.0 → 27.0)0.0 (45.0–45.0)
MCI−21.4 (36.3 → 28.5)−43.9 (17.6 → 9.9)−56.5 (6.0 → 2.6)−63.9 (45.0 → 16.2)
Note: Arrows (→) represent the change in measured values between treatments, indicating the difference before and after the respective compost amendment.
Disclaimer/Publisher’s Note: The statements, opinions and data contained in all publications are solely those of the individual author(s) and contributor(s) and not of MDPI and/or the editor(s). MDPI and/or the editor(s) disclaim responsibility for any injury to people or property resulting from any ideas, methods, instructions or products referred to in the content.