Article

Analysis of Recharge Efficiency Under Barrier Effects Incurred by Adjacent Underground Structures

1
Hunan Provincial Key Laboratory of Geotechnical Engineering for Stability Control and Health Monitoring, School of Civil Engineering, Hunan University of Science and Technology, Xiangtan 411201, China
2
State Key Laboratory of Performance Monitoring Protecting of Rail Transit Infrastructure, East China Jiaotong University, Nanchang 330013, China
3
China Construction Eighth Engineering Division Co., Ltd., Shanghai 200122, China
*
Author to whom correspondence should be addressed.
Water 2025, 17(2), 257; https://doi.org/10.3390/w17020257
Submission received: 9 December 2024 / Revised: 27 December 2024 / Accepted: 1 January 2025 / Published: 17 January 2025

Abstract

:
Foundation pit dewatering will impact the surrounding underground environment. To mitigate the adverse effects on adjacent underground structures, groundwater recharge is commonly utilized to control groundwater drawdown outside the pit. However, under a barrier effect of underground structures, the recharge effect may be different from that without the barrier effect. Meanwhile, the results of recharging different aquifers may also be different under the barrier effect. Therefore, based on an actual foundation pit project, this paper establishes a three-dimensional finite element model to investigate the impact of recharge on the surrounding environment under the barrier effect. To be specific, the recharge simulations were conducted in aquifers at different depths, and the effects on groundwater, enclosure wall deflection, and ground settlement under each recharge condition were compared and discussed. Furthermore, the optimal recharge scheme under the barrier effect was proposed. The results show the following: (1) When recharge is conducted in an aquifer that is completely cut off by underground structures, both groundwater levels rise and enclosure deflection induced by recharge are dramatic; therefore, caution should be taken when recharging under this condition to avoid an excessive response of recharge on the surrounding environment. (2) When recharge is conducted in an aquifer that is not cut off, most of the recharged water flows far away from the foundation pit, resulting in a low recharge efficiency. (3) When recharge is conducted in an aquifer with a direct hydraulic connection between the inside and outside of the foundation pit, it can significantly raise the groundwater levels of each aquifer, and effectively control the ground settlement without obviously increasing the deflection of the enclosure; engineers could benefit from this recharge scheme to achieve a better recharge effect under the barrier effect.

1. Introduction

The acceleration of urbanization means that urban space is increasingly crowded, and the utilization of underground space has received more attention [1,2,3,4,5,6,7]. However, the rapid development of underground space also confronts numerous challenges [8,9,10,11,12,13], including the destruction of the surrounding environment in the process of deep foundation pit dewatering [14,15,16,17,18]. To avoid the influence of foundation pit dewatering on the surrounding environment, a waterproof curtain is typically adopted to totally cut off the confined aquifer to extend the seepage path of groundwater, thereby playing a certain role in water blocking [19,20,21,22,23]. However, this approach presents challenges and high costs for construction. Based on this, the suspended waterproof curtain is typically utilized in projects to the control groundwater level, but drawdown will still exist outside the pit, inducing the uneven settlement of the ground, which further affects the safety of adjacent buildings [24,25,26,27,28]. The above aspects have attracted some attention in academia. Wang et al. [29] conducted numerical simulations to investigate the influence of the interaction between the waterproof curtain and pumping well on the surrounding environment. Lyu et al. [30] proposed an equation based on an analytical solution to calculate the groundwater head inside and outside the excavation pit in a confined aquifer.
To control the large-scale drawdown outside the pit caused by dewatering, groundwater recharge is widely adopted as an effective and economical measure to control the change in groundwater levels outside the pit [31,32,33,34]. Specifically, the increase in the groundwater head after recharge will decrease the effective stress and cause the soil to expand, thereby realizing the expected recharge effect. In addition, field recharge tests are essential for evaluating artificial recharge in deep foundation pits. Moreover, recharge analysis can be performed using analytical or numerical approaches. When recharge occurs in a confined aquifer partially blocked by a suspended waterproof curtain, it creates a complex three-dimensional flow field that requires numerical analysis. Numerous scholars have conducted studies on groundwater control through artificial recharge [35,36]. Zhang et al. [37] conducted model tests and numerical simulations to confirm the effect of the seepage control–recharge coupling model on the ground settlement during dewatering. Zheng et al. [38] conducted a series of pumping and recharge tests at a metro station in Tianjin, proving that it was feasible to recharge silt and silty sand semiconfined aquifers.
In addition, in the process of foundation pit dewatering and recharge, the barrier effect incurred by adjacent underground structures has a significant impact on the deformation of the surrounding environment [39,40,41]. Specifically, the existence of underground structures during the dewatering stage may block the seepage of groundwater, which will aggravate the decline of groundwater levels in front of the underground structures and induce the uneven settlement of soil in the front and at the rear of the structure [42,43,44,45]. Similarly, the existence of underground structures during the recharge stage may also block the seepage of recharged water, which may affect the recharge efficiency compared to the absence of underground barriers.
The current research primarily focuses on the influence of the barrier effect on the surrounding environment during dewatering. However, there are few studies on the impact of this barrier effect during the recharge process. Furthermore, groundwater recharge requires determination of the appropriate recharge aquifer; otherwise, the recharge effect will not be exerted effectively but will aggravate the deformation of the surrounding environment. Therefore, this paper establishes a three-dimensional simulation model based on a foundation pit dewatering test to explore this problem. Specifically, the recharge was conducted in aquifers at different depths near a metro station, and the effects on groundwater, enclosure wall deflection, and ground settlement under each recharge condition were compared and discussed. Furthermore, the optimal recharge scheme is determined, and engineering suggestions are provided.

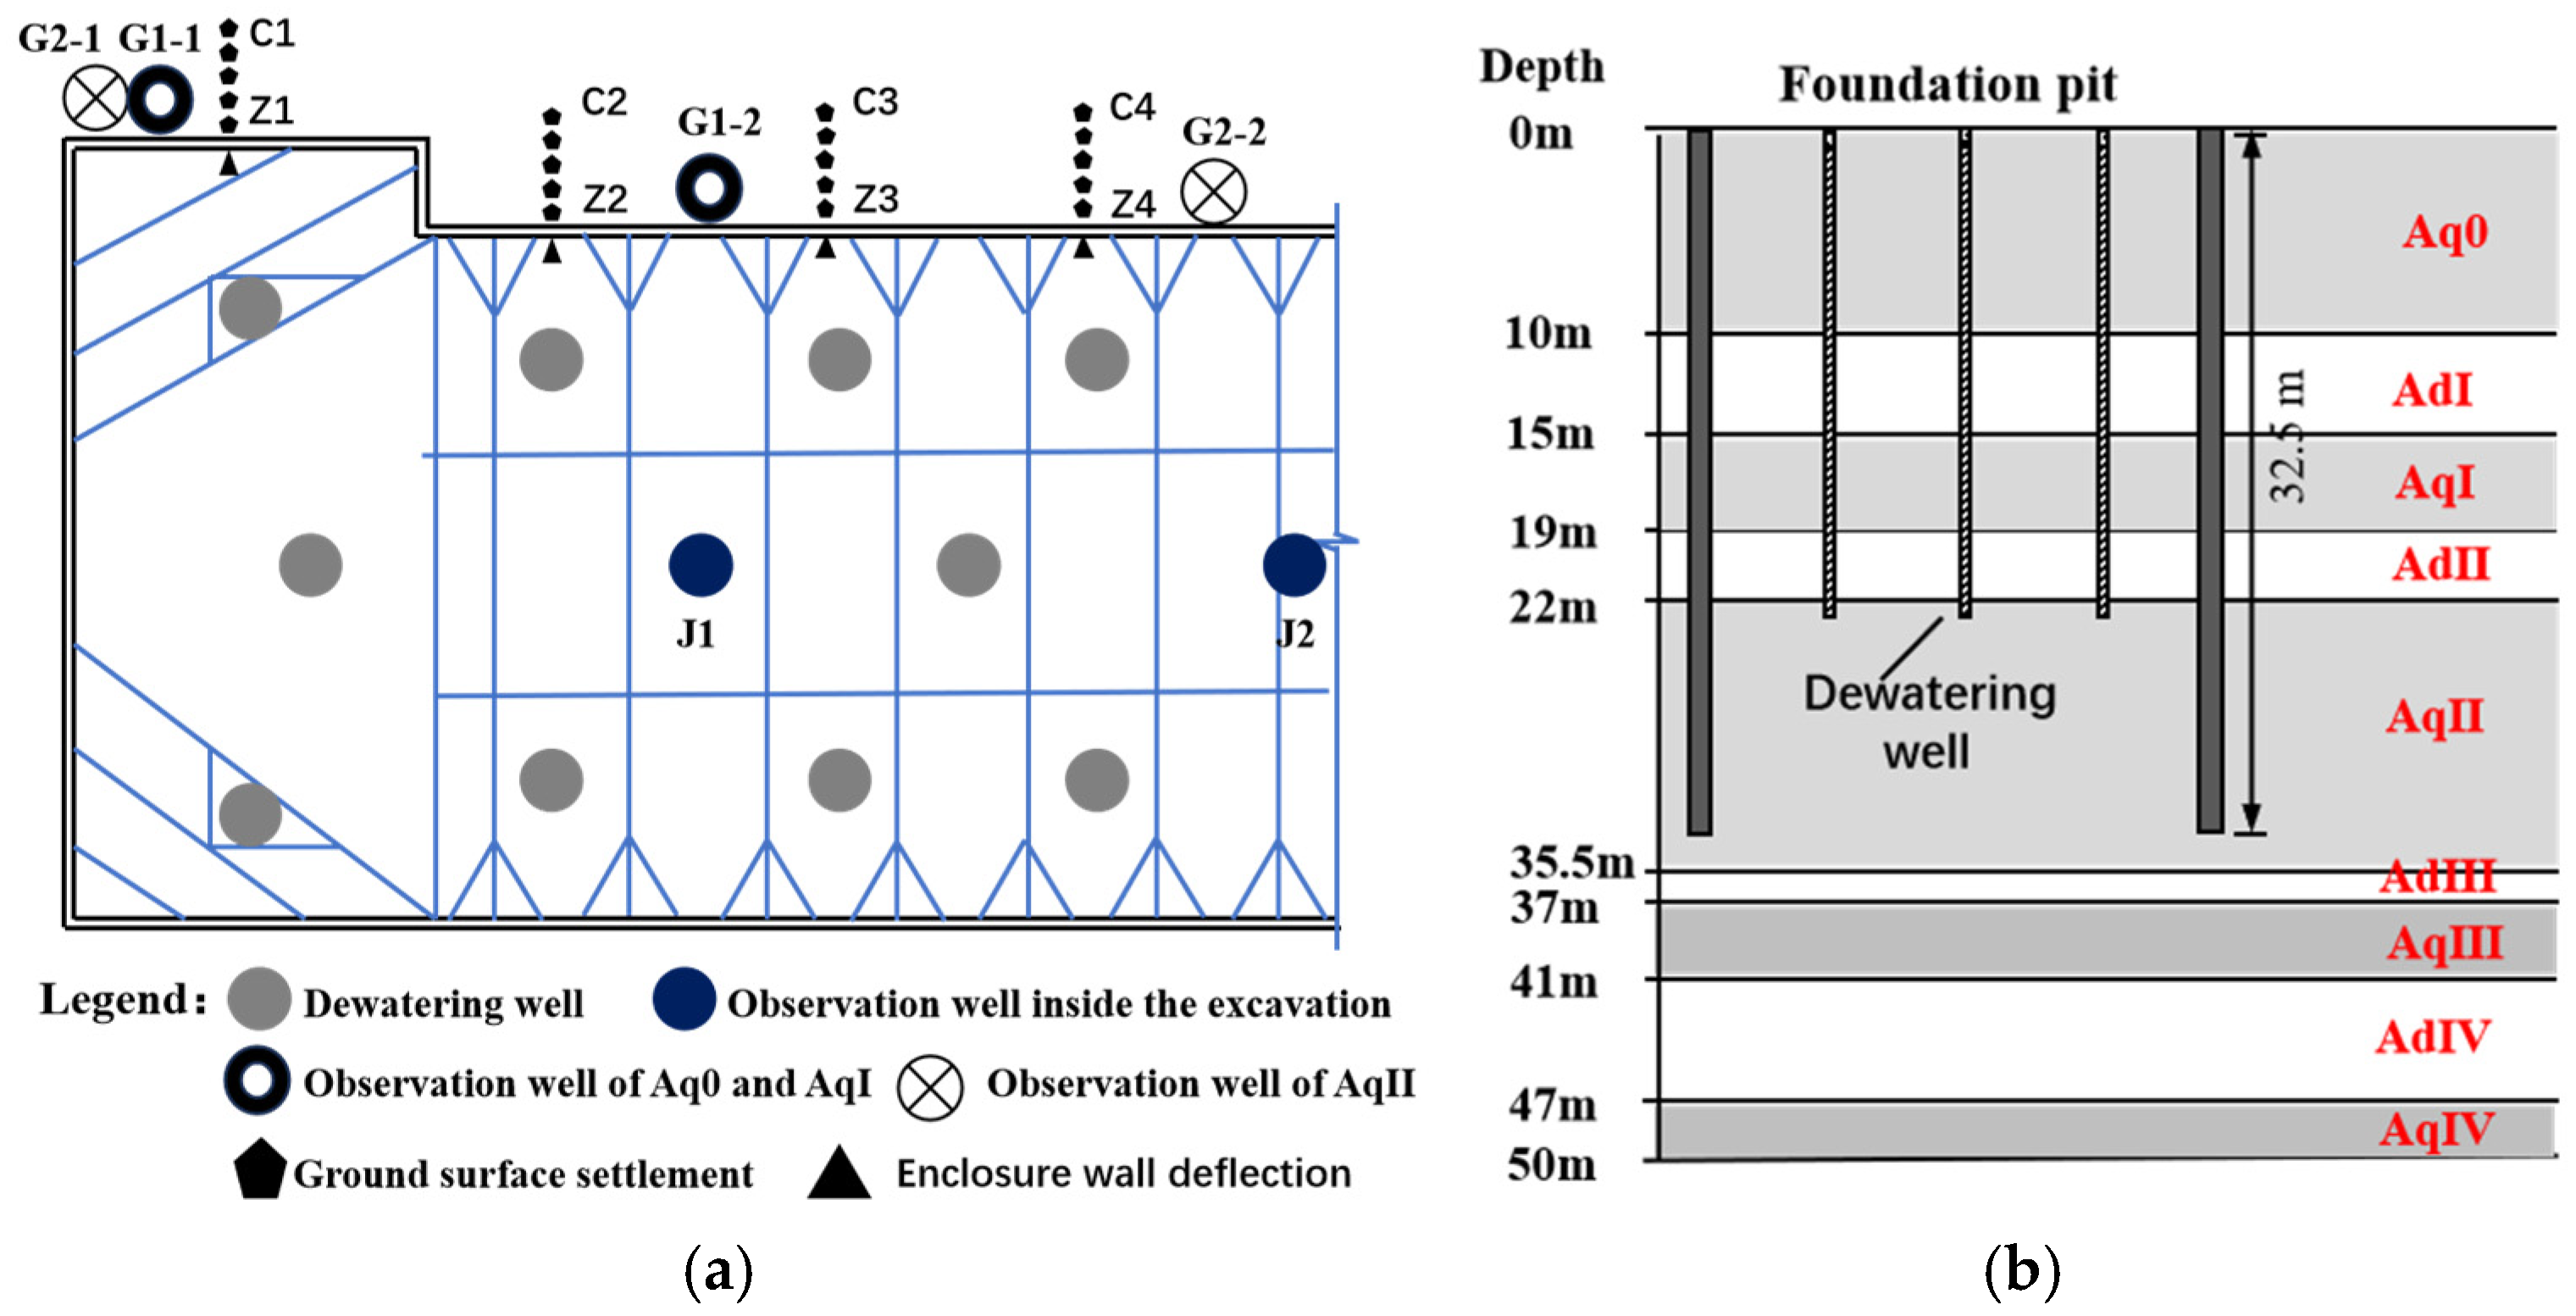
2. Project Background

Figure 1 shows the view of the foundation pit and strata for a metro station in Nankai District, Tianjin. The depth of the pit is 16.9 m, with a length of 155 m and a width of 40 m. The diaphragm wall has a thickness of 0.8 m, and a buried depth of 32.5 m.
A field investigation report indicates that there are nine soil layers with different properties below the surface, including phreatic aquifer Aq0, four confined aquifers (AqI-AqIV), and four low-permeability aquitards (AdI-AdIV). Confined aquifers and low-permeability aquifers appear alternately. The buried depth of phreatic aquifer is 10 m, and the buried depths for confined aquifers AqI-AqIV are 19 m, 35.5 m, 41 m, and 50 m, respectively, while those for low-penetrability aquifers AdI-AdIV are at depths of 15 m, 22 m, 37 m, and 47 m, respectively. The initial groundwater level for phreatic aquifer Aq0 is at 2.0 m below the surface, and for confined aquifers AqI-AqIV at 2.7 m, 3.0 m, 3.2 m, and 3.7 m from the surface, respectively. Detailed soil layer parameters are shown in Table 1. In Table 1, Es is the compression modulus; γ is the natural weight of soil; φ′ is the effective friction angle of the soil; vs. is the shear wave velocity; c′ is the effective cohesion of soil; e is the initial porosity ratio; H is the buried depth of the aquifer; K0 is the coefficient of earth pressure at rest; and ω is the moisture content.

3. Pumping Test

Since the depth of the dewatering wells in the foundation pit reaches AqII, and the diaphragm wall has not completely cut off AqII, dewatering inside the foundation pit is expected to induce a drawdown outside the pit, resulting in strata subsidence. To assess the impact of dewatering on the environment, a prior pumping test, lasting 3.2 days, was conducted after the completion of both the diaphragm wall and the first level of reinforced concrete strut. During this test, 22 pumping wells were operated within the pit, and another three wells served as observation wells for the real-time monitoring of groundwater level changes. The groundwater level within the pit dropped by approximately 15 m during this period. An analysis of monitoring data from observation wells revealed decreased groundwater levels in different aquifers outside the pit. Meanwhile, the enclosure wall was observed to move towards the foundation pit inside, and the strata behind the wall presented subsidence. Detailed results are presented in Section 4.4.

4. Numerical Modelling

4.1. Modelling Scheme

Two types of three-dimensional finite element models are established in this paper using Abaqus software. The first type is based on the aforementioned pumping test, and its reliability is verified by comparing measured data with simulated data (detailed results are presented in Section 4.4). The second model incorporates an imaginary metro station as a barrier structure near the foundation pit, along with several recharge wells positioned in front of the station. The recharge wells are set 5 m in front of the metro station to ensure the protection of the existing structures outside the pit. Furthermore, dewatering in this study involves a 10 m drawdown from AqII, while recharged aquifers are located in AqI, AqII, and AqIII, respectively. The process of establishing the two types of models is similar, and the same stratum distribution, stratum parameters, and foundation pit layout are adopted, with the main difference being the presence or absence of recharge wells outside the pit and the structure of the metro station. Therefore, this section focuses on detailing the establishment process for the second type of model.
Table 2 presents the specific simulation condition. Under the constant parameters such as the distance from station to the pit (D), foundation pit width (B), metro station depth (H), recharge well spacing (d), and the recharge flow rate (q), the recharged aquifer is varied to investigate the effect of the groundwater and settlement control of different recharge aquifers under the barrier of the metro station, and then the reasonable recharge aquifer is obtained.

4.2. Model Setup

4.2.1. Model Dimension

Figure 2 is a finite element mesh of the second type of model. To simplify the calculation process, only a 1/2 model of the pit is established using symmetry, with dimensions set at 1640 × 877.5 × 70 m. The height of the model soil layer is set to 70 m to prevent interference with numerical results from the bottom boundary. Additionally, the distance between the pit and lateral boundary in the model must exceed the dewatering influence range (R) to eliminate boundary effects on calculation results. The Sichardt formula [47] is used to calculate the influence range (R) of dewatering, and the Sichardt Formula (1) is defined as follows:
R = 10 S w K
where Sw = 35.5 m for the maximum groundwater level drawdown of AqII and permeability coefficient K = 0.0035 cm/s; R can be calculated as 615 m for dewatering influence radius; therefore, the lateral boundary is set at least 800 m away from the pit.
The layout and dimensions of the pit and dewatering wells in the model closely resemble those of the engineering prototype in Section 2. The existing metro station structure and recharge wells outside the pit are conceptual structures. The horizontal distance between the recharge wells and metro station is set at 5 m, while both the dewatering wells and recharge wells have a depth of 35.5 m with a radius of 0.2 m. The foundation pit, metro station structure, dewatering wells, and recharge wells are all simulated using an elastic model with respective elastic moduli values as per design specifications (30 GPa for foundation pit and metro station structures, 210 GPa for dewatering wells and recharge wells). Additionally, based on a similar numerical simulation experience [46], a friction coefficient of 0.3 is assigned between the soil mass and various structures in the model.

4.2.2. Constitutive Model

The selection of a suitable soil constitutive model is crucial for ensuring the reliability of numerical calculation results. Due to fluctuating groundwater levels in Tianjin, especially due to past over-exploitation and recent restrictions, the soil (particularly sandy soil) exhibits significant elastic deformation in response to changes in groundwater levels. Therefore, the Moore–Coulomb constitutive model is utilized to simulate soil deformation during dewatering. The calculation parameters for the model soil are presented in Table 3, with gravity (γ), porosity ratio (e), and shear strength indexes (c′ and φ′), all obtained from Table 1. Additionally, referring to the relevant literature on the inversion calculation process [29], the horizontal and vertical permeability coefficients (KH and KV), elastic modulus (E) of the soil layer, and specific storage coefficient (Ss) are determined through inversion computation based on the pumping test from Section 3.

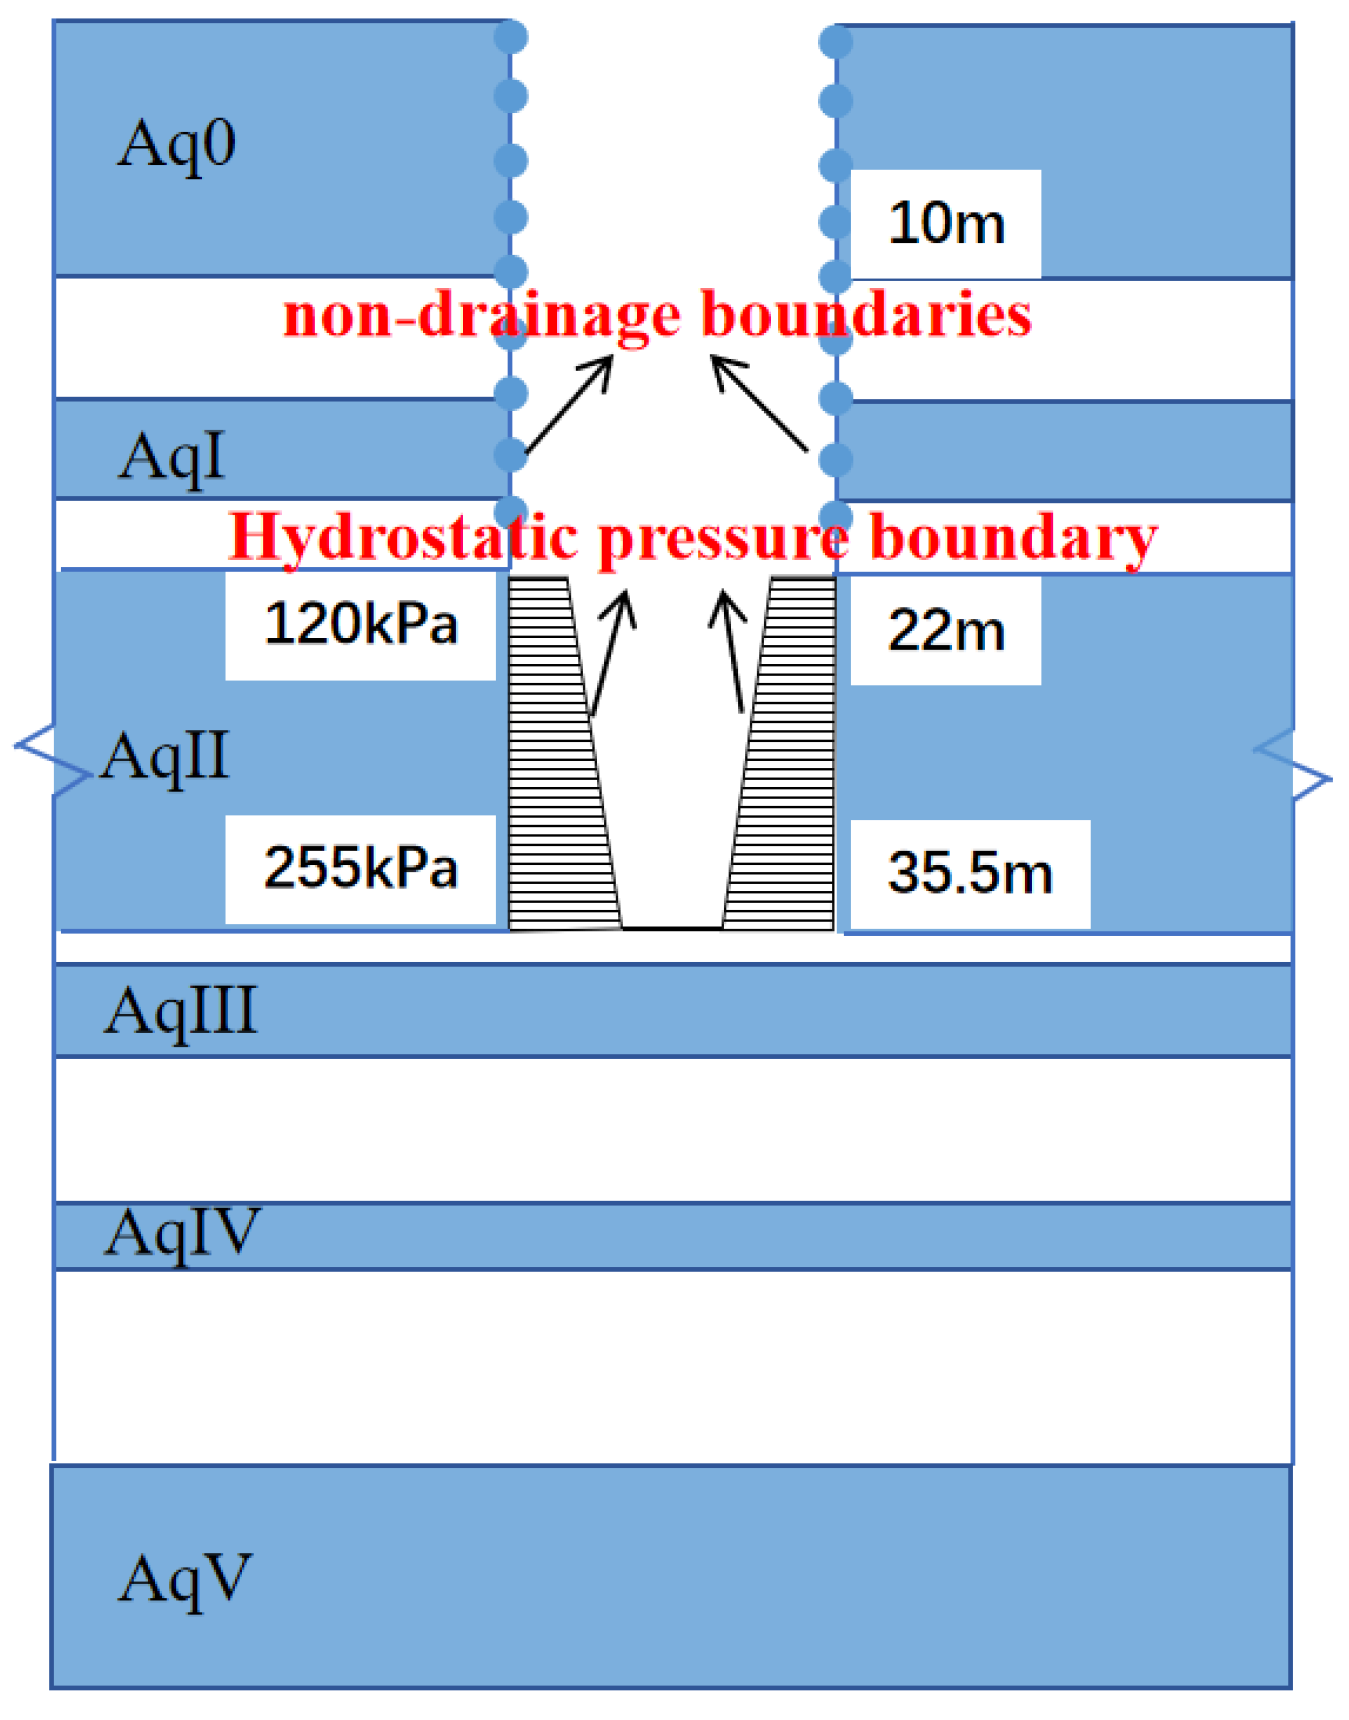
4.3. Boundary Conditions and Simulation of Dewatering and Recharge

The symmetric plane of the model restricts only the deformation perpendicular to its direction, while the asymmetric plane (lateral boundary) and the bottom of the model limit both vertical and horizontal deformations. The asymmetric plane is designated as the constant head boundary, and the symmetric plane and the bottom of the model are designated as the undrained boundary.
The dewatering method simulated in this paper involves dewatering in the second confined aquifer, with the dewatering well depth set at 35.5 m (the bottom of AqII), and the soil surface within the 0~22 m depth range designated as non-drainage boundaries. Pore pressure at depths of 22 m and 35.5 m are set to 120 kPa and 255 kPa, respectively, (representing a simulated groundwater level drawdown of 10 m). The simulation method is illustrated in Figure 3. Recharge simulation involves defining surface pore flow for soil in contact with recharge wells, along with assigning a suitable recharge flow rate to each site.

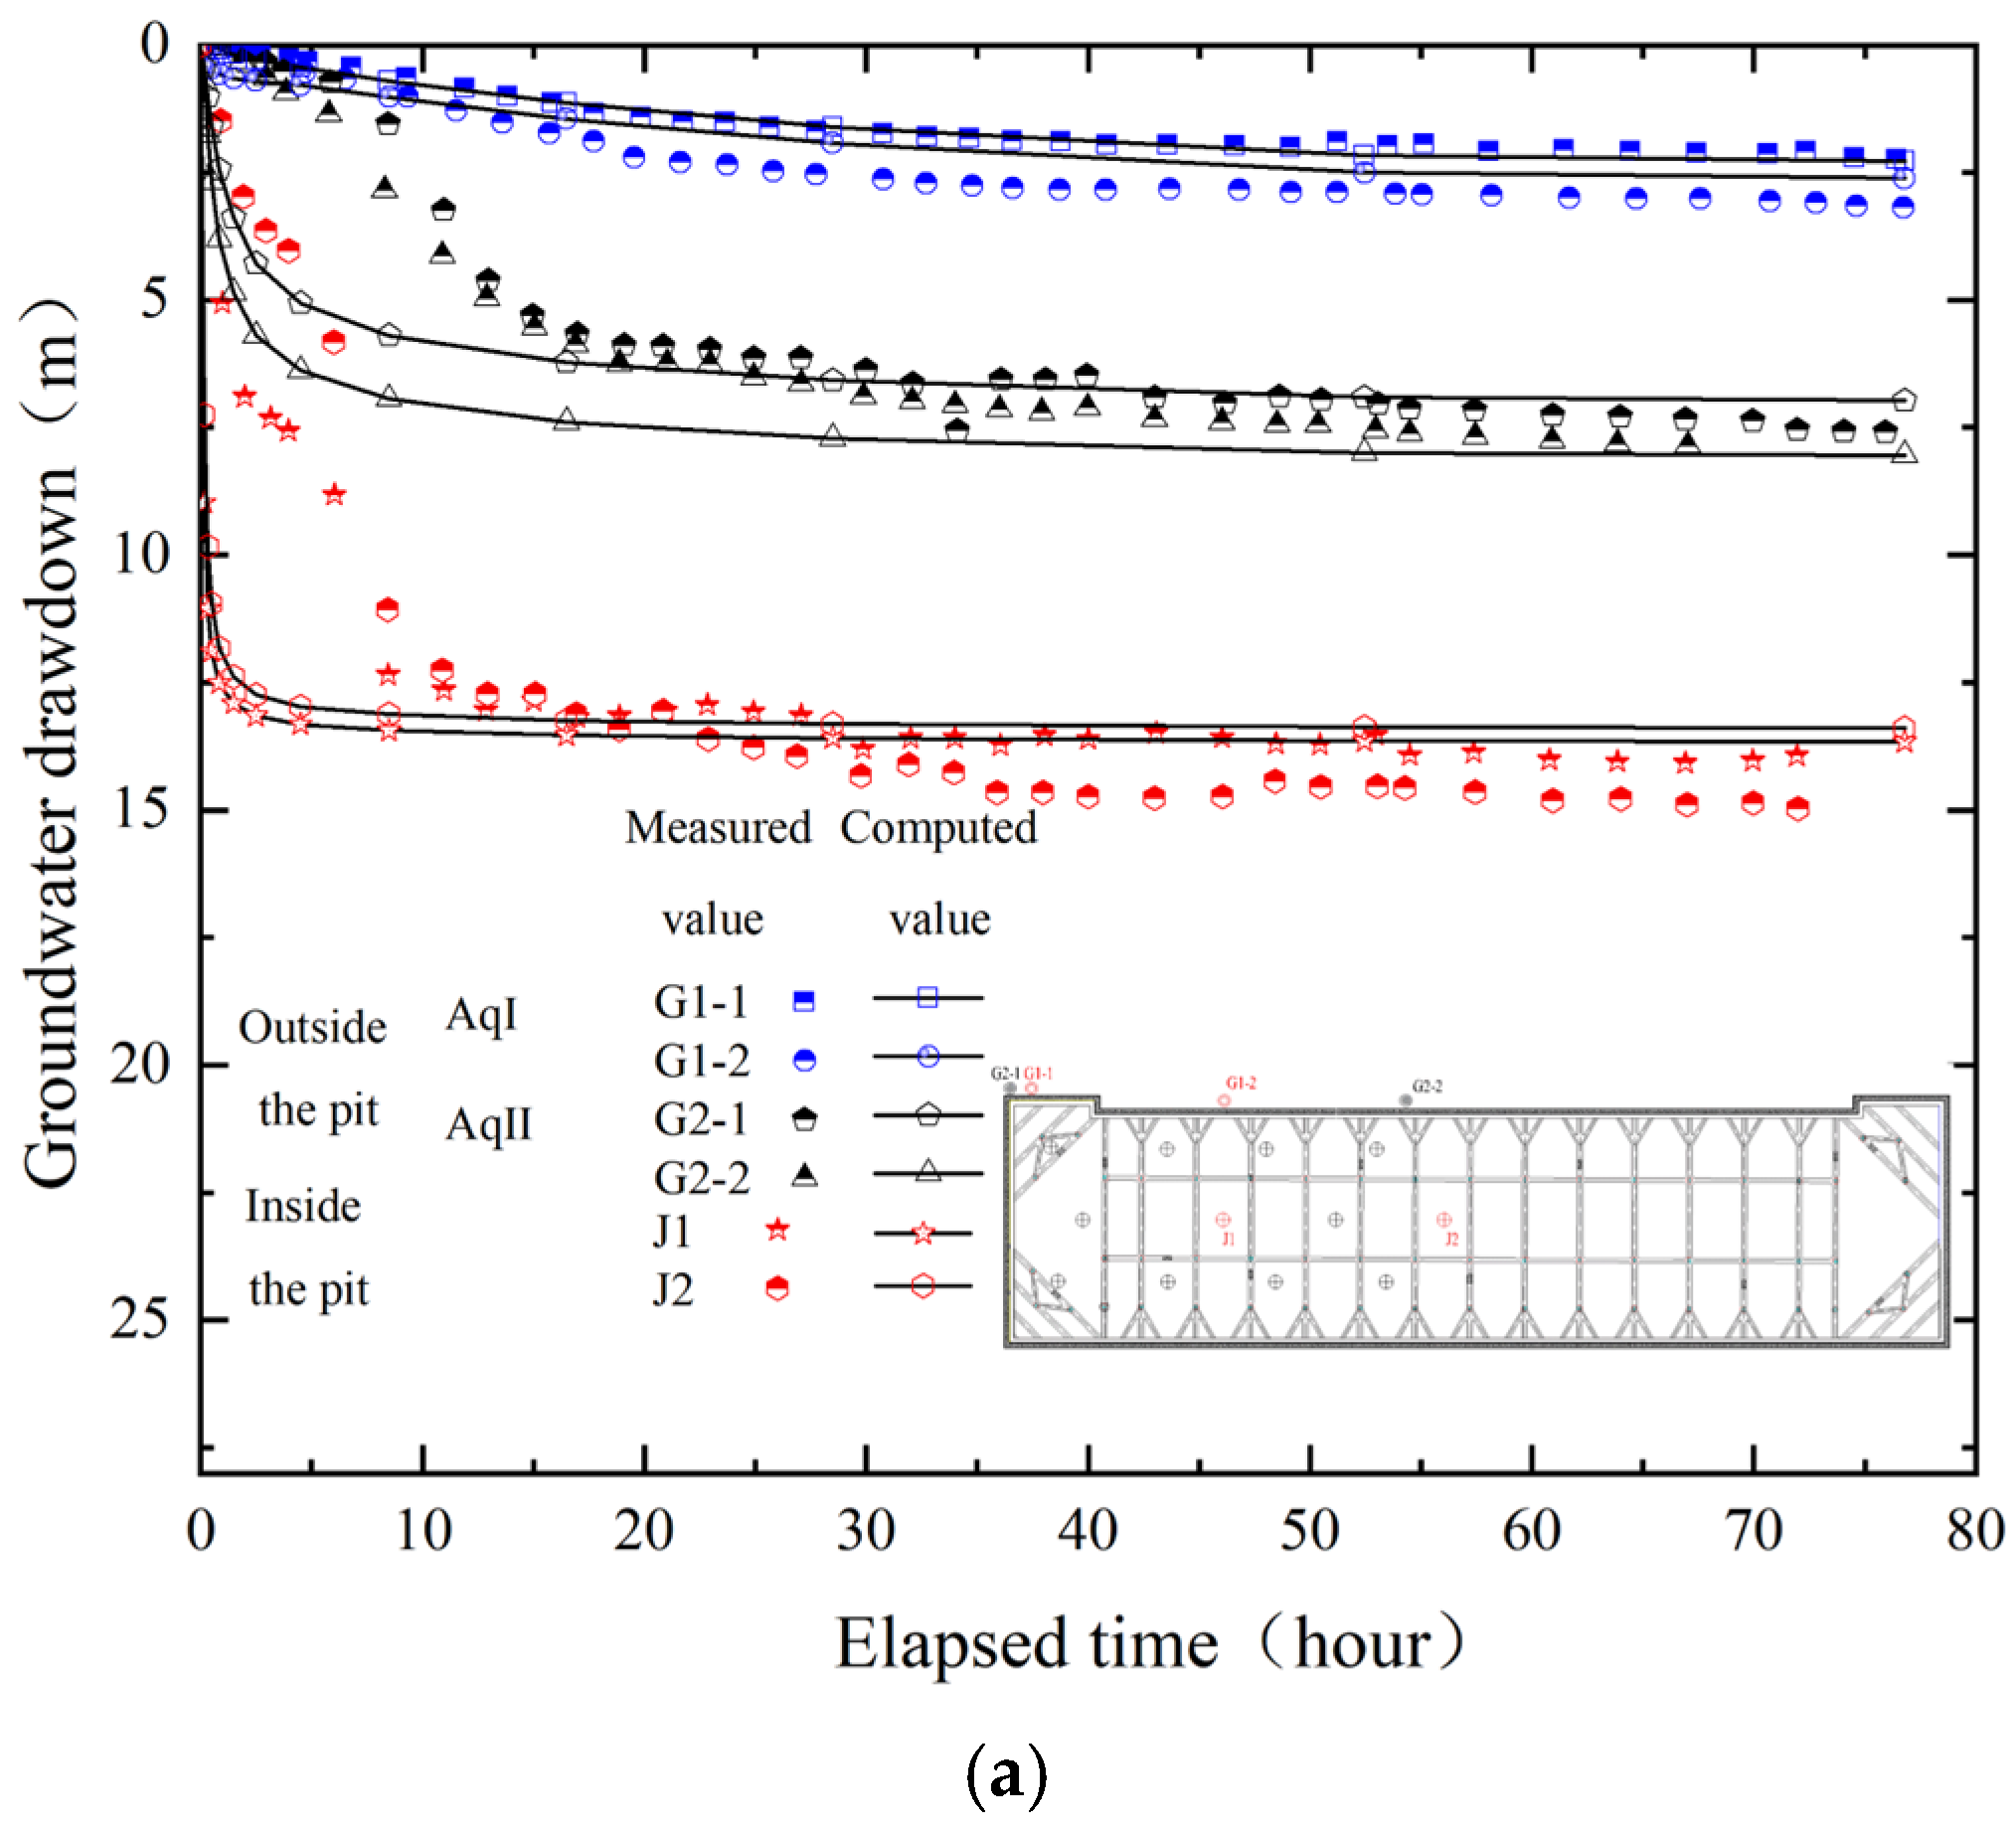
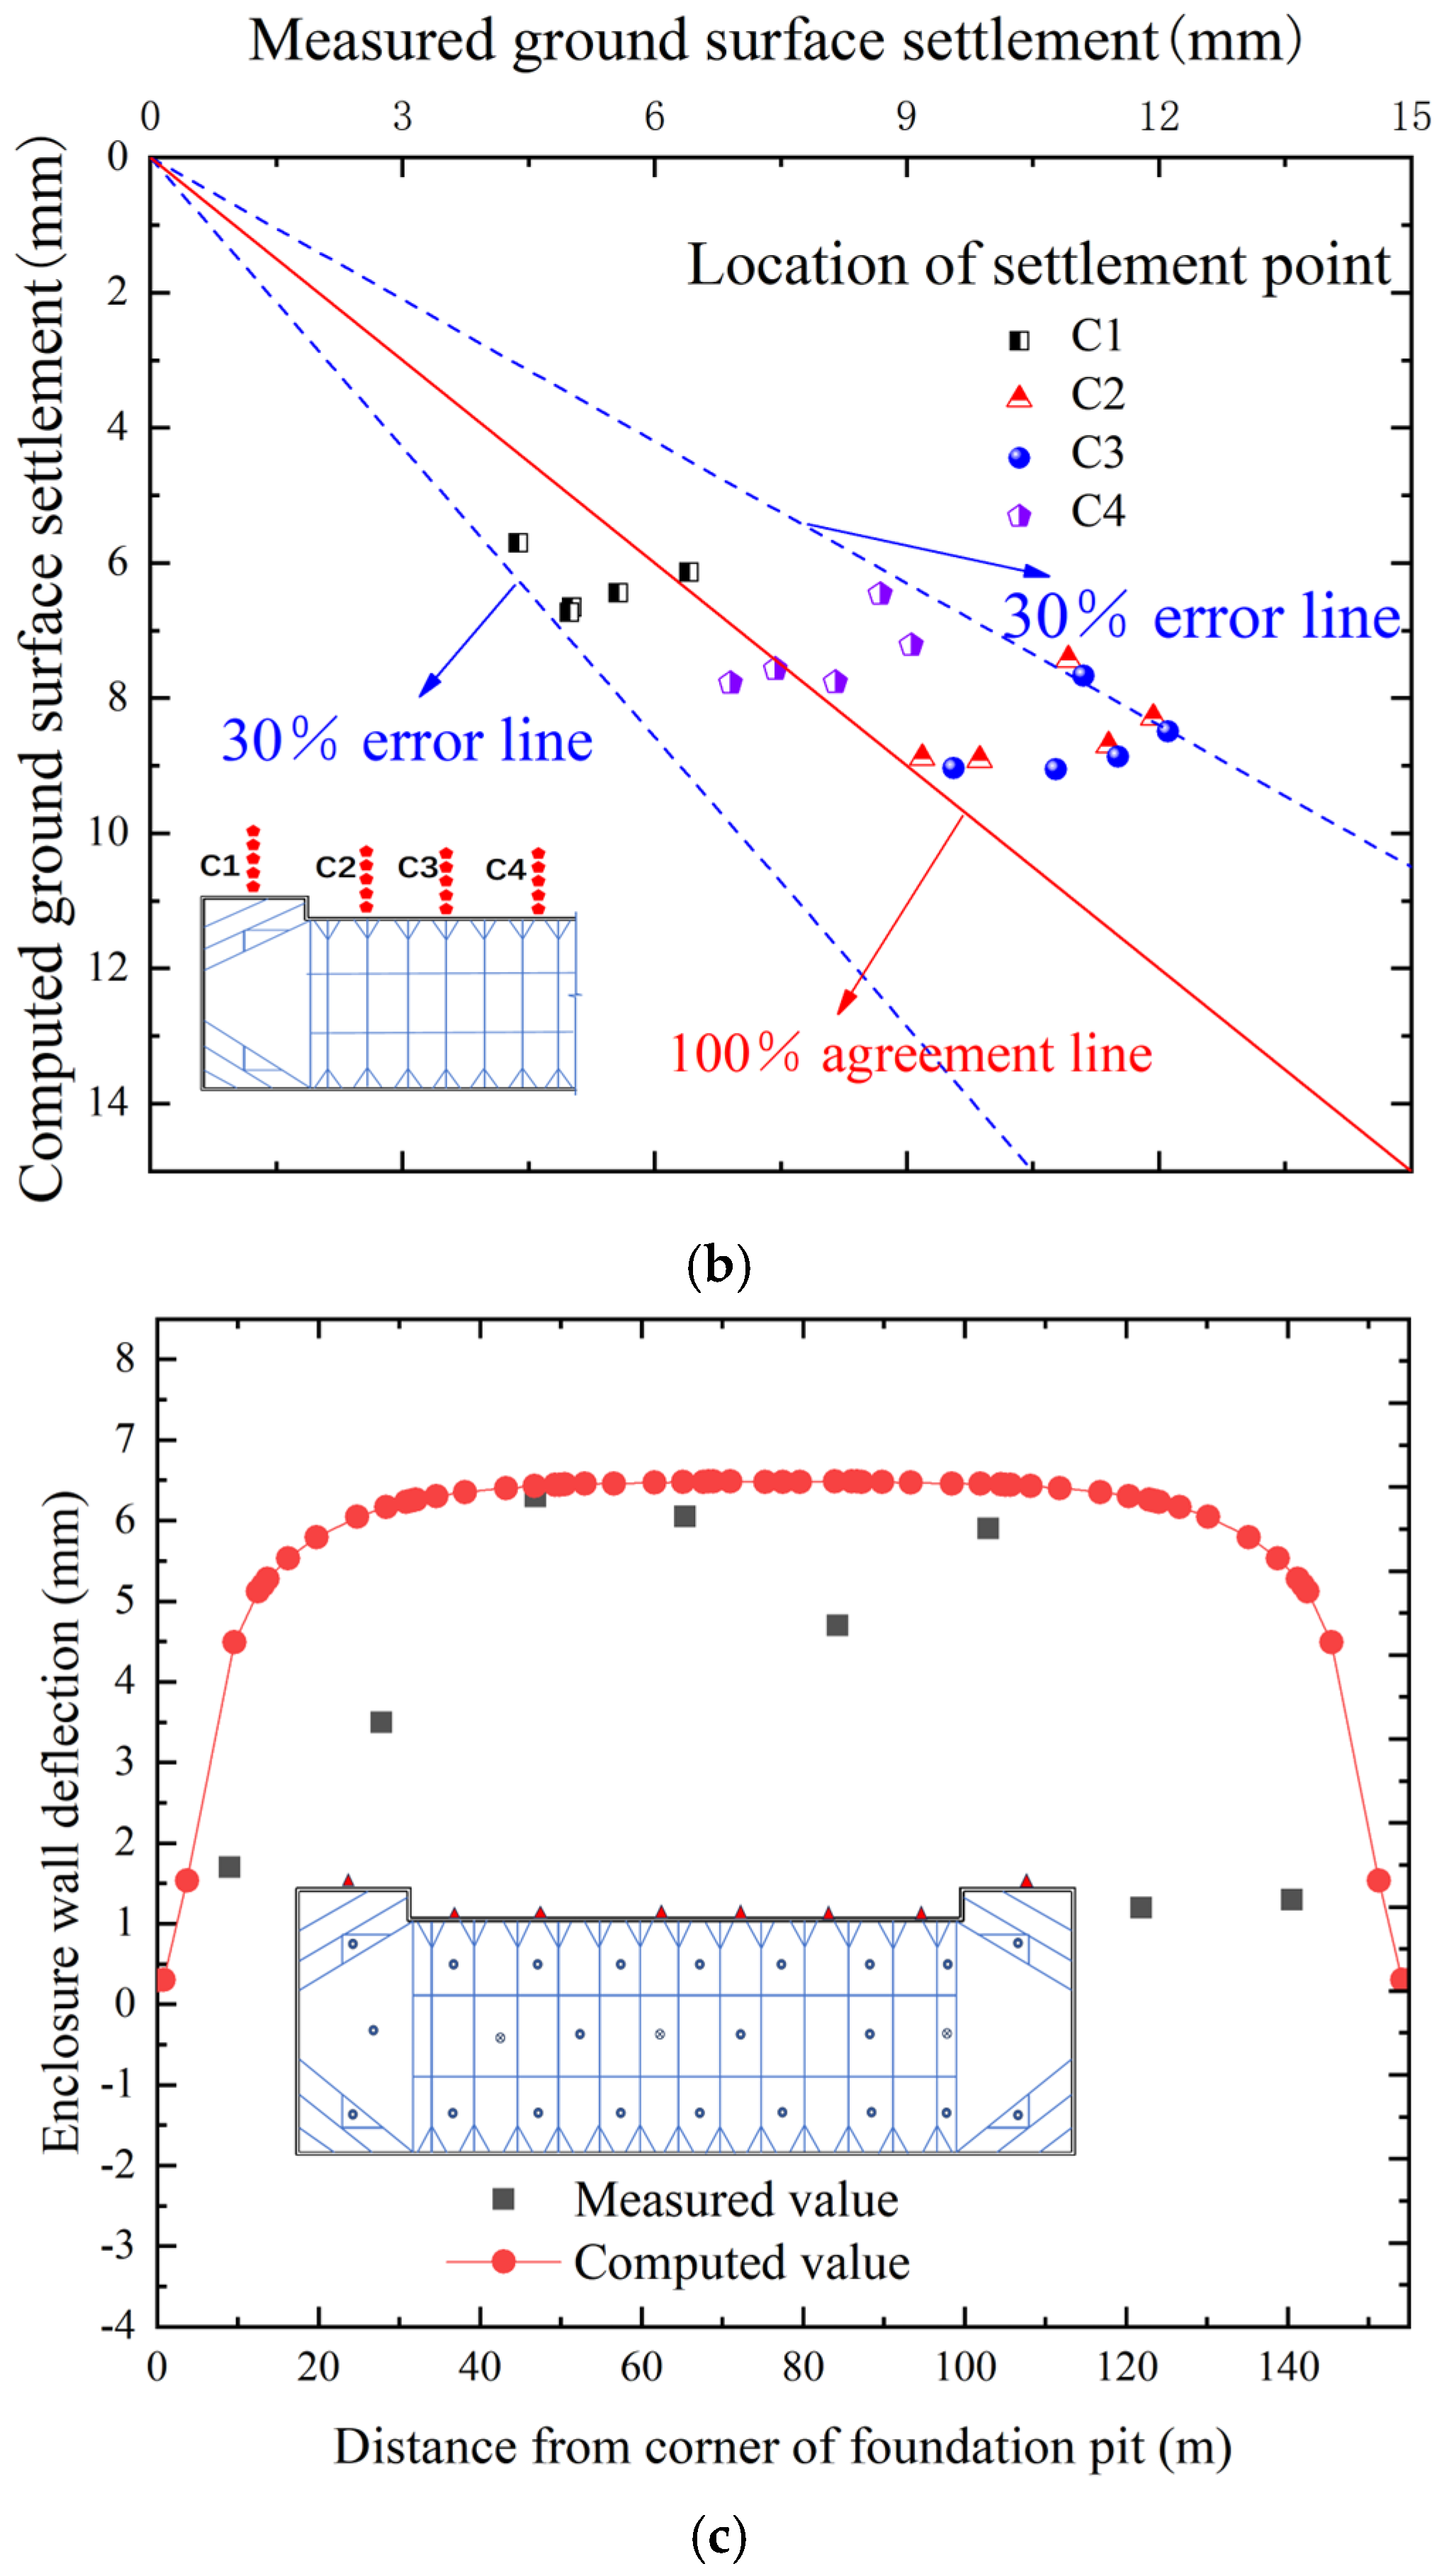
4.4. Model Validation

Figure 4a illustrates the comparison between the calculated groundwater level drawdown of the first type model and the measured values during the pumping test for some typical measuring points. Both results indicate a drawdown inside the foundation pit, leading to the corresponding drawdown in different aquifers outside the pit. Specifically, there was a 15 m drawdown inside the excavation, resulting in an approximately 6.5 m decline in AqII outside the pit, and about a 2.5 m drop in AqI. The stable stage of pumping shows a high agreement between the calculated and measured values, while initial stages exhibit a relatively large discrepancy. This discrepancy is attributed to the simplifications during the pumping simulation process, causing an exaggerated early-stage drawdown.
Figure 4b illustrates the comparison between the calculated and measured values of surface settlement outside the pit. It is observed that the errors between the two sets of data are within 32%, with the majority being less than 20%. Most of the points are located near the 100% agreement line. The discrepancy between the calculated and measured values may be attributed to the simplified assumption of uniform soil layer thickness in the simulation, whereas in actual projects, the thickness of each soil layer varies by location.
Figure 4c shows the comparison between the measured values and the calculated values of the enclosure wall deflection. It is evident that there is a relatively large deviation between the calculated and measured results at the corner of the foundation pit, whereas there is a reasonable agreement in results in the central part of the pit. In fact, the existence of a deviation or error between the computed and measured results is normal and expectable because the simplified model employed in this study could not accurately reflect the variations of the strata thickness and the soil properties in the actual field conditions. Given that the subsequent analysis is based on the calculated deflection data from the central part of the pit, the correlation analysis could maintain a satisfactory level of accuracy.

5. Simulation Results and Analysis

5.1. Response of Groundwater

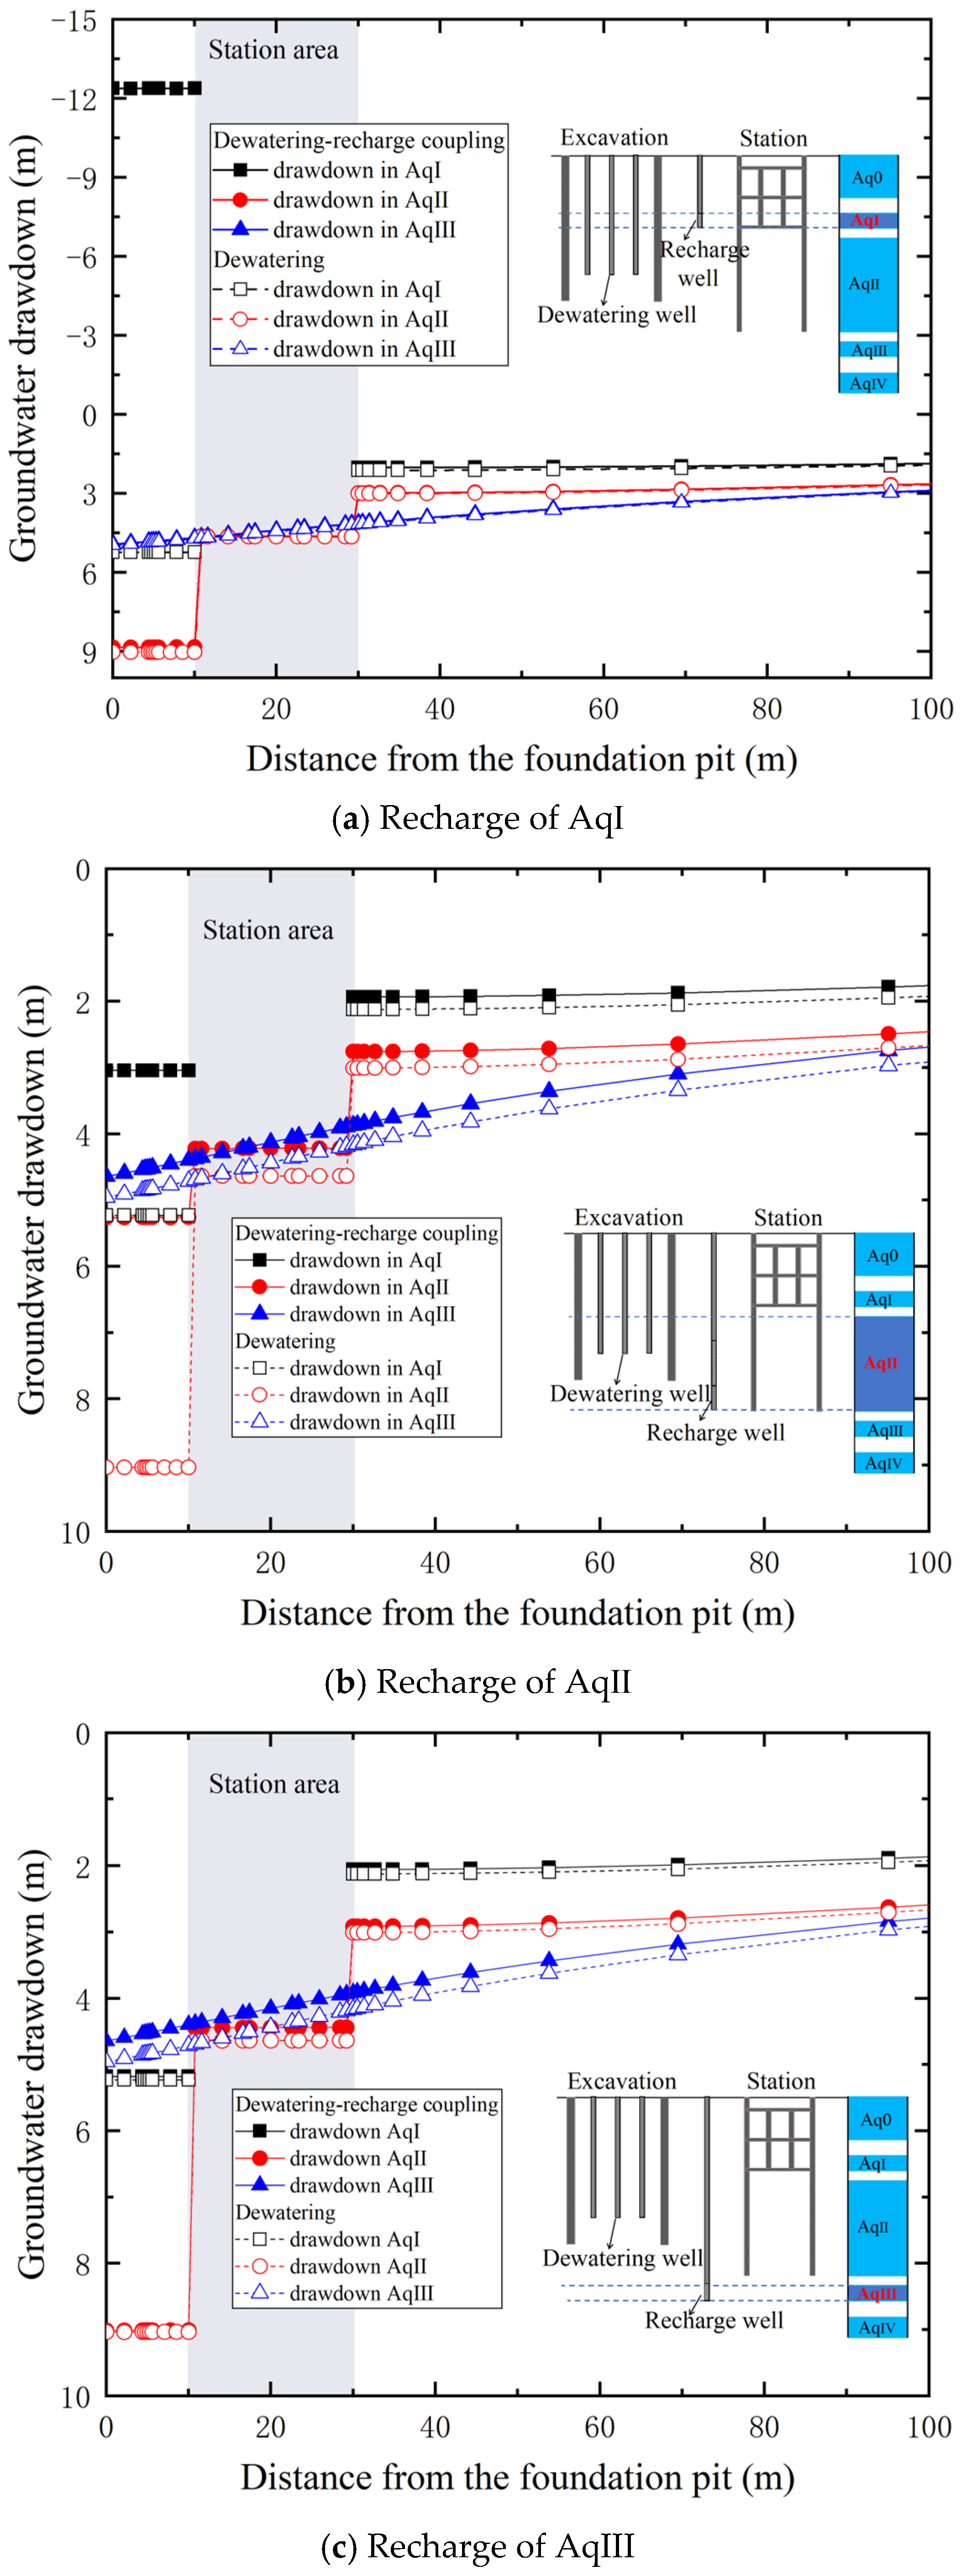
5.1.1. Groundwater Drawdown

Figure 5a–c depicts the groundwater level drawdown of different confined aquifers outside the pit during the recharge of AqI, AqII, and AqIII, respectively, and compares it with the drawdown during the dewatering stage. During the dewatering process, the groundwater drawdown in AqII is larger than that in AqI and AqIII. This phenomenon can be attributed to AqII being an aquifer with a hydraulic connection between the inside and outside of the foundation pit. Additionally, groundwater leakage from AqI and AqIII to AqII also contributes to drawdown in both aquifers. Furthermore, given that the buried depth of the station is 35.5 m and that both AqI and AqII have been completely cut off, the station exerts a blocking effect on groundwater seepage within these two confined aquifers while not affecting groundwater flow in AqIII. Therefore, the groundwater drawdown of AqI and AqII appears as discontinuous changes in the front and at the rear of the station, and the groundwater drawdown of AqIII changes continuously.
Figure 5a reveals that during the recharge of AqI, the groundwater level in AqI in front of the station rises sharply to approximately 12.3 m, while the groundwater level at the rear of the station drops to about 2 m. At this time, the drawdown difference between the front and rear of the station is approximately 14.3 m, compared to 3 m for the condition of dewatering, which indicates that the recharge of AqI will exert a negative influence on the stability of the station structure. Nevertheless, the groundwater level in AqII and AqIII is basically unchanged from that in the dewatering stage. Therefore, the recharge of AqI has an overly drastic effect on the groundwater level rise of this aquifer but rarely impacts the groundwater level control of AqII and AIII. From the perspective of groundwater level control, it is irrational to recharge AqI.
Figure 5b reveals that during the recharge of AqII, the groundwater level of all aquifers is raised to a certain extent. Among them, the groundwater level of AqII is the most significant, followed by AqI, and AqIII is the least. Additionally, after recharging AqII, the drawdown difference in AqI and AqII in the front and rear of the station are approximately 1 m and 2.2 m, respectively; compared to the drawdown difference of 3 m and 6 m in the front and rear of the station at the dewatering stage, it indicates that the recharge of AqII can effectively reduce the drawdown difference on both sides of the station, thereby achieving the expected effect of recharge. Regarding the groundwater level still dropping after recharge, the expected groundwater control effect can be attained by increasing the recharge flow rate in the project. Thus, from the perspective of groundwater level control, the recharge of AqII seems to be more reasonable.
Figure 5c reveals that recharge of AqIII only has a certain impact on the groundwater level rise of AqIII but has little effect on the groundwater level rise of AqI and AqII. Therefore, from the viewpoint of groundwater level control, it is neither economical nor reasonable to recharging AqIII.

5.1.2. Analysis of Ew

To more intuitively assess the groundwater control effect after the recharge of different aquifers, this paper defines Ew as the groundwater control rate, where Ew = groundwater level rise after recharge/groundwater level drop after dewatering; the closer Ew is to 100%, the closer the groundwater level after recharge is to the initial level, over 100%, indicating that the groundwater level after recharge is higher than the initial level.
Figure 6a represents the Ew during the recharge of AqI. It can be observed that after recharging AqI, the Ew in front of the station reaches as high as 340% in this aquifer, significantly higher than 100%. However, the Ew of AqII and AqIII is approximately 1%, which is much lower than 100%. This is because both the enclosure wall and the station have completely cut off AqI, and the groundwater seepage will be blocked during recharge, leading to a considerable groundwater level rise in this aquifer.
Figure 6b presents the Ew during recharge the of AqII. It can be observed that after recharging AqII, the Ew of AqI and AqII are similar, both reaching 42%. The Ew of AqIII is relatively low, approximately 6%, as this aquifer is not cut off by the station and the enclosure wall, allowing the recharged water to flow far away from the foundation pit and the station. From the aspect of groundwater control rate, the Ew of each aquifer is obvious when recharging AqII, and AqII is an aquifer with a hydraulic connection between the inside and outside of the foundation pit. As a result, recharge to a well-circulated source aquifer can significantly raise the groundwater level of each aquifer. Although the Ew has not reached 100%, the rate of each aquifer can approach 100% by enhancing the recharge intensity.
Figure 6c presents the Ew during the recharge of AqIII. It can be observed that the Ew of AqIII is approximately 6%, while the Ew of AqI and AqII are close to 0, both significantly below 100%. This is also associated with the fact that AqIII is not cut off by the enclosure wall and the station, and the recharged water can flow far away resulting in a lower Ew.
Based on the aforementioned analysis of the recharge of three different confined aquifers, it is found that the recharge of AqII is more reasonable to control the drawdown outside the pit. However, it is not convincing to determine the reasonable recharge aquifer merely from the perspective of the groundwater level, and it should also be combined with the response of the enclosure wall deflection and ground settlement.

5.2. Response of Enclosure Wall

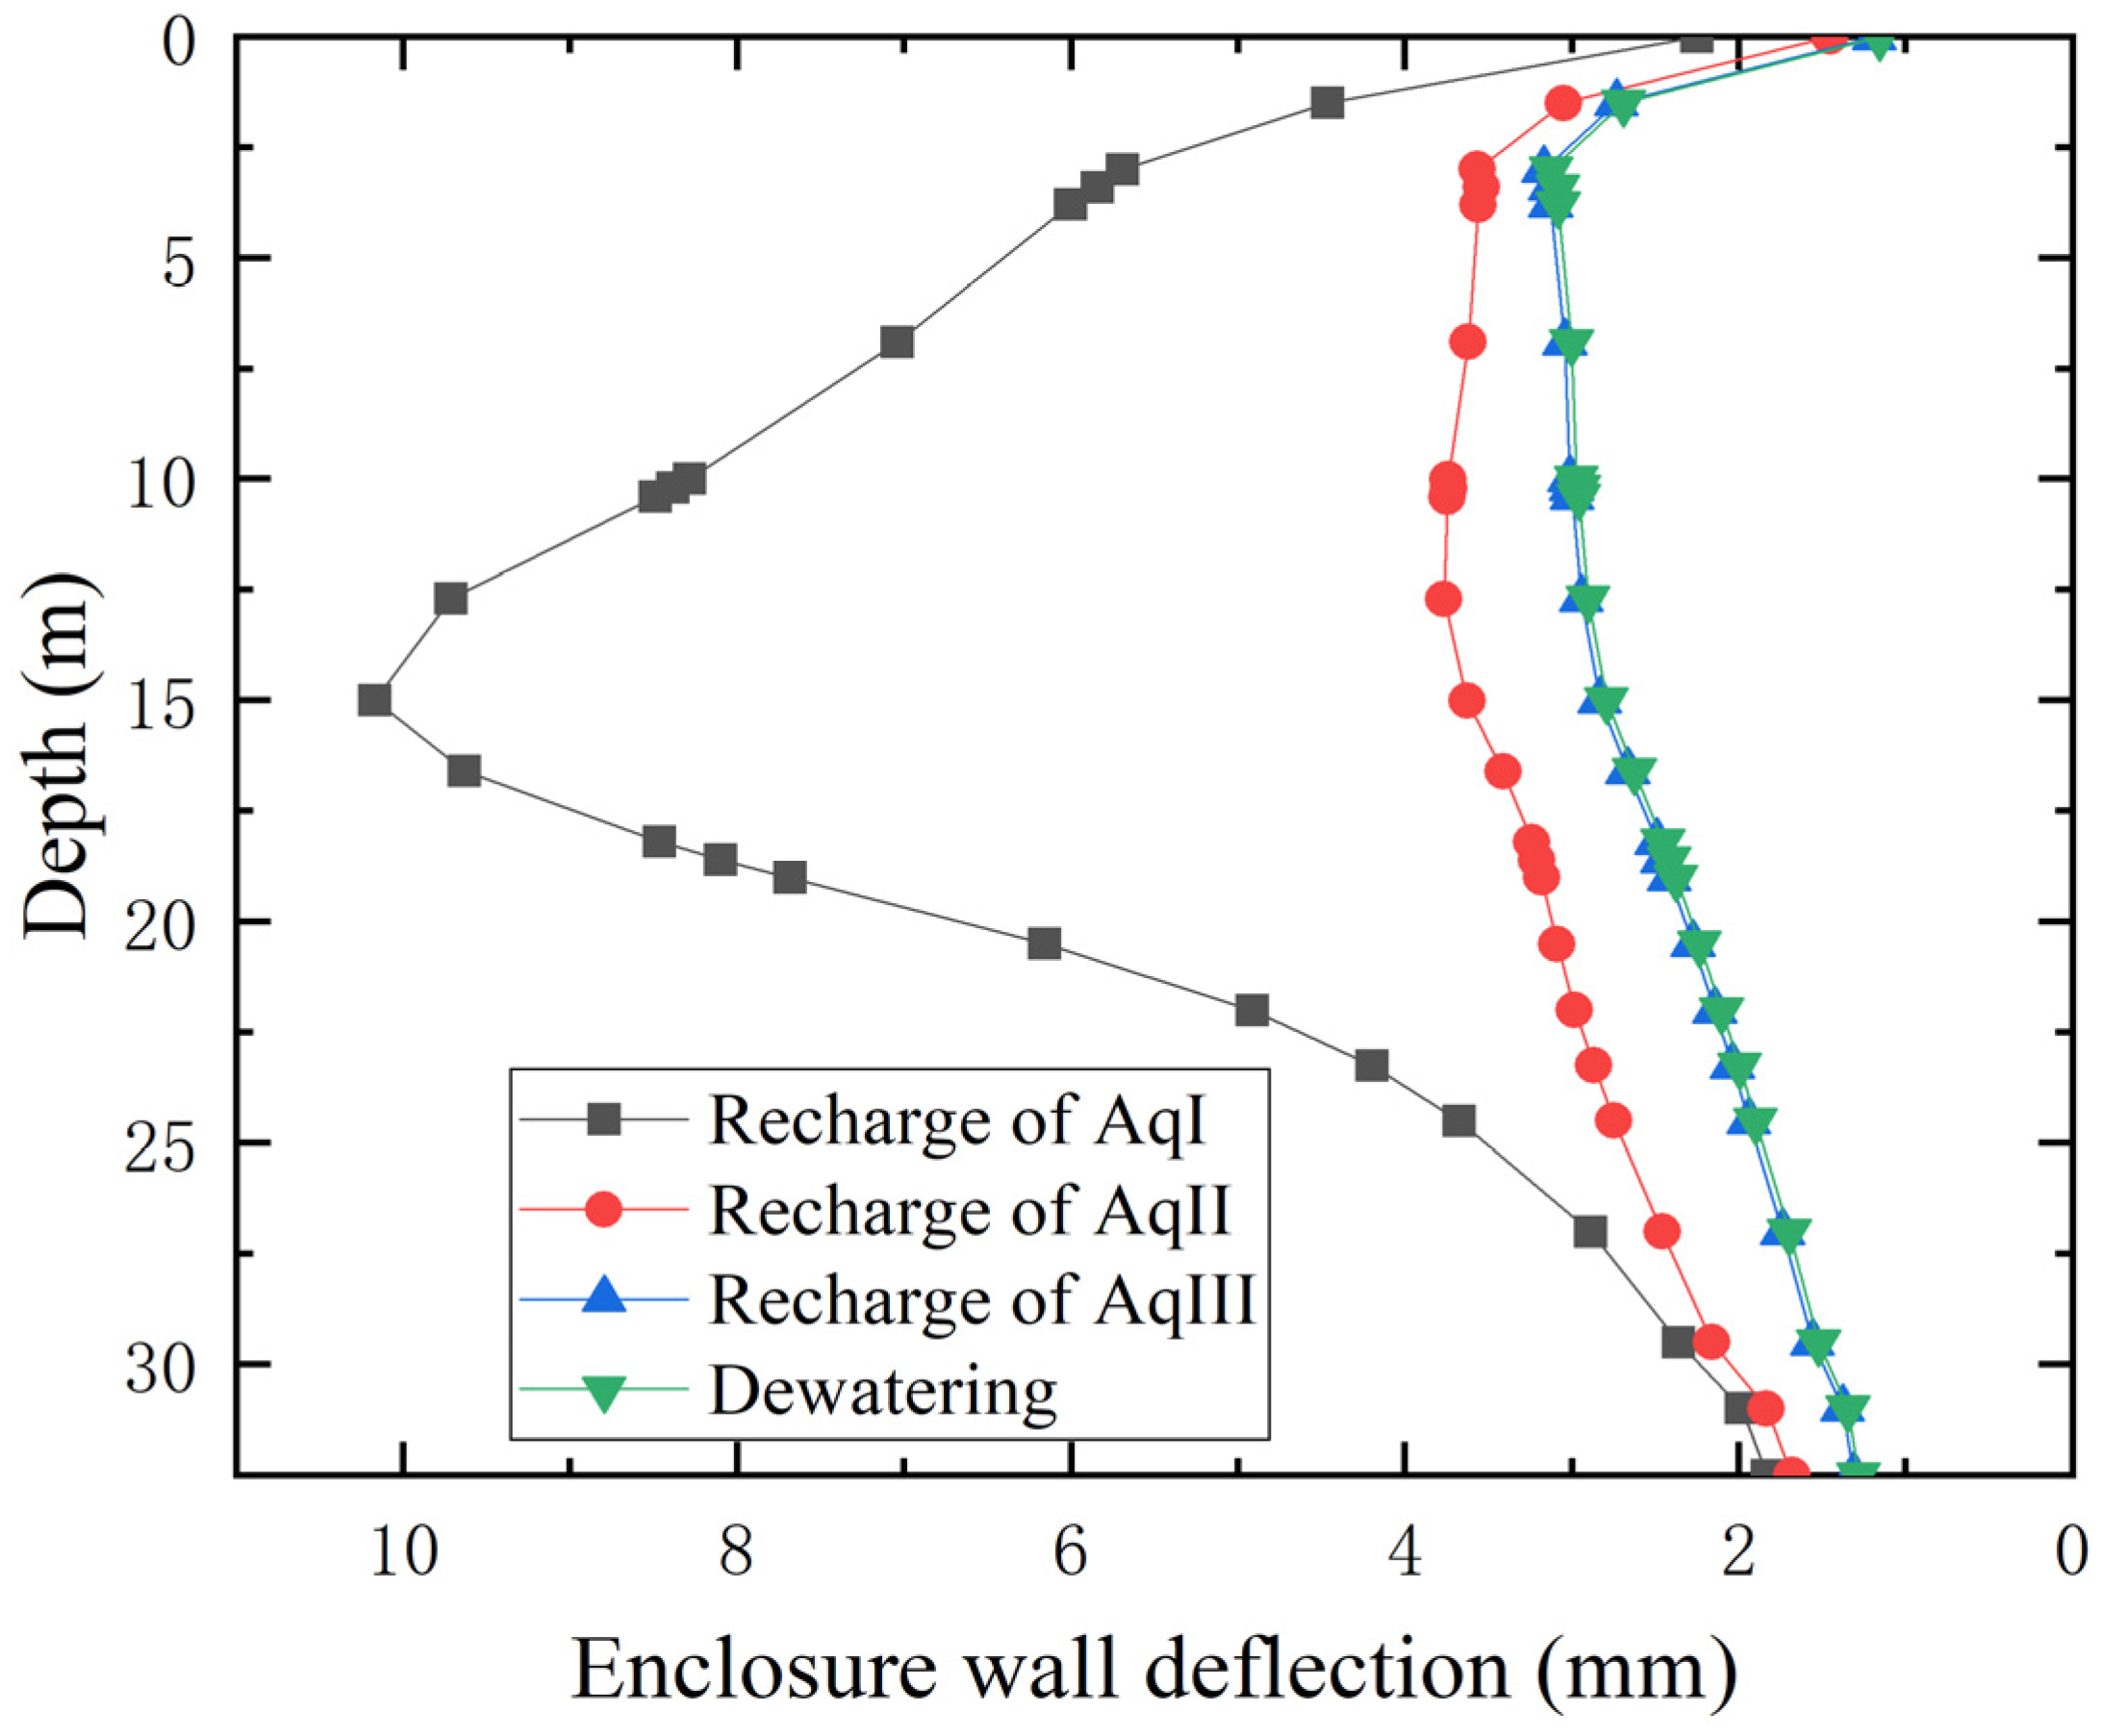
5.2.1. Enclosure Wall Deflection

Figure 7 presents the distribution of enclosure deflection along depth. It can be seen that the enclosure wall deflection is at a minimum during dewatering, and the deflection increases significantly when recharging AqI and AqII. This is because the groundwater level between the station and the foundation pit rises, resulting in an increase in the difference in water pressure inside and outside the pit, thereby enhancing the enclosure wall deflection. When recharging AqIII, the enclosure wall deflection is essentially the same as that of dewatering. This is because the buried depth of the enclosure wall is 32.5 m in AqII; when recharging AqIII, it primarily affects the resulting groundwater level of this aquifer, while the groundwater pressure changes on both sides of the enclosure wall are basically unaffected. In combination with the changes in the groundwater level and the enclosure wall deflection, the groundwater level in each aquifer is raised during the recharge of AqII, and the enclosure wall deflection is relatively small. Therefore, it can be concluded that the recharge of AqII is more reasonable.

5.2.2. Analysis of η

To more intuitively judge the variation in the enclosure wall deflection after recharging different aquifers, this paper defines η as the aggravation of the enclosure wall deflection, where η = the enclosure wall deflection after recharge/the enclosure wall deflection after dewatering; a larger value of η indicates a greater wall deflection after recharge.
Figure 8 depicts the aggravation of the enclosure wall deflection after recharge. It can be seen that the maximum deflection during the recharge of AqI is approximately 3.8 times greater than that during dewatering, and the difference in each η is large. This is due to the fact that the groundwater level of this aquifer rises sharply during the recharge of AqI, but remains basically unchanged in the other aquifers; this means that the difference in water pressure along the depth on both sides of the enclosure wall is uneven, resulting in the deflection along the enclosure wall being different. In the recharge of AqII, the maximum deflection is only 1.5 times greater than that of the dewatering, and the difference in each η is small, indicating a small difference in deflection along the enclosure wall, slightly differing from that during dewatering. In the recharge of AqIII, each η value is close to one, indicating that the recharge of AqIII has little effect on the enclosure wall deflection. Therefore, from the perspective of η, it is also more reasonable to recharge AqII.

5.3. Response of Soil

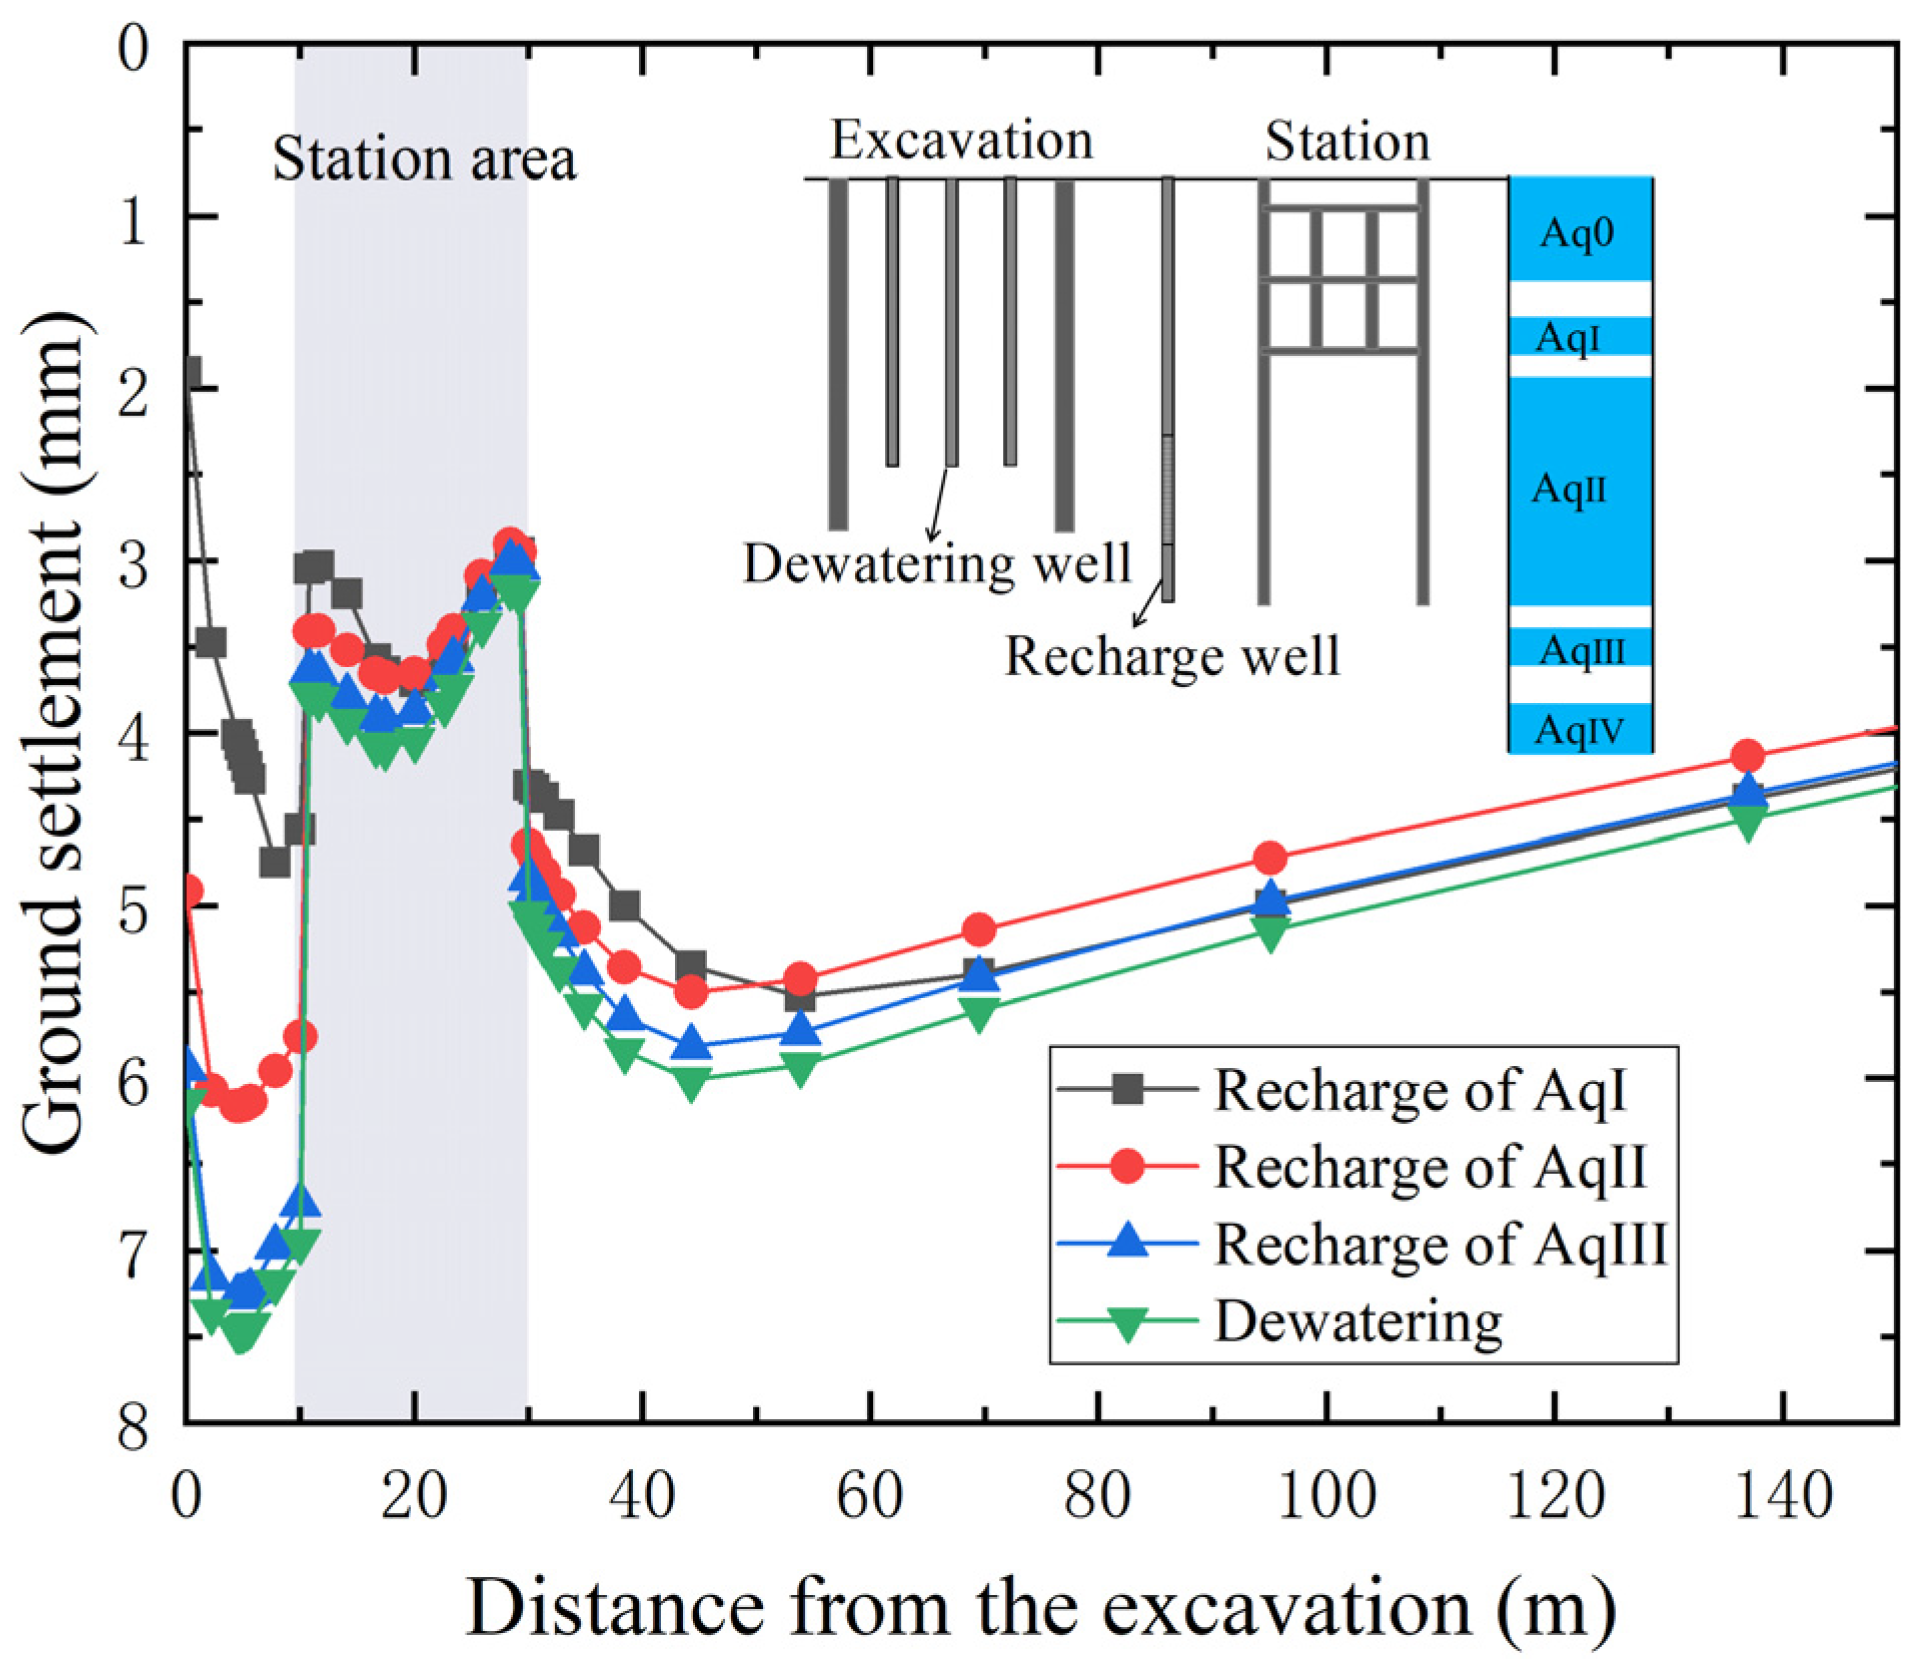
5.3.1. Ground Settlement

Figure 9 illustrates the distribution of ground settlement outside the pit. It can be seen that during the dewatering process, the maximum ground settlement at the front and rear of the station reaches 7.5 mm and 6 mm, respectively, while during the recharge of AqI, these values are about 4.8 mm and 4.5 mm for the front and rear, respectively. During the recharge of AqII, they are around 6 mm and 4.7 mm for the front and rear positions, correspondingly. However, the recharge of AqIII proves to be ineffective due to an inability to raise the groundwater level in each aquifer after recharge. Therefore, after recharge, ground settlement at both ends of the station diminishes as a result of elevated groundwater levels, resulting in a reduction in uneven settlement in the front and rear of the station. This indicates that controlling ground settlement by recharge is viable in the project, but a reasonable recharge scheme for the aquifer still needs to be devised.

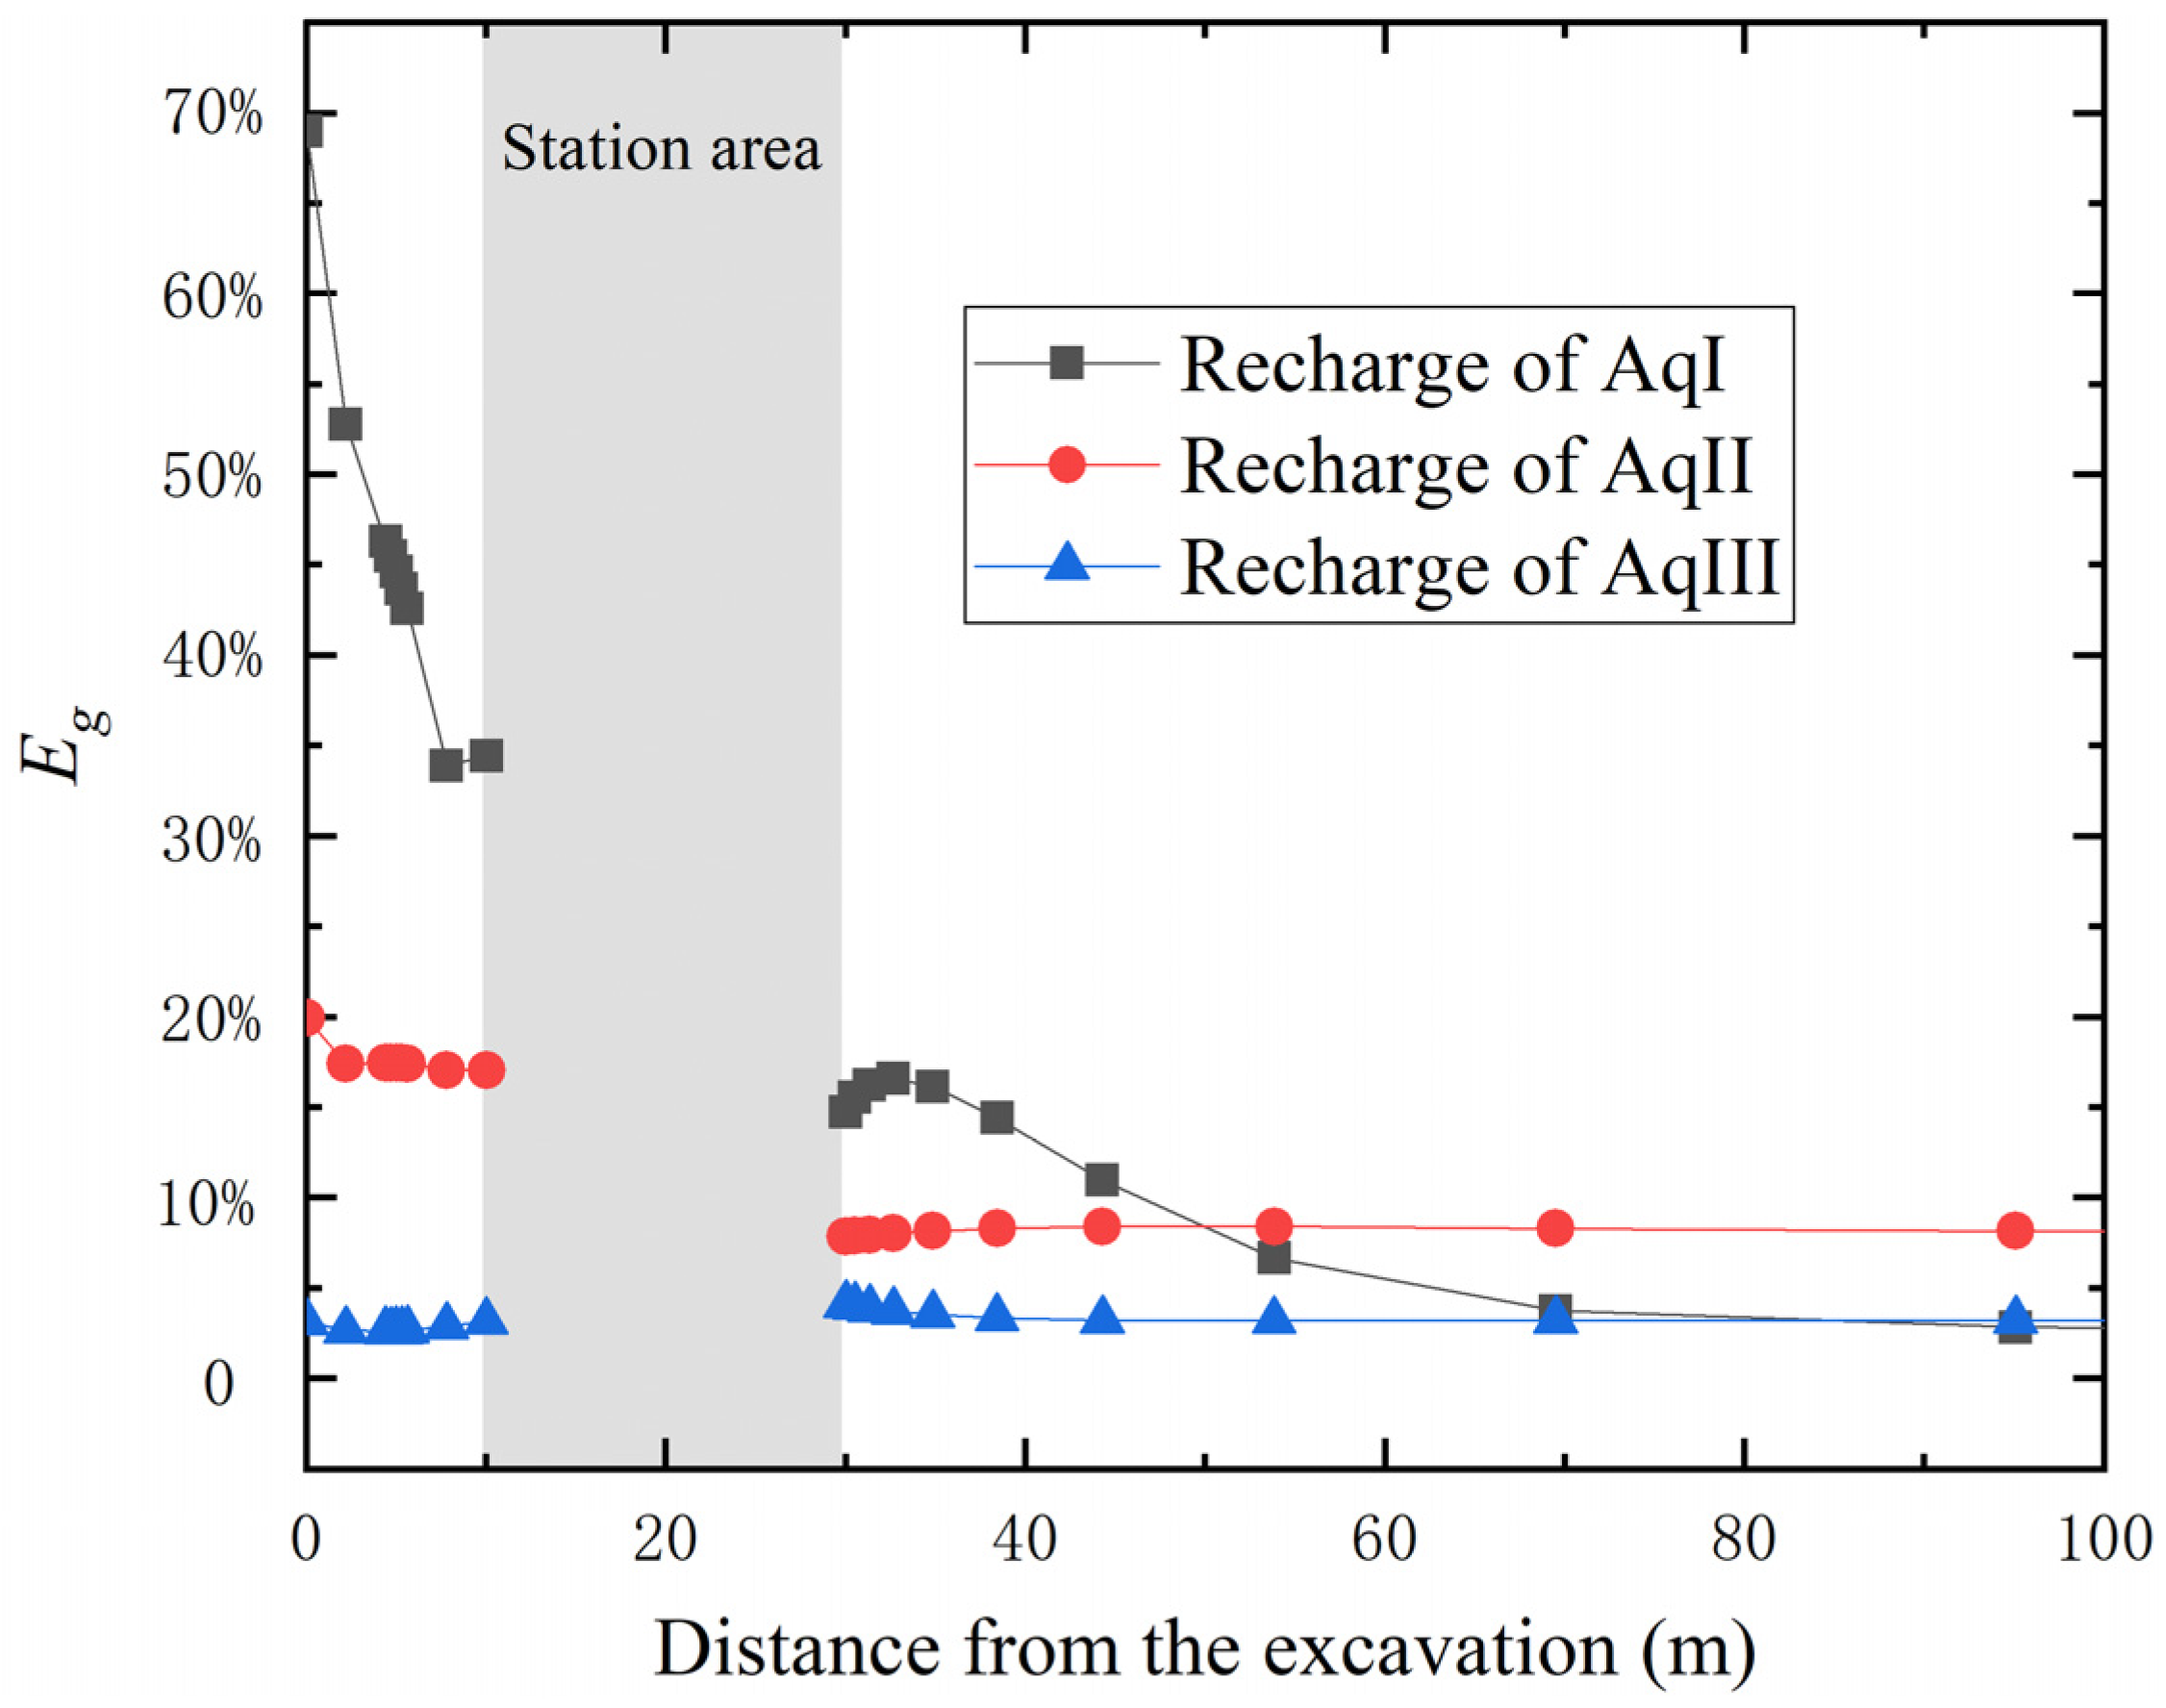
5.3.2. Analysis of Eg

To more intuitively judge the ground settlement control effect after the recharge of different aquifers, this paper defines Eg as the ground settlement control rate, where Eg = ground uplift after recharge/ground settlement after dewatering; an Eg closer to 100% indicates a more pronounced effect of recharge on settlement control.
Figure 10 illustrates the ground settlement control rate after recharge. The figure reveals significant variability in Eg in the front of the station during the recharge of AqI, with the maximum rate reaching 70% and the minimum rate at 35%. In contrast, during the recharge of AqII and AqIII, there is minimal variation in Eg observed at approximately 17% and 3%, respectively. Consequently, during the recharge of AqII, the Eg is relatively stable, and its value can be further increased by increasing the recharge intensity. While considering only ground settlement outside the pit, it appears that the recharge of AqI yields superior results; however, integrating the aforementioned analysis of the groundwater and the enclosure response indicates that both groundwater level rise and wall deflection are excessive after the recharge of AqI. Therefore, it is also more reasonable to recharge AqII to control groundwater and settlement.
Based on the aforementioned analysis of the groundwater, enclosure wall, and soil responses, it is evident that recharging AqII is more reasonable, as AqII is an aquifer with a hydraulic connection between the inside and outside of the foundation pit. Moreover, recharge in a well-circulated source aquifer can not only significantly raise the groundwater level of each aquifer, but effectively control the ground settlement without obviously increasing the enclosure wall deflection. Therefore, recharge should be carried out in a well-circulated source aquifer to achieve a better recharge effect. In this way, it can avoid aggravating the deformation of the pit due to difficultly controlling the recharge process and causing adverse effects on the adjacent buildings.

6. Discussion

This study has illustrated a common engineering issue that occurs in the case of the barrier effect incurred by adjacent underground structures; an appropriate recharge aquifer should be evaluated to achieve the expected recharge effect. In the actual project, however, the appropriate recharge aquifer depends on many factors, including the thickness of the aquifers, recharge flow rate, the spacing of recharge wells, and the distance between the foundation pit and underground structures. A numerical simulation involving various parameters should be conducted in the future to further investigate this issue. Moreover, due to the current lack of comparative data from different field measurements, this comparison will be a focus of future research.

7. Conclusions

Based on actual foundation pit engineering, this paper establishes a three-dimensional finite element model of recharging AqI, AqII, and AqIII to investigate the impact of recharge on the surrounding environment under the barrier effect. The following four main conclusions are obtained.
  • In the process of dewatering and the recharge of the foundation pit, the existence of adjacent underground structures will aggravate the fluctuation of groundwater levels. Therefore, the underground barrier should be considered in the design of the recharge to obtain the expected recharge effect.
  • When recharging AqI, which is completely cut off by the enclosure and the station, both the groundwater level rise and enclosure deflection induced by recharge are dramatic; therefore, caution should be taken when recharging under this condition to avoid aggravating the deformation of the surrounding environment due to difficulty controlling the recharge process.
  • When recharging AqIII, which is not cut off by the underground structure, most of the recharged water flows far away from the foundation pit, resulting in a low recharge efficiency.
  • Recharging AqII, which is an aquifer with a hydraulic connection between the inside and outside of the foundation pit, can significantly raise the groundwater of each aquifer, and effectively control the ground settlement without obviously increasing the deflection of the enclosure; engineers could benefit from this recharge scheme to achieve a better recharge effect under the barrier effect.

Author Contributions

Conceptualization, K.Y. and C.Z.; Methodology, K.Y. and C.Z.; Software, K.Y. and L.Z.; Validation, K.Y.; Formal analysis, K.Y.; Investigation, K.Y.; Writing—original draft, K.Y.; Writing—review & editing, K.Y. and C.Z.; Supervision, C.X., C.Z., X.X. and L.H.; Project administration, C.Z. All authors have read and agreed to the published version of the manuscript.

Funding

This work was supported by the National Natural Science Foundation of China [grant numbers 52478342 and 52238009], the Science and Technology Innovation Program of Hunan Province [grant number 2022RC1172], and the Natural Science Foundation of Jiangxi Province [grant number 20223BBG71018].

Data Availability Statement

The original contributions presented in this study are included in the article. Further inquiries can be directed to the corresponding author.

Acknowledgments

The authors are grateful for the warm and efficient work by editors and reviewers.

Conflicts of Interest

Author Lei Han was employed by the company China Construction Eighth Engineering Division Co., Ltd. The remaining authors declare that the research was conducted in the absence of any commercial or financial relationships that could be construed as a potential conflict of interest.

References

  1. Yin, Z.-Y.; Yin, J.-H.; Huang, H.-W. Rate-Dependent and Long-Term Yield Stress and Strength of Soft Wenzhou Marine Clay: Experiments and Modeling. Mar. Georesources Geotechnol. 2015, 33, 79–91. [Google Scholar] [CrossRef]
  2. Yin, Z.-Y.; Xu, Q.; Hicher, P.-Y. A simple critical-state-based double-yield-surface model for clay behavior under complex loading. Acta Geotech. 2013, 8, 509–523. [Google Scholar] [CrossRef]
  3. Wang, J.; Feng, B.; Liu, Y.; Wu, L.; Zhu, Y.; Zhang, X.; Tang, Y.; Yang, P. Controlling subsidence caused by de-watering in a deep foundation pit. Bull. Eng. Geol. Environ. 2012, 71, 545–555. [Google Scholar] [CrossRef]
  4. Shen, S.L.; Wang, Z.F.; Cheng, W.C. Estimation of lateral displacement induced by jet grouting in clayey soils. Géotechnique 2017, 67, 621–630. [Google Scholar] [CrossRef]
  5. Luo, Z.; Zhang, Y.; Wu, Y. Finite Element Numerical Simulation of Three-Dimensional Seepage Control for Deep Foundation Pit Dewatering. J. Hydrodyn. 2008, 20, 596–602. [Google Scholar] [CrossRef]
  6. Wu, Y.-X.; Shen, S.-L.; Yuan, D.-J. Characteristics of dewatering induced drawdown curve under blocking effect of retaining wall in aquifer. J. Hydrol. 2016, 539, 554–566. [Google Scholar] [CrossRef]
  7. Zeng, C.-F.; Powrie, W.; Xue, X.-L.; Li, M.-K.; Mei, G.-X. Effectiveness of a buttress wall in reducing retaining wall movement during dewatering before bulk excavation. Acta Geotech. 2021, 16, 3253–3267. [Google Scholar] [CrossRef]
  8. Du, Y.J.; Fan, R.D.; Liu, S.Y.; Reddy, K.R.; Jin, F. Workability, compressibility and hydraulic conductivity of zeolite-amended clayey soil/calcium-bentonite backfills for slurry-trench cutoff walls. Eng. Geol. 2015, 195, 258–268. [Google Scholar] [CrossRef]
  9. Xu, Y.-S.; Ma, L.; Shen, S.-L.; Sun, W.-J. Evaluation of land subsidence by considering underground structures that penetrate the aquifers of Shanghai, China. Hydrogeol. J. 2012, 20, 1623–1634. [Google Scholar] [CrossRef]
  10. Wang, Y.; Jiao, J.J. Origin of groundwater salinity and hydrogeochemical processes in the confined Quaternary aquifer of the Pearl River Delta, China. J. Hydrol. 2012, 438–439, 112–124. [Google Scholar] [CrossRef]
  11. Wang, J.; Feng, B.; Yu, H.; Guo, T.; Yang, G.; Tang, J. Numerical study of dewatering in a large deep foundation pit. Env. Earth Sci. 2013, 69, 863–872. [Google Scholar] [CrossRef]
  12. Pujades, E.; Vázquez-Suñé, E.; Carrera, J.; Vilarrasa, V.; De Simone, S.; Jurado, A.; Ledesma, A.; Ramos, G.; Lloret, A. Deep enclosures versus pumping to reduce settlements during shaft excavations. Eng. Geol. 2014, 169, 100–111. [Google Scholar] [CrossRef]
  13. Zeng, C.-F.; Powrie, W.; Chen, H.-B.; Wang, S.; Diao, Y.; Xue, X.-L. Ground Behavior due to Dewatering Inside a Foundation Pit Considering the Barrier Effect of Preexisting Building Piles on Aquifer Flow. J. Geotech. Geoenviron Eng. 2024, 150, 05024004. [Google Scholar] [CrossRef]
  14. Pujades, E.; Jurado, A. Groundwater-related aspects during the development of deep excavations below the water table: A short review. Undergr. Space 2021, 6, 35–45. [Google Scholar] [CrossRef]
  15. Xu, Y.-S.; Wu, H.-N.; Wang, B.Z.-F.; Yang, T.-L. Dewatering induced subsidence during excavation in a Shanghai soft deposit. Env. Earth Sci. 2017, 76, 351. [Google Scholar] [CrossRef]
  16. Figueroa-Miranda, S.; Tuxpan-Vargas, J.; Ramos-Leal, J.A.; Hernández-Madrigal, V.M.; Villaseñor-Reyes, C.I. Land subsidence by groundwater over-exploitation from aquifers in tectonic valleys of Central Mexico: A review. Eng. Geol. 2018, 246, 91–106. [Google Scholar] [CrossRef]
  17. Shen, S.-L.; Xu, Y.-S. Numerical evaluation of land subsidence induced by groundwater pumping in Shanghai. Can. Geotech. J. 2011, 48, 1378–1392. [Google Scholar] [CrossRef]
  18. Zeng, C.-F.; Song, W.-W.; Xue, X.-L.; Li, M.-K.; Bai, N.; Mei, G.-X. Construction dewatering in a metro station incorporating buttress retaining wall to limit ground settlement: Insights from experimental modelling. Tunn. Undergr. Space Technol. 2021, 116, 104124. [Google Scholar] [CrossRef]
  19. Wu, Y.-X.; Wu, H.-N.; Shen, S.-L.; Xu, Y.-S. Behaviour of multi-aquifer system during pumping test. JGS Spec. Publ. 2015, 1, 15–18. [Google Scholar] [CrossRef]
  20. Xie, Z.-F.; Shen, S.-L.; Arulrajah, A.; Horpibulsuk, S. Environmentally sustainable groundwater control during dewatering with barriers: A case study in Shanghai. Undergr. Space 2021, 6, 12–23. [Google Scholar] [CrossRef]
  21. Zhang, Y.-Q.; Wang, J.-H.; Chen, J.-J.; Li, M.-G. Numerical study on the responses of groundwater and strata to pumping and recharge in a deep confined aquifer. J. Hydrol. 2017, 548, 342–352. [Google Scholar] [CrossRef]
  22. Zhang, X.; Yang, J.; Zhang, Y.; Gao, Y. Cause investigation of damages in existing building adjacent to foundation pit in construction. Eng. Fail. Anal. 2018, 83, 117–124. [Google Scholar] [CrossRef]
  23. He, D.; Zeng, C.; Xu, C.; Xue, X.; Zhao, Y.; Han, L.; Sun, H. Barrier Effect of Existing Building Pile on the Responses of Groundwater and Soil During Foundation Pit Dewatering. Water 2024, 16, 2977. [Google Scholar] [CrossRef]
  24. Wu, Y.-X.; Zheng, Q.; Zhou, A.; Shen, S.-L. Numerical evaluation of the ground response induced by dewatering in a multi-aquifer system. Geosci. Front. 2021, 12, 101209. [Google Scholar] [CrossRef]
  25. Zhou, N.; Vermeer, P.A.; Lou, R.; Tang, Y.; Jiang, S. Numerical simulation of deep foundation pit dewatering and optimization of controlling land subsidence. Eng. Geol. 2010, 114, 251–260. [Google Scholar] [CrossRef]
  26. Pujades, E.; Vàzquez-Suñé, E.; Carrera, J.; Jurado, A. Dewatering of a deep excavation undertaken in a layered soil. Eng. Geol. 2014, 178, 15–27. [Google Scholar] [CrossRef]
  27. Zeng, C.-F.; Wang, S.; Xue, X.-L.; Zheng, G.; Mei, G.-X. Characteristics of ground settlement due to combined actions of groundwater drawdown and enclosure wall movement. Acta Geotech. 2022, 17, 4095–4112. [Google Scholar] [CrossRef]
  28. Shen, S.-L.; Lyu, H.-M.; Zhou, A.; Lu, L.-H.; Li, G.; Hu, B.-B. Automatic control of groundwater balance to combat dewatering during construction of a metro system. Autom. Constr. 2021, 123, 103536. [Google Scholar] [CrossRef]
  29. Wang, X.-W.; Yang, T.-L.; Xu, Y.-S.; Shen, S.-L. Evaluation of optimized depth of waterproof curtain to mitigate negative impacts during dewatering. J. Hydrol. 2019, 577, 123969. [Google Scholar] [CrossRef]
  30. Lyu, H.-M.; Shen, S.-L.; Wu, Y.-X.; Zhou, A.-N. Calculation of groundwater head distribution with a close barrier during excavation dewatering in confined aquifer. Geosci. Front. 2021, 12, 791–803. [Google Scholar] [CrossRef]
  31. Attard, G.; Winiarski, T.; Rossier, Y.; Eisenlohr, L. Review: Impact of underground structures on the flow of urban groundwater. Hydrogeol. J. 2016, 24, 5–19. [Google Scholar] [CrossRef]
  32. Liu, N.-W.; Peng, C.-X.; Li, M.-G.; Chen, J.-J. Hydro-mechanical behavior of a deep excavation with dewatering and recharge in soft deposits. Eng. Geol. 2022, 307, 106780. [Google Scholar] [CrossRef]
  33. Li, M.-G.; Chen, J.-J.; Xu, Y.-S.; Tong, D.-G.; Cao, W.-W.; Shi, Y.-J. Effects of groundwater exploitation and recharge on land subsidence and infrastructure settlement patterns in Shanghai. Eng. Geol. 2021, 282, 105995. [Google Scholar] [CrossRef]
  34. Zhang, Y.-Q.; Li, M.-G.; Wang, J.-H.; Chen, J.-J.; Zhu, Y.-F. Field tests of pumping-recharge technology for deep confined aquifers and its application to a deep excavation. Eng. Geol. 2017, 228, 249–259. [Google Scholar] [CrossRef]
  35. Gödeke, S. Simulation of groundwater mounding at a West Australian mine site. Env. Earth Sci. 2011, 64, 1363–1373. [Google Scholar] [CrossRef]
  36. Zeng, C.-F.; Zheng, G.; Xue, X.-L.; Mei, G.-X. Combined recharge: A method to prevent ground settlement induced by redevelopment of recharge wells. J. Hydrol. 2019, 568, 1–11. [Google Scholar] [CrossRef]
  37. Zhang, C.-H.; Wang, B.-T.; Liu, Y. Research on the Effective Control of Ground Settlement during Double-Layered Foundation Pit Dewatering Based on Seepage Control-Recharge Coupling Model. Yuan B, editor. Adv. Civ. Eng. 2022, 2022, 1–8. [Google Scholar] [CrossRef]
  38. Zheng, G.; Cao, J.R.; Cheng, X.S.; Ha, D.; Wang, F.J. Experimental study on the artificial recharge of semiconfined aquifers involved in deep excavation engineering. J. Hydrol. 2018, 557, 868–877. [Google Scholar] [CrossRef]
  39. Pujades, E.; López, A.; Carrera, J.; Vázquez-Suñé, E.; Jurado, A. Barrier effect of underground structures on aquifers. Eng. Geol. 2012, 145–146, 41–49. [Google Scholar] [CrossRef]
  40. Xu, Y.-S.; Shen, S.-L.; Ma, L.; Sun, W.-J.; Yin, Z.-Y. Evaluation of the blocking effect of retaining walls on groundwater seepage in aquifers with different insertion depths. Eng. Geol. 2014, 183, 254–264. [Google Scholar] [CrossRef]
  41. Zeng, C.-F.; Xue, X.-L.; Zheng, G.; Xue, T.-Y.; Mei, G.-X. Responses of retaining wall and surrounding ground to pre-excavation dewatering in an alternated multi-aquifer-aquitard system. J. Hydrol. 2018, 559, 609–626. [Google Scholar] [CrossRef]
  42. Font-Capo, J.; Pujades, E.; Vàzquez-Suñé, E.; Carrera, J.; Velasco, V.; Montfort, D. Assessment of the barrier effect caused by underground constructions on porous aquifers with low hydraulic gradient: A case study of the metro construction in Barcelona, Spain. Eng. Geol. 2015, 196, 238–250. [Google Scholar] [CrossRef]
  43. Tan, Y.; Li, X.; Kang, Z.; Liu, J.; Zhu, Y. Zoned Excavation of an Oversized Pit Close to an Existing Metro Line in Stiff Clay: Case Study. J. Perform. Constr. Facil. 2015, 29, 04014158. [Google Scholar] [CrossRef]
  44. Ma, L.; Xu, Y.-S.; Shen, S.-L.; Sun, W.-J. Evaluation of the hydraulic conductivity of aquifers with piles. Hydrogeol. J. 2014, 22, 371–382. [Google Scholar] [CrossRef]
  45. Xue, T.; Xue, X.; Long, S.; Chen, Q.; Lu, S.; Zeng, C. Effect of Pre-Existing Underground Structures on Groundwater Flow and Strata Movement Induced by Dewatering and Excavation. Water 2023, 15, 814. [Google Scholar] [CrossRef]
  46. Zeng, C.-F.; Liao, H.; Xue, X.-L.; Long, S.-C.; Luo, G.-J.; Diao, Y.; Li, M.-G. Responses of groundwater and soil to dewatering considering the barrier effect of adjacent metro station on multi-aquifers. J. Hydrol. 2022, 612, 128117. [Google Scholar] [CrossRef]
  47. Bear, J. Hydraulics of Groundwater; Courier Corporation: Mineola, NY, USA, 2012. [Google Scholar]
  48. Zeng, C.-F.; Chen, H.-B.; Liao, H.; Xue, X.-L.; Chen, Q.-N.; Diao, Y. Behaviours of groundwater and strata during dewatering of large-scale excavations with a nearby underground barrier. J. Hydrol. 2023, 620, 129400. [Google Scholar] [CrossRef]
Figure 1. Diagram of foundation pit and strata (adapted from reference [13]). (a) Symmetric plane of foundation pit. (b) Typical positional relation between pit and strata.
Water 17 00257 g001
Figure 2. A finite element model.
Water 17 00257 g002
Figure 3. Dewatering simulation method of the second confined aquifer.
Water 17 00257 g003
Figure 4. Comparison of measured and calculated (a) groundwater drawdown, (b) ground surface settlement, and (c) enclosure wall deflection (adapted from reference [48]).
Water 17 00257 g004aWater 17 00257 g004b
Figure 5. The groundwater drawdown of different aquifers outside the pit.
Water 17 00257 g005
Figure 6. The Ew of different aquifers during the recharge of AqI, AqI and AqIII.
Water 17 00257 g006
Figure 7. Distributions of enclosure wall deflection along depth.
Water 17 00257 g007
Figure 8. The value of η along the enclosure wall.
Water 17 00257 g008
Figure 9. Distribution of ground settlement outside the pit.
Water 17 00257 g009
Figure 10. The Eg of recharging different aquifers.
Water 17 00257 g010
Table 1. Strata distribution and main soil mechanical parameters (adapted from reference [46]).
Hydrological PropertySoil ClassificationH (m)Vs (m/s)γ (kN/m3)ω (%)K0 (m/d)eEs (MPa)φ′ (°)c′ (kPa)
Aq0Silty clay1015219.130.40.5770.855.92517
AdISilty clay1517219.328.70.610.815.22318
AqISilt1926620.221.70.440.6213.63410
AdIISilty clay2224619.925.10.560.716.12619
AqIISilt24.527820.422.30.440.5511.9348
Silt29.527820.620.90.410.5813.1368
Silty clay32.525320.323.60.560.667.42617
Silty sand35.530020.616.30.3980.52116.3377
AdIIISilty clay37274.520.520.70.560.68.92619
AqIIISilt4132820.718.20.440.54173410
AdIVSilty clay4731520.322.10.5460.649.22718
AqIVSilty sand5036020.617.50.3840.5323387
Table 2. Calculation cases of numerical simulation.
D/mH/mB/md/mq (m3/h)Recharged Aquifer
1035.54018.41AqI
1035.54018.41AqII
1035.54018.41AqIII
Table 3. Input parameters of the model soil (adapted from reference [46]).
Soil ClassificationDepth (m)γ (kN/m3)φ′ (°)c′ (kPa)Ss (m−1)KH (cm/s)KV (cm/s)E (MPa)e
Silty clays with silt seams10.019.125172.3 × 10−43.5 × 10−53.5 × 10−643.50.85
Silty clays15.019.323181.8 × 10−42.9 × 10−51.2 × 10−656.30.81
Clayey silts19.020.234107.3 × 10−52.3 × 10−41.2 × 10−4137.60.62
Silty clays22.019.926198.4 × 10−56.9 × 10−61.2 × 10−6118.60.71
Sandy silts24.520.43486.6 × 10−52.9 × 10−35.8 × 10−4151.80.55
Sandy silts29.520.63686.5 × 10−51.2 × 10−32.3 × 10−4153.30.58
Silty clays with silt seams32.520.326177.8 × 10−51.2 × 10−31.9 × 10−4128.00.66
Silty sands35.520.63775.6 × 10−53.5 × 10−36.9 × 10−4178.50.521
Silty clays37.020.526196.6 × 10−52.3 × 10−54.6 × 10−6152.20.6
Sandy silts41.020.734104.7 × 10−53.5 × 10−31.0 × 10−3214.50.54
Silty clays47.020.327185.0 × 10−55.8 × 10−71.2 × 10−7198.40.64
Silty sands50.020.63873.9 × 10−54.1 × 10−31.7 × 10−32570.53
Disclaimer/Publisher’s Note: The statements, opinions and data contained in all publications are solely those of the individual author(s) and contributor(s) and not of MDPI and/or the editor(s). MDPI and/or the editor(s) disclaim responsibility for any injury to people or property resulting from any ideas, methods, instructions or products referred to in the content.

