Abstract
Water use efficiency (WUE) plays a pivotal role in connecting the carbon and water cycles and represents the amount of water used by plants or ecosystems to achieve carbon sequestration. The response of WUE to climate warming and its underlying mechanisms remain unclear. Here, we examined the effects of varying levels of warming on carbon fluxes, water fluxes, and WUE in an alpine peatland, with Blysmus sinocompressus and Carex secbrirostris as dominant species. Open-top chambers were utilized to simulate two levels of warming: low-level warming (TL) and high-level warming (TH). The carbon dioxide and water fluxes were monitored over a growing season (June to September). Gradient warming significantly decreased both gross primary productivity (GPP) and net ecosystem carbon exchange (NEE); GPP was 10.05% and 13.31% lower and NEE was 21.00% and 30.00% lower in the TL and TH treatments, respectively, than in the control. Warming had no significant effect on soil evaporation, and plant transpiration and evapotranspiration were 36.98% and 23.71% higher in the TL treatment than in the control, respectively; this led to decreases of 31.38% and 28.17% in canopy water use efficiency (WUEc) and ecosystem water use efficiency (WUEe), respectively. Plant transpiration was the main factor affecting both WUEe and WUEc in response to warming. The findings underscore the essential function of water fluxes in regulating WUE and enhance our understanding of carbon–water coupling mechanisms under climate change.
1. Introduction
The Qinghai–Tibet Plateau (QTP), often referred to as the “Roof of the World” and the “Third Pole” of the Earth, serves as a vital mode of safeguarding ecological security []. It is a green barrier that regulates climate, water conservation, carbon sequestration, and emission reduction and helps maintain China’s ecological balance []. The QTP is also the area with the most concentrated distribution of wetlands in China, accounting for approximately 7.46% of the total wetland area []. It contains extensive peatlands and holds the largest peat reserves globally []. However, this region is highly vulnerable to climate change. The QTP has undergone a marked increase both in temperature and precipitation over the past few decades, which has significantly affected regional ecosystem functions []. The carbon and water cycles are closely linked processes that connect ecosystem components, including soil, vegetation, and the atmosphere []. Vegetation dynamics, along with carbon and water fluxes, have been profoundly shaped by alterations in temperature and precipitation patterns [,,].
Exchanges of carbon and water, coupled with soil–plant systems and the environmental atmosphere on the plateau, are crucial for the region’s carbon sink function, and temperature is considered one of the dominant factors influencing carbon exchanges []. Increased temperature can increase or decrease gross primary productivity (GPP) and ecosystem respiration (RE), depending on environmental factors, such as water availability, on the QTP [,,,]. Furthermore, changes in GPP and RE can either promote or inhibit the net ecosystem carbon dioxide exchange (NEE) response to warming [,]. Temperature alters the rate of soil respiration and soil carbon decomposition by regulating the activity of soil microorganisms, which ultimately affects the carbon output of the soil. Changes in temperature also affect the phenological state and photosynthetic rate of vegetation, which can lead to alterations in the carbon input of ecosystems []. Warming may also affect water fluxes, accelerate the evapotranspiration (ET) rate, and lead to a decrease in the soil moisture content []. ET comprises soil evaporation (E) and plant transpiration (T) and is a key factor affecting both water and carbon cycles. Warming usually increases ET by enhancing E or T, although exceptions in which ET decreases with increased temperature have also been reported [,].
Water use efficiency (WUE) is a key indicator for quantifying the coupling effects of carbon and water cycles in ecosystems, and it represents the amount of carbon fixed per unit of water loss in terrestrial ecosystems []. Ecosystems with higher WUE can sequester more carbon, which contributes to climate change mitigation. Typically, WUE can be characterized at two levels: the canopy level (canopy water use efficiency, WUEc) and the ecosystem level (ecosystem water use efficiency, WUEe) []. Factors such as plant community structure, soil water availability, and microbial activities significantly affect carbon and water fluxes, which results in variations in the response of WUE to temperature increases in alpine ecosystems []. Studies of the entire QTP have indicated that GPP is a major factor mediating changes in WUEe [,]. In an alpine meadow in Hongyuan County in the northeastern QTP, ET shows greater sensitivity to warming than GPP, which results in a decrease in WUE under warming conditions []. The extent to which water fluxes and carbon fluxes mediate changes in WUE due to climate warming appears to depend heavily on plant and soil characteristics, although the underlying mechanisms have not yet been fully characterized.
Several recent studies have examined carbon and water fluxes, as well as WUE dynamics. However, whether carbon or water fluxes primarily drive changes in WUE under different levels of warming has remained unclear. To address this research gap, we conducted an open-top warming experiment in the peatlands of the Zoige Plateau to simulate various warming levels. Our objectives were to (1) assess the response of carbon and water fluxes, as well as WUE, to gradient warming treatments in an alpine peatland; (2) determine whether carbon or water dynamics are the main factors affecting WUE; and (3) elucidate the underlying mechanisms. Understanding the effects of warming on WUE is imperative for predicting the interactions between carbon and water cycles as climate change progresses. The results of this study offer valuable perspectives on the adaptive strategies of plant communities and the resilience of peatland ecosystems, which are vital for the development of carbon management and climate adaptation strategies.
2. Materials and Methods
2.1. Study Area and Experimental Design
The Zoige peatland, which is located in the northeastern part of the QTP at an elevation of 3400 to 3900 m, spans an area of roughly 16,000 km2 (Figure 1a). This region features a cold temperate and plateau humid climate, which is characterized by an exceptionally long frost period. The average annual temperature varies between −0.7 °C and 1.1 °C, and the average annual precipitation falls between 650 mm and 750 mm, with the majority occurring from June to September [,]. The relative humidity is around 78%. The alpine meadow was dominated by Carex meyeriana, C. muliensis, Blysmus sinocompressus, Carex secbrirostris, and C. tibetikobresia.
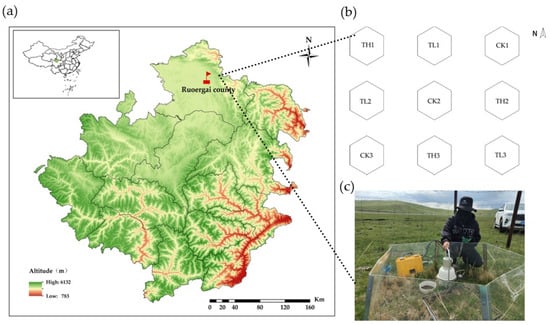
Figure 1.
(a) Overview of the study site; (b) experimental design; (c) a photograph of warming plot. CK, control; TL, low-level warming; TH, high-level warming.
This study was conducted on a field-manipulated platform for warming treatment, which was established in June 2021 and located at Axi Ranch (33°47′56″ N, 102°57′28″ E) in Zoige National Nature Reserve. Nine plots with similar vegetation and hydrological conditions were selected, which were spaced at least 50 cm apart. The plots were dominated by Blysmus sinocompressus and Carex secbrirostris, with the water table at approximately 50 cm below the ground surface. The temperature on the Zoige Plateau has increased by 0.6 °C per decade since 1990 []. This warming trend was modeled using the open-top chamber (OTC) method of setting two levels of warming treatments (low-level warming, TL; high-level warming, TH). The treatments were arranged in a randomized block design (Figure 1b). The plots for the control (CK) did not have an OTC. Each treatment had three replicates. The OTC devices were hexagonal structures made of six trapezoidal acrylic glass panels that were highly transparent; each had a base length of 75 cm and a thickness of 3 mm. The heights of the OTCs for the TL and TH treatments were 25 cm and 50 cm, respectively. A 50 cm × 50 cm frame made of stainless steel was installed in the center zone of each plot and inserted 20 cm into the soil. The frames were used to fix transparent chambers for measuring NEE, RE, and ET. Additionally, a PVC ring, 20 cm in diameter, was positioned near each frame within the plots to facilitate measurements of E.
2.2. Measurement of Carbon and Water Fluxes
From June to September 2022, carbon and water fluxes in the experimental plots were measured every 10 days. NEE, RE, and ET were determined using a static chamber paired with a laser-based greenhouse gas analyzer (DLT-100, Los Gatos Research Inc., Mountain View, CA, USA). The static chamber was a high-transparency chamber (50 cm × 50 cm × 50 cm) with two small fans installed at the top to ensure rapid mixing of the gases inside the chamber. NEE and ET were measured in transparent chambers, and RE was measured in dark chambers with an opaque cloth. During the measurements, the static chamber was positioned on the preinstalled stainless-steel frame, and water was added to the frame space to create a seal for the chamber. The greenhouse gas analyzer continuously recorded changes in CO2 and H2O concentrations inside the chamber for 2 min, with a data collection frequency of 1 Hz. A TZS-5X digital thermometer (Hangzhou Tuopu Instrument Manufacturing Inc., Hangzhou, China) was installed inside the chamber to record the air temperature at the beginning and end of each measurement. The equations for calculating NEE, RE, and ET were as follows []:
where F is the flux of CO2 and H2O (μ·mol (m2·s)), VC represents the volume of the static chamber (cm3), P0 denotes the initial pressure (kPa), WV is the initial water vapor mole fraction (mmol/mol), G refers to the gas constant (8.314 Pa·m3/(K·mol)), Sa is the surface area of the base (cm2), T0 is the air temperature within the chamber, and represents the rate of change in the gas concentration over time as a linear slope during the observation period.
GPP was calculated by measuring NEE and RE:
E was measured using a PS-9000 soil gas flux monitoring system (Beijing LICA United Technology Limited, Beijing, China), which comprised an infrared gas analyzer paired with an SC-11 respiration chamber. During measurements, the chamber of the gas analyzer was placed on the pre-installed PVC ring, and the instrument automatically measured the flux based on changes in the CO2 concentration within the chamber.
T was calculated as follows []:
WUEc was calculated as follows []:
WUEe was calculated as follows []:
2.3. Measurement of Soil Temperature and Soil Water Content
The soil temperature (TS) and soil water content (SWC) were measured simultaneously with carbon and water fluxes. TS was measured at depths of 5 cm, 10 cm, and 20 cm using a TZS-5X digital thermometer; SWC was recorded at the same depths using a TDR-300 Moisture Meter (Spectrum Technologies Inc., Aurora, IL, USA). Three random readings were recorded in each experimental plot for both TS and SWC, and the average values were calculated.
2.4. Statistical Analyses
A Repeated Measures Analysis of Variance (RM-ANOVA) was conducted to evaluate the effects of warming regimes on SWC, TS, E, T, ET, NEE, GPP, RE, WUEe, and WUEc, followed by post hoc multiple comparisons using the LSD method. All data met the assumptions of ANOVA. Pearson correlation coefficients were used to analyze the correlations among variables. Statistical analysis and plotting were performed using R version 4.3.3 [].
3. Results
3.1. Effect of Gradient Warming on TS and SWC
Warming significantly increased soil temperature (Table 1). The TS was 0.66 °C and 1.07 °C higher at a 5 cm depth in TL and TH, respectively, compared with the CK (Table 2). At depths of 10 cm and 20 cm, the TS was reduced by 0.30 °C and 0.47 °C, respectively, in the TL treatment compared to the CK. In contrast, in the TH treatment, the TS decreased by 0.19 °C and 0.25 °C, respectively, relative to the CK (Table 2). The interaction between depth and treatment was significant (p < 0.05), as the TS in the 10 cm and 20 cm layers was greater than in the 5 cm layers (Table 2).

Table 1.
Results of RM-ANOVA for the effect of warming on soil temperature and soil water content.
Table 2.
Soil temperature, soil water content, carbon and water fluxes, and water use efficiency in gradient warming treatments (Mean ± Standard Error).
Warming also significantly reduced the SWC at all depths (p < 0.05) (Table 1). The SWC was 3.92% and 7.21% lower at a 5 cm depth in TL and TH, respectively, compared with the CK; at a 10 cm depth, the SWC was 6.54% and 8.63% lower in TL and TH, respectively, compared with the CK; and at a 20 cm depth, the SWC was 5.74% and 8.36% lower in TL and TH, respectively, compared with the CK (Table 2). The interaction between depth and treatment was significant (p < 0.05); the SWC was lower in TL and TH at a depth of 10 cm, but the SWC was not lower in the CK at a depth of 10 cm.
3.2. Effect of Gradient Warming on Carbon Fluxes
Warming significantly reduced the GPP and NEE in both the TL and TH treatments (p < 0.001), and it had no significant effect on RE (p > 0.05) (Table 3). From June to September, GPP gradually decreased over time, and the average value of GPP was 21.19 μ mol m−2s−1 in the CK plots (Figure 2). GPP was 10.05% and 13.31% lower on average in the TL and TH treatments, respectively, than in the CK (Table 2). RE initially increased and then decreased, and its peak value in the CK was observed on August 4th. The peak RE in the warming treatments occurred about 10 days earlier than that in the CK. NEE gradually increased over time, with an average value of −11.98 μ mol m−2s−1 (Table 2). The absolute value of NEE decreased by an average of 21.00% and 30.00% in the TL and TH treatments, respectively. Significant interactions of time and treatment with GPP and NEE were observed. In August, GPP was significantly lower and NEE was significantly higher in both the TL and TH plots than in the CK (Figure 2).
Table 3.
Results of RM-ANOVA for the effect of warming on carbon and water fluxes and water use efficiency.
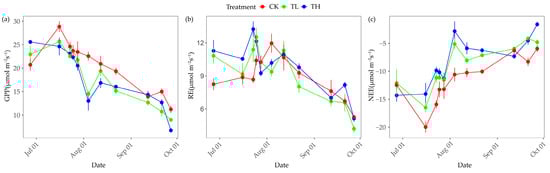
Figure 2.
Dynamics of gross primary productivity (GPP, a), ecosystem respiration (RE, b), and net ecosystem carbon dioxide exchange (NEE, c) under gradient warming treatments.
3.3. Effect of Gradient Warming on Water Fluxes
From June to September, E, T, and ET fluctuated within the ranges of 0.16–0.46 mmol m−2s−1, 0.20–1.46 mmol m−2s−1, and 0.36–1.73 mmol m−2s−1, respectively, and no consistent trend was observed (Figure 3, Table 2). T and ET were 36.98% and 23.71% higher in the TL treatment, respectively, than in the CK, and these differences were significant (p < 0.01). In contrast, the TH treatment did not significantly alter T and ET (p > 0.05, Table 3). The average E was lower in both warming treatments than in the control, but the effect was not significant (p > 0.05, Table 3). Significant interactions of time and treatment with E, T, and ET were observed. As shown in Figure 3, E, T, and ET showed larger fluctuations in both the TL and TH treatments than in the CK.
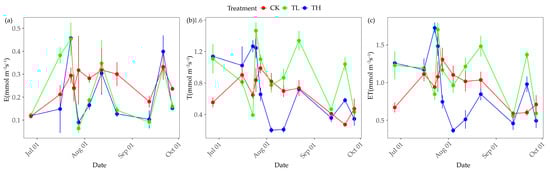
Figure 3.
Dynamics of soil evaporation (E, a), plant transpiration (T, b), and evapotranspiration (ET, c) under gradient warming treatments.
3.4. Effect of Gradient Warming on WUE and T/ET
WUEc and WUEe were 31.38% and 28.17% lower in the TL treatment than in the CK, respectively (Table 2, p < 0.05). T/ET was 23.71% higher in the TL treatment than in the CK (p < 0.05). No significant changes in WUEc, WUEe, or T/ET were observed at the beginning and end of the growing season in the TH treatment (p > 0.05). However, significant interactions of time and treatment with WUEc, WUEe, and T/ET were observed. Both WUEc and WUEe were greater in the TH plots than in the CK and TL plots during the mid-growing season, from late July to mid-August (Figure 4a,b). In contrast, T/ET was lower in the TH plots than in the CK and TL plots (Figure 4c).
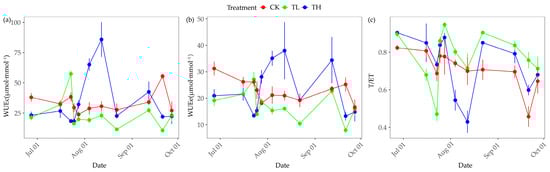
Figure 4.
Dynamics of canopy water use efficiency (WUEc, a), ecosystem water use efficiency (WUEe, b), and T/ET (c) under gradient warming treatments.
3.5. Correlations of Carbon and Water Fluxes with TS and SWC
The TS was found to be significantly negatively correlated with GPP (p < 0.05) and E (p < 0.01), while it exhibited a positive correlation with RE (p < 0.01), NEE (p < 0.001), and ET (p < 0.01). The SWC exhibited a significant negative correlation with GPP (p < 0.05) and a pronounced positive correlation with T (p < 0.01). WUEc and WUEe exhibited significant negative correlations with both RE and ET (p < 0.01). Moreover, the ratio of T to ET (T/ET) showed a significant negative correlation with GPP (p < 0.05) and a positive correlation with RE (p < 0.01) (Figure 5).
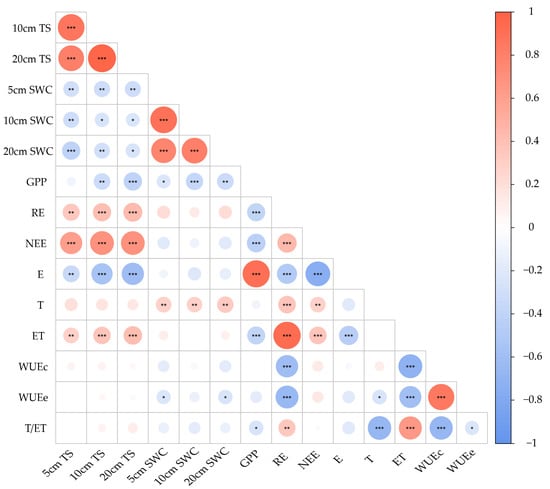
Figure 5.
Pearson correlations among the soil water content, soil temperature, carbon and water fluxes, and water use efficiency. ‘*’, ‘**’, and ‘***’ represent significant effects at p < 0.05, p < 0.01, and p < 0.001, respectively. SWC, soil water content; TS, soil temperature; GPP, gross primary productivity; RE, ecosystem respiration; NEE, net ecosystem carbon exchange; E, soil evaporation; T, plant transpiration; ET, evapotranspiration; WUEc, canopy water use efficiency; WUEe, ecosystem water use efficiency; T/ET, ratio of soil evaporation and evapotranspiration.
4. Discussion
4.1. Response of Carbon Fluxes to Gradient Warming
Generally, warming affects carbon fluxes by altering TS, SWC, plant photosynthesis, and microbial activities [,,]. In our study, an increased TS led to a decrease in GPP and an increase in RE, and this altered the absolute values of NEE (Figure 5). Specifically, warming significantly reduced GPP by decreasing the SWC in the Zoige peatland (Table 1 and Table 3), a result that is consistent with observations from alpine grasslands in Nam Co, QTP, where elevated temperatures were associated with reduced GPP due to intensified drought conditions and suppressed vegetation growth []. Another study at the interface of the QTP, Loess Plateau, and Mongolian Plateau also found that rising temperatures were a major factor in deducing GPP by increasing grassland aridity and inhibiting vegetation growth in grassland ecosystems []. These findings suggest that warming primarily affected the GPP by suppressing water availability in QTP grasslands []. Additionally, the non-significant increase in RE in the TL and TH treatments could be attributed to increased microbial activity []. Overall, the warming-induced reduction in NEE in our study was mainly attributed to the decreased GPP, as warming only significantly affected GPP, not RE (Table 3), which is consistent with a study conducted in an alpine meadow in Haibei, QTP []. These findings suggest that the GPP is the main contributor to changes in NEE under warming conditions.
4.2. Response of Water Fluxes to Gradient Warming
ET consists of both E and T and plays a fundamental role in linking the SWC with atmospheric water fluxes []. In alpine grasslands, T accounts for 68–73.9% of the total ET []. In our study, both levels of warming reduced the SWC (Table 3), which led to drier plots, where T comprised the largest proportion of the ET due to increased T and decreased E under the warming treatments. SWC plays a critical role in determining the competition for water between T and E. For example, in alpine meadows in Naqu, ET is dominated by T when the SWC is low []. Similarly, in our experimental plots, the dominance of T over E is consistent with this pattern, which highlights the strong influence of water availability on the partitioning of ET under warming conditions. These findings suggest that SWC serves as a key regulator of the hydrological balance between E and T, with warming intensifying the role of transpiration in the water cycle.
We observed that T increased significantly in the TL treatment and did not change significantly in the TH treatment (Table 3). The different responses of T to TL and TH could be attributed to the response of plant stomatal conductance to warming. Plants may decrease their stomatal conductance to reduce water loss under limited water availability []. Elevated temperatures and vapor pressure in the OTC may lead to increased leaf water diffusion, thereby increasing T in the TL treatment. However, excessive temperatures further deplete the SWC, forcing plants to reduce their canopy stomatal conductance, resulting in lower T in the TH treatment compared to the TL treatment []. In August, the elevated atmospheric temperatures exacerbated this effect, leading to a dramatic decrease in T in the TH treatment (Figure 3) and consequently a decrease in ET.
4.3. Response of WUE to Gradient Warming
The significant relationship between WUE and ET (Figure 5) indicates that the responses of both WUEc and WUEe to warming were predominantly driven by water fluxes in Zoige peatland. The lowered WUEc and WUEe in the TL treatment could be attributed to the increased T and ET, which were driven by the slightly elevated TS. These changes reflect the direct impact of warming on the ecosystem’s water dynamics, and increased T and ET effectively reduced WUE. The non-significant changes in T and ET in the TH treatment might be explained by the decline in plant stomatal conductance due to water deficiency, which stemmed from the excessively elevated TS. This phenomenon revealed the threshold nature of plant responses to warming, where moderate increases in temperature can enhance water fluxes, while extreme temperatures may impair plant water uptake and utilization. Additionally, an anomalous increase in WUEc and WUEe was observed in the TH treatment in August (Figure 4), which can be explained by the anomalous decrease in T (Figure 3). The GPP was not significantly correlated with WUE (Figure 5), although it decreased with the gradient warming treatments. Our results indicated that T and ET, rather than GPP, determined WUE when the SWC was reduced in Zoige peatland; this is consistent with the results of a previous study in Hongyuan County, which is adjacent to Zoige peatland []. Similarly, studies by Ganjurjav et al. in alpine meadows in Naqu showed that warming increased ET in alpine meadows without affecting the GPP, resulting in decreased WUE [].
5. Conclusions
We analyzed changes in carbon and water fluxes in Zoige Plateau peatland under simulated warming. Our findings indicated that the responses of carbon and water fluxes to different warming levels were inconsistent. Both the TL and TH treatments reduced NEE (21.00% and 30.00%) by lowering the GPP (10.05% and 13.31%) without significantly affecting RE. Additionally, T and ET were only significantly reduced by 36.98% and 23.71%, respectively, in the TL treatment, and no significant changes in these variables were observed in the TH treatment. Water fluxes were the primary drivers of WUEe and WUEc, and reductions in waWUEe and WUEc of 28.17% and 31.38% were observed in the TL treatment; however, no significant changes were observed in the TH treatment. Our findings highlight the contrasting effects of TL and TH on carbon and water fluxes and clarify the mechanisms of carbon–water coupling in alpine peatlands under climate change. Our findings also offer new insights into the role of water availability in managing alpine ecosystems under future warming scenarios, suggesting that water fluxes may significantly influence the ecosystem’s capacity to mitigate climate change.
Author Contributions
Conceptualization and methodology: X.K. and Y.H.; investigation, writing—original draft preparation, X.Y.; writing—review and editing, Z.Y. and X.Z.; investigation, A.Y., Y.N., J.L., E.K. and W.Z.; data curation, Y.L., K.Z. and L.Y.; supervision, funding acquisition, X.Z. and X.K. All authors have read and agreed to the published version of the manuscript.
Funding
This work was financially supported by the Fundamental Research Funds of CAF (CAFYBB2022SZ002) and the National Natural Science Foundation of China (42041005, 32171597, 32201410, 32171598).
Data Availability Statement
The data supporting this study’s findings are available on request from the corresponding author.
Acknowledgments
Thanks to the editor and the anonymous reviewers for their constructive comments and suggestions for improving the quality of this paper.
Conflicts of Interest
The authors declare no conflicts of interest.
References
- Zhao, Y.; Chen, D.; Fan, J. Sustainable Development Problems and Countermeasures: A Case Study of the Qinghai-Tibet Plateau. Geogr. Sustain. 2020, 1, 275–283. [Google Scholar] [CrossRef]
- Wang, Q.; Liu, S.; Wang, F.; Liu, H.; Liu, Y.; Yu, L.; Sun, J.; Tran, L.-S.P.; Dong, Y. Quantifying Carbon Sequestration Service Flow Associated with Human Activities Based on Network Model on the Qinghai-Tibetan Plateau. Front. Environ. Sci. 2022, 10, 900908. [Google Scholar] [CrossRef]
- Hua, R.; Hua, L.; Tang, Z.; Dong, R.; Bao, D.; Ye, G.; La, M.; Sun, W.; Zhang, Z.; Wang, L.; et al. Maxent Modeling for Predicting Habitat Suitability and Potential Distribution of Plateau Pika (Ochotona Curzoniae) on the Qinghai-Tibet Plateau, China. Rangel. Ecol. Manag. 2023, 87, 34–43. [Google Scholar] [CrossRef]
- Yang, G.; Peng, C.; Chen, H.; Dong, F.; Wu, N.; Yang, Y.; Zhang, Y.; Zhu, D.; He, Y.; Shi, S.; et al. Qinghai–Tibetan Plateau Peatland Sustainable Utilization under Anthropogenic Disturbances and Climate Change. Ecosyst. Health Sustain. 2017, 3, e01263. [Google Scholar] [CrossRef]
- Kuang, X.; Jiao, J.J. Review on Climate Change on the Tibetan Plateau during the Last Half Century. J. Geophys. Res. Atmos. 2016, 121, 3979–4007. [Google Scholar] [CrossRef]
- Catovsky, S.; Holbrook, N.M.; Bazzaz, F.A. Coupling Whole-Tree Transpiration and Canopy Photosynthesis in Coniferous and Broad-Leaved Tree Species. Can. J. For. Res. 2002, 32, 295–309. [Google Scholar] [CrossRef]
- Kang, X.; Li, Y.; Wang, J.; Yan, L.; Zhang, X.; Wu, H.; Yan, Z.; Zhang, K.; Hao, Y. Precipitation and Temperature Regulate the Carbon Allocation Process in Alpine Wetlands: Quantitative Simulation. J. Soils Sediments 2020, 20, 3300–3315. [Google Scholar] [CrossRef]
- Yun, H.; Tang, J.; D’Imperio, L.; Wang, X.; Qu, Y.; Liu, L.; Zhuang, Q.; Zhang, W.; Wu, Q.; Chen, A.; et al. Warming and Increased Respiration Have Transformed an Alpine Steppe Ecosystem on the Tibetan Plateau from a Carbon Dioxide Sink into a Source. J. Geophys. Res. Biogeosci. 2022, 127, e2021JG006406. [Google Scholar] [CrossRef]
- Wang, X.; Li, Y.; Hao, Y.; Kang, E.; Han, J.; Zhang, X.; Li, M.; Zhang, K.; Yan, L.; Yang, A.; et al. Soil Temperature and Fungal Diversity Jointly Modulate Soil Heterotrophic Respiration under Short-Term Warming in the Zoige Alpine Peatland. J. Environ. Manag. 2024, 370, 122778. [Google Scholar] [CrossRef] [PubMed]
- Shi, L.; Lin, Z.; Tang, S.; Peng, C.; Yao, Z.; Xiao, Q.; Zhou, H.; Liu, K.; Shao, X. Interactive Effects of Warming and Managements on Carbon Fluxes in Grasslands: A Global Meta-Analysis. Agric. Ecosyst. Environ. 2022, 340, 108178. [Google Scholar] [CrossRef]
- Wang, Y.; Zhu, Z.; Ma, Y.; Yuan, L. Carbon and Water Fluxes in an Alpine Steppe Ecosystem in the Nam Co Area of the Tibetan Plateau during Two Years with Contrasting Amounts of Precipitation. Int. J. Biometeorol. 2020, 64, 1183–1196. [Google Scholar] [CrossRef]
- Ganjurjav, H.; Hu, G.; Zhang, Y.; Gornish, E.S.; Yu, T.; Gao, Q. Warming Tends to Decrease Ecosystem Carbon and Water Use Efficiency in Dissimilar Ways in an Alpine Meadow and a Cultivated Grassland in the Tibetan Plateau. Agric. For. Meteorol. 2022, 323, 109079. [Google Scholar] [CrossRef]
- Fu, G.; Zhang, X.; Zhang, Y.; Shi, P.; Li, Y.; Zhou, Y.; Yang, P.; Shen, Z. Experimental Warming Does Not Enhance Gross Primary Production and Above-Ground Biomass in the Alpine Meadow of Tibet. J. Appl. Remote Sens. 2013, 7, 073505. [Google Scholar] [CrossRef]
- Gu, S.; Tang, Y.; Du, M.; Kato, T.; Li, Y.; Cui, X.; Zhao, X. Short-Term Variation of CO2 Flux in Relation to Environmental Controls in an Alpine Meadow on the Qinghai-Tibetan Plateau. J. Geophys. Res. Atmos. 2003, 108, 4670. [Google Scholar] [CrossRef]
- Wang, R.; Yang, J.; Liu, H.; Sardans, J.; Zhang, Y.; Wang, X.; Wei, C.; Lü, X.; Dijkstra, F.A.; Jiang, Y.; et al. Nitrogen Enrichment Buffers Phosphorus Limitation by Mobilizing Mineral-bound Soil Phosphorus in Grasslands. Ecology 2022, 103, e3616. [Google Scholar] [CrossRef]
- Yuan, F.; Han, X.; Ge, J.; Wu, J. Net primary productivity of Leymus chinensis steppe in Xilin River basin of Inner Mongolia and its responses to global climate change. Chin. J. Appl. Ecol. 2008, 19, 10. [Google Scholar]
- Goyal, R.K. Sensitivity of Evapotranspiration to Global Warming: A Case Study of Arid Zone of Rajasthan (India). Agric. Water Manag. 2004, 69, 1–11. [Google Scholar] [CrossRef]
- Lawrence, D.M.; Thornton, P.E.; Oleson, K.W.; Bonan, G.B. The Partitioning of Evapotranspiration into Transpiration, Soil Evaporation, and Canopy Evaporation in a GCM: Impacts on Land–Atmosphere Interaction. J. Hydrometeorol. 2007, 8, 862–880. [Google Scholar] [CrossRef]
- Vadez, V.; Pilloni, R.; Grondin, A.; Hajjarpoor, A.; Belhouchette, H.; Brouziyne, Y.; Chehbouni, G.; Kharrou, M.H.; Zitouna-Chebbi, R.; Mekki, I.; et al. Water Use Efficiency across Scales: From Genes to Landscapes. J. Exp. Bot. 2023, 74, 4770–4788. [Google Scholar] [CrossRef] [PubMed]
- Hatfield, J.L.; Dold, C. Water-Use Efficiency: Advances and Challenges in a Changing Climate. Front. Plant Sci. 2019, 10, 103. [Google Scholar] [CrossRef]
- Wang, Y.; Xiao, J.; Ma, Y.; Luo, Y.; Hu, Z.; Li, F.; Li, Y.; Gu, L.; Li, Z.; Yuan, L. Carbon Fluxes and Environmental Controls across Different Alpine Grassland Types on the Tibetan Plateau. Agric. For. Meteorol. 2021, 311, 108694. [Google Scholar] [CrossRef]
- Ji, Z.; Pei, T.; Chen, Y.; Wu, H.; Hou, Q.; Shi, F.; Xie, B.; Zhang, J. The Driving Factors of Grassland Water Use Efficiency along Degradation Gradients on the Qinghai-Tibet Plateau, China. Glob. Ecol. Conserv. 2022, 35, e02090. [Google Scholar] [CrossRef]
- Ma, N.; Zhang, Y. Contrasting Trends in Water Use Efficiency of the Alpine Grassland in Tibetan Plateau. J. Geophys. Res. Atmos. 2022, 127, e2022JD036919. [Google Scholar] [CrossRef]
- Quan, Q.; Zhang, F.; Tian, D.; Zhou, Q.; Wang, L.; Niu, S. Transpiration Dominates Ecosystem Water-Use Efficiency in Response to Warming in an Alpine Meadow. J. Geophys. Res. Biogeosci. 2018, 123, 453–462. [Google Scholar] [CrossRef]
- Yan, Z.; Kang, E.; Zhang, K.; Li, Y.; Hao, Y.; Wu, H.; Li, M.; Zhang, X.; Wang, J.; Yan, L.; et al. Plant and Soil Enzyme Activities Regulate CO2 Efflux in Alpine Peatlands After 5 Years of Simulated Extreme Drought. Front. Plant Sci. 2021, 12, 756956. [Google Scholar] [CrossRef]
- Yan, W.; Wang, Y.; Chaudhary, P.; Ju, P.; Zhu, Q.; Kang, X.; Chen, H.; He, Y. Effects of Climate Change and Human Activities on Net Primary Production of Wetlands on the Zoige Plateau from 1990 to 2015. Glob. Ecol. Conserv. 2022, 35, e02052. [Google Scholar] [CrossRef]
- R Core Team. R: A Language and Environment for Statistical Computing; R Foundation for Statistical Computing: Vienna, Austria, 2024. [Google Scholar]
- Lu, M.; Zhou, X.; Yang, Q.; Li, H.; Luo, Y.; Fang, C.; Chen, J.; Yang, X.; Li, B. Responses of Ecosystem Carbon Cycle to Experimental Warming: A Meta-analysis. Ecology 2013, 94, 726–738. [Google Scholar] [CrossRef] [PubMed]
- Yu, X.; Ye, S.; Olsson, L.; Wei, M.; Krauss, K.W.; Brix, H. A 3-Year In-Situ Measurement of CO2 Efflux in Coastal Wetlands: Understanding Carbon Loss through Ecosystem Respiration and Its Partitioning. Wetlands 2020, 40, 551–562. [Google Scholar] [CrossRef]
- Zhao, J.; Luo, T.; Wei, H.; Deng, Z.; Li, X.; Li, R.; Tang, Y. Increased Precipitation Offsets the Negative Effect of Warming on Plant Biomass and Ecosystem Respiration in a Tibetan Alpine Steppe. Agric. For. Meteorol. 2019, 279, 107761. [Google Scholar] [CrossRef]
- Wu, G.-L.; Cheng, Z.; Alatalo, J.M.; Zhao, J.; Liu, Y. Climate Warming Consistently Reduces Grassland Ecosystem Productivity. Earths Future 2021, 9, e2020EF001837. [Google Scholar] [CrossRef]
- Xu, M.; Zhang, T.; Zhang, Y.; Chen, N.; Zhu, J.; He, Y.; Zhao, T.; Yu, G. Drought Limits Alpine Meadow Productivity in Northern Tibet. Agric. For. Meteorol. 2021, 303, 108371. [Google Scholar] [CrossRef]
- Chen, J.; Luo, Y.; Xia, J.; Shi, Z.; Jiang, L.; Niu, S.; Zhou, X.; Cao, J. Differential Responses of Ecosystem Respiration Components to Experimental Warming in a Meadow Grassland on the Tibetan Plateau. Agric. For. Meteorol. 2016, 220, 21–29. [Google Scholar] [CrossRef]
- Lin, X.; Zhang, Z.; Wang, S.; Hu, Y.; Xu, G.; Luo, C.; Chang, X.; Duan, J.; Lin, Q.; Xu, B.; et al. Response of Ecosystem Respiration to Warming and Grazing during the Growing Seasons in the Alpine Meadow on the Tibetan Plateau. Agric. For. Meteorol. 2011, 151, 792–802. [Google Scholar] [CrossRef]
- Wang, Y.; Zhang, Y.; Yu, X.; Jia, G.; Liu, Z.; Sun, L.; Zheng, P.; Zhu, X. Grassland Soil Moisture Fluctuation and Its Relationship with Evapotranspiration. Ecol. Indic. 2021, 131, 108196. [Google Scholar] [CrossRef]
- Kirschbaum, M.U.F.; McMillan, A.M.S. Warming and Elevated CO2 Have Opposing Influences on Transpiration. Which Is More Important? Curr. For. Rep. 2018, 4, 51–71. [Google Scholar] [CrossRef]
- Zhang, T.; Xu, M.; Zhang, Y.; Zhao, T.; An, T.; Li, Y.; Sun, Y.; Chen, N.; Zhao, T.; Zhu, J.; et al. Grazing-Induced Increases in Soil Moisture Maintain Higher Productivity during Droughts in Alpine Meadows on the Tibetan Plateau. Agric. For. Meteorol. 2019, 269–270, 249–256. [Google Scholar] [CrossRef]
- Asargew, M.F.; Masutomi, Y.; Kobayashi, K.; Aono, M. Water Stress Changes the Relationship between Photosynthesis and Stomatal Conductance. Sci. Total Environ. 2024, 907, 167886. [Google Scholar] [CrossRef]
- Peng, F.; You, Q.; Xue, X.; Guo, J.; Wang, T. Evapotranspiration and Its Source Components Change under Experimental Warming in Alpine Meadow Ecosystem on the Qinghai-Tibet Plateau. Ecol. Eng. 2015, 84, 653–659. [Google Scholar] [CrossRef]
- Li, T.; Tian, D.; He, Y.; Zhang, R.; Wang, J.; Wang, F.; Niu, S. Threshold Response of Ecosystem Water Use Efficiency to Soil Water in an Alpine Meadow. Sci. Total Environ. 2024, 908, 168345. [Google Scholar] [CrossRef]
Disclaimer/Publisher’s Note: The statements, opinions and data contained in all publications are solely those of the individual author(s) and contributor(s) and not of MDPI and/or the editor(s). MDPI and/or the editor(s) disclaim responsibility for any injury to people or property resulting from any ideas, methods, instructions or products referred to in the content. |
© 2025 by the authors. Licensee MDPI, Basel, Switzerland. This article is an open access article distributed under the terms and conditions of the Creative Commons Attribution (CC BY) license (https://creativecommons.org/licenses/by/4.0/).