
Impact of Spatial Configuration of Bioretention Cells on Catchment Hydrological Performance Under Extreme Rainfall Conditions with Different Stormwater Flow Paths


Abstract
1. Introduction
2. Methods
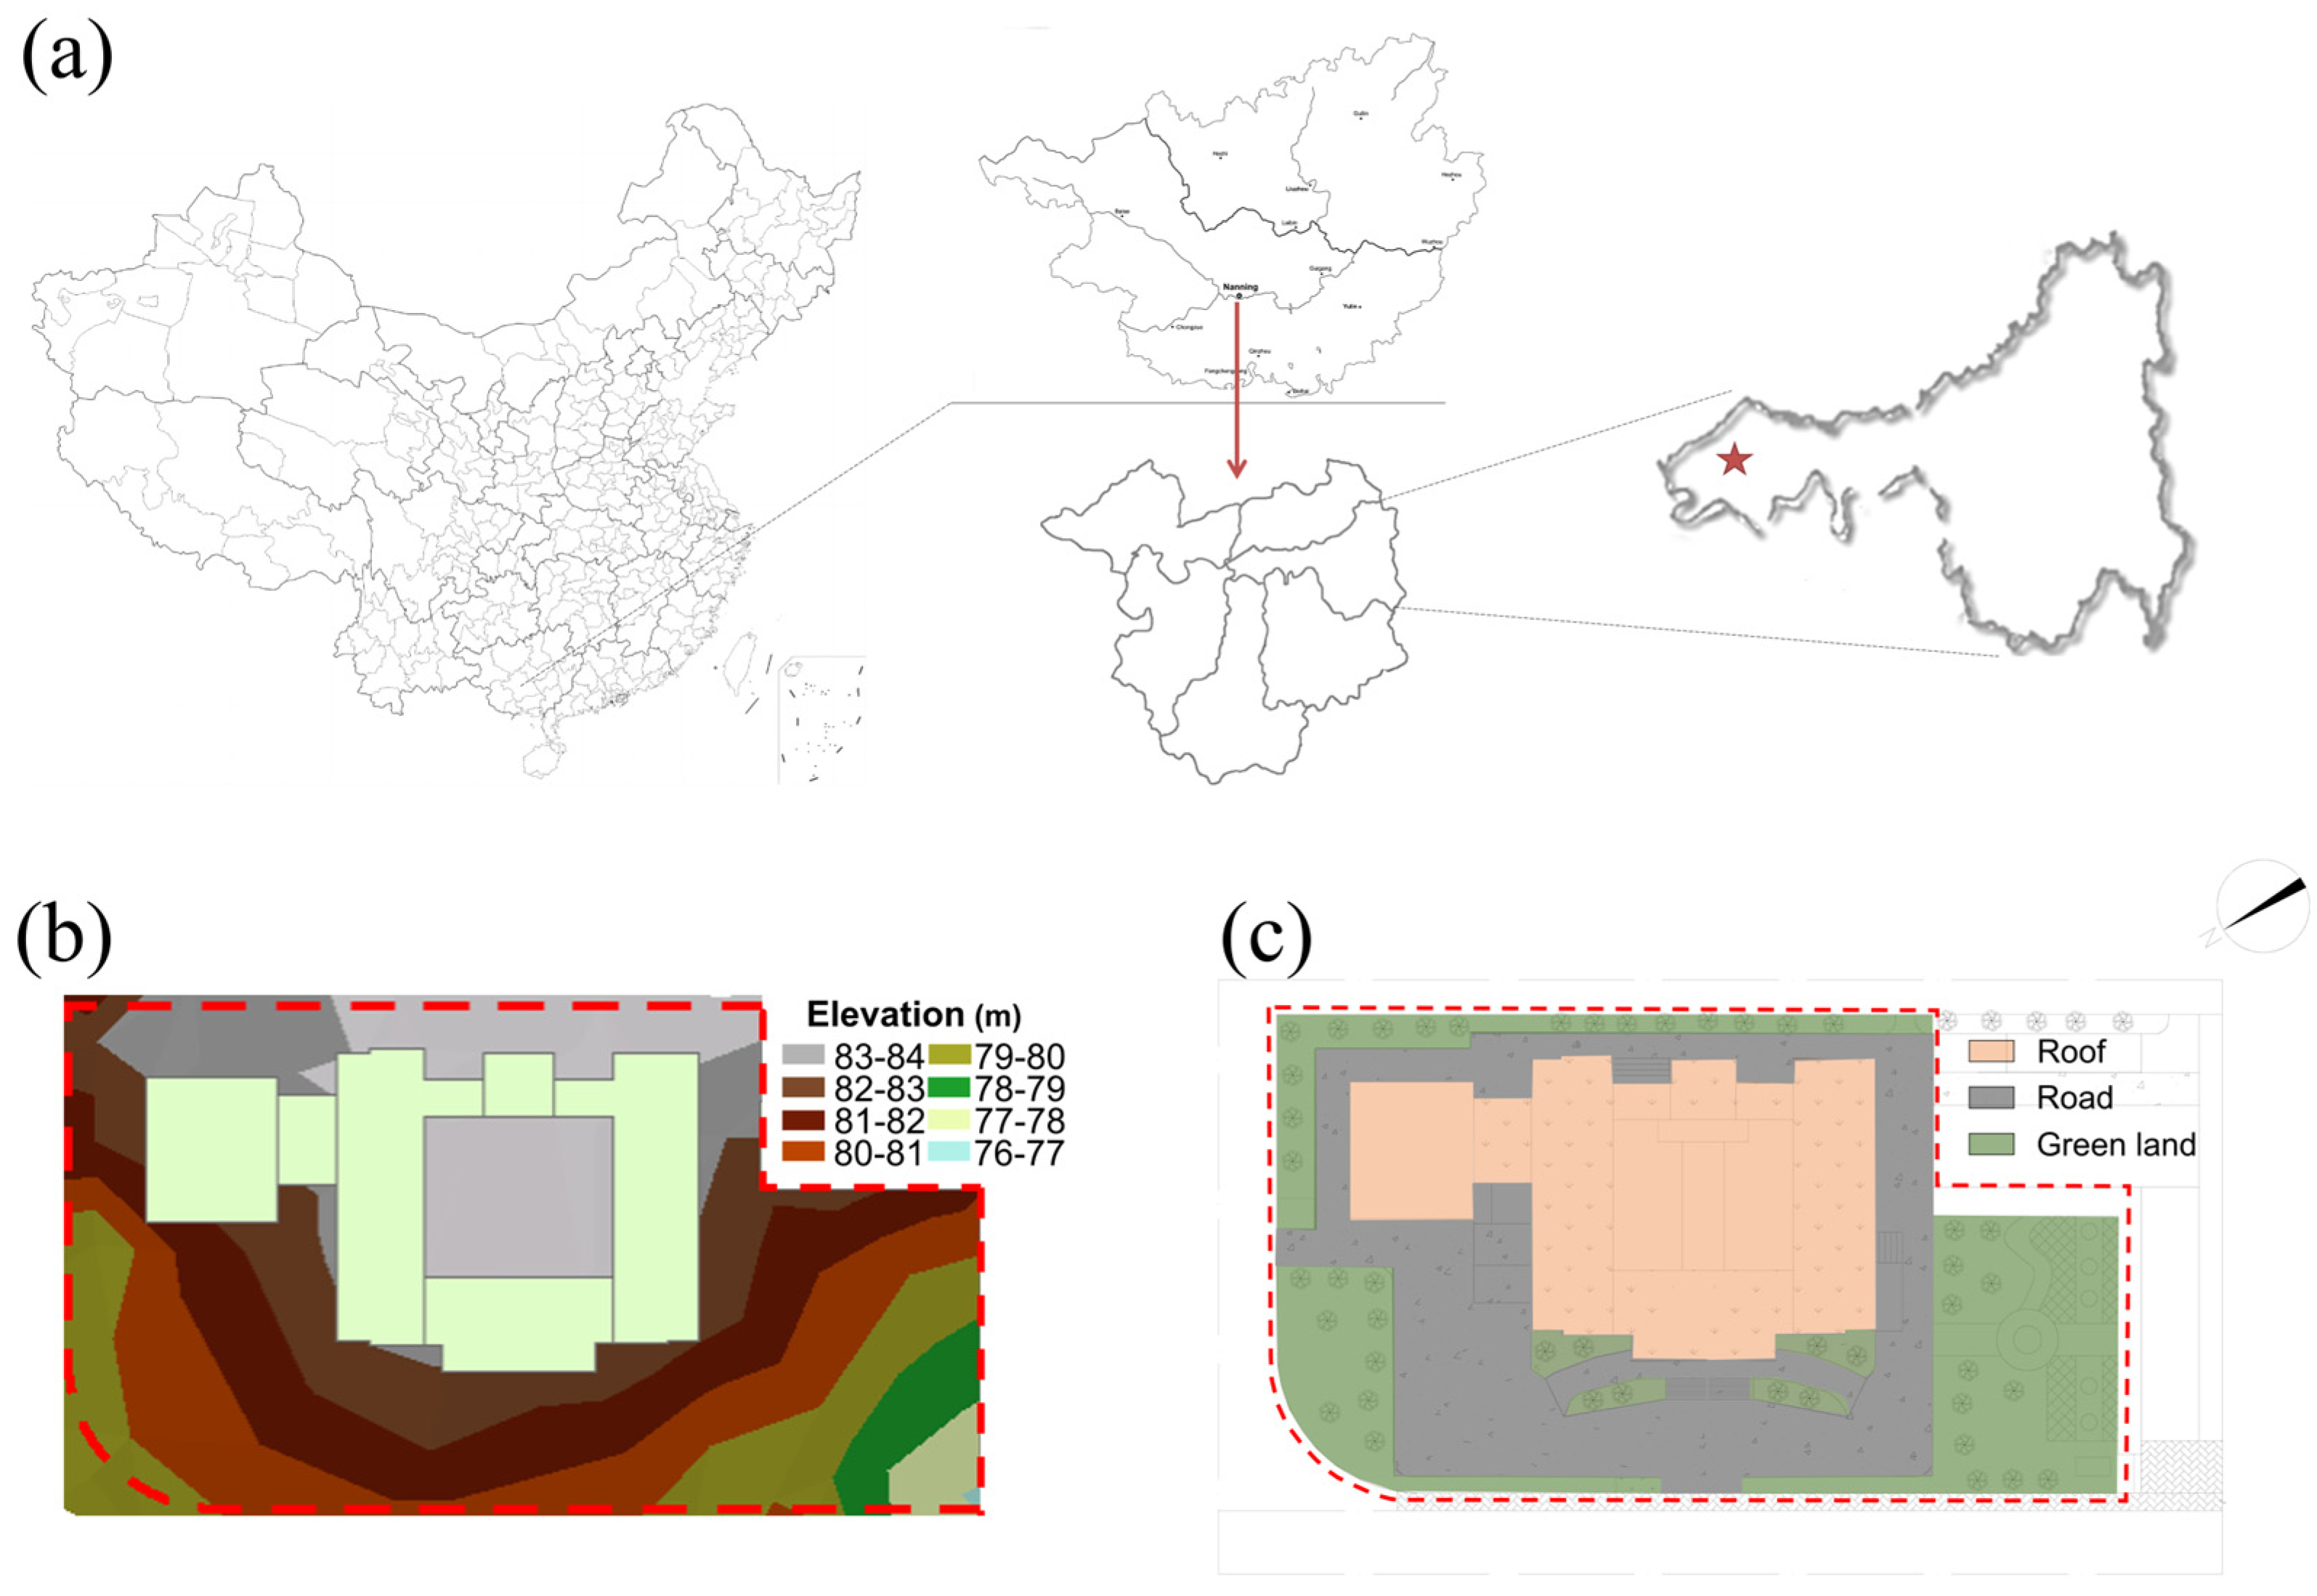
2.1. Study Area
2.2. Model Building
2.2.1. Models and Model Settings
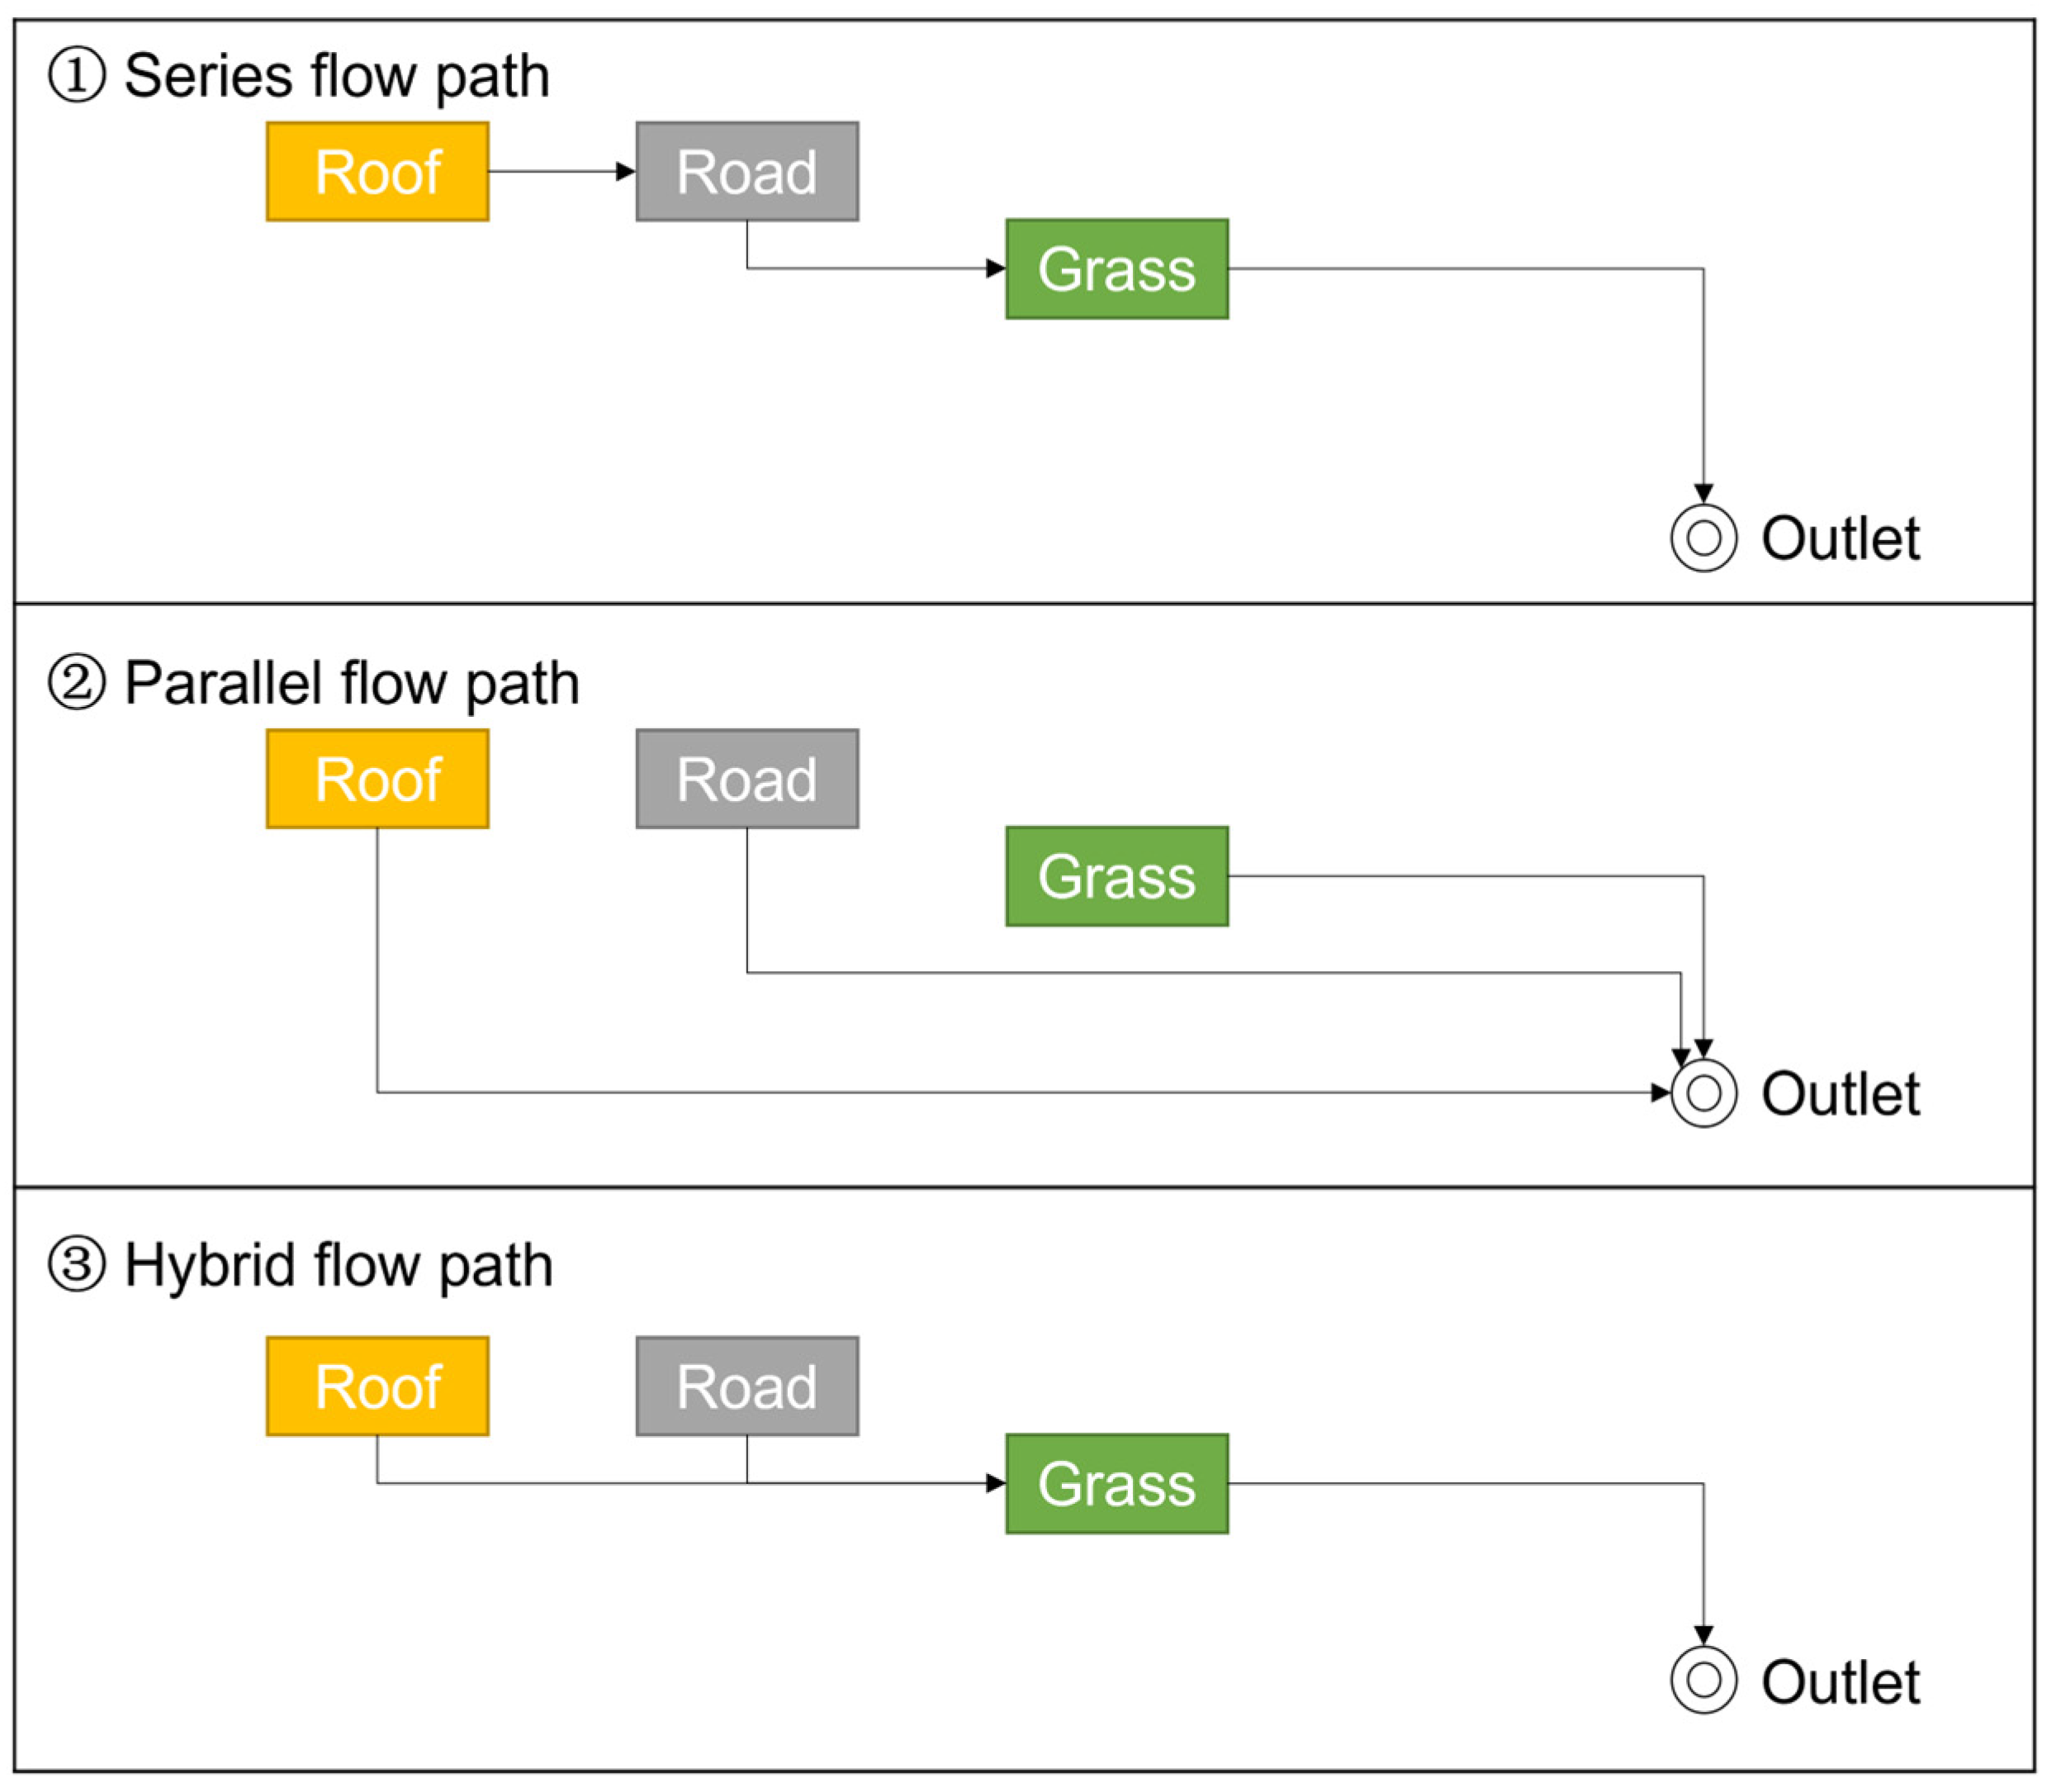
2.2.2. Scenario of Stormwater Flow Paths
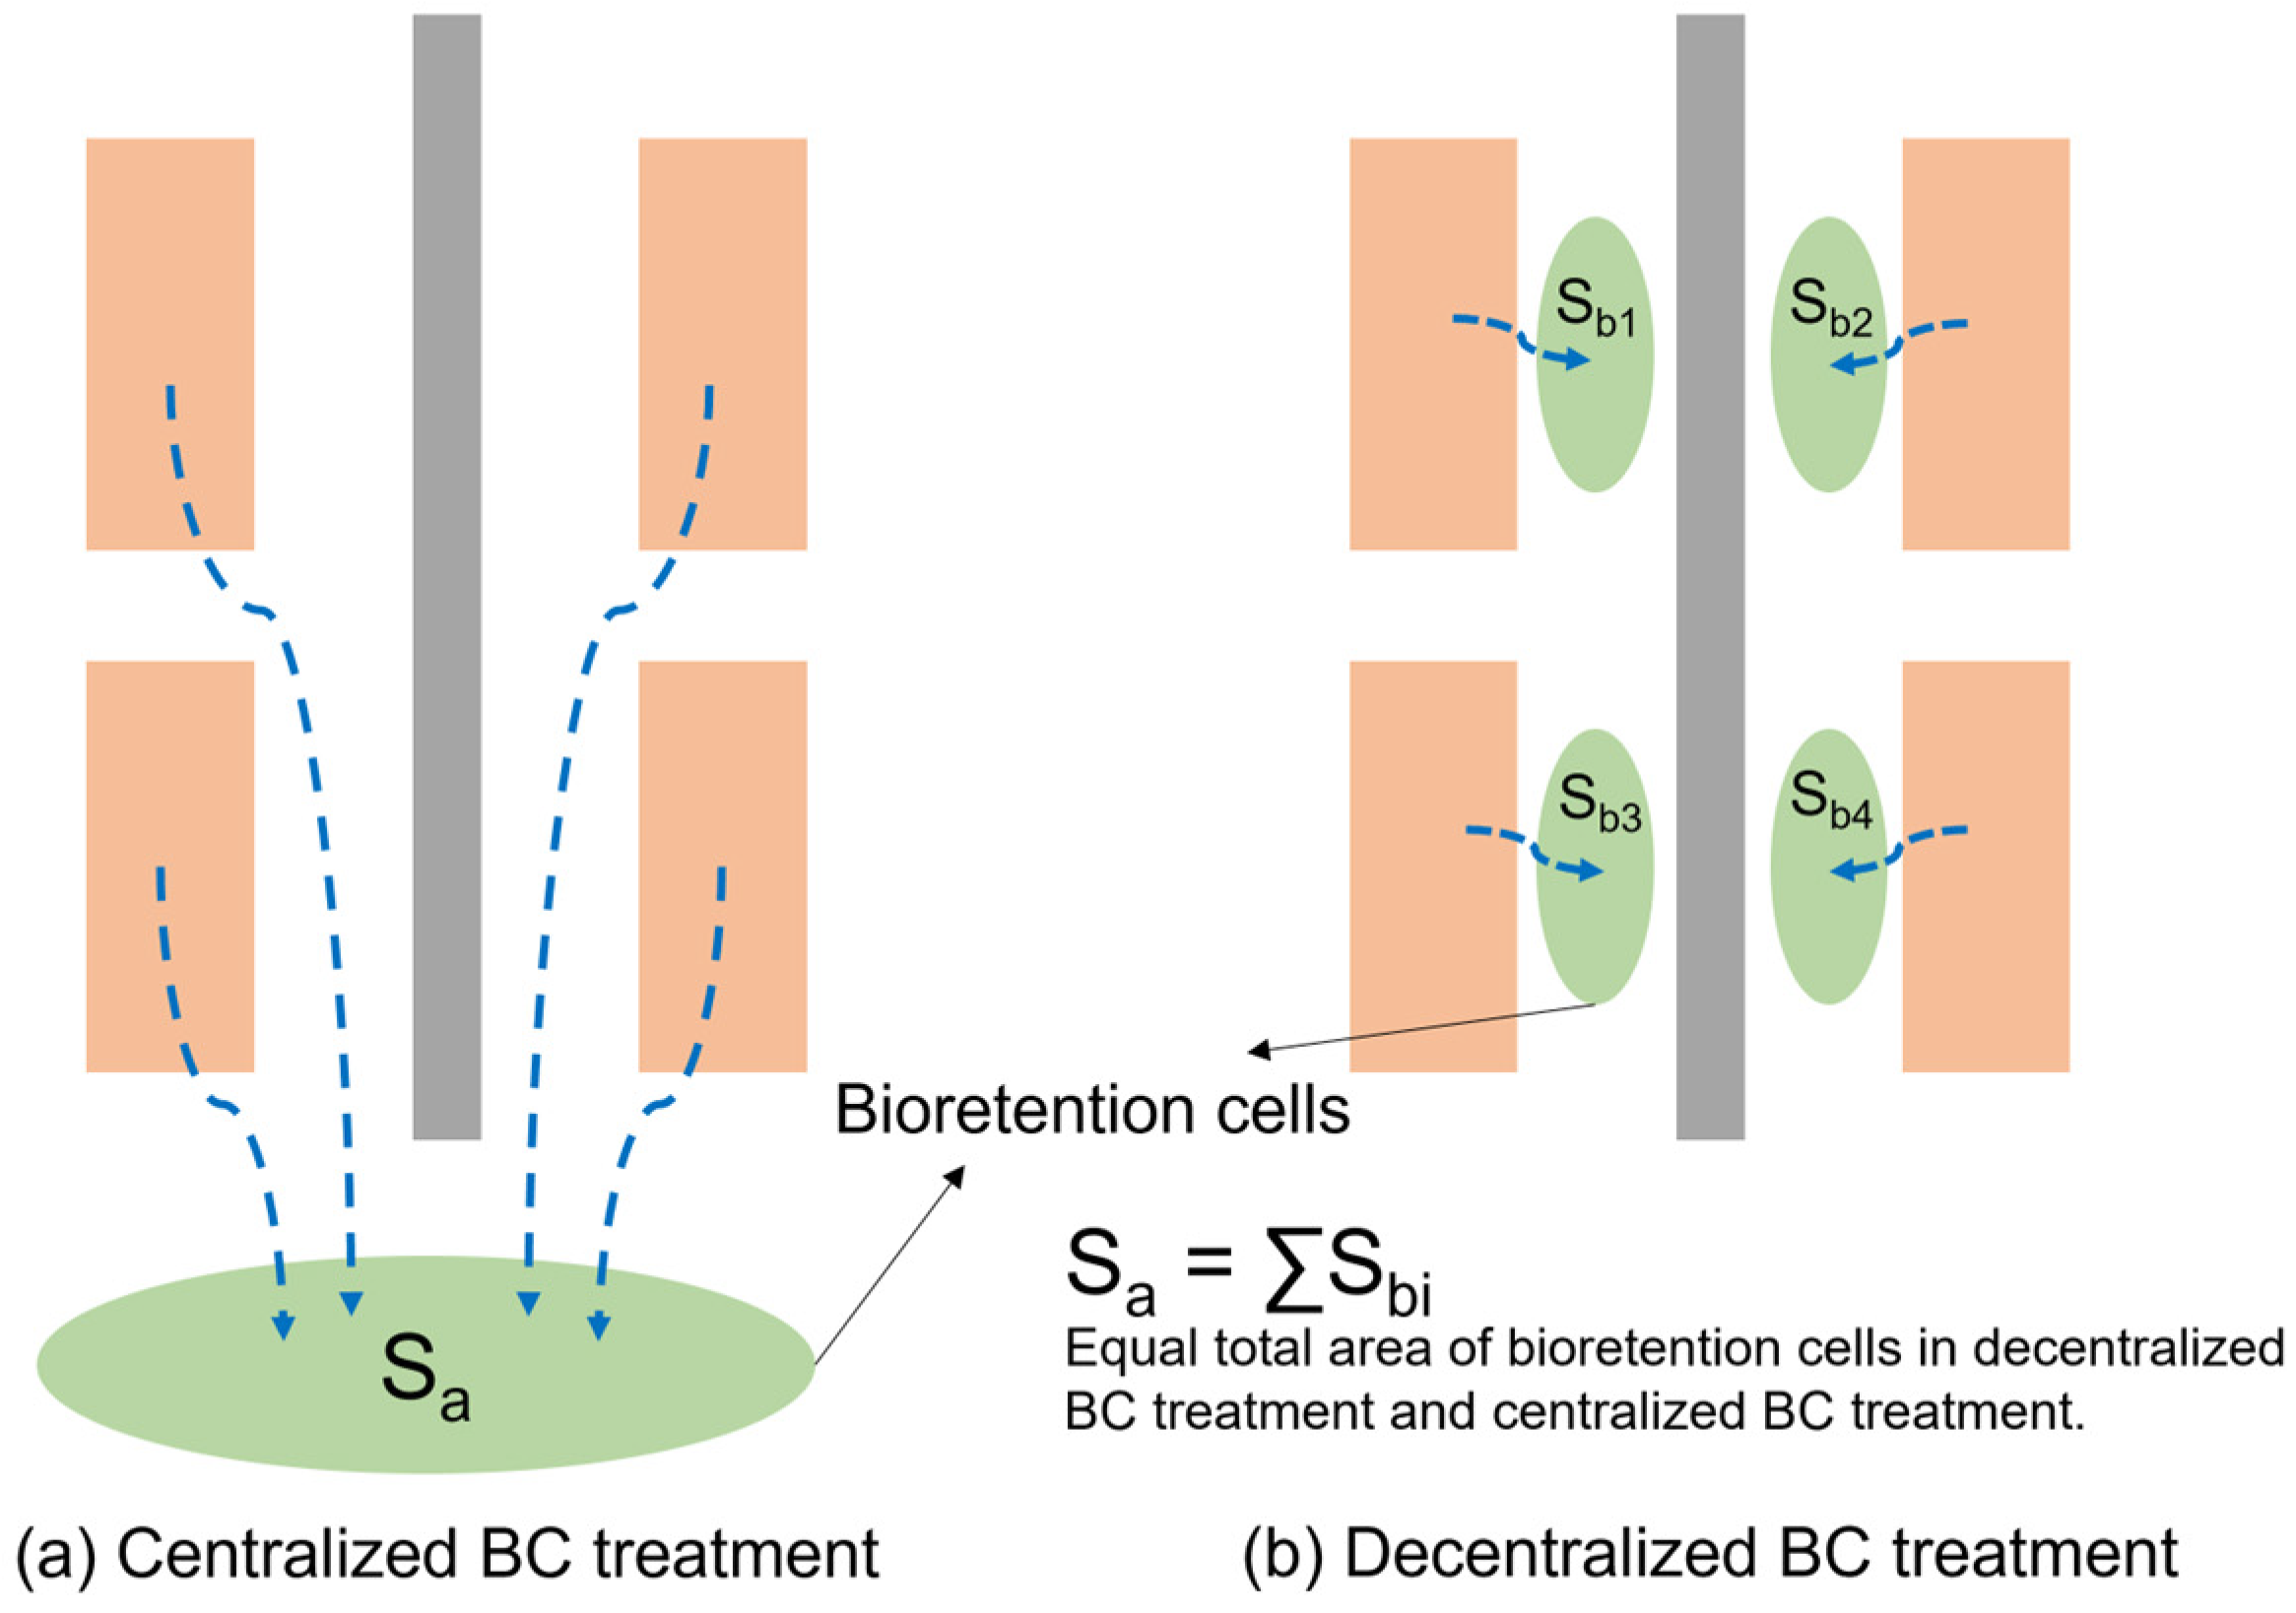
2.2.3. Bioretention Cell Design
2.3. Rainfall–Runoff Description
2.3.1. Rainfall Data
2.3.2. Runoff Descriptors
3. Results and Discussion
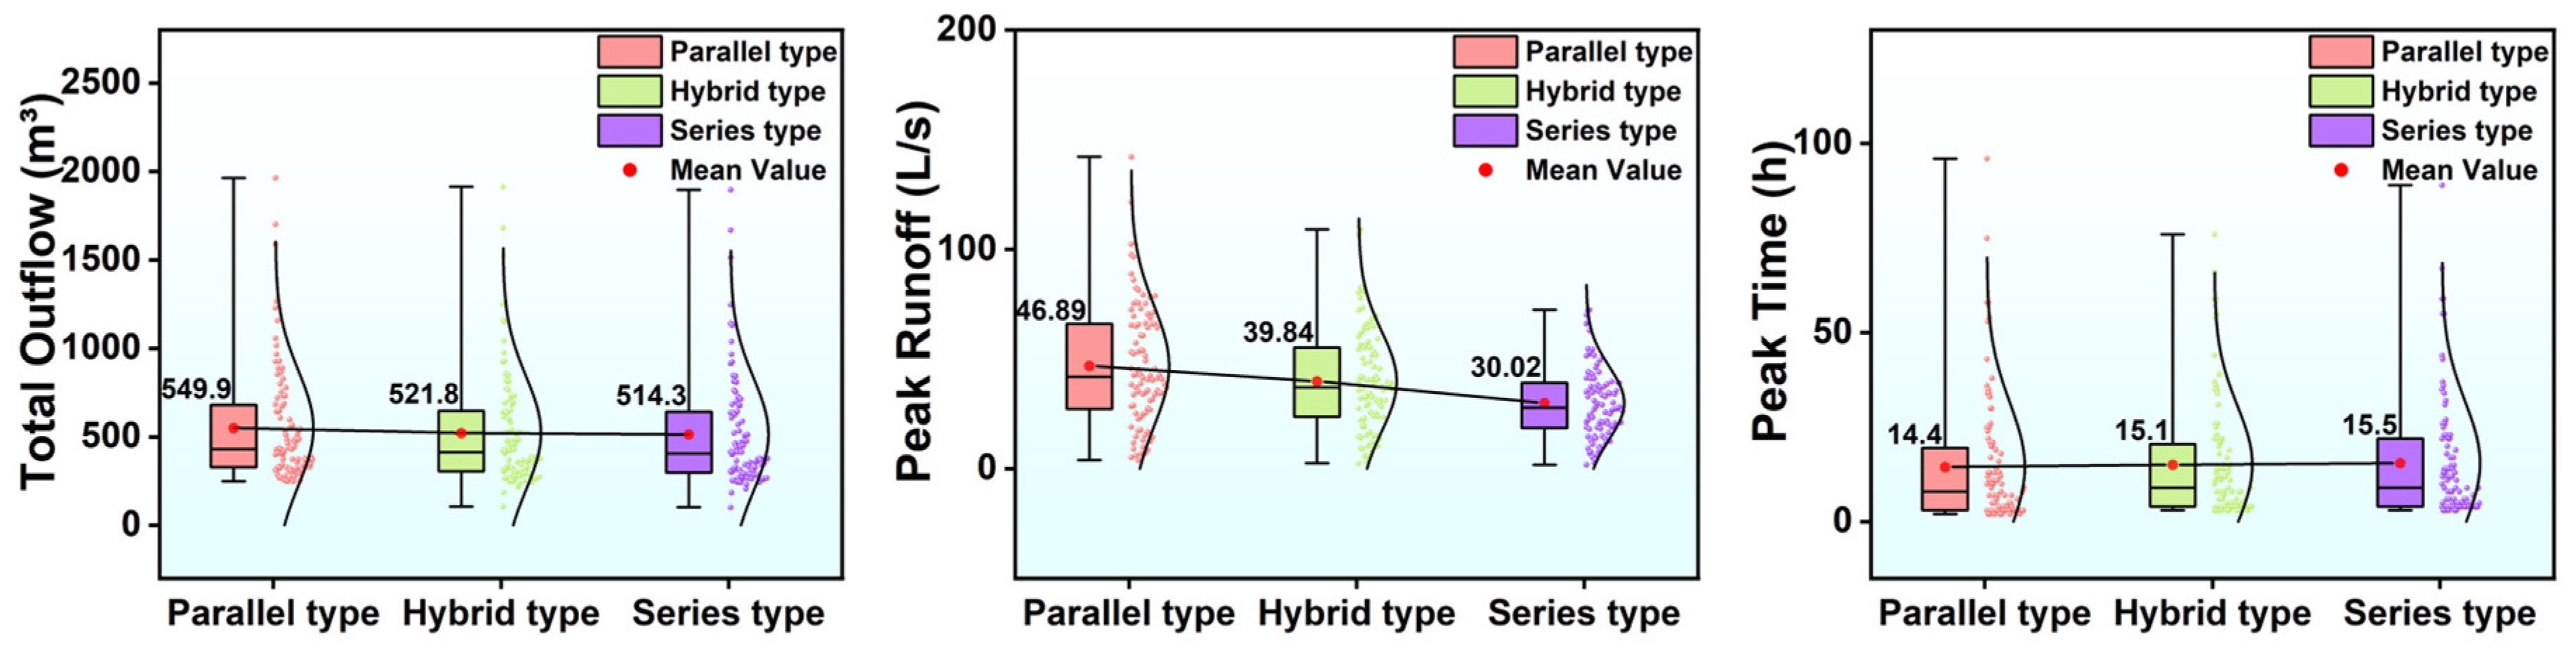
3.1. The Impact of Different Stormwater Flow Paths on Catchment Hydrology
3.2. The Impact of Spatial Configuration of BCs on Catchment Hydrology
3.2.1. The Impact of Centralized BCs on Catchment Hydrology
3.2.2. The Impact of Decentralized BCs on Catchment Hydrology
3.2.3. The Comparison of the Impact of Centralized and Decentralized BCs on Catchment Hydrology
4. Conclusions
Supplementary Materials
Author Contributions
Funding
Data Availability Statement
Acknowledgments
Conflicts of Interest
References
- Kronaveter, L.; Shamir, U.; Kessler, A. Water-Sensitive Urban Planning: Modeling On-Site Infiltration. J. Water Resour. Plan. Manag. 2001, 127, 78–88. [Google Scholar] [CrossRef]
- IPCC. AR6 Synthesis Report: Climate Change 2023. 2023. Available online: https://www.ipcc.ch/report/sixth-assessment-report-cycle/ (accessed on 19 September 2024).
- China Meteorological Administration. Blue Book of Climate Change in China (2024); China Meteorological Administration: Beijing, China, 2024.
- Jiang, Y.; Zevenbergen, C.; Ma, Y. Urban pluvial flooding and stormwater management: A contemporary review of China’s challenges and “sponge cities” strategy. Environ. Sci. Policy 2018, 80, 132–143. [Google Scholar] [CrossRef]
- Shi, P.-J.; Yuan, Y.; Zheng, J.; Wang, J.-A.; Ge, Y.; Qiu, G.-Y. The effect of land use/cover change on surface runoff in Shenzhen region, China. CATENA 2007, 69, 31–35. [Google Scholar] [CrossRef]
- Liu, K.; Hou, L. Wuhan Merges 2 Lakes to Help Fight Flooding. Available online: http://www.chinadaily.com.cn/china/2016-07/15/content_26096857.htm (accessed on 25 July 2024).
- Liu, Y.; Jiang, H.; Fu, Y. Record Breaking Heavy Rain Invades, Nanning is Flooded for 14 Hours. Available online: https://new.qq.com/rain/a/20240521A073BS00 (accessed on 25 July 2024).
- Eggert, A.L.; Löwe, R.; Arnbjerg-Nielsen, K. Identifying barriers and potentials of integrated assessments of sustainable urban development and adaptation to rising sea levels. Ecol. Indic. 2023, 148, 110078. [Google Scholar] [CrossRef]
- Suresh, A.; Pekkat, S.; Subbiah, S. Quantifying the efficacy of Low Impact Developments (LIDs) for flood reduction in micro-urban watersheds incorporating climate change. Sustain. Cities Soc. 2023, 95, 104601. [Google Scholar] [CrossRef]
- Yin, D.; Zhang, X.; Cheng, Y.; Jia, H.; Jia, Q.; Yang, Y. Can flood resilience of green-grey-blue system cope with future uncertainty? Water Res. 2023, 242, 120315. [Google Scholar] [CrossRef]
- Zhao, L.; Li, J.; Zhang, T.; Feng, P.; Wang, X.; Shen, J. Multi-method combined analysis of urban flood risks and its influencing factors under low impact development. J. Hydrol. 2024, 632, 130927. [Google Scholar] [CrossRef]
- Chaves, M.T.R.; Farias, T.R.L.; Eloi, W.M. Comparative analysis of bioretention design strategies for urban runoff infiltration: A critical overview. Ecol. Eng. 2024, 207, 107352. [Google Scholar] [CrossRef]
- Abebe, Y.; Tesfamariam, S. Chapter Three—Climate Change Impact and Adaptation for Urban Drainage Systems. In Climate Adaptation Engineering; Bastidas-Arteaga, E., Stewar, M.G., Eds.; Butterworth-Heinemann: Portsmouth, UK, 2019; pp. 73–98. [Google Scholar]
- Zhou, S.; Diao, H.; Wang, J.; Jia, W.; Xu, H.; Xu, X.; Wang, M.; Sun, C.; Qiao, R.; Wu, Z. Multi-stage optimization framework for synergetic grey-green infrastructure in response to long-term climate variability based on shared socio-economic pathways. Water Res. 2025, 274, 123091. [Google Scholar] [CrossRef] [PubMed]
- Wang, M.; Liu, M.; Zhang, D.; Qi, J.; Fu, W.; Zhang, Y.; Rao, Q.; Bakhshipour, A.E.; Tan, S.K. Assessing and optimizing the hydrological performance of Grey-Green infrastructure systems in response to climate change and non-stationary time series. Water Res. 2023, 232, 119720. [Google Scholar] [CrossRef]
- Huang, C.-L.; Hsu, N.-S.; Liu, H.-J.; Huang, Y.-H. Optimization of low impact development layout designs for megacity flood mitigation. J. Hydrol. 2018, 564, 542–558. [Google Scholar] [CrossRef]
- Dudrick, R.; Hoffman, M.; Antoine, J.; Austin, K.; Bedoya, L.; Clark, S.; Dean, H.; Medina, A.; Gotsch, S.G. Do plants matter?: Determining what drives variation in urban rain garden performance. Ecol. Eng. 2024, 201, 107208. [Google Scholar] [CrossRef]
- Greksa, A.; Grabić, J.; Blagojević, B. Contribution of low impact development practices-bioretention systems towards urban flood resilience: Case study of Novi Sad, Serbia. Environ. Eng. Res. 2022, 27, 210120–210125. [Google Scholar] [CrossRef]
- Weathers, M.; Hathaway, J.M.; Tirpak, R.A.; Khojandi, A. Evaluating the impact of climate change on future bioretention performance across the contiguous United States. J. Hydrol. 2023, 616, 128771. [Google Scholar] [CrossRef]
- Winston, R.J.; Dorsey, J.D.; Hunt, W.F. Quantifying volume reduction and peak flow mitigation for three bioretention cells in clay soils in northeast Ohio. Sci. Total Environ. 2016, 553, 83–95. [Google Scholar] [CrossRef] [PubMed]
- Autixier, L.; Mailhot, A.; Bolduc, S.; Madoux-Humery, A.-S.; Galarneau, M.; Prévost, M.; Dorner, S. Evaluating rain gardens as a method to reduce the impact of sewer overflows in sources of drinking water. Sci. Total Environ. 2014, 499, 238–247. [Google Scholar] [CrossRef] [PubMed]
- Kumar, S.; Singh, K.K. Hydrological performance of rain gardens having Calendula officinalis plant with varied planting mixtures. Water Sci. Technol. 2023, 87, 1316–1326. [Google Scholar] [CrossRef] [PubMed]
- Zhang, B.; Li, J.; Li, Y. Simulation and optimization of rain gardens via DRAINMOD model and response surface methodology. Ecohydrol. Hydrobiol. 2020, 20, 413–423. [Google Scholar] [CrossRef]
- Wang, M.; Zhang, D.Q.; Su, J.; Dong, J.W.; Tan, S.K. Assessing hydrological effects and performance of low impact development practices based on future scenarios modeling. J. Clean. Prod. 2018, 179, 12–23. [Google Scholar] [CrossRef]
- Zhang, L.; Lu, Q.; Ding, Y.; Wu, J. A procedure to design road bioretention soil media based on runoff reduction and pollutant removal performance. J. Clean. Prod. 2021, 287, 125524. [Google Scholar] [CrossRef]
- Le Floch, N.; Pons, V.; Hassan Abdalla, E.M.; Alfredsen, K. Catchment scale effects of low impact development implementation scenarios at different urbanization densities. J. Hydrol. 2022, 612, 128178. [Google Scholar] [CrossRef]
- Yao, L.; Wu, Z.; Wang, Y.; Sun, S.; Wei, W.; Xu, Y. Does the spatial location of green roofs affects runoff mitigation in small urbanized catchments? J. Environ. Manag. 2020, 268, 110707. [Google Scholar] [CrossRef] [PubMed]
- Mao, X.; Jia, H.; Yu, S.L. Assessing the ecological benefits of aggregate LID-BMPs through modelling. Ecol. Model. 2017, 353, 139–149. [Google Scholar] [CrossRef]
- Rossman, L.A. Storm Water Management Model; version 5.2; United States Environmental Protection Agency: Washington, DC, USA, 2015.
- Ebrahimian, A.; Sokolovskaya, N.; Wadzuk, B. Modeling dynamic performance of urban infiltration trench systems: Methodology and a case study in Philadelphia. J. Hydrol. 2021, 594, 125938. [Google Scholar] [CrossRef]
- Giacomoni, M.H.; Joseph, J. Multi-Objective Evolutionary Optimization and Monte Carlo Simulation for Placement of Low Impact Development in the Catchment Scale. J. Water Resour. Plan. Manag. 2017, 143, 04017053. [Google Scholar] [CrossRef]
- Liang, C.; Zhang, X.; Xia, J.; Xu, J.; She, D. The Effect of Sponge City Construction for Reducing Directly Connected Impervious Areas on Hydrological Responses at the Urban Catchment Scale. Water 2020, 12, 1163. [Google Scholar] [CrossRef]
- Jia, L. Study on the Configuration Optimization and Carbon Emission Reduction of Low Impact Development in Sponge City. Master’s Thesis, Tianjin University, Tianjin, China, 2017. [Google Scholar]
- DB32/T 4046-2021; Technical Guidelines for Reconstruction of Macrophyte-Dominated Ecosystem in Urban Lake. Jiangsu Adminstration of Market Regulation: Nanjing, China, 2021.
- Zha, X.; Fang, W.; Zhu, W.; Wang, S.; Mu, Y.; Wang, X.; Luo, P.; Zainol, M.R.R.M.A.; Zawawi, M.H.; Chong, K.L.; et al. Optimizing the deployment of LID facilities on a campus-scale and assessing the benefits of comprehensive control in Sponge City. J. Hydrol. 2024, 635, 131189. [Google Scholar] [CrossRef]
- Zhai, X.; Guo, L.; Liu, R.; Zhang, Y. Rainfall threshold determination for flash flood warning in mountainous catchments with consideration of antecedent soil moisture and rainfall pattern. Nat. Hazards J. Int. Soc. Prev. Mitig. Nat. Hazards 2018, 94, 605–625. [Google Scholar] [CrossRef]
- Mu, D.; Luo, P.; Lyu, J.; Zhou, M.; Huo, A.; Duan, W.; Nover, D.; He, B.; Zhao, X. Impact of temporal rainfall patterns on flash floods in Hue City, Vietnam. J. Flood Risk Manag. 2021, 14, e12668. [Google Scholar] [CrossRef]
- Technical Guidelines for Sponge City Construction—Construction of Low Impact Development Rainwater Systems (Trial); Ministry of Housing and Urban-Rural Development: Beijing, China, 2014.
- Zhou, F.; Xu, Y.; Chen, Y.; Xu, C.Y.; Gao, Y.; Du, J. Hydrological response to urbanization at different spatio-temporal scales simulated by coupling of CLUE-S and the SWAT model in the Yangtze River Delta region. J. Hydrol. 2013, 485, 113–125. [Google Scholar] [CrossRef]
- Yang, W.; Zhang, J.; Krebs, P. Low impact development practices mitigate urban flooding and non-point pollution under climate change. J. Clean. Prod. 2022, 347, 131320. [Google Scholar] [CrossRef]


| Layer | Parameter | Determination Method | Value |
|---|---|---|---|
| Surface | Berm height (mm) | Design drawing | 150 |
| Vegetation volume fraction | Parameter calibration | 0.2 | |
| Surface roughness | Parameter calibration | 0.19 | |
| Surface slope (%) | Measurement | 0.2 | |
| Soil | Thickness (mm) | Design drawing | 500 |
| Porosity | Design drawing | 0.5 | |
| Field capacity | Parameter calibration | 0.2 | |
| Wilting point | Measurement | 0.1 | |
| Conductivity (mm/h) | Measurement | 18 | |
| Conductivity slope | Measurement | 8 | |
| Suction head (mm) | Measurement | 80 | |
| Storage | Thickness (mm) | Design drawing | 300 |
| Void ratio (voids/solids) | Parameter calibration | 0.75 | |
| Seepage rate (mm/h) | Measurement | 9.036 | |
| Clogging factor | Not considered | 0 | |
| Drain | Flow coefficient | Design drawing | 2.36 |
| Flow exponent | Design drawing | 0.5 | |
| Offset height (mm) | Design drawing | 60 |
| Rainfall (mm) | Rainfall Events (Times) | Percentage of Rainfall Events (%) | Total Rainfall (mm) | Percentage of Total Rainfall (%) |
|---|---|---|---|---|
| ≤40.4 | 1586 | 94.4 | 9462.0 | 54.2 |
| 40.4~54.4 | 31 | 1.8 | 1461.9 | 8.4 |
| 54.4~66.5 | 19 | 1.1 | 1189.8 | 6.9 |
| ≥66.5 | 46 | 2.7 | 5297.6 | 30.5 |
| Grand total | 1682 | 100 | 17,381.3 | 100 |
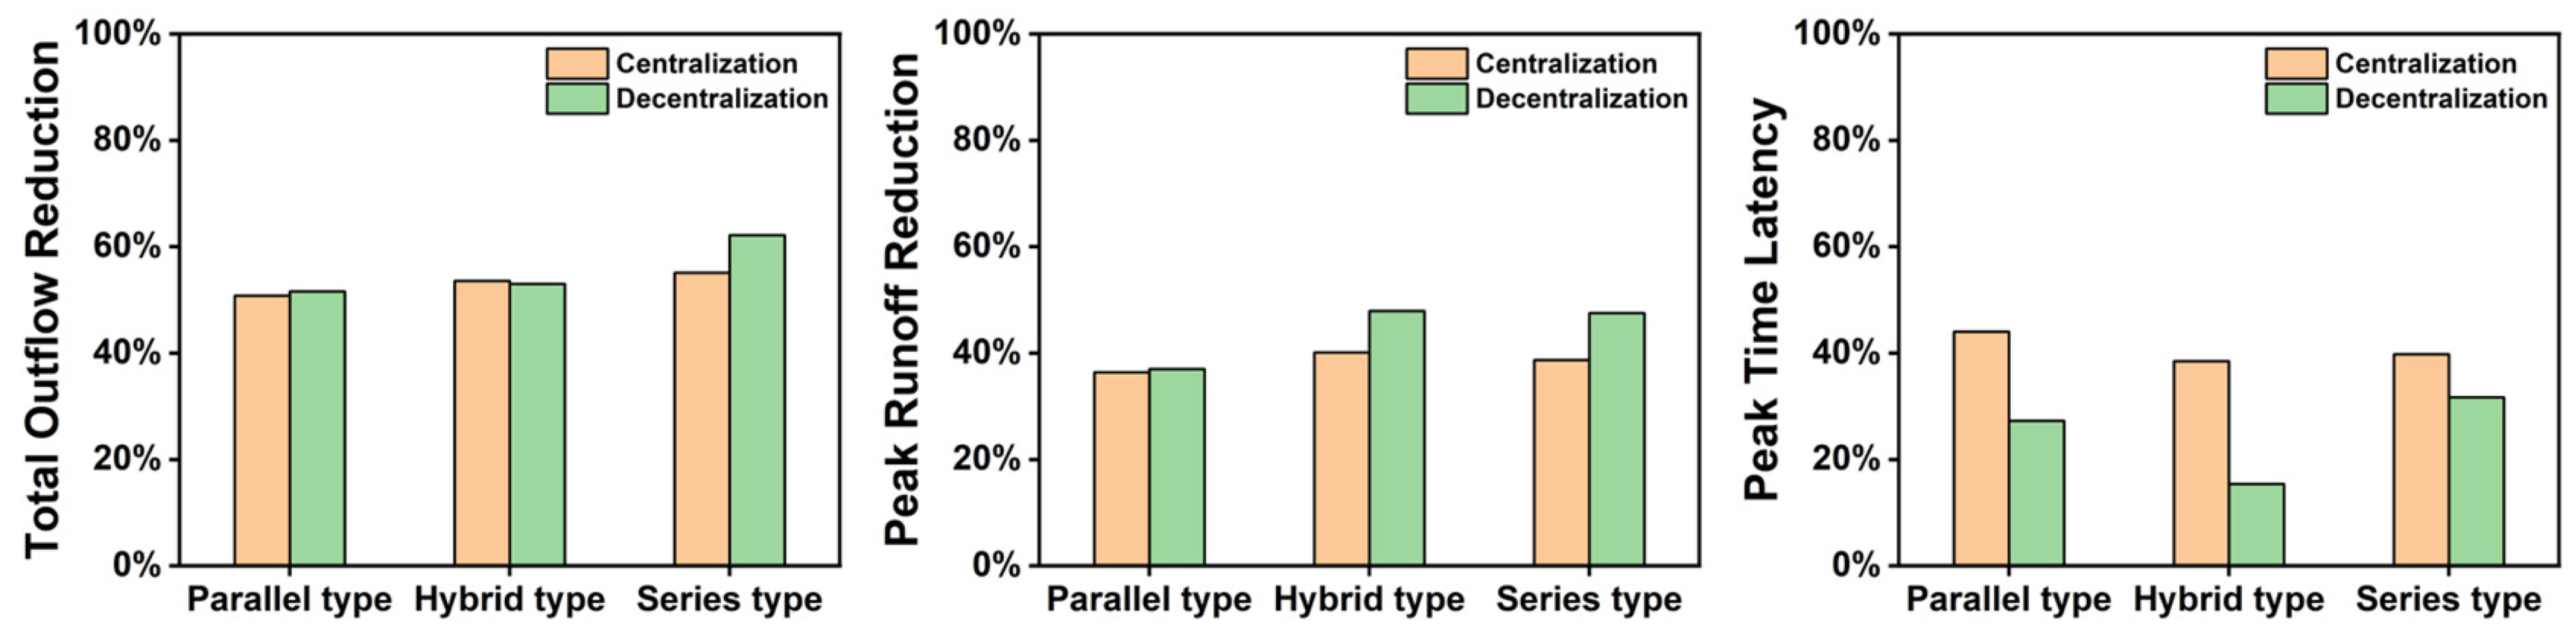
| Runoff Descriptor | Flow Path | No Centralized BC Scenario | Centralized BC Scenario | Reduction/Latency Rate |
|---|---|---|---|---|
| Total outflow (m3) | Parallel type | 549.9 | 270.6 | 50.8% |
| Hybrid type | 521.8 | 242.1 | 53.6% | |
| Series type | 514.3 | 230.9 | 55.1% | |
| Peak runoff (L/s) | Parallel type | 46.89 | 29.82 | 36.4% |
| Hybrid type | 39.84 | 23.86 | 40.1% | |
| Series type | 30.02 | 18.40 | 38.7% | |
| Peak time (h) | Parallel type | 14.4 | 20.7 | 44.0% |
| Hybrid type | 15.1 | 20.9 | 38.5% | |
| Series type | 15.5 | 21.7 | 39.8% |
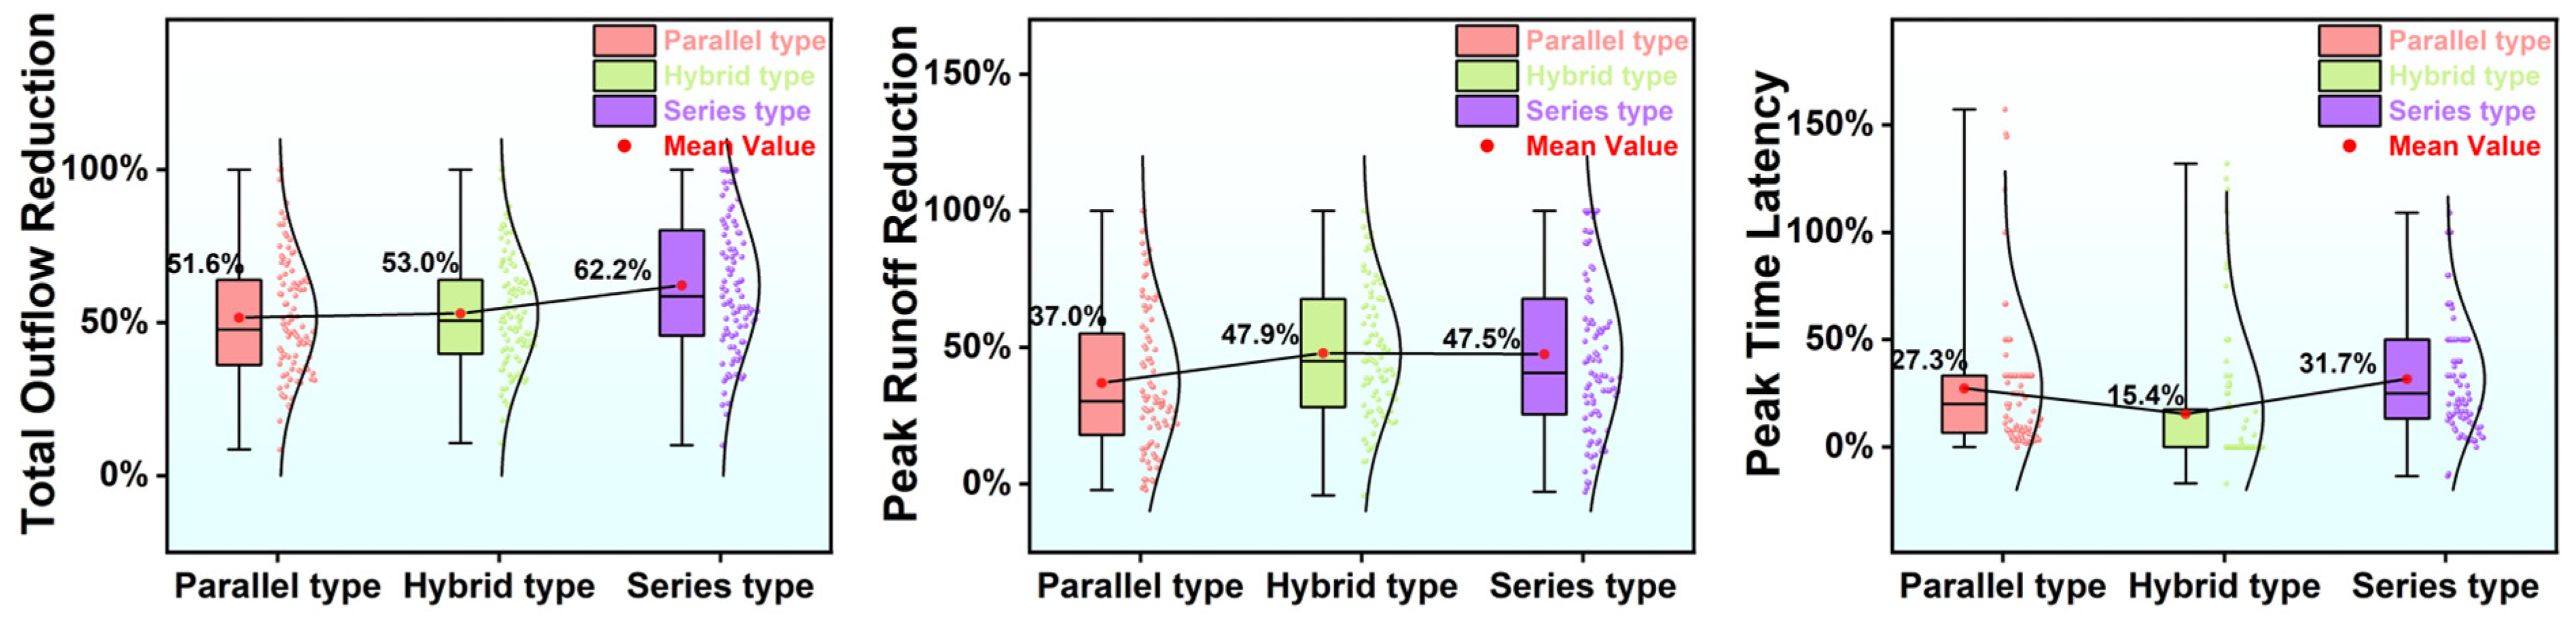
| Runoff Descriptor | Flow Path | No Decentralized BC Scenario | Decentralized BC Scenario | Reduction/Latency Rate |
|---|---|---|---|---|
| Total outflow (m3) | Parallel type | 549.9 | 266.2 | 51.6% |
| Hybrid type | 521.8 | 245.2 | 53.0% | |
| Series type | 514.3 | 194.4 | 62.2% | |
| Peak runoff (L/s) | Parallel type | 46.89 | 29.54 | 37.0% |
| Hybrid type | 39.84 | 20.76 | 47.9% | |
| Series type | 30.02 | 15.76 | 47.5% | |
| Peak time (h) | Parallel type | 14.4 | 18.3 | 27.3% |
| Hybrid type | 15.1 | 17.4 | 15.4% | |
| Series type | 15.5 | 20.4 | 31.7% |
Disclaimer/Publisher’s Note: The statements, opinions and data contained in all publications are solely those of the individual author(s) and contributor(s) and not of MDPI and/or the editor(s). MDPI and/or the editor(s) disclaim responsibility for any injury to people or property resulting from any ideas, methods, instructions or products referred to in the content. |
© 2025 by the authors. Licensee MDPI, Basel, Switzerland. This article is an open access article distributed under the terms and conditions of the Creative Commons Attribution (CC BY) license (https://creativecommons.org/licenses/by/4.0/).
Share and Cite
Liu, X.; Huang, J.; Zheng, S.; Wang, L.; Huang, Y.; Yu, Z. Impact of Spatial Configuration of Bioretention Cells on Catchment Hydrological Performance Under Extreme Rainfall Conditions with Different Stormwater Flow Paths. Water 2025, 17, 233. https://doi.org/10.3390/w17020233
Liu X, Huang J, Zheng S, Wang L, Huang Y, Yu Z. Impact of Spatial Configuration of Bioretention Cells on Catchment Hydrological Performance Under Extreme Rainfall Conditions with Different Stormwater Flow Paths. Water. 2025; 17(2):233. https://doi.org/10.3390/w17020233
Chicago/Turabian StyleLiu, Xu, Jun Huang, Sicheng Zheng, Li Wang, Yimin Huang, and Zebin Yu. 2025. "Impact of Spatial Configuration of Bioretention Cells on Catchment Hydrological Performance Under Extreme Rainfall Conditions with Different Stormwater Flow Paths" Water 17, no. 2: 233. https://doi.org/10.3390/w17020233
APA StyleLiu, X., Huang, J., Zheng, S., Wang, L., Huang, Y., & Yu, Z. (2025). Impact of Spatial Configuration of Bioretention Cells on Catchment Hydrological Performance Under Extreme Rainfall Conditions with Different Stormwater Flow Paths. Water, 17(2), 233. https://doi.org/10.3390/w17020233