Abstract
Internal phosphorus (P) loading is a key driver of waterbody eutrophication. Various sediment P indexes are developed to assess sediment P risks by linking them to water column P, but their seasonal reliability remains underexplored. This study evaluated, for the first time, sediment P status in the Xiashan reservoir, a large shallow reservoir in northern China serving 9.4 million people. The ability of three P indexes, including exchangeable P (Ex-P), Olsen P (Olsen-P), and diluted HCl-extractable P (HCl-P), to predict water column P concentrations was tested across February, May, and August. Sediments in the Xiashan reservoir exhibited moderate total P levels (531–650 mg kg−1) but high P availability, with Ex-P, Olsen-P, and HCl-P in ranges of 19–35, 58–101, and 327–444 mg kg−1, respectively, likely due to sandy composition. Water column P concentrations significantly correlate with August sediment P indexes (r = 0.42–0.81) but not with February and May sediments, highlighting the ability of August sediment P indexes to predict water column P across seasons. Sampling in August is recommended to efficiently identify critical zones for internal P loading, with Ex-P as the preferred indicator given its simple extraction and strong correlation with water column P (r = 0.81).
1. Introduction
Eutrophication of freshwater lakes and reservoirs is a worldwide concern because eutrophication can cause harmful algae blooms that threaten drinking water supplies, food security, and recreational uses [1,2,3,4]. Phosphorus (P), along with nitrogen (N), is recognized as the key nutrient driving eutrophication in freshwater ecosystems [5,6]. To mitigate eutrophication, management efforts have focused on reducing external P loading from urban point sources and agricultural diffuse sources into waterbodies [7,8]. While some of these efforts are effective in controlling eutrophication, in many cases, eutrophication persists for decades after external P inputs have been reduced, highlighting the significant contribution of internal P loading from sediments [9,10,11,12,13,14].
Various methods have been developed to assess internal P loading, including in situ flux measurements, intact sediment core incubation, mass balance methods, and approaches based on Fick’s law [15,16,17]. In situ flux measurements, which use flux chambers to minimize sediment and water disturbance, are expensive and it is challenging to maintain consistent environmental conditions inside and outside the chamber [18]. Intact sediment core incubations, which simulate in situ conditions in controlled laboratory settings, are limited by the number of sampling sites and cannot be applied across large areas [19,20,21]. Fick’s law-based methods, which use devices like high-resolution pepper to measure the P concentration gradient at the sediment–water interface, are labor-intensive and costly, limiting their spatial applicability [17,22]. The mass balance method, which calculates the net internal P loading based on the difference between P inputs and outputs, is also costly and provides only seasonal or annual results, with high uncertainty if critical P inputs and outputs are not correctly identified [23,24].
From a management perspective, mitigating internal P loading primarily requires the semi-quantitative or qualitative identification of critical zones in waterbodies, where management practices such as sediment dredging or geoengineering techniques can be applied [25,26]. The most widely used method for this purpose is P sequential fractionation, initially developed to study the geochemical cycling of P in sediments [27,28,29]. This method classifies P in sediments into fractions based on chemical recalcitrance: loosely adsorbed P, redox-sensitive P, iron/aluminum-bound P, calcium-bound P, and organic/refractory P. The labile P fractions, such as loosely adsorbed and redox-sensitive P, are commonly used to indicate the risk of internal P release. But P sequential fractionation is also time-consuming and labor-intensive, with many modifications for specific research purposes limiting its widespread application. In recent years, simpler indexes derived from soil P agronomic tests, such as Olsen P, exchangeable P (via CaCl2 or MgCl2), and water-soluble P, have been applied to assess sediment P release risks [30,31,32,33,34,35]. These indexes, which relate to the most bioavailable fractions of sediment P, have shown a good correlation with water column P concentrations and the growth of algae in previous studies [36,37]. Their methodologies are well established, easy to conduct, and suitable for application in a broad range of waterbodies, especially those in rural areas with limited historical data. However, labile P fractions in sediments can be influenced by seasonal variations in hydroclimate conditions, but sediments are often investigated at low frequencies due to the challenges of sediment sampling, particularly in large waterbodies [38,39]. Similarly, P concentrations in the water column also experience seasonal fluctuations due to variations in hydroclimate, internal P release, and external P input [40,41]. The persistence of the relationship between sediment P indexes and water column P concentrations across seasons remains underexplored, introducing uncertainty in sediment P risk assessment and the design of relevant management strategies.
This study aims to address this gap by investigating three sediment P indexes and their relationship with water column P concentrations across seasons in the Xiashan reservoir, in northern China. The Xiashan reservoir is a large, shallow freshwater reservoir that serves as the primary drinking water source of Weifang City (population: 9.4 million) and an important emergency water supply for the Jiaodong Peninsula (population: 20.0 million). In recent years, external nutrient inputs to the reservoir have been significantly reduced due to effective management policies. However, the reservoir continues to experience occasional harmful algae blooms [42], which increase water treatment costs and threaten the security of the water supply. Despite the potential significant contribution of internal P loading, the sediment P status in the Xiashan reservoir has not yet been studied. Thus, the objectives of this study are to (i) provide the first assessment of sediment P risk status in the Xiashan reservoir, and (ii) determine whether sediment P indexes can predict water column P concentrations across different seasons. The results of this study will help to improve the design of sampling strategies for internal P risk assessment in freshwater reservoirs.
2. Materials and Methods
2.1. Site Description
The Xiashan reservoir is located in Weifang City of Shandong Province, northern China (Figure 1). It was constructed in 1960 on hills and sloping plains and has a catchment area of 4210 km2, with a total water storage capacity of 1.4 billion m3 and an average depth of 4.6 m. The region experiences a temperate monsoon climate, with mean monthly temperatures ranging from −0.5 °C in January to 26.7 °C in July (2010–2022). The mean annual precipitation was 834 mm, with more than 60% falling between June and August (2010–2022). The catchment area is primarily composed of plains, with brown loam soils being the dominant type. This area is heavily agricultural, with crops such as wheat, corn, cotton, and peanuts leading to historical external nutrient inputs into the reservoir and the subsequent enrichment of nutrients in the sediments.
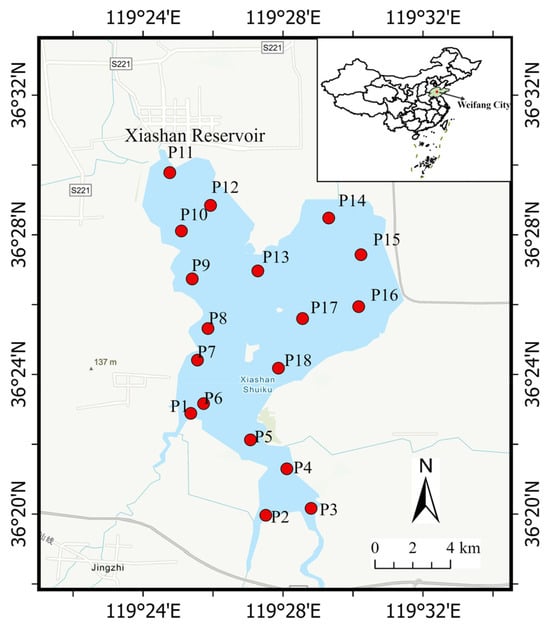
Figure 1.
Location of Xiashan reservoir in Weifang City, northern China, and sampling points (red cycles).
2.2. Sediment and Water Sampling
Surface sediments (0–5 cm) were collected with a Peterson sampler at 18 points in the reservoir in February, May, and August 2022 (Figure 1). Among these sites, P1, P2, and P3 were located at the mouths of the three main rivers discharging into the reservoir, while P11 was near the only outlet of the Xiashan reservoir. Once brought to the surface, sediments were poured into a plastic basin, mixed thoroughly, and placed in Ziploc bags. The sediments were transported to the laboratory and stored in a refrigerator at 4 °C until further analysis. During the May 2022 sampling, an additional 3.0 L of overlying water was collected at each sediment sampling point.
At each sediment sampling location, water samples were collected using a plastic water sampler at a depth of 1 m. A portion of each water sample was passed through <0.45 μM cellulose acetate filters within 3 h after collection, while the remaining sample was acidified with H2SO4 to pH < 2. All water samples were stored in a refrigerator at 4 °C and analyzed within 3 days.
2.3. Sediment and Water Analysis
Water depth was measured using a rope with a scale and counterweight during each sampling event. Sediment pH and redox potential (Eh) were determined using glass and platinum electrodes, respectively, with a calomel electrode as the reference. Sediment organic matter content was estimated using loss on ignition (LOI), with samples combusted at 550 °C for 2 h. Sediment total P (TPS) was digested in an acid mixture (HNO3, HClO4, and H2SO4 at a ratio of 3:1:1) and determined colorimetrically using the molybdate blue method (precision: ±13 μg L−1) [43]. Sediment particle size fractions were analyzed by the pipette method with sediments collected in May 2022. All sediment analyses were conducted in triplicate, with fresh sediments used for each test.
Water sample parameters such as temperature, conductivity, total dissolved solids, salinity, and pH were measured in situ using a ProQuatro handheld multiparameter meter (YSI, Xylem). For the acidified water sample, total phosphorus (TP), total N (TN), and chemical oxygen demand (COD) were analyzed. For the filtrated water sample, total dissolved P (TDP), soluble reactive P (SRP), total dissolved N (TDN), and ammonium (NH4+) were analyzed. SRP was determined colorimetrically via the molybdate blue method (precision: ±5 μg L−1). TP and TDP were determined using the same method as SRP but after digestion in acidic potassium persulfate (precision: ±13 μg L−1). Particulate P (PP) was calculated as the difference between TP and TDP. COD was determined using the dichromate titration method (precision: ±5%) [44]. TN and TDN were determined using ultraviolet spectrophotometry after digestion in alkaline potassium persulfate (precision: ±50 μg L−1) [44]. NH4+ was determined using the Nessler reagent colorimetric method (precision: ±50 μg L−1) [44].
2.4. Sediment P Risk Assessment
In this study, three sediment P indexes were used to assess the sediment P internal risk in the Xiashan reservoir: Olsen P (Olsen-P), exchangeable P (Ex-P), and diluted HCl-extractable P (HCl-P). Olsen-P was extracted with 0.1 M NaHCO3 for 30 min at a sediment/water ratio of 1:20 [45]. Ex-P was extracted with 0.1 M MgCl2 for 2 h at a sediment/water ratio of 1:20 [27]. HCl-P was extracted with 0.1 M HCl for 4 h at a sediment/water ratio of 1:40 [46]. P concentrations in extracts were determined by the molybdate blue method after necessary adjustment of the solution’s pH. HCl-P was included because previous studies indicated that 0.1 M HCl effectively assesses the available acid consumption capacity of sediments, which is linked to the fraction of pollutants in sediments that are sensitive to changes in hydroclimate conditions [46].
A classic single pollution index was used to evaluate the general ecological risk of sediment P in the Xiashan reservoir, based on the guidelines for environmental quality assessment expressed by the Department of Environment and Energy of Ontario, Canada (1992). This index was calculated as follows:
where STP is the single pollution index, CTP is the TP content in sediments (mg kg−1), and CS is the guideline TP content of the sediment, set at 600 mg kg−1 [47].
STP = CTP/CS
Sediment P fractions in the Xiashan reservoir were determined using a traditional sequential chemical extraction method on sediments collected in May 2022 [48]. Briefly, fresh sediment (1.0 g of dry weight) was placed in 60 mL centrifuge tubes and sequentially extracted by 50 mL 0.1 M KCl + 0.2% 2′2-bipyridine, citrate dithionite bicarbonate (CDB), and 1.0 M HCl. The suspension was subjected to end-over-end shaking at 25 °C for several hours, then centrifuged at 5000 rpm for 5 min and passed through 0.45 μm cellulose acetate filters. Extracts were used to determine exchangeable and ferrous-participated P (Fe(II)-P), ferric-oxide-bound P (CDB-P), and calcium-bound P (Ca-P), respectively. The residue was combusted at 550 °C for 2 h, ground, and extracted with 1.0 M HCl to determine refractory residual P (Res-P).
2.5. Statistical Analysis
Pearson correlation analyses were conducted to assess the relationship between sediment TPS, P fractions, and the three P indexes with the concentrations of TDP, SRP, and PP in water samples from the three sampling events, to compare the ability of sediment P properties to indicate the P release risk across seasons. Differences in sediment and water sample characteristics among the three sampling events were assessed using a one-way analysis of variance and Tukey’s post hoc test. The significance level of all analyses was set at p < 0.05. All statistical analyses were performed using SPSS software (IBM SPSS Statistics 22).
3. Results
3.1. Basic Characteristics of Sediments
The sediments in the Xiashan reservoir were predominantly sandy loam, with sand and silt constituting 67.5% and 27.9% of the sediment composition, respectively (Table 1; Figure S1). Sediments were strongly reduced, with Eh values consistently below −140 mv across all three sampling events. The Eh values of sediments in February were lower and more variable compared to those observed in May and August. Sediments were neutral with mean pH ranging from 7.0 in August to 7.5 in February. Sediment LOI values were not obviously different among the three sampling events, with mean values ranging from 6.6% in February and May to 7.5% in August.

Table 1.
Physio-chemical properties of the surface sediments sampled. Values are mean ± a standard deviation of the sediments at the same date.
3.2. Characteristics of Sediment P and Risk Assessment
TPS ranged from 353 to 1107 mg kg−1 in August, which were significantly higher than those in February (224–841 mg kg−1) and May (369–921 mg kg−1) (Table 1; Figure 2A). Sediment points near the river entrances (P1-P4), as well as those at P8, P9, and P12, exhibited higher TPS than the other points (Figure 2A). Correspondingly, the mean STP at each site ranged from 0.5 at P10 to 1.4 at P9, indicating that the ecological risk level of sediments was classified as slightly to moderately polluted (Table 2). Sediments at P2 and P9 in May, as well as at P1 in August, were classified as seriously polluted.
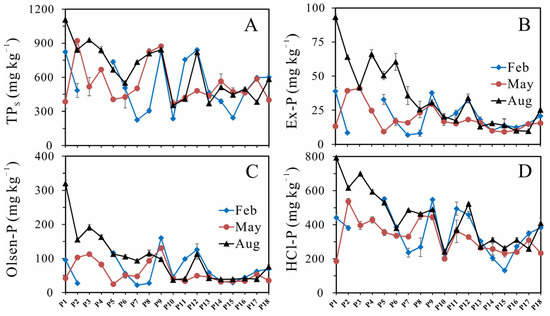
Figure 2.
Variations in the contents of (A) total P (TPS), (B) exchangeable P (Ex-P), (C) Olsen P (Olsen-P), and (D) HCl-extractable P (HCl-P) in the surface sediments sampled.
Table 2.
Ecological risk of P in sediments of the Xiashan reservoir evaluated by the single pollution index.
Similar to TPS, the contents of Ex-P, Olsen-P, and HCl-P were significantly higher in August than in February and May (Table 1; Figure 2B–D). Mean values for Ex-P, Olsen-P, and HCl-P ranged from 19 mg kg−1, 58 mg kg−1, and 327 mg kg−1 in May to 35 mg kg−1, 101 mg kg−1, and 444 mg kg−1 in August, respectively (Table 1). The seasonal differences in these P indexes were more pronounced at points near river entrances (P1–P4) than at the other points, where the contents of Ex-P, Olsen-P, and HCl-P were relatively consistent (Figure 2B–D).
Ca-P and Res-P were the dominant P fractions in the sediments, comprising mean proportions of 31.6% and 38.8%, respectively (Figure 3). CDB-P and Fe(II)-P were the secondary fractions in sediment P, with mean proportions of 16.2% and 13.4%, respectively.
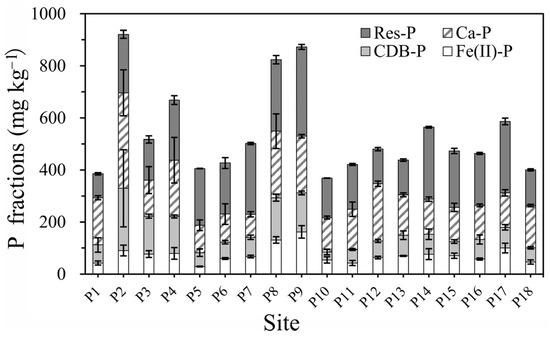
Figure 3.
Variations in the P fractions in surface sediments. Samples were from May 2022. Fe(II)-P: sum of labile exchangeable P and P precipitated by ferrous iron; CDB-P: P bound by iron/aluminum oxides; Ca-P: P bound by detrital and metastable apatite; Res-P: residual organic P. Values are means of 3 replicated measurements. Error bars represent standard deviation.
3.3. Relationship Between Sediment P and Water Column P Across Seasons
Basic water quality properties are presented in Table 3. Water depth, temperature, conductivity, TDS, salinity, and pH, as well as concentrations of TDN, NH4+, TN, and COD, showed notable seasonal variations. Concentrations of TDP, SRP, and TP displayed similar seasonal variations as those of available P in sediments, with the concentrations in August being significantly higher than in February and May. Concentrations of TDP, SRP, and TP were also higher at points close to the river entrances (P1–P5) compared to other sampling points (Figure 4). PP concentrations were comparable in May and August and were significantly higher than in February. The proportions of PP in TP were 77% in February and 81% in May, significantly higher than the 41% observed in August.
Table 3.
Physio-chemical properties of the surface water sampled. Values are mean ± a standard deviation of the samples at the same date.
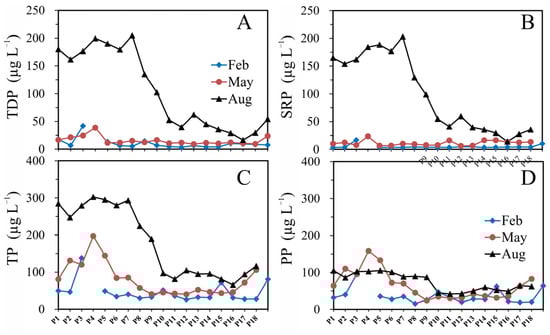
Figure 4.
Spatial variations in the concentrations of (A) total dissolved P (TDP), (B) soluble reactive P (SRP), (C) total P (TP), and (D) particulate P (PP) in the surface water sampled.
The P fractions, along with TPS and the three P indexes in the sediments of February and May, generally had no significant effect on the concentrations of TDP, SRP, and TP in the water column (Figure 5). There were only significant positive correlations between CDB-P and Ex-P in May sediments with TDP in May waters, as well as between HCl-P in May sediments with TDP and SRP in May waters. In contrast, TPS and the three P indexes in August sediments showed significant positive correlations with TDP concentrations across the three sampling events, with correlation coefficients ranging from 0.42 to 0.81 (Figure 5). These sediment parameters were also significantly correlated with PP concentrations in May and August, and with SRP in August, with correlation coefficients ranging from 0.44 to 0.78.
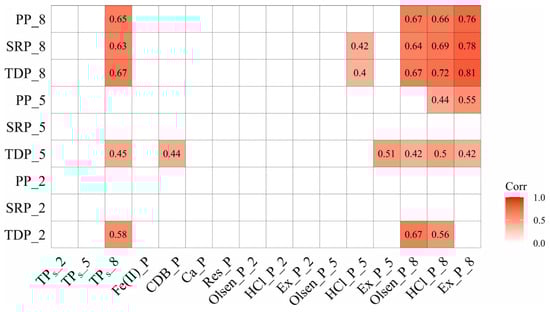
Figure 5.
Correlations between sediment P fractions and P indexes with the concentrations of TDP, SRP, and PP in the overlying water sampled in February, May, and August 2022. Numbers are significant correlation coefficients at the significance level of p < 0.05.
4. Discussion
The present study is the first to investigate sediment P status in the Xiashan reservoir. The results reveal that the sediments in this reservoir contain moderate levels of TPS contents but exhibit high P availability. The mean TPS in sediments ranged between 531 and 650 mg kg−1 during the three sampling events, which correspond to a classification of slightly to moderately polluted according to the classic single pollution index. These values are lower than those observed in many other lakes and reservoirs in northern China [49,50]. For example, the Miyun Reservoir, another freshwater reservoir in northern China, has a mean TPS of 688 mg kg−1, which is higher than that found in the Xiashan reservoir [50]. However, the sediment P in the Xiashan reservoir is characterized by very high availability compared to other freshwater bodies. The Olsen-P content in Xiashan’s sediments ranged between 58 and 101 mg kg−1, accounting for 10.7–15.5% of the TPS. These values are similar to those found in heavily polluted Chinese lakes, such as Taihu Lake (80–140 mg kg−1) [51] and Dianchi lake (146–430 mg kg−1) [52], but are much higher than those in Chaohu Lake (2.5–28.3 mg kg−1) [53].
To further assess the risk of internal P release from the sediments of the Xiashan reservoir, we conducted a modified static release simulation experiment using sediments from various locations in the reservoir, including P4, P6, P8, P9, P12, and P14 (detailed procedures are provided in the Supporting Materials). The results indicated that the release rate of TP after 28 days ranged from 20.0 mg m−2 d−1 at P4 to 0.4 mg m−2 d−1 at P6, 1.1 mg m−2 d−1 at P8, 10.9 mg m−2 d−1 at P9, and 5.6 mg m−2 d−1 at P12, while P14 showed a negative release rate (Figure 6). These release rates are notably higher than those observed in the most polluted areas of Taihu Lake (up to 6.8 mg m−2 d−1) [17], Dianchi lake (up to 2.1 mg m−2 d−1) [19], and Chaohu Lake (up to 8.9 mg m−2 d−1) [54]. This high P internal loading results in the water quality status of the Xiashan reservoir being lower than the national standards for drinking water resources despite efforts to control external P inputs.
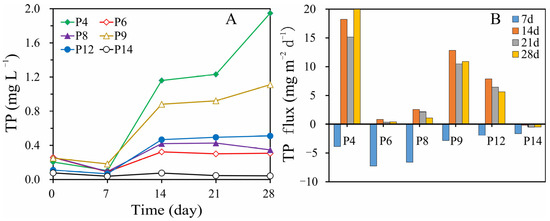
Figure 6.
(A) Variations in total P concentrations in the overlying water and (B) diffusive total P fluxes during the static sediment incubation.
The high availability of P in the sediments of the Xiashan reservoir can be attributed to the sandy nature of the sediments, which lack stable P-binding carriers such as clay minerals and iron/aluminum oxides. The average sand content in Xiashan’s sediments is 67.5%, with values reaching as high as 85.9% at P5 (Figure S1). It is well known that clay minerals and iron/aluminum oxides are the primary carriers of P in soils and sediments, and the P-binding capacity of clay minerals often surpasses that of iron/aluminum oxides [55]. The low clay content in Xiashan’s sediments results in relatively low TP contents, but high availability of P. Moreover, a recent study investigating the reducing capacity of Xiashan’s sediments indicated a shortage of active iron minerals, with the primary reducing agents being organic matter and sulfide [56], further explaining the high P availability of Xiashan’s sediments.
Another important finding of this study is that sediment P indexes from August showed significant positive correlations with TDP concentrations in the water column across all three sampling events. This suggests that sediment P indexes in August can effectively predict water column P concentrations across seasons. In contrast, sediment P indexes from February and May did not show significant correlations with TDP concentrations in the water column. This result was contrary to our initial expectation because, during the dry season in February and May, with lower water depth and external P input, sediment available P should theoretically have a stronger relationship with P concentrations in the water column. In contrast, during the wet season in August, the reservoir’s increased water depth and higher external P inputs from tributaries, which result in the highest P concentrations in the waters, might be expected to disrupt this relationship. This is likely due to the seasonal variation in internal P fluxes associated with hydroclimate changes [17]. In August, higher internal P fluxes occurred due to elevated temperatures, accelerated biogeochemical cycles of sediment P, and enhanced matter exchange between sediment and water caused by increased water flux. This led to a closer linkage between sediment labile P and water column P concentrations in August compared to February and May.
This finding has significant implications for management perspectives. As P indexes in August sediments have good predictions on water column P across seasons, points with high P indexes will be identified as the critical zones of internal P release and should be prioritized for management practices aimed at reducing internal P risks. This is particularly important for waterbodies in rural areas that have historically received limited scientific attention and financial support. Among the three P indexes tested in the present study, we recommend using Ex-P as the indicator of sediment internal P risk because of its feasible extraction procedure and the stronger correlation with water column P concentrations (Figure 5).
Furthermore, our results showed that Ex-P in sediments was significantly positively correlated with both TDP and PP concentrations in the water. It is widely recognized that dissolved P, including dissolved inorganic and organic P forms, is the bioavailable P for phytoplankton in water columns of lakes and reservoirs [57,58]. In contrast, PP, which is attached to resuspended sediment, algal, or bacterial particles, cannot be directly utilized by algae. However, PP can contribute to maintaining the concentration of dissolved P in the water column through various biogeochemical processes [57,58]. In shallow lakes and reservoirs, which are particularly vulnerable to sediment resuspension, PP can be a major source of P for primary production [59]. The significant correlation between Ex-P in sediments and PP in the water column observed in this study highlights the potential of sediment P indexes to provide a more comprehensive evaluation of sediment P risks.
5. Conclusions
This study presents the first assessment of sediment P status in the Xiashan reservoir, northern China, and evaluates the ability of Ex-P, Olsen-P, and HCl-P to predict P concentrations in the water column across seasons. The results indicate that the sediments in the Xiashan reservoir have moderate total P contents but exhibit high P availability due to their sandy nature. We found that TDP in water samples from February, May, and August significantly correlated with Ex-P, Olsen-P, and HCl-P in August sediments, but not with those from February and May sediments. This highlights the predictive ability of P indexes in August sediments for water column P concentrations across seasons. Our findings suggest that sediment sampling in August provides a more effective means of identifying critical zones for internal P loading, and we recommend Ex-P as a suitable indicator for internal P risk, given its feasible extraction procedure and stronger prediction power for water column P concentrations.
Supplementary Materials
The following supporting information can be downloaded at https://www.mdpi.com/article/10.3390/w17020218/s1: Figure S1: Variations in the pH, Eh, loss on ignition (LOI), and size fractions of the sediments sampled. Size fractions were measured with sediments from May 2022.
Author Contributions
Conceptualization, W.L., S.G. and Q.L.; methodology, W.L. and S.G.; software, W.L. and S.G.; validation, S.G., Q.L. and Z.L.; formal analysis, W.L. and F.H.; investigation, S.G., Q.L. and Z.L.; resources, S.G., Q.L. and Z.L.; data curation, F.H., S.F., Y.Y., S.J., L.L., X.C. and Y.J.; writing—original draft preparation, W.L., S.G. and Q.L.; writing—review and editing, W.L., S.G. and Q.L.; visualization, W.L., S.G. and Q.L.; supervision, W.L., S.G. and Q.L.; project administration, W.L., S.G. and Q.L.; funding acquisition, W.L., S.G. and Q.L. All authors have read and agreed to the published version of the manuscript.
Funding
This research was funded by the National Natural Science Foundation of China, grant numbers: 42177038, 42077097, and 41877397.
Data Availability Statement
The data presented in this study are available on request from the corresponding author.
Acknowledgments
We are thankful for the help of Haochen Tan, Ruilian Guo, Changlin Shao, and Fanjun Yang during the sample collection.
Conflicts of Interest
The authors declare no conflicts of interest.
References
- Conley, D.J.; Paerl, H.W.; Howarth, R.W.; Boesch, D.F.; Seitzinger, S.P.; Havens, K.E. Controlling eutrophication: Nitrogen and phosphorus. Science 2009, 323, 1014–1015. [Google Scholar] [CrossRef] [PubMed]
- Brooks, B.W.; Lazorchak, J.M.; Howard, M.D.; Johnson, M.V.; Morton, S.L.; Perkins, D.A.; Reavie, E.D.; Scott, G.I.; Smith, S.A.; Steevens, J.A. Are harmful algal blooms becoming the greatest inland water quality threat to public health and aquatic ecosystems? Environ. Toxicol. Chem. 2016, 35, 6–13. [Google Scholar] [CrossRef]
- Jenny, J.-P.; Normandeau, A.; Francus, P.; Taranu, Z.E.; Gregory-Eaves, I.; Lapointe, F. Urban point sources of nutrients were the leading cause for the historical spread of hypoxia across European lakes. Proc. Natl. Acad. Sci. USA 2016, 113, 12655–12660. [Google Scholar] [CrossRef]
- Le Moal, M.; Gascuel-Odoux, C.; Ménesguen, A.; Souchon, Y.; Étrillard, C.; Levain, A. Eutrophication: A new wine in an old bottle? Sci. Total. Environ. 2018, 651, 139. [Google Scholar] [CrossRef] [PubMed]
- Peñuelas, J.; Poulter, B.; Sardans, J.; Ciais, P.; van der Velde, M.; Bopp, L.; Boucher, O.; Godderis, Y.; Hinsinger, P.; Llusia, J.; et al. Human-induced nitrogen–phosphorus imbalances alter natural and managed ecosystems across the globe. Nat. Commun. 2013, 4, 2934. [Google Scholar] [CrossRef]
- Schindler, D.W.; Carpenter, S.R.; Chapra, S.C.; Hecky, R.E.; Orihel, D.M. Reducing phosphorus to curb Lake eutrophication is a success. Environ. Sci. Technol. 2016, 50, 8923–8929. [Google Scholar] [CrossRef] [PubMed]
- Schoumans, O.F.; Chardon, W.J.; Bechmann, M.E.; Gascuel-Odoux, C.; Hofman, G.; Kronvang, B. Overview of mitigation options to reduce phosphorus losses from rural areas and to improve surface water quality. Sci. Total Environ. 2014, 468–469, 1255–1266. [Google Scholar] [CrossRef] [PubMed]
- Tong, Y.; Zhang, W.; Wang, X.; Couture, R.-M.; Larssen, T.; Zhao, Y.; Li, J.; Liang, H.; Liu, X.; Bu, X.; et al. Decline in Chinese lake phosphorus concentration accompanied by shift in sources since 2006. Nat. Geosci. 2017, 10, 507–511. [Google Scholar] [CrossRef]
- Carpenter, S.R. Eutrophication of aquatic ecosystems: Bistability and soil phosphorus. Proc. Natl. Acad. Sci. USA 2005, 102, 10002–10005. [Google Scholar] [CrossRef] [PubMed]
- Jeppesen, E.; Søndergaard, M.; Jensen, J.P.; Havens, K.E.; Anneville, O.; Carvalho, L.; Coveney, M.F.; Deneke, R.; Dokulil, M.T.; Foy, B.; et al. Lake responses to reduced nutrient loading—An analysis of contemporary long-term data from 35 case studies. Freshw. Biol. 2005, 50, 1747–1771. [Google Scholar] [CrossRef]
- Matisoff, G.; Kaltenberg, E.M.; Steely, R.L.; Hummel, S.K.; Seo, J.; Gibbons, K.J.; Bridgeman, T.B.; Seo, Y.; Behbahani, M.; James, W.F.; et al. Internal loading of phosphorus in western Lake Erie. J. Great Lakes Res. 2016, 42, 775–788. [Google Scholar] [CrossRef]
- Watson, S.B.; Miller, C.; Arhonditsis, G.; Boyer, G.L.; Carmichael, W.; Charlton, M.N.; Confesor, R.; Depew, D.; Höök, T.O.; Ludsin, S.A.; et al. The re-eutrophication of Lake Erie: Harmful algal blooms and hypoxia. Harmful Algae 2016, 56, 44–66. [Google Scholar] [CrossRef] [PubMed]
- Janssen, A.B.G.; de Jager, V.C.L.; Janse, J.H.; Kong, X.; Liu, S.; Ye, Q. Spatial identification of critical nutrient loads of large shallow lakes: Implications for Lake Taihu (China). Water Res. 2017, 119, 276–287. [Google Scholar] [CrossRef]
- Lepori, F.; Roberts, J.J. Effects of internal phosphorus loadings and food-web structure on the recovery of a deep lake from eutrophication. J. Great Lakes Res. 2017, 43, 255–264. [Google Scholar] [CrossRef]
- Bhadha, J.H.; Jawitz, J.W.; Min, J.-H. Phosphorus mass balance and internal load in an impacted subtropical isolated wetland. Water Air Soil. Pollut. 2011, 218, 619–632. [Google Scholar] [CrossRef]
- Koriyama, M.; Hayami, Y.; Koga, A.; Yamamoto, K.; Isnasetyo, A.; Hamada, T.; Yoshino, K.; Katano, T.; Yamaguchi, S. Seasonal variations of water column nutrients in the inner area of Ariake Bay, Japan: The role of muddy sediments. Environ. Monit. Assess. 2013, 185, 6831–6846. [Google Scholar] [CrossRef] [PubMed]
- Ding, S.; Chen, M.; Gong, M.; Fan, X.; Qin, B.; Xu, H.; Gao, S.; Jin, Z.; Tsang, D.C.W.; Zhang, C. Internal phosphorus loading from sediments causes seasonal nitrogen limitation for harmful algal blooms. Sci. Total Environ. 2018, 625, 872–884. [Google Scholar] [CrossRef]
- Burger, D.F.; Hamilton, D.P.; Pilditch, C.A.; Gibbs, M.M. Benthic nutrient fluxes in a eutrophic, polymictic lake. Hydrobiologia 2007, 584, 13–25. [Google Scholar] [CrossRef]
- Li, B.; Ding, S.-M.; Fan, C.-X.; Zhong, J.-C.; Zhao, B.; Yin, H.-B.; Zhang, L. Estimation of releasing fluxes of sediment nitrogen and phosphorus in Fubao Bay in Dianchi Lake. Environ. Sci. 2008, 29, 114–120. [Google Scholar]
- Steinman, A.; Chu, X.; Ogdahl, M. Spatial and temporal variability of internal and external phosphorus loads in Mona Lake, Michigan. Aquat. Ecol. 2009, 43, 1–18. [Google Scholar] [CrossRef]
- Yin, H.; Zhang, M.; Yin, P.; Li, J. Characterization of internal phosphorus loading in the sediment of a large eutrophic lake (Lake Taihu, China). Water Res. 2022, 225, 119125. [Google Scholar] [CrossRef]
- Ding, S.; Han, C.; Wang, Y.; Yao, L.; Wang, Y.; Xu, D.; Sun, Q.; Williams, P.N.; Zhang, C. In situ, high-resolution imaging of labile phosphorus in sediments of a large eutrophic lake. Water Res. 2015, 74, 100–109. [Google Scholar] [CrossRef]
- Kelderman, P.; Wei, Z.; Maessen, M. Water and mass budgets for estimating phosphorus sediment–water exchange in Lake Taihu (China PR). Hydrobiologia 2005, 544, 167–175. [Google Scholar] [CrossRef]
- Nürnberg, G.K.; Tarvainen, M.; Ventelä, A.-M.; Sarvala, J. Internal phosphorus load estimation during biomanipulation in a large polymictic and mesotrophic lake. Inland Waters 2012, 2, 147–162. [Google Scholar] [CrossRef]
- Yin, H.; Kong, M. Reduction of sediment internal P-loading from eutrophic lakes using thermally modified calcium-rich attapulgite-based thin-layer cap. J. Environ. Manag. 2015, 151, 178–185. [Google Scholar] [CrossRef]
- Sun, C.; Zhong, J.; Pan, G.; Mortimer, R.J.; Yu, J.; Wen, S.; Zhang, L.; Yin, H.; Fan, C. Controlling internal nitrogen and phosphorus loading using Ca-poor soil capping in shallow eutrophic lakes: Long-term effects and mechanisms. Water Res. 2023, 233, 119797. [Google Scholar] [CrossRef] [PubMed]
- Ruttenberg, K.C. Development of a sequential extraction method for different forms of phosphorus in marine sediments. Limnol. Oceanogr. 1992, 37, 1460–1482. [Google Scholar] [CrossRef]
- Sondergaard, M.; Jensen, J.P.; Jeppesen, E. Role of sediment and internal loading of phosphorus in shallow lakes. Hydrobiologia 2003, 506, 135–145. [Google Scholar] [CrossRef]
- Aydin, I.; Aydin, F.; Saydut, A.; Hamamci, C. A sequential extraction to determine the distribution of phosphorus in the seawater and marine surface sediment. J. Hazard. Mater. 2009, 168, 664–669. [Google Scholar] [CrossRef] [PubMed]
- Wang, S.; Jin, X.; Bu, Q.; Liao, H.; Wu, F. Evaluation of phosphorus bioavailability in sediments of the shallow lakes in the middle and lower reaches of the Yangtze River region, China. Environ. Earth Sci. 2010, 60, 1491–1498. [Google Scholar] [CrossRef]
- Bo, L.; Wang, D.; Zhang, G.; Wang, C. Evaluating the Relationship between Phosphorus Bioavailability and Phosphorus Speciation in Sediments from Rural Rivers in the Taihu Lake Area, China. Pol. J. Environ. Stud. 2014, 23, 1933–1940. [Google Scholar] [CrossRef] [PubMed]
- Chen, C.; Deng, W.; Xu, X.; He, J.; Wang, S.; Jiao, L.; Zhang, Y. Phosphorus adsorption and release characteristics of surface sediments in Dianchi Lake, China. Environ. Earth Sci. 2015, 74, 3689–3700. [Google Scholar] [CrossRef]
- Huang, L.; Li, Z.; Li, R.; Wu, H. Comparative study of phosphorus adsorption behaviors in lake sediments over short and long periods of time: Implication for the prediction of the release of phosphorus by CaCl2 and NaHCO3 extraction. Environ. Sci. Pollut. Res. 2016, 23, 25145–25155. [Google Scholar] [CrossRef] [PubMed]
- Fu, Z.; Hong, Z.; Wei, J.; Liao, Y.; You, S.; Wang, Y.; Lv, J.; Feng, H.; Kolenčík, M.; Chang, X.; et al. Phosphorus fractionation and adsorption characteristics in drinking water reservoir inlet river sediments under human disturbance. J. Soil Sediment. 2022, 22, 2530–2547. [Google Scholar]
- Younis, A.M.; Soliman, N.F.; Elkady, E.M.; Mohamedein, L.I. Distribution and ecological risk evaluation of bioavailable phosphorus in sediments of El Temsah Lake, Suez Canal. Oceanologia 2022, 64, 287–298. [Google Scholar] [CrossRef]
- Zhou, Q.; Gibson, C.E.; Zhu, Y. Evaluation of phosphorus bioavailability in sediments of three contrasting lakes in China and the UK. Chemosphere 2001, 42, 221–225. [Google Scholar] [CrossRef]
- Chen, Y.; Chen, Q.; Zhang, D.; Tang, L. Variation in sediment available-phosphorus in Dianchi Lake and its impacts on algal growth. Int. J. Environ. Res. Public Health 2022, 19, 14689. [Google Scholar] [CrossRef] [PubMed]
- Kangur, M.; Puusepp, L.; Buhvestova, O.; Haldna, M.; Kangur, K. Spatio-temporal variability of surface sediment phosphorus fractions and water phosphorus concentration in Lake Peipsi (Estonia/Russia). Est. J. Earth Sci. 2013, 62, 171–180. [Google Scholar] [CrossRef]
- Cai, Y.; Wang, H.; Zhang, T.; Zhou, Y.; Dong, A.; Huang, R. Seasonal variation regulate the endogenous phosphorus release in sediments of Shijiuhu Lake via water-level fluctuation. Environ. Res. 2023, 238, 117247. [Google Scholar] [CrossRef]
- Varol, M. Spatio-temporal changes in surface water quality and sediment phosphorus content of a large reservoir in Turkey. Environ. Pollut. 2020, 259, 113860. [Google Scholar] [CrossRef]
- Geng, M.; Wang, K.; Yang, N.; Li, F.; Zou, Y.; Chen, X.; Deng, Z.; Xie, Y. Evaluation and variation trends analysis of water quality in response to water regime changes in a typical river-connected lake (Dongting Lake), China. Environ. Pollut. 2021, 268, 115761. [Google Scholar] [CrossRef] [PubMed]
- Tan, H.; Wang, Y.; Li, S.; Zhang, Q.; Liu, G.; Liu, B. A newly recorded species of freshwater blooming dinoflagellates from China and its ecological risks. J. Lake Sci. 2020, 32, 784–792. [Google Scholar]
- Murphy, J.; Riley, J.P. A modified single solution method for the determination of phosphate in natural waters. Anal. Chim. Acta 1962, 27, 31–36. [Google Scholar] [CrossRef]
- GB3838–2002; Environmental Quality Standard for Surface Water. Ministry of Ecology and Environment: Beijing, China, 2002.
- Olsen, S.R. Estimation of Available Phosphorus in Soils by Extraction with Sodium Bicarbonate (No. 939); US Department of Agriculture: Washington, DC, USA, 1954.
- Li, Q.; Bao, X.; Chen, P.; Jiao, Y.; Gu, S. Available acid consumption capacity of sediments in six water bodies in the Yangtze River Basin in China. Water Res. 2021, 203, 117565. [Google Scholar] [CrossRef] [PubMed]
- Alvarez-Guerra, M.; Viguri, J.R.; Casado-Martínez, M.C.; DelValls, T.A. Sediment quality assessment and dredged material management in Spain: Part I, application of sediment quality guidelines in the Bay of Santander. Integr. Environ. Assess. Manag. 2007, 3, 529–538. [Google Scholar] [CrossRef]
- Gu, S.; Qian, Y.; Jiao, Y.; Li, Q.; Pinay, G.; Gruau, G. An innovative approach for sequential extraction of phosphorus in sediments: Ferrous iron P as an independent P fraction. Water Res. 2016, 103, 352–361. [Google Scholar] [CrossRef] [PubMed]
- Ji, P.; Chen, J.; Chen, R.; Liu, J.; Yu, C.; Chen, F. Nitrogen and phosphorus trends in lake sediments of China may diverge. Nat. Commun. 2024, 15, 2644. [Google Scholar] [CrossRef]
- Qin, L.; Zeng, Q.; Zhang, W.; Li, X.; Steinman, A.D.; Du, X. Estimating internal P loading in a deep water reservoir of northern China using three different methods. Environ. Sci. Pollut. Res. 2016, 23, 18512–18523. [Google Scholar] [CrossRef]
- Huang, Q.; Wang, Z.; Wang, D.; Ma, M. Environmental soil phosphorus testing and phosphorus release in Taihu Lake, China. Pedosphere 2004, 14, 461–466. [Google Scholar]
- Hu, J.; Liu, Y.; Liu, J. The Comparison of Phosphorus Pools from the Sediment in Two Bays of Lake Dianchi for Cyanobacterial Bloom Assessment. Environ. Monit. Assess. 2006, 121, 1–14. [Google Scholar] [CrossRef]
- Zhou, C.; Zhou, Y.; Chen, X.; Li, Y.; Cao, X.; Song, C. Linkage between land use patterns and sediment phosphorus sorption behaviors along shoreline of a Chinese large shallow lake (Lake Chaohu). Knowl. Manag. Aquat. Ecosyst. 2011, 403, 06. [Google Scholar] [CrossRef][Green Version]
- Yang, C.; Li, J.; Yin, H. Phosphorus internal loading and sediment diagenesis in a large eutrophic lake (Lake Chaohu, China). Environ. Pollut. 2022, 292, 118471. [Google Scholar] [CrossRef] [PubMed]
- Gérard, F. Clay minerals, iron/aluminum oxides, and their contribution to phosphate sorption in soils—A myth revisited. Geoderma 2016, 262, 213–226. [Google Scholar] [CrossRef]
- Chen, X.; Li, Z.; Fu, S.; Liang, L.; Liu, X.; Hu, F.; Zhang, W.; Bi, Y.; Jiao, Y.; Gu, S.; et al. Sequential oxidation procedures with KMnO4: Component characteristics of labile reducing capacity fractions in anaerobic sediments. Sci. Total Environ. 2024, 955, 177126. [Google Scholar] [CrossRef] [PubMed]
- Ellison, M.E.; Brett, M.T. Particulate phosphorus bioavailability as a function of stream flow and land cover. Water Res. 2006, 40, 1258–1268. [Google Scholar] [CrossRef]
- Zhang, C.; Feng, W.; Chen, H.; Zhu, Y.; Wu, F.; Giesy, J.P.; He, Z.; Wang, H.; Sun, F. Characterization and sources of dissolved and particulate phosphorus in 10 freshwater lakes with different trophic statuses in China by solution 31P nuclear magnetic resonance spectroscopy. Ecol. Res. 2019, 34, 106–118. [Google Scholar] [CrossRef]
- Kong, M.; Chao, J.; Han, W.; Ye, C.; Li, C.; Tian, W. Degradation characteristics of phosphorus in phytoplankton-derived particulate organic matter and its effects on the growth of phosphorus-deficient microcystis aeruginosa in Lake Taihu. Int. J. Environ. Res. Public Health 2019, 16, 2155. [Google Scholar] [CrossRef]
Disclaimer/Publisher’s Note: The statements, opinions and data contained in all publications are solely those of the individual author(s) and contributor(s) and not of MDPI and/or the editor(s). MDPI and/or the editor(s) disclaim responsibility for any injury to people or property resulting from any ideas, methods, instructions or products referred to in the content. |
© 2025 by the authors. Licensee MDPI, Basel, Switzerland. This article is an open access article distributed under the terms and conditions of the Creative Commons Attribution (CC BY) license (https://creativecommons.org/licenses/by/4.0/).