Author Contributions
Conceptualization, C.-M.L. and S.-G.K.; methodology, S.-G.K., H.-I.K. and J.-S.Y.; software, S.-G.K. and H.-I.K.; analysis, S.-G.K., H.-I.K. and J.-S.Y.; investigation, S.-G.K., J.-S.Y., C.-H.K. and H.H.; resources, C.-M.L., data curation, S.-G.K., J.-S.Y., C.-H.K. and H.H.; writing—original draft preparation, S.-G.K. and H.-I.K.; writing—review and editing, J.-S.Y. and C.-H.K.; visualization, S.-G.K., H.-I.K. and H.H.; supervision, C.-M.L. All authors have read and agreed to the published version of the manuscript.
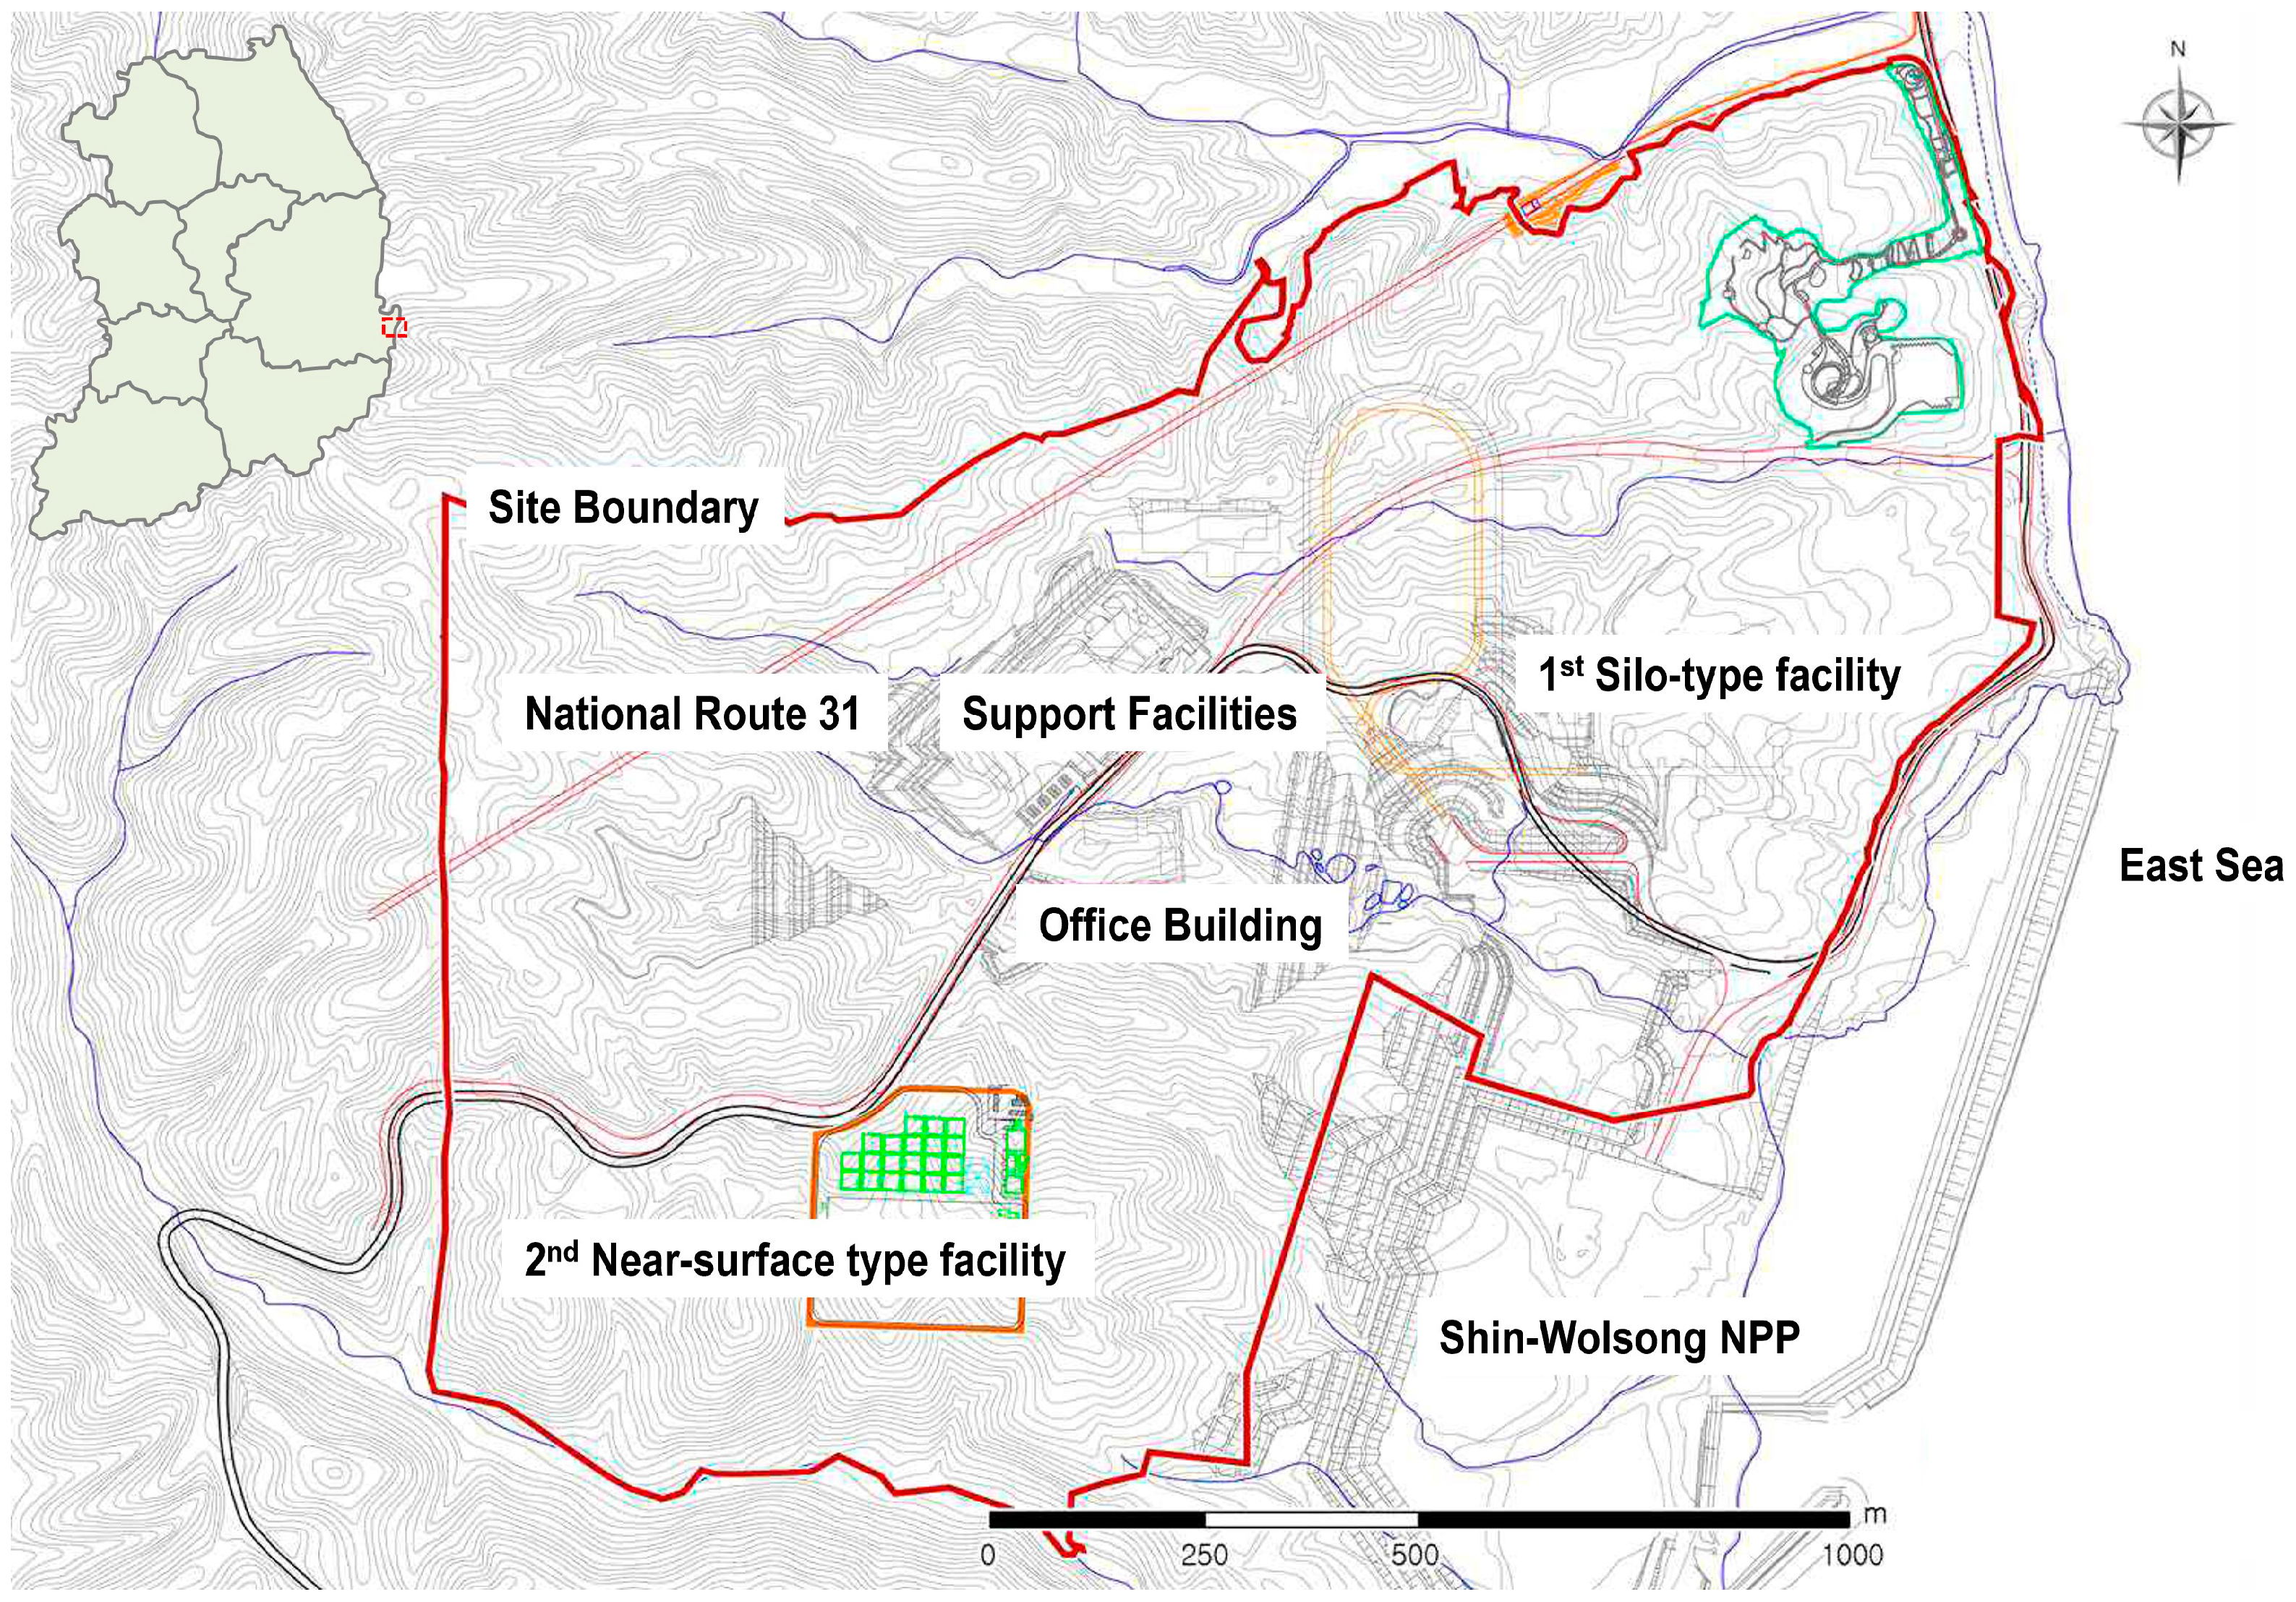
Figure 1.
Map of study area (Southeastern of Korea).
Figure 1.
Map of study area (Southeastern of Korea).
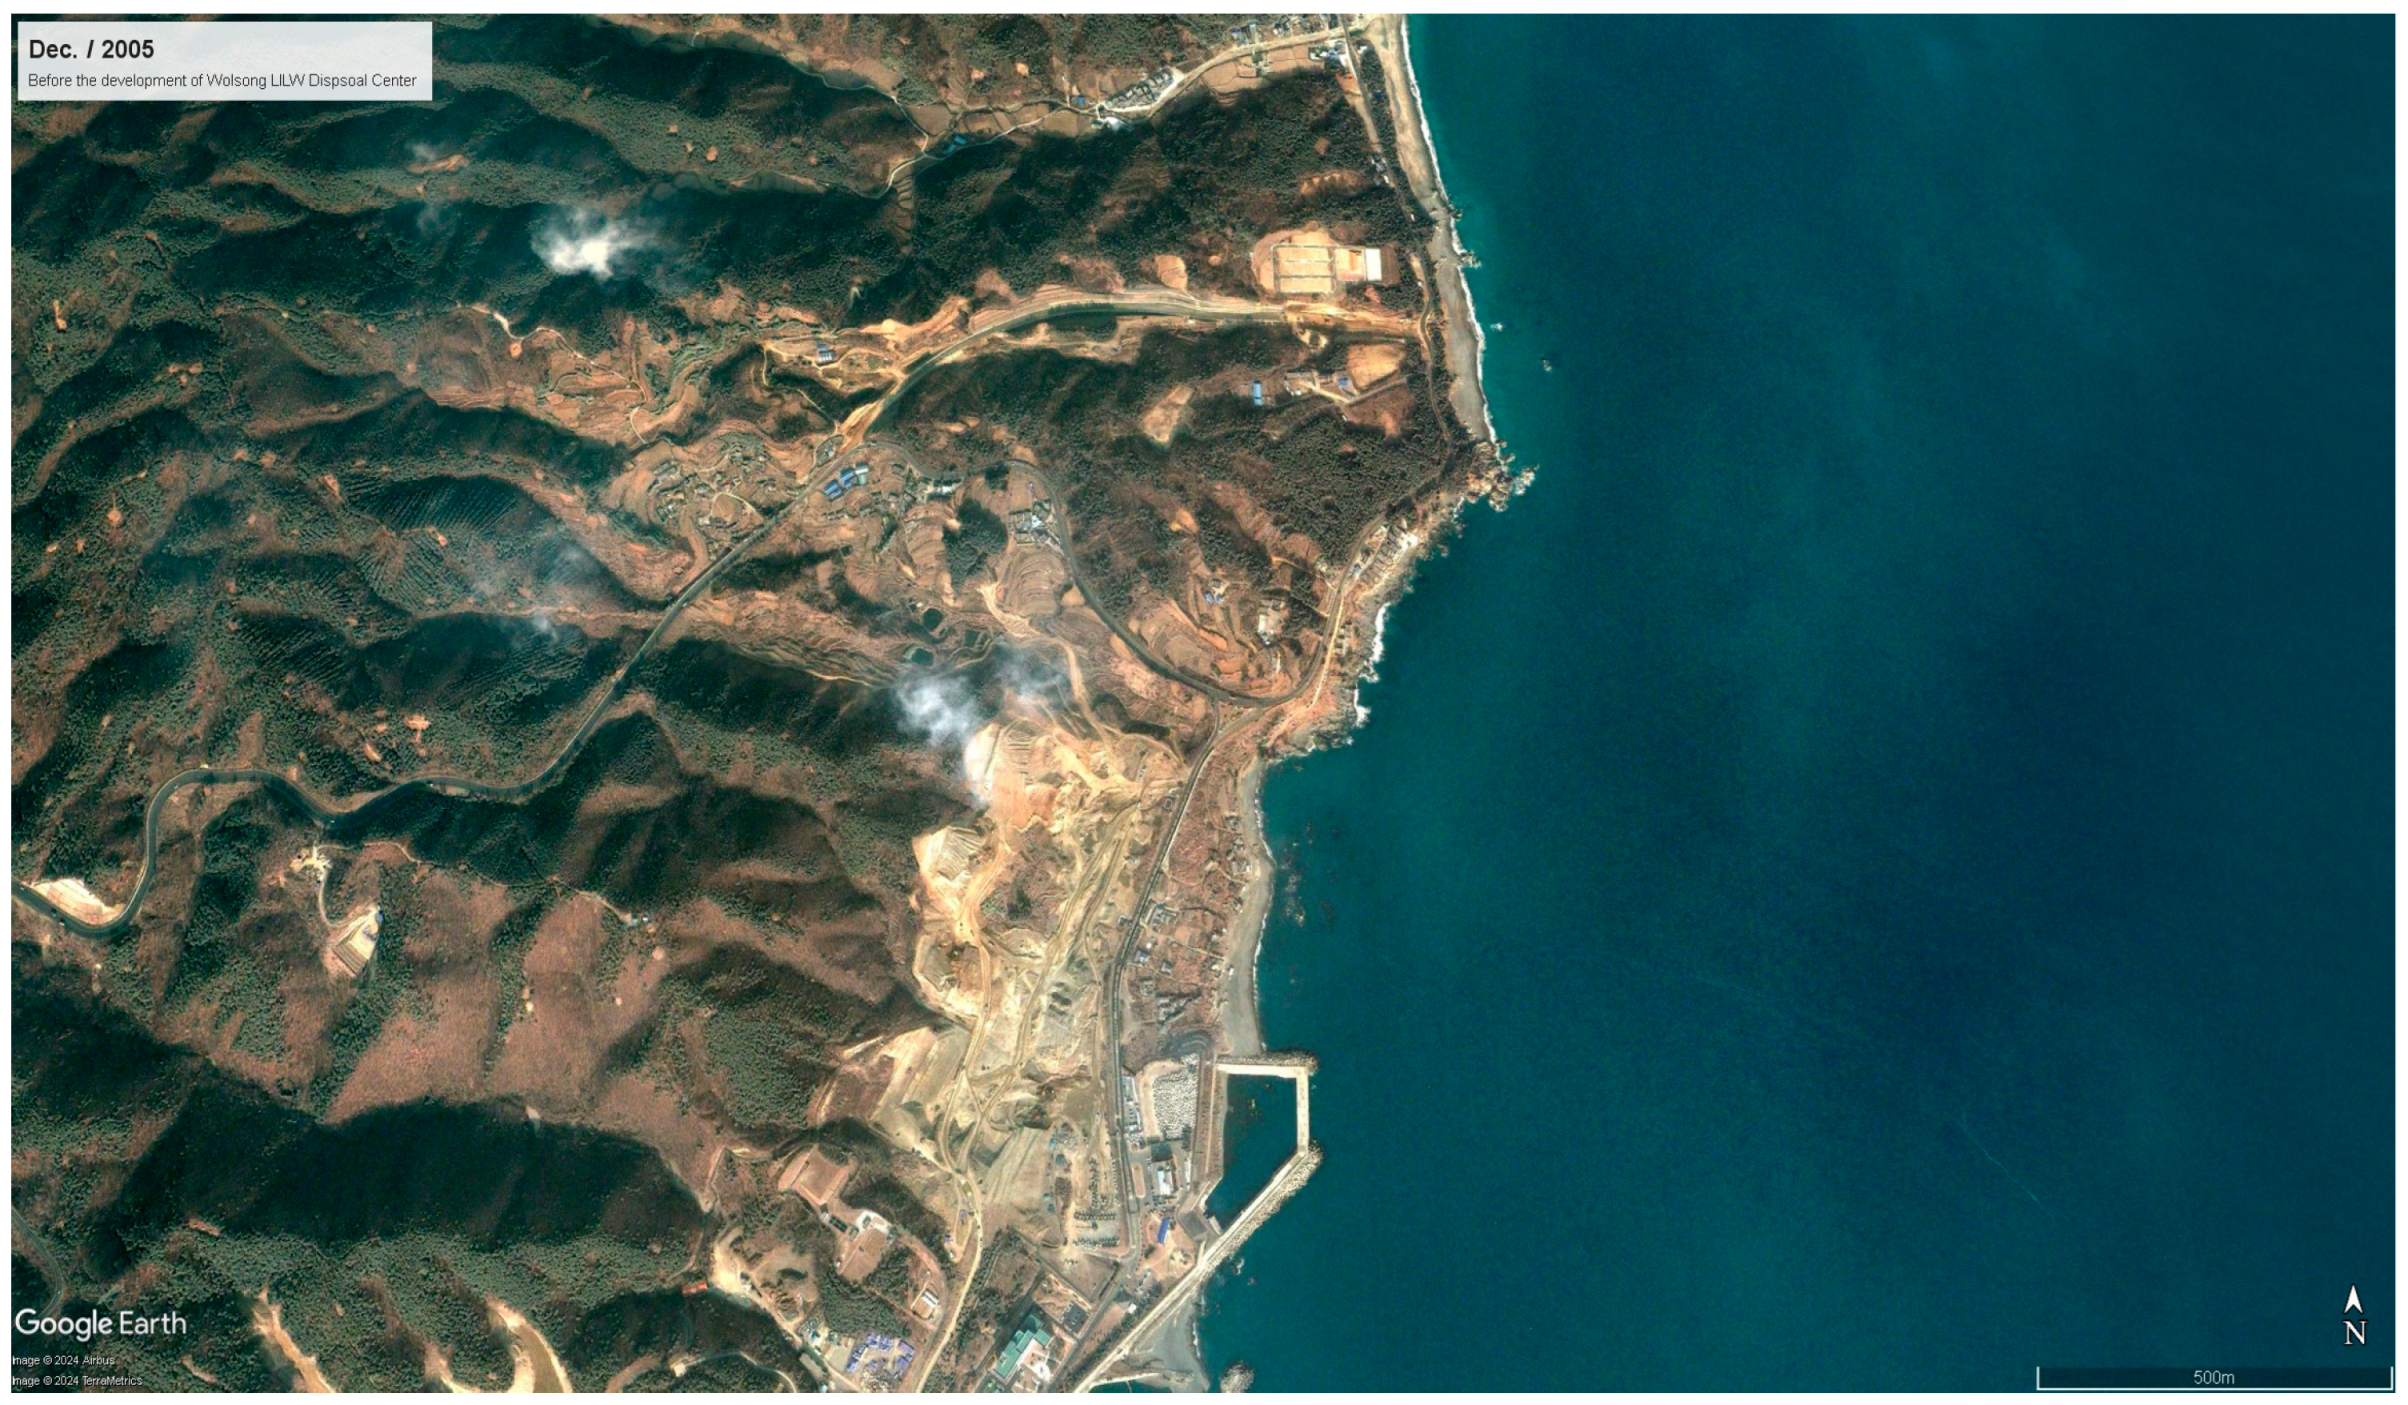
Figure 2.
Aerial photograph of the Wolsong LILW Disposal Center before development (courtesy of Google Earth, 2005).
Figure 2.
Aerial photograph of the Wolsong LILW Disposal Center before development (courtesy of Google Earth, 2005).
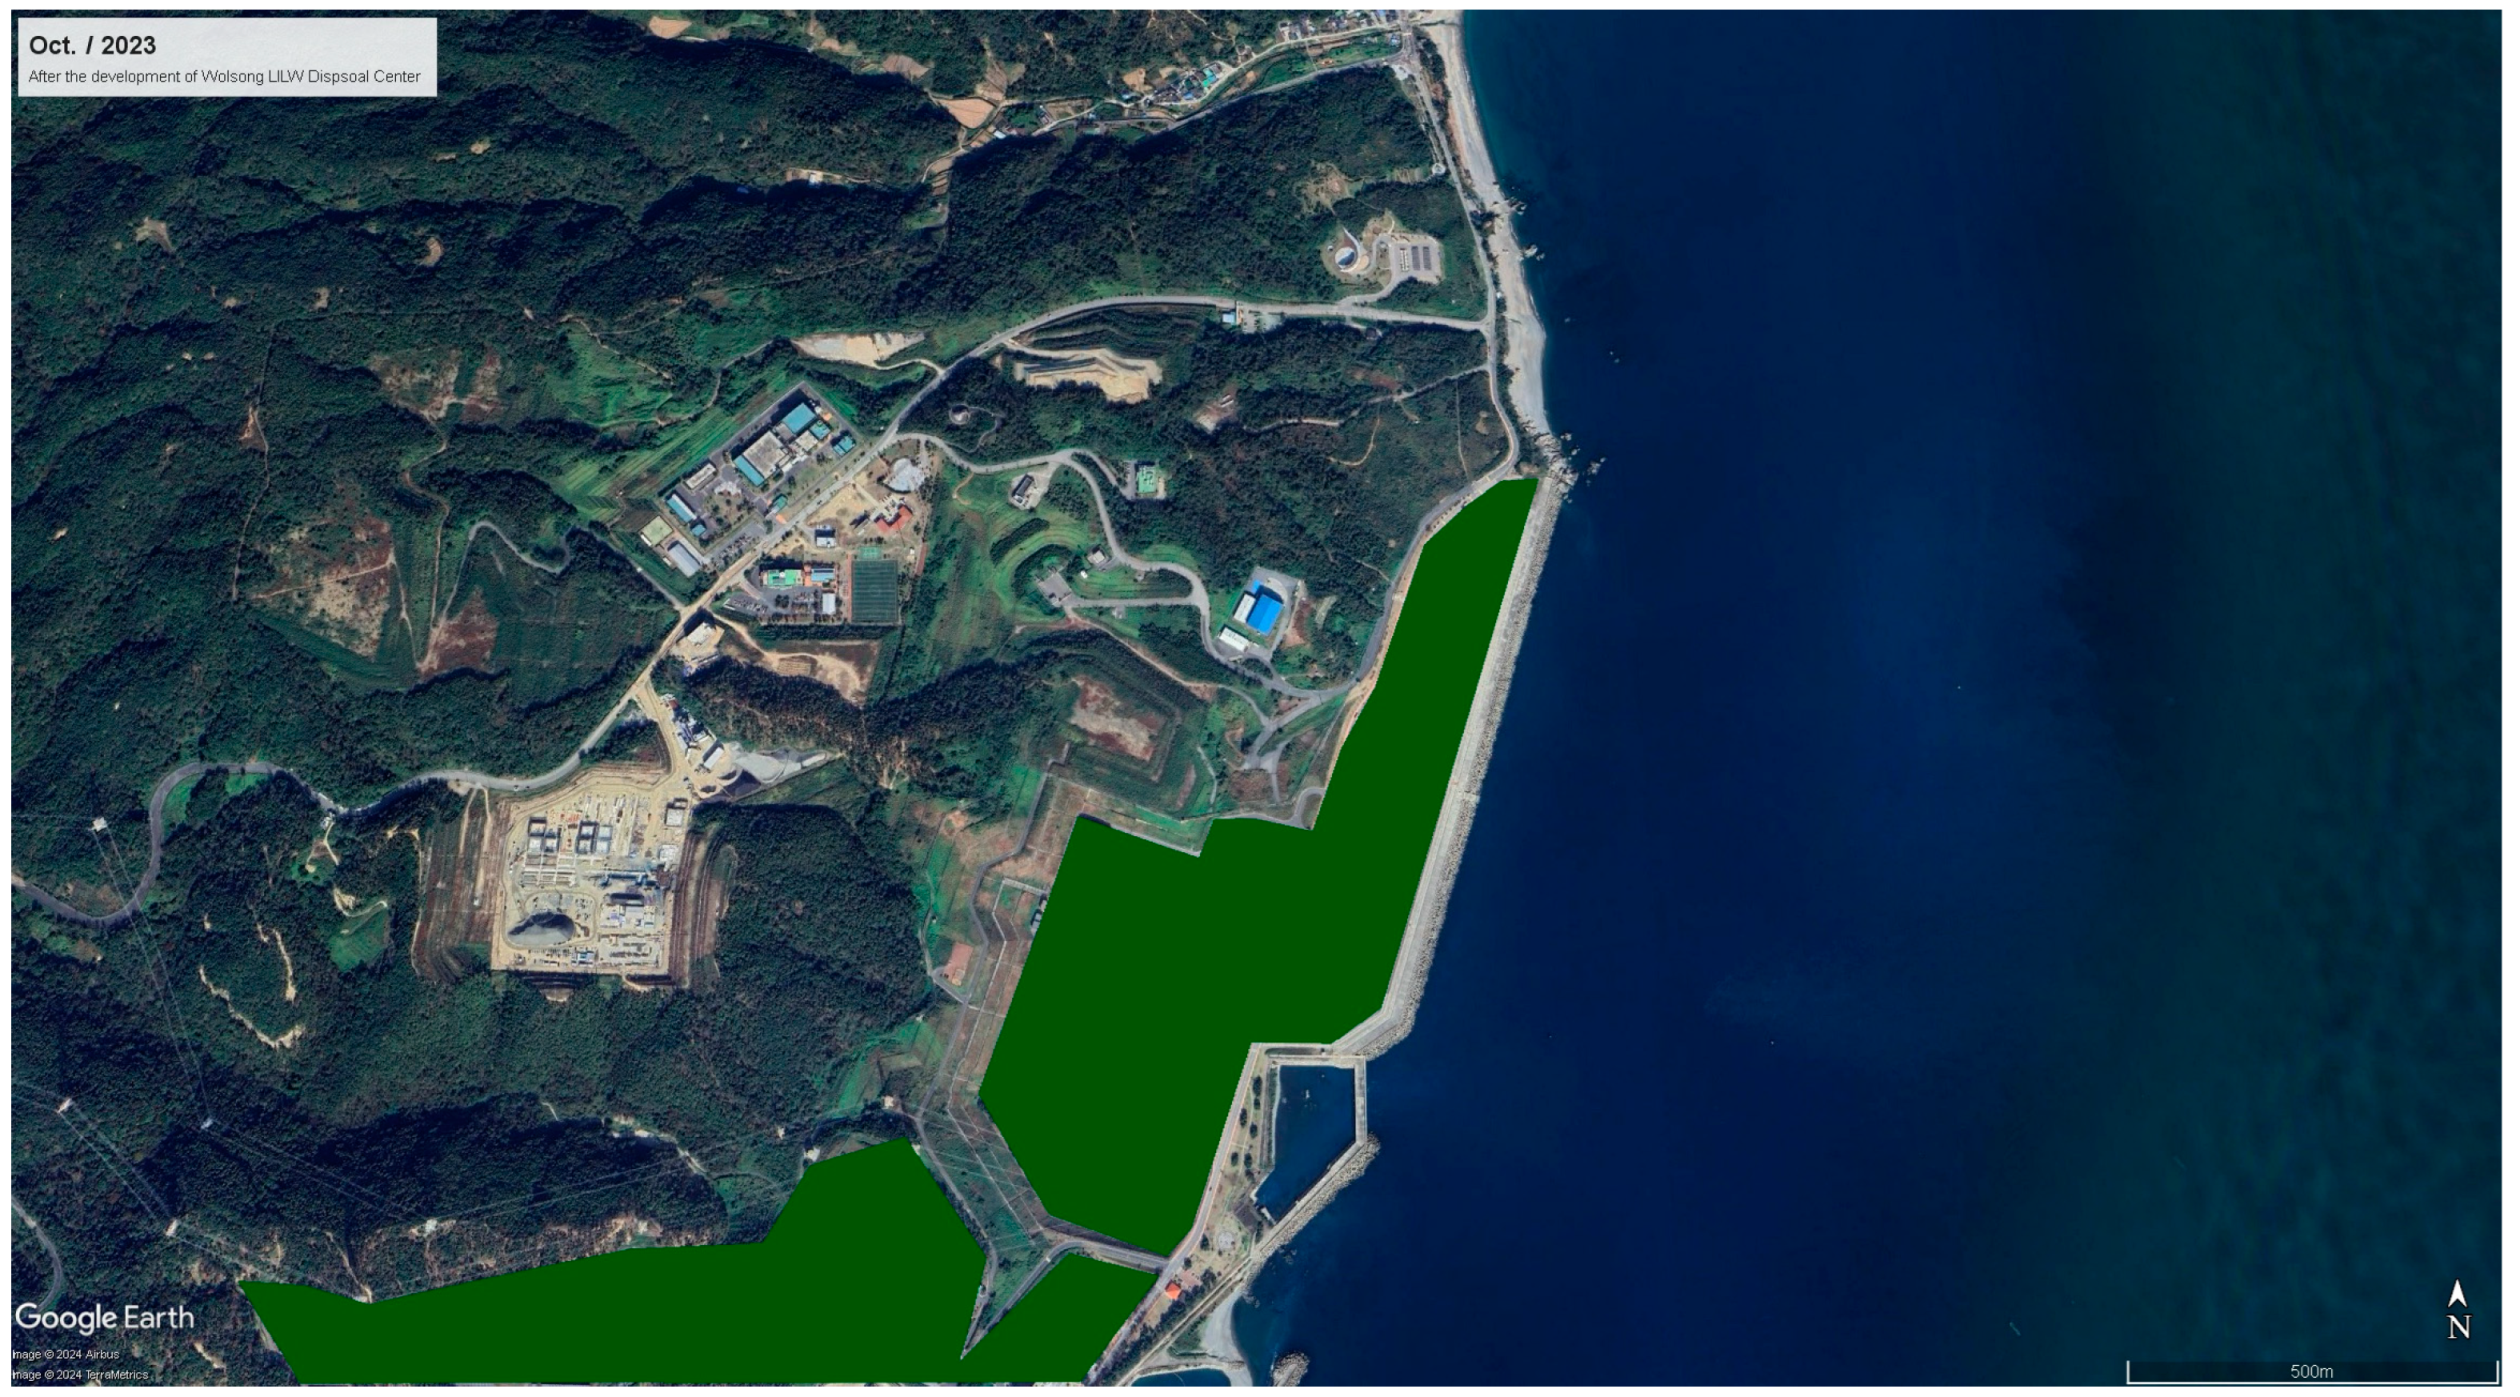
Figure 3.
Aerial photograph of the Wolsong LILW Disposal Center after development (courtesy of Google Earth, 2023).
Figure 3.
Aerial photograph of the Wolsong LILW Disposal Center after development (courtesy of Google Earth, 2023).
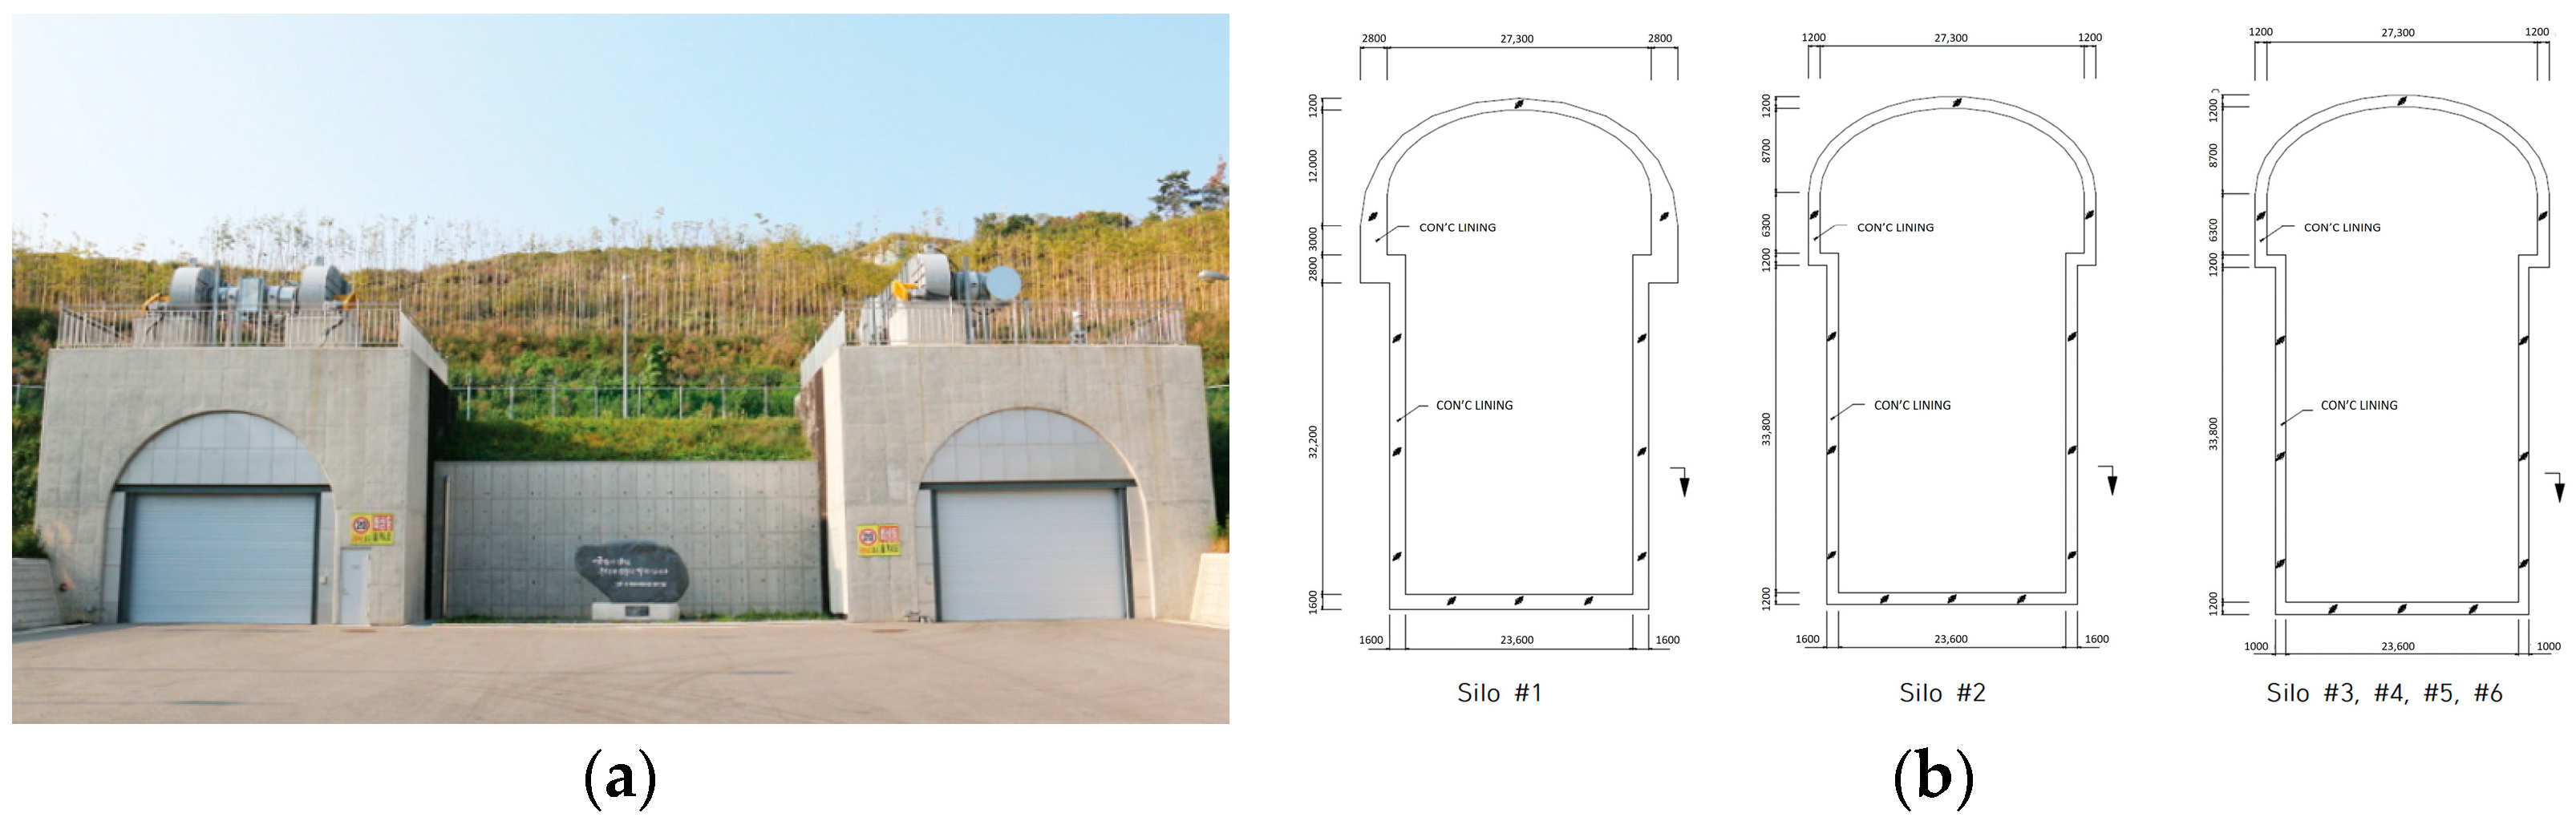
Figure 4.
Phase 1 silo-type facility at Wolsong LILW Disposal Center: (a) entrance view; (b) design layout of disposal silos.
Figure 4.
Phase 1 silo-type facility at Wolsong LILW Disposal Center: (a) entrance view; (b) design layout of disposal silos.
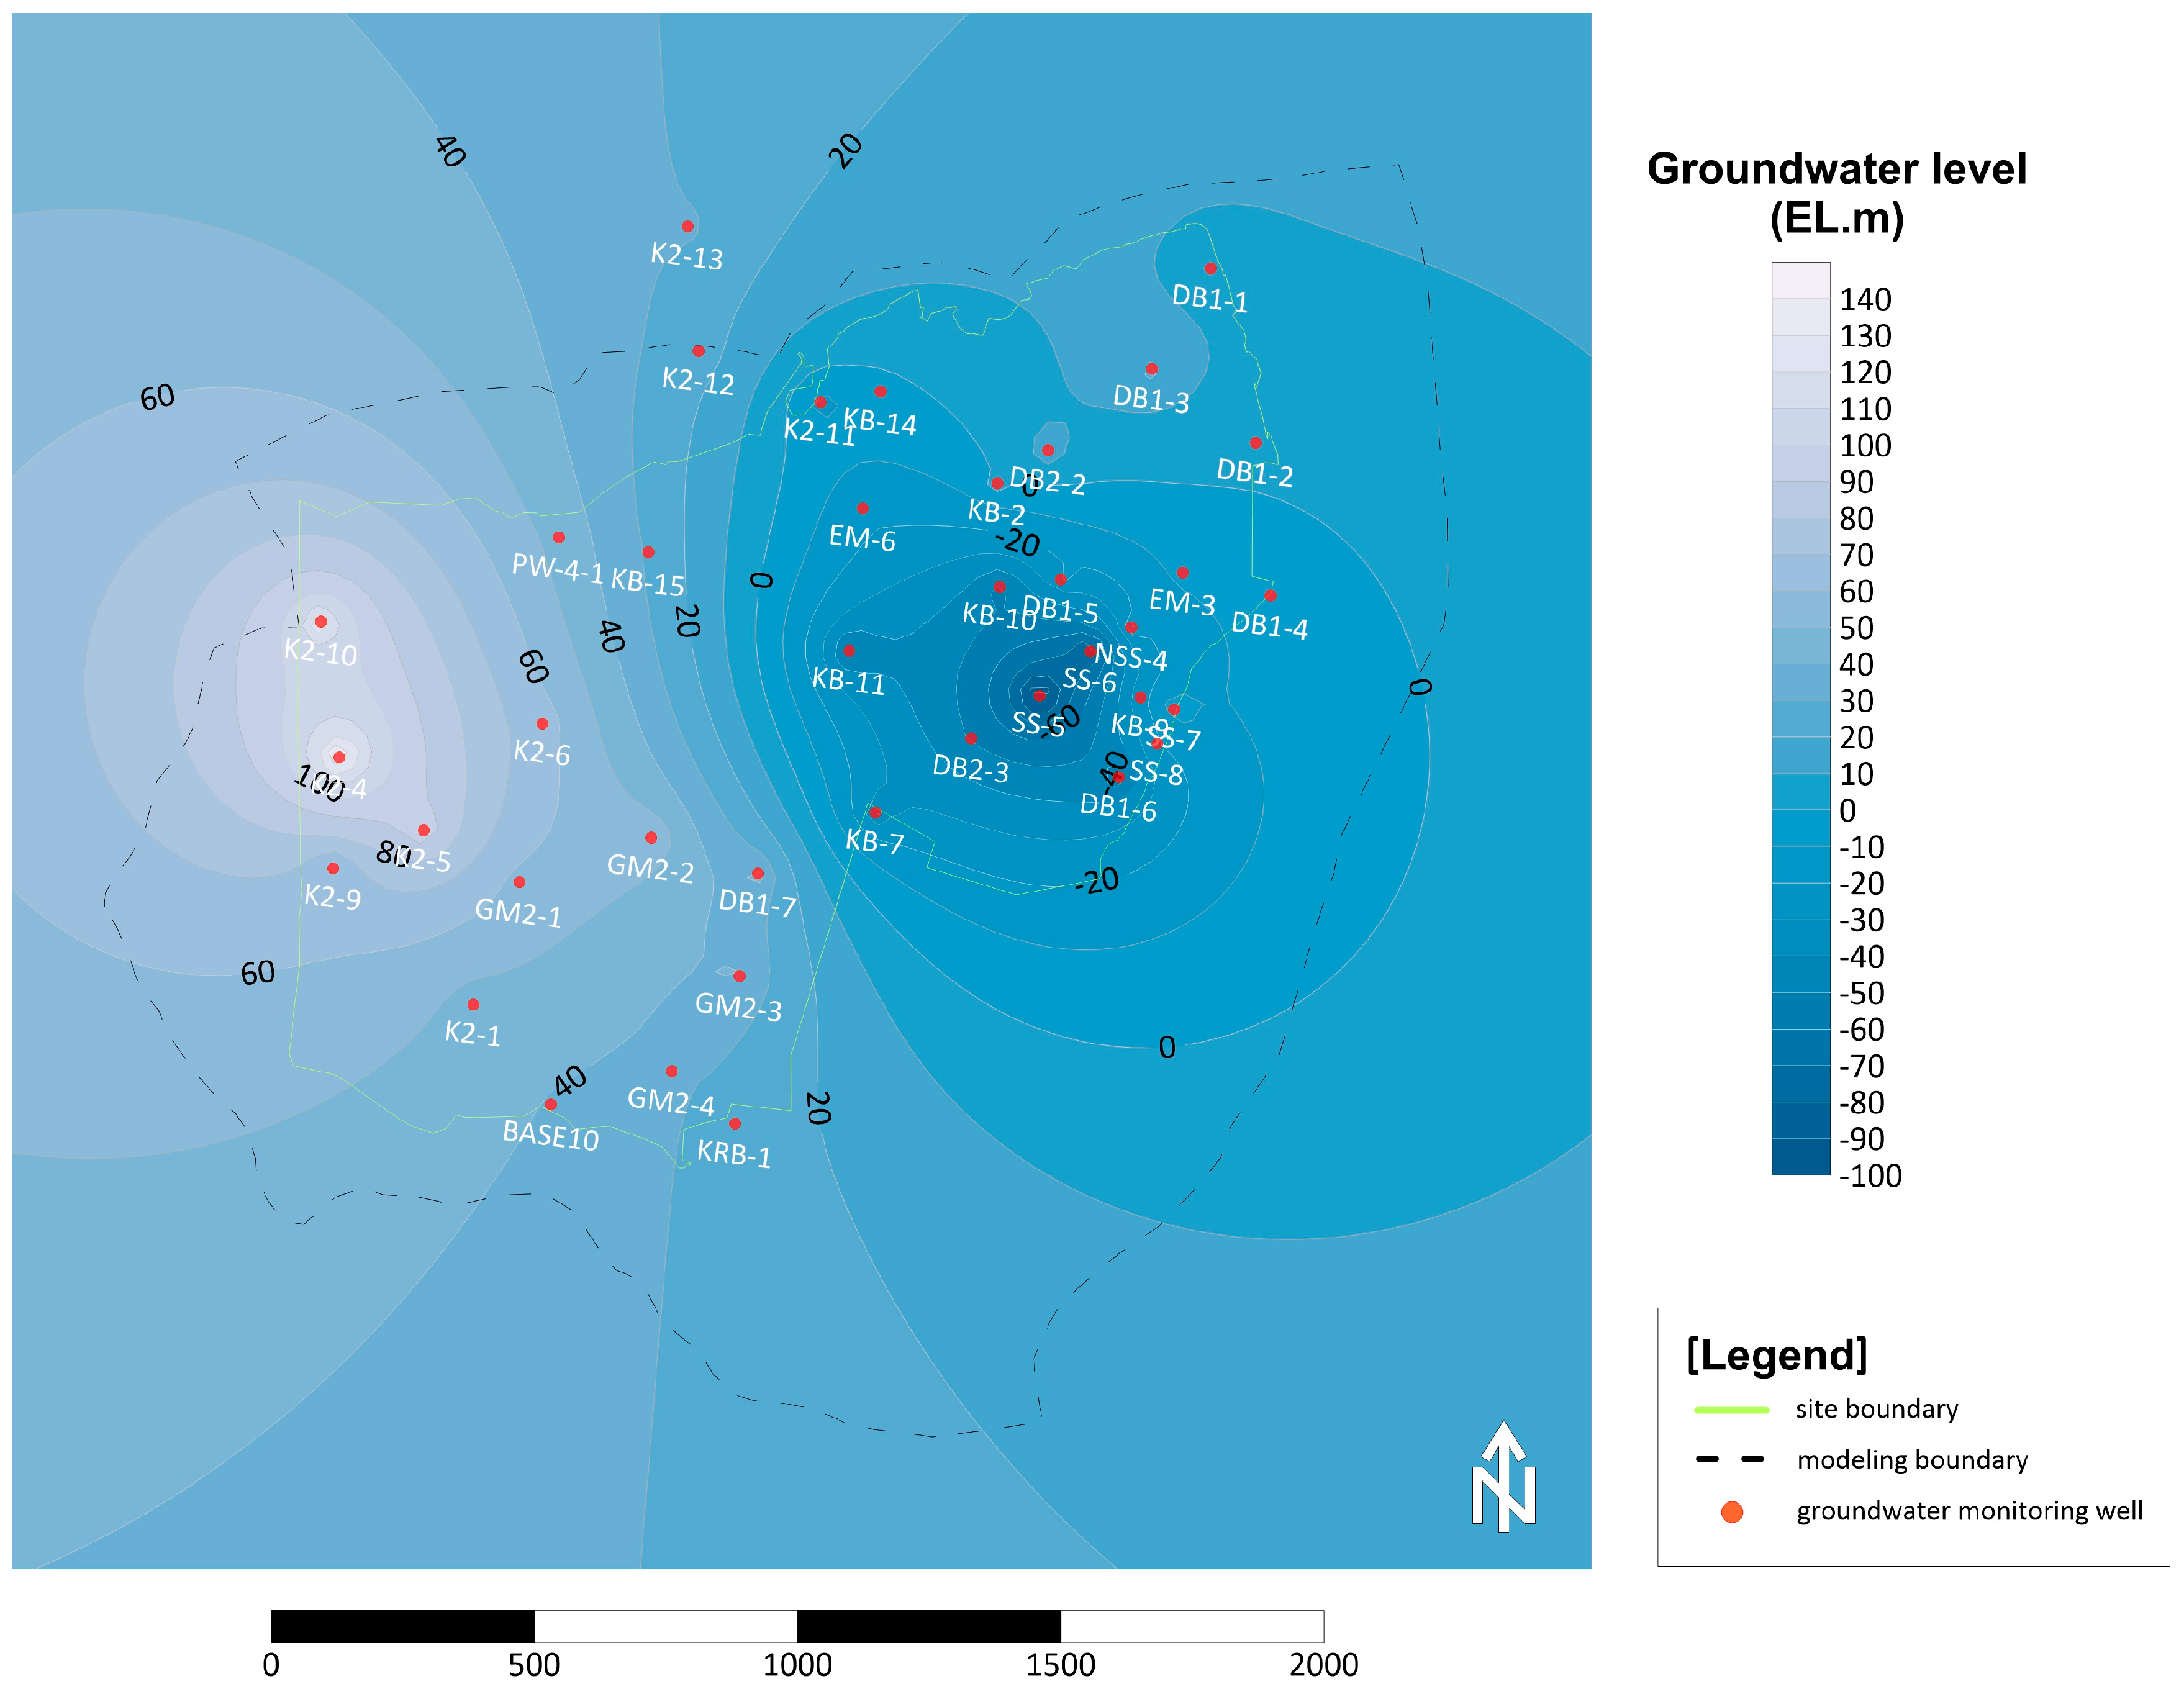
Figure 5.
Groundwater level distribution at the Wolsong LILW Disposal Center site.
Figure 5.
Groundwater level distribution at the Wolsong LILW Disposal Center site.
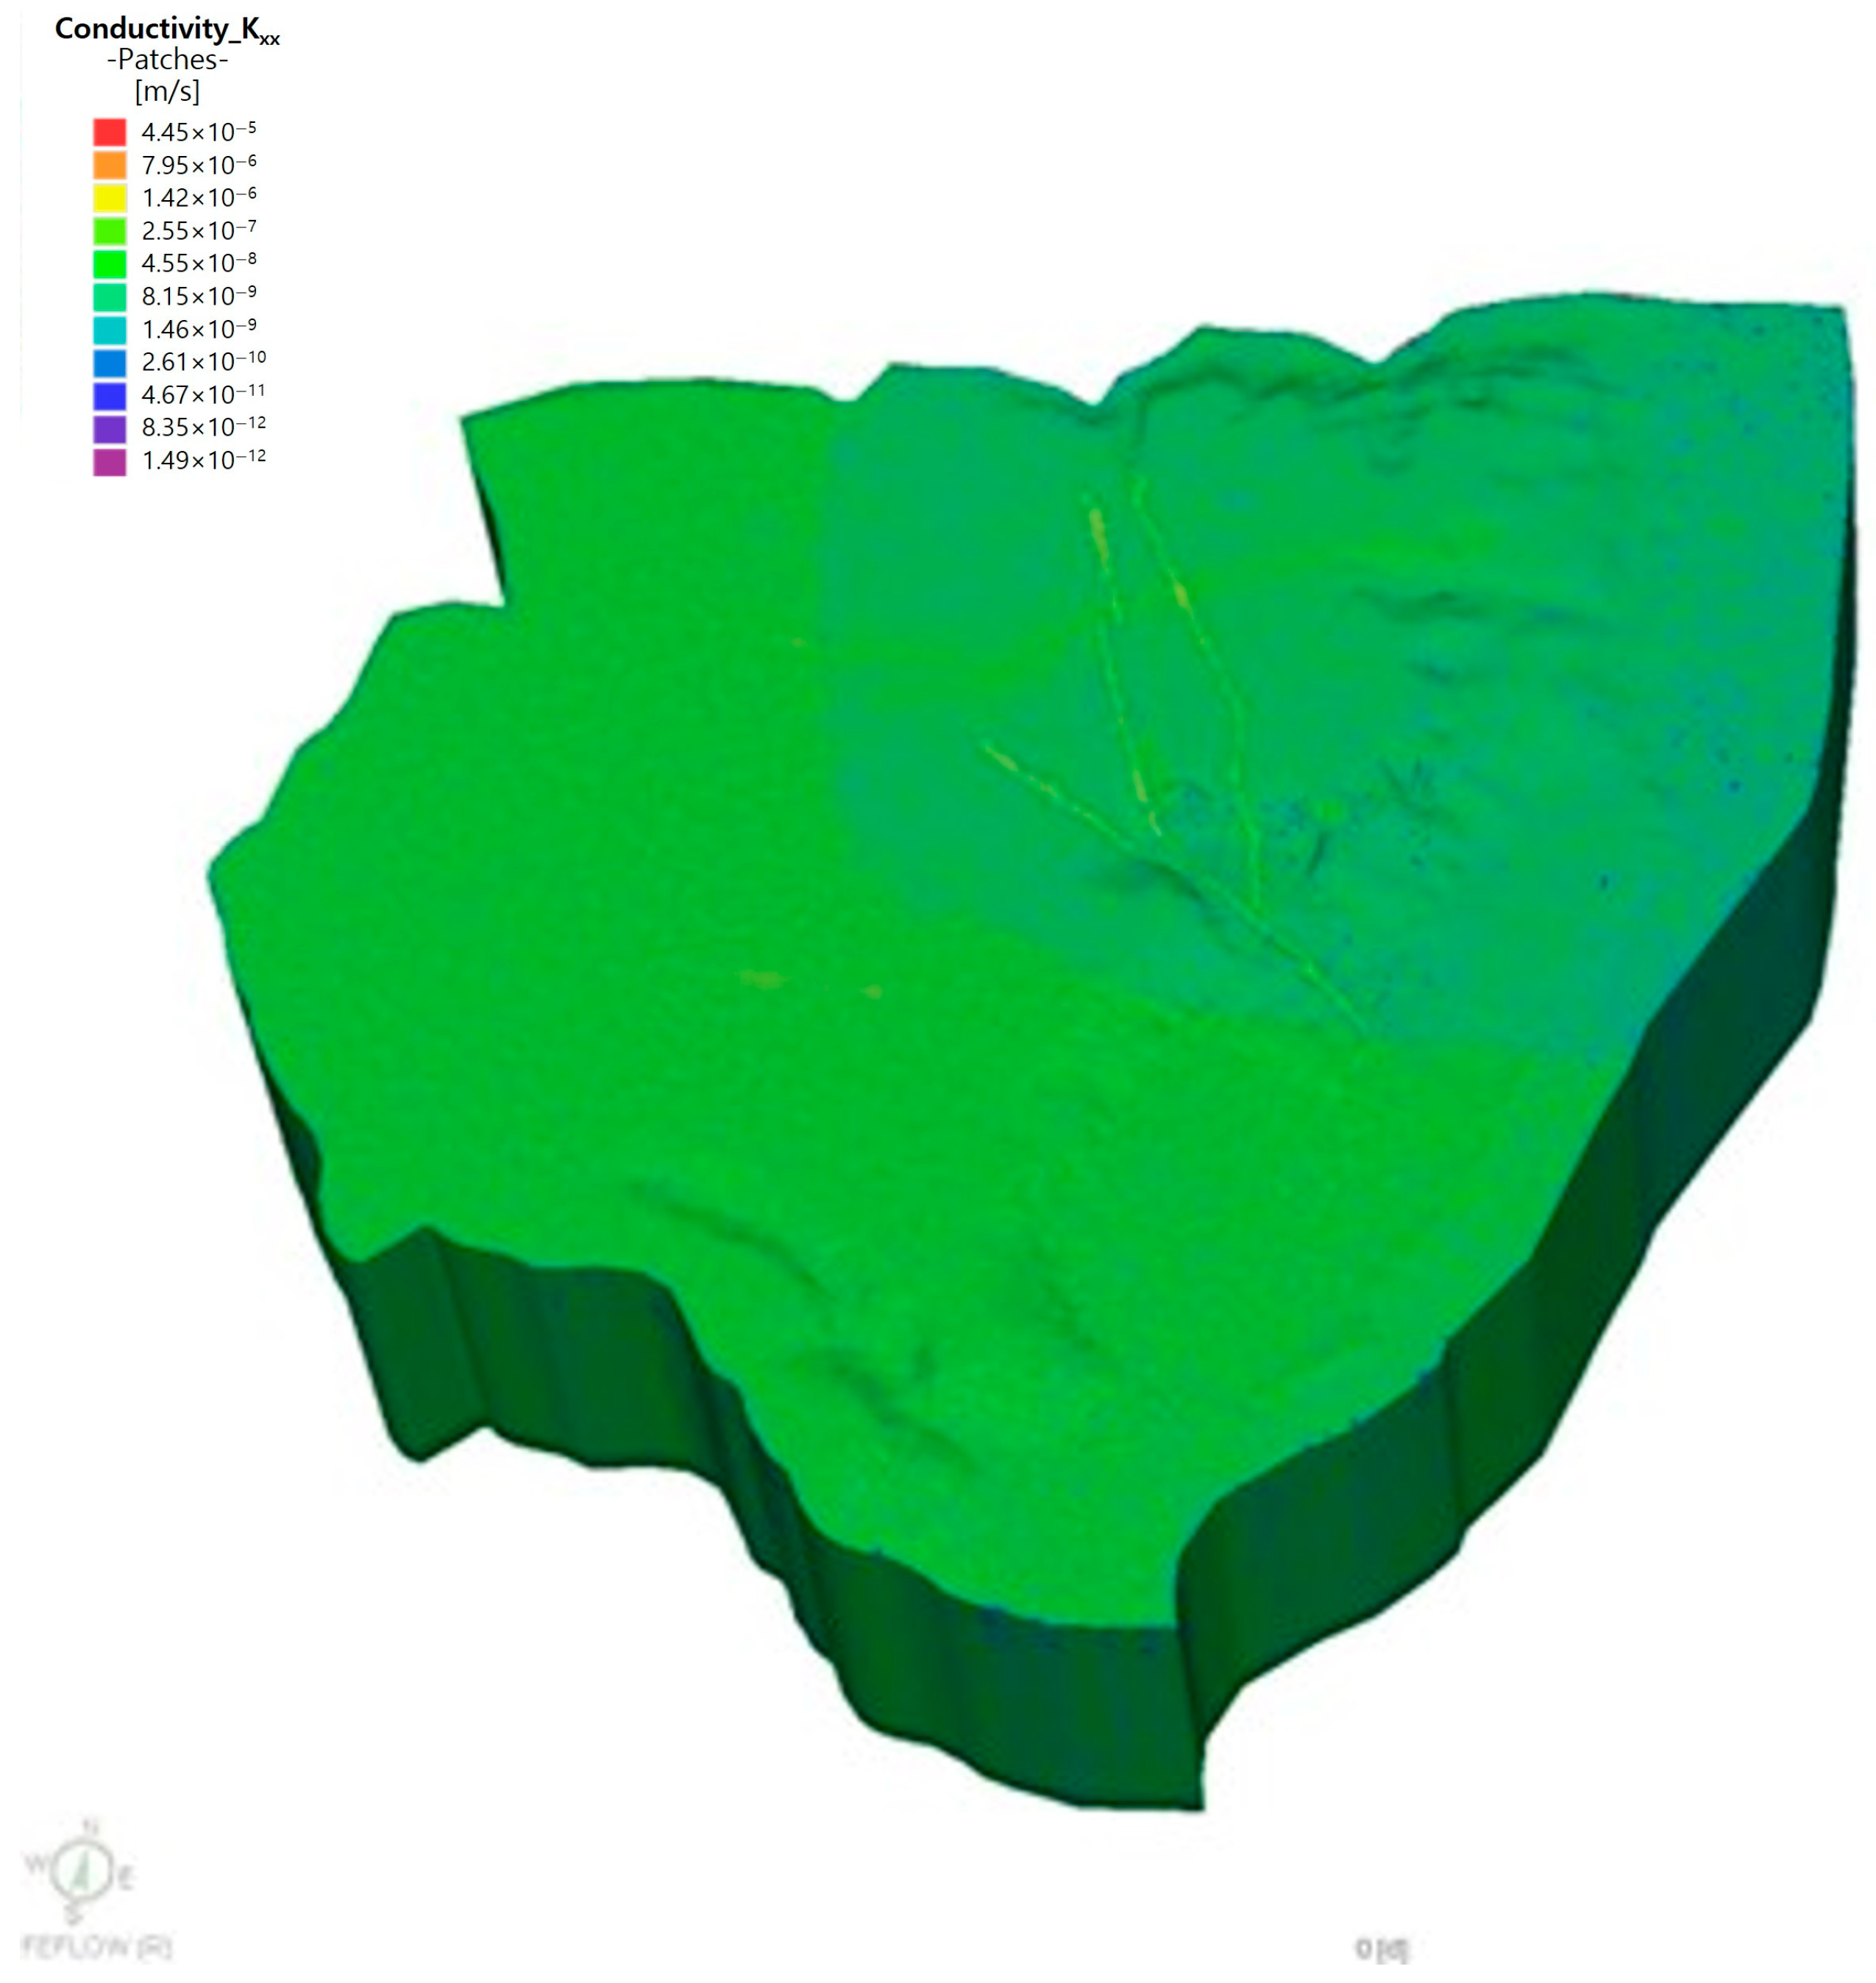
Figure 6.
Spatial distribution of hydraulic conductivity (Kxx) derived from DFN modeling at the Wolsong LILW Disposal Center site.
Figure 6.
Spatial distribution of hydraulic conductivity (Kxx) derived from DFN modeling at the Wolsong LILW Disposal Center site.
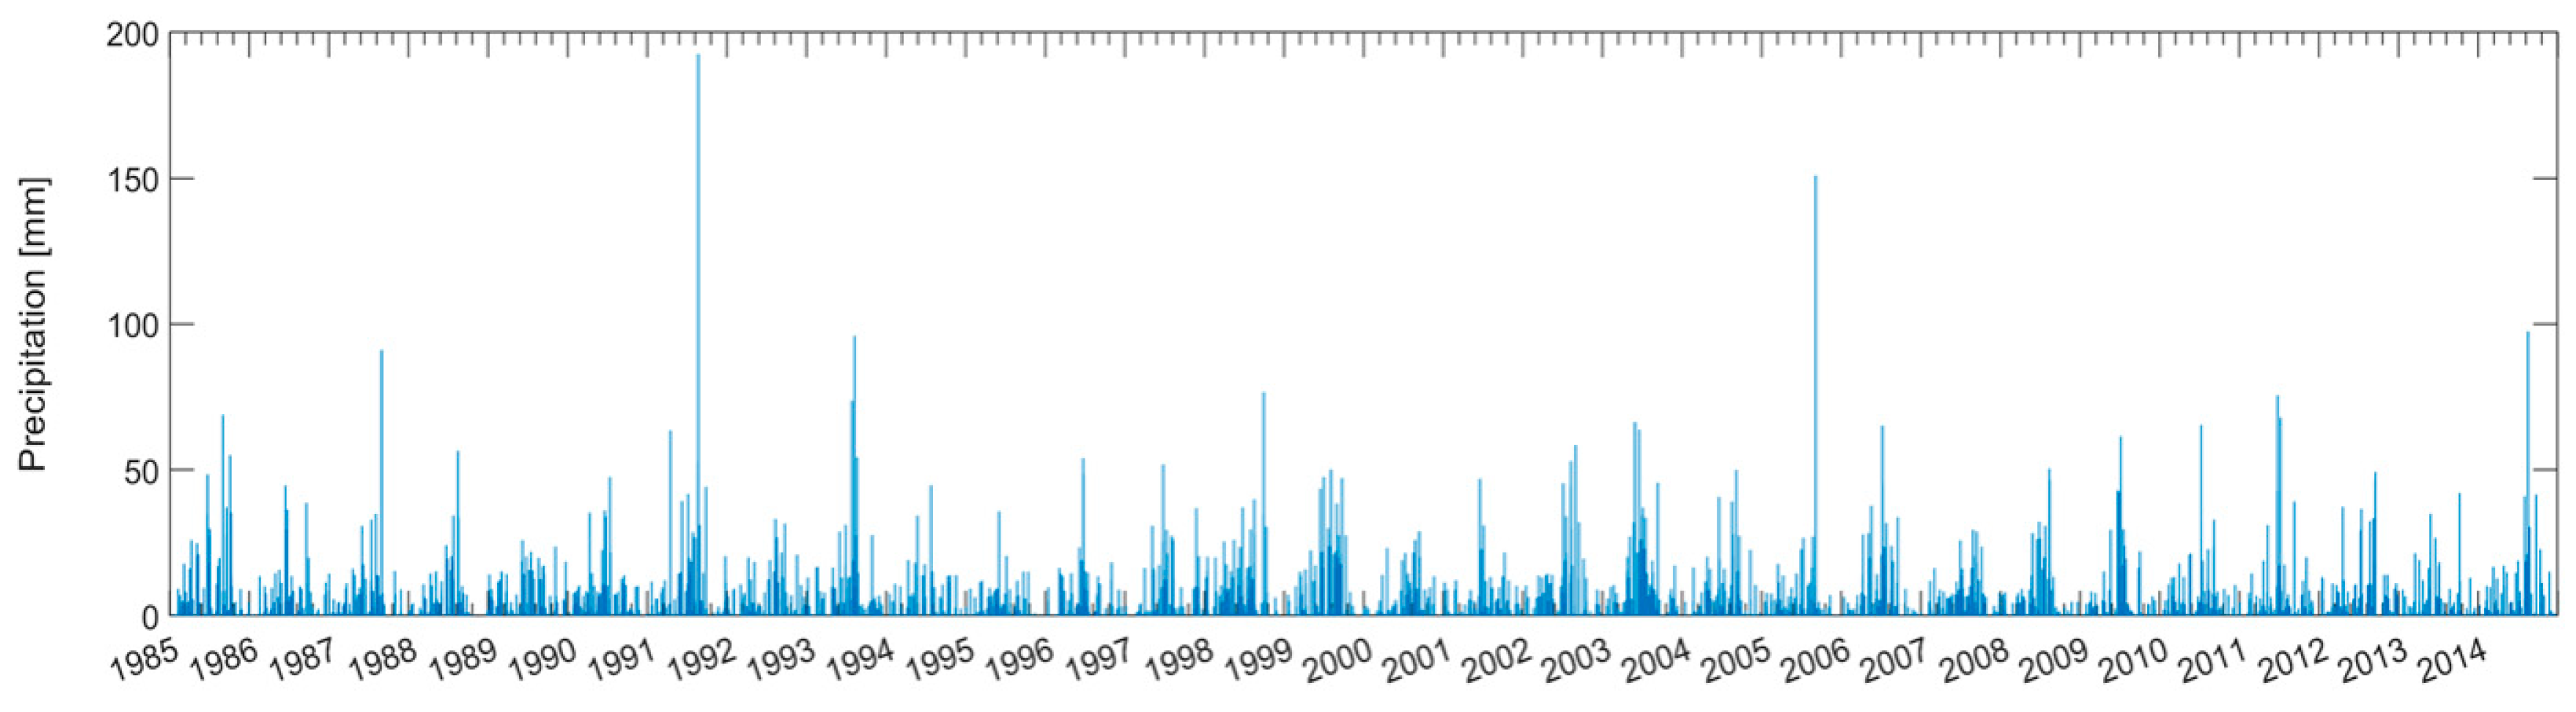
Figure 7.
The 30-year climate normal (1985–2014) for the Ulsan weather station.
Figure 7.
The 30-year climate normal (1985–2014) for the Ulsan weather station.
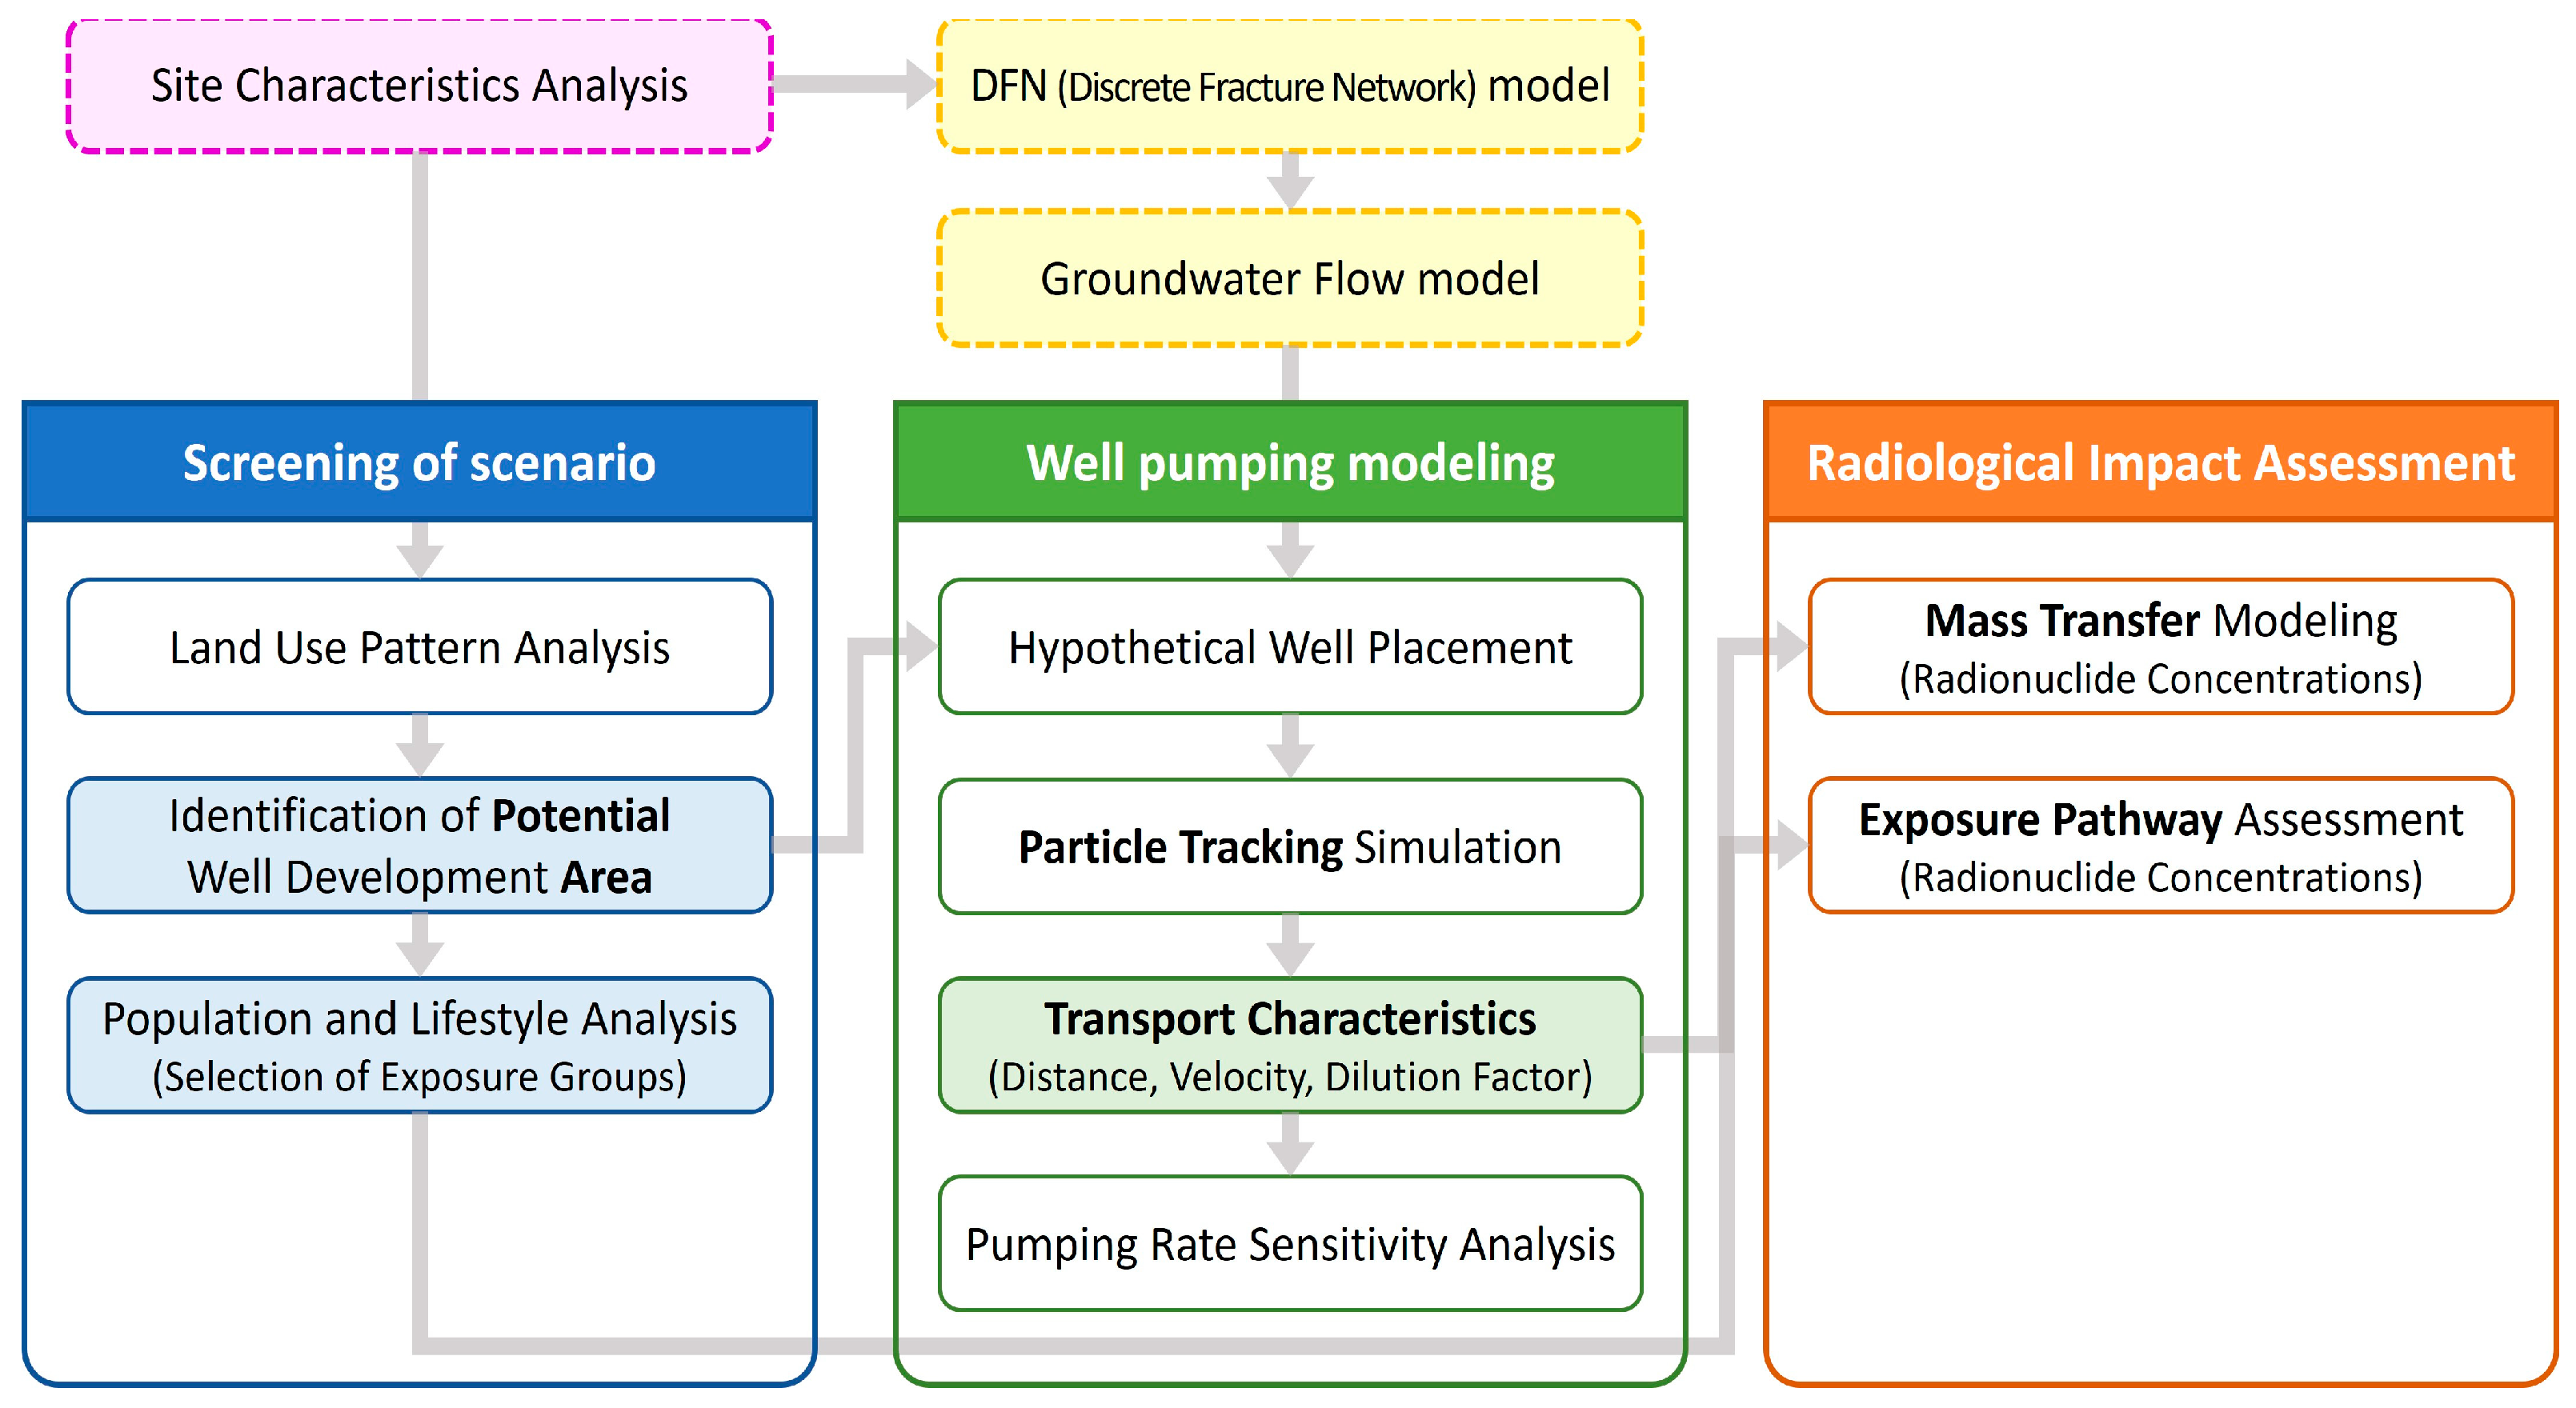
Figure 8.
Methodological framework for the safety assessment of human intrusion scenarios.
Figure 8.
Methodological framework for the safety assessment of human intrusion scenarios.
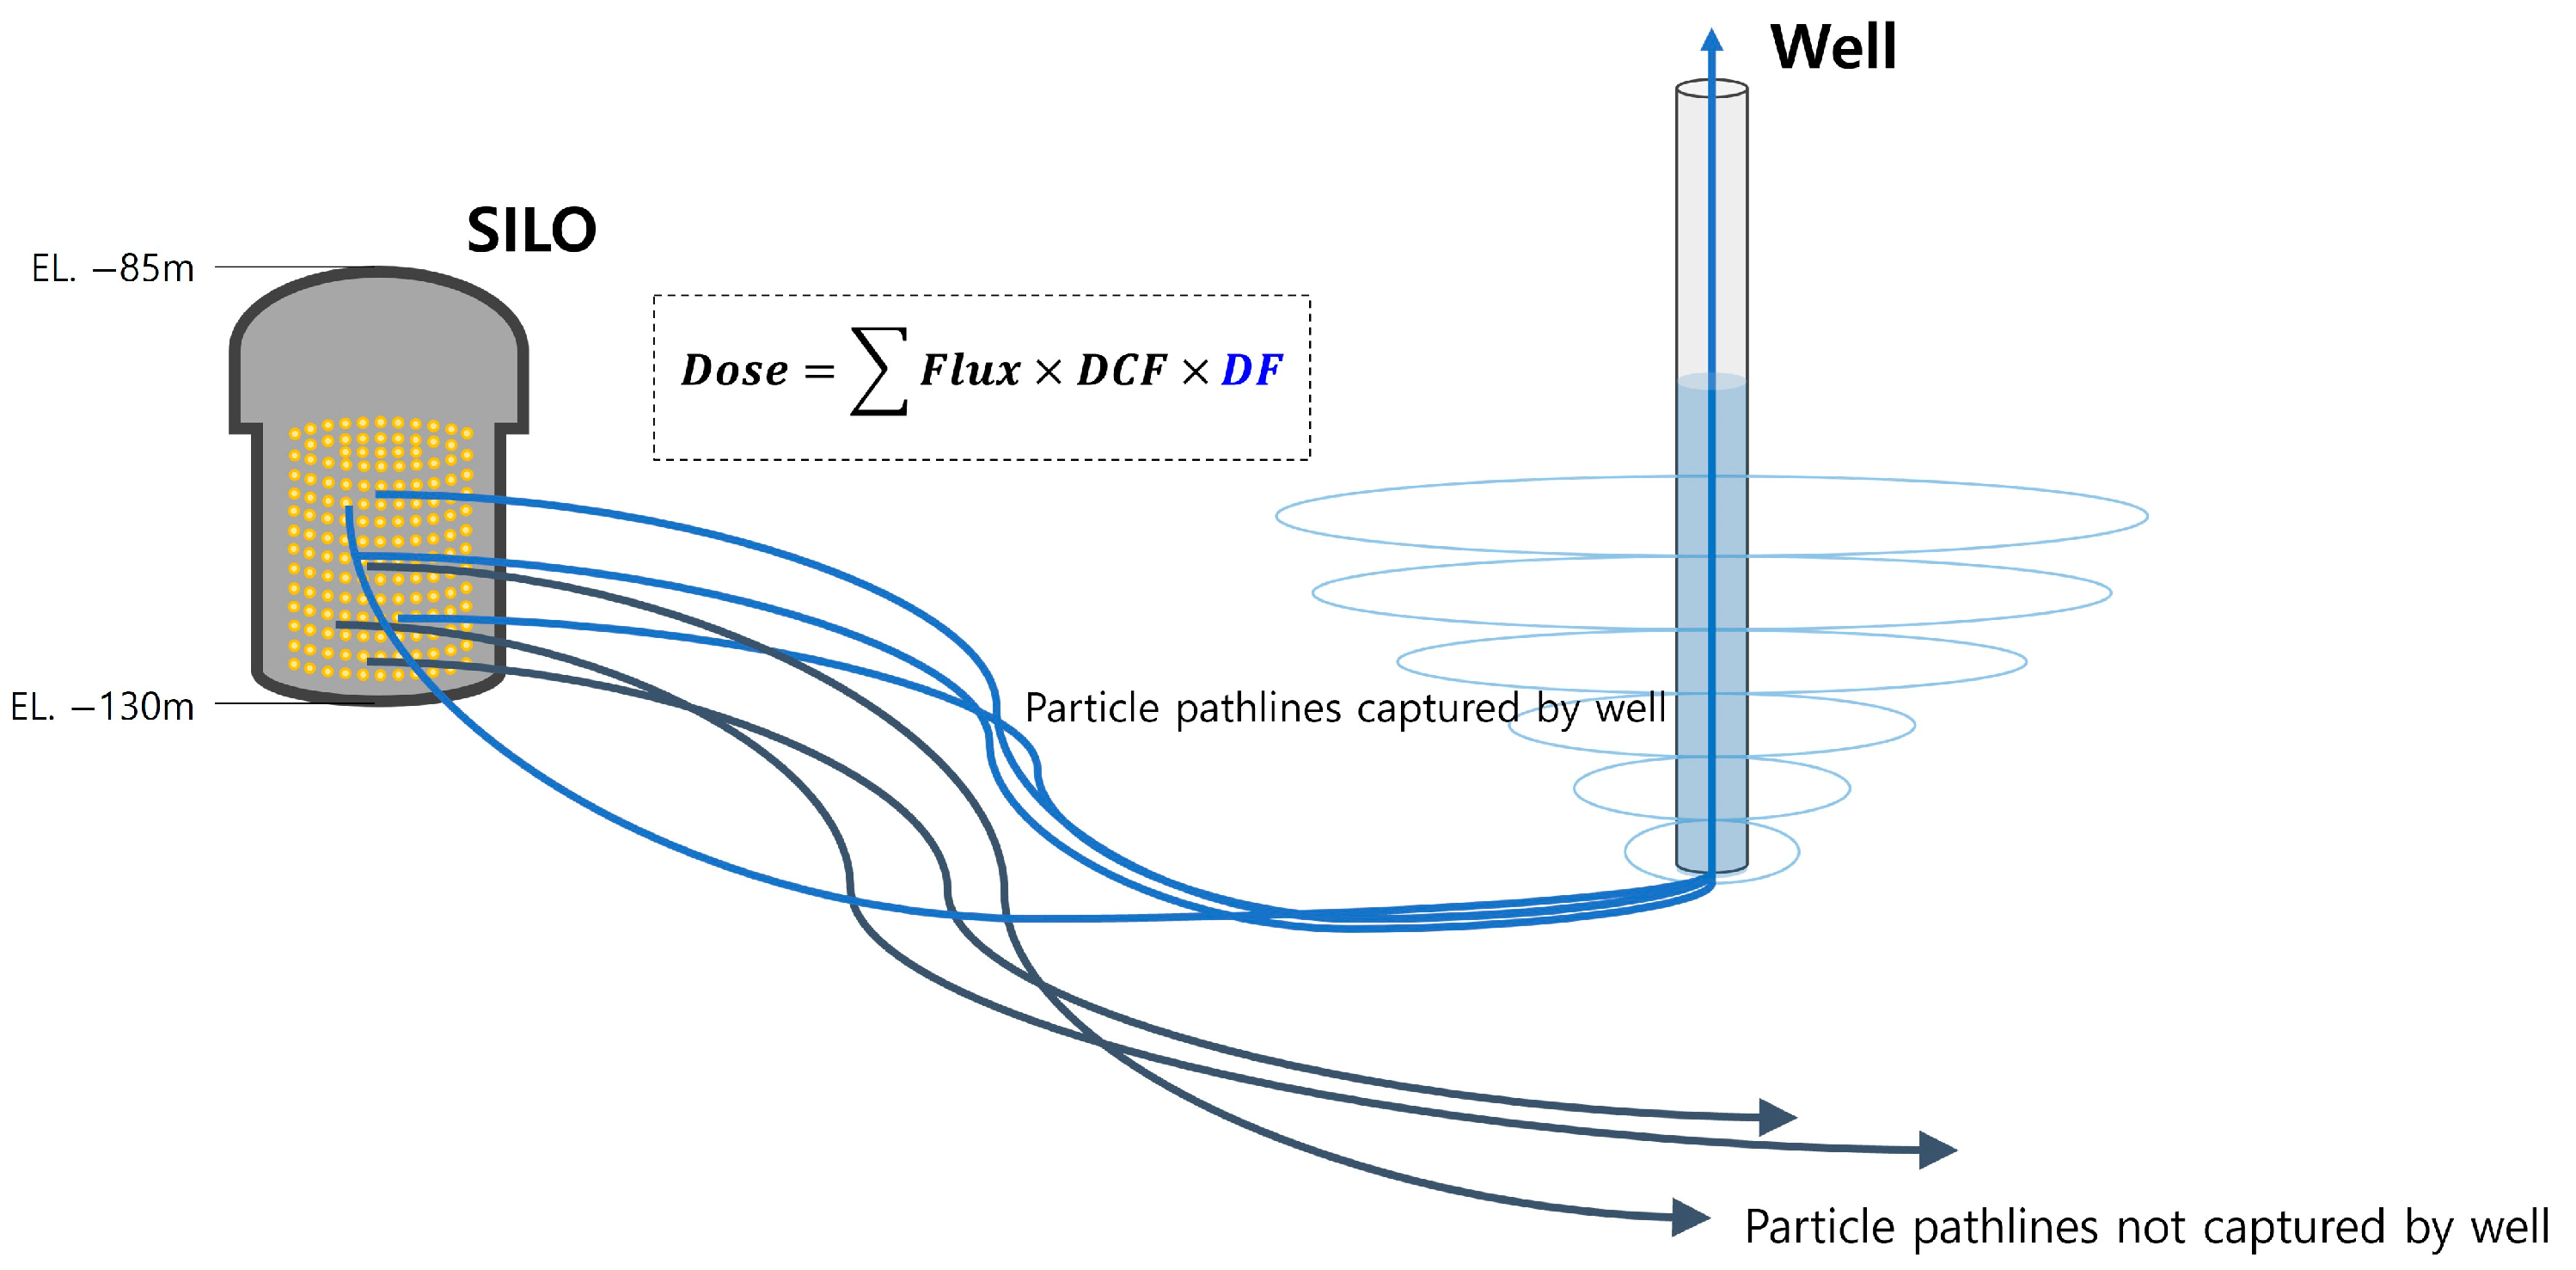
Figure 9.
Conceptual model for predicting dilution factors in well scenarios.
Figure 9.
Conceptual model for predicting dilution factors in well scenarios.
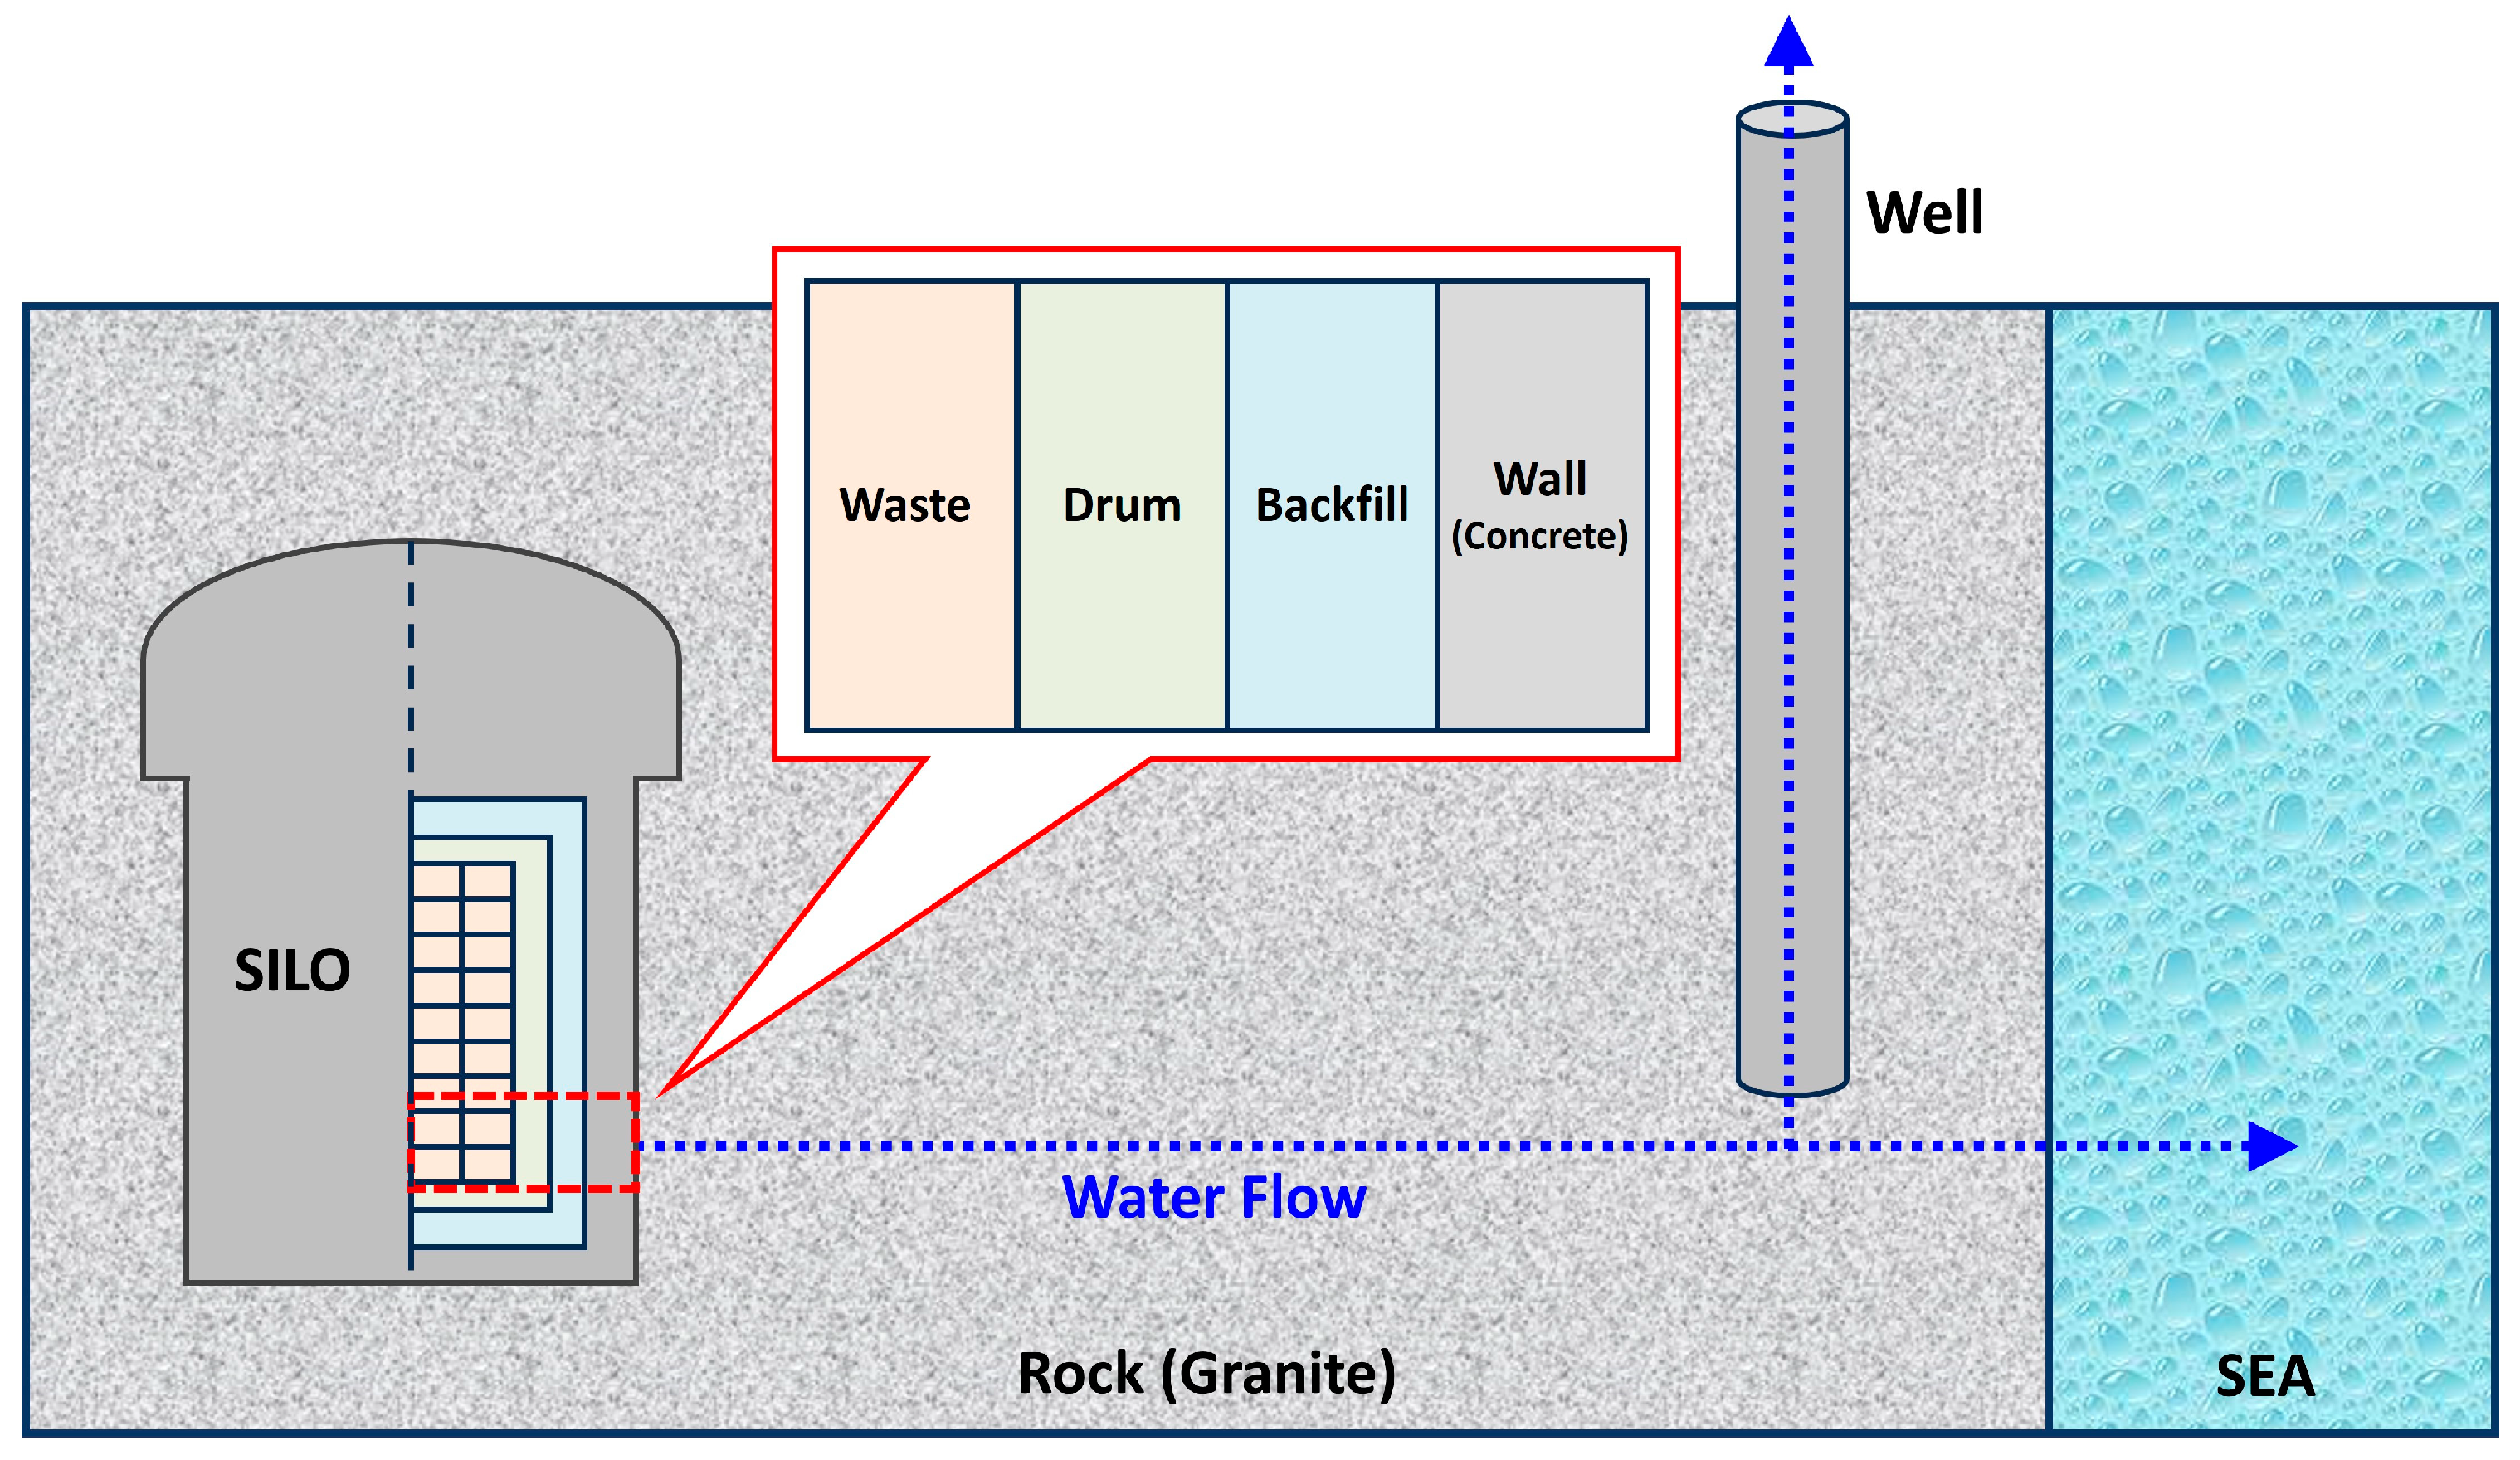
Figure 10.
Conceptual model of radionuclide migration in Phase 1 silo-type disposal facility.
Figure 10.
Conceptual model of radionuclide migration in Phase 1 silo-type disposal facility.
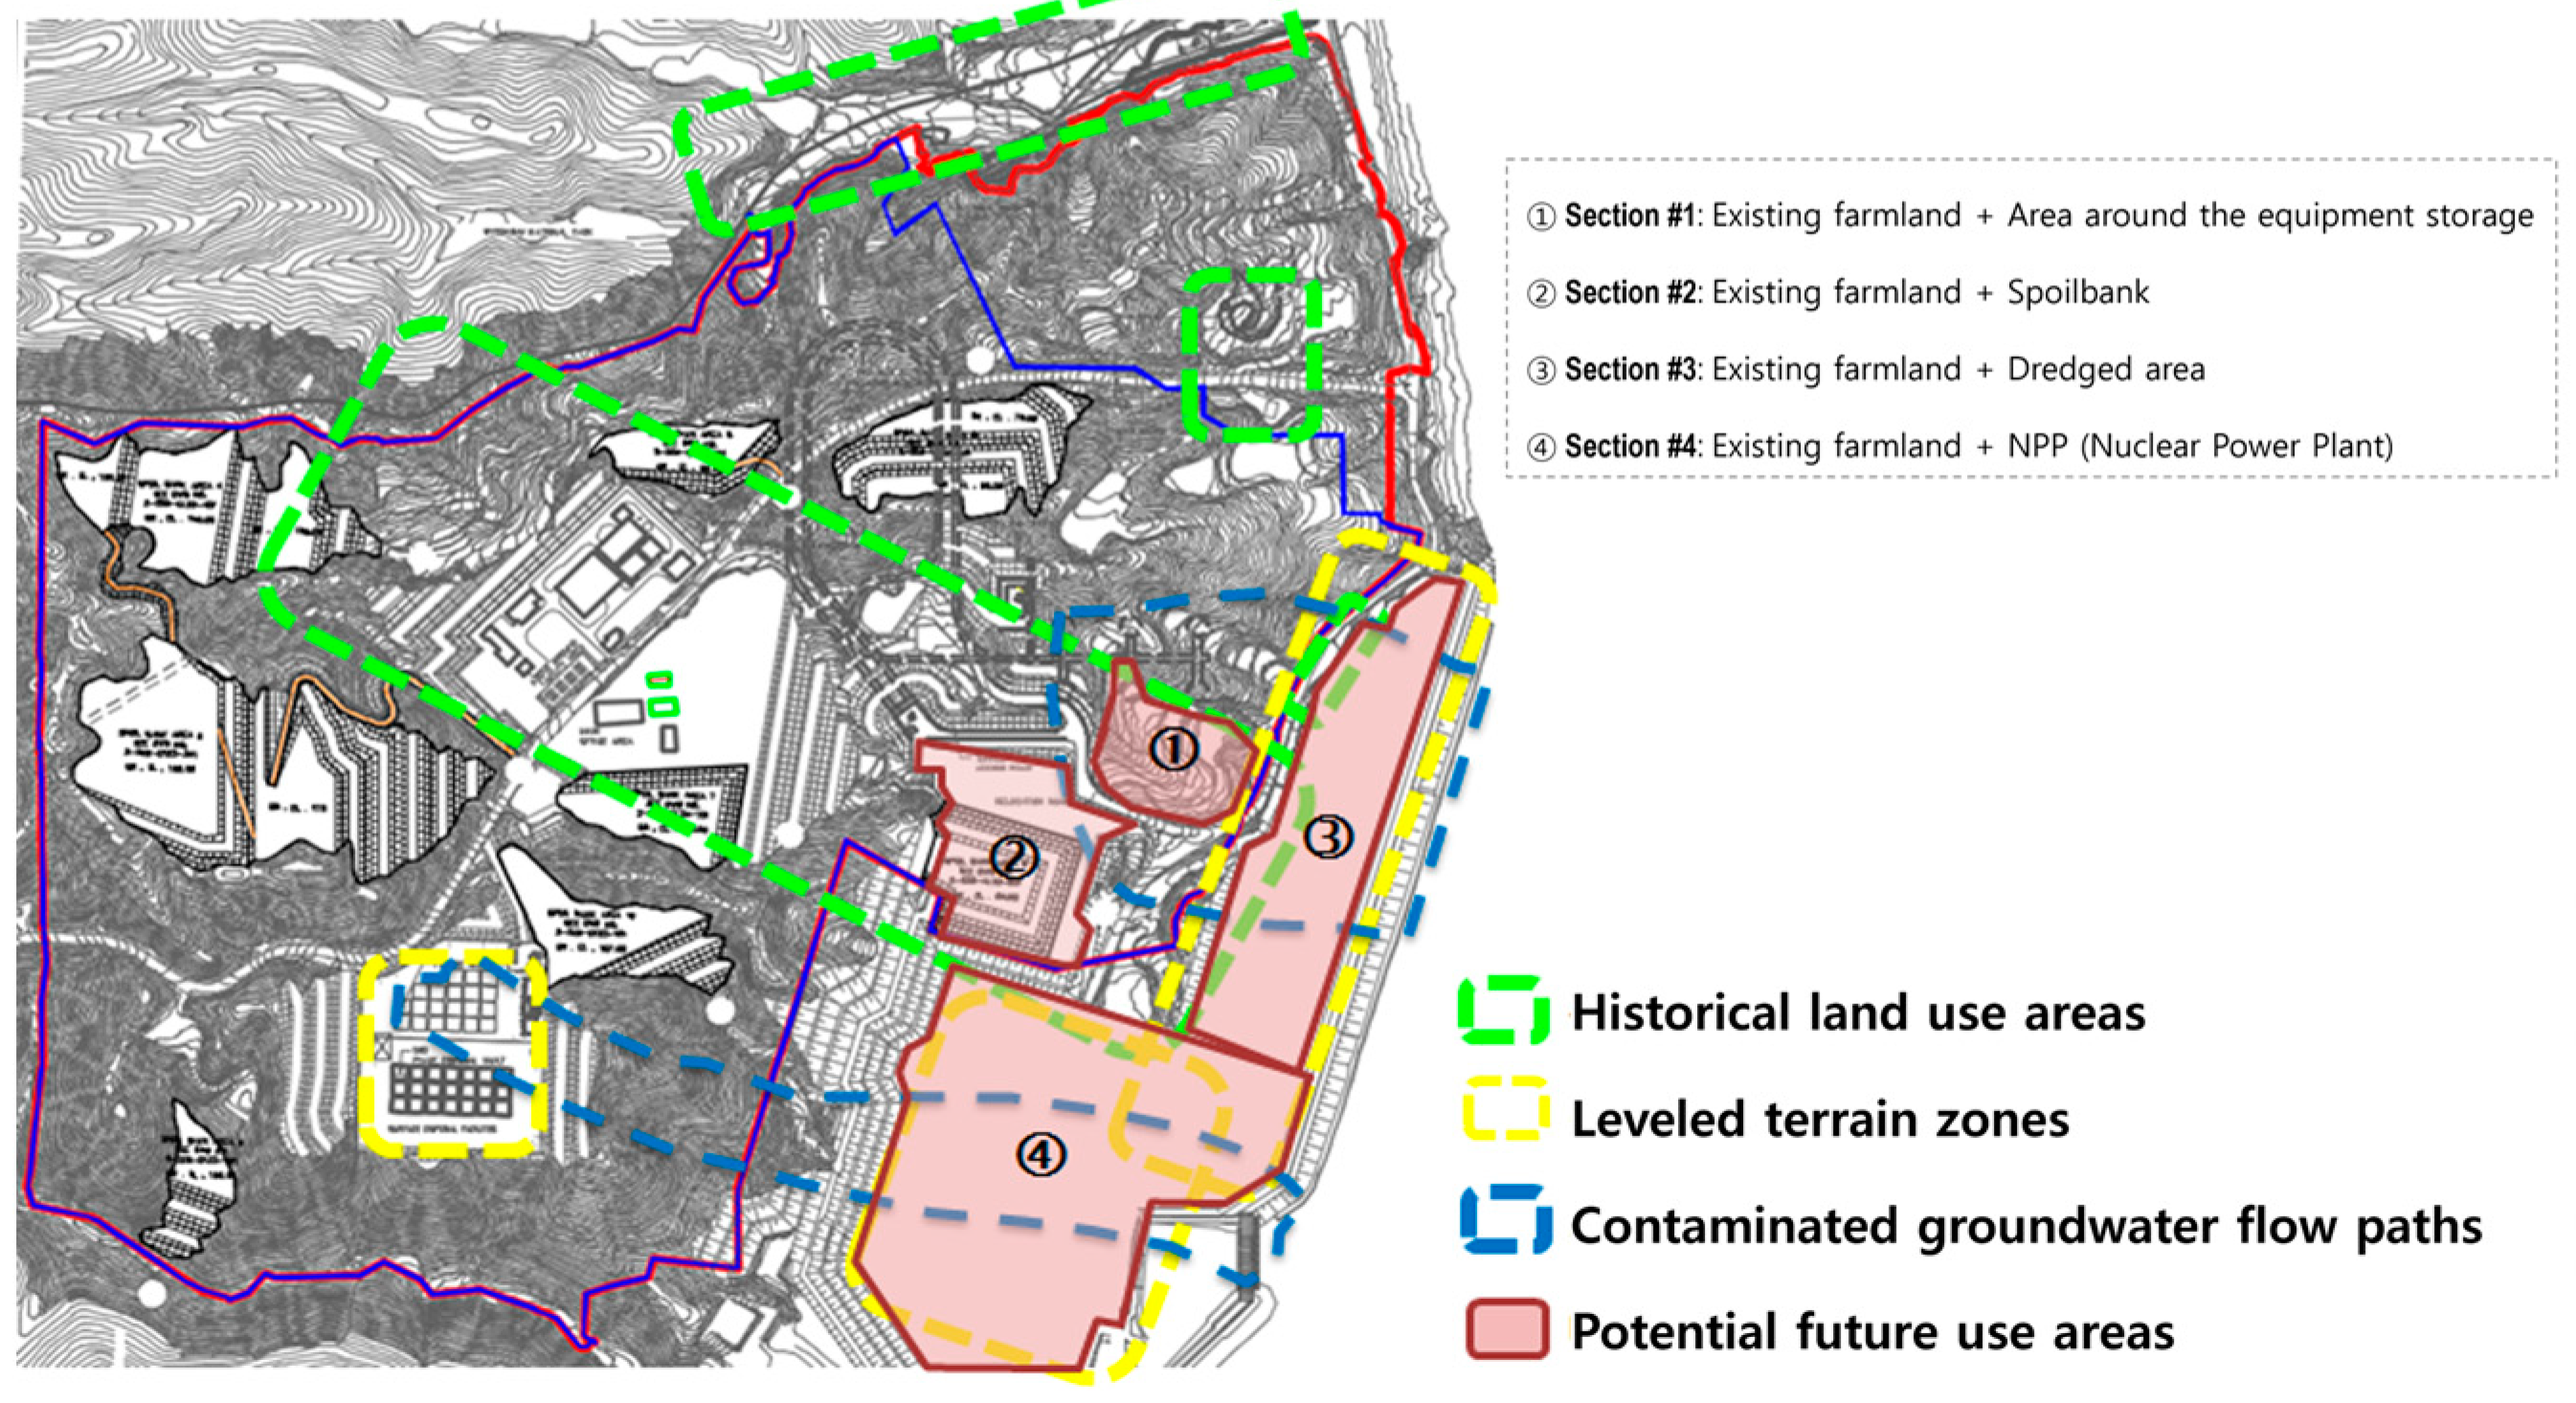
Figure 11.
Identification of potential well development zones.
Figure 11.
Identification of potential well development zones.
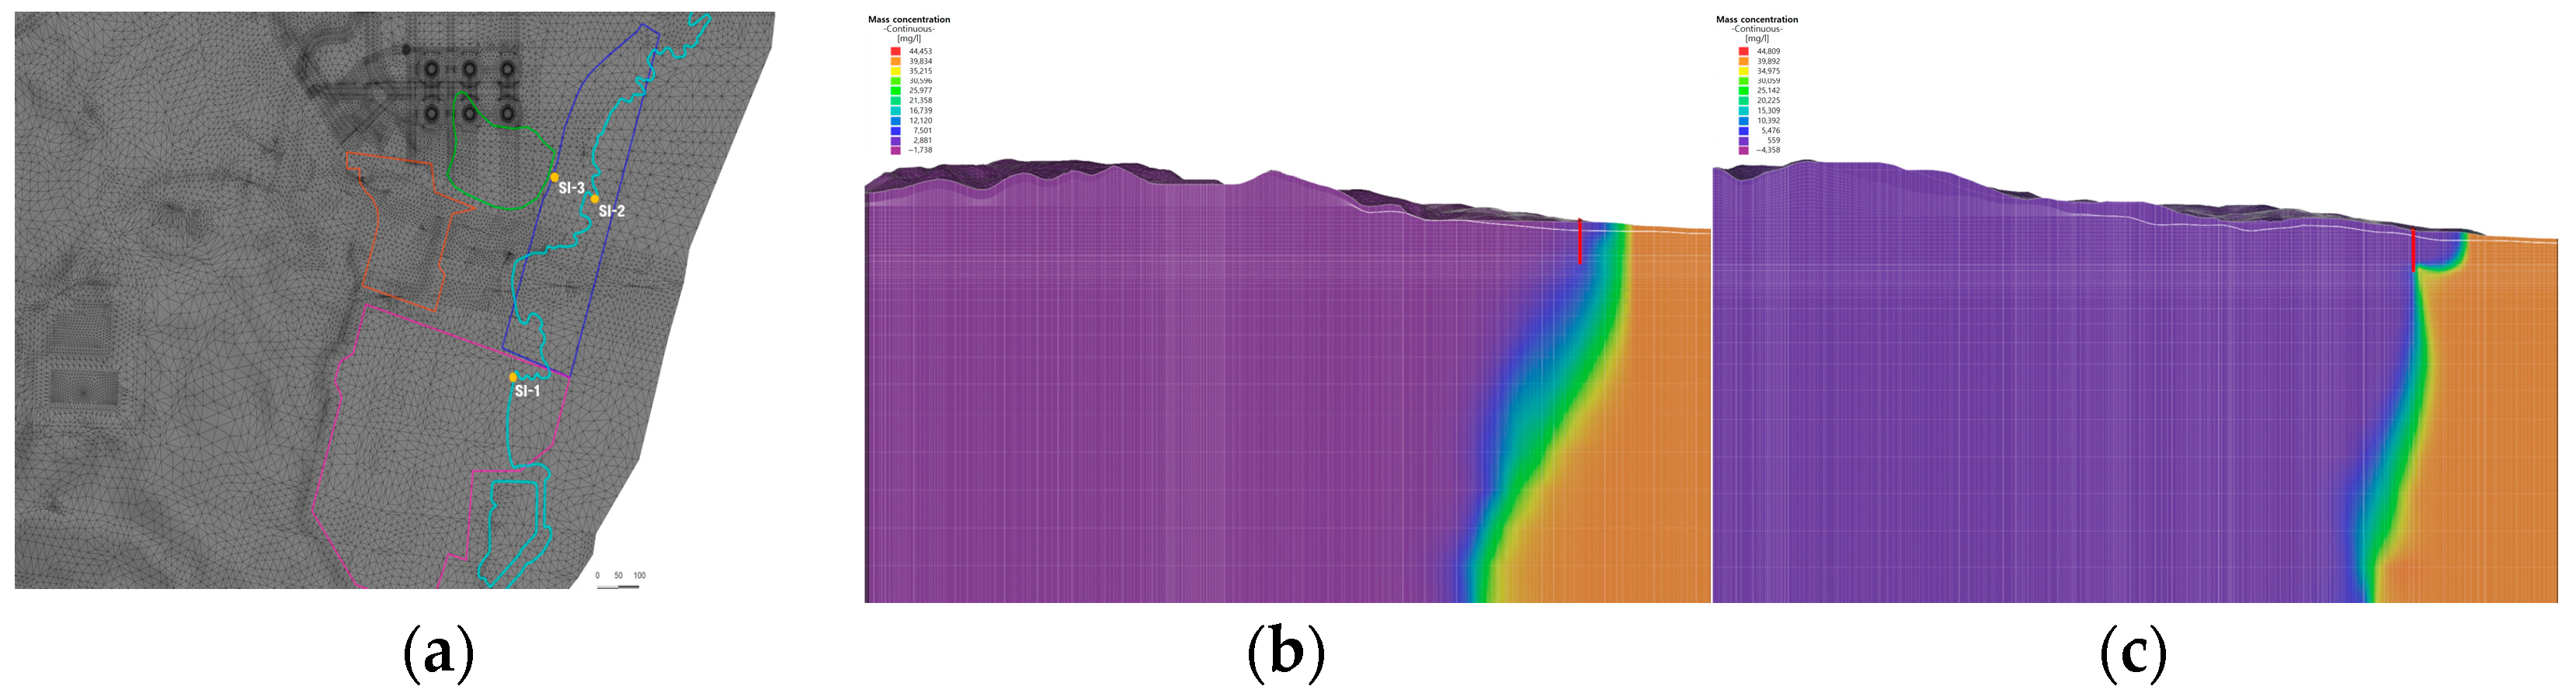
Figure 12.
Evaluation of seawater intrusion impact in Section #3: (a) locations of monitoring wells for assessing seawater intrusion impact; (b) modeling results at hypothetical well SI-1; (c) modeling results at hypothetical well SI-3.
Figure 12.
Evaluation of seawater intrusion impact in Section #3: (a) locations of monitoring wells for assessing seawater intrusion impact; (b) modeling results at hypothetical well SI-1; (c) modeling results at hypothetical well SI-3.
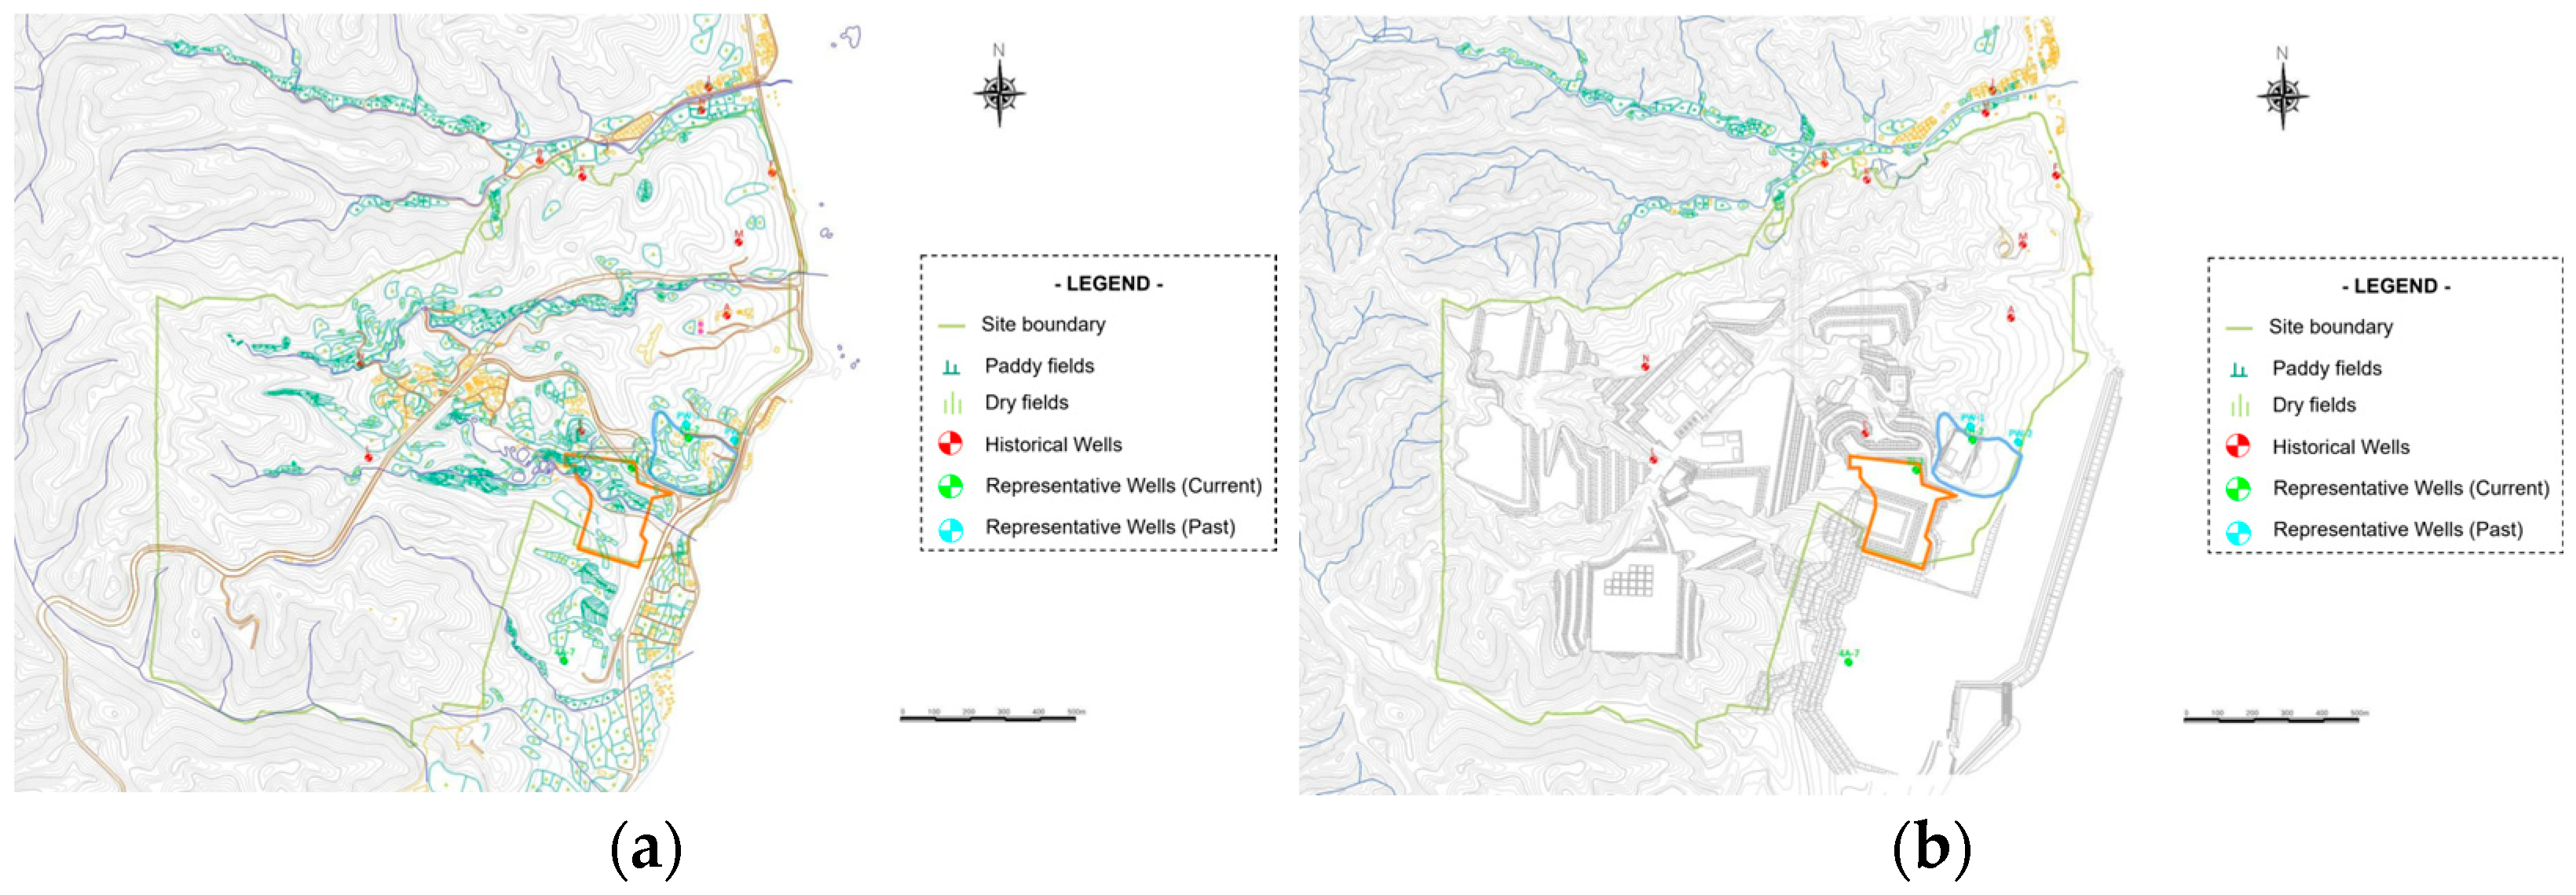
Figure 13.
Land use status within the Wolsong LILW Disposal Center site: (a) digital topographic map before construction (2005); (b) digital topographic map after construction (2023).
Figure 13.
Land use status within the Wolsong LILW Disposal Center site: (a) digital topographic map before construction (2005); (b) digital topographic map after construction (2023).
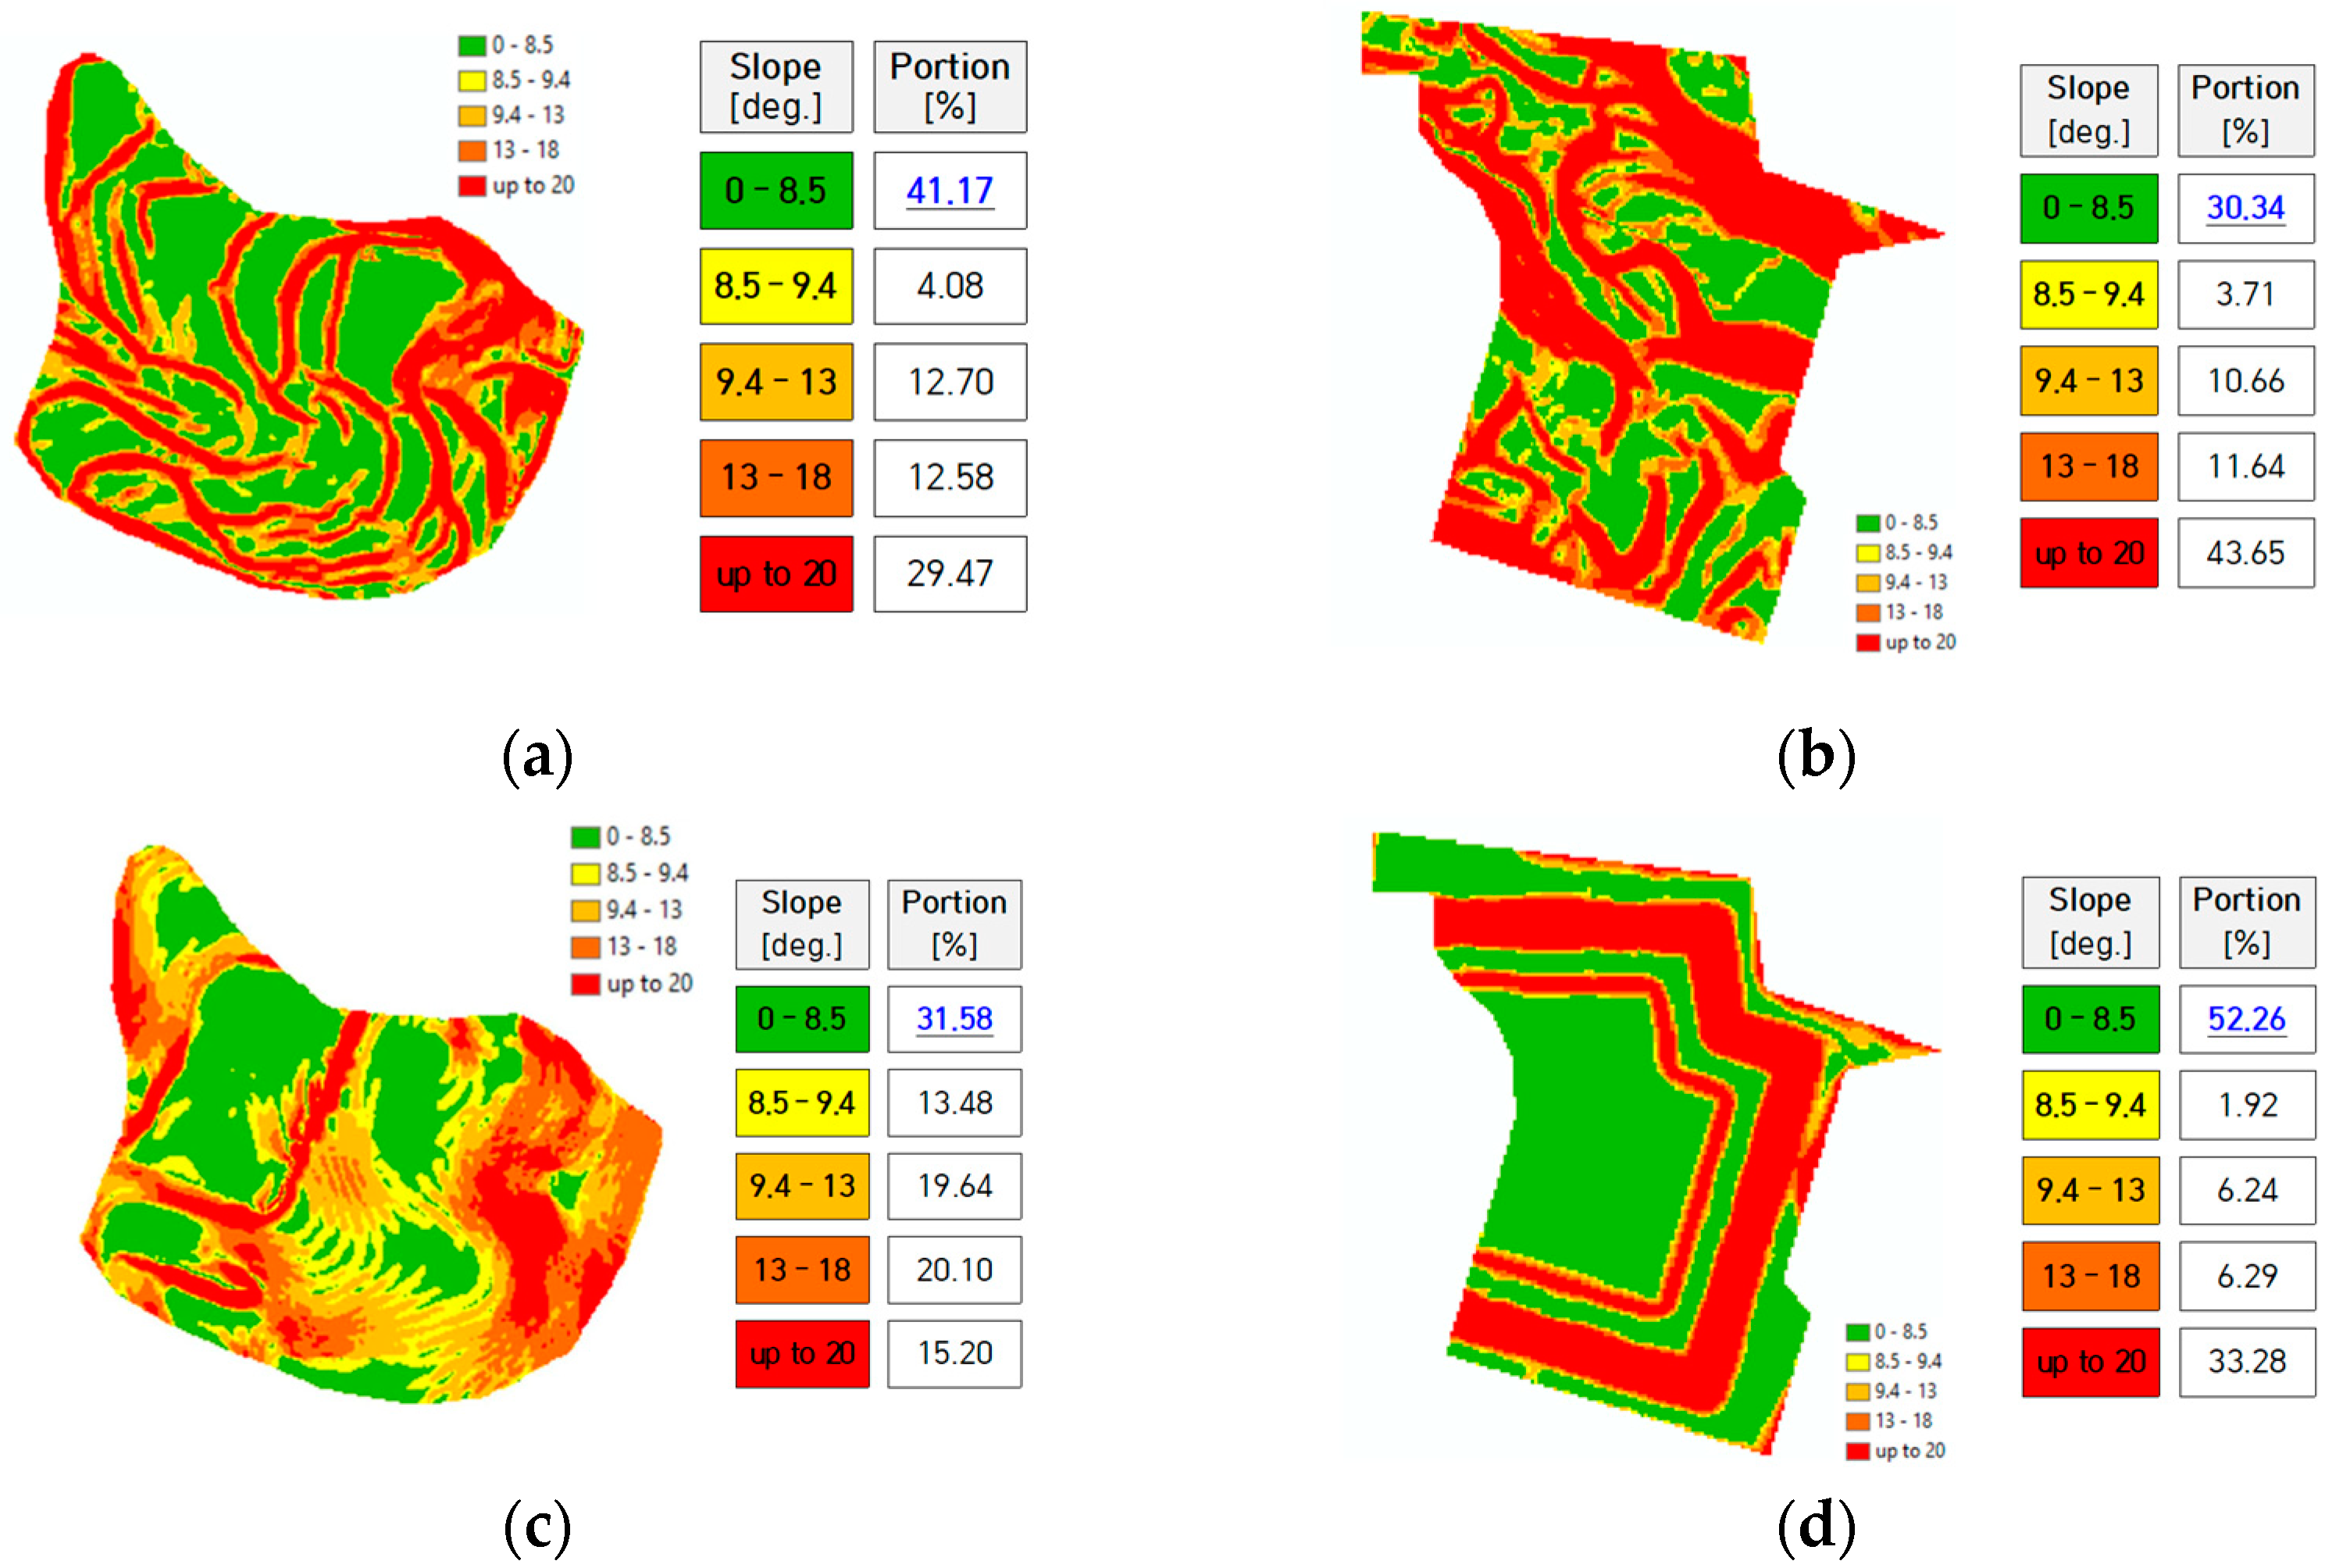
Figure 14.
Slope analysis results for potential future use areas. Numbers in blue font with underlines indicate slope ranges suitable for potential agricultural use: (a) topographic slope distribution of Section #1 before facility construction (2005); (b) topographic slope distribution of Section #2 before facility construction (2005); (c) topographic slope distribution of Section #1 after facility construction (2023); (d) topographic slope distribution of Section #2 after facility construction (2023).
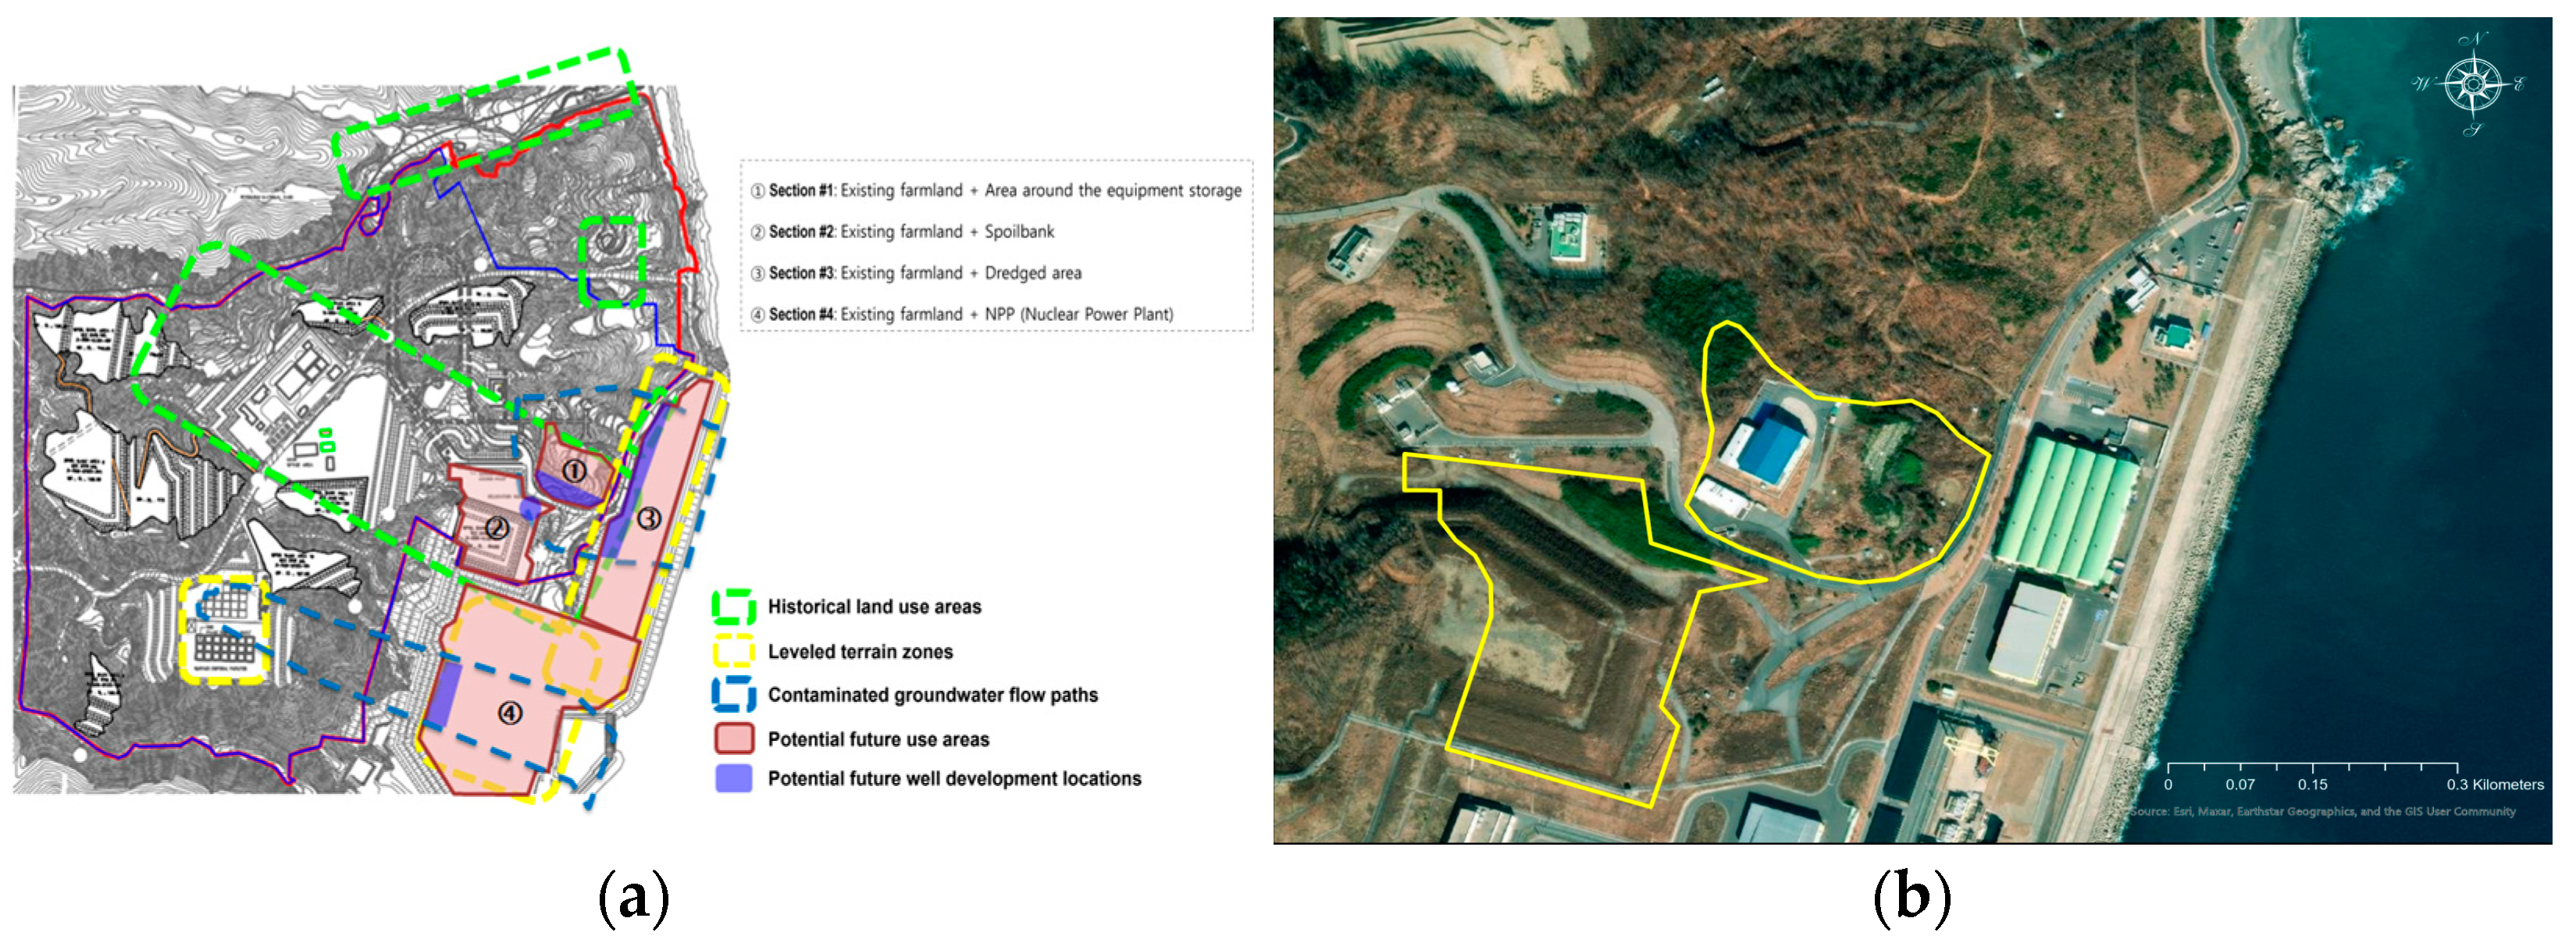
Figure 15.
Potential well development locations: (a) screening results (purple shaded areas); (b) aerial photograph of identified feasible areas.
Figure 15.
Potential well development locations: (a) screening results (purple shaded areas); (b) aerial photograph of identified feasible areas.
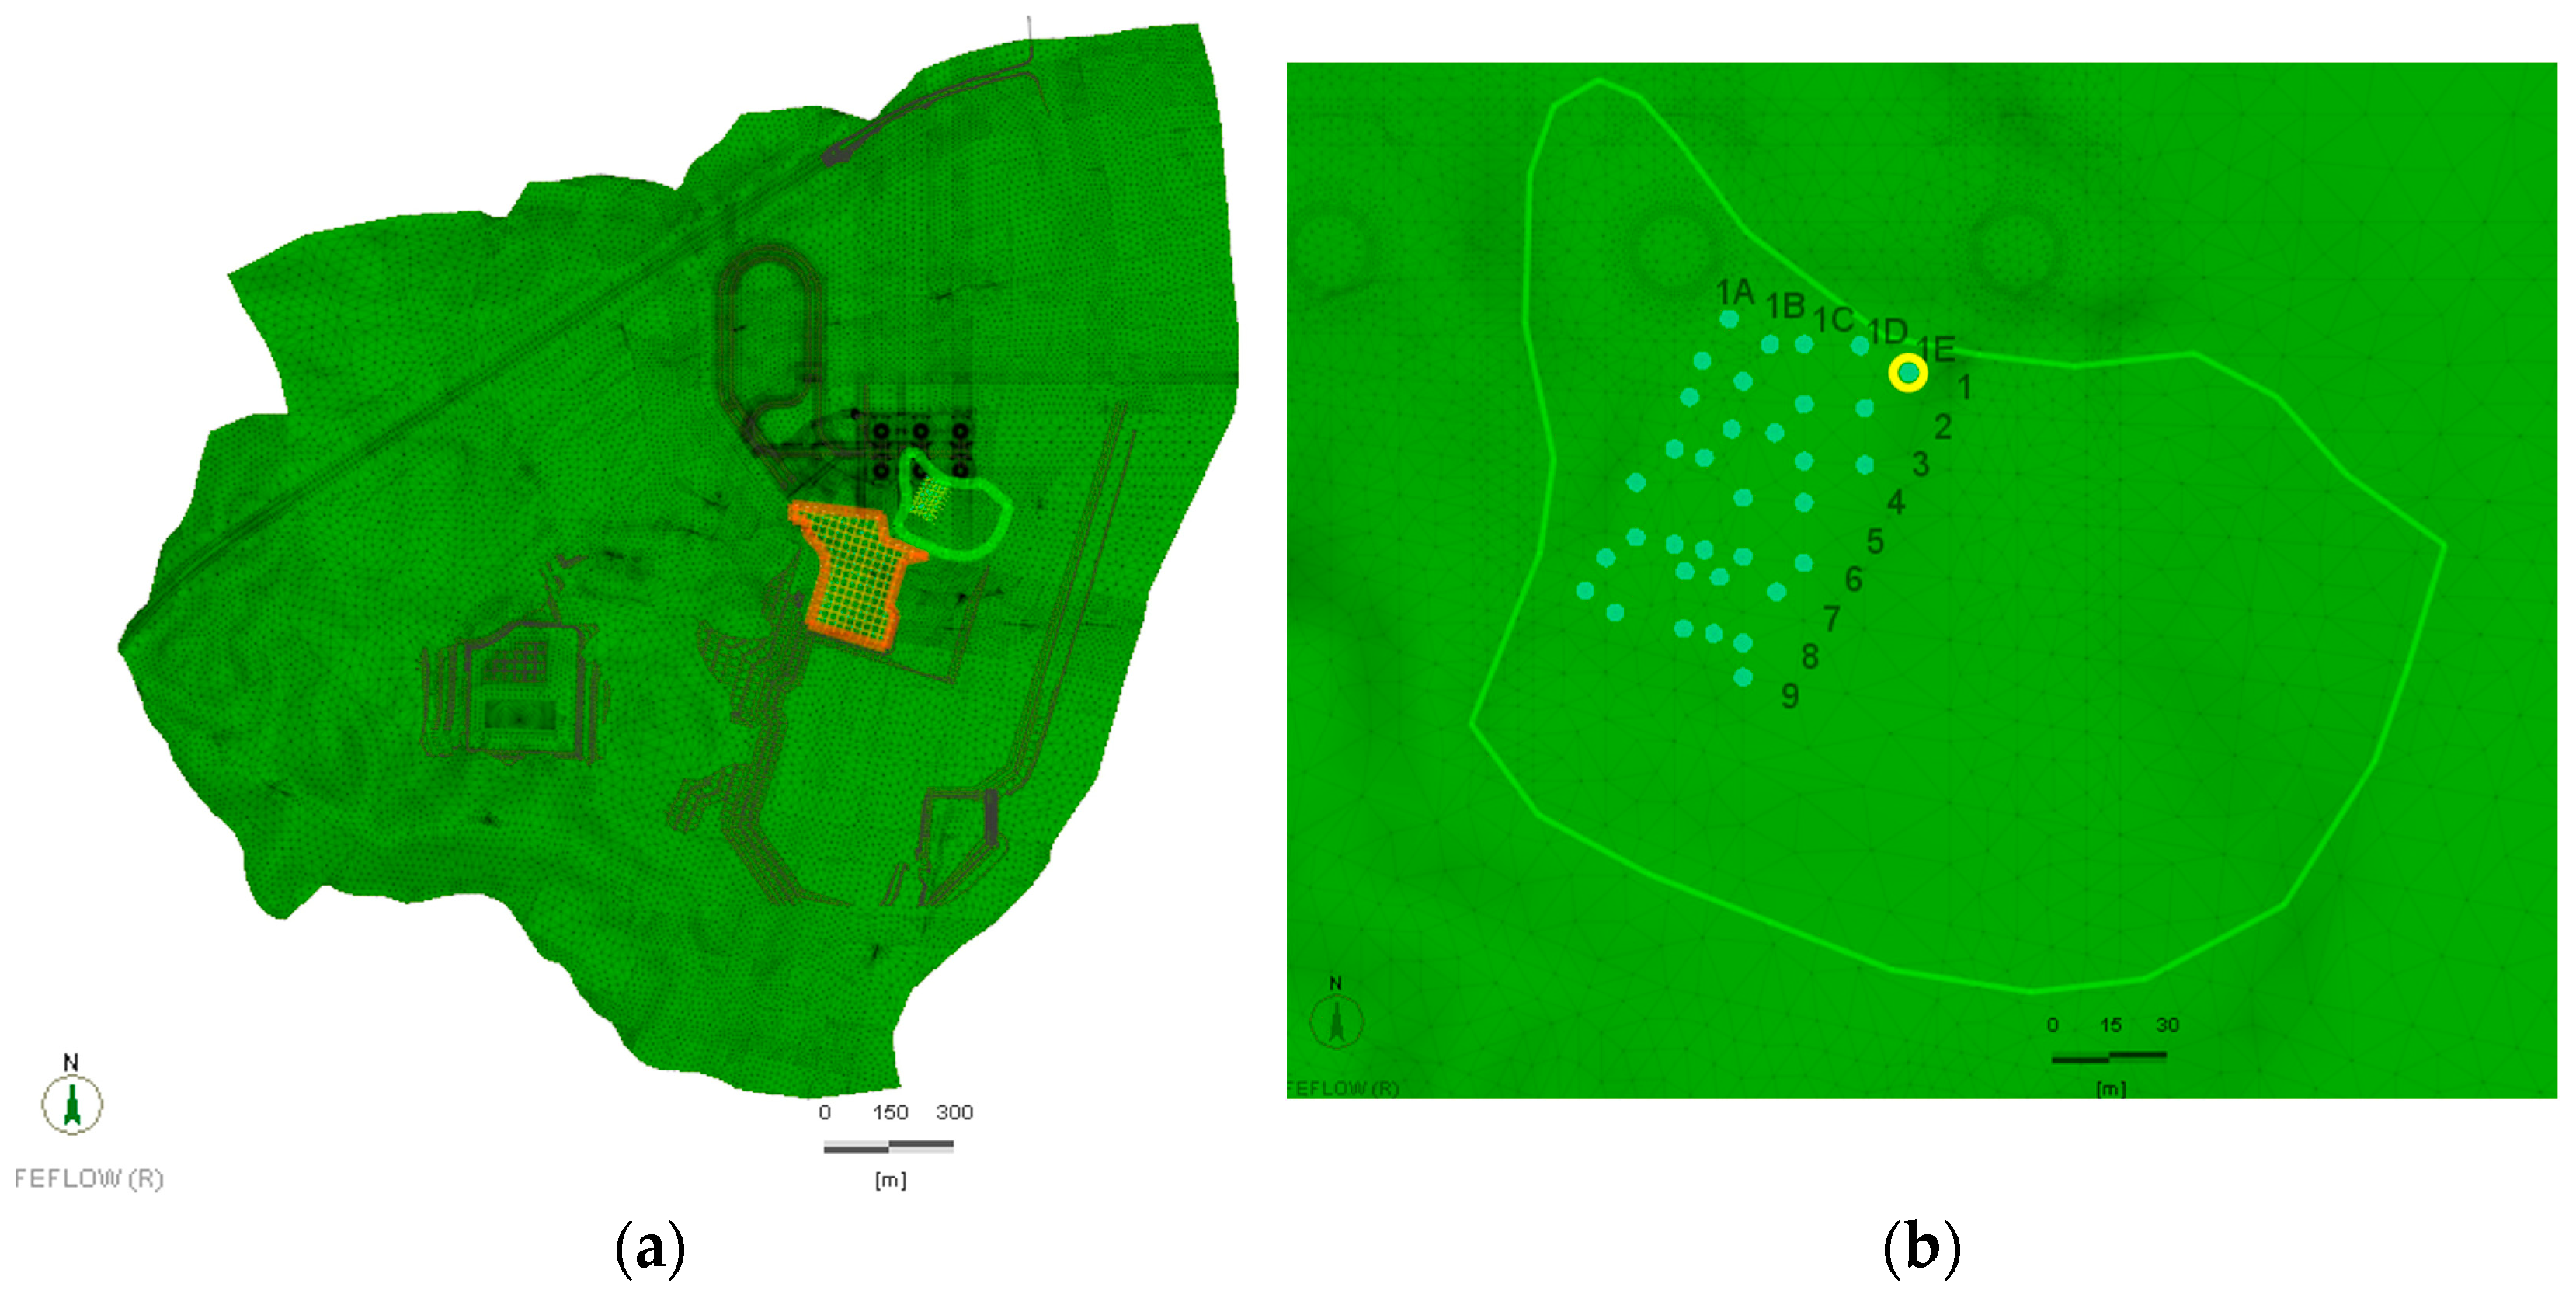
Figure 16.
Placement of hypothetical wells for site screening in Section #1. The dots within the area indicate virtual well installation points: (a) overview of well locations; (b) detailed view of well positions.
Figure 16.
Placement of hypothetical wells for site screening in Section #1. The dots within the area indicate virtual well installation points: (a) overview of well locations; (b) detailed view of well positions.
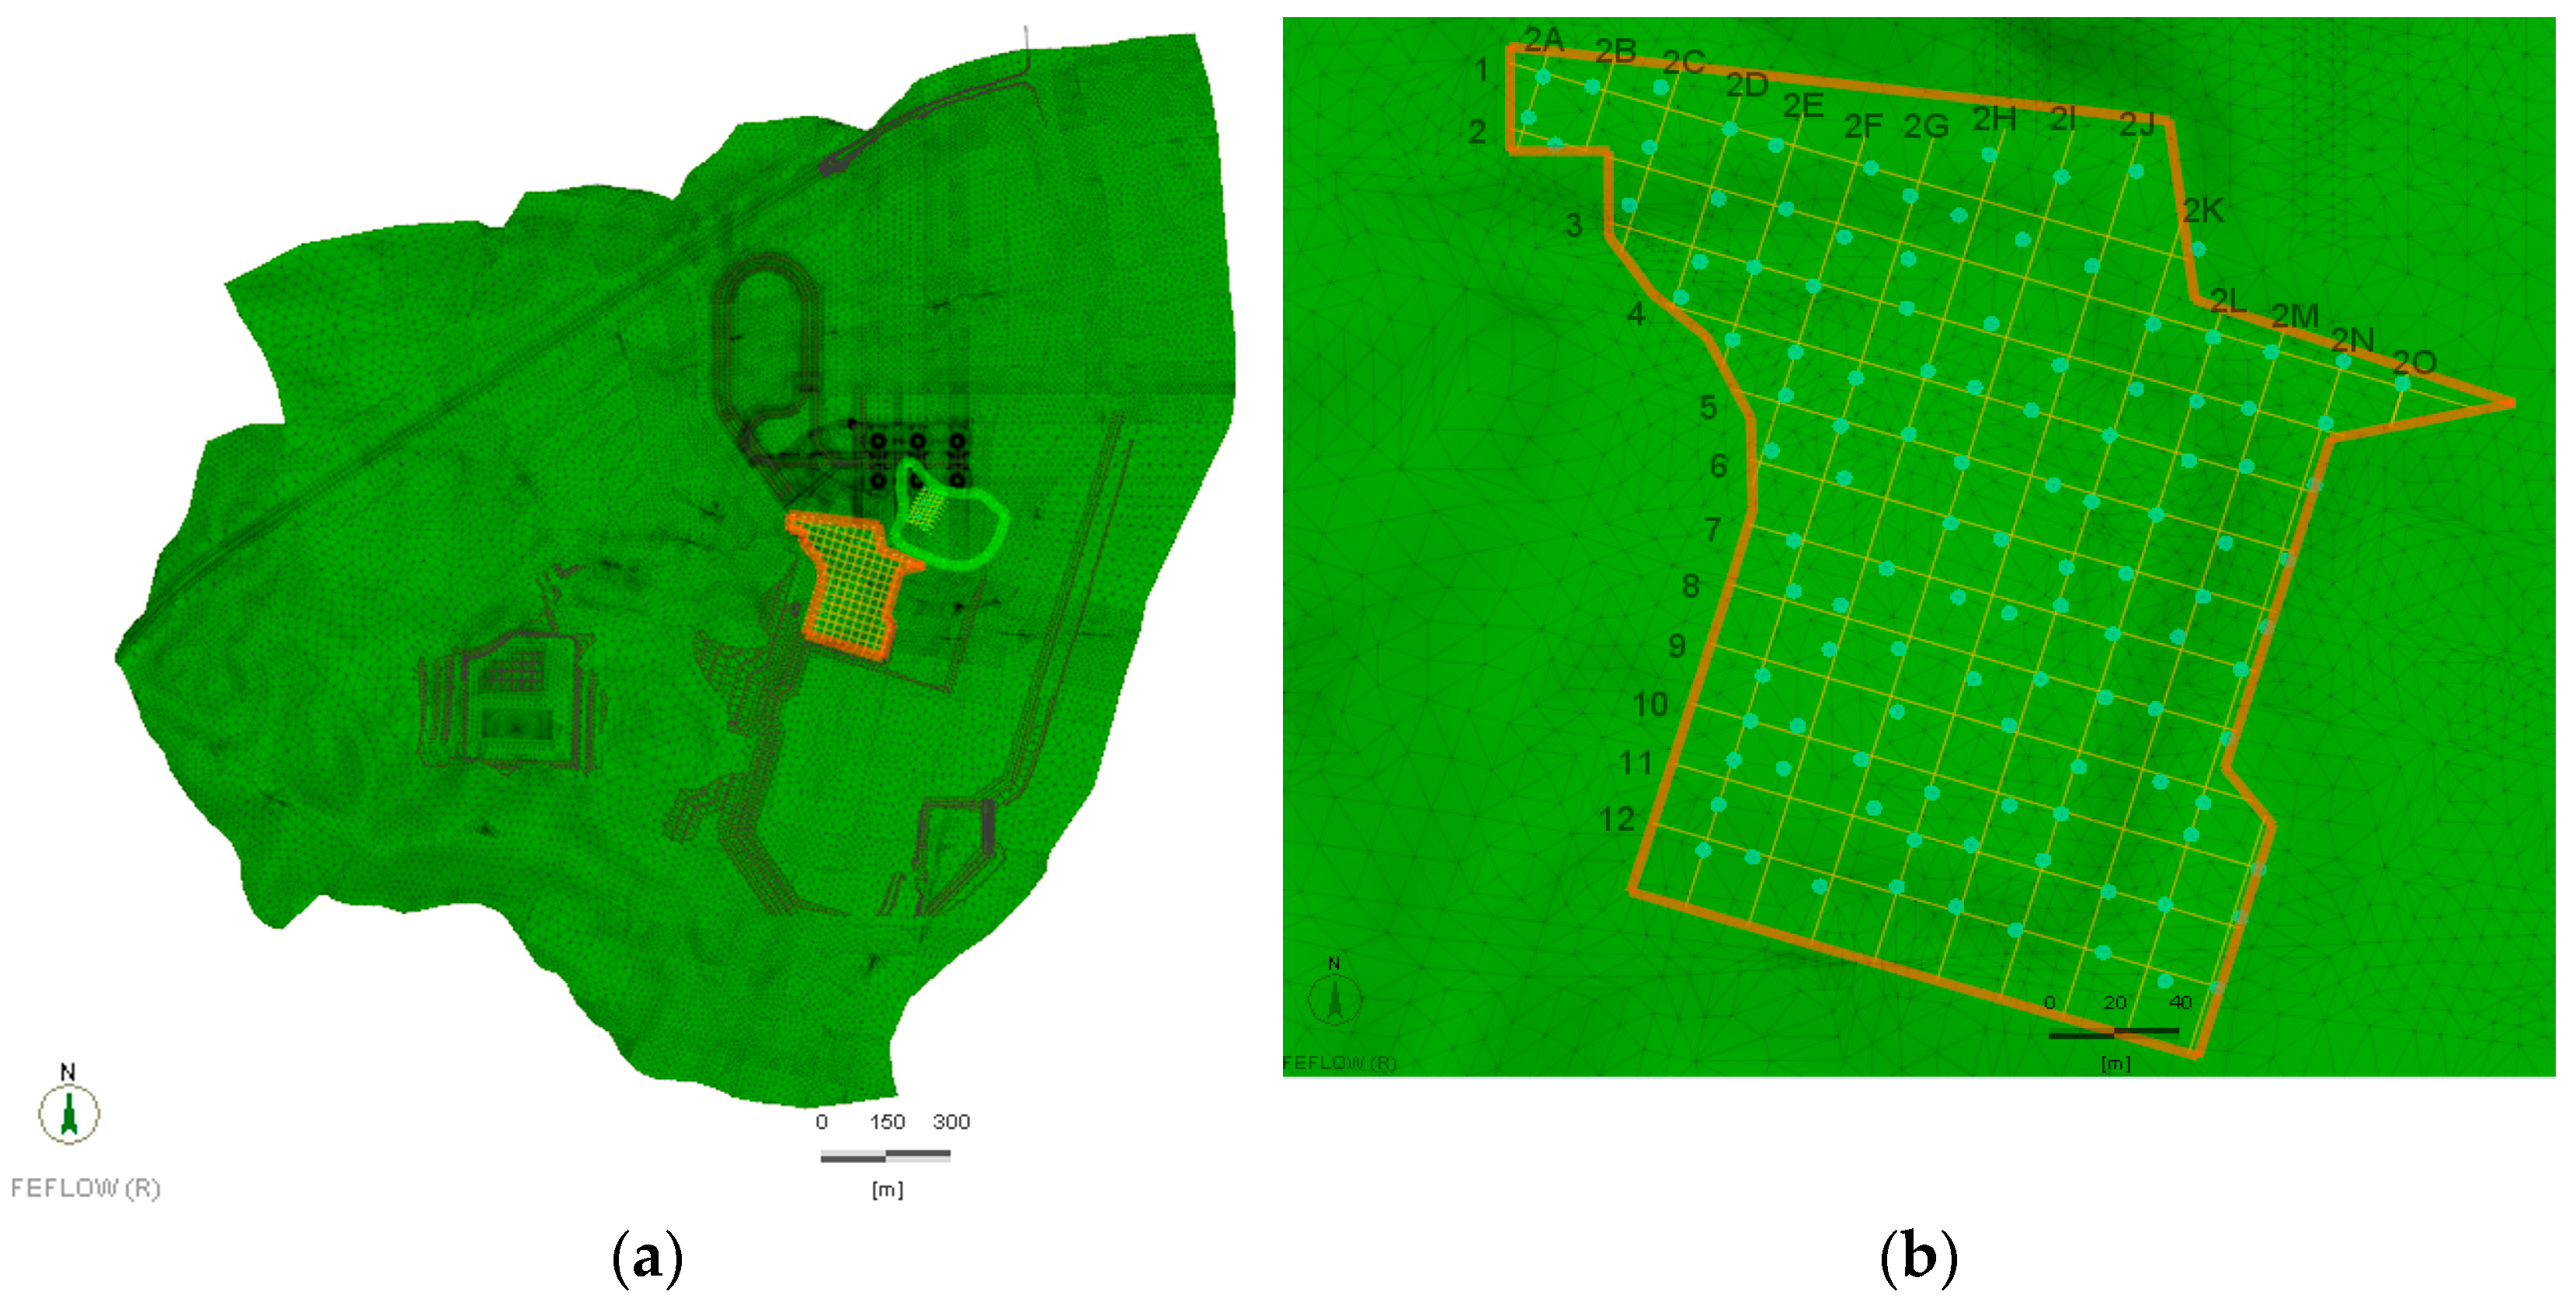
Figure 17.
Placement of hypothetical wells for site screening in Section #2. The dots within the area indicate virtual well installation points: (a) overview of well locations; (b) detailed view of well positions.
Figure 17.
Placement of hypothetical wells for site screening in Section #2. The dots within the area indicate virtual well installation points: (a) overview of well locations; (b) detailed view of well positions.
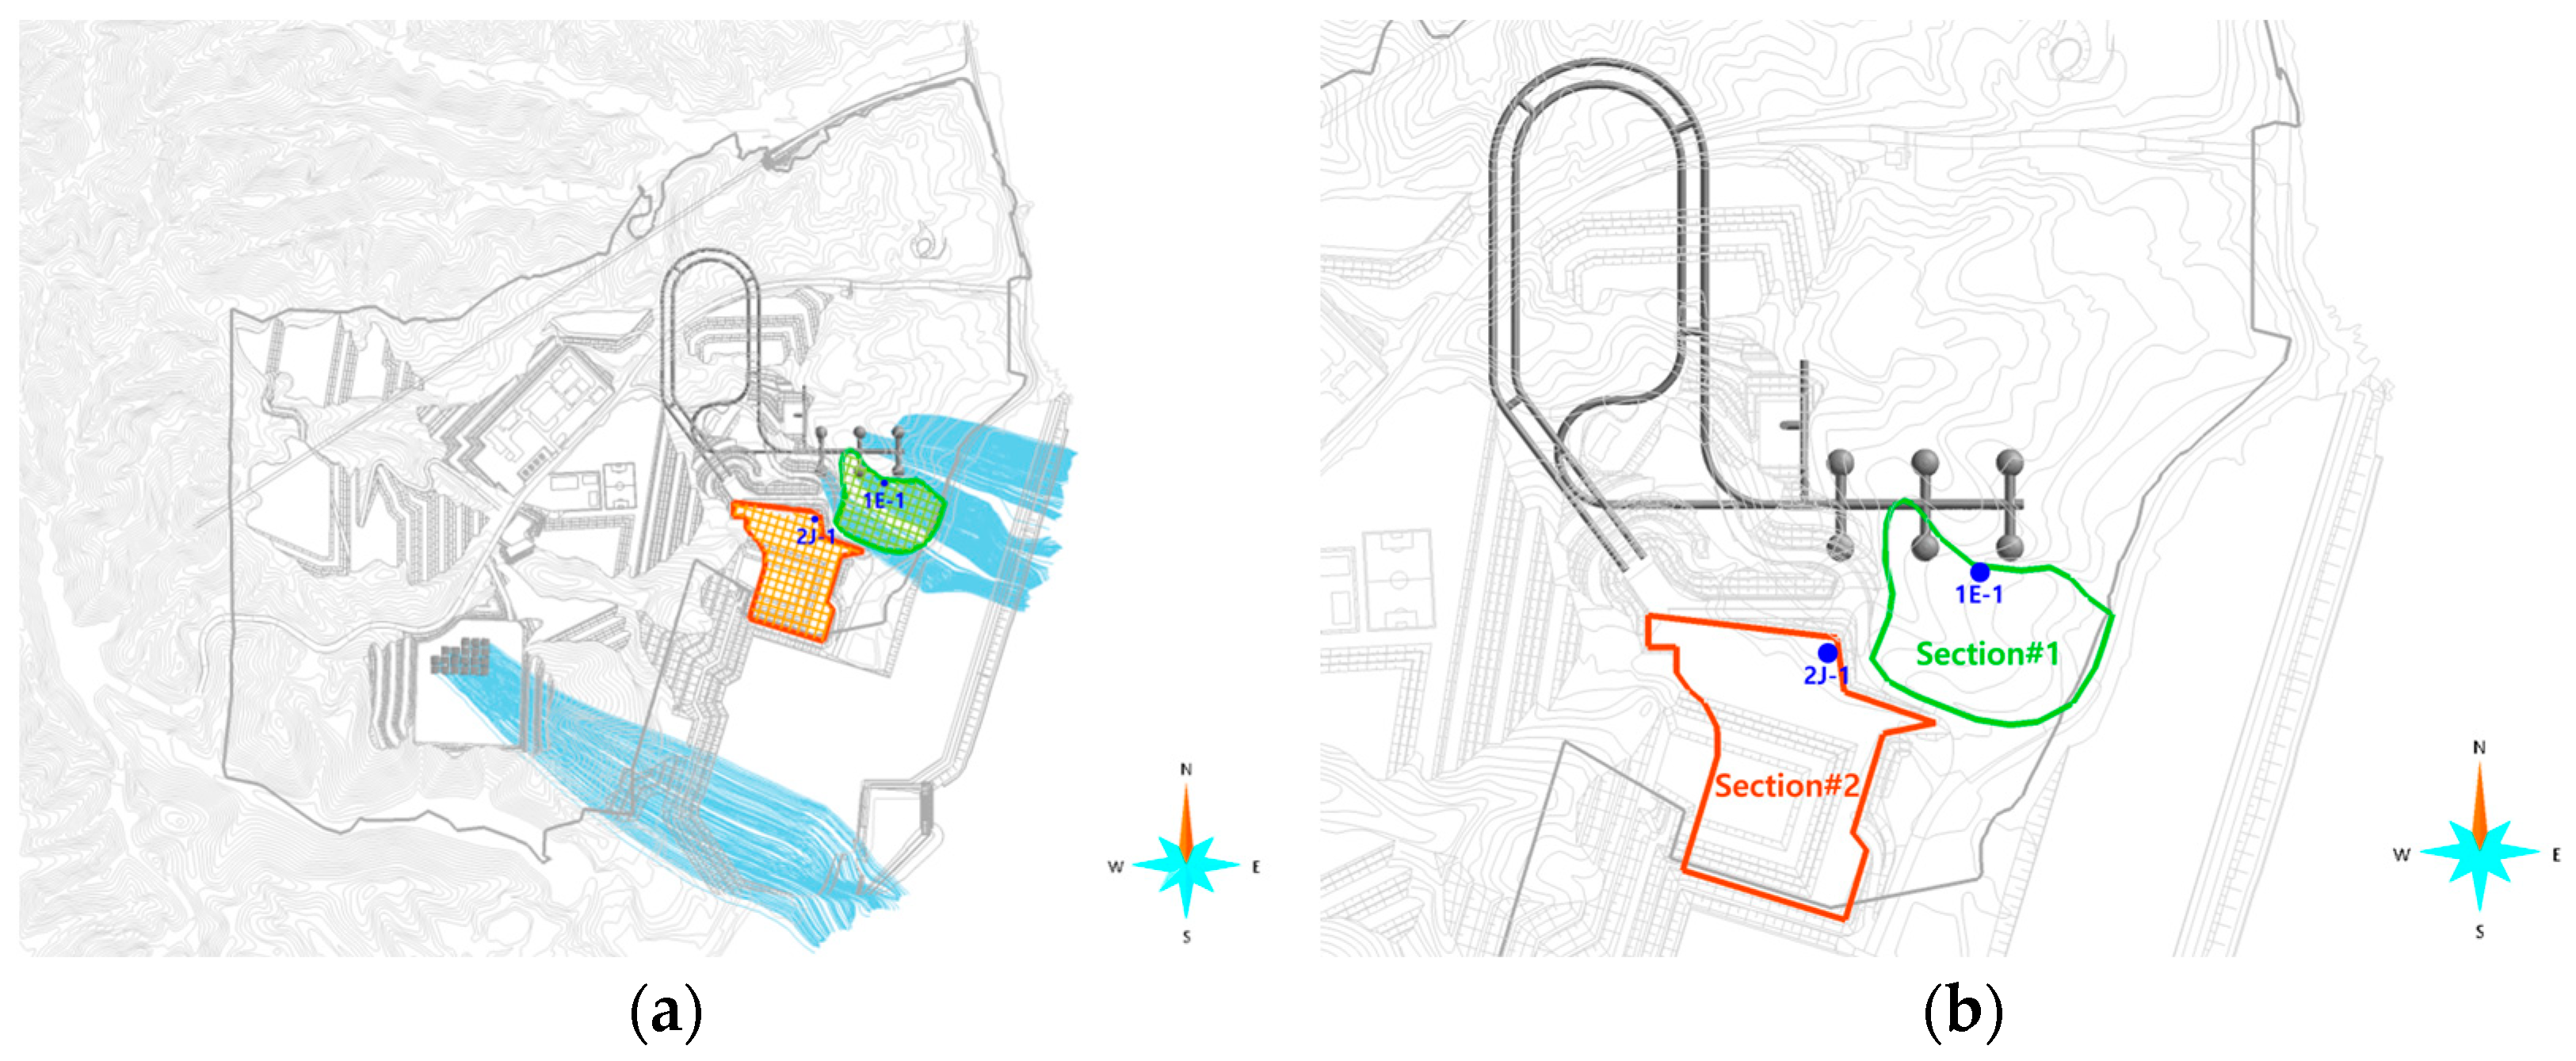
Figure 18.
Representative well locations considering groundwater flow patterns: (a) site overview; (b) detailed view of silo area.
Figure 18.
Representative well locations considering groundwater flow patterns: (a) site overview; (b) detailed view of silo area.
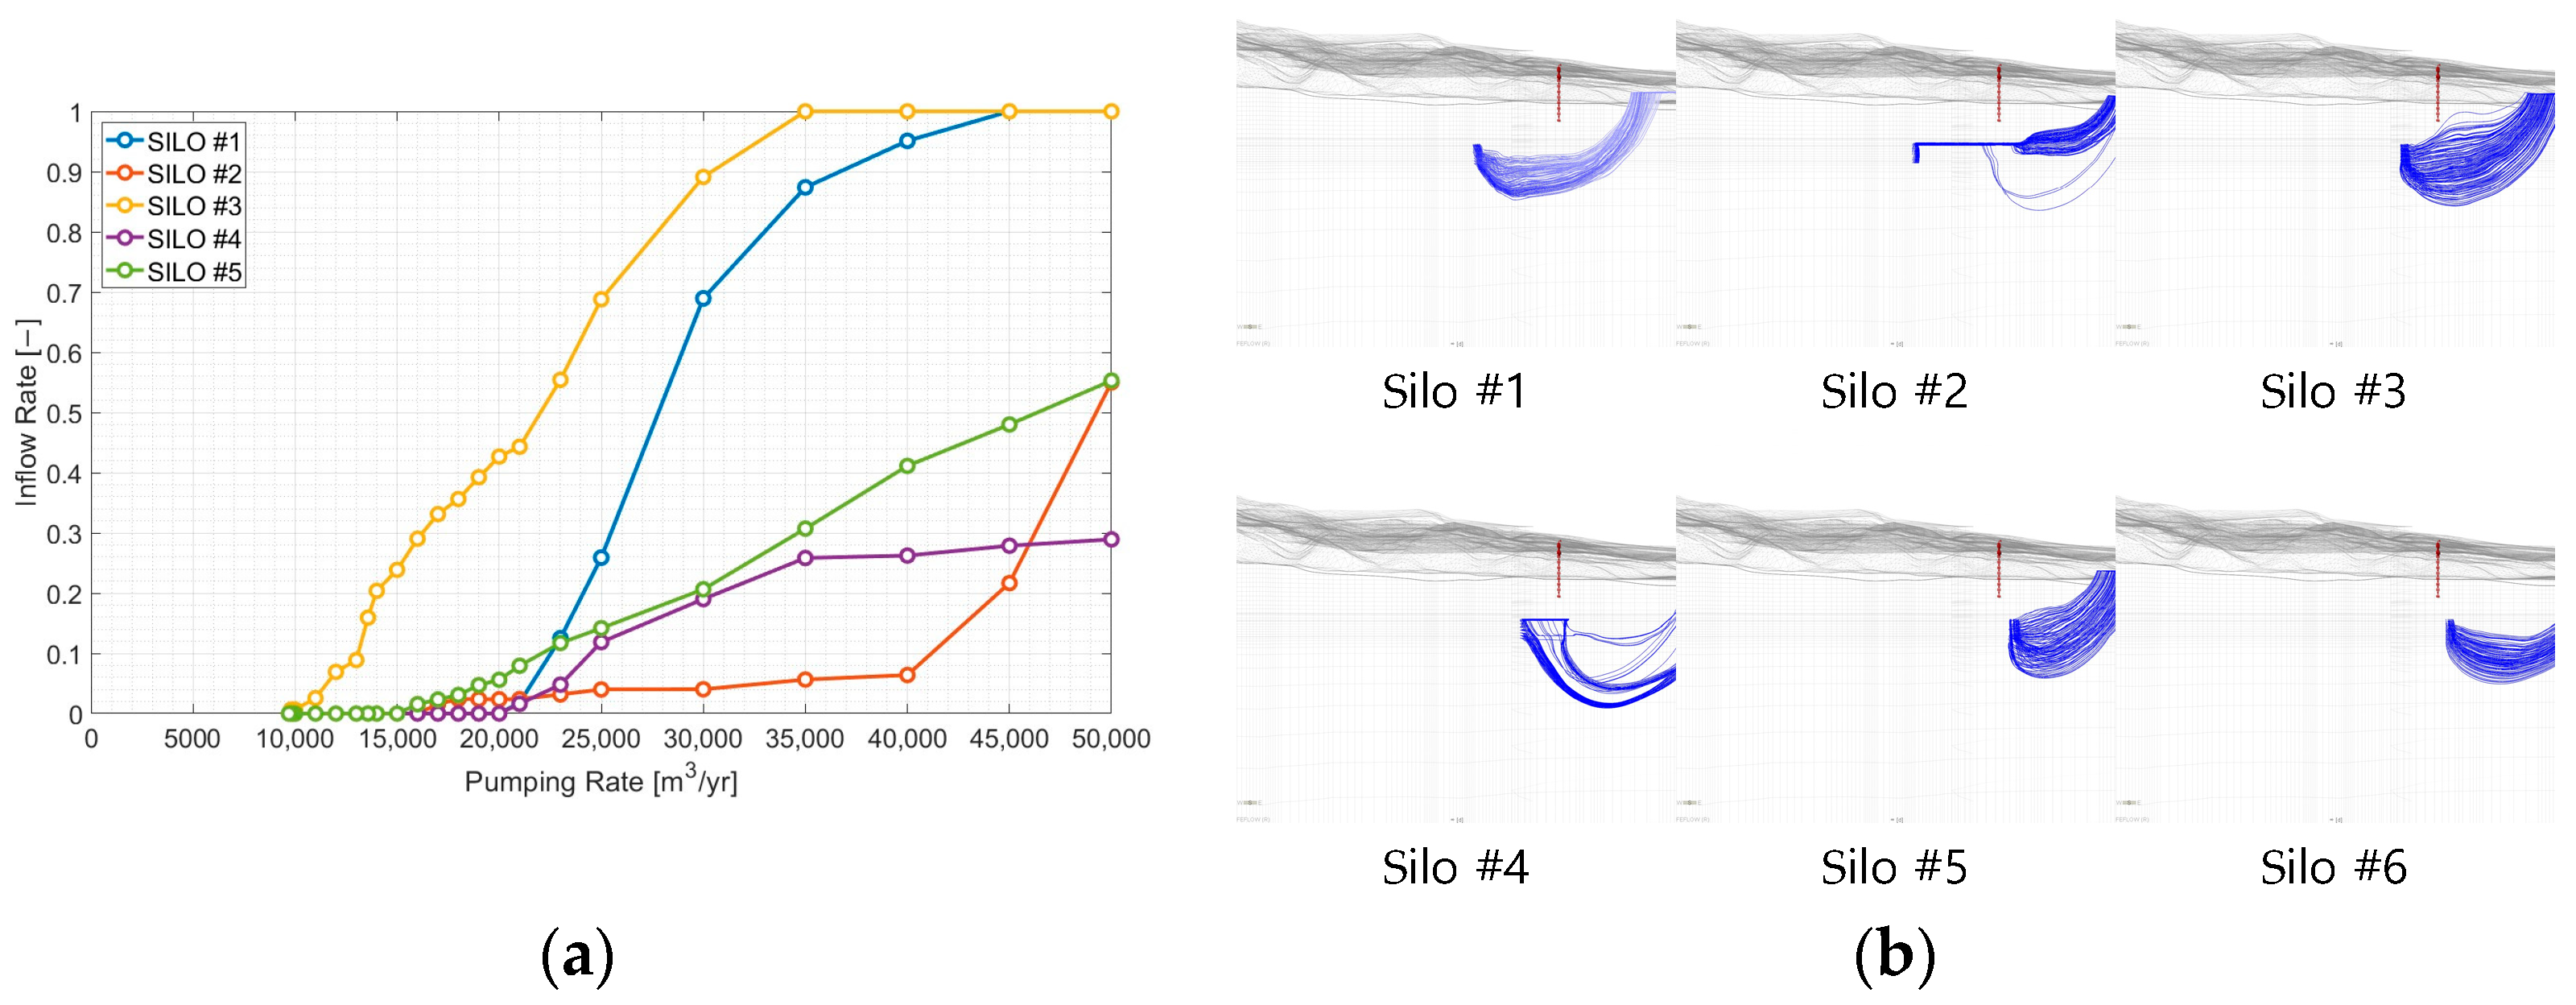
Figure 19.
Contaminant transport analysis at representative well (1E-1) in Section #1 under varying pumping rates: (a) correlation between pumping rates and particle inflow ratios; (b) groundwater flow patterns around the well at the pumping rate where particle inflow ceases.
Figure 19.
Contaminant transport analysis at representative well (1E-1) in Section #1 under varying pumping rates: (a) correlation between pumping rates and particle inflow ratios; (b) groundwater flow patterns around the well at the pumping rate where particle inflow ceases.
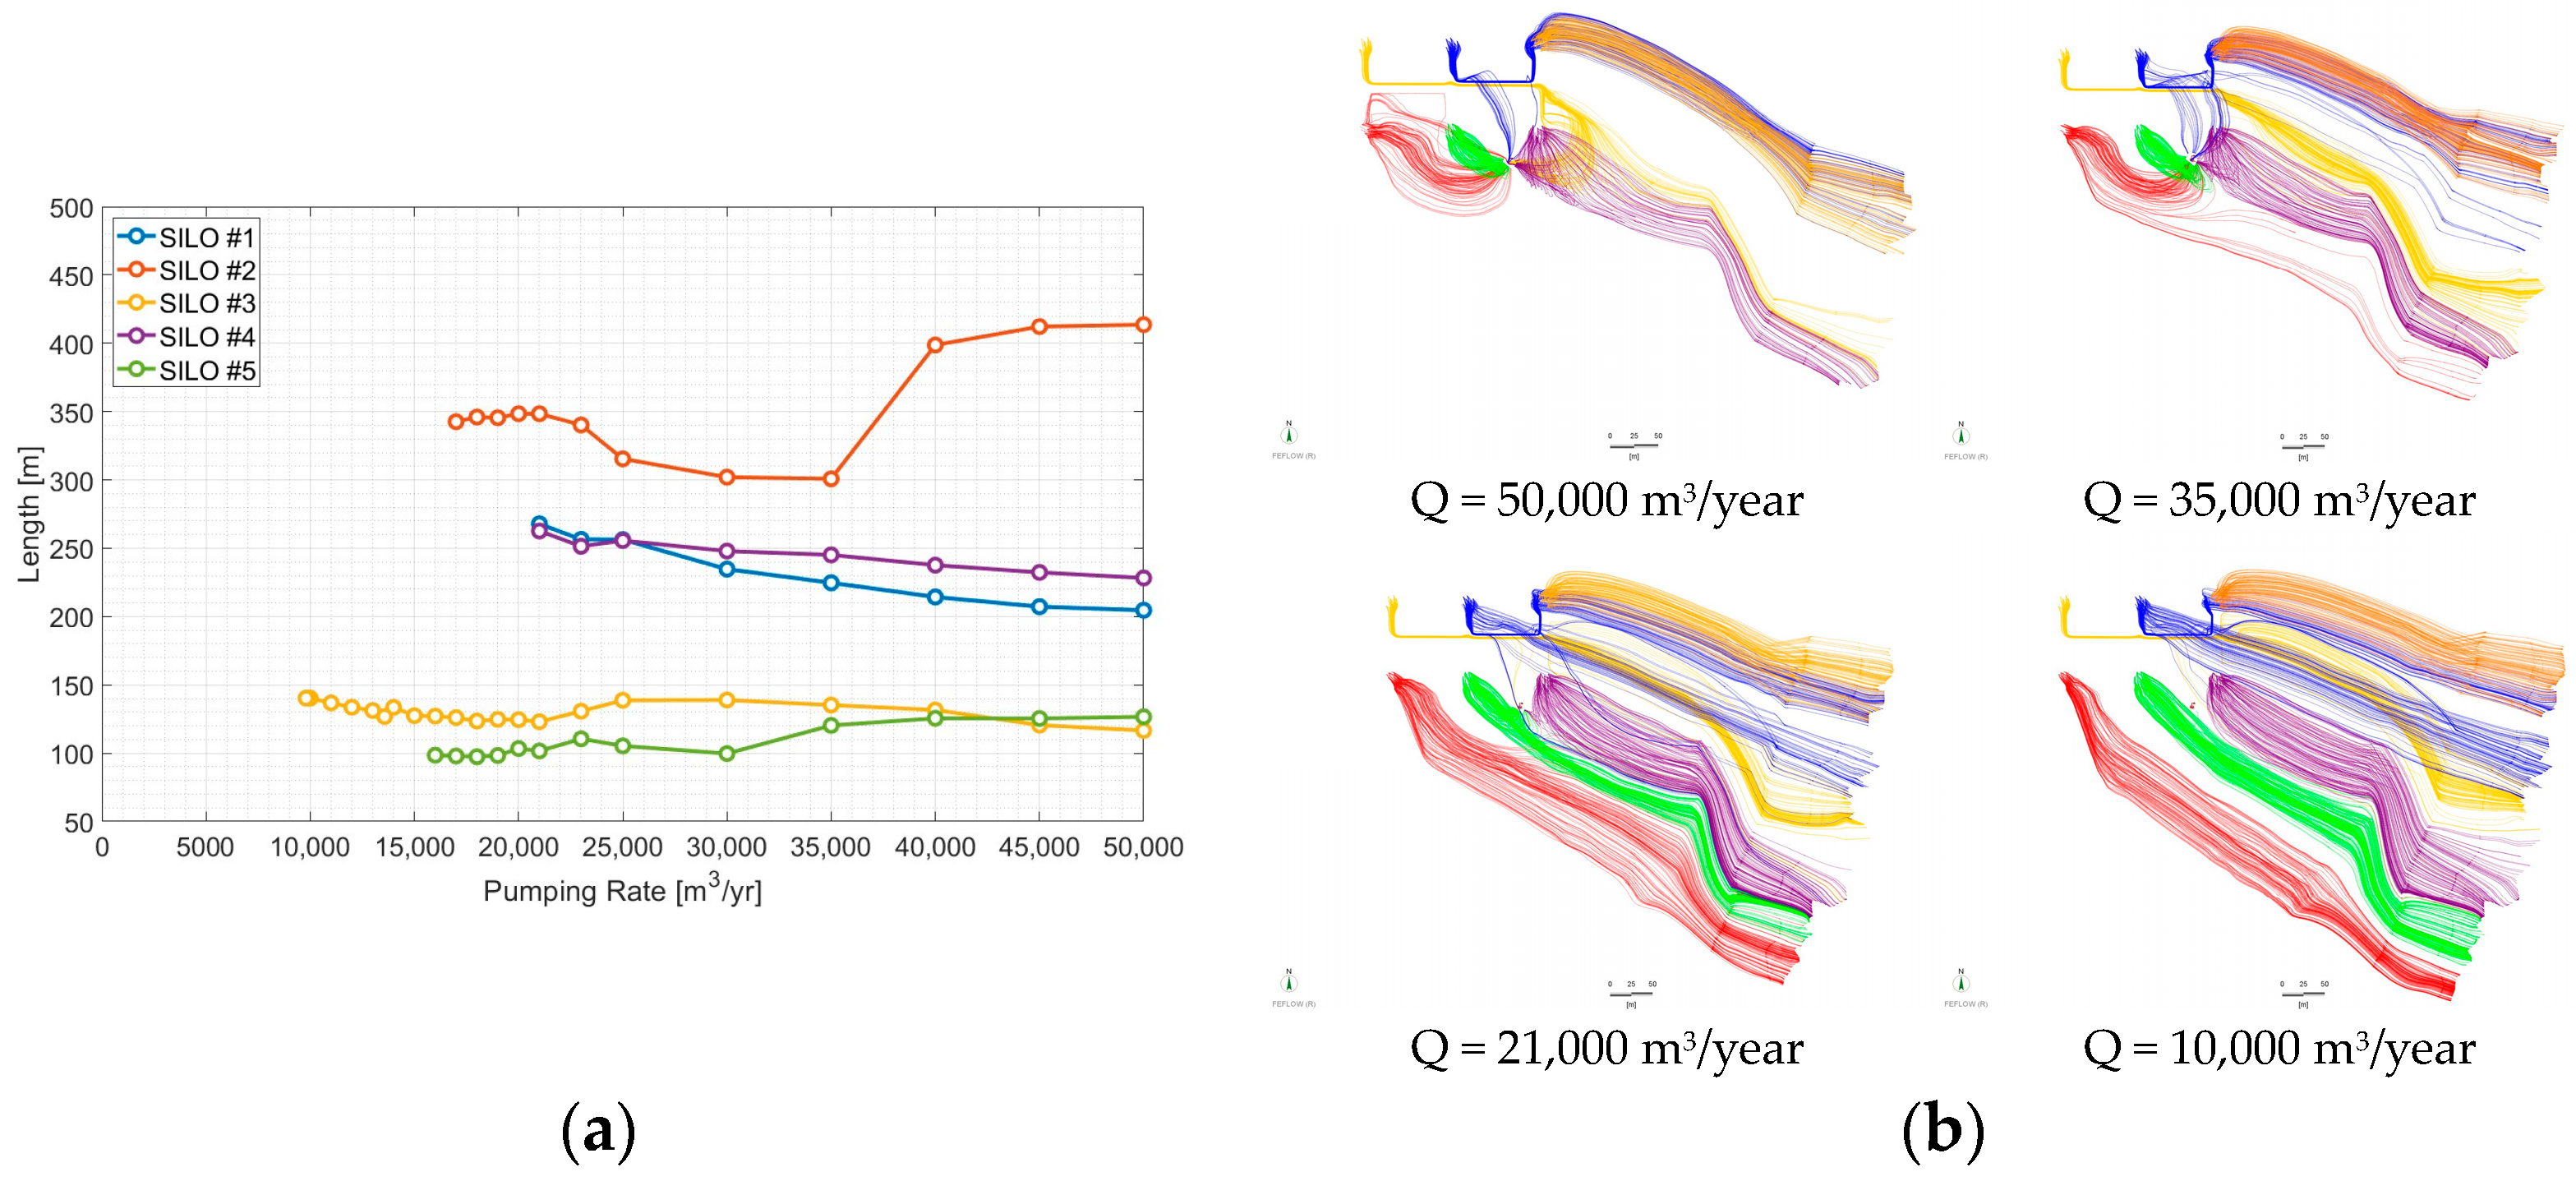
Figure 20.
Contaminant transport analysis at representative well (1E-1) in Section #1 under varying pumping rates: (a) relationship between pumping rates and contaminant transport distances; (b) contaminant pathways under varying pumping rates.
Figure 20.
Contaminant transport analysis at representative well (1E-1) in Section #1 under varying pumping rates: (a) relationship between pumping rates and contaminant transport distances; (b) contaminant pathways under varying pumping rates.
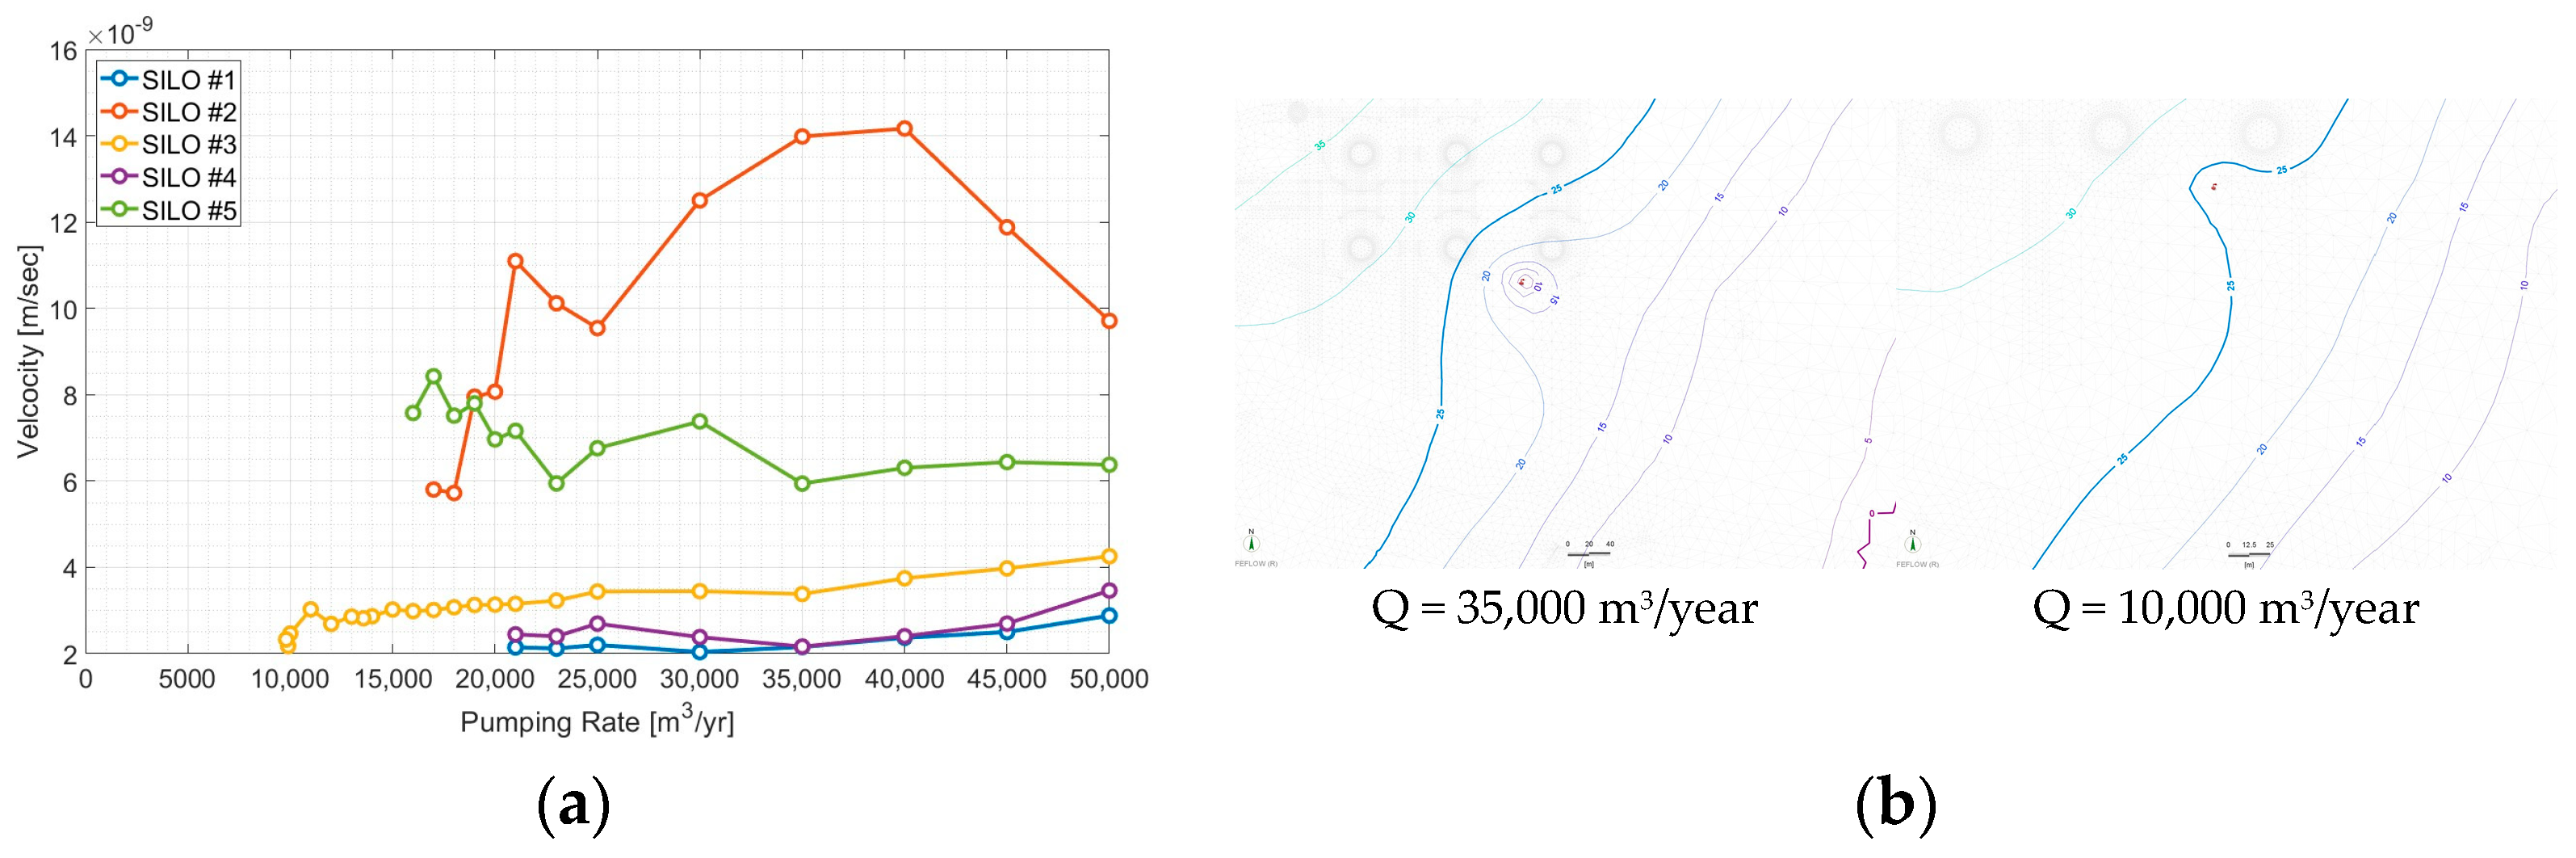
Figure 21.
Contaminant transport analysis at representative well (1E-1) in Section #1 under varying pumping rates: (a) relationship between pumping rates and Darcy velocities; (b) spatial distribution of hydraulic-heads under different pumping conditions.
Figure 21.
Contaminant transport analysis at representative well (1E-1) in Section #1 under varying pumping rates: (a) relationship between pumping rates and Darcy velocities; (b) spatial distribution of hydraulic-heads under different pumping conditions.
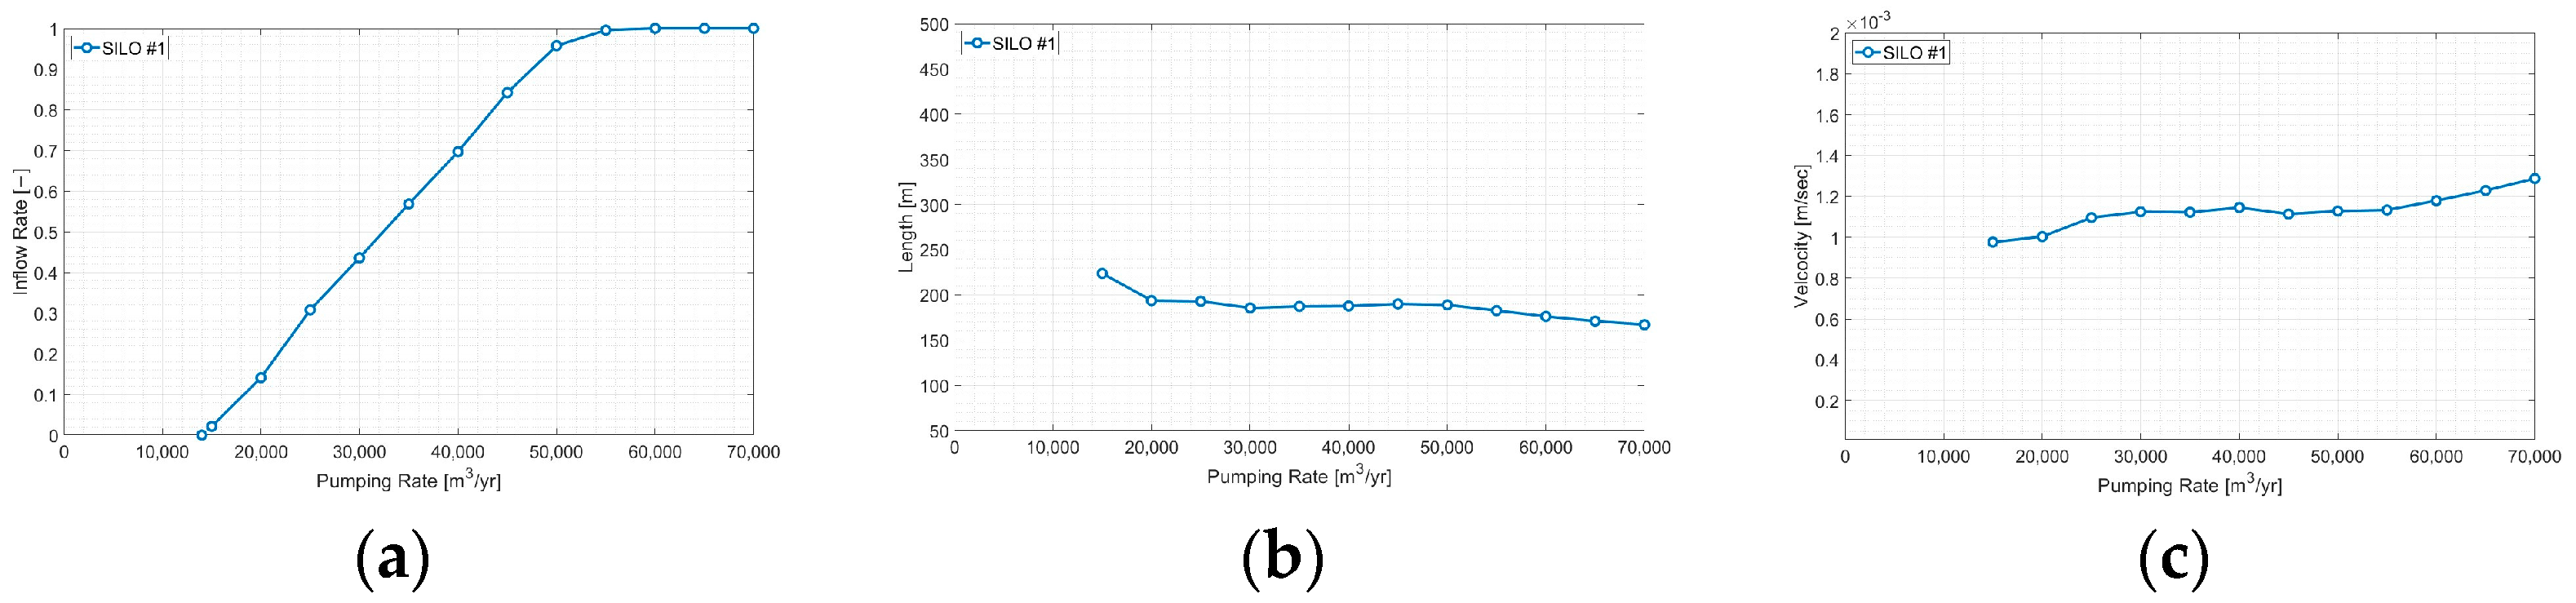
Figure 22.
Contaminant transport analysis at representative well (1E-1) in Section #1 under varying pumping rates: (a) correlation between pumping rates and particle inflow ratios; (b) relationship between pumping rates and contaminant transport distances; (c) relationship between pumping rates and Darcy velocities.
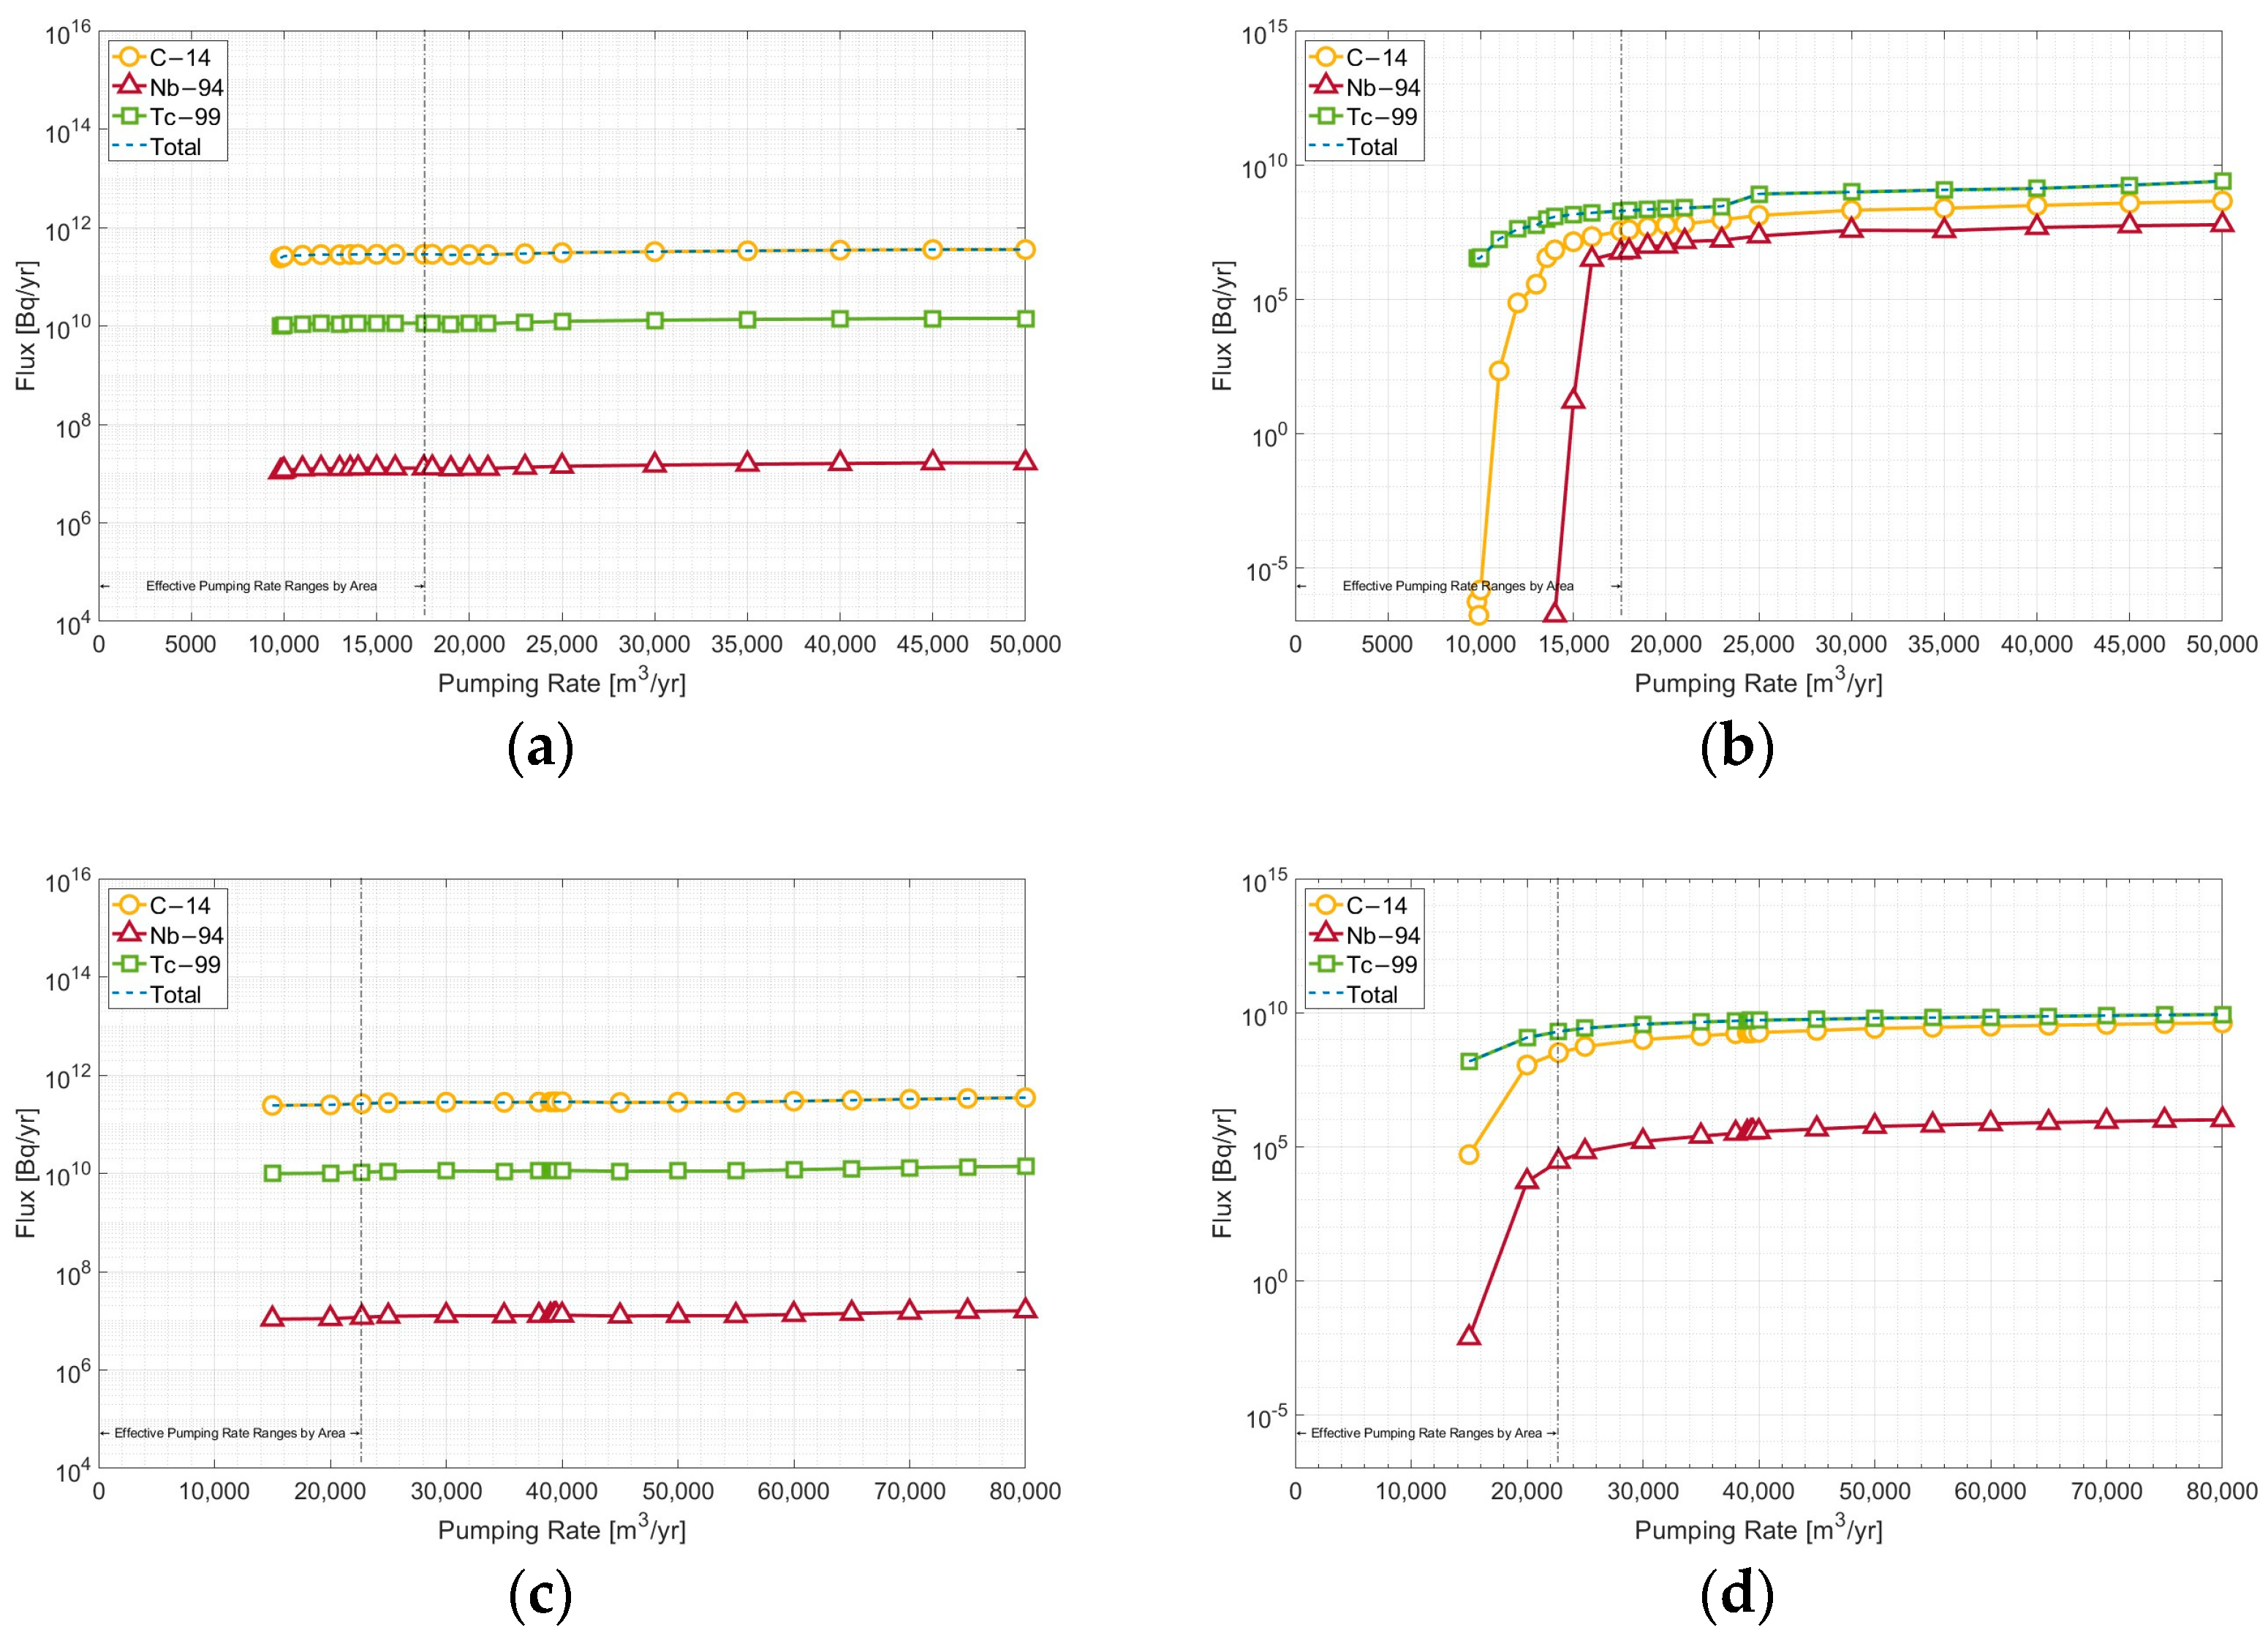
Figure 23.
Variations in near-field and far-field flux with respect to changes in pumping rates: (a) near-field flux at Section #1 (1E-1); (b) far-field flux at Section #1 (1E-1); (c) near-field flux at Section #2 (2J-1); (d) far-field flux at Section #2 (2J-1).
Figure 23.
Variations in near-field and far-field flux with respect to changes in pumping rates: (a) near-field flux at Section #1 (1E-1); (b) far-field flux at Section #1 (1E-1); (c) near-field flux at Section #2 (2J-1); (d) far-field flux at Section #2 (2J-1).
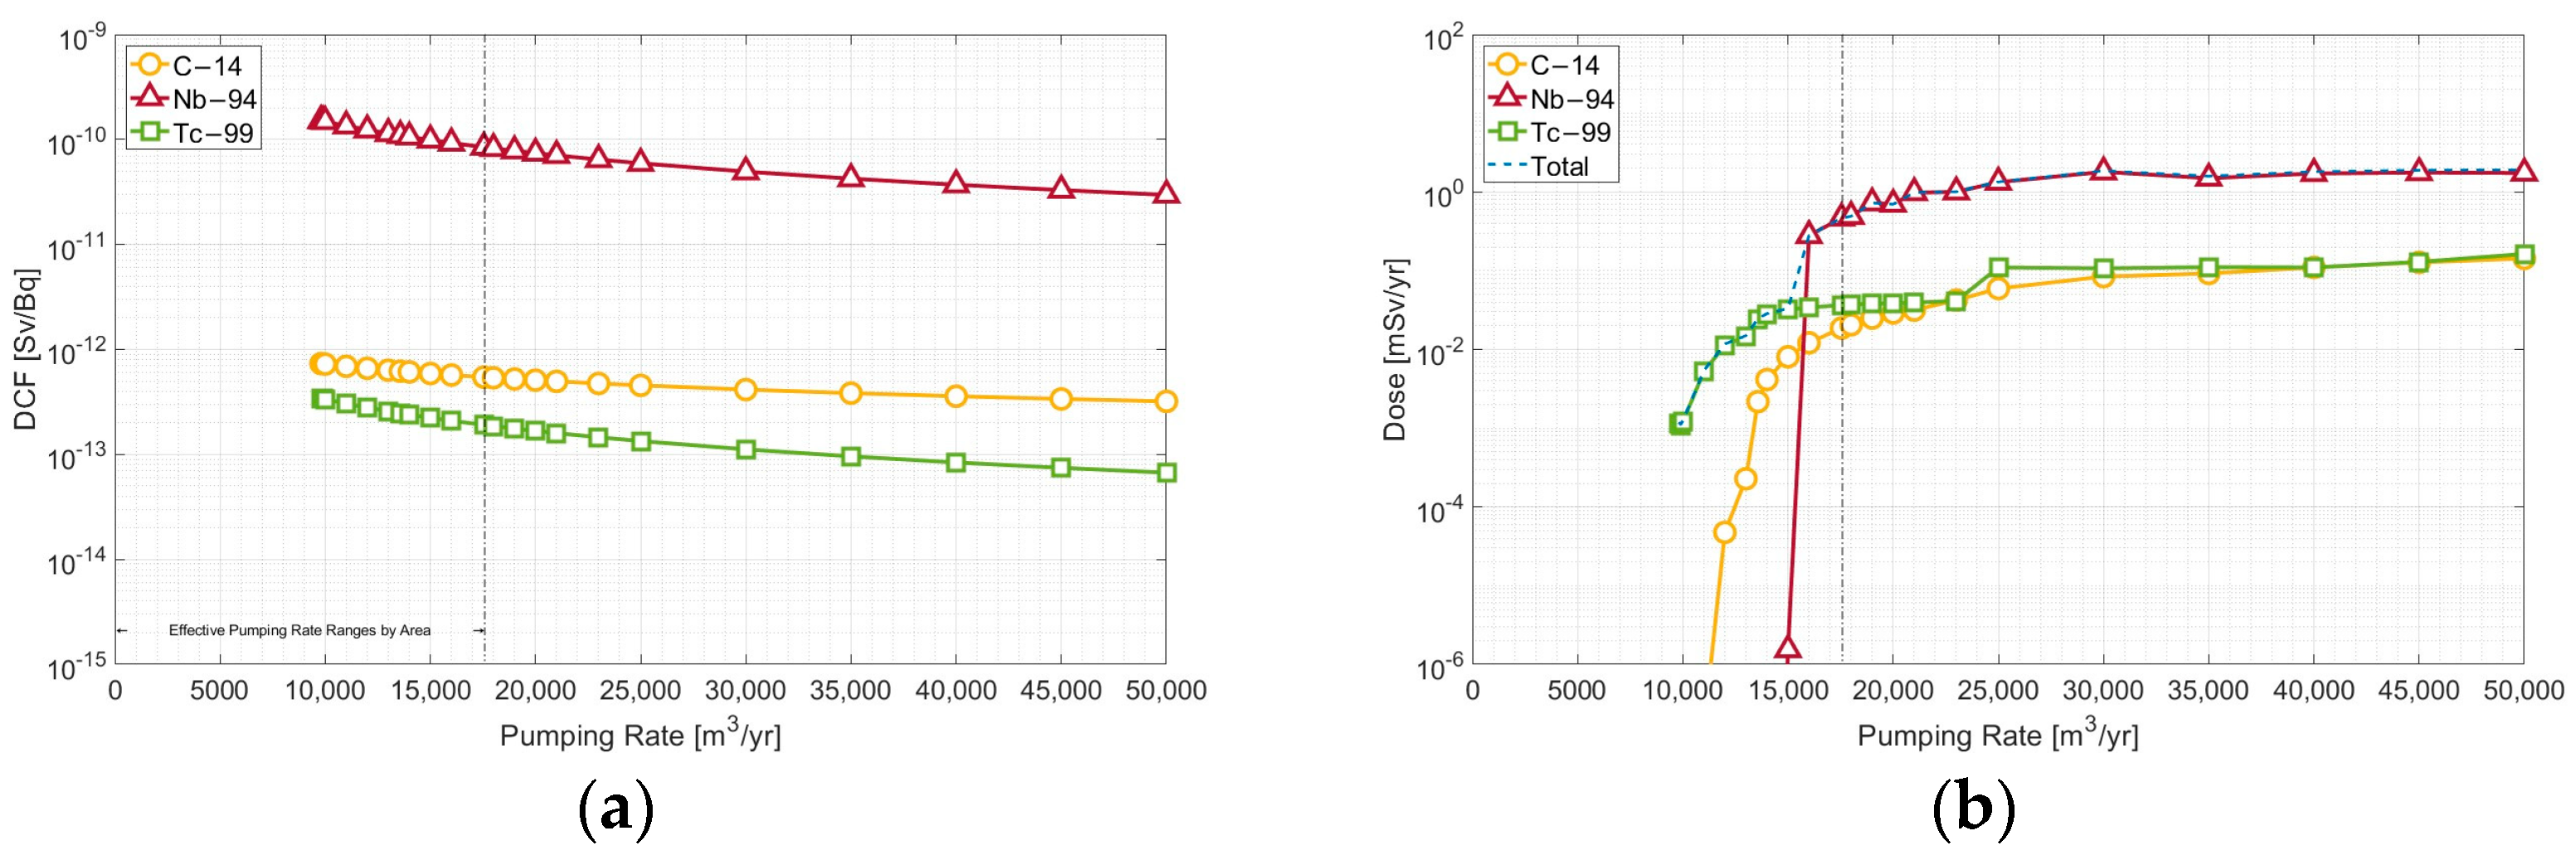
Figure 24.
Variations in DCF and dose with respect to changes in pumping rates in Section #1: (a) DCF at Section #1 (1E-1); (b) dose at Section #1 (1E-1).
Figure 24.
Variations in DCF and dose with respect to changes in pumping rates in Section #1: (a) DCF at Section #1 (1E-1); (b) dose at Section #1 (1E-1).
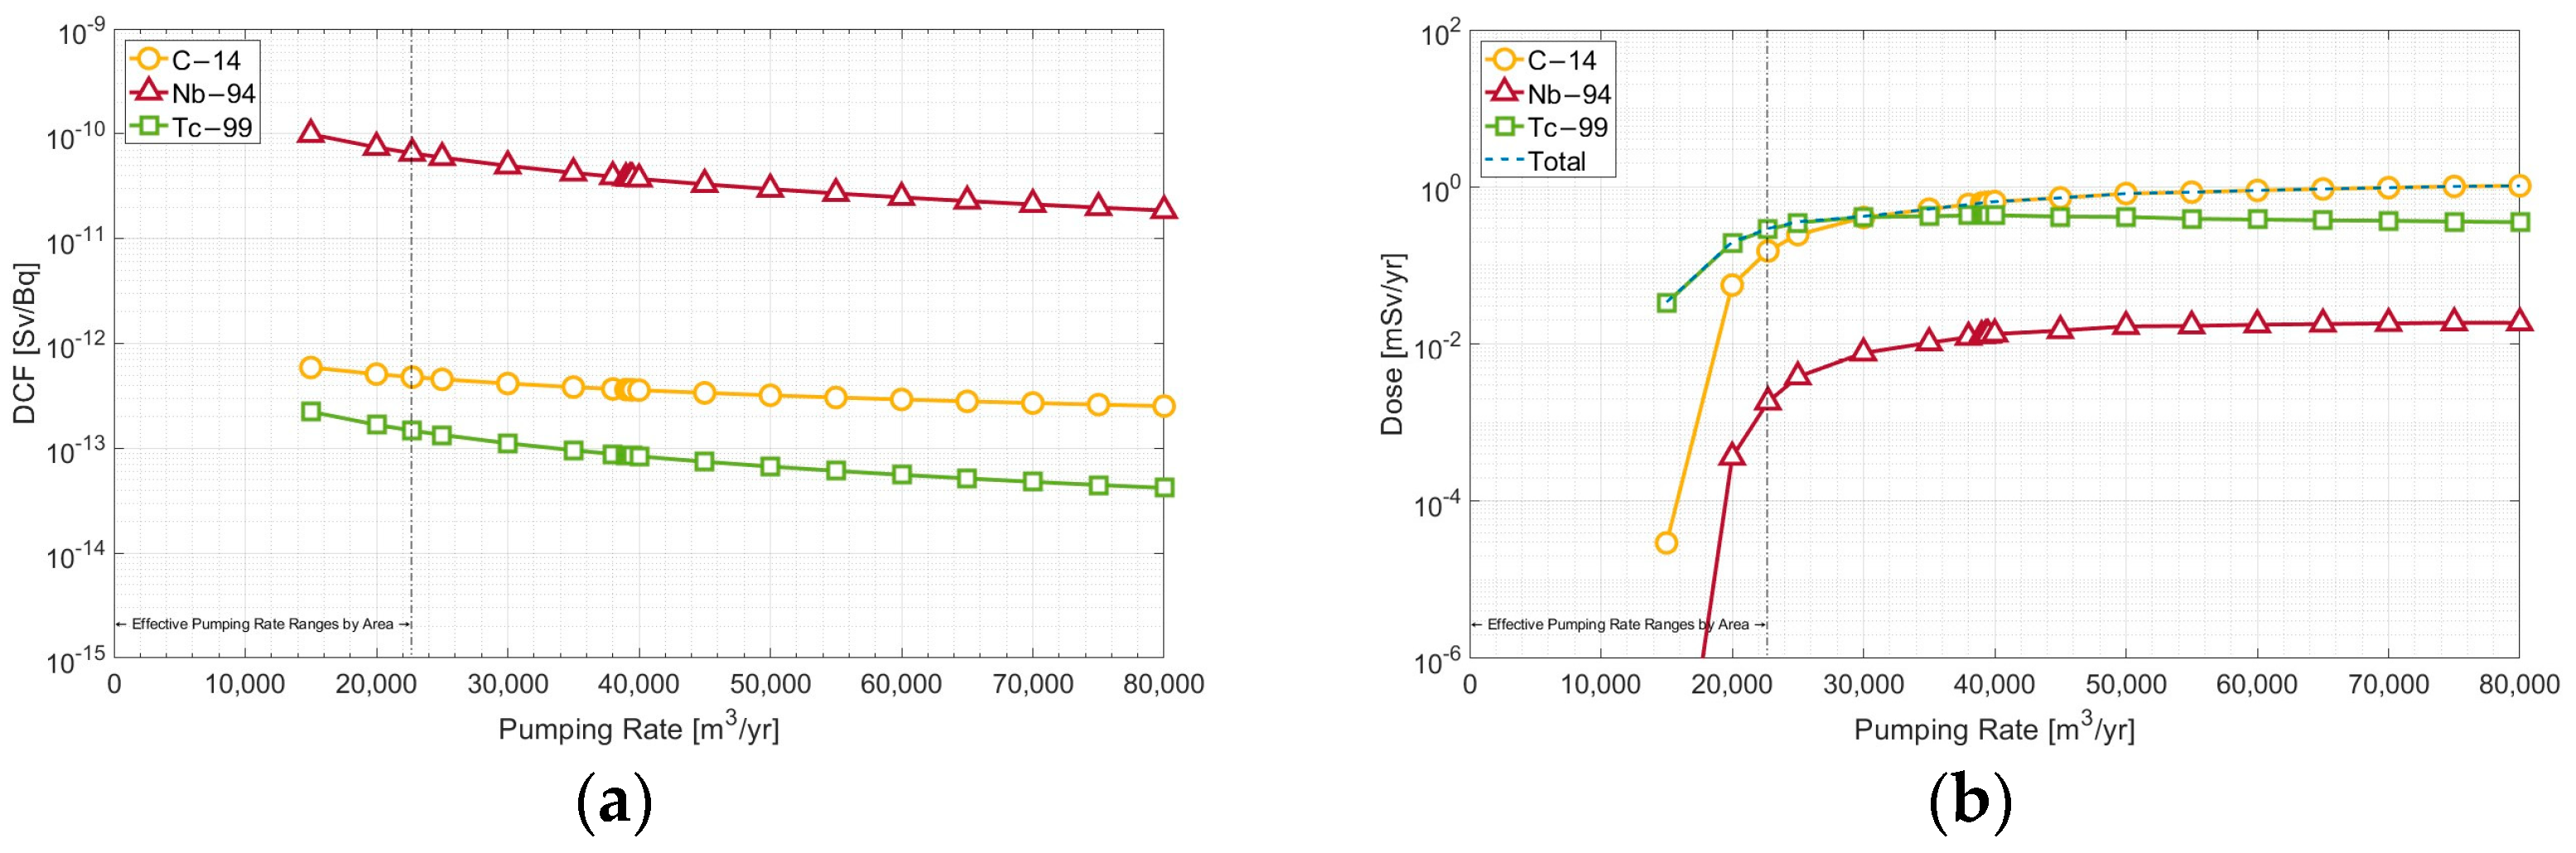
Figure 25.
Variations in DCF and dose with respect to changes in pumping rates in Section #2: (a) DCF at Section #2 (2J-1); (b) dose at Section #2 (2J-1).
Figure 25.
Variations in DCF and dose with respect to changes in pumping rates in Section #2: (a) DCF at Section #2 (2J-1); (b) dose at Section #2 (2J-1).
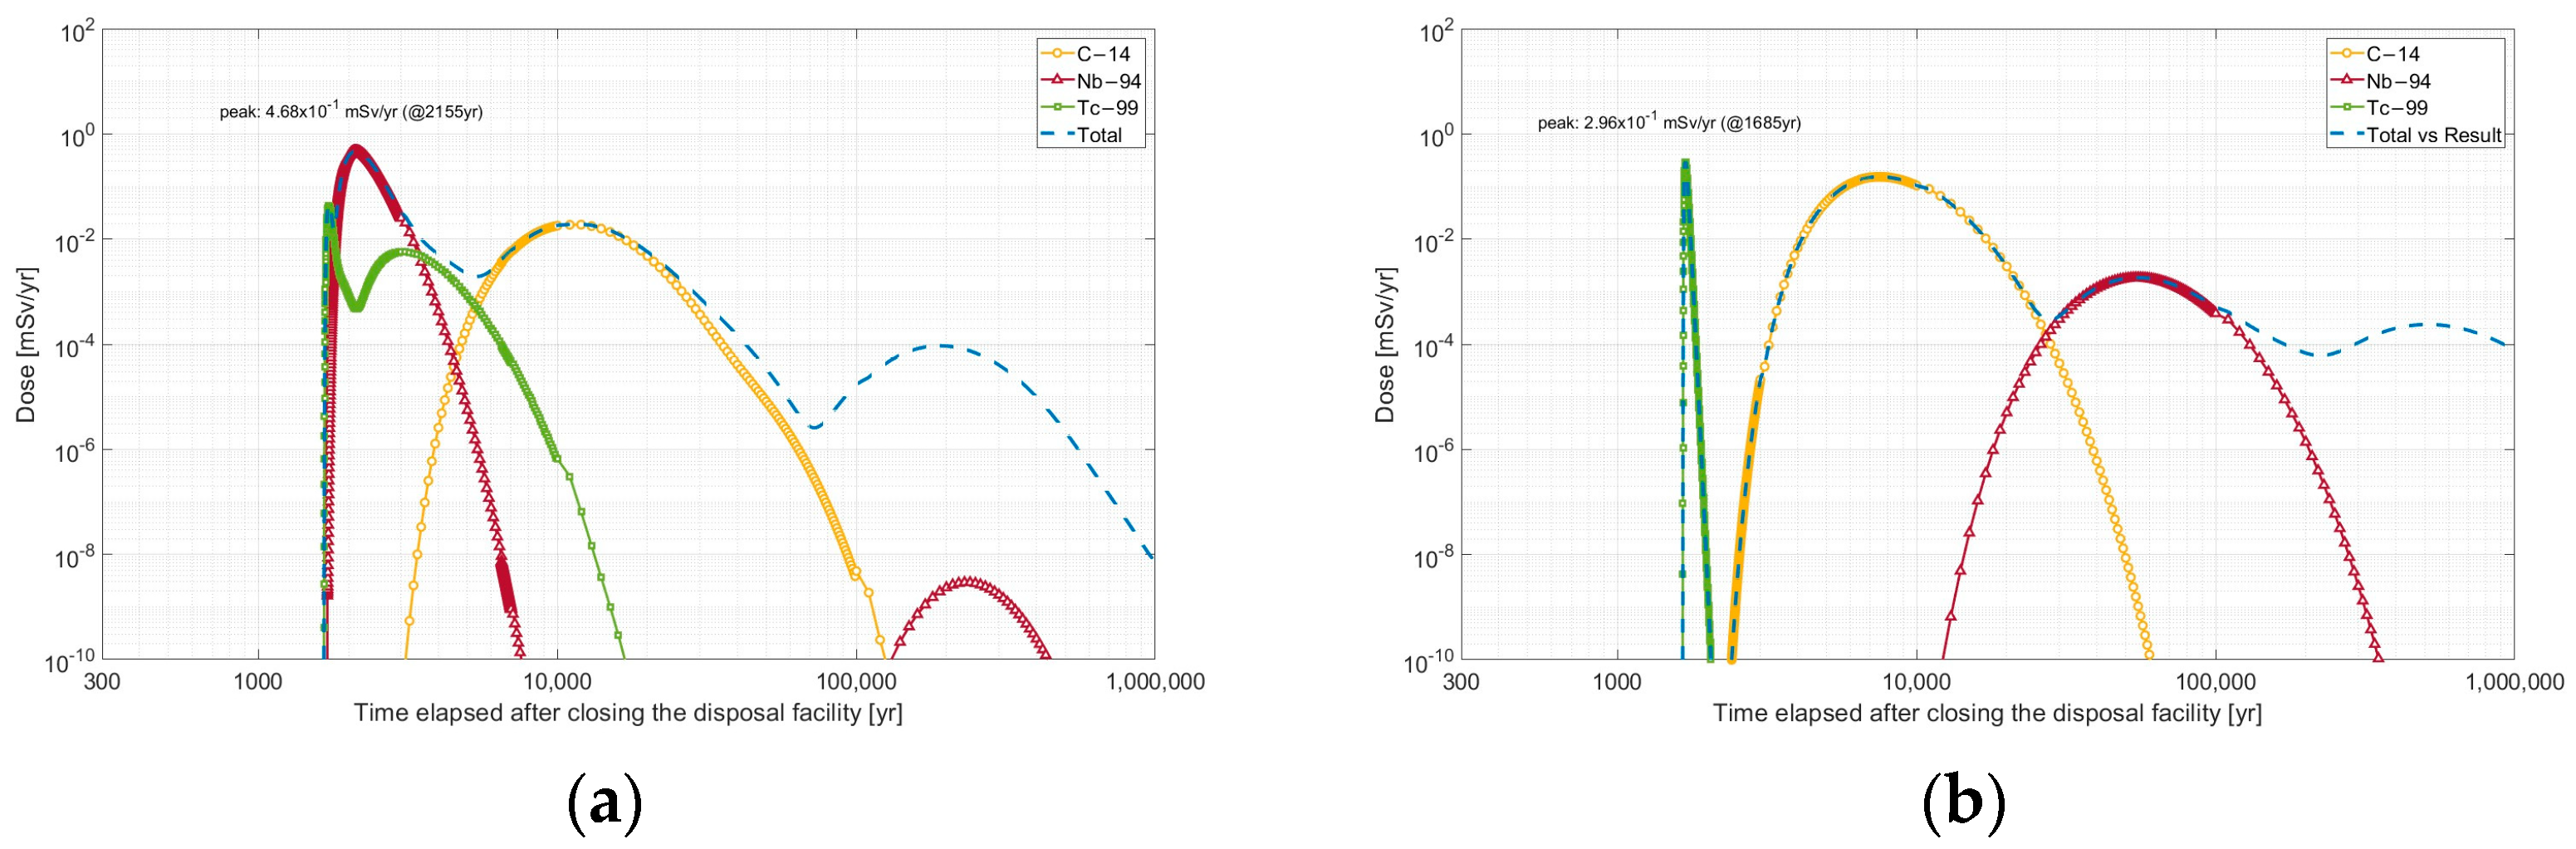
Figure 26.
Dose evaluation results at representative locations: (a) representative well in Section #1 (1E-1); (b) representative well in Section #2 (2J-1).
Figure 26.
Dose evaluation results at representative locations: (a) representative well in Section #1 (1E-1); (b) representative well in Section #2 (2J-1).
Table 1.
Land use status within 10 km radius of the Wolsong LILW Disposal Center site.
Table 1.
Land use status within 10 km radius of the Wolsong LILW Disposal Center site.
| Land Use Type | Fields | Paddies | Orchards | Pasture | Forestland | Other 1 |
|---|
| Area [ha] | 849.1 | 1823.3 | 5.8 | 11.7 | 11,229.2 | 1776.2 |
| Percentage [%] | 5.41 | 11.62 | 0.04 | 0.07 | 71.55 | 11.32 |
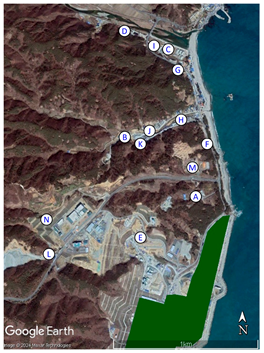
Table 2.
Specifications and characteristics of pre-existing wells within the site boundary.
Table 2.
Specifications and characteristics of pre-existing wells within the site boundary.
| Location | ID | Usage | Potable | Capacity [m3/year] | Depth [m] | Diameter [m] |
|---|
![Water 17 00186 i001]() | A | Domestic | Yes | 3600 | 100 | 0.15 |
| B | Domestic | Yes | 3500 | 90 | 0.20 |
| C | Domestic | Yes | - | 100 | 0.15 |
| D | Domestic | No | - | 100 | 0.15 |
| E | Domestic | Yes | 24,000 | 100 | 0.15 |
| F | Domestic | Yes | 9000 | 100 | 0.15 |
| G | Domestic | Yes | - | 100 | 0.15 |
| H | Domestic | No | 3600 | 35 | 0.10 |
| I | Domestic | No | - | 100 | 0.15 |
| J | Domestic | No | - | 100 | 0.15 |
| K | Domestic | No | - | 100 | 0.20 |
| L | Domestic | Yes | 17,500 | 60 | 0.15 |
| M | Domestic | Yes | 18,000 | 100 | 0.20 |
| N | Agricultural | No | 50,000 | 50 | 0.15 |
Table 3.
Particle influx ratios for hypothetical wells in Section #1.
Table 3.
Particle influx ratios for hypothetical wells in Section #1.
| Well | Particle Inflow Ratio (-) |
|---|
| SILO #1 | SILO #2 | SILO #3 | SILO #4 | SILO #5 | SILO #6 | Mean |
|---|
| 1A-1 | 0.357 | 0.022 | 0.394 | 0.037 | - | - | 0.135 |
| 1B-1 | 0.252 | 0.032 | 0.074 | 0.424 | - | - | 0.130 |
| 1C-1 | 0.271 | 0.036 | 0.491 | 0.110 | - | - | 0.151 |
| 1D-1 | 0.180 | 0.008 | 0.350 | 0.146 | 0.032 | - | 0.119 |
| 1E-1 | 0.250 | 0.023 | 0.696 | 0.122 | 0.143 | - | 0.206 |
| 1A-2 | 0.439 | | 0.397 | - | - | - | 0.139 |
| 1B-2 | 0.348 | | 0.452 | - | - | - | 0.133 |
| 1C-2 | 0.283 | 0.032 | 0.475 | - | - | - | 0.132 |
| 1D-2 | 0.177 | 0.036 | 0.487 | - | 0.021 | - | 0.120 |
| 1A-3 | 0.339 | - | 0.305 | - | - | - | 0.107 |
| 1B-3 | - | - | 0.025 | - | - | - | 0.004 |
| 1C-3 | 0.113 | - | 0.408 | - | - | - | 0.087 |
| 1D-3 | - | - | - | - | - | - | 0.000 |
| 1E-3 | - | - | - | - | - | - | 0.000 |
| 1A-4 | 0.068 | - | 0.057 | - | - | - | 0.021 |
| 1C-4 | 0.107 | - | 0.122 | - | - | - | 0.038 |
| 1D-4 | 0.131 | - | 0.176 | - | - | - | 0.051 |
| 1A-5 | 0.236 | - | 0.024 | - | - | - | 0.043 |
| 1C-5 | 0.111 | - | 0.372 | - | - | - | 0.081 |
| 1D-5 | 0.120 | - | 0.270 | - | - | - | 0.065 |
| 1A-6 | 0.371 | - | 0.052 | - | - | - | 0.071 |
| 1B-6 | - | - | - | - | - | - | 0.000 |
| 1C-6 | 0.351 | - | 0.121 | - | - | - | 0.079 |
| 1D-6 | 0.353 | - | 0.322 | - | - | - | 0.113 |
| 1E-6 | 0.446 | - | 0.237 | - | - | - | 0.114 |
| 1A-7 | 0.214 | - | - | - | - | - | 0.036 |
| 1C-7 | 0.130 | - | 0.028 | - | - | - | 0.026 |
| 1D-7 | 0.235 | - | 0.050 | - | - | - | 0.048 |
| 1E-7 | 0.242 | - | 0.155 | - | - | - | 0.066 |
| 1A-8 | 0.121 | - | - | - | - | - | 0.020 |
| 1B-8 | 0.453 | 0.015 | 0.611 | 0.007 | 0.105 | - | 0.199 |
| 1C-8 | 0.117 | - | 0.018 | - | - | - | 0.023 |
| 1D-8 | 0.157 | - | 0.060 | - | - | - | 0.036 |
| 1E-9 | 0.175 | - | 0.043 | - | - | - | 0.036 |
Table 4.
Mean contaminant transport distances during hypothetical well pumping in Section #1.
Table 4.
Mean contaminant transport distances during hypothetical well pumping in Section #1.
| Well | Mean Transport Distances of Radionuclides (m) |
|---|
| SILO #1 | SILO #2 | SILO #3 | SILO #4 | SILO #5 | SILO #6 | Mean |
|---|
| 1A-1 | 226.7 | 379.9 | 74.5 | 249.6 | - | - | 232.7 |
| 1B-1 | 249.8 | 352.9 | 108.0 | 275.2 | - | - | 246.5 |
| 1C-1 | 245.0 | 321.2 | 96.6 | 238.2 | - | - | 225.3 |
| 1D-1 | 275.7 | 312.6 | 135.8 | 248.7 | 139.0 | - | 222.4 |
| 1E-1 | 289.0 | 309.5 | 149.4 | 302.6 | 117.7 | - | 233.6 |
Table 5.
Mean groundwater Darcy velocities during hypothetical well pumping in Section #1.
Table 5.
Mean groundwater Darcy velocities during hypothetical well pumping in Section #1.
| Well | Mean Groundwater Darcy Velocities (m/day) |
|---|
| SILO #1 | SILO #2 | SILO #3 | SILO #4 | SILO #5 | SILO #6 | Mean |
|---|
| 1A-1 | 2.05 × 10⁻⁹ | 5.65 × 10⁻⁹ | 3.98 × 10⁻⁹ | 3.15 × 10⁻⁹ | - | - | 3.71 × 10⁻⁹ |
| 1B-1 | 2.31 × 10⁻⁹ | 7.35 × 10⁻⁹ | 3.76 × 10⁻⁹ | 1.95 × 10⁻⁹ | - | - | 3.84 × 10⁻⁹ |
| 1C-1 | 1.95 × 10⁻⁹ | 1.03 × 10⁻⁸ | 3.47 × 10⁻⁹ | 2.01 × 10⁻⁹ | - | - | 4.44 × 10⁻⁹ |
| 1D-1 | 2.44 × 10⁻⁹ | 1.69 × 10⁻⁸ | 3.16 × 10⁻⁹ | 2.08 × 10⁻⁹ | 7.41 × 10⁻⁹ | - | 6.41 × 10⁻⁹ |
| 1E-1 | 2.20 × 10⁻⁹ | 1.07 × 10⁻⁸ | 3.44 × 10⁻⁹ | 2.74 × 10⁻⁹ | 6.37 × 10⁻⁹ | - | 5.16 × 10⁻⁹ |
Table 6.
Total radiation doses during hypothetical well pumping in Section #1.
Table 6.
Total radiation doses during hypothetical well pumping in Section #1.
| Category | 1A-1 | 1B-1 | 1C-1 | 1D-1 | 1E-1 |
|---|
| Total Dose [mSv/year] | 6.21 × 10⁻² | 2.30 × 10⁻¹ | 7.85 × 10⁻² | 3.12 × 10⁻¹ | 1.22 × 100 |
| Peak Time [year] | 1798 | 1819 | 2078 | 2199 | 1778 |
Table 7.
Particle influx ratios for hypothetical wells in Section #2.
Table 7.
Particle influx ratios for hypothetical wells in Section #2.
| Well | Particle Inflow Ratio (-) |
|---|
| SILO #1 | SILO #2 | SILO #3 | SILO #4 | SILO #5 | SILO #6 | Mean |
|---|
| 2H-1 | 0.607 | - | - | - | - | - | 0.607 |
| 2I-1 | 1.000 | - | - | - | - | - | 1.000 |
| 2J-1 | 1.000 | - | - | - | - | - | 1.000 |
| 2K-1 | 1.000 | - | - | - | - | - | 1.000 |
| 2H-2 | 0.064 | - | - | - | - | - | 0.064 |
| 2I-2 | 0.333 | - | - | - | - | - | 0.333 |
| 2J-2 | 0.833 | - | - | - | - | - | 0.833 |
| 2K-2 | 0.868 | - | - | - | - | - | 0.868 |
| 2L-2 | 0.692 | - | - | - | - | - | 0.692 |
| 2M-2 | 0.936 | - | - | - | - | - | 0.936 |
| 2N-2 | 0.996 | - | - | - | - | - | 0.996 |
| 2O-2 | 0.996 | - | - | - | - | - | 0.996 |
| 2I-3 | 0.128 | - | - | - | - | - | 0.128 |
| 2J-3 | 0.261 | - | - | - | - | - | 0.261 |
Table 8.
Mean contaminant transport distances during hypothetical well pumping in Section #2.
Table 8.
Mean contaminant transport distances during hypothetical well pumping in Section #2.
| Well | Mean Transport Distances of Radionuclides (m) |
|---|
| SILO #1 | SILO #2 | SILO #3 | SILO #4 | SILO #5 | SILO #6 | Mean |
|---|
| 2I-1 | 234.5 | - | - | - | - | - | 234.5 |
| 2J-1 | 158.6 | - | - | - | - | - | 158.6 |
| 2K-1 | 199.6 | - | - | - | - | - | 199.6 |
Table 9.
Mean groundwater Darcy velocities during hypothetical well pumping in Section #2.
Table 9.
Mean groundwater Darcy velocities during hypothetical well pumping in Section #2.
| Well | Mean Groundwater Darcy Velocities (m/day) |
|---|
| SILO #1 | SILO #2 | SILO #3 | SILO #4 | SILO #5 | SILO #6 | Mean |
|---|
| 2I-1 | 1.15 × 10⁻³ | - | - | - | - | - | 1.15 × 10⁻³ |
| 2J-1 | 1.42 × 10⁻³ | - | - | - | - | - | 1.42 × 10⁻³ |
| 2K-1 | 8.31 × 10⁻⁴ | - | - | - | - | - | 8.31 × 10⁻⁴ |


 ,
, 
