
Application of Machine Learning to Identify Influential Factors for Fecal Contamination of Shallow Groundwater


Abstract
1. Introduction
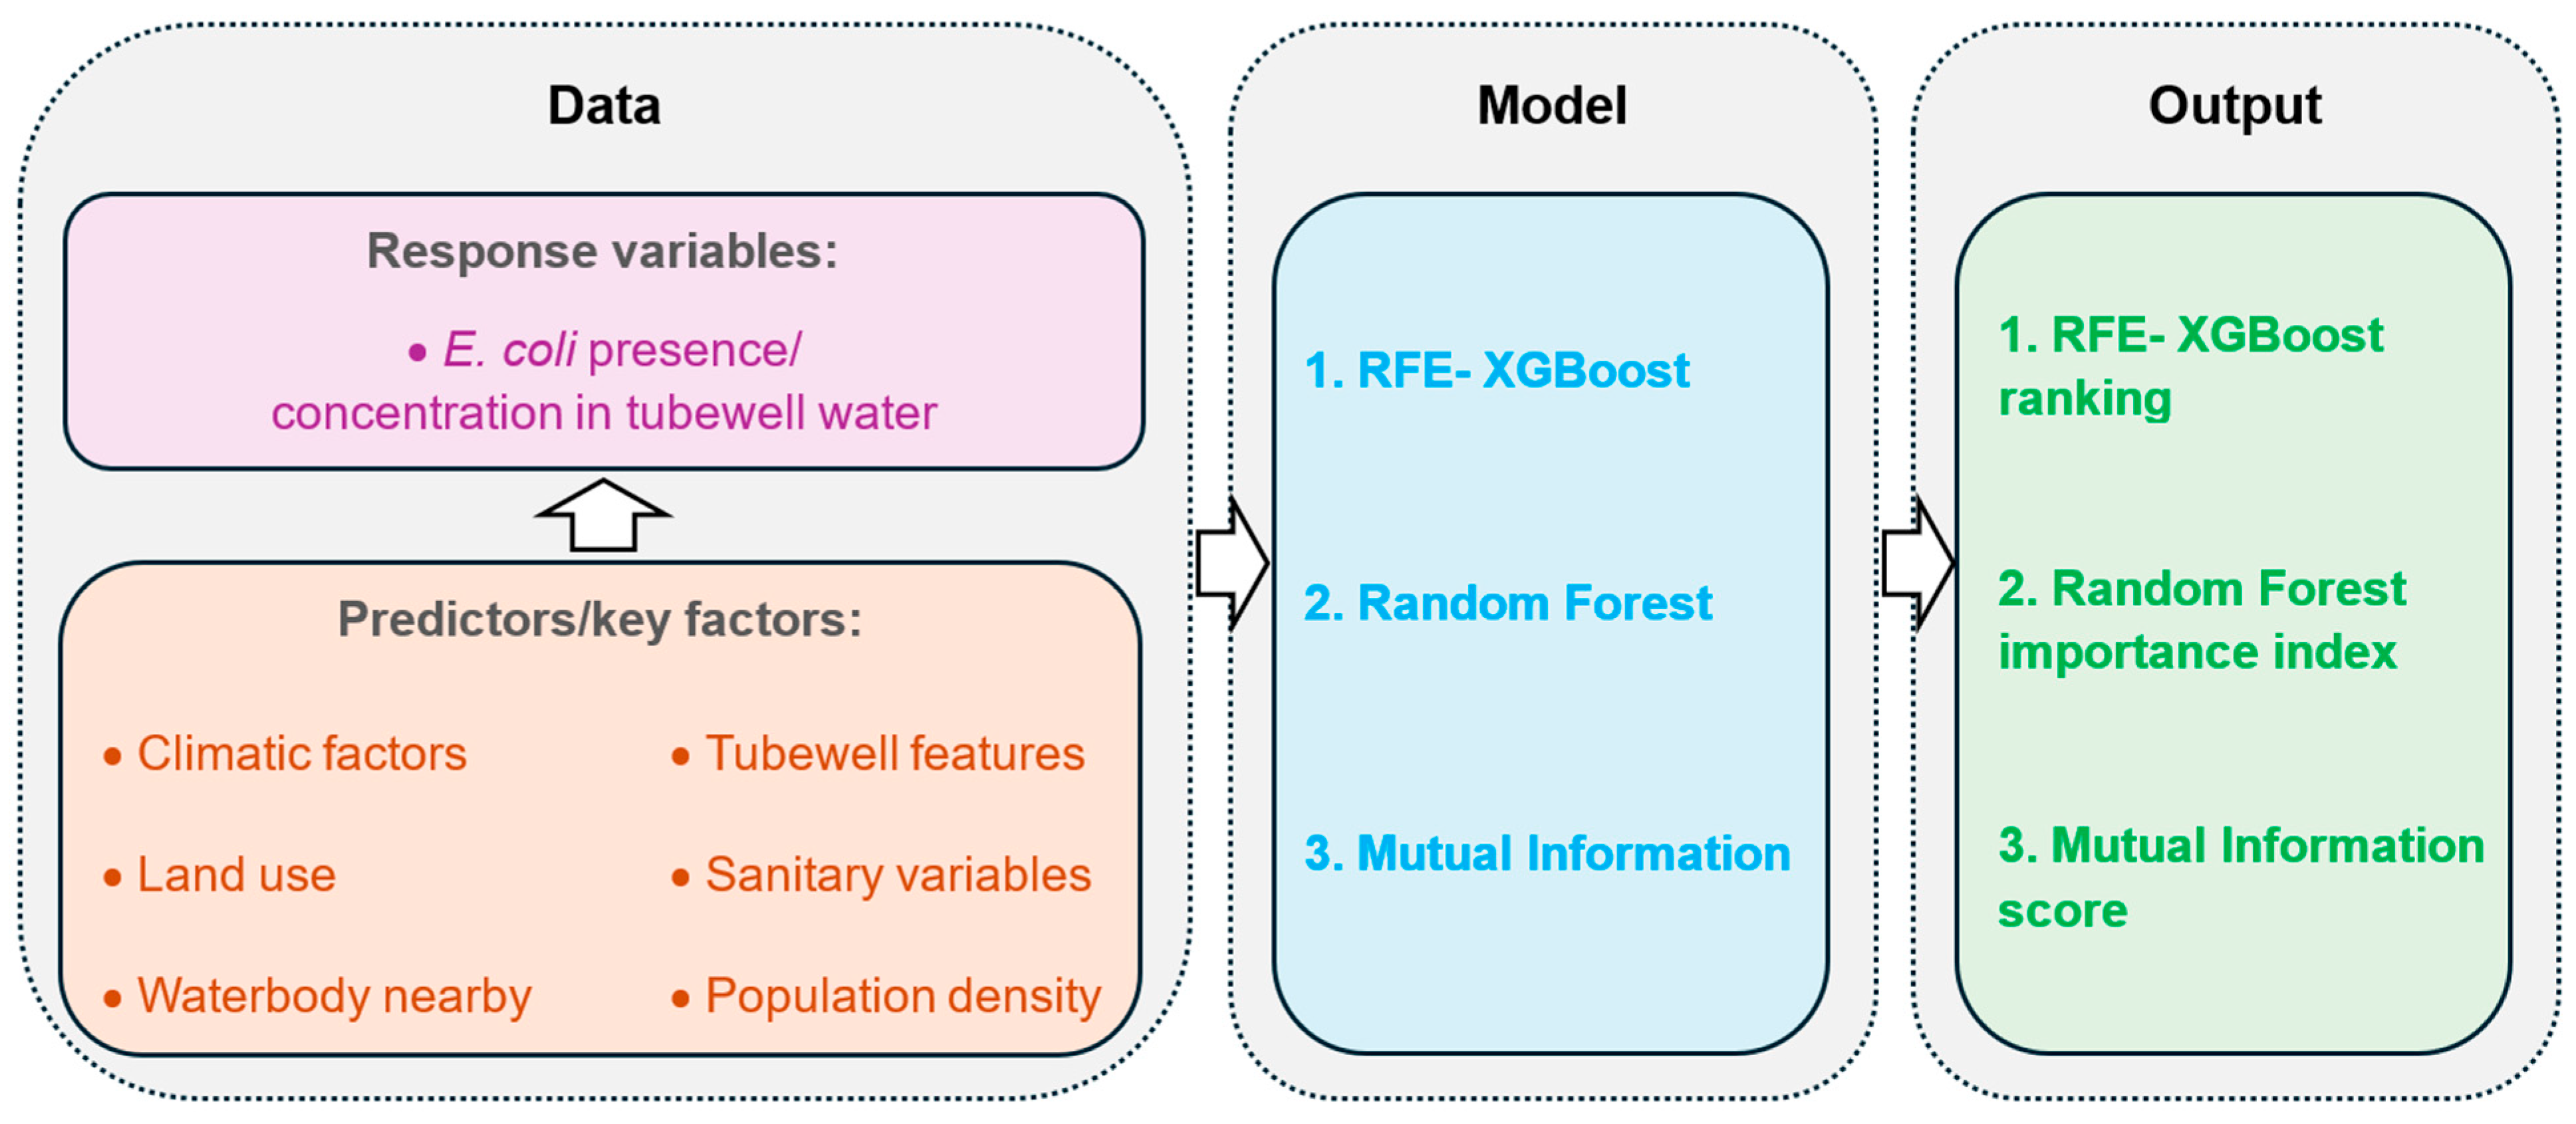
2. Materials and Methods
2.1. Study Sites and Sampling
2.2. Measurement of Microbial Contaminants
2.3. Survey of Tubewells and Sanitary Facilities
2.4. Land Use and Weather Data
2.5. Data Processing
2.6. Identifying Influential Factors Using Recursive Feature Elimination with XGBoost
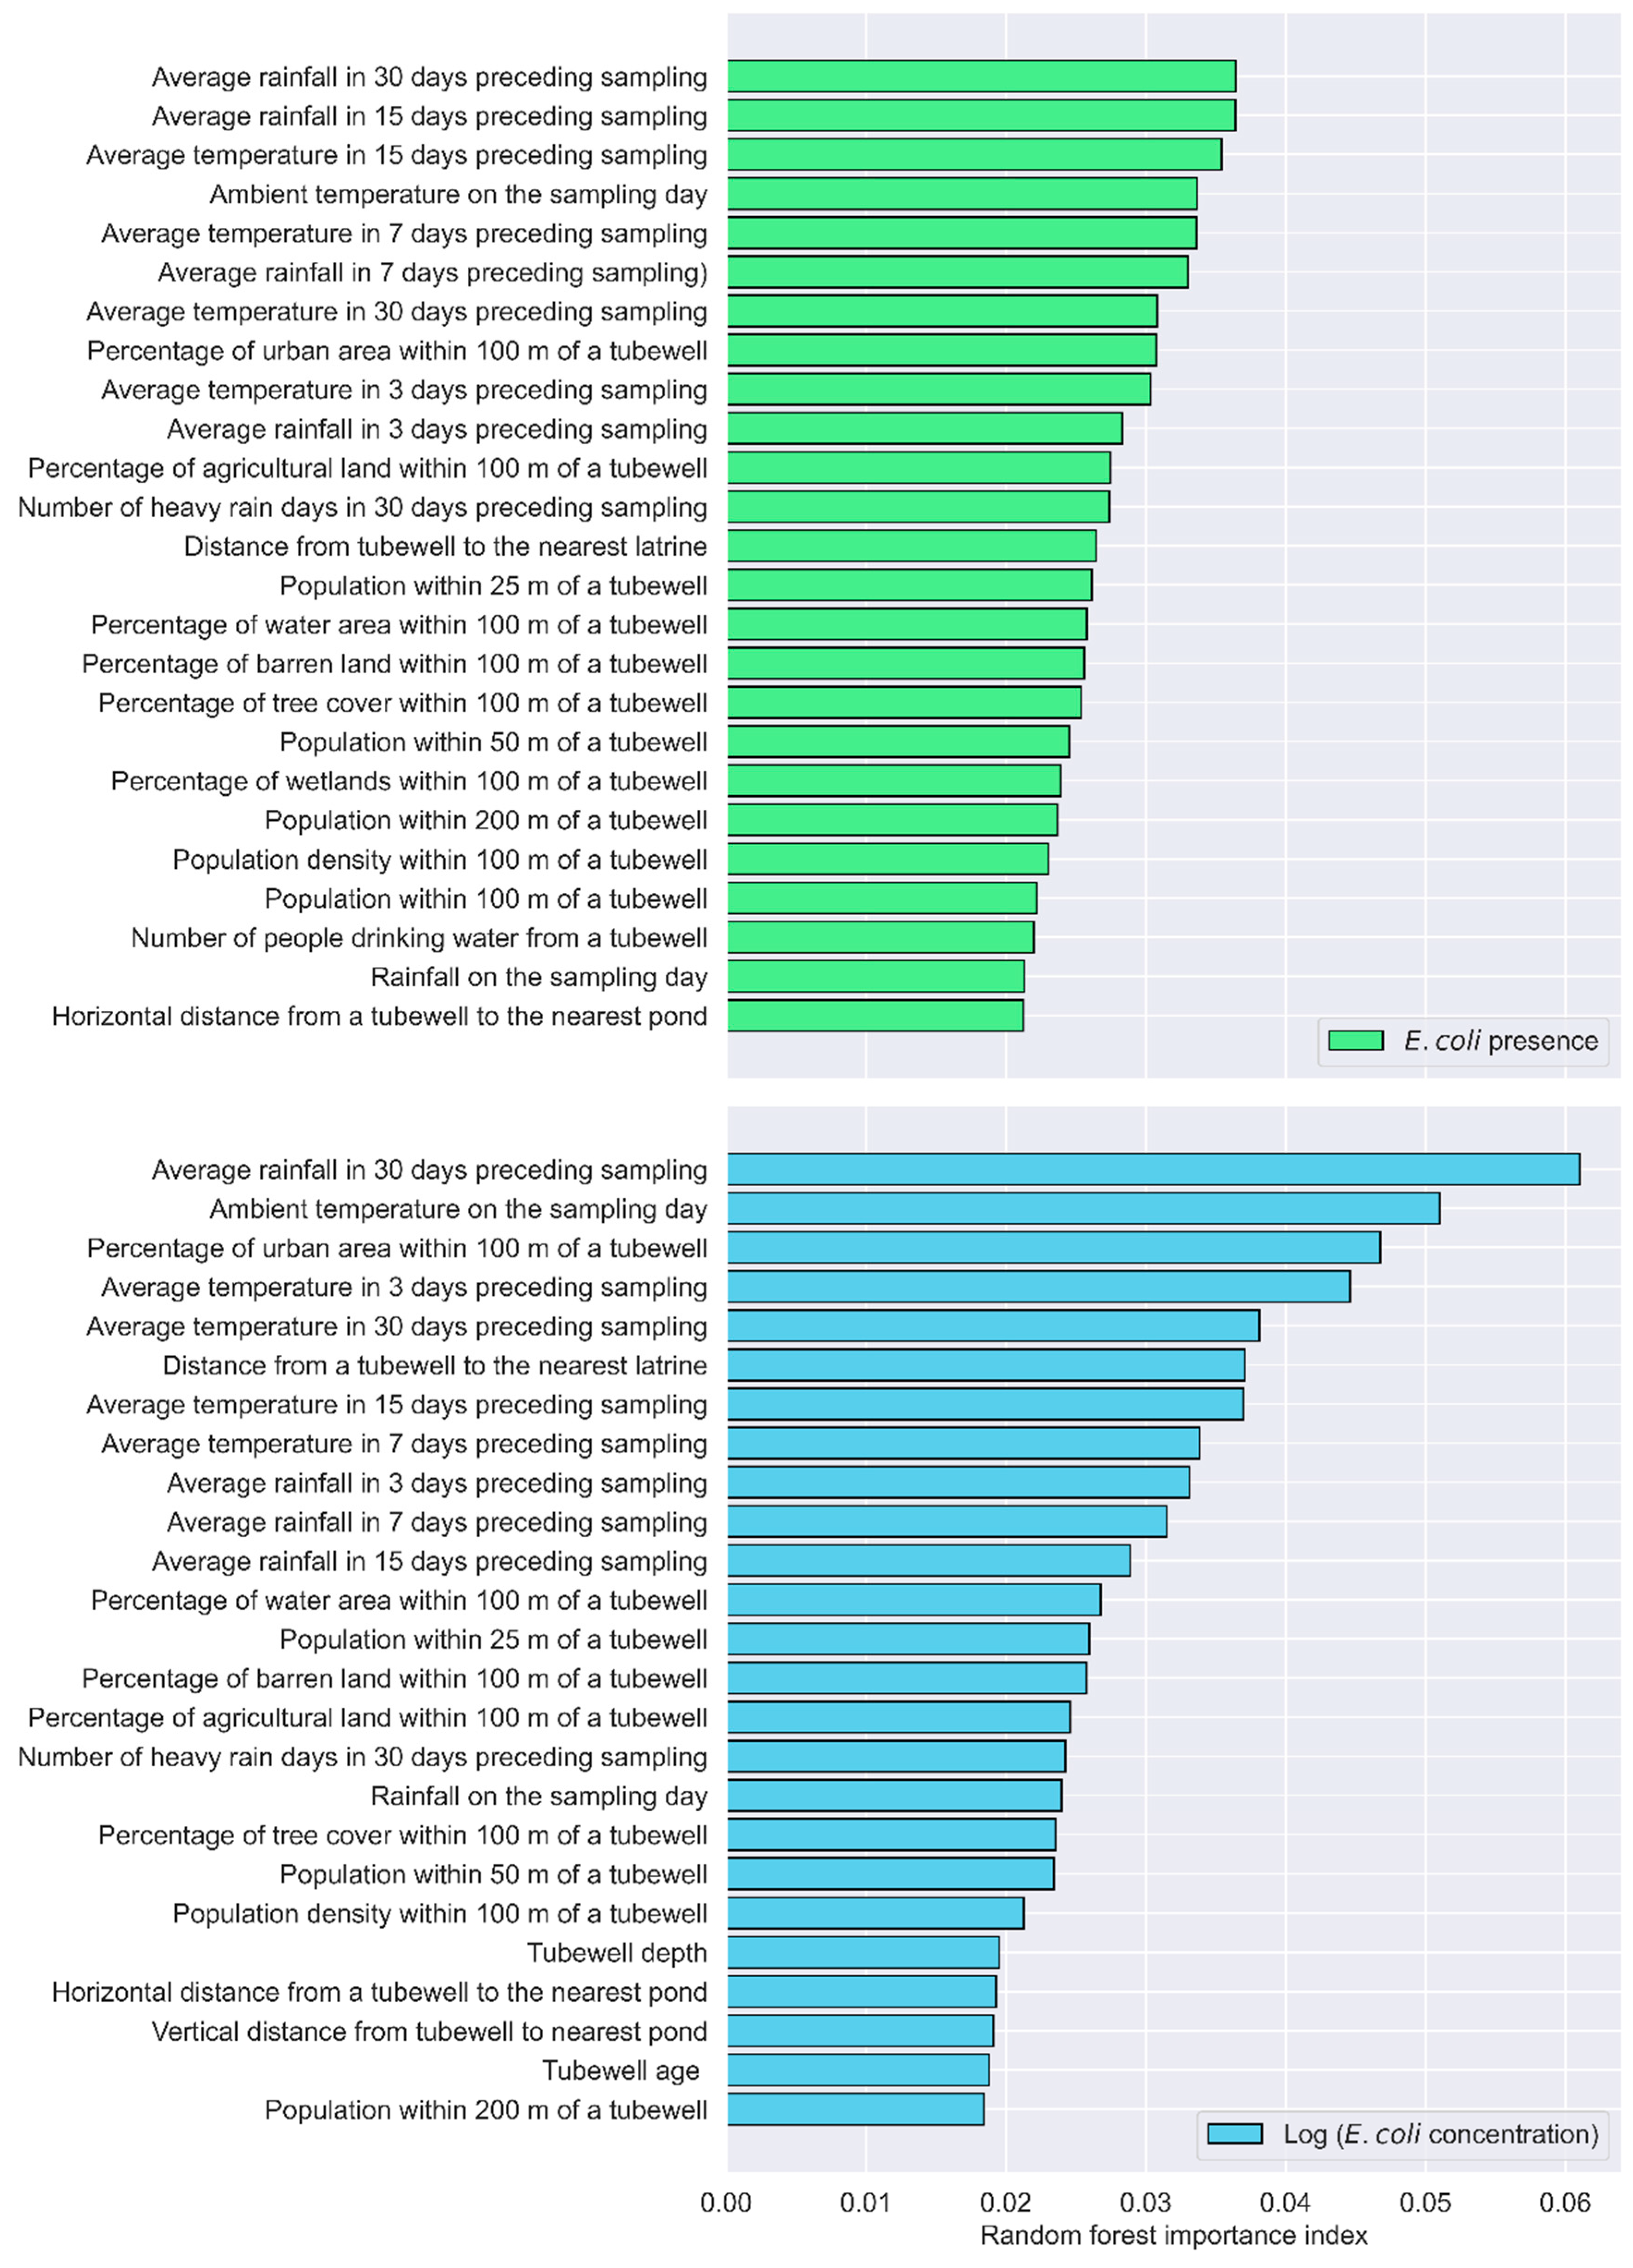
2.7. Identifying Influential Factors Using the Importance Index from Random Forest
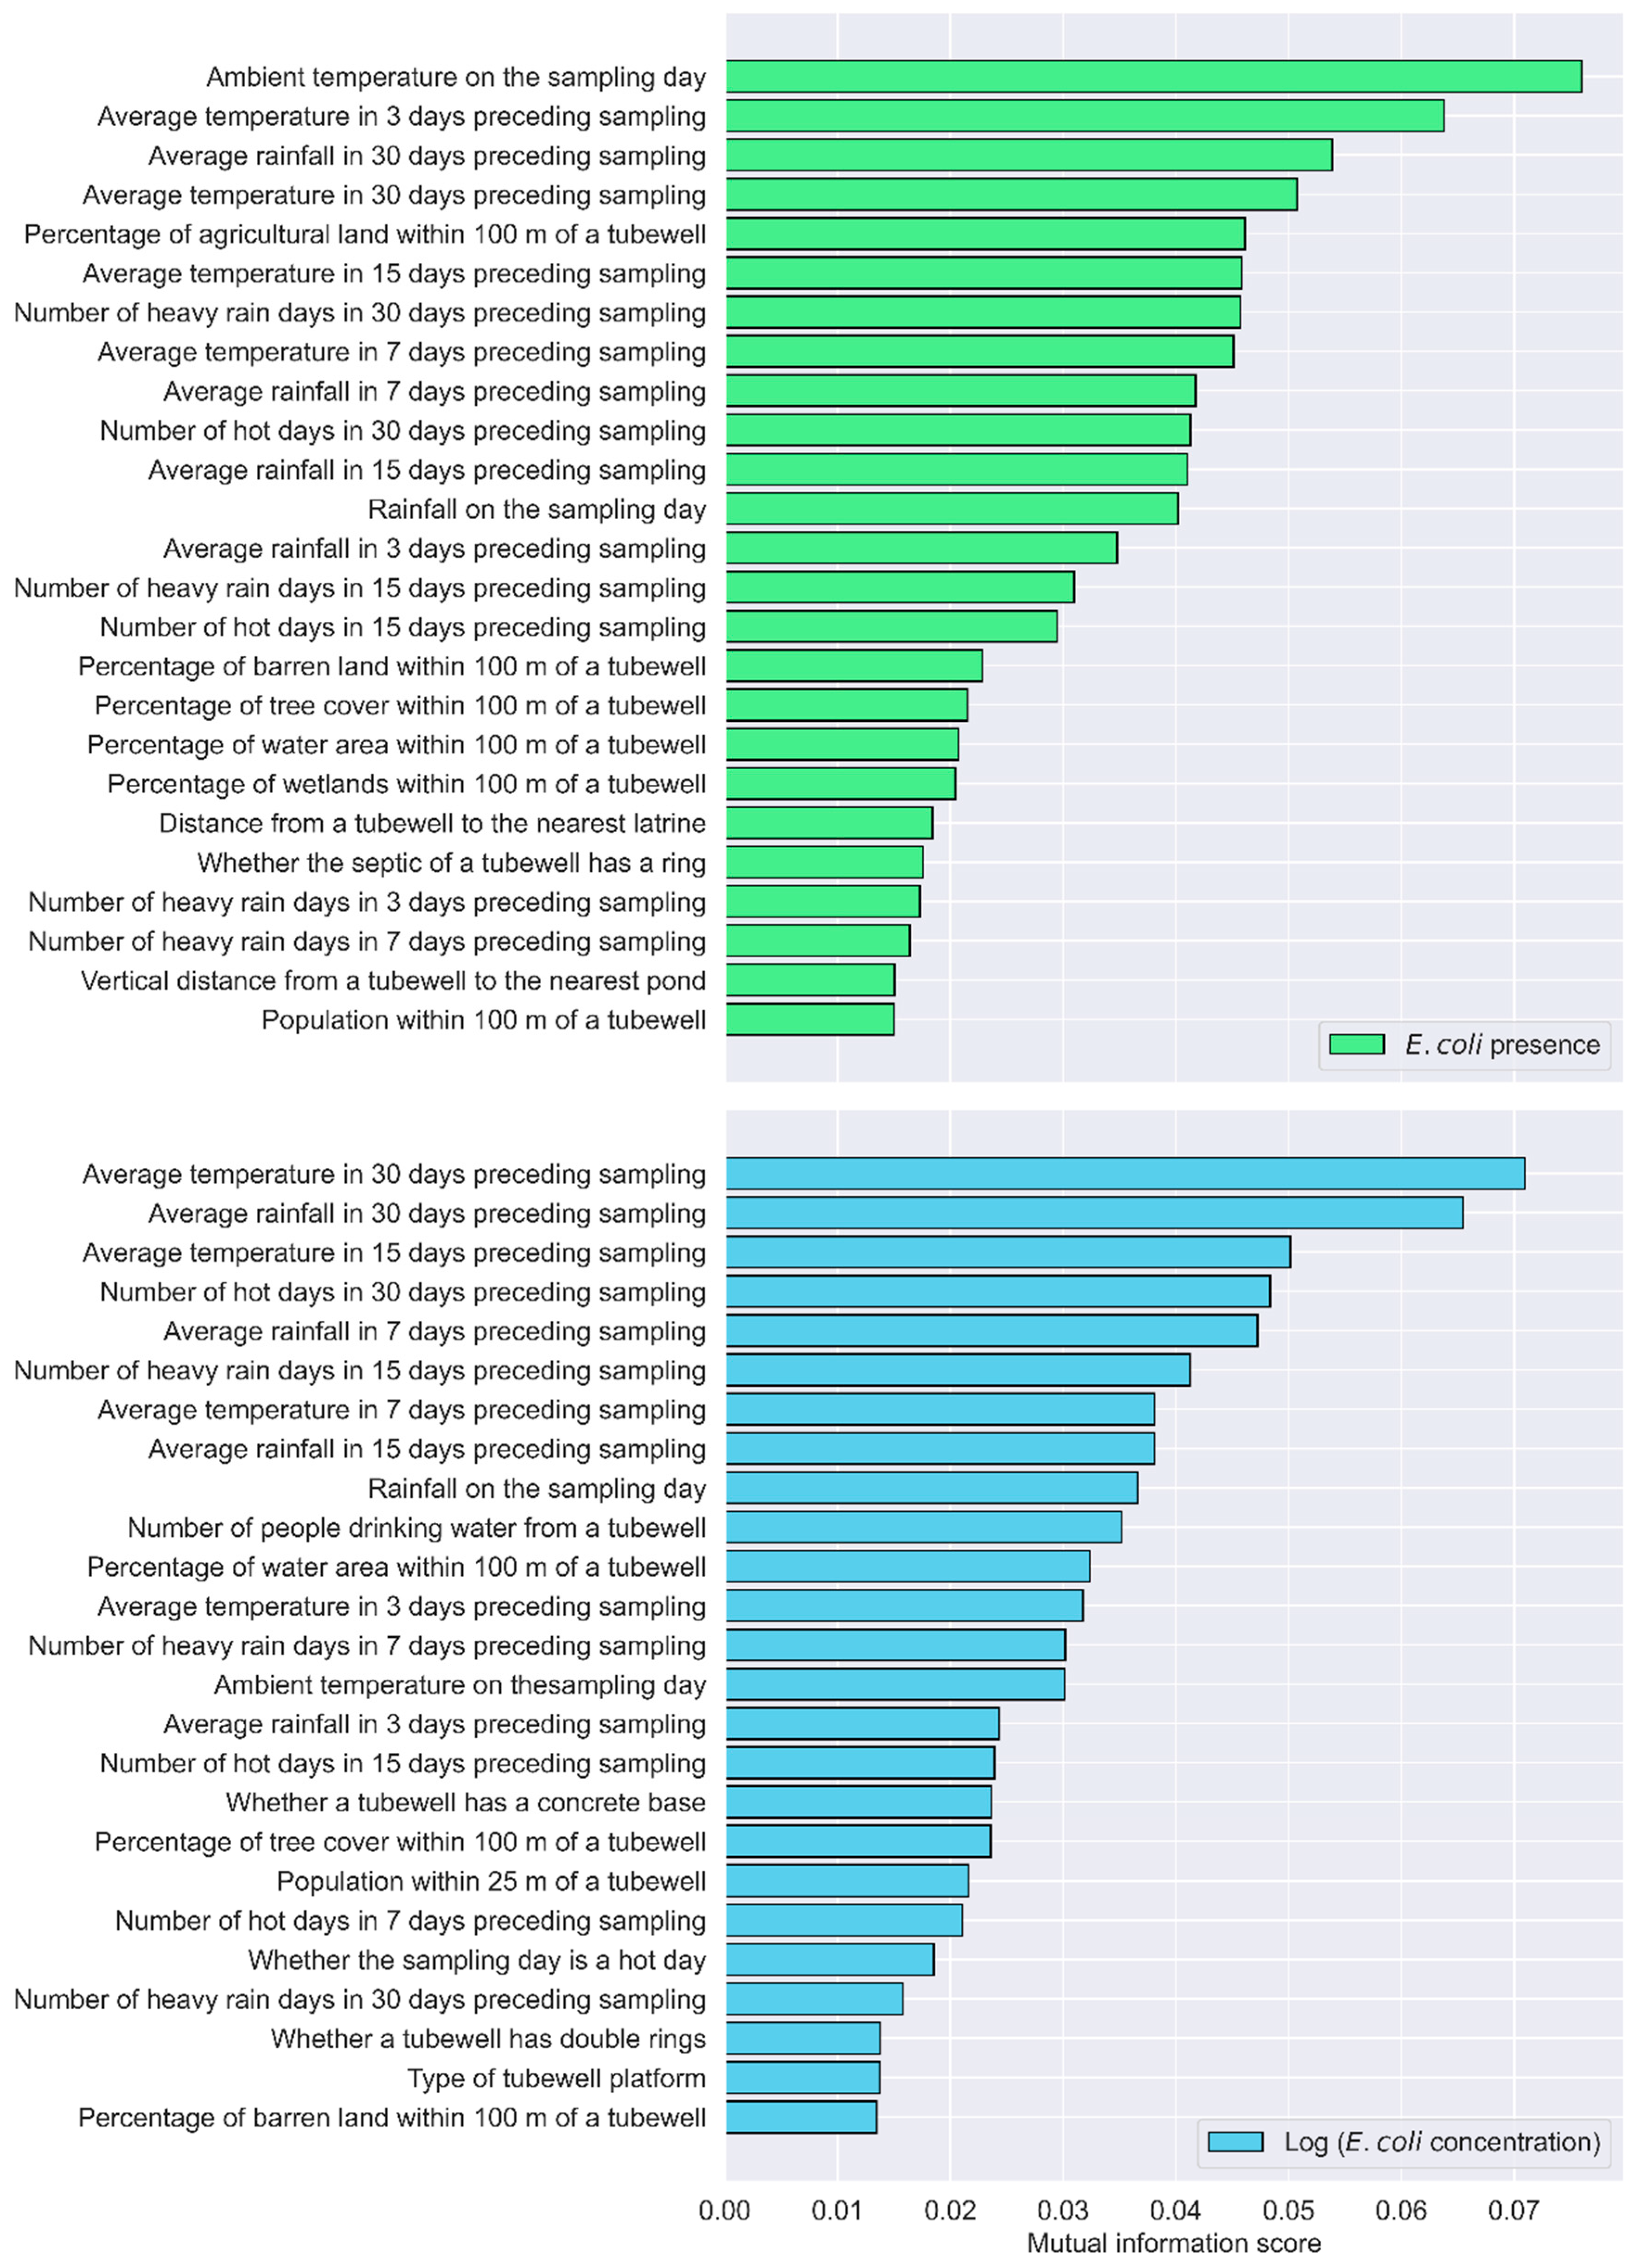
2.8. Identifying Influential Factors Using Mutual Information
3. Results
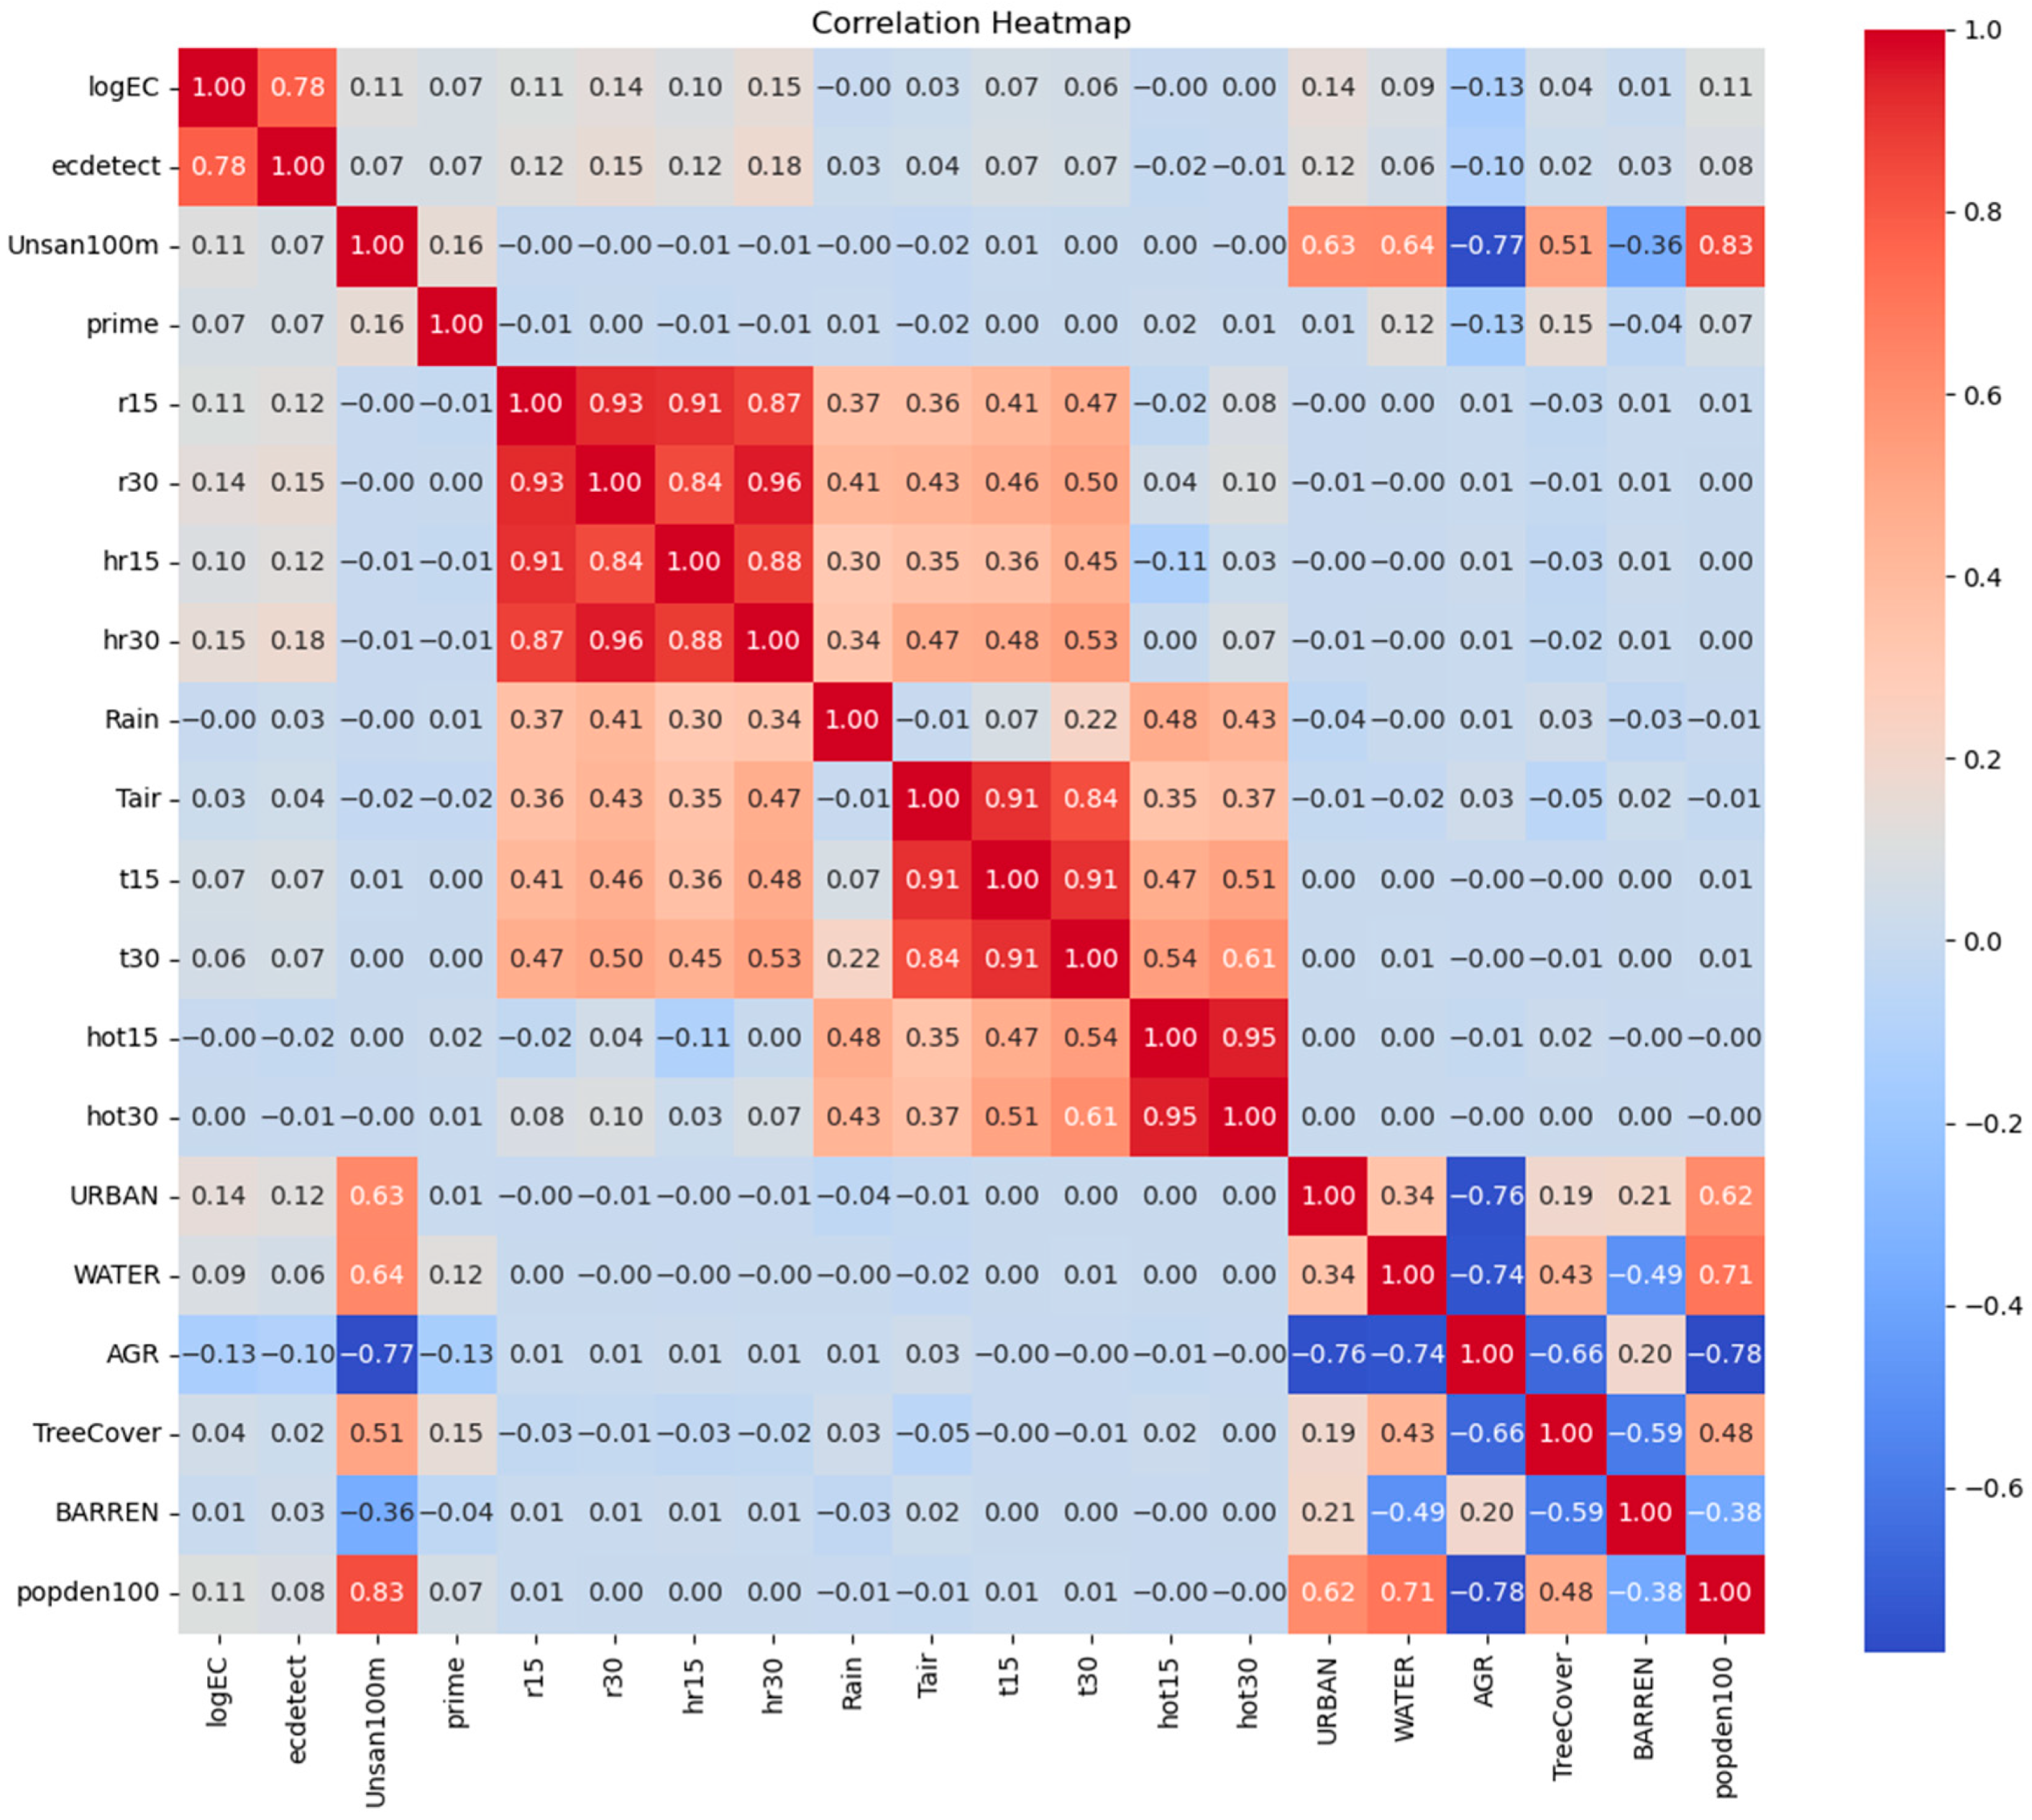
3.1. Exploratory Data Analysis
3.2. Key Factors Influencing E. coli Presence
3.3. Key Factors Influencing E. coli Concentration
4. Discussion
5. Conclusions
- Climatic variables, land use, and demographic factors were identified as key predictors of fecal contamination in shallow tubewell water, with factors such as rainfall, temperature, land use within 100 m of a tubewell, and population density significantly influencing E. coli presence and concentration.
- By identifying influential factors, robust machine learning models can be developed to predict groundwater contamination and prioritize mitigation efforts, providing a data-driven framework for targeted interventions such as land use management and adaptation to climatic variability to improve water quality and public health.
Author Contributions
Funding
Data Availability Statement
Acknowledgments
Conflicts of Interest
References
- Ferrer, N.; Folch, A.; Masó, G.; Sanchez, S.; Sanchez-Vila, X. What are the main factors influencing the presence of faecal bacteria pollution in groundwater systems in developing countries? J. Contam. Hydrol. 2020, 228, 103556. [Google Scholar] [CrossRef]
- Jasechko, S.; Perrone, D. Global groundwater wells at risk of running dry. Science 2021, 372, 418–421. [Google Scholar] [CrossRef] [PubMed]
- Lall, U.; Josset, L.; Russo, T. A snapshot of the world’s groundwater challenges. Annu. Rev. Environ. Resour. 2020, 45, 171–194. [Google Scholar] [CrossRef]
- Murphy, H.M.; Prioleau, M.D.; Borchardt, M.A.; Hynds, P.D. Epidemiological evidence of groundwater contribution to global enteric disease, 1948–2015. Hydrogeol. J. 2017, 25, 981–1001. [Google Scholar] [CrossRef]
- Conboy, M.; Goss, M. Natural protection of groundwater against bacteria of fecal origin. J. Contam. Hydrol. 2000, 43, 1–24. [Google Scholar] [CrossRef]
- Schmoll, O. Protecting Groundwater for Health: Managing the Quality of Drinking-Water Sources; World Health Organization: Geneva, Switzerland, 2006. [Google Scholar]
- Abanyie, S.K.; Apea, O.B.; Abagale, S.A.; Amuah, E.E.Y.; Sunkari, E.D. Sources and factors influencing groundwater quality and associated health implications: A review. Emerg. Contam. 2023, 9, 100207. [Google Scholar] [CrossRef]
- El-Magd, S.A.A.; Ahmed, H.; Pham, Q.B.; Linh, N.T.T.; Anh, D.T.; Elkhrachy, I.; Masoud, A.M. Possible factors driving groundwater quality and its vulnerability to land use, floods, and droughts using hydrochemical analysis and GIS approaches. Water 2022, 14, 4073. [Google Scholar] [CrossRef]
- Alberti, L.; Antelmi, M.; Oberto, G.; La Licata, I.; Mazzon, P. Evaluation of fresh groundwater Lens Volume and its possible use in Nauru island. Water 2022, 14, 3201. [Google Scholar] [CrossRef]
- Keswick, B.H.; Gerba, C.P. Viruses in groundwater. Environ. Sci. Technol. 1980, 14, 1290–1297. [Google Scholar] [CrossRef]
- Macler, B.A.; Merkle, J.C. Current knowledge on groundwater microbial pathogens and their control. Hydrogeol. J. 2000, 8, 29–40. [Google Scholar] [CrossRef]
- Pedley, S.; Howard, G. The public health implications of microbiological contamination of groundwater. Q. J. Eng. Geol. Hydrogeol. 1997, 30, 179–188. [Google Scholar] [CrossRef]
- Dong, Y.; Jiang, Z.; Hu, Y.; Jiang, Y.; Tong, L.; Yu, Y.; Cheng, J.; He, Y.; Shi, J.; Wang, Y. Pathogen contamination of groundwater systems and health risks. Crit. Rev. Environ. Sci. Technol. 2024, 54, 267–289. [Google Scholar] [CrossRef]
- Mahagamage, M.; Pathirage, M.; Manage, P.M. Contamination status of Salmonella spp., Shigella spp. and Campylobacter spp. in surface and groundwater of the Kelani River Basin, Sri Lanka. Water 2020, 12, 2187. [Google Scholar] [CrossRef]
- Gallay, A.; De Valk, H.; Cournot, M.; Ladeuil, B.; Hemery, C.; Castor, C.; Bon, F.; Megraud, F.; Le Cann, P.; Desenclos, J. A large multi-pathogen waterborne community outbreak linked to faecal contamination of a groundwater system, France, 2000. Clin. Microbiol. Infect. 2006, 12, 561–570. [Google Scholar] [CrossRef] [PubMed]
- Bivins, A.; Lowry, S.; Murphy, H.M.; Borchardt, M.; Coyte, R.; Labhasetwar, P.; Brown, J. Waterborne pathogen monitoring in Jaipur, India reveals potential microbial risks of urban groundwater supply. Npj Clean Water 2020, 3, 35. [Google Scholar] [CrossRef]
- Ferguson, A.S.; Layton, A.C.; Mailloux, B.J.; Culligan, P.J.; Williams, D.E.; Smartt, A.E.; Sayler, G.S.; Feighery, J.; McKay, L.D.; Knappett, P.S. Comparison of fecal indicators with pathogenic bacteria and rotavirus in groundwater. Sci. Total Environ. 2012, 431, 314–322. [Google Scholar] [CrossRef]
- Ercumen, A.; Naser, A.M.; Arnold, B.F.; Unicomb, L.; Colford, J.M., Jr.; Luby, S.P. Can sanitary inspection surveys predict risk of microbiological contamination of groundwater sources? Evidence from shallow tubewells in rural Bangladesh. Am. J. Trop. Med. Hyg. 2017, 96, 561–568. [Google Scholar] [CrossRef] [PubMed]
- Luby, S.; Gupta, S.; Sheikh, M.; Johnston, R.; Ram, P.; Islam, M. Tubewell water quality and predictors of contamination in three flood-prone areas in Bangladesh. J. Appl. Microbiol. 2008, 105, 1002–1008. [Google Scholar] [CrossRef]
- Wu, J.Y.; Yunus, M.; Islam, M.S.; Emch, M. Influence of Climate Extremes and Land Use on Fecal Contamination of Shallow Tubewells in Bangladesh. Environ. Sci. Technol. 2016, 50, 2669–2676. [Google Scholar] [CrossRef]
- Poulin, C.; Peletz, R.; Ercumen, A.; Pickering, A.J.; Marshall, K.; Boehm, A.B.; Khush, R.; Delaire, C. What Environmental Factors Influence the Concentration of Fecal Indicator Bacteria in Groundwater? Insights from Explanatory Modeling in Uganda and Bangladesh. Environ. Sci. Technol. 2020, 54, 13566–13578. [Google Scholar] [CrossRef]
- Knappett, P.S.; McKay, L.D.; Layton, A.; Williams, D.E.; Alam, M.J.; Mailloux, B.J.; Ferguson, A.S.; Culligan, P.J.; Serre, M.L.; Emch, M.; et al. Unsealed tubewells lead to increased fecal contamination of drinking water. J. Water Health 2012, 10, 565–578. [Google Scholar] [CrossRef] [PubMed]
- White, K.; Dickson-Anderson, S.; Majury, A.; McDermott, K.; Hynds, P.; Brown, R.S.; Schuster-Wallace, C. Exploration of E. coli contamination drivers in private drinking water wells: An application of machine learning to a large, multivariable, geo-spatio-temporal dataset. Water Res. 2021, 197, 117089. [Google Scholar] [CrossRef] [PubMed]
- Howard, G.; Pedley, S.; Barrett, M.; Nalubega, M.; Johal, K. Risk factors contributing to microbiological contamination of shallow groundwater in Kampala, Uganda. Water Res. 2003, 37, 3421–3429. [Google Scholar] [CrossRef] [PubMed]
- Díaz-Alcaide, S.; Martínez-Santos, P. Mapping fecal pollution in rural groundwater supplies by means of artificial intelligence classifiers. J. Hydrol. 2019, 577, 124006. [Google Scholar] [CrossRef]
- Gómez-Escalonilla, V.; Montero-González, E.; Díaz-Alcaide, S.; Martín-Loeches, M.; del Rosario, M.R.; Martínez-Santos, P. A machine learning approach to site groundwater contamination monitoring wells. Appl. Water Sci. 2024, 14, 250. [Google Scholar] [CrossRef]
- Bishop, C.M.; Nasrabadi, N.M. Pattern Recognition and Machine Learning; Springer: Berlin/Heidelberg, Germany, 2006; Volume 4. [Google Scholar]
- Alam, N.; Ali, T.; Razzaque, A.; Rahman, M.; Zahirul Haq, M.; Saha, S.K.; Ahmed, A.; Sarder, A.M.; Moinuddin Haider, M.; Yunus, M.; et al. Health and demographic surveillance system (HDSS) in Matlab, Bangladesh. Int. J. Epidemiol. 2017, 46, 809–816. [Google Scholar] [CrossRef] [PubMed]
- van Geen, A.; Ahmed, K.M.; Akita, Y.; Alam, M.J.; Culligan, P.J.; Emch, M.; Escamilla, V.; Feighery, J.; Ferguson, A.S.; Knaypett, P.; et al. Fecal Contamination of Shallow Tubewells in Bangladesh Inversely Related to Arsenic. Environ. Sci. Technol. 2011, 45, 1199–1205. [Google Scholar] [CrossRef]
- Escamilla, V.; Knappett, P.S.; Yunus, M.; Streatfield, P.; Emch, M. Influence of latrine proximity and type on tubewell water quality and diarrheal disease in Bangladesh. Ann. Assoc. Am. Geogr. 2013, 103, 299–308. [Google Scholar] [CrossRef]
- Wu, J.; Yunus, M.; Ali, M.; Escamilla, V.; Emch, M. Influences of heatwave, rainfall, and tree cover on cholera in Bangladesh. Environ. Int. 2018, 120, 304–311. [Google Scholar] [CrossRef] [PubMed]
- Chen, X.-w.; Jeong, J.C. Enhanced recursive feature elimination. In Proceedings of the Sixth International Conference on Machine Learning and Applications (ICMLA 2007), Cincinnati, OH, USA, 13–15 December 2007; pp. 429–435. [Google Scholar]
- Chen, T.; Guestrin, C. Xgboost: A scalable tree boosting system. In Proceedings of the 22nd acm SIGKDD International Conference on Knowledge Discovery and Data Mining, San Francisco, CA, USA, 13–17 August 2016; pp. 785–794. [Google Scholar]
- Breiman, L. Random forests. Mach. Learn. 2001, 45, 5–32. [Google Scholar] [CrossRef]
- Venkateswarlu, T.; Anmala, J. Importance of land use factors in the prediction of water quality of the Upper Green River watershed, Kentucky, USA, using random forest. Environ. Dev. Sustain. 2024, 26, 23961–23984. [Google Scholar] [CrossRef]
- Wu, J.; Song, C.; Dubinsky, E.A.; Stewart, J.R. Tracking major sources of water contamination using machine learning. Front. Microbiol. 2021, 11, 616692. [Google Scholar] [CrossRef]
- Genuer, R.; Poggi, J.-M.; Tuleau-Malot, C. Variable selection using random forests. Pattern Recognit. Lett. 2010, 31, 2225–2236. [Google Scholar] [CrossRef]
- Vergara, J.R.; Estévez, P.A. A review of feature selection methods based on mutual information. Neural Comput. Appl. 2014, 24, 175–186. [Google Scholar] [CrossRef]
- Zhou, H.; Wang, X.; Zhang, Y. Feature selection based on weighted conditional mutual information. Appl. Comput. Inform. 2024, 20, 55–68. [Google Scholar] [CrossRef]
- Kraskov, A.; Stogbauer, H.; Grassberger, P. Estimating mutual information. Phys. Rev. E—Stat. Nonlinear Soft Matter Phys. 2004, 69, 066138. [Google Scholar] [CrossRef]
- Wu, J.; Long, S.C.; Das, D.; Dorner, S.M. Are microbial indicators and pathogens correlated? A statistical analysis of 40 years of research. J. Water Health 2011, 9, 265–278. [Google Scholar] [CrossRef]
- Atherholt, T.; Feerst, E.; Hovendon, B.; Kwak, J.; Rosen, J.D. Evaluation of indicators of fecal contamination in groundwater. J. Am. Water Work. Assoc. 2003, 95, 119–131. [Google Scholar] [CrossRef]
- Knappett, P.S.K.; Escamilla, V.; Layton, A.; McKay, L.D.; Emch, M.; Williams, D.E.; Huq, R.; Alam, J.; Farhana, L.; Mailloux, B.J.; et al. Impact of population and latrines on fecal contamination of ponds in rural Bangladesh. Sci. Total Environ. 2011, 409, 3174–3182. [Google Scholar] [CrossRef]
- Blaustein, R.; Pachepsky, Y.; Hill, R.; Shelton, D.; Whelan, G. Escherichia coli survival in waters: Temperature dependence. Water Res. 2013, 47, 569–578. [Google Scholar] [CrossRef]
- Hounslow, A. Water Quality Data: Analysis and Interpretation; CRC Press: Boca Raton, FL, USA, 1995. [Google Scholar]


| Variables (Unit) N = 1495 | Mean | Standard Deviation | Min | Max | Data Types |
|---|---|---|---|---|---|
| E. coli presence | 0.43 | 0.50 | 0 | 1 | Categorical |
| E. coli concentration (MPN/100 mL) | 38.09 | 248.29 | 0.30 | 3000 | Continuous |
| The number of unsanitary latrines in 100 m | 10.71 | 7.67 | 1 | 26 | Discrete |
| The number of sanitary latrines in 100 m | 14.87 | 7.24 | 2 | 32 | Discrete |
| The type of nearby waterbody | 1.59 | 0.68 | 146 | 1 | Categorical |
| The type of the nearest latrine (sanitary vs. unsanitary) | 0.38 | 0.49 | 0 | 1 | Categorical |
| Distance to the nearest latrine (m) | 13.02 | 8.55 | 0.7 | 40.43 | Continuous |
| The type of platform | 0.62 | 0.49 | 0 | 1 | Categorical |
| Well depth (m) | 15.38 | 5.44 | 7.5 | 36 | Continuous |
| Population density in 100 m | 8.25 | 0.70 | 6.46 | 9.15 | Continuous |
| The percentage of urban area in 100 m (%) | 11.96 | 6.68 | 2.5 | 31.69 | Continuous |
| The percentage of water area in 100 m (%) | 21.49 | 9.32 | 5.72 | 40.09 | Continuous |
| The percentage of agricultural land in 100 m (%) | 29.54 | 17.89 | 2.92 | 70.40 | Continuous |
| Heavy-rain day (Yes/No) | 0.21 | 0.41 | 0 | 1 | Discrete |
| Daily mean temperature (°C) | 27.26 | 2.81 | 17.95 | 31.37 | Continuous |
| Daily rainfall (mm) | 11.66 | 20.60 | 0 | 108.99 | Continuous |
| Average daily temperature in 7 days preceding sampling | 26.89 | 3.54 | 17.96 | 30.65 | Continuous |
| Average rainfall in 7 days preceding sampling | 10.78 | 10.34 | 0 | 49.23 | Continuous |
| Average daily temperature in 30 days preceding sampling | 26.90 | 3.19 | 19.02 | 30.12 | Continuous |
| The number of heavy-rain days in 30 days preceding sampling | 26.90 | 3.19 | 19.02 | 30.12 | Discrete |
| The number of heavy-rain days in 3 days preceding sampling | 0.59 | 0.83 | 0 | 3 | Discrete |
| Variables | E. coli Presence | E. coli Concentration * | ||
|---|---|---|---|---|
| r | p | r | p | |
| The type of platform | −0.060 | 0.021 | −0.041 | 0.113 |
| Distance to the nearest latrine (m) | 0.024 | 0.349 | 0.043 | 0.099 |
| The type of nearby waterbody | 0.035 | 0.174 | 0.046 | 0.073 |
| The number of unsanitary latrines in 100 m | 0.074 | 0.004 | 0.111 | <0.001 |
| The number of sanitary latrines in 100 m | 0.072 | 0.005 | 0.093 | <0.001 |
| Well depth (m) | −0.024 | 0.361 | 0.013 | 0.606 |
| Population density in 100 m | 0.093 | <0.001 | 0.135 | <0.001 |
| The percentage of urban area in 100 m (%) | 0.122 | <0.001 | 0.142 | <0.001 |
| The percentage of water area in 100 m (%) | 0.059 | 0.023 | 0.085 | 0.001 |
| The percentage of agricultural land in 100 m (%) | −0.099 | <0.001 | −0.128 | <0.001 |
| Average rainfall in 7 days preceding sampling | 0.103 | <0.001 | 0.091 | <0.001 |
| Average temperature in 7 days preceding sampling | 0.051 | 0.047 | 0.044 | 0.086 |
| Daily rainfall | 0.025 | 0.331 | −0.003 | 0.900 |
| Daily average temperature (°C) | 0.037 | 0.154 | 0.025 | 0.325 |
| Heavy-rain day (yes/no) | 0.076 | 0.003 | 0.052 | 0.043 |
| The number of heavy-rain days in 3 days preceding sampling | 0.070 | 0.007 | 0.042 | 0.104 |
| The number of heavy-rain days in 30 days preceding sampling | 0.177 | <0.001 | 0.148 | <0.001 |
| Average temperature in 30 days preceding sampling | 0.065 | 0.012 | 0.057 | 0.028 |
| Rank | Features |
|---|---|
| 1 | Average rainfall in 30 days preceding sampling |
| 2 | Average rainfall in 7 days preceding sampling |
| 3 | Volume of water used for tubewell priming |
| 4 | Population within 200 m of a tubewell |
| 5 | Number of hot days in 30 days preceding sampling |
| 6 | Percentage of urban area within 100 m of a tubewell |
| 7 | Percentage of agricultural land within 100 m of a tubewell |
| 8 | Average temperature in 30 days preceding sampling |
| 9 | Population within 25 m of a tubewell |
| 10 | Percentage of tree cover within 100 m of a tubewell |
| 11 | Average temperature in 7 days preceding sampling |
| 12 | Population within 50 m of a tubewell |
| 13 | Horizontal distance from a tubewell to the nearest latrine |
| 14 | Rainfall on the sampling day |
| 15 | Number of hot days in 15 days preceding sampling |
| 16 | Ambient temperature on the sampling day |
| 17 | Number of people drinking water from a tubewell |
| 18 | Average rainfall in 15 days preceding sampling |
| 19 | Vertical distance from a tubewell to the nearest pond |
| 20 | Number of sanitary latrines within 100 m |
| 21 | Distance from a tubewell to the nearest latrine |
| 22 | Percentage of water area within 100 m of a tubewell |
| 23 | Average rainfall in 3 days preceding sampling |
| 24 | Tubewell depth |
| 25 | Types of discharge near a tubewell |
| Rank | Features |
|---|---|
| 1 | Percentage of agricultural land within 100 m of a tubewell |
| 2 | Percentage of barren land within 100 m of a tubewell |
| 3 | Number of heavy-rain days in 30 days preceding sampling |
| 4 | Number of hot days in 30 days preceding sampling |
| 5 | Ambient temperature on the sampling day |
| 6 | Percentage of water area within 100 m of a tubewell |
| 7 | Percentage of urban area within 100 m of a tubewell |
| 8 | Percentage of tree cover within 100 m of a tubewell |
| 9 | Average rainfall in 3 days preceding sampling |
| 10 | Average temperature in 3 days preceding sampling |
| 11 | Average temperature in 15 days preceding sampling |
| 12 | Percentage of wetlands within 100 m of a tubewell |
| 13 | Average rainfall in 30 days preceding sampling |
| 14 | Rainfall on the sampling day |
| 15 | Volume of water used for tubewell priming |
| 16 | Average temperature in 30 days preceding sampling |
| 17 | Population within 200 m of a tubewell |
| 18 | Whether a tubewell is a deep well |
| 19 | Average temperature in 7 days preceding sampling |
| 20 | Population within 100 m of a tubewell |
| 21 | Population within 50 m of a tubewell |
| 22 | Population within 25 m of a tubewell |
| 23 | Tubewell depth |
| 24 | Number of hot days in 15 days preceding sampling |
| 25 | Distance from a tubewell to the nearest latrine |
Disclaimer/Publisher’s Note: The statements, opinions and data contained in all publications are solely those of the individual author(s) and contributor(s) and not of MDPI and/or the editor(s). MDPI and/or the editor(s) disclaim responsibility for any injury to people or property resulting from any ideas, methods, instructions or products referred to in the content. |
© 2025 by the authors. Licensee MDPI, Basel, Switzerland. This article is an open access article distributed under the terms and conditions of the Creative Commons Attribution (CC BY) license (https://creativecommons.org/licenses/by/4.0/).
Share and Cite
Wu, J.; Cao, Y.; Islam, M.S.; Emch, M. Application of Machine Learning to Identify Influential Factors for Fecal Contamination of Shallow Groundwater. Water 2025, 17, 160. https://doi.org/10.3390/w17020160
Wu J, Cao Y, Islam MS, Emch M. Application of Machine Learning to Identify Influential Factors for Fecal Contamination of Shallow Groundwater. Water. 2025; 17(2):160. https://doi.org/10.3390/w17020160
Chicago/Turabian StyleWu, Jianyong, Yanni Cao, Md. Sirajul Islam, and Michael Emch. 2025. "Application of Machine Learning to Identify Influential Factors for Fecal Contamination of Shallow Groundwater" Water 17, no. 2: 160. https://doi.org/10.3390/w17020160
APA StyleWu, J., Cao, Y., Islam, M. S., & Emch, M. (2025). Application of Machine Learning to Identify Influential Factors for Fecal Contamination of Shallow Groundwater. Water, 17(2), 160. https://doi.org/10.3390/w17020160