
Comprehensive Assessment of Per- and Polyfluoroalkyl Substances (PFAS) Pollution in a Coastal Region: Contributions from Nearshore and Offshore Sources

 ,
,
Abstract
1. Introduction
2. Materials and Methods
2.1. Chemicals and Materials
2.2. Sample Collection and Pretreatment
2.3. LC-MS/MS Analysis
2.4. Method Validation and Quality Assurance/Quality Control
2.5. Statistical Data Treatment
3. Results and Discussion
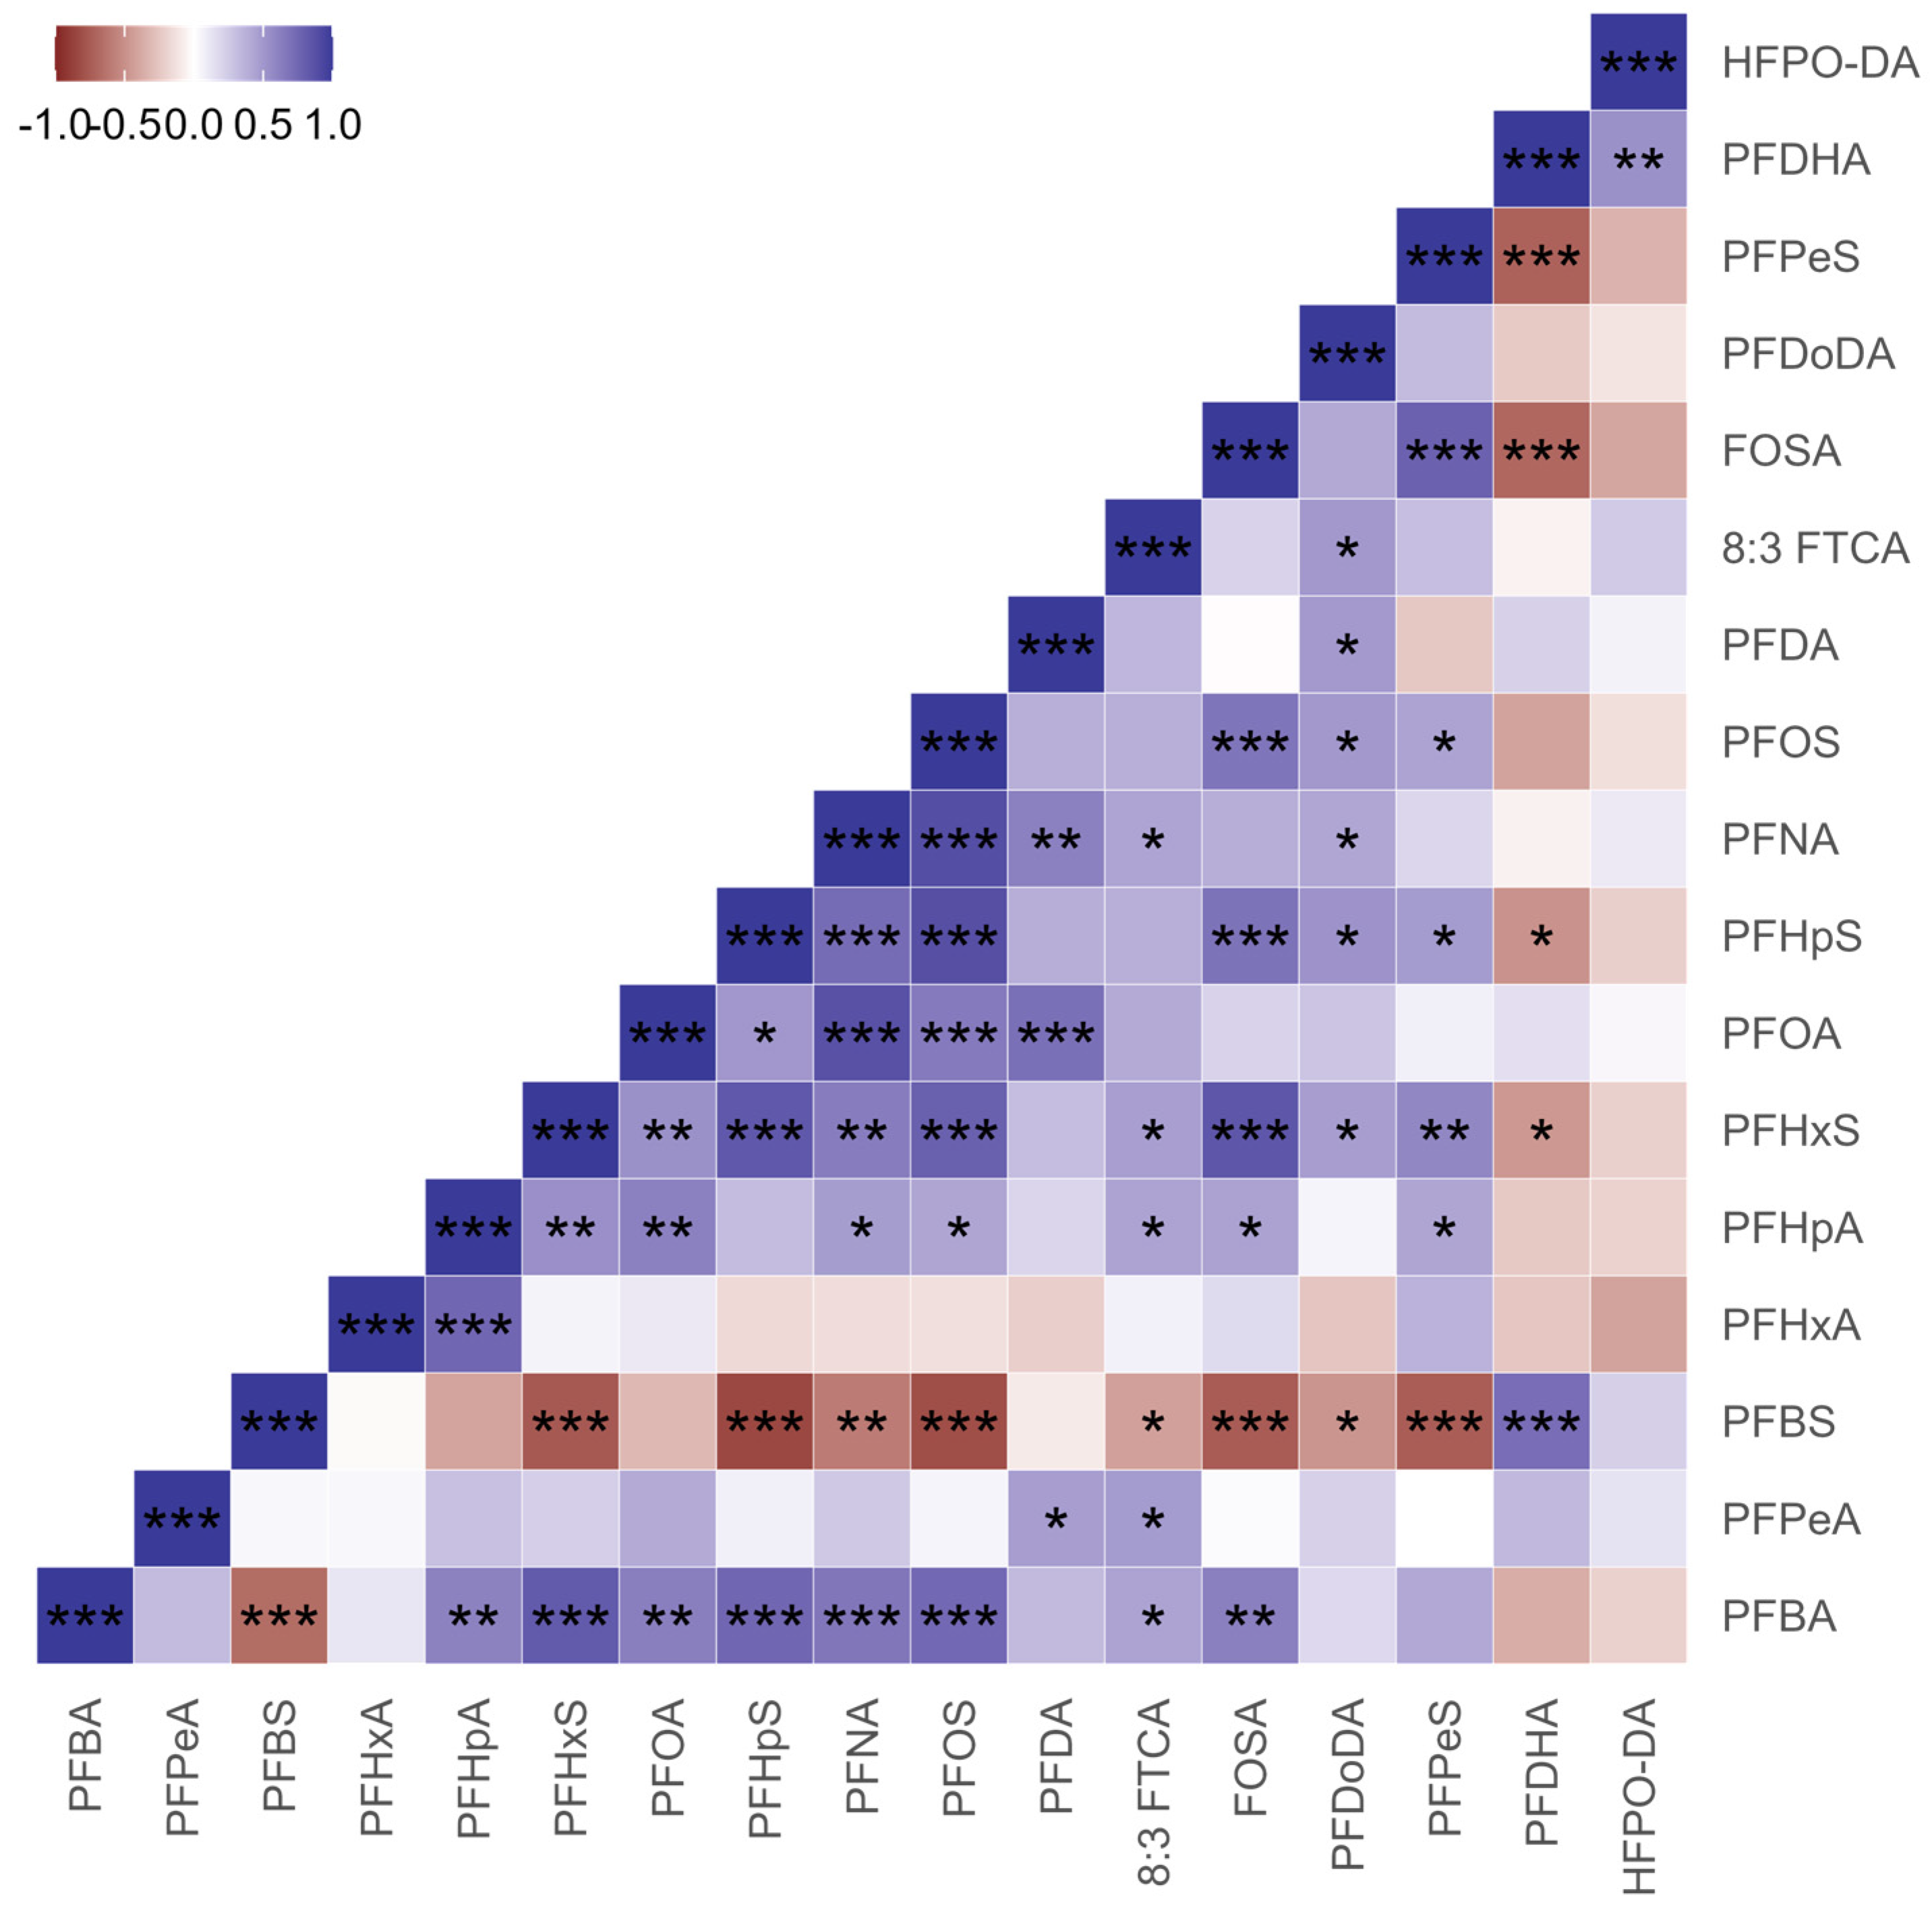
3.1. Occurrence of PFAS in the Coastal Region
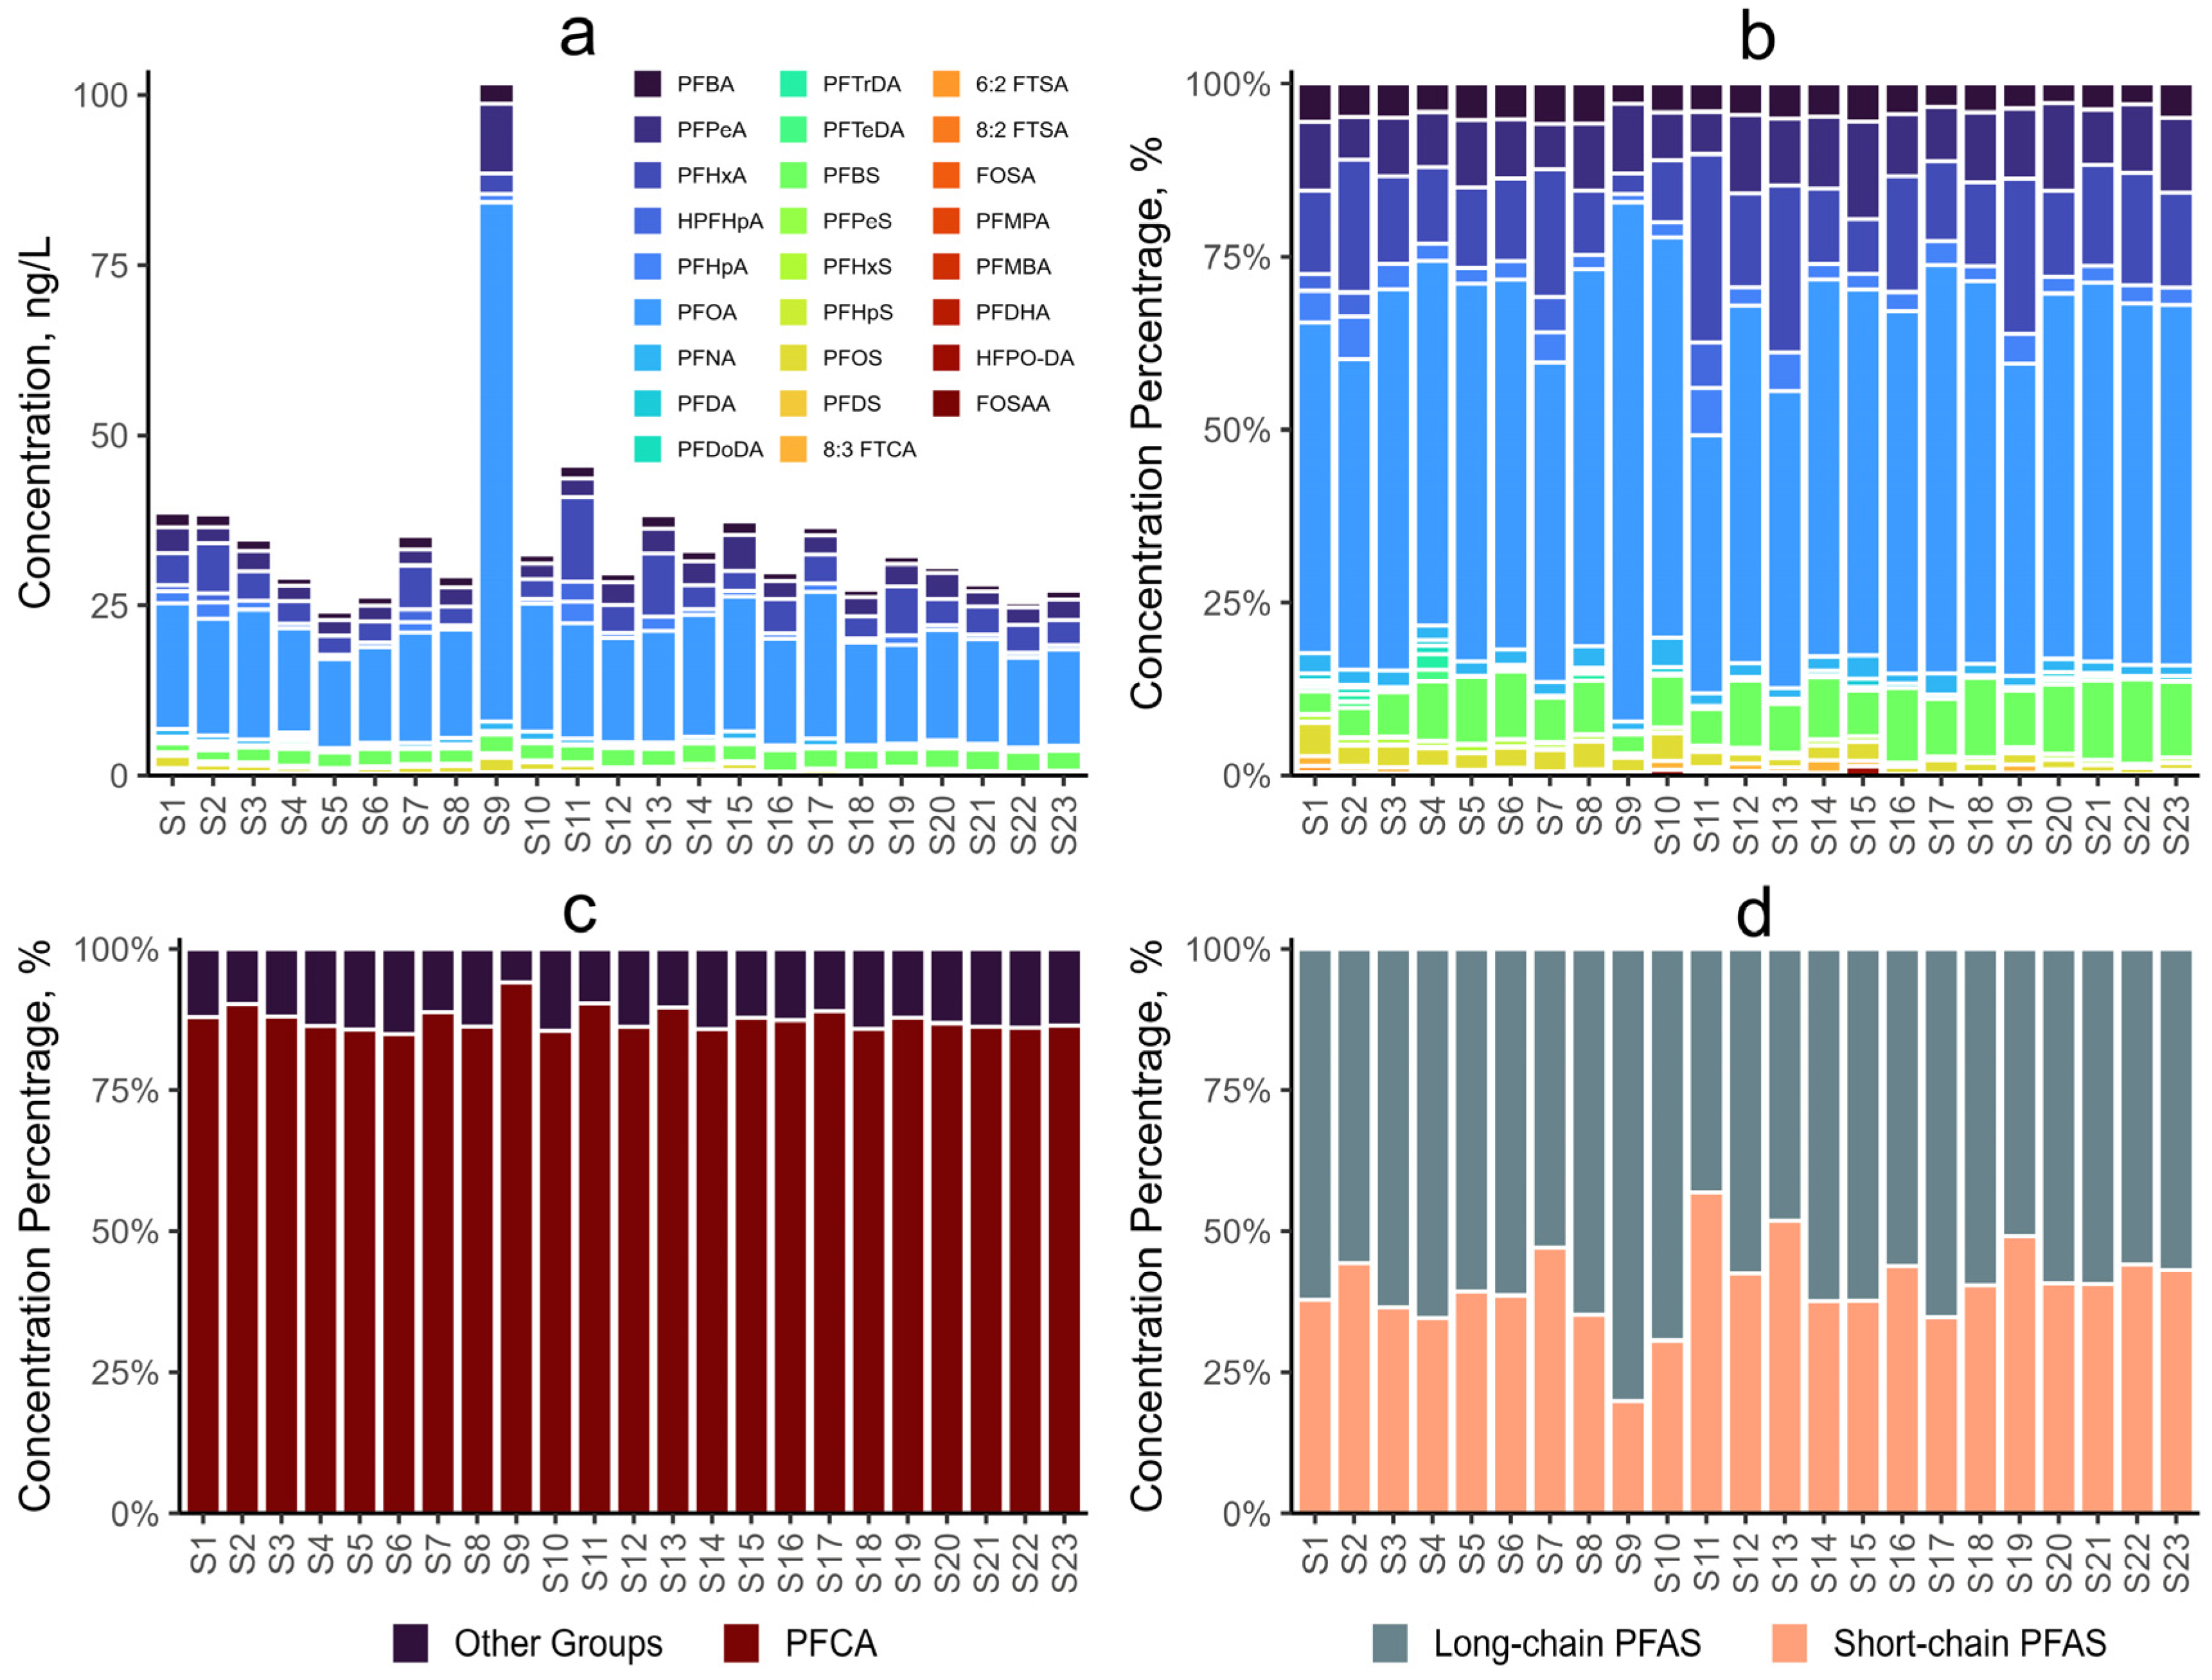
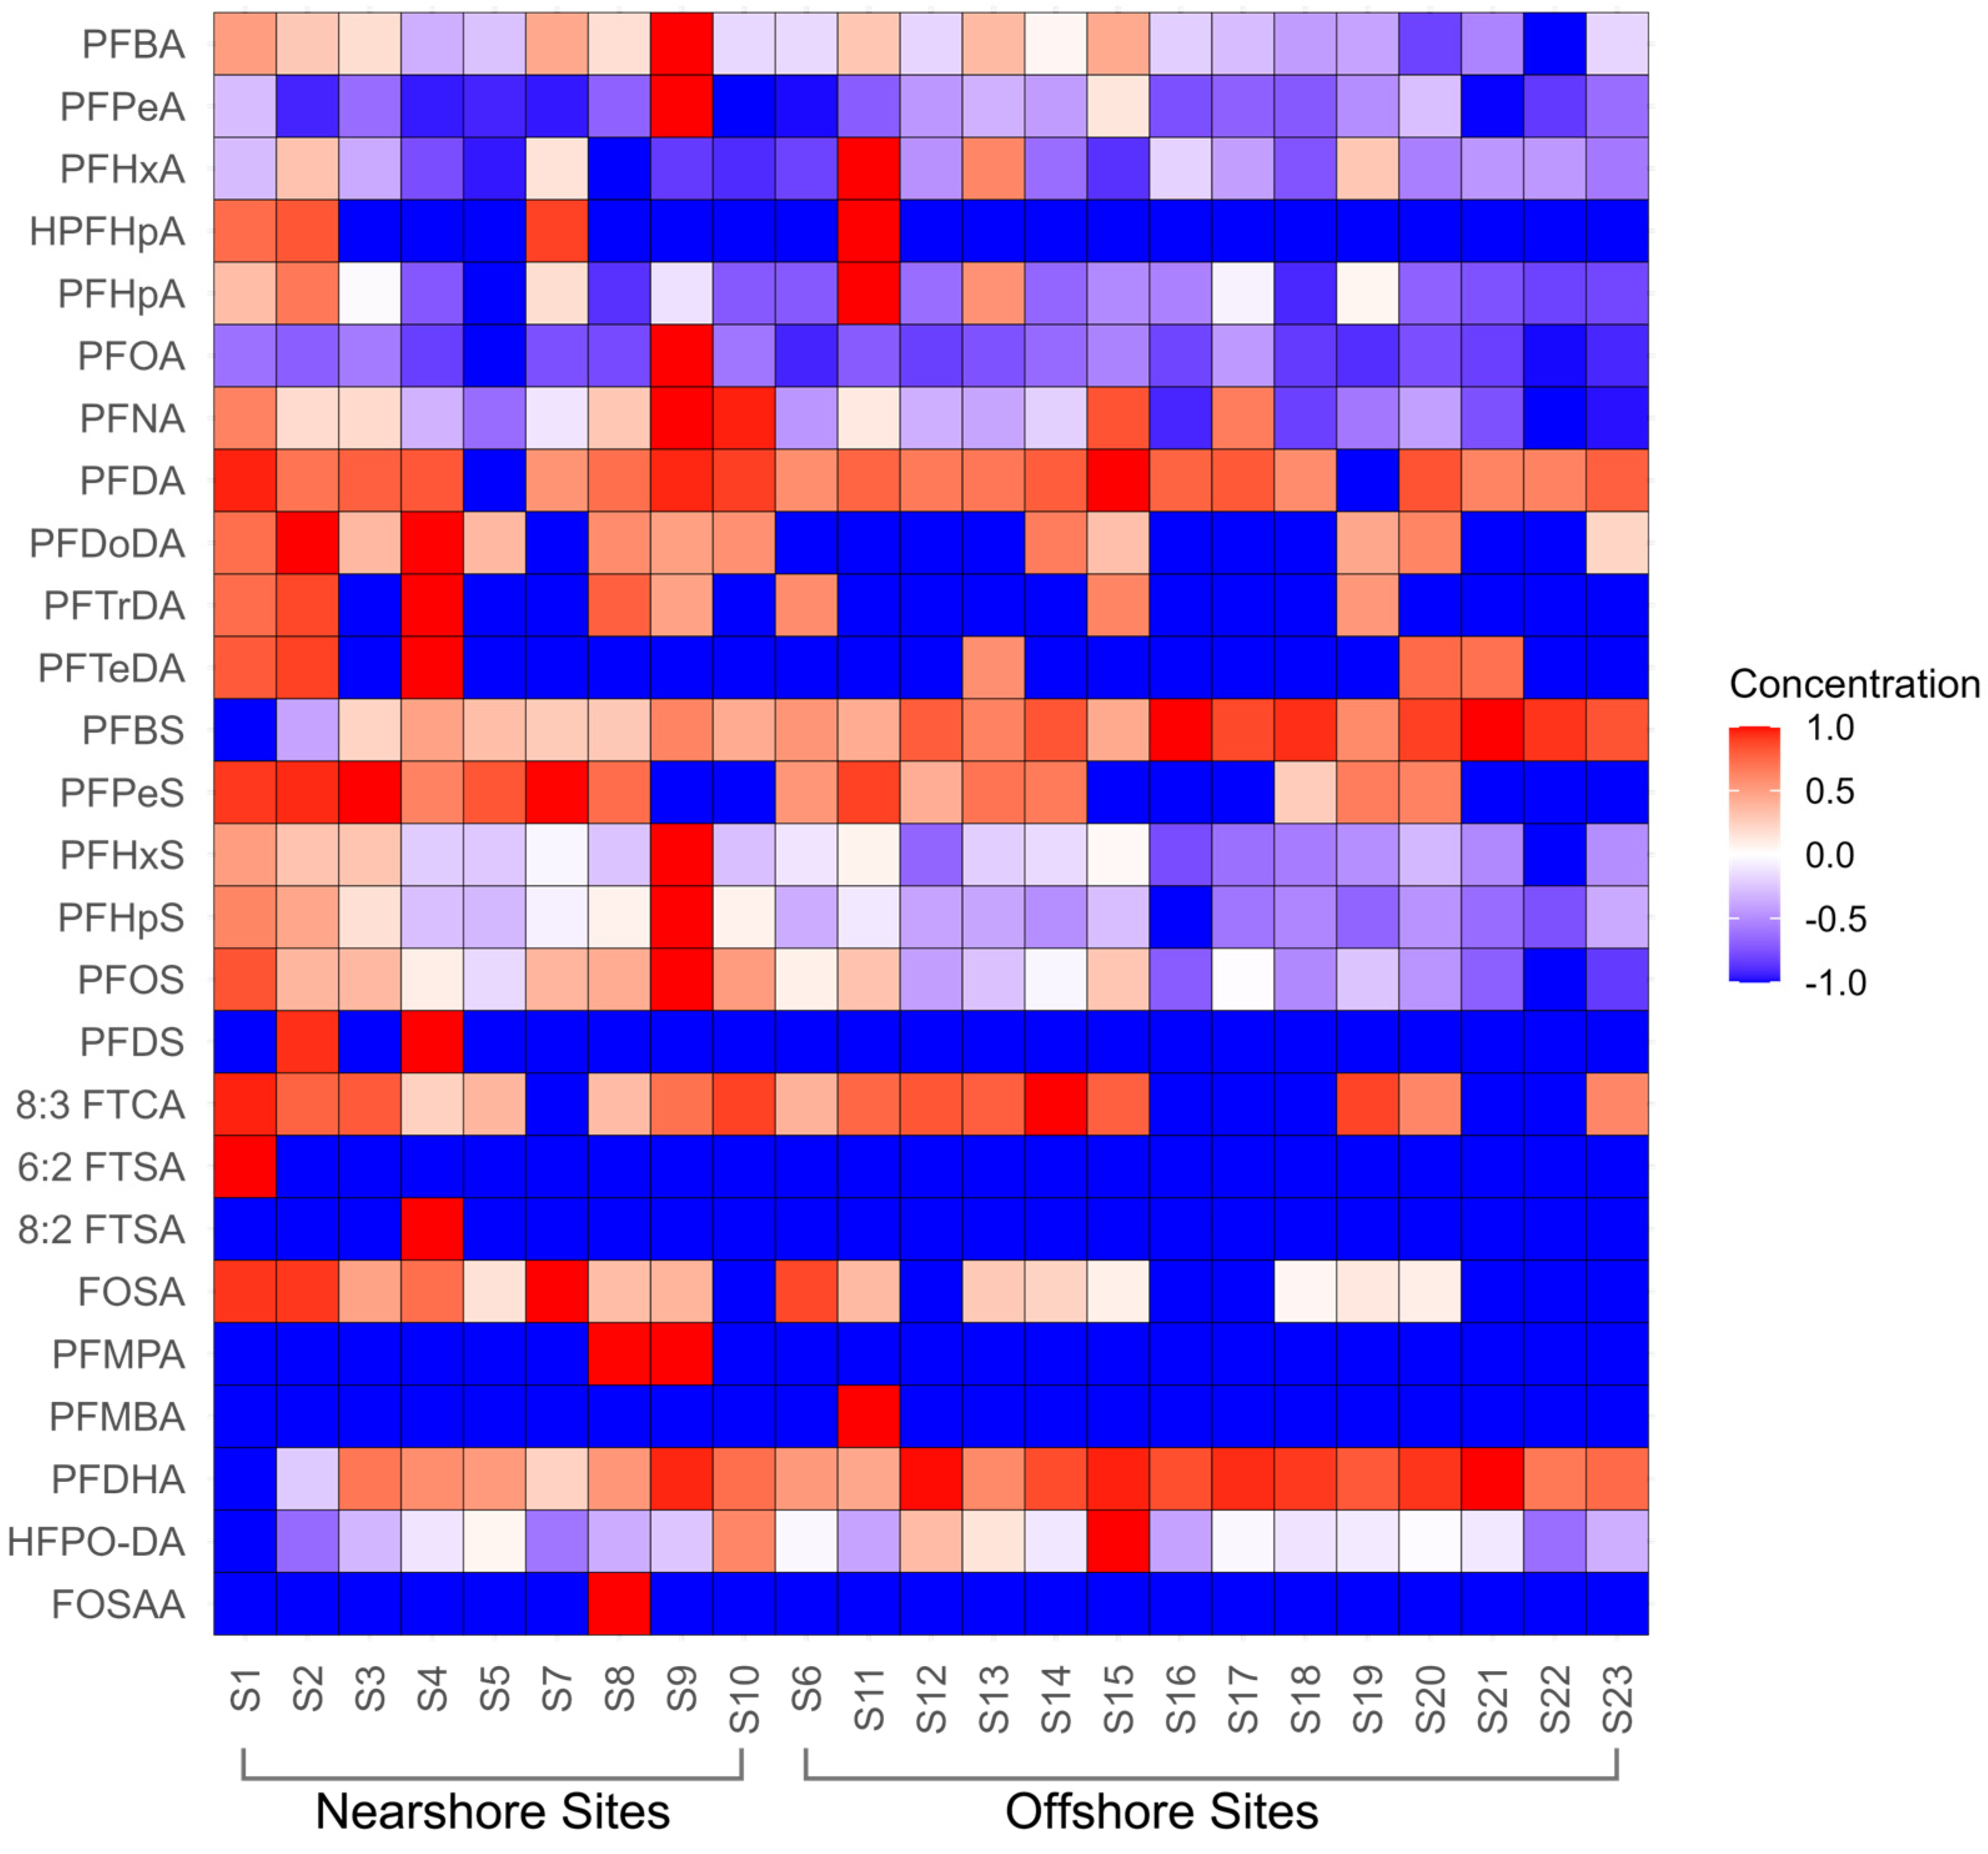
3.2. Spatial Distribution of PFAS in the Coastal Region
3.3. Comparison with Other Studies and Its Implications

| Country | Area | PFAS Species | PFOA | PFHxA | PFPeA | PFBS | HPFHpA | PFBA | PFHpA | PFOS | References |
|---|---|---|---|---|---|---|---|---|---|---|---|
| US | Biscayne Bay | 30 | 0.29–5.81 | 0.29–5.81 | 0.63–6.18 | 0.4–2.2 | NA | 0.68–3.16 | 0.48–4.6 | 1.16–46.98 | [5] |
| Australia | Sydney Harbour | 13 | 4.2–6.4 | 2.8–3.2 | NA | 1.2–1.5 | NA | NA | 1.4–2.0 | 7.5–21 | [65] |
| Japan | Osaka Bay | 15 | 0.31–7 | 0.43–37 | 0.48–1.3 | 0.76 | NA | 1.2–1.8 | 0.38–2 | 0.89–1.3 | [59] |
| Korea | along the Korean coasts | 25 | 0.21–16.5 | <0.04–2.18 | <0.2–2.20 | <0.04–3.87 | NA | NA | <0.1–1.50 | <0.04–1.92 | [35] |
| Korea | West coast | 12 | 0.54–31 | NA | NA | <0.2–16 | NA | NA | <1.0–110 | 0.35–47 | [63] |
| Korea | West coast | 12 | 2.95–68.6 | ND–47.0 | NA | ND–39.8 | NA | ND–9.55 | ND–47.2 | 4.11–450 | [64] |
| China | The entire coastal line | 12 | ND–423 | ND–41.7 | ND–37.7 | ND–575 | NA | 0.34–283 | ND–44.4 | ND–56.0 | [48] |
| China | Bohai Sea | 21 | 3.64–629 | 0.58–11.5 | 1.70–8.94 | 0.610–30.9 | NA | 3.58–18.2 | 0.73–10.42 | 0.951–14.3 | [34] |
| China | Bohai Sea | 29 | 2.3–106 | 0.40–4.0 | 0.31–3.0 | 0.12–0.28 | NA | 0.15–1.5 | 0.19–2.2 | <0.03–0.12 | [50] |
| Yellow Sea | 29 | 0.89–14 | 0.16–0.96 | 0.12–1.2 | <0.04–0.22 | NA | <0.05–0.66 | 0.06–0.45 | <0.03–0.11 | [50] | |
| Yangtze River Estuary | 29 | 0.98–6.9 | 0.20–1.4 | 0.12–1.3 | 0.11–0.94 | NA | 0.09–0.50 | 0.07–0.23 | <0.03–0.20 | [50] | |
| China | Jiaozhou Bay | 14 | <1.0–28.72 | ND–3.13 | <1.5 | <0.8 | NA | ND–2.04 | ND–3.76 | ND–14.55 | [60] |
| China | coastal tourist resorts in Shandong Peninsula | 17 | 0.34–23.4 | 0.18–11.8 | 0.22–15.2 | 0.48–3.59 | NA | 2.98–43.7 | 0.0089–8.55 | 2.26–24.5 | [66] |
| China | Hangzhou Bay | 17 | 45 | 25 | NA | NA | NA | NA | NA | 1.0 | [49] |
| China | Shuidong Bay | 23 | 0.32–0.49 | 0.16–0.42 | 0.18–0.61 | 0.27–2.18 | NA | 0.91–2.49 | 0.17–0.60 | 0.077–0.21 | [61] |
| China | Beibu Gulf | 18 | 0.23–0.84 | 0.09–1.00 | 0.12–2.97 | 0.14–0.56 | NA | 0.34–1.30 | 0.11–0.35 | ND–0.37 | [62] |
| China | Wenzhou Bay | 74 | 13.17–76.31 | 2.71–12.38 | 2.23–10.20 | 1.23–3.22 | 0.93–2.99 | 0.76–2.97 | 0.56–3.12 | 0.23–2.23 | This study |
4. Conclusions
Supplementary Materials
Author Contributions
Funding
Data Availability Statement
Conflicts of Interest
References
- Buck, R.C.; Franklin, J.; Berger, U.; Conder, J.M.; Cousins, I.T.; de Voogt, P.; Jensen, A.A.; Kannan, K.; Mabury, S.A.; van Leeuwen, S.P.J. Perfluoroalkyl and polyfluoroalkyl substances in the environment: Terminology, classification, and origins. Integr. Environ. Assess. Manag. 2011, 7, 513–541. [Google Scholar] [CrossRef]
- Jian, J.-M.; Guo, Y.; Zeng, L.; Liang-Ying, L.; Lu, X.; Wang, F.; Zeng, E.Y. Global distribution of perfluorochemicals (PFCs) in potential human exposure source—A review. Environ. Int. 2017, 108, 51–62. [Google Scholar] [CrossRef]
- Prevedouros, K.; Cousins, I.T.; Buck, R.C.; Korzeniowski, S.H. Sources, fate and transport of perfluorocarboxylates. Environ. Sci. Technol. 2006, 40, 32–44. [Google Scholar] [CrossRef] [PubMed]
- Manojkumar, Y.; Pilli, S.; Rao, P.V.; Tyagi, R.D. Sources, occurrence and toxic effects of emerging per- and polyfluoroalkyl substances (PFAS). Neurotoxicology Teratol. 2023, 97, 107174. [Google Scholar] [CrossRef] [PubMed]
- Li, X.; Fatowe, M.; Cui, D.; Quinete, N. Assessment of per- and polyfluoroalkyl substances in Biscayne Bay surface waters and tap waters from South Florida. Sci. Total Environ. 2022, 806, 150393. [Google Scholar] [CrossRef]
- Tang, Z.W.; Shahul Hamid, F.; Yusoff, I.; Chan, V. A review of PFAS research in Asia and occurrence of PFOA and PFOS in groundwater, surface water and coastal water in Asia. Groundw. Sustain. Dev. 2023, 22, 100947. [Google Scholar] [CrossRef]
- Cai, L.; Hu, J.; Li, J.; Cao, X.; Lyu, Y.; Sun, W. Occurrence, source apportionment, and pollution assessment of per- and polyfluoroalkyl substances in a river across rural and urban areas. Sci. Total Environ. 2022, 835, 155505. [Google Scholar] [CrossRef] [PubMed]
- Juhasz, A.L.; Keith, A.; Jones, R.; Kastury, F. Impact of precursors and bioaccessibility on childhood PFAS exposure from house dust. Sci. Total Environ. 2023, 889, 164306. [Google Scholar] [CrossRef]
- Yamazaki, E.; Lalwani, D.; Ruan, Y.; Taniyasu, S.; Hanari, N.; Kumar, N.J.I.; Lam, P.K.S.; Yamashita, N. Nationwide distribution of per- and polyfluoroalkyl substances (PFAS) in road dust from India. Sci. Total Environ. 2023, 892, 164538. [Google Scholar] [CrossRef] [PubMed]
- Macorps, N.; Labadie, P.; Lestremau, F.; Assoumani, A.; Budzinski, H. Per- and polyfluoroalkyl substances (PFAS) in surface sediments: Occurrence, patterns, spatial distribution and contribution of unattributed precursors in French aquatic environments. Sci. Total Environ. 2023, 874, 162493. [Google Scholar] [CrossRef]
- Paige, T.; De Silva, T.; Buddhadasa, S.; Prasad, S.; Nugegoda, D.; Pettigrove, V. Background concentrations and spatial distribution of PFAS in surface waters and sediments of the greater Melbourne area, Australia. Chemosphere 2024, 349, 140791. [Google Scholar] [CrossRef] [PubMed]
- Wellmitz, J.; Bandow, N.; Koschorreck, J. Long-term trend data for PFAS in soils from German ecosystems, including TOP assay. Sci. Total Environ. 2023, 893, 164586. [Google Scholar] [CrossRef] [PubMed]
- Cai, M.; Yang, H.; Xie, Z.; Zhao, Z.; Wang, F.; Lu, Z.; Sturm, R.; Ebinghaus, R. Per- and polyfluoroalkyl substances in snow, lake, surface runoff water and coastal seawater in Fildes Peninsula, King George Island, Antarctica. J. Hazard. Mater. 2012, 209–210, 335–342. [Google Scholar] [CrossRef]
- Battisti, I.; Trentin, A.R.; Franzolin, E.; Nicoletto, C.; Masi, A.; Renella, G. Uptake and distribution of perfluoroalkyl substances by grafted tomato plants cultivated in a contaminated site in northern Italy. Sci. Total Environ. 2024, 915, 170032. [Google Scholar] [CrossRef] [PubMed]
- Qian, S.; Lu, H.; Xiong, T.; Zhi, Y.; Munoz, G.; Zhang, C.; Li, Z.; Liu, C.; Li, W.; Wang, X.; et al. Bioaccumulation of Per- and Polyfluoroalkyl Substances (PFAS) in Ferns: Effect of PFAS Molecular Structure and Plant Root Characteristics. Environ. Sci. Technol. 2023, 57, 4443–4453. [Google Scholar] [CrossRef] [PubMed]
- Foord, C.S.; Szabo, D.; Robb, K.; Clarke, B.O.; Nugegoda, D. Hepatic concentrations of per- and polyfluoroalkyl substances (PFAS) in dolphins from south-east Australia: Highest reported globally. Sci. Total Environ. 2024, 908, 168438. [Google Scholar] [CrossRef]
- Wells, M.R.; Coggan, T.L.; Stevenson, G.; Singh, N.; Askeland, M.; Lea, M.-A.; Philips, A.; Carver, S. Per- and polyfluoroalkyl substances (PFAS) in little penguins and associations with urbanisation and health parameters. Sci. Total Environ. 2024, 912, 169084. [Google Scholar] [CrossRef]
- Abdallah, M.A.-E.; Wemken, N.; Drage, D.S.; Tlustos, C.; Cellarius, C.; Cleere, K.; Morrison, J.J.; Daly, S.; Coggins, M.A.; Harrad, S. Concentrations of perfluoroalkyl substances in human milk from Ireland: Implications for adult and nursing infant exposure. Chemosphere 2020, 246, 125724. [Google Scholar] [CrossRef]
- Xie, L.-N.; Wang, X.-C.; Dong, X.-J.; Su, L.-Q.; Zhu, H.-J.; Wang, C.; Zhang, D.-P.; Liu, F.-Y.; Hou, S.-S.; Dong, B.; et al. Concentration, spatial distribution, and health risk assessment of PFASs in serum of teenagers, tap water and soil near a Chinese fluorochemical industrial plant. Environ. Int. 2021, 146, 106166. [Google Scholar] [CrossRef] [PubMed]
- Law, H.D.; Armstrong, B.K.; D’este, C.; Hosking, R.; Smurthwaite, K.S.; Trevenar, S.; Lucas, R.M.; Lazarevic, N.; Kirk, M.D.; Korda, R.J. Relative rates of cancers and deaths in Australian communities with PFAS environmental contamination associated with firefighting foams: A cohort study using linked data. Cancer Epidemiol. 2023, 82, 102296. [Google Scholar] [CrossRef]
- Carstens, K.E.; Freudenrich, T.; Wallace, K.; Choo, S.; Carpenter, A.; Smeltz, M.; Clifton, M.S.; Henderson, W.M.; Richard, A.M.; Patlewicz, G.; et al. Evaluation of Per- and Polyfluoroalkyl Substances (PFAS) In Vitro Toxicity Testing for Developmental Neurotoxicity. Chem. Res. Toxicol. 2023, 36, 402–419. [Google Scholar] [CrossRef]
- Ehrlich, V.; Bil, W.; Vandebriel, R.; Granum, B.; Luijten, M.; Lindeman, B.; Grandjean, P.; Kaiser, A.M.; Hauzenberger, I.; Hartmann, C.; et al. Consideration of pathways for immunotoxicity of per- and polyfluoroalkyl substances (PFAS). Environ. Health 2023, 22, 19. [Google Scholar] [CrossRef]
- Freire, C.; Vela-Soria, F.; Castiello, F.; Salamanca-Fernández, E.; Quesada-Jiménez, R.; López-Alados, M.C.; Fernandez, M.F.; Olea, N. Exposure to perfluoroalkyl substances (PFAS) and association with thyroid hormones in adolescent males. Int. J. Hyg. Environ. Health 2023, 252, 114219. [Google Scholar] [CrossRef]
- Groisman, L.; Berman, T.; Quinn, A.; Pariente, G.; Rorman, E.; Karakis, I.; Gat, R.; Sarov, B.; Novack, L. Levels of PFAS concentrations in the placenta and pregnancy complications. Ecotoxicol. Environ. Saf. 2023, 262, 115165. [Google Scholar] [CrossRef]
- Pinas, V.; Van Dijk, C.; Weber, R. Inventory and action plan for PFOS and related substances in Suriname as basis for Stockholm Convention implementation. Emerg. Contam. 2020, 6, 421–431. [Google Scholar] [CrossRef]
- GB 5749-2022; Standards for Drinking Water Quality. State Administration for Market Regulation, Standardization Administration of the People’s Republic of China: Beijing, China, 2022.
- U.S. EPA (United States Environmental Protection Agency). PFAS National Primary Drinking Water Regulation; 89 FR 32532; Office of the Federal Register, National Archives and Records Administration: Washington, DC, USA, 2024.
- An, X.; Lei, H.; Lu, Y.; Xie, X.; Wang, P.; Liao, J.; Liang, Z.; Sun, B.; Wu, Z. Per- and polyfluoroalkyl substances (PFASs) in water and sediment from a temperate watershed in China: Occurrence, sources, and ecological risks. Sci. Total Environ. 2023, 890, 164207. [Google Scholar] [CrossRef] [PubMed]
- Wang, Q.; Tsui, M.M.P.; Ruan, Y.; Lin, H.; Zhao, Z.; Ku, J.P.H.; Sun, H.; Lam, P.K.S. Occurrence and distribution of per- and polyfluoroalkyl substances (PFASs) in the seawater and sediment of the South China sea coastal region. Chemosphere 2019, 231, 468–477. [Google Scholar] [CrossRef] [PubMed]
- Hu, J.; Lyu, Y.; Chen, H.; Cai, L.; Li, J.; Cao, X.; Sun, W. Integration of target, suspect, and nontarget screening with risk modeling for per- and polyfluoroalkyl substances prioritization in surface waters. Water Res. 2023, 233, 119735. [Google Scholar] [CrossRef]
- Wang, Q.; Ruan, Y.; Jin, L.; Lu, G.; Ma, L.; Yeung, L.W.Y.; Wang, W.-X.; Lam, P.K.S. Oysters for legacy and emerging per- and polyfluoroalkyl substances (PFASs) monitoring in estuarine and coastal waters: Phase distribution and bioconcentration profile. Sci. Total Environ. 2022, 846, 157453. [Google Scholar] [CrossRef]
- da Silva, B.F.; Aristizabal-Henao, J.J.; Aufmuth, J.; Awkerman, J.; Bowden, J.A. Survey of per- and polyfluoroalkyl substances (PFAS) in surface water collected in Pensacola, FL. Heliyon 2022, 8, e10239. [Google Scholar] [CrossRef] [PubMed]
- Pelch, K.E.; McKnight, T.; Reade, A. 70 analyte PFAS test method highlights need for expanded testing of PFAS in drinking water. Sci. Total Environ. 2023, 876, 162978. [Google Scholar] [CrossRef] [PubMed]
- Liu, Y.; Zhang, Y.; Li, J.; Wu, N.; Li, W.; Niu, Z. Distribution, partitioning behavior and positive matrix factorization-based source analysis of legacy and emerging polyfluorinated alkyl substances in the dissolved phase, surface sediment and suspended particulate matter around coastal areas of Bohai Bay, China. Environ. Pollut. 2019, 246, 34–44. [Google Scholar] [PubMed]
- Lee, J.-W.; Lee, H.-K.; Lim, J.-E.; Moon, H.-B. Legacy and emerging per- and polyfluoroalkyl substances (PFASs) in the coastal environment of Korea: Occurrence, spatial distribution, and bioaccumulation potential. Chemosphere 2020, 251, 126633. [Google Scholar] [CrossRef]
- Hariharan, G.; Sunantha, G.; Robin, R.S.; Darwin, R.; Purvaja, R.; Ramesh, R. Early detection of emerging persistent perfluorinated alkyl substances (PFAS) along the east coast of India. Sci. Total Environ. 2023, 902, 166155. [Google Scholar]
- Kwok, K.Y.; Wang, X.-H.; Ya, M.; Li, Y.; Zhang, X.-H.; Yamashita, N.; Lam, J.C.W.; Lam, P.K.S. Occurrence and distribution of conventional and new classes of per- and polyfluoroalkyl substances (PFASs) in the South China Sea. J. Hazard. Mater. 2015, 285, 389–397. [Google Scholar] [CrossRef] [PubMed]
- Pan, C.-G.; Ying, G.-G.; Zhao, J.-L.; Liu, Y.-S.; Jiang, Y.-X.; Zhang, Q.-Q. Spatiotemporal distribution and mass loadings of perfluoroalkyl substances in the Yangtze River of China. Sci. Total Environ. 2014, 493, 580–587. [Google Scholar] [CrossRef] [PubMed]
- Zhou, D.; Zhao, X.; Li, P.; Jin, F.; Li, S.; Li, H.; Wang, J. Assessing territorial space conflicts in the coastal zone of Wenzhou, China: A land-sea interaction perspective. Sci. Total Environ. 2024, 926, 171826. [Google Scholar] [CrossRef] [PubMed]
- Shi, L.; Yang, S. Assessment of eco-environmental stress in the Western Taiwan Straits Economic Zone. Sustainability 2015, 7, 2716–2729. [Google Scholar] [CrossRef]
- Hong, B.; Zhou, M.; Li, J.; Yu, S.; Liu, X.; Chen, P.; Zhang, Y.; Niu, Y. Effect of typhoons on spatiotemporal patterns of multi-group persistent organic pollutants in sediment of Chinese southeastern coastal estuaries. J. Hazard. Mater. 2024, 461, 132557. [Google Scholar] [CrossRef]
- Xie, J.; Sun, Y.; Cheng, Y.; Chen, Y.; Chen, L.; Xie, C.; Dai, S.; Luo, X.; Zhang, L.; Mai, B. Halogenated flame retardants in surface sediments from fourteen estuaries, South China. Mar. Pollut. Bull. 2021, 164, 112099. [Google Scholar] [CrossRef]
- Chen, Y.S.; Yu, S.; Hong, Y.W.; Lin, Q.Y.; Li, H.B. Pharmaceutical residues in tidal surface sediments of three rivers in southeastern China at detectable and measurable levels. Environ. Sci. Pollut. Res. 2013, 20, 8391–8403. [Google Scholar] [CrossRef] [PubMed]
- Wang, T.; Vestergren, R.; Herzke, D.; Yu, J.; Cousins, I.T. Levels, isomer profiles, and estimated riverine mass discharges of perfluoroalkyl acids and fluorinated alternatives at the mouths of Chinese rivers. Environ. Sci. Technol. 2016, 50, 11584–11592. [Google Scholar] [CrossRef]
- Zhang, F.; Yao, C.; Xu, J.; Zhu, L.; Peng, G.; Li, D. Composition, spatial distribution and sources of plastic litter on the East China Sea floor. Sci. Total Environ. 2020, 742, 140525. [Google Scholar] [CrossRef]
- Hu, H.; Fang, S.; Zhao, M.; Jin, H. Occurrence of phthalic acid esters in sediment samples from East China Sea. Sci. Total Environ. 2020, 722, 137997. [Google Scholar] [CrossRef] [PubMed]
- Xie, J.; Zhao, N.; Zhang, Y.; Hu, H.; Zhao, M.; Jin, H. Occurrence and partitioning of bisphenol analogues, triclocarban, and triclosan in seawater and sediment from East China Sea. Chemosphere 2022, 287, 132218. [Google Scholar] [CrossRef]
- Du, D.; Lu, Y.; Zhou, Y.; Zhang, M.; Wang, C.; Yu, M.; Song, S.; Cui, H.; Chen, C. Perfluoroalkyl acids (PFAAs) in water along the entire coastal line of China: Spatial distribution, mass loadings, and worldwide comparisons. Environ. Int. 2022, 169, 107506. [Google Scholar] [CrossRef]
- Lu, Z.; Song, L.; Zhao, Z.; Ma, Y.; Wang, J.; Yang, H.; Ma, H.; Cai, M.; Codling, G.; Ebinghaus, R.; et al. Occurrence and trends in concentrations of perfluoroalkyl substances (PFASs) in surface waters of eastern China. Chemosphere 2015, 119, 820–827. [Google Scholar] [CrossRef] [PubMed]
- Zhao, Z.; Tang, J.; Mi, L.; Tian, C.; Zhong, G.; Zhang, G.; Wang, S.; Li, Q.; Ebinghaus, R.; Xie, Z.; et al. Perfluoroalkyl and polyfluoroalkyl substances in the lower atmosphere and surface waters of the Chinese Bohai Sea, Yellow Sea, and Yangtze River estuary. Sci. Total Environ. 2017, 599–600, 114–123. [Google Scholar] [CrossRef]
- Liu, Z.; Zhou, J.; Xu, Y.; Lu, J.; Chen, J.; Wang, J. Distributions and sources of traditional and emerging per- and polyfluoroalkyl substances among multiple environmental media in the Qiantang River watershed, China. RSC Adv. 2022, 12, 21247. [Google Scholar] [CrossRef] [PubMed]
- Backe, W.J.; Day, T.C.; Field, J.A. Zwitterionic, cationic, and anionic fluorinated chemicals in aqueous film forming foam formulations and groundwater from U.S. military bases by nonaqueous large-volume Injection HPLC-MS/MS. Environ. Sci. Technol. 2013, 47, 5226–5234. [Google Scholar] [CrossRef] [PubMed]
- Codling, G.; Vogt, A.; Jones, P.D.; Wang, T.; Wang, P.; Lu, Y.L.; Corcoran, M.; Bonina, S.; Li, A.; Sturchio, N.C.; et al. Historical trends of inorganic and organic fluorine in sediments of Lake Michigan. Chemosphere 2014, 114, 203–209. [Google Scholar] [CrossRef] [PubMed]
- Viticoski, R.L.; Wang, D.; Feltman, M.A.; Mulabagal, V.; Rogers, S.R.; Blersch, D.M.; Hayworth, J.S. Spatial distribution and mass transport of Perfluoroalkyl Substances (PFAS) in surface water: A statewide evaluation of PFAS occurrence and fate in Alabama. Sci. Total Environ. 2022, 836, 155524. [Google Scholar] [CrossRef] [PubMed]
- Lenka, S.P.; Kah, M.; Padhye, L.P. A review of the occurrence, transformation, and removal of poly- and perfluoroalkyl substances (PFAS) in wastewater treatment plants. Water Res. 2021, 199, 117187. [Google Scholar] [CrossRef] [PubMed]
- Singh, K.; Kumar, N.; Kumar Yadav, A.; Singh, R.; Kumar, K. Per-and polyfluoroalkyl substances (PFAS) as a health hazard: Current state of knowledge and strategies in environmental settings across Asia and future perspectives. Chem. Eng. J. 2023, 475, 145064. [Google Scholar] [CrossRef]
- Garg, S.; Kumar, P.; Mishra, V.; Guijt, R.; Singh, P.; Dumée, L.F.; Sharma, R.S. A review on the sources, occurrence and health risks of per-/poly-fluoroalkyl substances (PFAS) arising from the manufacture and disposal of electric and electronic products. J. Water Process Eng. 2020, 38, 101683. [Google Scholar] [CrossRef]
- Paolo, F.S.; Kroodsma, D.; Raynor, J.; Hochberg, T.; Davis, P.; Cleary, J.; Marsaglia, L.; Orofino, S.; Thomas, C.; Halpin, P. Satellite mapping reveals extensive industrial activity at sea. Nature 2024, 625, 85–91. [Google Scholar] [CrossRef]
- Beškoski, V.P.; Yamamoto, K.; Yamamoto, A.; Okamura, H.; Hayashi, M.; Nakano, T.; Matsumura, C.; Fukushi, K.; Wada, S.; Inui, H. Distribution of perfluoroalkyl compounds in Osaka Bay and coastal waters of Western Japan. Chemosphere 2017, 170, 260–265. [Google Scholar] [CrossRef] [PubMed]
- Han, T.; Gao, L.; Chen, J.; He, X.; Wang, B. Spatiotemporal variations, sources and health risk assessment of perfluoroalkyl substances in a temperate bay adjacent to metropolis, North China. Environ. Pollut. 2020, 265, 115011. [Google Scholar] [CrossRef] [PubMed]
- Chen, H.; Jiang, J.; Tang, J.; Xu, L.; Deng, W.; Ye, K.; Zeng, D.; Luo, Y. Legacy and emerging per- and polyfluoroalkyl substances in the Shuidong bay of South China: Occurrence, partitioning behavior, and ecological risks. Chemosphere 2024, 350, 141106. [Google Scholar] [CrossRef] [PubMed]
- Pan, C.-G.; Yu, K.-F.; Wang, Y.-H.; Zhang, W.; Zhang, J.; Guo, J. Perfluoroalkyl substances in the riverine and coastal water of the Beibu Gulf, South China: Spatiotemporal distribution and source identification. Sci. Total Environ. 2019, 660, 297–305. [Google Scholar] [CrossRef]
- Naile, J.E.; Khim, J.S.; Hong, S.; Park, J.; Kwon, B.-O.; Ryu, J.S.; Hwang, J.H.; Jones, P.D.; Giesy, J.P. Distributions and bioconcentration characteristics of perfluorinated compounds in environmental samples collected from the west coast of Korea. Chemosphere 2013, 90, 387–394. [Google Scholar] [CrossRef] [PubMed]
- Naile, J.E.; Khim, J.S.; Wang, T.; Chen, C.; Luo, W.; Kwon, B.-O.; Park, J.; Koh, C.-H.; Jones, P.D.; Lu, Y.; et al. Perfluorinated compounds in water, sediment, soil and biota from estuarine and coastal areas of Korea. Environ. Pollut. 2010, 158, 1237–1244. [Google Scholar] [CrossRef] [PubMed]
- Thompson, J.; Roach, A.; Eaglesham, G.; Bartkow, M.E.; Edge, K.; Mueller, J.F. Perfluorinated alkyl acids in water, sediment and wildlife from Sydney Harbour and surroundings. Mar. Pollut. Bull. 2011, 62, 2869–2875. [Google Scholar] [CrossRef]
- Cao, X.; Xin, S.; Liu, X.; Wang, S. Occurrence and behavior of per- and polyfluoroalkyl substances and conversion of oxidizable precursors in the waters of coastal tourist resorts in China. Environ. Pollut. 2023, 316, 120460. [Google Scholar] [CrossRef] [PubMed]
- U.S. EPA (United States Environmental Protection Agency). Final Recommended Aquatic Life Criteria and Benchmarks for Select PFAS; 89 FR 81077; Office of the Federal Register, National Archives and Records Administration: Washington, DC, USA, 2024.

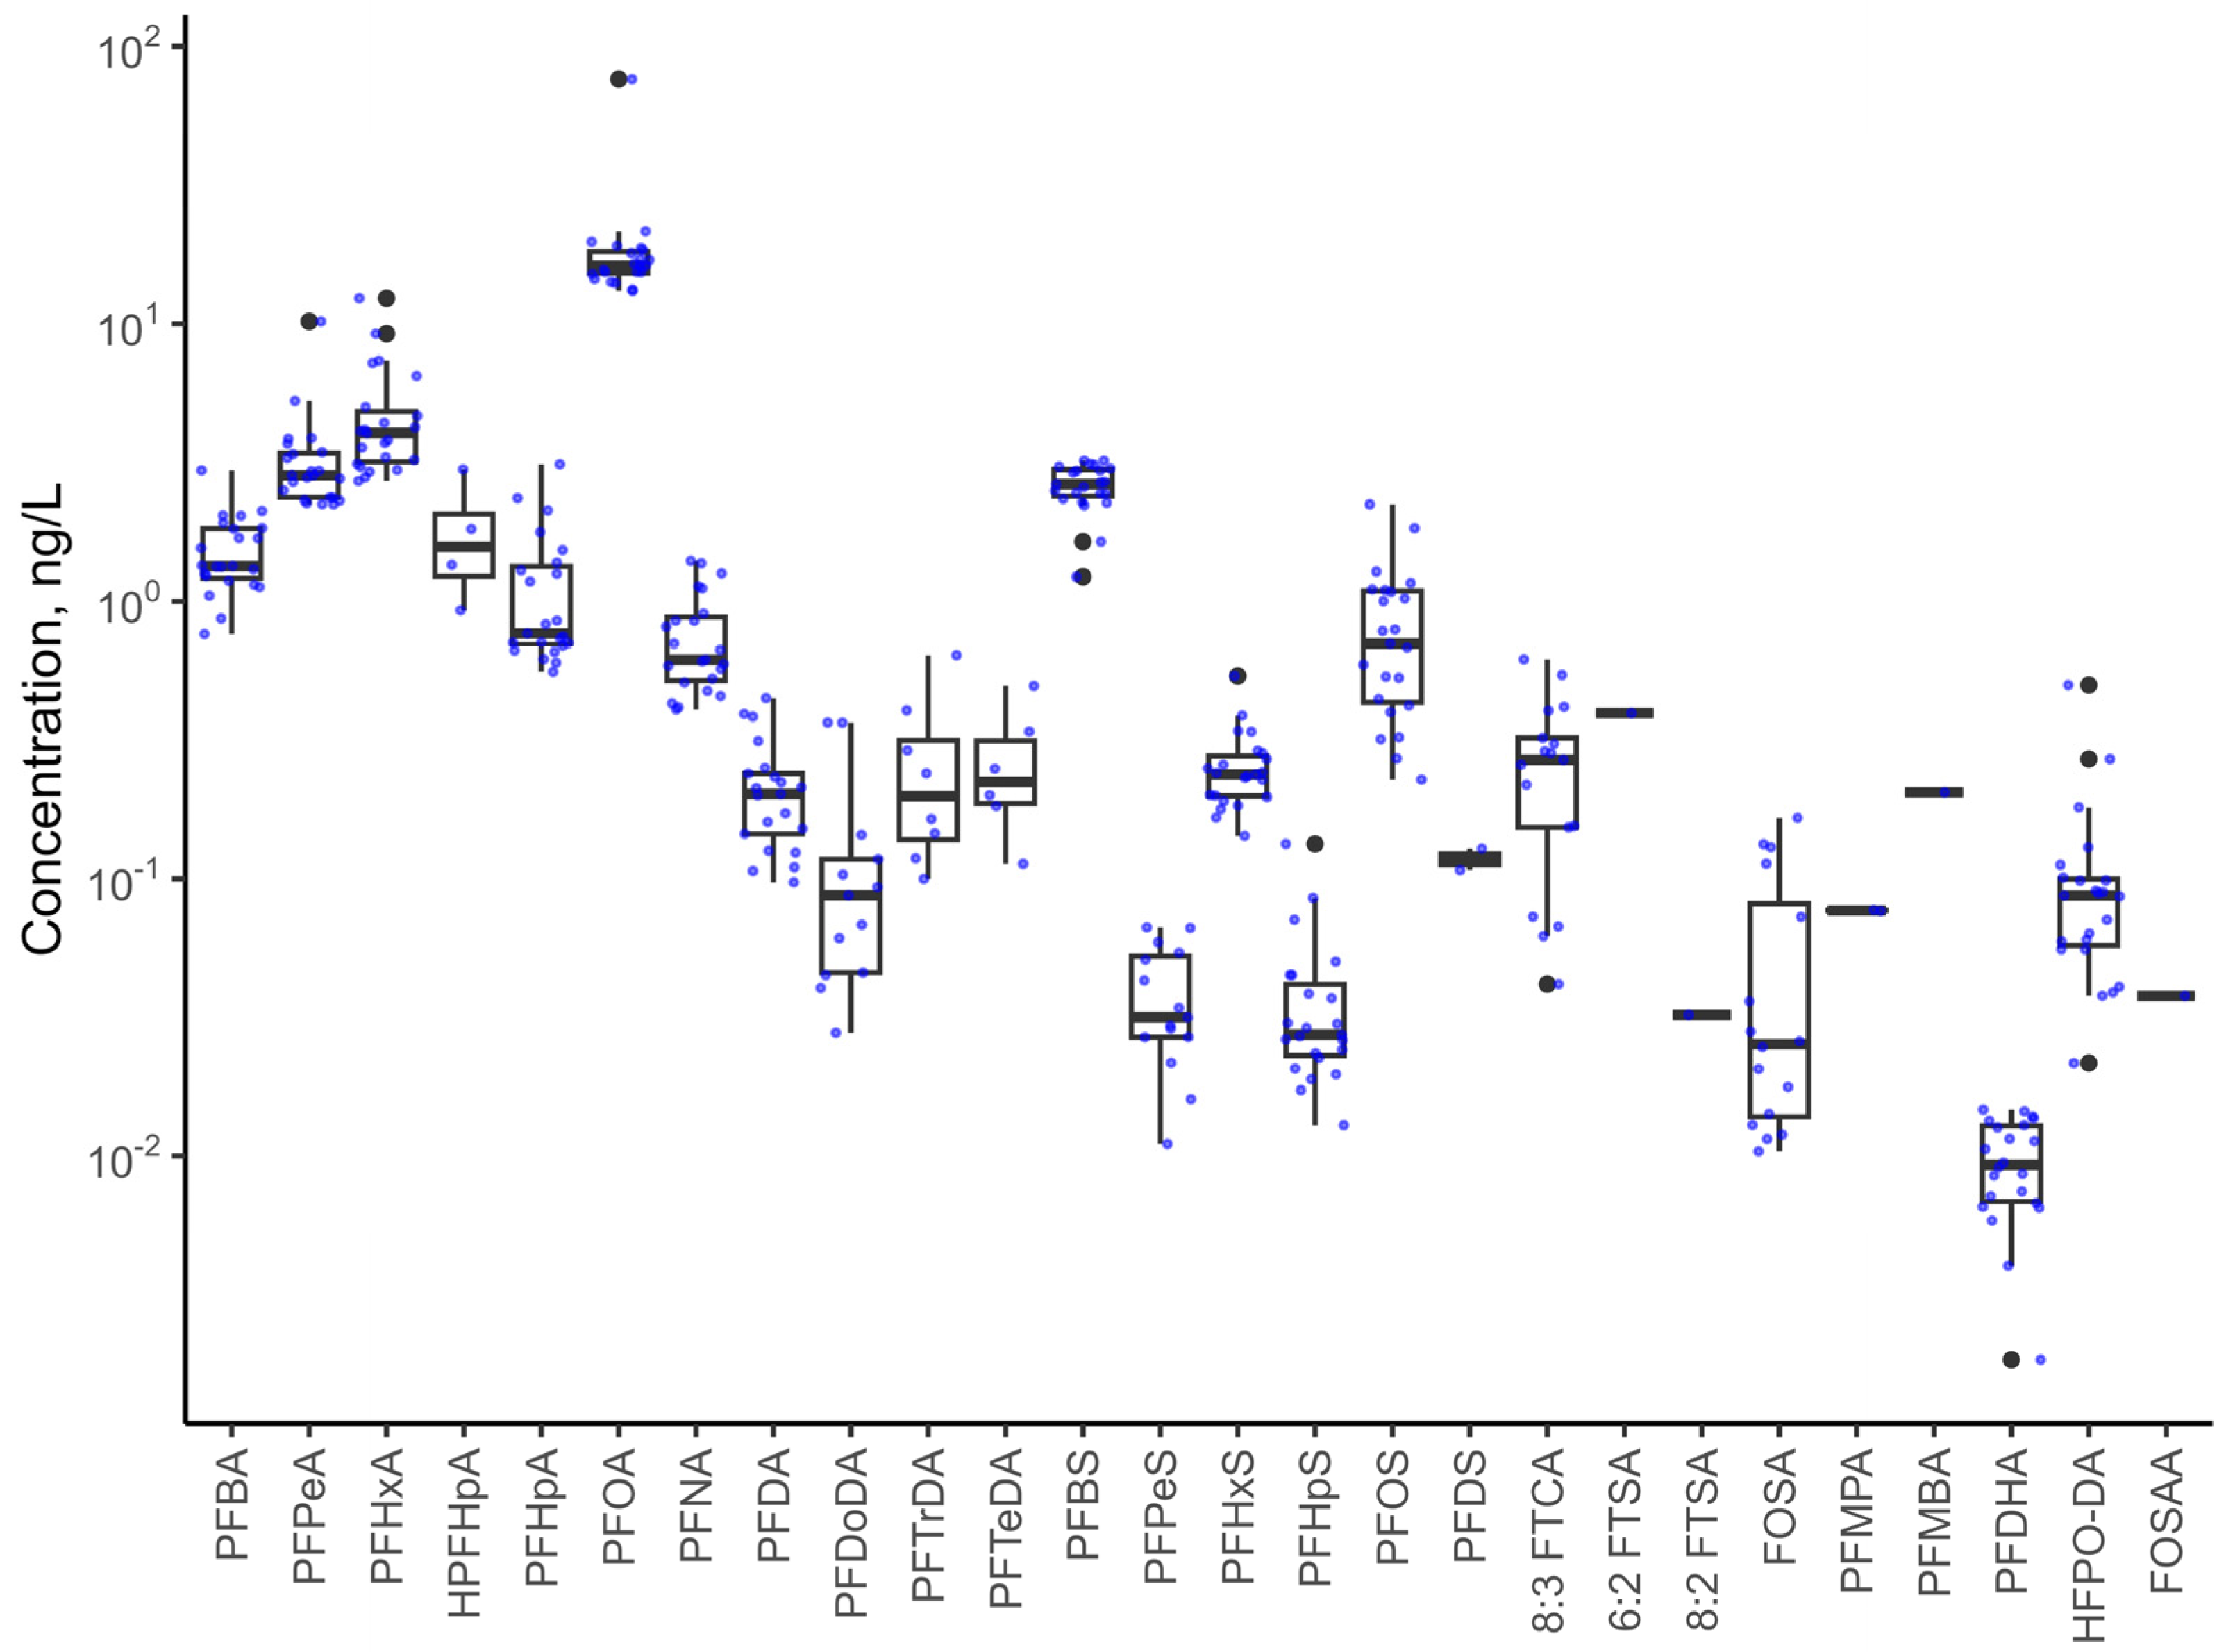

| PFAS | Detection Frequencies (%) | Minimum Concentration (ng/L) | Maximum Concentration (ng/L) | Mean Concentration (ng/L) | Standard Deviation (ng/L) |
|---|---|---|---|---|---|
| PFBA | 100.0 | 0.7619 | 2.9659 | 1.5201 | 0.49 |
| PFPeA | 100.0 | 2.2345 | 10.2046 | 3.2822 | 1.67 |
| HPFHpA | 17.4 | 0.9284 | 2.9888 | 1.7731 | 0.89 |
| PFHxA | 100.0 | 2.7120 | 12.3816 | 4.7203 | 2.37 |
| PFHpA | 100.0 | 0.5569 | 3.1181 | 1.1242 | 0.67 |
| PFOA | 100.0 | 13.1665 | 76.3125 | 19.0062 | 12.67 |
| PFNA | 100.0 | 0.4074 | 1.3983 | 0.7501 | 0.31 |
| PFDA | 91.3 | 0.0971 | 0.4473 | 0.2144 | 0.10 |
| PFDoDA | 56.5 | 0.0279 | 0.3652 | 0.1203 | 0.11 |
| PFTrDA | 34.8 | 0.0999 | 0.6395 | 0.2627 | 0.18 |
| PFTeDA | 26.1 | 0.1131 | 0.4957 | 0.2633 | 0.14 |
| PFBS | 100.0 | 1.2262 | 3.2166 | 2.6072 | 0.49 |
| PFHxS | 100.0 | 0.1427 | 0.5381 | 0.2532 | 0.086 |
| PFHpS | 100.0 | 0.0129 | 0.1334 | 0.0375 | 0.027 |
| PFOS | 100.0 | 0.2275 | 2.2338 | 0.8191 | 0.50 |
| PFDS | 8.7 | 0.1075 | 0.1283 | 0.1179 | 0.015 |
| PFPeS | 65.2 | 0.0111 | 0.0667 | 0.0378 | 0.018 |
| FOSA | 69.6 | 0.0104 | 0.1658 | 0.0518 | 0.053 |
| FOSAA | 4.3 | 0.0378 | 0.0378 | 0.0378 | - |
| 8:3 FTCA | 73.9 | 0.0417 | 0.6178 | 0.2633 | 0.17 |
| 6:2 FTSA | 4.3 | 0.3950 | 0.3950 | 0.3950 | - |
| 8:2 FTSA | 4.3 | 0.0323 | 0.0323 | 0.0323 | - |
| PFMPA | 8.7 | 0.0766 | 0.0771 | 0.0768 | 0.00033 |
| PFMBA | 4.3 | 0.2048 | 0.2048 | 0.2048 | - |
| PFDHA | 95.7 | 0.0018 | 0.0147 | 0.0096 | 0.0036 |
| HFPO-DA (GenX) | 100.0 | 0.0216 | 0.4990 | 0.1059 | 0.10 |
Disclaimer/Publisher’s Note: The statements, opinions and data contained in all publications are solely those of the individual author(s) and contributor(s) and not of MDPI and/or the editor(s). MDPI and/or the editor(s) disclaim responsibility for any injury to people or property resulting from any ideas, methods, instructions or products referred to in the content. |
© 2025 by the authors. Licensee MDPI, Basel, Switzerland. This article is an open access article distributed under the terms and conditions of the Creative Commons Attribution (CC BY) license (https://creativecommons.org/licenses/by/4.0/).
Share and Cite
Chen, C.; Wang, Y.; Chen, F.; Wang, X.; Zhang, Q.; Sun, J.; Li, S.; Chen, Q.; Shang, F.; Zhang, H. Comprehensive Assessment of Per- and Polyfluoroalkyl Substances (PFAS) Pollution in a Coastal Region: Contributions from Nearshore and Offshore Sources. Water 2025, 17, 149. https://doi.org/10.3390/w17020149
Chen C, Wang Y, Chen F, Wang X, Zhang Q, Sun J, Li S, Chen Q, Shang F, Zhang H. Comprehensive Assessment of Per- and Polyfluoroalkyl Substances (PFAS) Pollution in a Coastal Region: Contributions from Nearshore and Offshore Sources. Water. 2025; 17(2):149. https://doi.org/10.3390/w17020149
Chicago/Turabian StyleChen, Chenyu, Ying Wang, Fei Chen, Xinyue Wang, Qiao Zhang, Jialong Sun, Si Li, Qiang Chen, Fangze Shang, and Hui Zhang. 2025. "Comprehensive Assessment of Per- and Polyfluoroalkyl Substances (PFAS) Pollution in a Coastal Region: Contributions from Nearshore and Offshore Sources" Water 17, no. 2: 149. https://doi.org/10.3390/w17020149
APA StyleChen, C., Wang, Y., Chen, F., Wang, X., Zhang, Q., Sun, J., Li, S., Chen, Q., Shang, F., & Zhang, H. (2025). Comprehensive Assessment of Per- and Polyfluoroalkyl Substances (PFAS) Pollution in a Coastal Region: Contributions from Nearshore and Offshore Sources. Water, 17(2), 149. https://doi.org/10.3390/w17020149