1. Introduction
The South China Sea (SCS) is one of the largest links in the chain of marginal seas of East Asia and represents an important part of the East Asian gas hydrate belt stretching from the coast of New Zealand to the Bering Sea [
1]. Numerous oil- and gas-bearing structures in the SCS region, including the Vietnamese shelf, make it possible to consider the region as a natural laboratory for studying the sources of natural gas formation and ways of its migration to the upper layers of the Earth’s crust, the water column and the atmosphere. The findings from research carried out in this region are significant in solving the general problem of the genesis and migration of natural gases, provide a better understanding of the causes and conditions of the location of known gas fields in the marginal seas of East Asia and contribute to the forecast of new petroleum deposits.
Russian gas geochemical studies in the waters of Vietnam began back in 1981, as one of the directions of joint geological and geophysical research efforts. The research was carried out by the Pacific Oceanological Institute of the Far Eastern Scientific Center of the USSR Academy of Sciences (POI FESC of the USSR Academy of Sciences, Vladivostok), together with Vietnamese scientists from the Institute of Marine Research of the National Center for Scientific Research of the SRV (IMR NCNR SRV, Nha Trang). High concentrations of natural gases (methane, carbon dioxide, etc.) and their sharp spatial variability were detected in the bottom waters on the border of the shelf of Southeastern Vietnam and the deep-sea basin of the South China Sea during the first stage of research. At the same time, it became clear that the detected gas outlets were concentrated in the zone of a large meridional fault (109°30′–110° E), currently active and acting as a drainage channel for gas emanation. The results of the gas geochemical studies of that period were published by Russian geologists Kulinich and Obzhirov [
2,
3] and then in a collective monograph [
4].
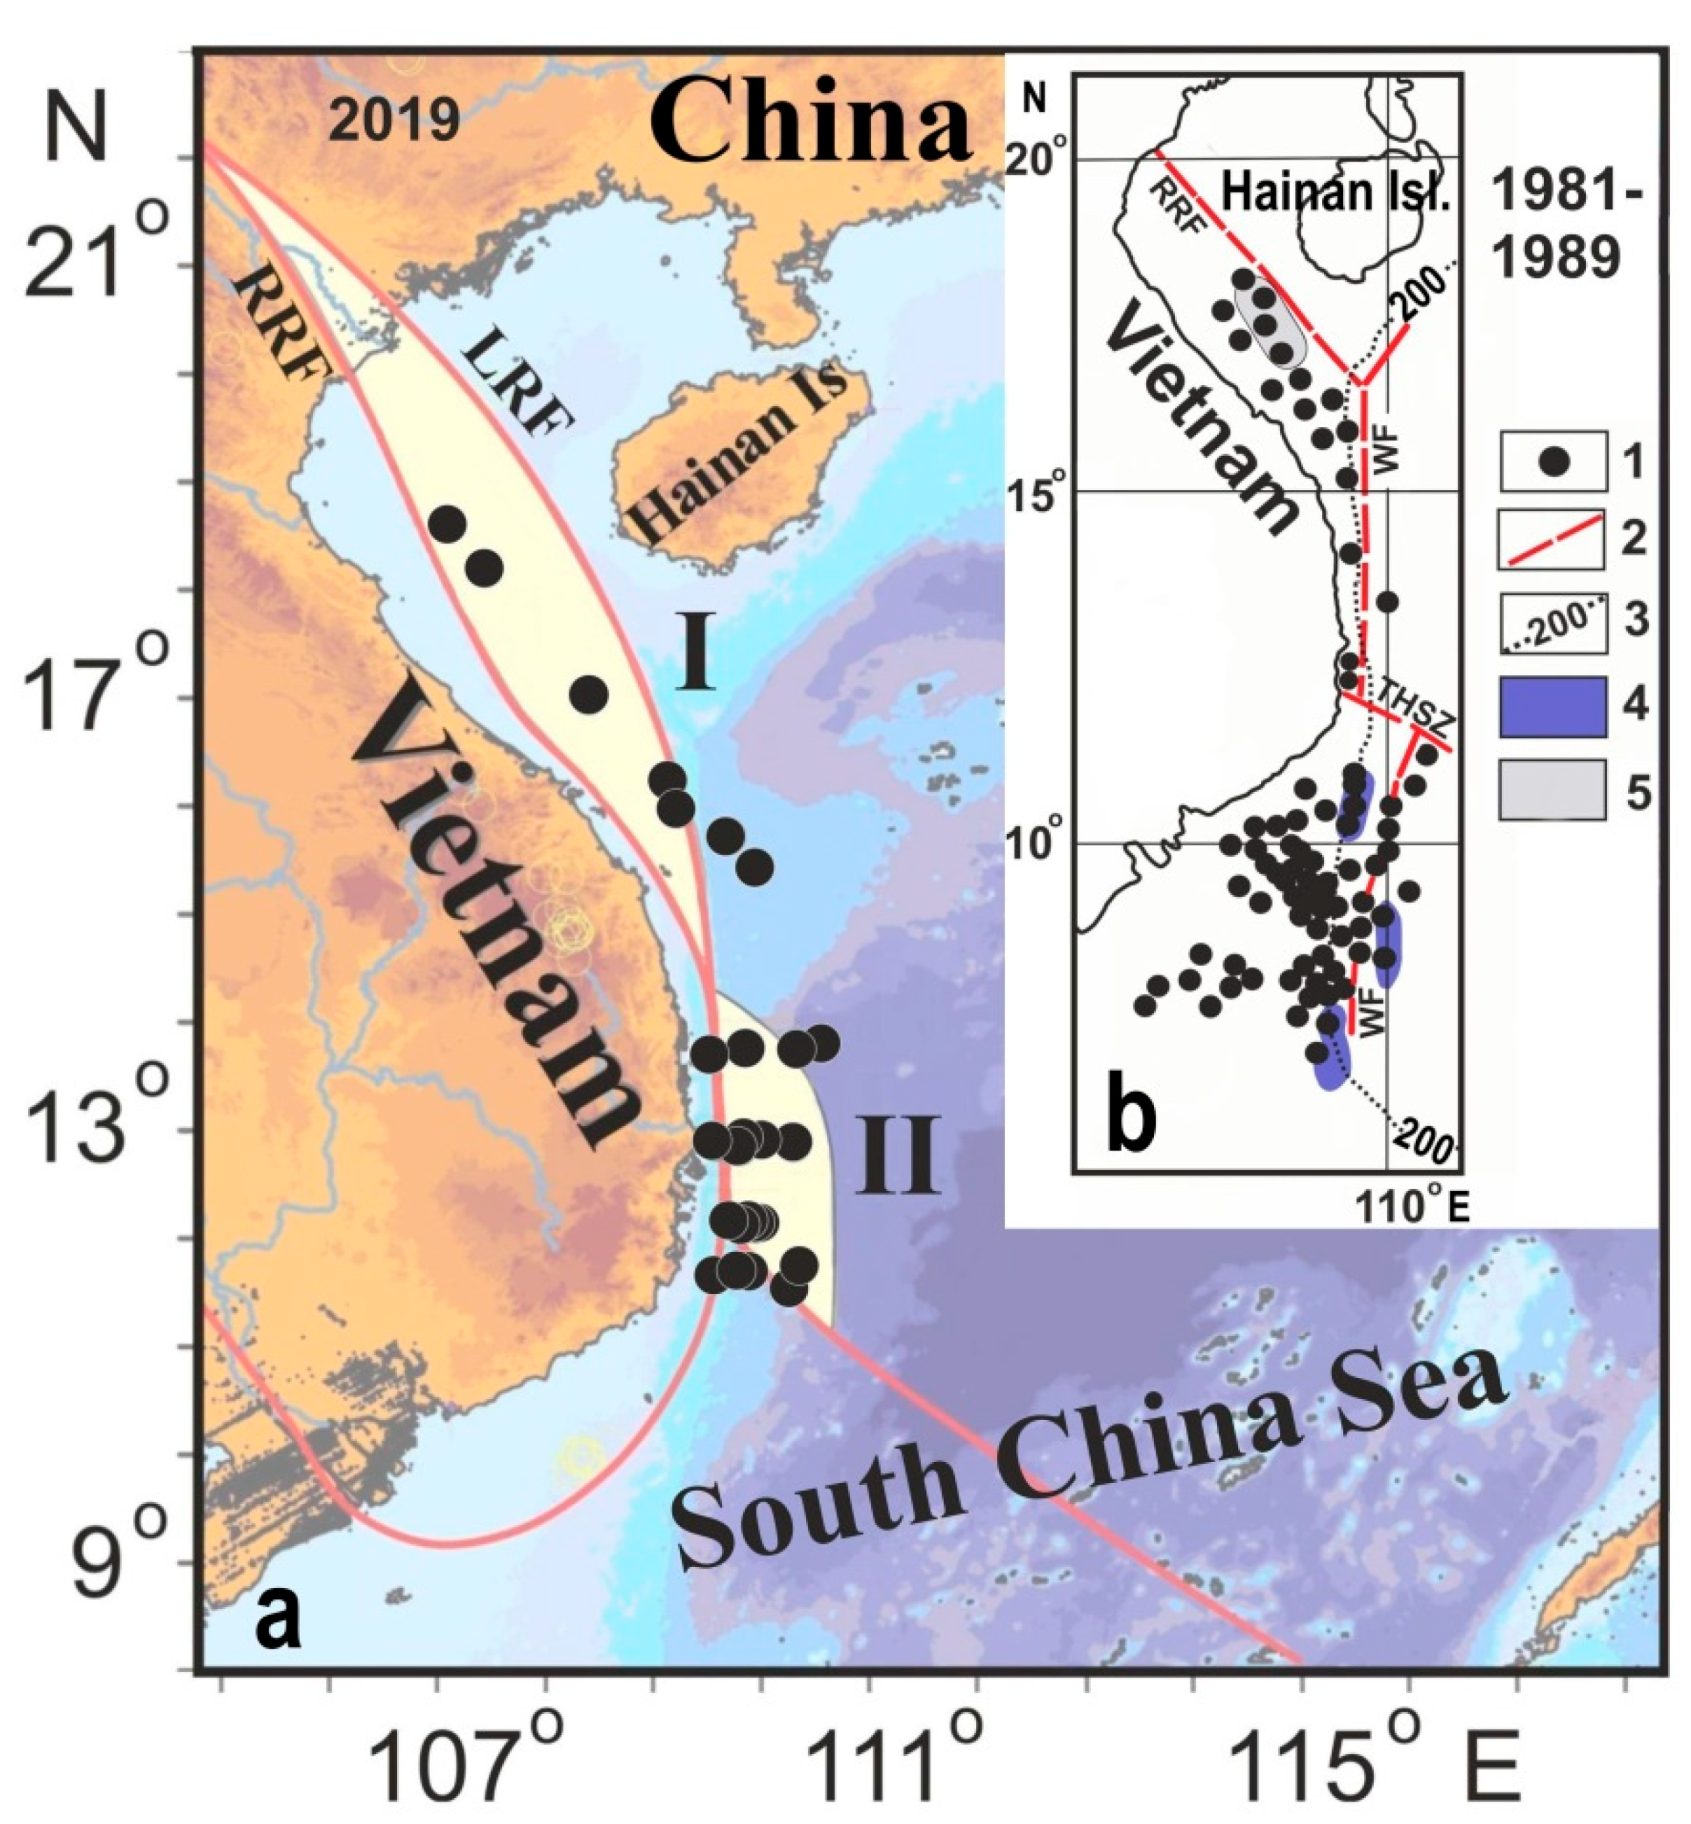
Extensive gas geochemical studies were carried out before the 1990s, leading to the discovery of new fields of abnormal methane concentrations. These findings, coupled with geophysical investigations, made it possible to assess the oil and gas prospects of the entire Vietnam shelf. The location of the research area and the main gas geochemical sampling stations in the period of 1981–1989 is shown in
Figure 1b.
Vietnam’s and the South China Sea’s waters as a whole have been actively studied by gas geochemical methods since the beginning of the 21st century [
7,
8,
9,
10,
11,
12,
13].
One of the latest expeditions of the Pacific Oceanological Institute to the offshore waters of Vietnam was conducted in October–December 2019 by R/V “Akademik M.A. Lavrentyev”, as part of cruise No. 88 (LV88). The research was carried out jointly with Vietnamese colleagues from the Institute of Marine Geology and Geophysics of the Vietnamese Academy of Sciences and Technologies (IMGG VAST). Continuing and adding details to the gas geochemical studies in this area were the main goals of the expedition. Three main sedimentary basins that were recommended on the Vietnamese side (Red River, Phu Khanh and Nam Con Son sedimentary basins) were the objects of research. The gas geochemical research encompassed a comprehensive examination of available data concerning the generation and distribution of hydrocarbon and other natural gas sources within the regional tectonic structure. Furthermore, the study explored the conditions and mechanisms of methane and its homologues’ formation in bottom sediments and the water column. Additionally, novel sites exhibiting anomalous concentrations of these gases were identified. A large amount of new versatile information, including geological, gas geochemical and geophysical aspects of the researched area, was obtained. All this, together with an analysis of other studies, is established in the monograph [
14].
This paper deals with another aspect affecting the formation and migration of dissolved methane fields in seawater—the hydrodynamics of the South China Sea and its restructuring under the influence of seasonal meteorological conditions and other synoptic processes. This is especially important for the South China Sea region, which is in a monsoon climate and exposed to tropical cyclones. In addition, we found it is necessary to discuss another factor. Our Vietnamese colleagues recently estimated the possibility of the fault system’s reactivation for various areas of the South China Sea [
15]. Based on the results of this study, there is a strong possibility that the tectonic activity in the Red River and Phu Khanh sedimentary basins will reactivate in the region. Since tectonic reactivation is one of the main factors determining the creation of a new drainage system or the renewal of an existing drainage system for the upward migration of deep gases, this research provides the basis for a forecast reassessment of known gas accumulations and the identification of new areas that are promising for hydrocarbon deposits. In our opinion, depending on the nature of tectonic disturbances (discharges, shifts, thrusts, etc.), different variations in the transformation of channels and the migration routes of endogenous gases may occur. The number, location and intensity of active gas emission sources may change, leading to changes in the pathways and intensity of gas migration toward the upper layers of the Earth’s crust. These tectonic processes are likely to affect the existing system for the formation of gas sources and its migration, which currently makes long-term predictions of the oil and gas potential of these basins difficult.
2. Tectonic Structures of the Research Area
The sedimentary basins of the Red River and the Phu Khanh depression are located in the zones of deep faults that originated or were activated during the opening of the South China Sea. At present, they act as boundary suture structures between the major geoblocks of Southeast Asia. The Red River fault zone is located in the northwest, which is a system of long-lived shear structures that currently form the boundary between the Indochina block (Paleozoic–Indochina folded region) in the west and the South China block (Precambrian Yangtze paraplatform) in the east [
16,
17,
18,
19,
20].
The role and significance of the Red River fault zone are explained in one of the popular models dealing with the opening of the South China Sea [
21]. In this paper, Tapponnier and his co-authors proposed a model describing the South China Sea’s opening as a result of the Indian and Eurasian lithospheric plates’ collision, which took place approximately 55–50 million years ago. This collision led the Indochina block to be squeezed out towards the southeast with some clockwise rotation. This event, according to these authors, was responsible for the disclosure of the South China Sea, and these displacements occurred along the Red River fault. Further tectonic processes created a complex system of shear faults there with the formation of horst and graben structures as well as sedimentary basins. The largest of them, located in the Red River delta and continuing along the Gulf of Tonkin’s bottom, is the object of this research.
The second object, confined to the Phu Khanh depression, is located in the zone of another deep fault stretching between 109°30′ and 110° E. The complex joint research of the early 80s, including gravimetric and gas geochemical surveys conducted by the Pacific Oceanological Institute and geological research conducted by the Institute of Volcanology of the Far Eastern Scientific Center of the USSR Academy of Sciences, allowed researchers to detect and qualify this object as a deep fault, considered to be an active tectono-magmatic zone that separates the Vietnamese shelf and the Sunda plate from the South China Sea’s deep-water basin [
2,
3,
22].
In recent years, Vietnamese geophysicists from the Institute of Marine Geology and Geophysics of the Vietnamese Academy of Sciences and Technologies (IMGG VAST) have studied this fault in more detail, and it was named the Western Fault of the Eastern Sea (WFES) [
6,
15]. In this paper, we will call it the Western Fault of the South China Sea (WFSCS).
Figure 1b schematically shows its position. The origin of the WFSCS can be associated with another model of the formation of the South China Sea, suggesting Cenozoic rifting [
23,
24,
25]. According to this model, riftogenesis began in the Paleogene, spreading along the Vietnamese continental shelf with the formation of rift depressions. The formation of the Phu Khanh basin can be associated with this process. Currently, the western slope of this depression is formed by the WFSCS.
Another hypothesis of the origin of the WFSCS assumed that this structure might be a part of a trans-regional tectonic system stretching between the meridians of 100 and 110° E to the north through the whole of China and Mongolia to the limits of the Siberian Platform. The presence of this lineament is also observed until reaching the south of the studied area. This super lineament on the vast territory of Asia delimits geological structures of different ages of the Alpine-Himalayan (northwestern) and Pacific (northeastern) strikes. This geological phenomenon has been considered in a number of scientific research studies. Its existence is well illustrated in the publication of Tapponier and co-authors, which provides a general diagram of the tectonic structures of Asia [
26]. According to Chinese researchers, this lineament in the Mesozoic–Cenozoic became the boundary between different geodynamic regimes: compression in the west and stretching in the east [
27]. According to another Chinese author, “diva” structures (geodepressions) only developed east of this lineament [
28]. Various aspects of this trans-regional structure have also been discussed at different times by Mongolian [
29] and Russian authors [
30,
31]. The WFSCS in the studied area played a similar role as the entire specified lineament. Indeed, on both sides of this fault, most tectonic structures are oriented in different directions. In the east, the northeastern direction prevails. The basin of the South China Sea is an example. To the west, the general direction changes to the northwest. The Indochina Peninsula and the fault system of the Red River are oriented in this direction. During the collision of the Indian and Eurasian lithospheric plates, the shear dislocations of Indochina along the Red River fault in the south could have moved into the “ready” tectonically weakened zone of the modern Western Fault and become involved in the process of the South China Sea’s opening.
In general, the formation of the sedimentary basins under consideration in different models, one way or another, is associated with the opening of the South China Sea. It has a causal relationship but different geodynamic and tectonic mechanisms. In any case, the degassing of geological space occurs through tectonically weakened zones (faults), and all sources and fields of natural gases are genetically and spatially related to this type of structure. Therefore, the study of the tectonic faults system and their current activity or activity in the near future are of paramount importance when searching for new or prospective evaluations of known hydrocarbon deposits.
The issue of tectonic faults has been a topic of interest for many researchers, and some of their works are referenced in our paper. Additionally, this year, researchers from IMGG VANT in collaboration with the POI FEB RAS published a study that compiled all available data on oil and gas accumulations and deposits in the main sedimentary basins along the shelf and continental slope of Vietnam, including the sedimentary basins of the Red River and Phu Khanh. This study also summarized data on known regional fault systems, which were supplemented by information on new faults identified through the interpretation of gravity fields. A correlation analysis was performed to investigate the relationship between the position and strike of oil- and gas-bearing structures and faults, which revealed a close correlation between them [
32].
From this point of view, the recent research by our Vietnamese colleagues from the IMGG with the participation of scientists of the POI FEB RAS is important. As mentioned above, the specified team made an assessment of the probability of the reactivation of the fault system in different areas of the South China Sea and mapped the corresponding forecast [
15]. According to this forecast, the Red River and Phu Khanh sedimentary basins are located in a tectonic system with the maximum probability of its reactivation. The Red River basin is almost entirely in the zone with the maximum probability of tectonic reactivation. The same prediction applies mainly to the southern part of the Phu Khanh basin, where the meridional WFSCS intersects with the Tuy Hoa shear zone. These possible events make it difficult to provide an accurate forecast regarding the oil and gas potential of the studied areas.
3. Hydrodynamic Regime in the Study Area
Natural gases, which go from bottom sediments into seawater, are carried by its currents in accordance with the general hydrodynamic structure of the basin. The spatio-temporal variability in these hydrodynamic processes naturally entails a change in the overall structure of gas transportation. This relationship is particularly pronounced in shallow shelf waters, where the circulation of the entire water column is notably influenced by regional meteorological processes. All this in general makes it difficult to obtain adequate information when performing gas geochemical studies. Hence, it is crucial to comprehend and account for the hydrodynamic regime of the studied area. In addition, according to a number of researchers, water layers serve as tracers of hydrocarbon gases’ distribution throughout the Pacific basin [
13,
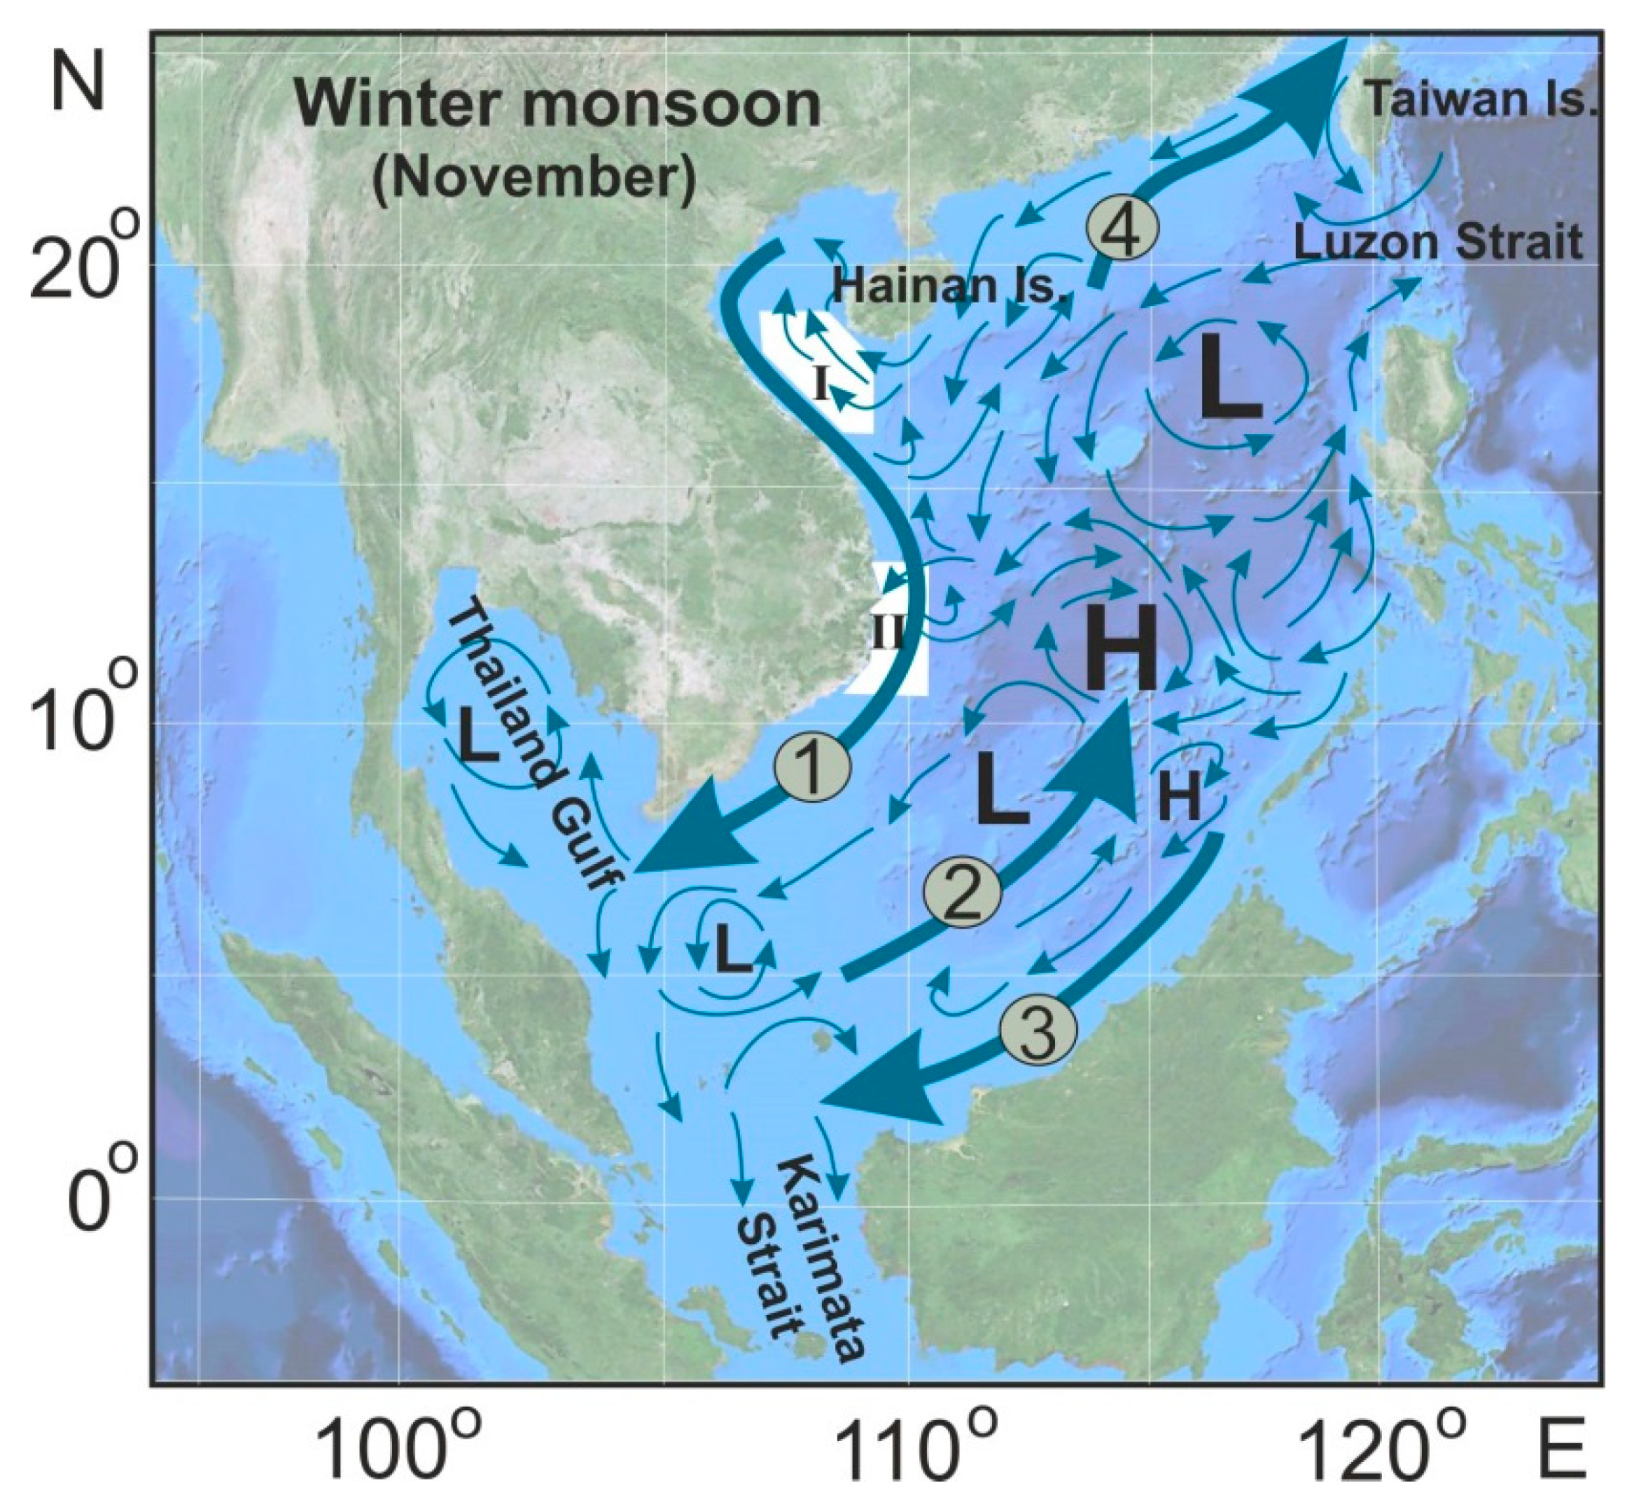
23]. The South China Sea region is influenced by the East Asian monsoon, which exhibits distinct seasonal variations. There are summer (southwest) and winter (northeast) monsoons. In summer, air masses move from the southwest to the northeast, and in winter, they move in the opposite direction. Their interaction with the surface waters of the South China Sea leads to a regular seasonal restructuring of the water circulation.
The Vietnamese current is the main hydrodynamic structure of the western part of the South China Sea, including the research area. It is subject to seasonal spatial and temporal variability, like other hydrodynamic structures of the South China Sea. In winter, under the influence of the winter monsoon, the waters of this current move from the north to the south and southwest, and in summer, they move in the opposite direction, according to the movement of the air masses of the East Asian monsoon. Since the expedition data under discussion were obtained in the autumn/winter seasons (mainly in November), we consider the hydrodynamic regime of South China Sea only in the conditions of the winter northeast monsoon. To compile a general scheme of the currents for the specified period, we used all available databases and the main published materials as of 2018.
Figure 2 shows the resulting scheme.
Influenced by the northeast monsoon, the waters of the North Equatorial Pacific Current flow from the Philippine Sea to the South China Sea through the Luzon Strait (Bashi) and spread in a westerly direction in the northern and central parts of the sea during the period under review. These waters merge with the flow coming from the East China Sea through the Taiwan Strait. The combined, powerful stream goes along the Hainan Island to the shores of Vietnam. To the west of Hainan Island, some of the water masses, skirting this island, move north into the Gulf of Tonkin, forming cyclonic circulation there. The main flow south of Hainan Island goes further to the southwest, creating the coastal Vietnamese current (see
Figure 2).
In the south, the Vietnamese current turns to the west and southwest, also passing along the coast of South Vietnam. At the southwestern end of the Vietnamese coast, there is a bifurcation of the current. One of its parts goes to the Gulf of Thailand, creating a cyclonic eddy there. The other part goes further south and exits the South China Sea through the southern straits. Countercurrents are often formed in the shallow coastal areas of Vietnam. The areas adjacent to the shores of South Vietnam are the exception. The general scheme of the currents presented (see
Figure 2) demonstrates possible ways of transporting dissolved natural gases from their sources located in the sedimentary basins of the Red River and Phu Khanh.
In addition to the monsoon factor, the hydrodynamic structure of the coastal Vietnamese current is significantly influenced by tropical cyclones (typhoons) that originate either in the tropical zone of the Northwestern Pacific Ocean or over the waters of the South China Sea [
33]. Typhoons create the instability of hydrodynamic processes (baroclinicity), increasing convective mixing and the vorticity of waters. This, in turn, destroys the regular migration routes of dissolved natural gases formed by seasonal monsoons and creates additional difficulties in investigating their spatial and temporal distribution. It has been determined that this region experiences an average of 12 typhoons annually, with the highest frequency occurring between June and December, peaking in September [
34]. As can be seen, the expedition under consideration was conducted during a period of increased frequency of tropical cyclones. Typhoon Nakri was a direct confirmation of this. It formed in the southern part of the South China Sea during the period of the expedition. This was another factor complicating the water structure and the general hydrodynamic regime in the study area.
4. Material and Methods
We used the results of gas geochemical research performed during the expedition by R/V “Akademik M.A. Lavrentyev” in October–November 2019 (LV88) as our main source material. The research included the determination of methane in bottom sediments, as well as bottom, intermediate and surface waters in the areas described above (see
Figure 1 and
Figure 2).
Bottom sediment sampling was conducted using a gravity sampler with a length of 3 to 6 m and an inner diameter of up to 120 mm. The lithological features of sedimentary cores were taken into account when sampling. Twelve mL disposable medical syringes with cut-off nozzles were used to sample sediment from the core. Then the sediment collected was put into sterile 43 mL and 68 mL glass bottles filled with a saturated NaCl solution with a preservative (0.5 mL chlorhexidine digluconate, 0.05%).
A 6-position rosette (USA) in combination with a CTD unit was used for water sampling. The CTD sounding complex was equipped with a cassette with NISKIN bathometers (6 pcs). Water was sampled at various horizons according the vertical distribution of temperature, salinity, density (T, S, P) and other hydrological parameters identified during CTD measurements. The main oceanographic parameters (temperature, salinity, density, turbidity, etc.) were studied for further detailed analysis of dissolved methane distribution. For these purposes, water samples were collected at six standard horizons: 0, 20, 50, 200 and 600 m.
The “headspace” method of equilibrium concentrations was used for gas chromatographic analysis of water. Samples were also taken to obtain the gas phase by vacuum degassing method in order to determine the concentrations of methane and its homologues (ethane, propane and butane) in seawater more accurately. A “CristalLux 4000M” (JSC “Chromatec”, Yoshkar-Ola, Russia) two-channel gas chromatograph equipped with a flame ionization detector and two thermal conductivity detectors (with sensitivity of 10−5%) was used for hydrocarbon gas analysis.
6. Red River Basin
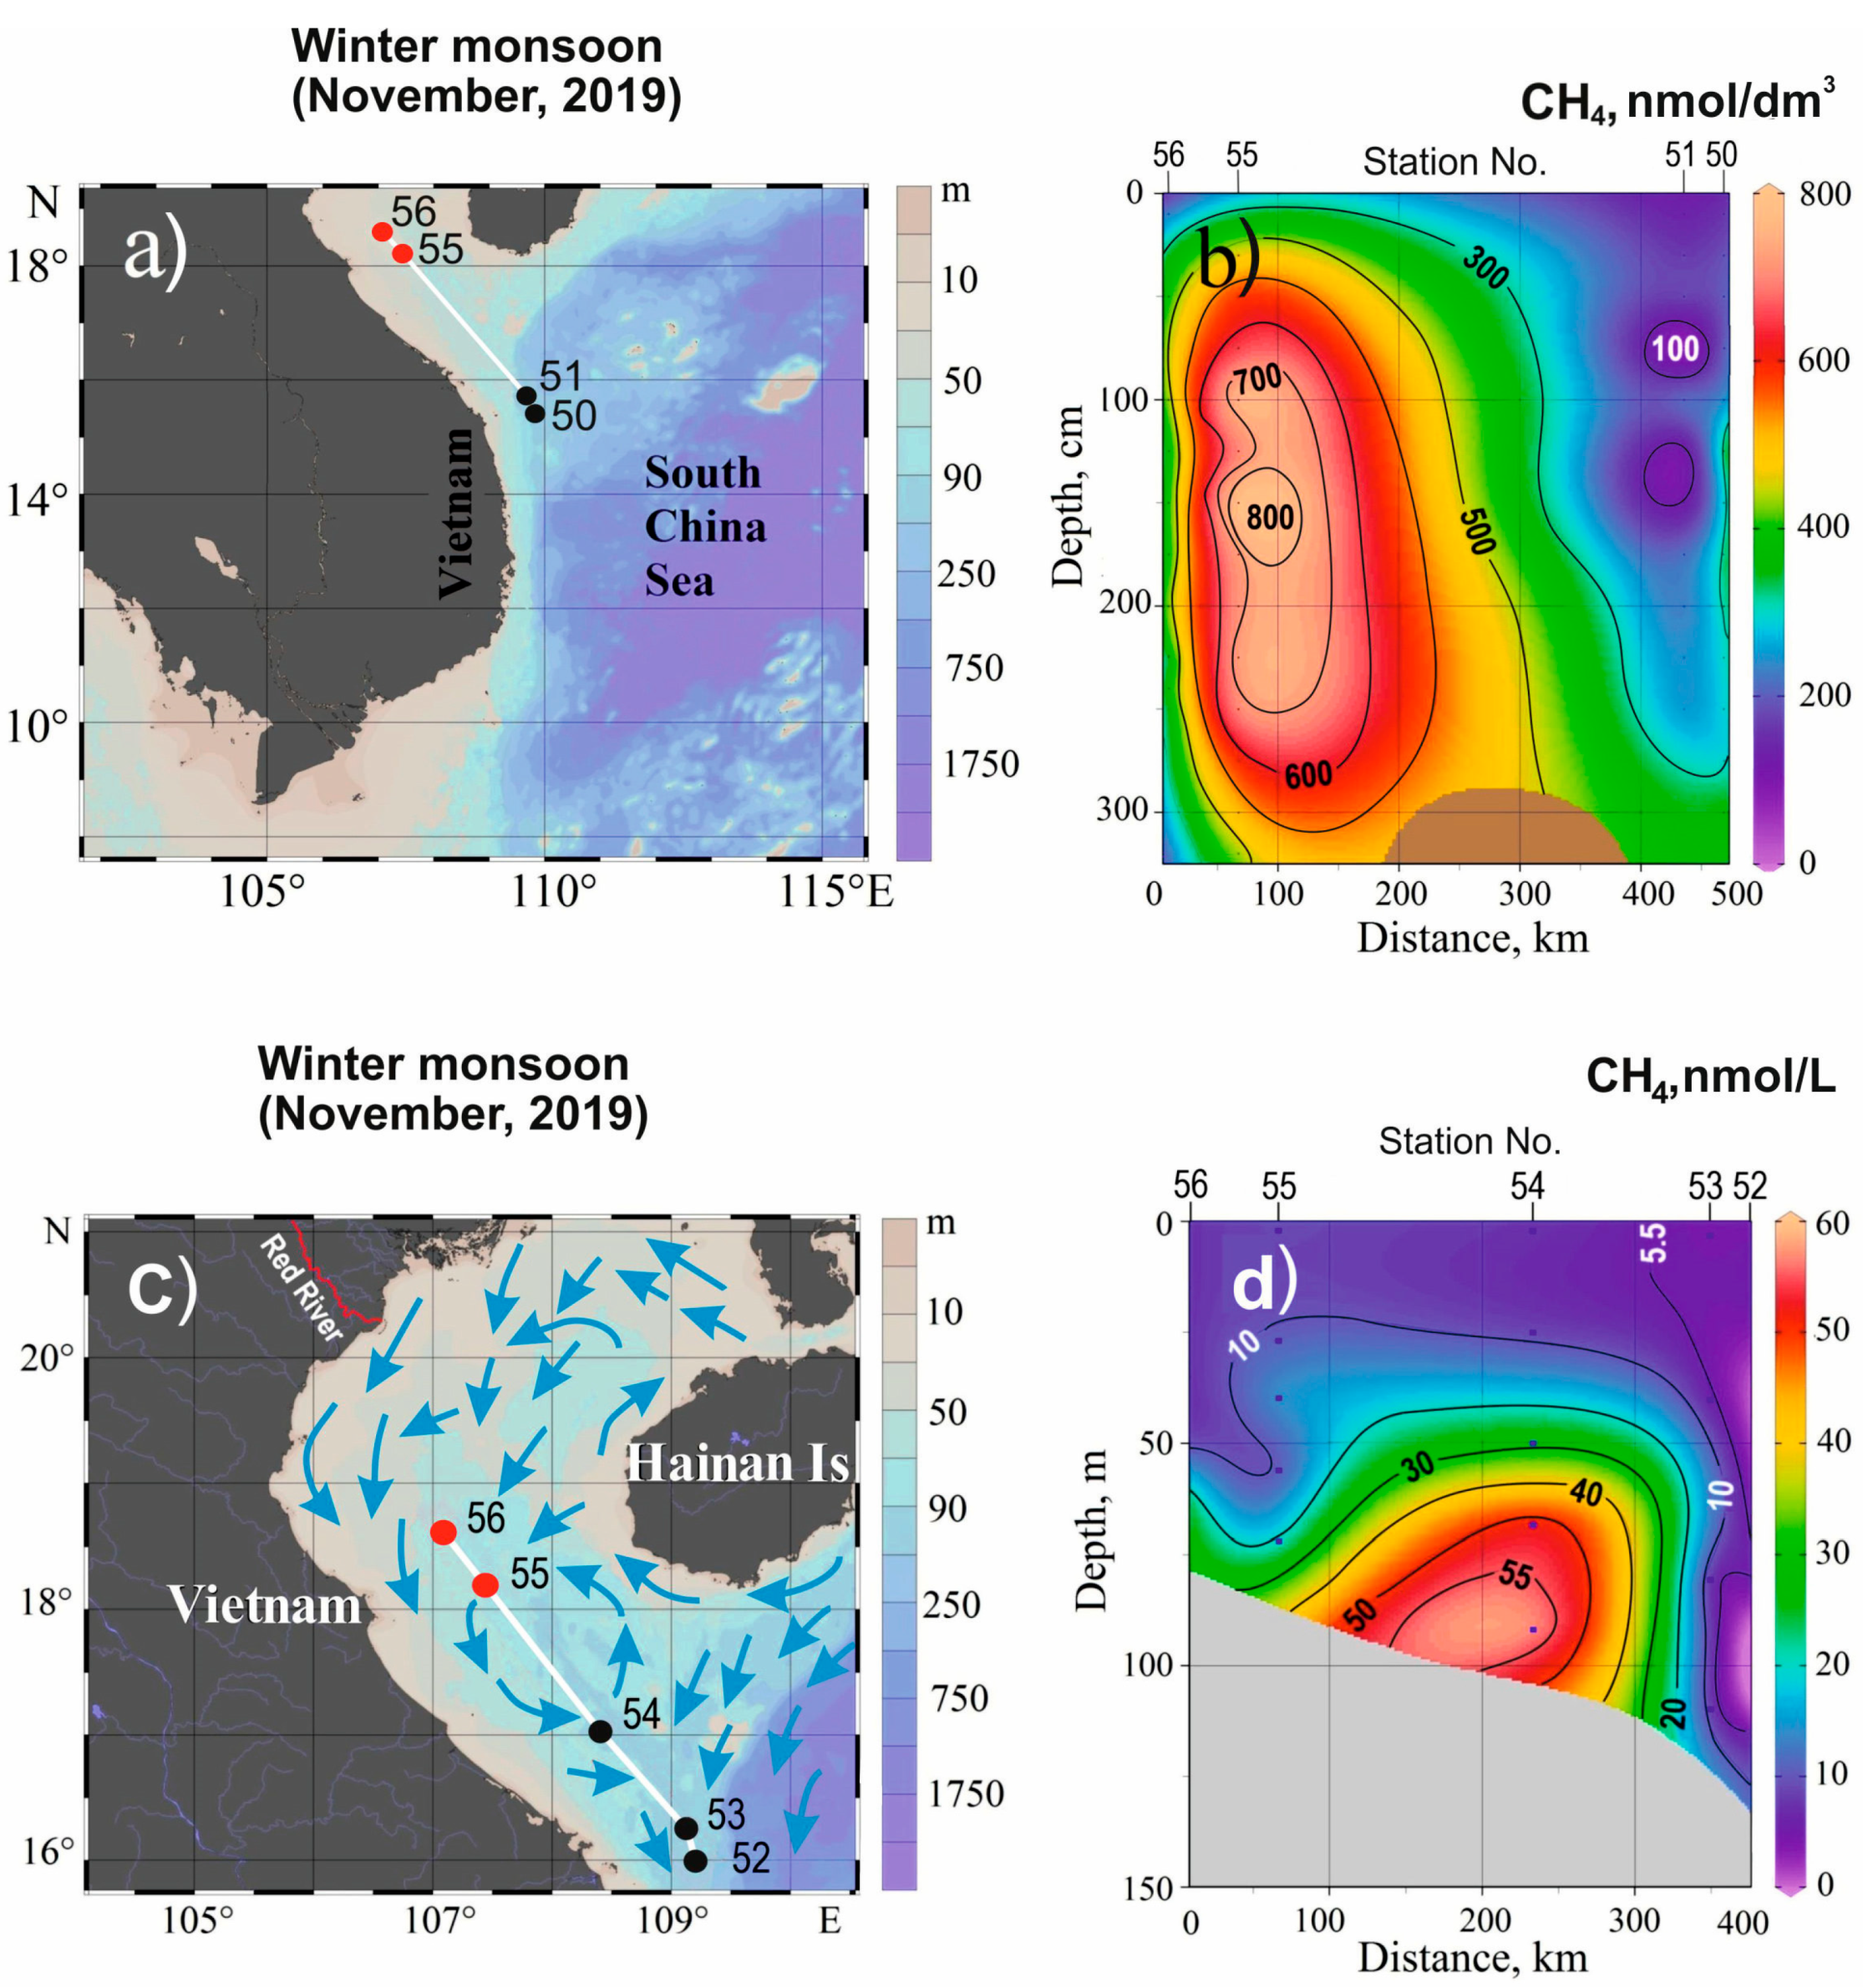
Figure 3a,c show the sediment and water sampling stations respectively. Sediments were sampled at four stations (No. 50, 51, 55 and 56), and water samples and CTD measurements were taken at five stations (No. 52, 53, 54, 55 and 56). Stations No. 55 and 56 were subject to both water and sediment sampling.
Sediment samples were taken from the near-surface layer in the 0–300 cm interval at stations No. 55 and 56. Anomalous concentrations of methane (up to 793 nmol/dm
3) were detected at station No. 55 with a background content of 26 ppm (252 nmol/dm
3) [
14]. The detected anomaly is observed only up to the 40 cm horizon. It does not extend into the water column (
Figure 3d). Its maximum value is fixed at a distance of 150 cm from the bottom surface. At the southern stations 50 and 51, the methane concentration in sediment (45–360 nmol/dm
3) is much lower than at the northern stations (
Figure 3b). A local methane maximum in sediments (360 nmol/dm
3 at the 300 cm horizon) was detected at station No. 50 (
Figure 3b). The presence of heavy hydrocarbons (ethane and propane) at the considered stations indicates the endogenous nature of the source located in this area. The absence of gases coming into the water column indicates insufficiently intensive methane emission and, as a result, its accumulation only in the sediment layer. The influence of hydrodynamics is excluded here. According to the identified signs, oil and gas accumulations are possible in the bowels of the site under consideration.
Figure 3 also shows a section (
Figure 3c) with an abnormal water dissolved methane concentration field (
Figure 3d). Its maximum is shifted relative to the gas anomaly in the sediment of stations No. 55 and 56 (
Figure 3a) and is fixed in the center of the profile. At station No. 54 (
Figure 3c), an absolute dissolved methane maximum (58 nmol/L) was detected in the bottom layer at a depth of 91 m (
Figure 3d). The anomaly spreads from the bottom to the horizon of 50 m, where its quantitative values fall to 28 nmol/L. This anomaly is traced along the profile at a distance of more than 200 km.
An increased methane content was also detected (
Figure 3d) in the northwest. A high abnormal concentration of hydrocarbon gases was also detected in the sediments in the area of stations No. 55 and No. 56 (
Figure 3b). High methane concentrations (32.5 nmol/L) spread here from the bottom to the 64 m horizon at station No. 56, where its quantitative values decreased to 25.4 nmol/L. This methane field spreads from the bottom to the 60 m horizon, where its quantitative values are even lower than 23 nmol/L in the area of station No. 55.
Thus, methane concentrations in the water of the Red River sedimentary basin are rather low, with the exception of station No. 54 (
Figure 3d). This anomaly with a maximum methane concentration of 228 nL/L (10 nmol/L) in the area (17°40′10″ N, 108°00′10″ E) was detected in the 1980s [
2,
3]. This implies the long-term stability of the degassing of this site, indicating the existence of a deep source of hydrocarbon generation here with the formation of gas and possibly oil accumulations in the lower sedimentary strata. Based on the dispersion pattern of the gas anomaly and sea currents in this area (see
Figure 2 and
Figure 3d), it can be inferred that a portion of the dissolved methane originating from the area near station No. 54 (
Figure 4b) may be transported by currents towards the northwest to the Gulf of Tonkin.
In the gulf, the current forms a cyclonic structure that turns southward and transports the dissolved gases. Another part of dissolved methane can be transported southwards directly from station No. 54. South of Hainan Island, both streams of the current join the coastal Vietnam current, which acts as a carrier of hydrocarbon gases from this area.
Taking into account the anomalous concentrations of hydrocarbon gases in the sediments at stations No. 55 and No. 56, the prospects of petroleum deposits for this area can be considered positive. Depth sources of degassing are confirmed by the presence of high concentrations of carbon dioxide here (0.40–0.50 mL/L or 18–20 μmol/L). Moreover, based on the results of recent studies [
35], the isotopic gas geochemical data obtained allowed us to confirm the conclusions about the presence of gas and condensate in the Red River basin depths. The results of isotope analyses in the Red River basin [
35] showed that the values of the stable carbon isotope lie in the range of 40.4–64.0‰ for methane and 17.4–23.8‰ for carbon dioxide, which indicates a predominantly thermogenic gas genesis (depths more than 2 km) with the presence of gases of microbial origin. The most “heavy” isotopic composition of carbon in methane and carbon dioxide was found in the sediments on stations № 55 and 56, in the zone of elevated methane concentrations. In May 2019, a large Ken Bau gas field was opened, which is located in the area of the described near-bottom methane anomaly. Gas geochemical [
36] and geomicrobiological [
37] indicators were also identified here by the LV88 expedition. We hope that the results of our studies will help to clarify the outer contours of the field.
7. Phu Khanh Basin
In this basin, expedition LV88 also studied the gas composition of the bottom sediments and seawater. In our research, 22 bottom sediment sampling stations and 11 water sampling stations were studied. The limited capabilities of the CTD measurement and sampling complex (up to 600 m) under the conditions of a sharp increase in the depth of the seafloor to the east of the Western Fault (≈110°00′ E) resulted in a smaller number of determinations of dissolved gases in water.
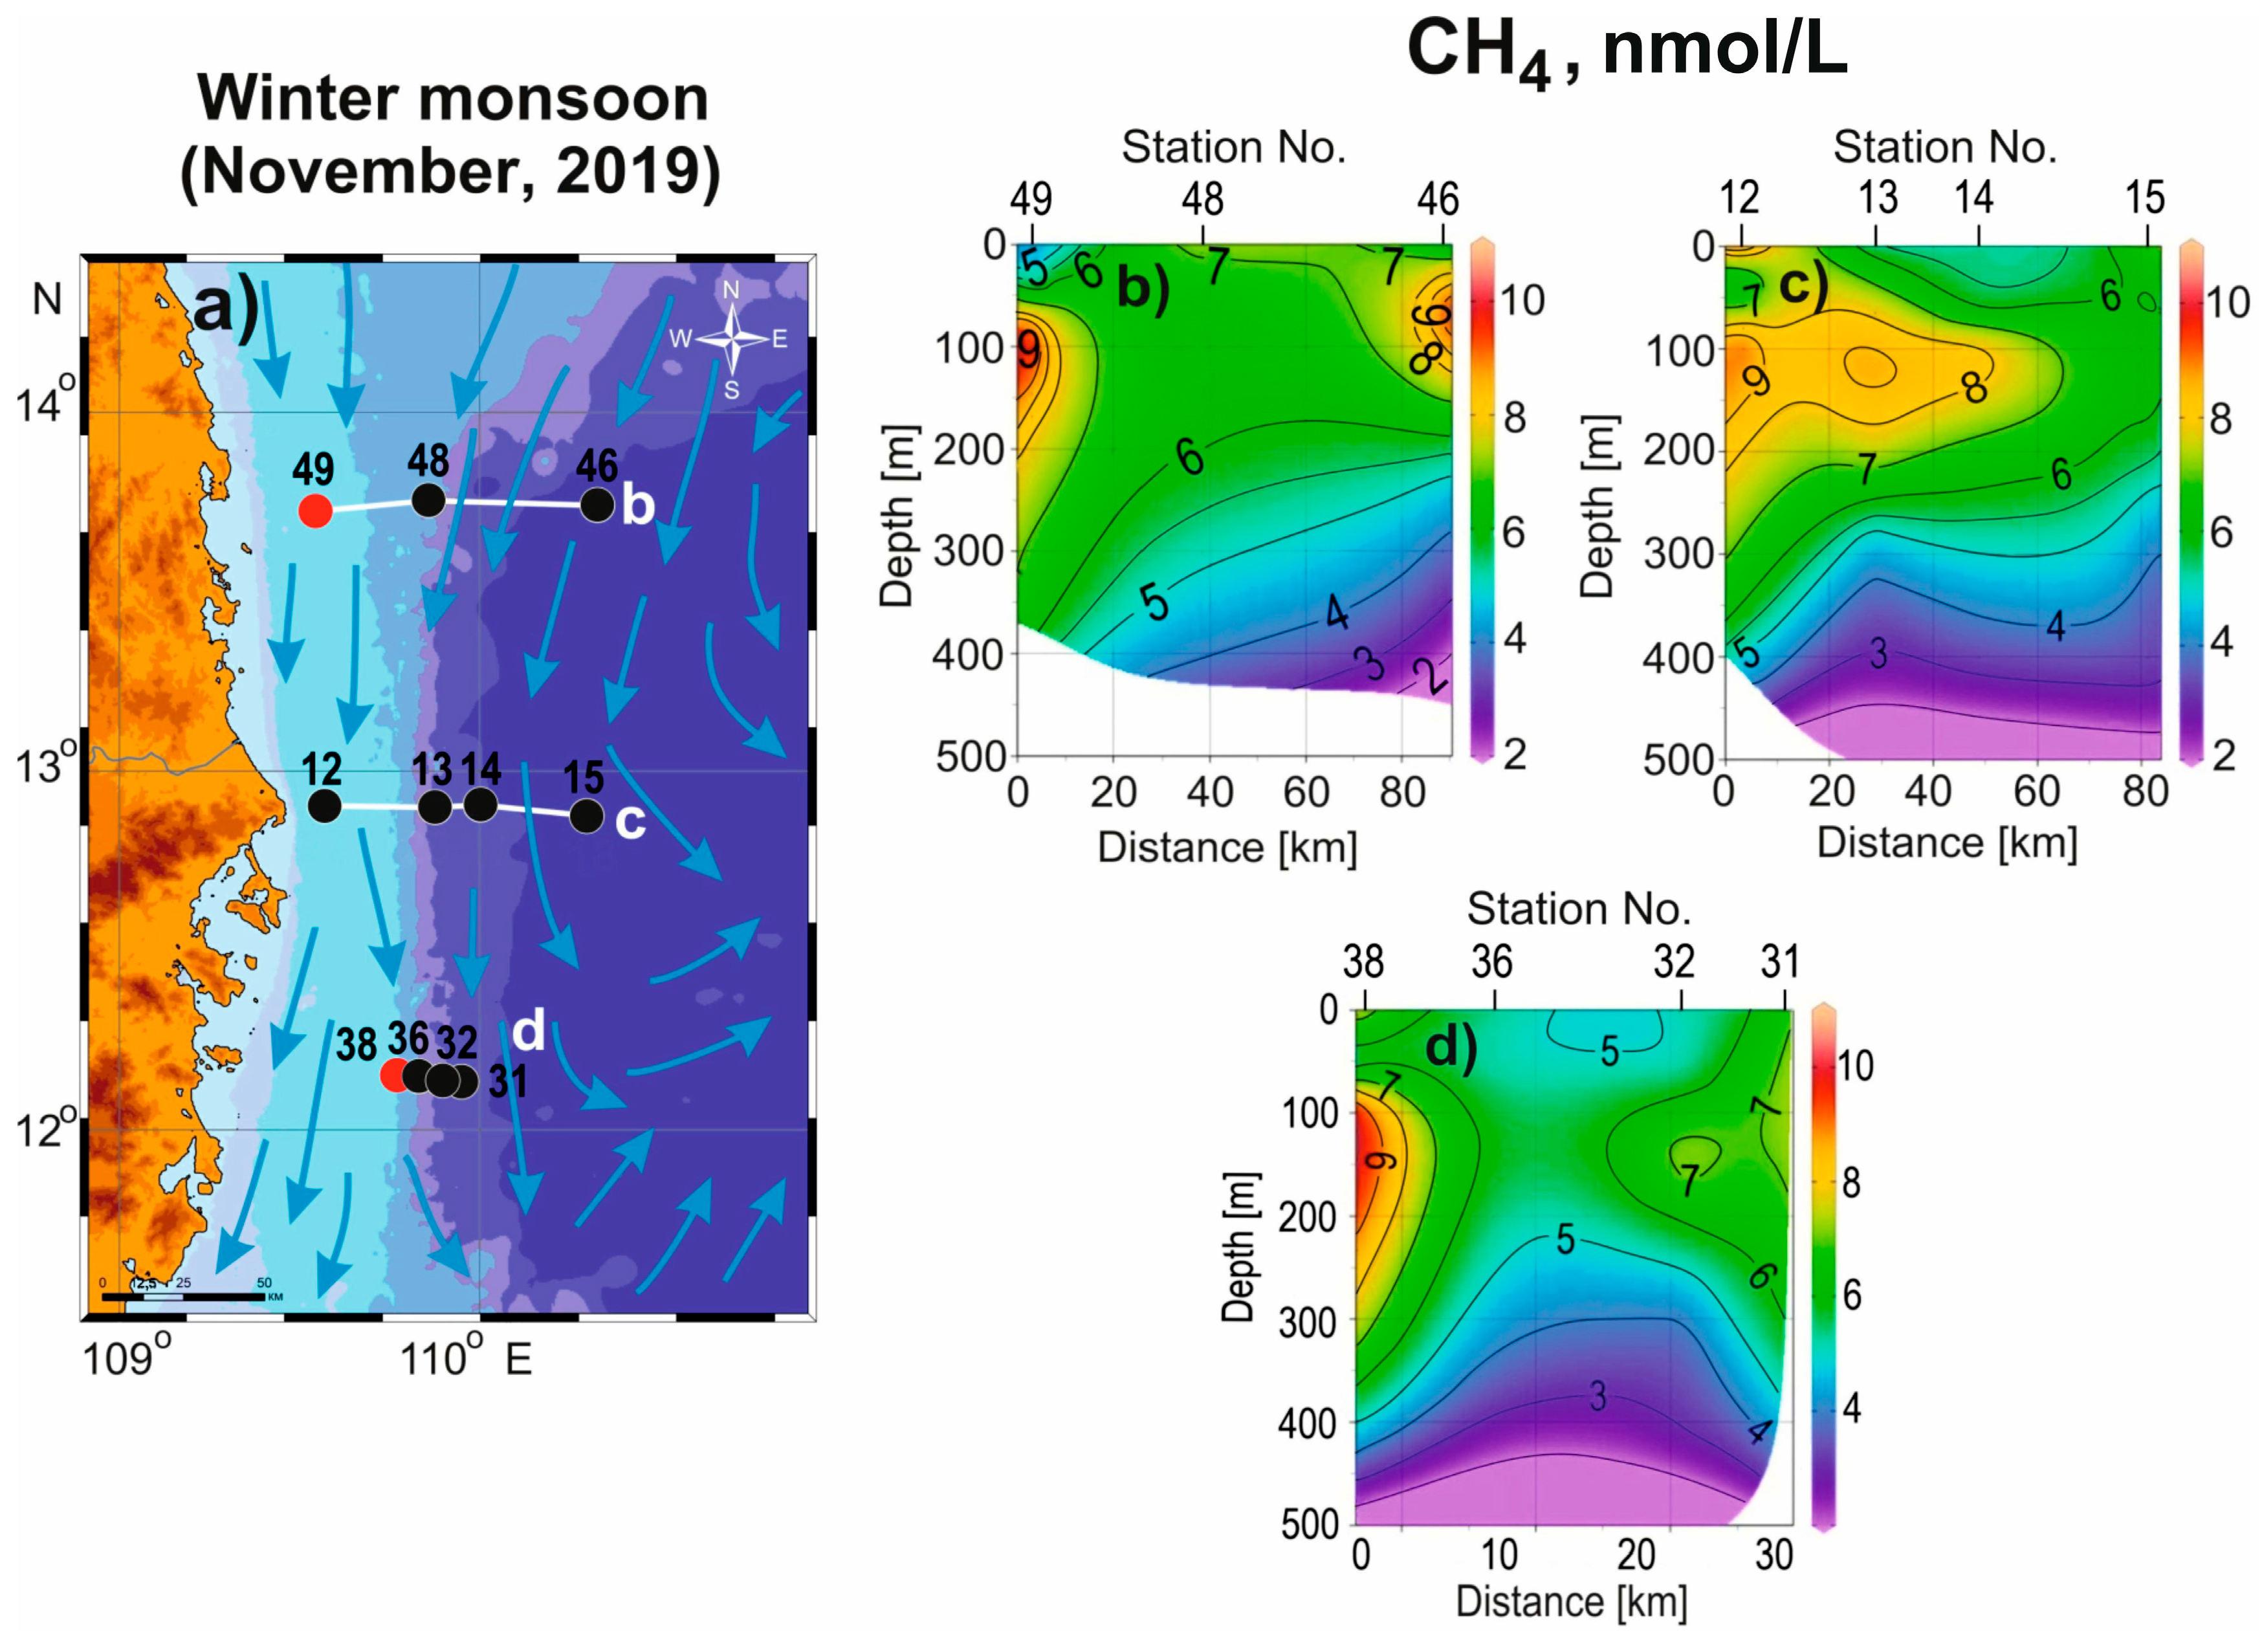
Sediments were sampled for four profiles (
Figure 4a), and CTD measurements and water samples were taken for three profiles. Combined sediment and water sampling was performed at two profiles (profile b, stations No. 46–49 and profile d, stations No. 31–38), while only water samples were collected at stations No. 12–15 (profile c). Of these, water samples were collected from the surface to the bottom only at two shelf stations (No. 38 and 49), which allowed for determining the presence of methane in the bottom water layer and its possible connection with the methane in sediments. The station locations and results of hydrocarbon gas sampling in bottom sediments are shown in
Figure 4.
Figure 4.
Results of methane sampling in bottom sediments of the Phu Khanh basin, South China Sea. (a) Position of the profiles (white lines) and sampling stations: black dots show sediment sampling stations, red dots show both water and sediment sampling stations. (b–e) Profile numbers and methane distribution in sediments: (b) High methane concentrations at station No. 48 (up to 850 nmol/dm3); (c) Anomalous high methane concentrations at station No. 27 (up to 1200 nmol/dm3); (d) Methane concentrations within wide limits from 150 nmol/dm3 (near shelf station No. 38) to 2000 nmol/dm3 (area of station No. 31 in the sediment layer ≈ 30–50 cm); (e) Anomalous high methane concentrations at station No. 23 (up to 2000 nmol/dm3).
Figure 4 shows the elevated and anomalous methane concentrations found for profiles b, c and e. The exception is profile d, within which a mosaic of local areas with different methane concentration fields is observed. One of these anomalous fields (up to 2000 nmol/dm
3) is located in the area of station No. 31 in the sediment layer ≈ 30–50 cm. The maximum methane concentrations found at profiles b, c and e are confined to the marginal part of the shelf or continental slope (stations No. 23, 27 and 48), which is formed by the WFSCS. This indicates the existence here of sources of endogenous gas emanations confined to the aforementioned fault.
There is a slight increase in the maximum methane concentrations from north to south. For profile b, an extensive field of elevated methane concentration is detected in the sediments, from the surface to a depth of 350 cm. Within this field, there are two local maximums not exceeding 700–800 nmol/dm3 at the depths of ≈170 and ≈260 cm. There is a smaller one to the south on profile c, but there is an intense anomaly recorded from the surface to a depth of ≈115 cm with a maximum methane concentration of up to 1200 nmol/dm3. An even more intense anomaly was detected in the southernmost profile, profile e. This anomaly with a maximum methane concentration reaching 2000 nmol/dm3 occupies a large area of the cross-section from the surface to a depth of 200 cm.
This increase in gas concentration in sediments can be explained by an increase in the endogenous generation of natural gases, in particular, methane, in this direction. Indeed, the cross-section e is located in the immediate vicinity of the intersection of the WFSCS and the Tuy Hoa shear zone (see
Figure 1b). It is known that the intersection of tectonic faults creates areas of increased crushing and the permeability of the geological environment. This, in turn, creates favorable conditions for enhanced gas–fluid migration. The cross-section under discussion is located near such tectonic conditions, so the appearance of the maximum gas anomaly here, including the deep gases helium and hydrogen [
35], can also be explained by this factor. Sediments in the Phu Khanh basin are characterized by increased helium and hydrogen concentrations along the entire length of the core from the surface to the bottom [
35]. The results of isotope analyses in the Phu Khanh basin showed that the values of the stable carbon isotope lie in the range of 27.7–66.6‰ for methane and 15.4–25.9‰ for carbon dioxide. The presence of methane with a “light” isotopic composition indicates the additional role of microbial gas in the methane emission. This is due to the fact that in the presence of an intense upward gas emission, favorable conditions are created for the development of microbiological processes. The isotopic ratio of
13C/
12C in thermogenic methane can be caused by the addition of a significant proportion of microbiological gas from the upper horizons of sediments.
The processing of the expedition data also revealed a different ratio of methane to propane and ethane in sediments in the north and south of the Phu Khanh basin (
Figure 5). This may indicate the existence of at least two deep sources of hydrocarbon gas emissions here. A paper [
36] has also presented this assumption.
Figure 4 clearly shows elevated methane concentrations and anomalies extend to the surface of bottom sediments. This means that the gas emissions should reach the water column and, dissolving in it, migrate further in accordance with the marine hydrodynamic conditions.
As mentioned above, the CTD measurements and water samples were taken at the bottom of only two stations (No. 38 and 49; given in
Figure 4a), and sediment samples were here as well. Unfortunately, these stations are the only ones at which it is possible to compare the methane concentrations for the water at the bottom and the sediments.
Figure 6 shows the results of the methane sampling in the water. The methane sampling was performed both in the water and in the sediments (
Figure 4a and
Figure 6a) for profiles b and d (
Figure 4b and
Figure 6b and
Figure 4d and
Figure 6d, respectively), while sampling was performed only in the water for profile c (
Figure 6c).
Analyzing the dissolved methane distribution and compressing it with its content in sediments show that elevated concentrations of this gas are located in the upper water layer at all profiles (
Figure 6b–d) and have no obvious association with its abnormal concentrations in the sediment (see
Figure 4b–d). As shown above (see
Figure 4b), an extensive field of elevated methane concentration (≈750 nmol/dm
3) was found in the bottom sediments at station No. 48 (profile b). However, the water layer above this area contains no dissolved methane anomaly. Only the 50–200 m and 20–110 m surface water layers have local methane anomalies of up to 9–10 nmol/L at the neighboring stations, stations No. 49 and 46 (see
Figure 6b). As one can see, there is no direct association between the methane in the sediment and water, so it is difficult to draw a definite conclusion about the methane source in the water column at this site.
A very small area with an anomalous methane concentration (2000 nmol/dm
3) was found in sediments at station № 31 for profile d (see
Figure 4d), but in the water above this station, no increase in methane concentration was observed (see
Figure 6d). Some increase in concentration was observed at station No. 38. Here, in the water layer of 70–300 m, a local area with an increased methane concentration (up to nine nmol/L) was also detected. A field of increased methane concentration (eight to nine nmol/L) extending from the shelf (station No. 12) towards greater depths for station No. 14 (see
Figure 6c) in the water layer from 70 to ≈200 m was also detected for profile c. Elevated methane concentrations (1200 nmol/dm
3) were detected in sediments in a small area on profile c (see
Figure 4c). However, the location of elevated methane concentrations in the surface water layer excludes a direct connection of this gas with any endogenous source. Thus, elevated or high methane concentrations were detected in the bottom sediments at all stations in the Phu Khan Basin. Areas with an increased content of this gas have also been found in the water column, but they are concentrated in the surface water layer and have no clear association with the gas anomalies in the sediment.
Let us turn to the regional hydrometeorological situation to assess the possibility of methane transport to the Phu Khanh sedimentary basin area by water currents.
Figure 2 shows the general scheme of currents in the South China Sea for the winter.
Figure 6a illustrates the water mass migration that was formed under the influence of tropical cyclone (TC) Nakri [
14] in November 2019 in more detail. It should be noted that the water samples were collected on 14–19 November, i.e., immediately after the TC (typhoon).
Figure 7 shows its trajectory. Therefore, its influence on the restructuring of the structure of currents and the transfer of gases dissolved in water must be taken into account.
TC Nakri developed from a tropical depression that had been formed on 4 November 2019 in the southern part of the South China Sea. It transformed into a tropical storm while shifting to the east, in the area with the coordinates of 13.7° S and 115.8° W. Then, it reached the stage of a strong tropical storm (typhoon) with a pressure of 980 hPa in the center on 9 November 2019 due to increased winds (44 m/s). Coastal southeastern provinces of Vietnam were affected by the western periphery of this typhoon on 10 November 2019 [
38]. The waters carried by currents from the central and eastern part of the South China Sea, under the influence of the Nakri tropical cyclone, merged with the waters of the Vietnamese current at a latitude of 12° N within the Phu Khanh sedimentary basin (see
Figure 7).
Figure 7.
The schematic map of the trajectory of tropical cyclone (TC) Nakri in the South China Sea in November 2019 during the cruise 88 R/V “Akademik M.A. Lavrentyev” (LV88). The white bold line shows the trajectory [
39] of the TC; green triangle is the place of origin of the TC; green circles are the position of its center for each day from 5 November to 10 November 2019; red triangle is the outlet of the TC to the shore (11 November 2019); blue rectangle indicates boundaries of the water research area; small yellow arrows show the direction of water mass movement on 9 November 2019 according to satellite observation [
40]; yellow bold arrows indicate possible trajectories of methane transport into the Phu Khanh basin from other endogenous sources of the South China Sea by currents (methane is transferred from oil and gas accumulations and deposits off the coast of Kalimantan and Palawan Islands); red color is warmer seawater and blue color is colder seawater [
40]).
The extent of the typhoon’s impact on the reshaping of the hydrodynamic conditions in the South China Sea and the movement of hydrocarbon gases is dependent on the depth to which it penetrates the water column. Several studies have been conducted on this topic, which suggest that when a typhoon reaches its peak intensity, the effects of tropical cyclones can extend to significant depths. The work by Ramage C.S. [
41] claims that tropical cyclones involve the movement of water masses located at a depth greater than 50 m. According to this study, in the central region of a tropical cyclone, water rises to the surface and spreads outwards, undergoing cooling and mixing. Beyond a distance of 110 km from the cyclone’s center, the water sinks to depths of 80–100 m and below 60 m, and a compensatory current flows towards the center of the tropical cyclone. Another study [
42] focuses on calculating geostrophic currents at a depth of 250 m that remain after the impact of a tropical cyclone. These currents are cyclonic in nature and move at a speed of approximately 50 cm per second in the area at which the tropical cyclone reached its maximum intensity. And finally, the works of Pudov V.D. and Ivanov V.N. [
43,
44] show that in the area in which typhoons follow a loop-like trajectory, a cyclonic eddy of synoptic scale forms, covering oceans to a depth of 1000 m. The flow velocity in the eddy reaches 50 cm/s at a depth of 100 m, 25 cm/s at a depth of 400 m and 16 cm/s at a depth of 800 m.
Based on these studies, we can conclude that the impact of Typhoon Nakri on the vertical and horizontal stratification of water and its movement could extend to great depths. However, as this is only indirect data, we limit our analysis to the assumption that Typhoon Nakri may have had an additional impact on methane transport in the region under study.
An analysis of the structure of the movement of water masses caused by this typhoon allowed us to construct two sources and ways for transporting dissolved gases into the Phu Khanh basin area. One source of migratory methane in the Phu Khanh basin could be the Ken Bau gas field in the Red River sedimentary basin.
Figure 3,
Figure 6 and
Figure 7 illustrate the direction of water mass flow from this area to the south, towards the Phu Khanh basin. Dissolved gases could be transported by this current. Another possible source of dissolved gases could be oil and gas deposits off the coast of the Kalimantan and Palawan Islands [
45,
46,
47]. Based on the extensive cyclonic movement of surface water created by typhoons and recorded by satellites [
40], we have constructed a possible trajectory for the transport of dissolved gases from the area of these islands to the Phu Khanh basin.
Thus, in our opinion, the water dissolved methane fields found in the Phu Khanh basin have a mixed origin. Some of them have a local endogenous origin associated with the system of the Western Fault and the Tuy Hoa shear zone; others were transported here from other areas of the South China Sea. Typhoon Nakri played an additional role, creating favorable conditions for the transfer of methane and other gases into the Phu Khanh basin.
8. Conclusions
The performed geological, gas geochemical and hydro meteorological studies led to the following main conclusions:
It is shown that the system of tectonic faults that formed the sedimentary basins of the Red River and Phu Khan creates the necessary conditions for the formation and migration of endogenous methane into bottom sediments and sea waters. According to Vietnamese scientists, the tectonic framework of both basins has a high probability of reactivation. Depending on the type of tectonic activity (renewed movements along discharges, shifts, thrusts, etc.), the number and intensity of sources of endogenous gases as well as their migration pathways to the upper layers of the Earth’s crust may vary. Due to the uncertainty of the timing and form of such reactivation, it is difficult to predict the oil and gas potential of the studied basins. However, in any case, these tectonic processes would affect the existing system for the formation and movement of natural gases, which should be taken into account.
An abnormally high methane concentration field detected in the 1980s has been confirmed and clarified in the Red River sedimentary basin. This indicates the existence of deep endogenic sources of hydrocarbon gases here with the long-term stable emission of methane and its homologues. The depth of the degassing sources is confirmed by the isotope analyses, which indicates a predominantly thermogenic gas genesis (with depths more than two km). All these factors may have contributed to the formation of the Ken Bau gas field.
It is shown that some part of the water-dissolved methane over the Ken Bau gas field can be transported to the south by the coastal Vietnamese current, adapted to the conditions of the winter northeast monsoon.
Elevated and high methane concentrations were detected in the bottom sediments at all stations in the Phu Khanh basin. This indicates the existence of endogenous sources of this gas here. They are spatially and, most likely, genetically related to the tectonic system of the Western Fault (109°30′–110°00′ E) and the Tuy Hoa shear zone. The different ratios of the amount of methane to propane and ethane in sediments in the northern and southern areas of this basin indicate the existence of at least two deep sources of hydrocarbon gas emissions here.
The quantitative characteristics of methane in the sediments of the Phu Khanh sedimentary basin are increasing from the north to the south. This can be explained by the increased permeability at the junction of the Western Fault system and the Tuy Hoa shear zone.
A direct relationship between high methane concentrations in the bottom sediments and the increased content of this gas in the water column of the Phu Khanh basin has not been found. In this regard, the origin of water-dissolved methane in this area may be partly the product of local sources and partly other areas of the South China Sea via currents.
The possible additional impact of Typhoon Nakri on the transportation of dissolved methane in the water column of the Phu Khanh basin has been studied. The typhoon may create favorable hydrodynamic conditions for the transport of dissolved gases from distant oil and gas deposits off the coasts of the Kalimantan and Palawan Islands to the Phu Khanh area.
This research is of particular relevance to and in accordance with the expected priorities of the WESTPAC Working Group on the Complex Study of Gas Hydrates and Methane Fluxes in the Indo-Pacific Region.


 ,
, 