Article

Mechanisms of Heavy Rainfall over the Southern Anhui Mountains: Assessment for Disaster Risk

1
Anhui Meteorological Observatory, Hefei 230031, China
2
Huaihe River Basin Meteorological Center, Hefei 230031, China
3
Land-Atmosphere Interaction and Its Climatic Effects Group, State Key Laboratory of Tibetan Plateau Earth System, Environment and Resources (TPESER), Institute of Tibetan Plateau Research, Chinese Academy of Sciences, Beijing 100101, China
4
College of Hydraulic & Environmental Engineering, China Three Gorges University, Yichang 443002, China
5
College of Earth and Planetary Sciences, University of Chinese Academy of Sciences, Beijing 100049, China
6
College of Atmospheric Science, Lanzhou University, Lanzhou 730000, China
7
National Observation and Research Station for Qomolongma Special Atmospheric Processes and Environmental Changes, Dingri 858200, China
8
China-Pakistan Joint Research Center on Earth Sciences, Chinese Academy of Sciences, Islamabad 45320, Pakistan
*
Author to whom correspondence should be addressed.
Water 2025, 17(19), 2906; https://doi.org/10.3390/w17192906 (registering DOI)
Submission received: 15 August 2025 / Revised: 24 September 2025 / Accepted: 7 October 2025 / Published: 8 October 2025
(This article belongs to the Special Issue Water-Related Disasters in Adaptation to Climate Change)

Abstract

Heavy rainfall events in the southern Anhui region are the main meteorological disasters, often leading to floods and secondary disasters. This article explores the mechanisms supporting extreme precipitation by studying the spatiotemporal characteristics of heavy rainfall events during 2022–2024 and their related atmospheric circulation patterns. Using high-resolution precipitation data, ERA5 and GDAS reanalysis datasets, and the Hybrid Single-Particle Lagrangian Integrated Trajectory (HYSPLIT) model analysis, the main sources and transport pathways of water that cause heavy rainfall in the region were determined. The results indicate that large-scale circulation systems, including the East Asian monsoon (EAM), the Western Pacific subtropical high (WPSH), the South Asian high (SAH), and the Tibetan Plateau monsoon (PM), play a decisive role in regulating water vapor flux and convergence in southern Anhui. Southeast Asia, the South China Sea, the western Pacific, and inland China are the main sources of water vapor, with multi-level and multi-channel transport. The uplift effect of mountainous terrain further enhances local precipitation. The Indian Ocean basin mode (IOBM) and zonal index are also closely related to the spatiotemporal changes in rainfall and disaster occurrence. The rainstorm disaster risk assessment based on principal component analysis, the information entropy weight method, and multiple regression shows that the power index model fitted by multiple linear regression is the best for the assessment of disaster-causing rainstorm events. The research results provide a scientific basis for enhancing early warning and disaster prevention capabilities in the context of climate change.

1. Introduction

Heavy rainfall is one of the most frequent and devastating weather hazards in China, often leading to severe flooding, urban waterlogging, and associated disasters [1]. The complex interplay of regional topography, atmospheric circulation, and climate variability underpins the occurrence, intensity, and distribution of such extreme precipitation events [2]. Anhui Province is located in eastern China, with frequent and intense rainfall, especially in its southern mountainous areas. These areas have complex terrain that significantly affects local weather patterns and poses significant risks to local communities and infrastructure [3,4]. Understanding the mechanisms driving these rainfall episodes is critical for improving forecasting accuracy and disaster risk management.
The atmospheric circulation systems play a crucial role in shaping heavy rainfall phenomena in China [5,6]. Key large-scale features such as the East Asian monsoon (EAM), the Western Pacific Subtropical High (WPSH), the South Asian High (SAH), and the Tibetan Plateau monsoon (PM) are intimately linked to regional precipitation variability [7,8,9,10,11]. For instance, the Tibetan Plateau Summer Monsoon (TPSM) and Tibetan Plateau Vortex (TPV) play a crucial role in the transfer and redistribution of water vapor on the Tibetan Plateau (TP) during summer, becoming increasingly active in summer and disappearing in winter [12]. When the plateau summer monsoon abnormally strengthens, significant changes occur in the atmospheric circulation in the Asian monsoon region, accompanied by abnormal precipitation in the EAM [13]. Similarly, the seasonal progression and strength of EASM dictate the onset and cessation of rainfall periods, while the position and intensity of WPSH determine the pathways of moisture inflow and convergence zones [14,15]. Latest advances in observational technology and climate reanalysis datasets have facilitated detailed investigations into the spatiotemporal patterns of heavy rainfall and their atmospheric drivers [16,17]. Notably, the integration of high-resolution reanalysis data, such as ERA5 and the Global Data Assimilation System (GDAS), with trajectory modeling tools like HYSPLIT enables in-depth analysis of water vapor sources and transport pathways during extreme precipitation events. For the study of channels and characteristics of water vapor transport, Jiang et al. [18] and Yang et al. [19] analyzed the water vapor transport characteristics during Jianghuai Meiyu and Huaibei rainy seasons and the differences based on the HYSPLIT model. The study of the July 2021 rainstorm event in Zhengzhou shows that the water transport in the South China Sea and the Western Pacific, which is regulated by regional circulation characteristics, plays an important role in the authenticity of the event [20].
Against the backdrop of climate change, the frequency and intensity of heavy rainfall in China, including Anhui, are expected to increase, further exacerbating disaster risks [21]. Some scholars have researched the risk of regional rainstorm disasters. Guo et al. [22] conducted physical model experiments and numerical simulations on the heavy precipitation conditions of regional disasters, and Wang et al. [4] used binary logistic regression to analyze the correlation between rainfall factors and geological hazards and determined the critical effective rainfall for different warning levels. The previous studies have shown that using the relevant factors of regional catastrophic rainfall events to build a conceptual model to assess the risk level of its related hazards has great application potential in future rainstorm forecasting and related disaster risk assessment [23,24].
The purpose of this study is to analyze the temporal and spatial distribution of rainstorm events in southern Anhui in recent years, explore its potential circulation mechanism and water vapor sources, and preliminarily assess the risk of rainstorm disasters, providing insights into the circulation mechanism of extreme rainfall events, which will have a certain impact on reducing disaster risks in the region and strengthening targeted prediction and early warning systems.

2. Materials and Methods

2.1. Study Area and Regional Heavy Rainfall Events

The research area is the Southern Anhui Mountains, Anhui Province, China, which is located in the hinterland of China, near 116°–120° east longitude and 29°–31° north latitude. The geographical location is shown in Figure 1. Referring to the research of some scholars, the warm season (May to September) in Anhui Province has frequent convective activities, and the rain belt in the Meiyu period in Anhui Province moves from south to north with time [25,26], while Ren et al. [27] also described the rainstorm falling area and frequency in the summer half year (April to September) in Anhui Province, providing reference for the location forecast of the rainstorm belt in the flood season in Anhui Province. Wannan Mountain District is located in the southernmost part of Anhui Province, so this article will select April to September 2022–2024 as the research period.
This paper refers to the comprehensive intensity assessment method of China’s regional precipitation process and the local standard Classification of Regional Rainstorm Process (DB34/T 4271-2022) [28], and the number of ground meteorological observation stations with the accumulated 24 h precipitation from 0800 Beijing Time (BJT) to 0800 BJT of the next day ≥ 50 mm is defined as a regional rainstorm day. In order to ensure the validity and integrity of the data, the threshold n value of the number of rainstorm daily stations is dynamically calculated according to 8% of the number of meteorological stations on that day [29], and finally 54 rainstorm days are screened out in the mountain area of southern Anhui from 2022 to 2024.
In order to study the relationship between the rainstorm event and the circulation in the mountainous area of southern Anhui Province and the disaster risks caused by it, the disaster information is divided into disaster and disaster-free (Table 1) according to whether there is a disaster affected population, affected area of crops, and economic losses on each rainstorm day, according to the statistics of the information center of Anhui Meteorological Bureau and other government agencies.

2.2. Data

The data used in this study consist of the following three types: The first type consists of hourly precipitation records collected from 459 meteorological stations in the Southern Anhui Mountains, covering the period from April to September during 2022–2024; The second type includes ERA5 reanalysis data provided hourly by the European Centre for Medium-Range Weather Forecasts (ECMWF) during 2022–2024. The ERA5 dataset used in this study has a horizontal resolution of 0.25° and includes six vertical levels, corresponding to the same temporal span as the precipitation dataset. ERA5 reanalysis data can be accessed at https://www.ecmwf.int/en/forecasts/dataset/ecmwf-reanalysis-v5 (accessed on 14 July 2025); The third type is NCEP reanalysis data processed by GDAS (ftp://arlftp.arlhq.noaa.gov/pub/archives/gdas1 (accessed on 14 July 2025). The GDAS data are interpolated from a variety of observational systems and instruments. Specifically, this study assimilated GDAS reanalysis data and interpolated them onto a conformal projection map. These data include wind direction, wind speed, air pressure, temperature, and specific humidity, with a spatial resolution of 1° × 1°, 17 vertical levels, and a temporal resolution of 6 h.

2.3. Hybrid Single-Particle Lagrangian Integrated Trajectory Model

2.3.1. Trajectory Tracing and Clustering Analysis

The HYSPLIT model is an air mass backward trajectory model based on the Lagrangian method developed by NOAA [30], which uses the GDAS data as input. HYSPLIT continues to be one of the most extensively used atmospheric transport and dispersion models in the atmospheric sciences community [31]. The principle of analyzing airflow trajectory by the HYSPLIT model involves assuming that the air parcel is drifting with the wind. According to the initial positions of air parcels, large amounts of trajectories can be obtained through the HYSPLIT model. As the exceptional number of trajectories is difficult to analyze intuitively, the clustering analysis is adopted [32]. The total spatial variance (TSV) is applied in trajectory clustering analysis. The trajectories that are near each other are merged and grouped into several clusters by analyzing the variations in the TSV of all clusters, where the final clustering result is achieved at the minimum TSV considering both the cluster number and the meanings of clustering.

2.3.2. Schemes of Water Vapor Trajectory Tracking and Clustering Analysis

The water vapor trajectory tracking scheme is as follows. First of all, the Mount Huangshan Guangmingding Meteorological Observation Station (118°9′ E, 30°8′ N, altitude 1839.7 m) is located on a high mountain, basically in the center of the mountainous area in southern Anhui, with more precipitation. We choose this station (the white triangle in Figure 1b) as the initial location of water vapor tracking. Next, considering that the atmospheric water vapor is mainly concentrated in the middle and lower levels of the troposphere [33] and that the source and channel of water vapor change with height during the rainstorm process, the isobaric levels of 850 hPa, 700 hPa, and 500 hPa are selected as the initial heights of water vapor tracking, and the tracking period is set to 3 days. Starting from 0800 Beijing time on each rainstorm day, the HYSPLIT model was used to simulate the reverse trajectory of air parcels in three days (72 h). The trajectory positions are output every 6 h to generate 162 trajectories in total (1 spatial initial point × 3 levels × 54 temporal initial points). After calculating the backward trajectory based on reanalysis data, cluster analysis was performed on trajectories at 850 hPa, 700 hPa, and 500 hPa, respectively.

2.4. Rainstorm Disaster Risk Assessment Method

  • Information entropy weighting method
Entropy weighting method is a statistical method that objectively determines the weights of indicators based on data differences, mainly used in multi indicator comprehensive evaluation systems [34]. It automatically assigns weights based on the degree of dispersion of indicator data, and the weighting process is transparent and reproducible. Information entropy represents the degree of orderliness of a system. The higher the degree of orderliness of a system, the greater the entropy value and the smaller the weight. Conversely, the higher the degree of orderliness, the greater the weight. The larger the difference between the values of an evaluation indicator, the greater its role in the comprehensive evaluation.
2.
Principal component analysis
Principal Component Analysis (PCA) is a typical unsupervised dimensionality reduction method that transforms the original multidimensional variables into a few uncorrelated “principal components” through linear transformation, which can preserve the variance information of the original data to the greatest extent possible [35]. The first principal component can be regarded as a weighted synthesis of various factors, commonly used to construct a comprehensive evaluation index.
3.
Multiple linear regression fitting power exponent
Multiple linear regression is a commonly used statistical modeling method that uses a set of independent variables to weight fit the dependent variable and determine the relative importance of each factor [36]. If the standardized values of each factor are used as independent variables, the regression coefficients can be regarded as the weights of each factor and can be used to construct a comprehensive index.
In order to reflect the nonlinear effects of various factors, a power-law weighted model can also be used, namely the following:
I = j = 1 n x j w j
Among them, xj is the j th normalization factor, and wj is its weight.

3. Results

3.1. Temporal and Spatial Distribution of Precipitation

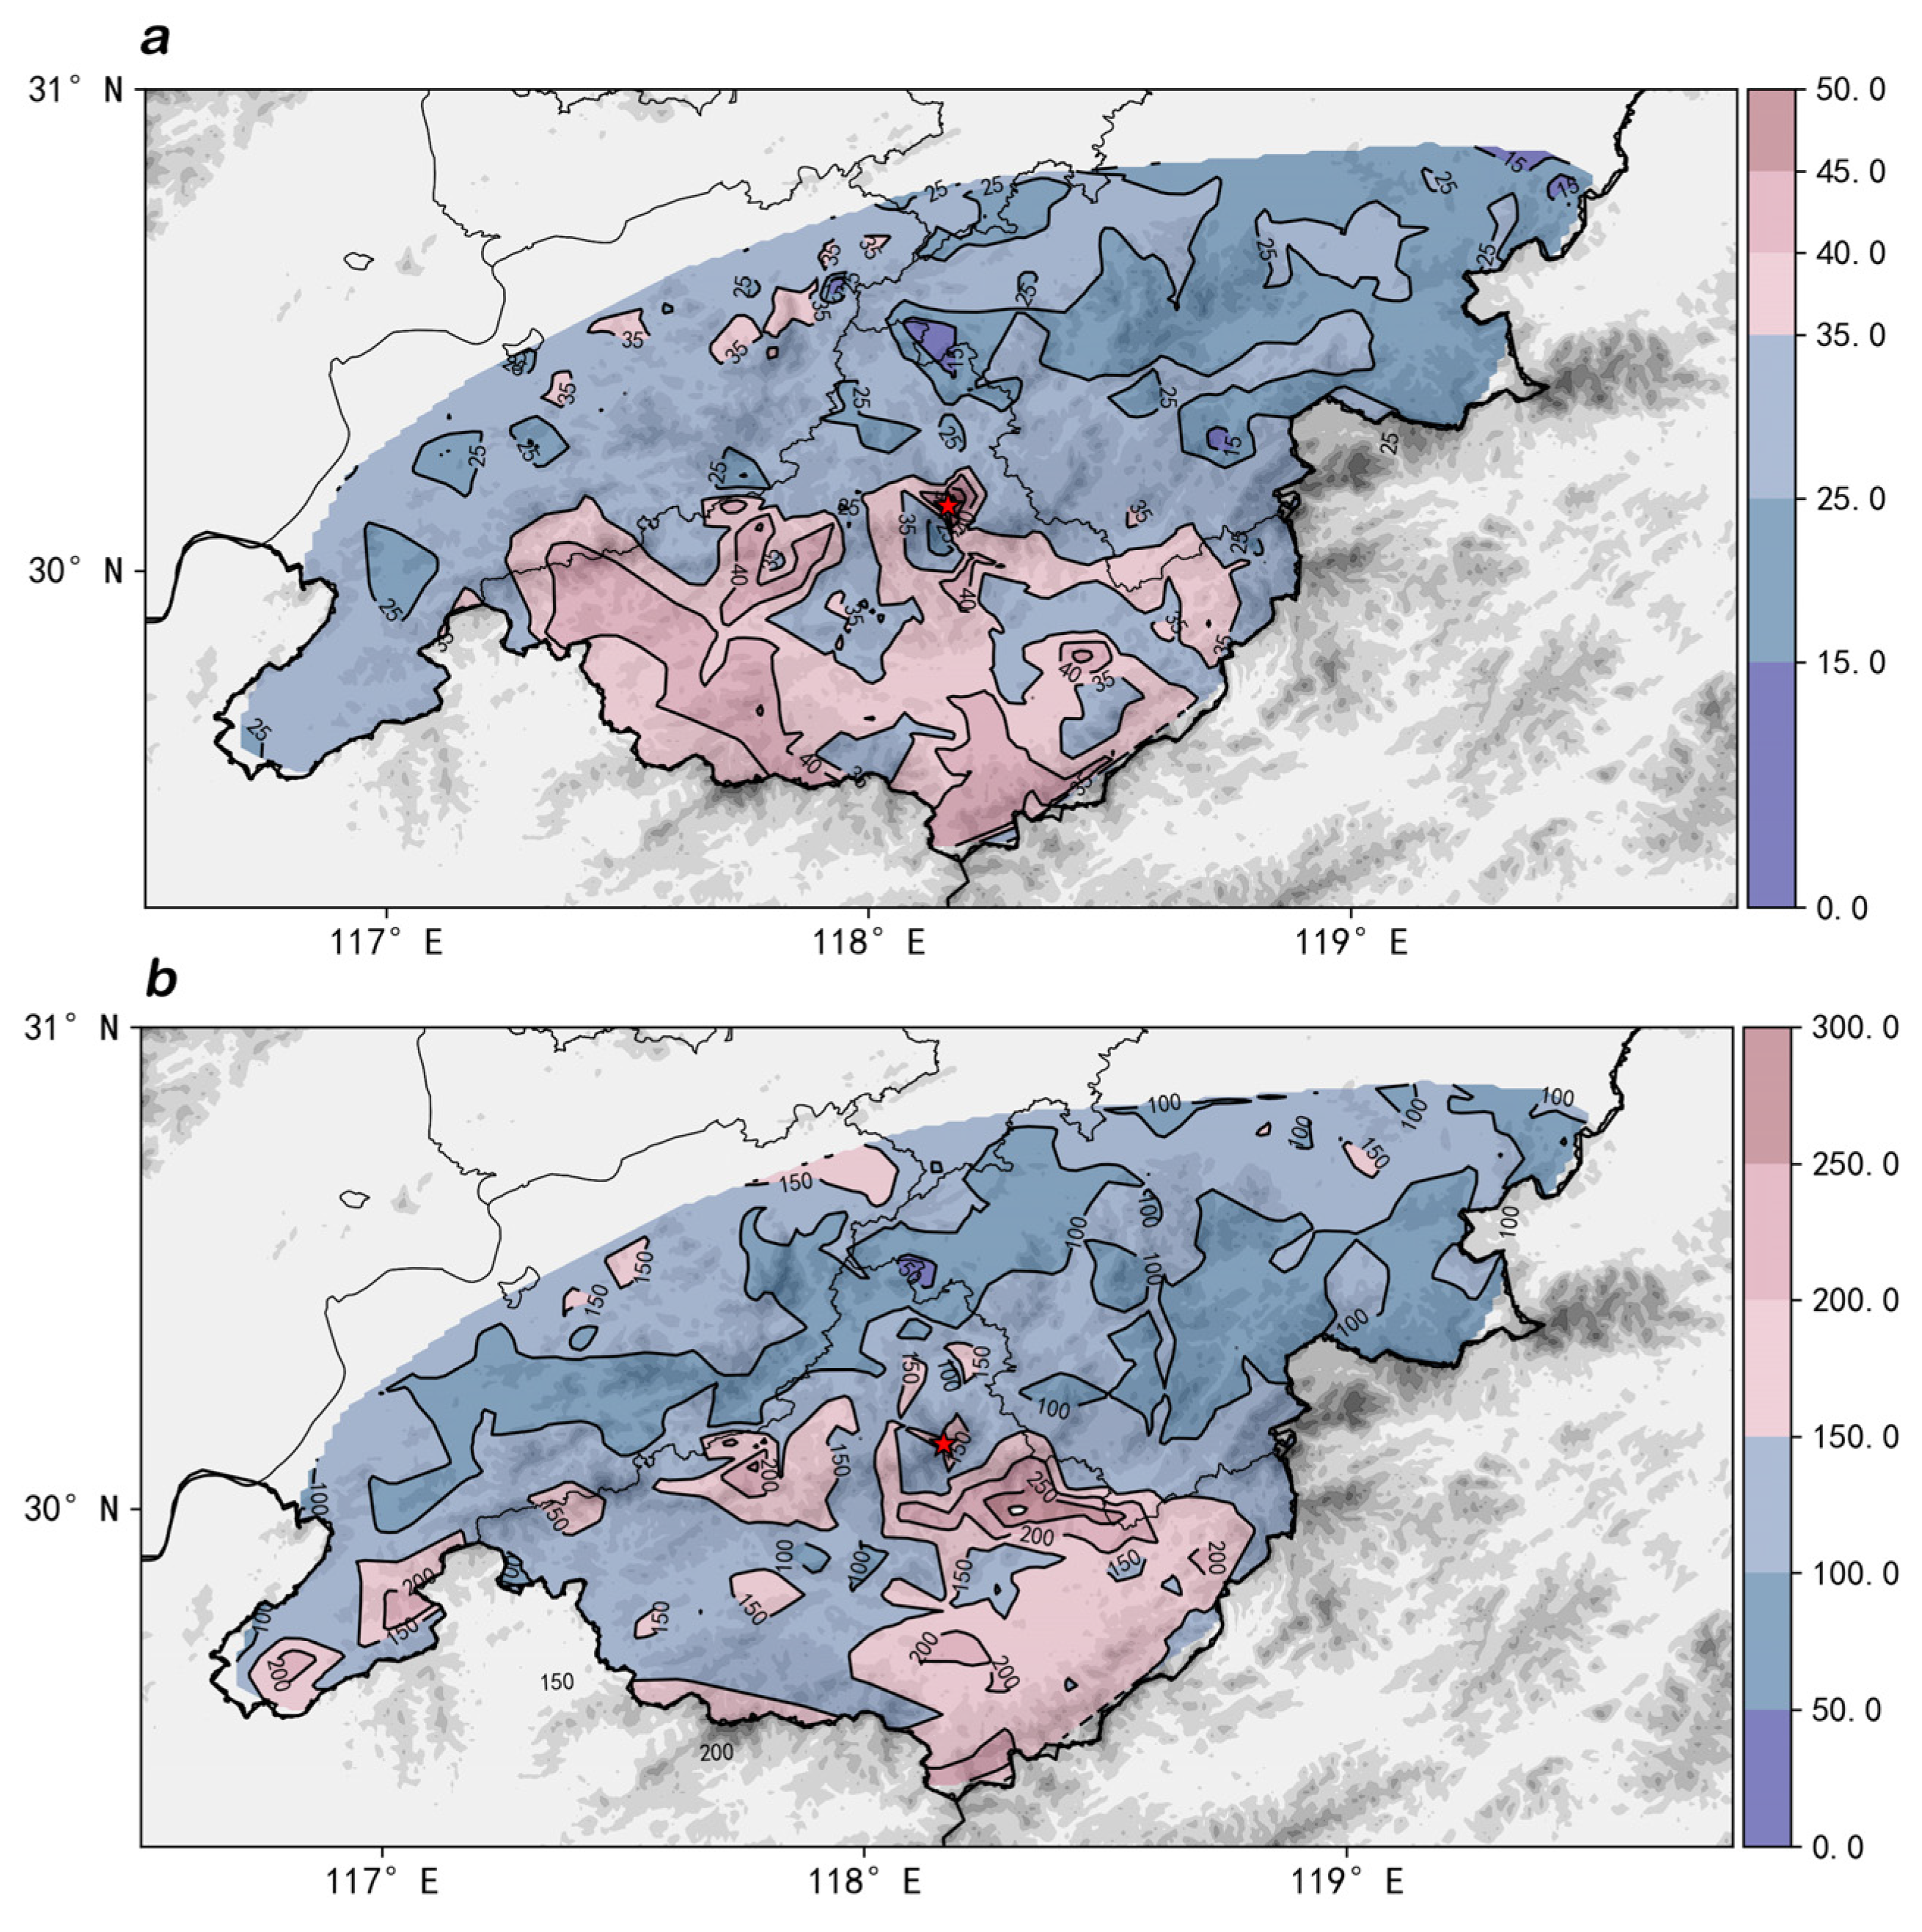
According to the daily precipitation of 459 meteorological stations in the southern mountainous area of Anhui Province from 2022 to 2024, the spatial distribution of the average precipitation and extreme precipitation of 54 rainstorm days is calculated. Figure 2a shows that the central and southern mountainous areas of Anhui Province are high-value areas for average precipitation, with dense contour lines and significantly higher local precipitation “core” than surrounding areas. The precipitation in the southern mountainous areas is generally higher than that in the north, while the precipitation in the north and east is relatively lower. The high average precipitation area corresponds well with the terrain elevation difference, indicating that mountainous terrain has a significant uplift effect on precipitation. The distribution of extreme precipitation (Figure 2b) is similar to the average precipitation, mainly concentrated in the high mountain areas of southern and central Anhui, with local extreme values being more prominent. The range of the extreme precipitation high-value area is slightly smaller than that of the average precipitation high-value area, but the spatial distribution is basically consistent, indicating that extreme rainstorm events are also significantly affected by terrain and water vapor transport. The extreme precipitation in the western and central regions is slightly higher than that in the eastern region, while the precipitation in the eastern region is relatively uniform but without extreme high values.

3.2. Transport Trajectories and Sources of Water Vapor

The HYSPLIT model was employed to conduct backward trajectory analyses of moisture transport associated with heavy rainfall events in the mountainous region of southern Anhui. The study period encompassed the concentrated precipitation season (April to September) from 2022 to 2024, during which 54 heavy rainfall events were selected for moisture tracking. The backward tracking period was set to three days, with 0000 UTC as the initial simulation time.
According to the cluster analysis results of HYSPLIT moisture trajectories at different pressure levels (500 hPa, 700 hPa, and 850 hPa), the major moisture transport pathways and their contributions were analyzed. The findings reveal that, at each atmospheric level, moisture trajectories exhibited a distinct multi-source transport pattern, with significant differences in moisture origins and transport routes across different layers.
By analyzing the variation in TSV during the clustering process for each layer and combining the spatial distribution of all moisture trajectories, the optimal number of clusters was determined to be three, four, and five for the 500 hPa, 700 hPa, and 850 hPa levels, respectively. Consequently, there are three, four, and five major moisture transport pathways at these respective levels.
At the 500 hPa level (Figure 3a), cluster analysis indicates that the main moisture sources are the Western Pacific, inland South China, and northwestern inland China. Among the three primary transport pathways, Pathway 1 transports moisture from Southeast Asia northeastward, accounting for 70% of the total trajectories and serving as the dominant route at this level. Pathway 2 primarily originates from Europe, traverses Central Asia, and then transports moisture to eastern China, comprising 17% of the trajectories. Pathway 3 conveys moisture from the Western Pacific along the eastern coast of China to the southern Anhui mountains, accounting for 13% of the total, making it the least among the three. Overall, Southeast Asia is the primary moisture source at 500 hPa, while northwestern inland China plays a key role in moisture replenishment for heavy rainfall events.
At the 700 hPa level (Figure 3b), four major pathways are identified. Pathway 1 originates in Fujian, travels north through Jiangxi, and reaches the southern Anhui mountains, representing 26% of the total paths. Pathway 2 transports moisture from the northwest, originating in Mongolia and moving southeastward to eastern China, accounting for 8%. Pathways 3 and 4 both originate from the southwest, transporting moisture from South China to eastern China in a northeasterly direction, comprising 32% and 34% of the total, respectively. This highlights the significant contribution of southwestward moisture at the mid-level. Thus, at 700 hPa, the South China Sea and the Western Pacific remain important moisture suppliers, while the northwestern inland region continues to contribute to mid-level moisture replenishment.
At the 850 hPa level (Figure 3c), moisture is mainly transported northward from the South China Sea and the Western Pacific. Among the five primary pathways, Pathway 1 originates in eastern China, constituting 26% of the total trajectories. Pathway 2 originates in eastern Vietnam, transporting moisture northward through South China, accounting for 36%. Pathway 4 originates from the South China Sea, accounting for 23%. Both paths are transported to the study area via the South China Sea and are the main low-level water vapor transport routes. Pathway 3 transports moisture from the western inland region to eastern China, accounting for 13%. Pathway 5, originating east of the Japanese Islands and entering inland China via the Yellow Sea, accounts for 2%. Thus, at 850 hPa, moisture sources are mainly concentrated in eastern China and the South China Sea, with more focused transport routes.
In summary, the cluster analysis results indicate that the moisture sources, in order of contribution, are Southeast Asia, the South China Sea, eastern China, northwestern inland China, and the Sea of Japan (Table 2). The low-level water mainly comes from Southeast Asia, the South China Sea, and eastern China, while the land in northwest China and the eastern side of the plateau make supplementary contributions to the high-level water supply. High-level moisture transport is governed by large-scale monsoonal circulation and upper-level jet streams, which facilitate long-distance transport and play a decisive role in rapid moisture replenishment during heavy rainfall events. The mid- and lower-levels simultaneously receive moisture from upper-level circulation and low-level monsoon flows, with multi-source moisture convergence from the South China Sea, Bay of Bengal, and the inland plateau, providing robust moisture support and diversified supply channels for heavy rainfall in southern Anhui.

3.3. Analysis of Circulation Situation

3.3.1. Weather Situation and Water Vapor Condition

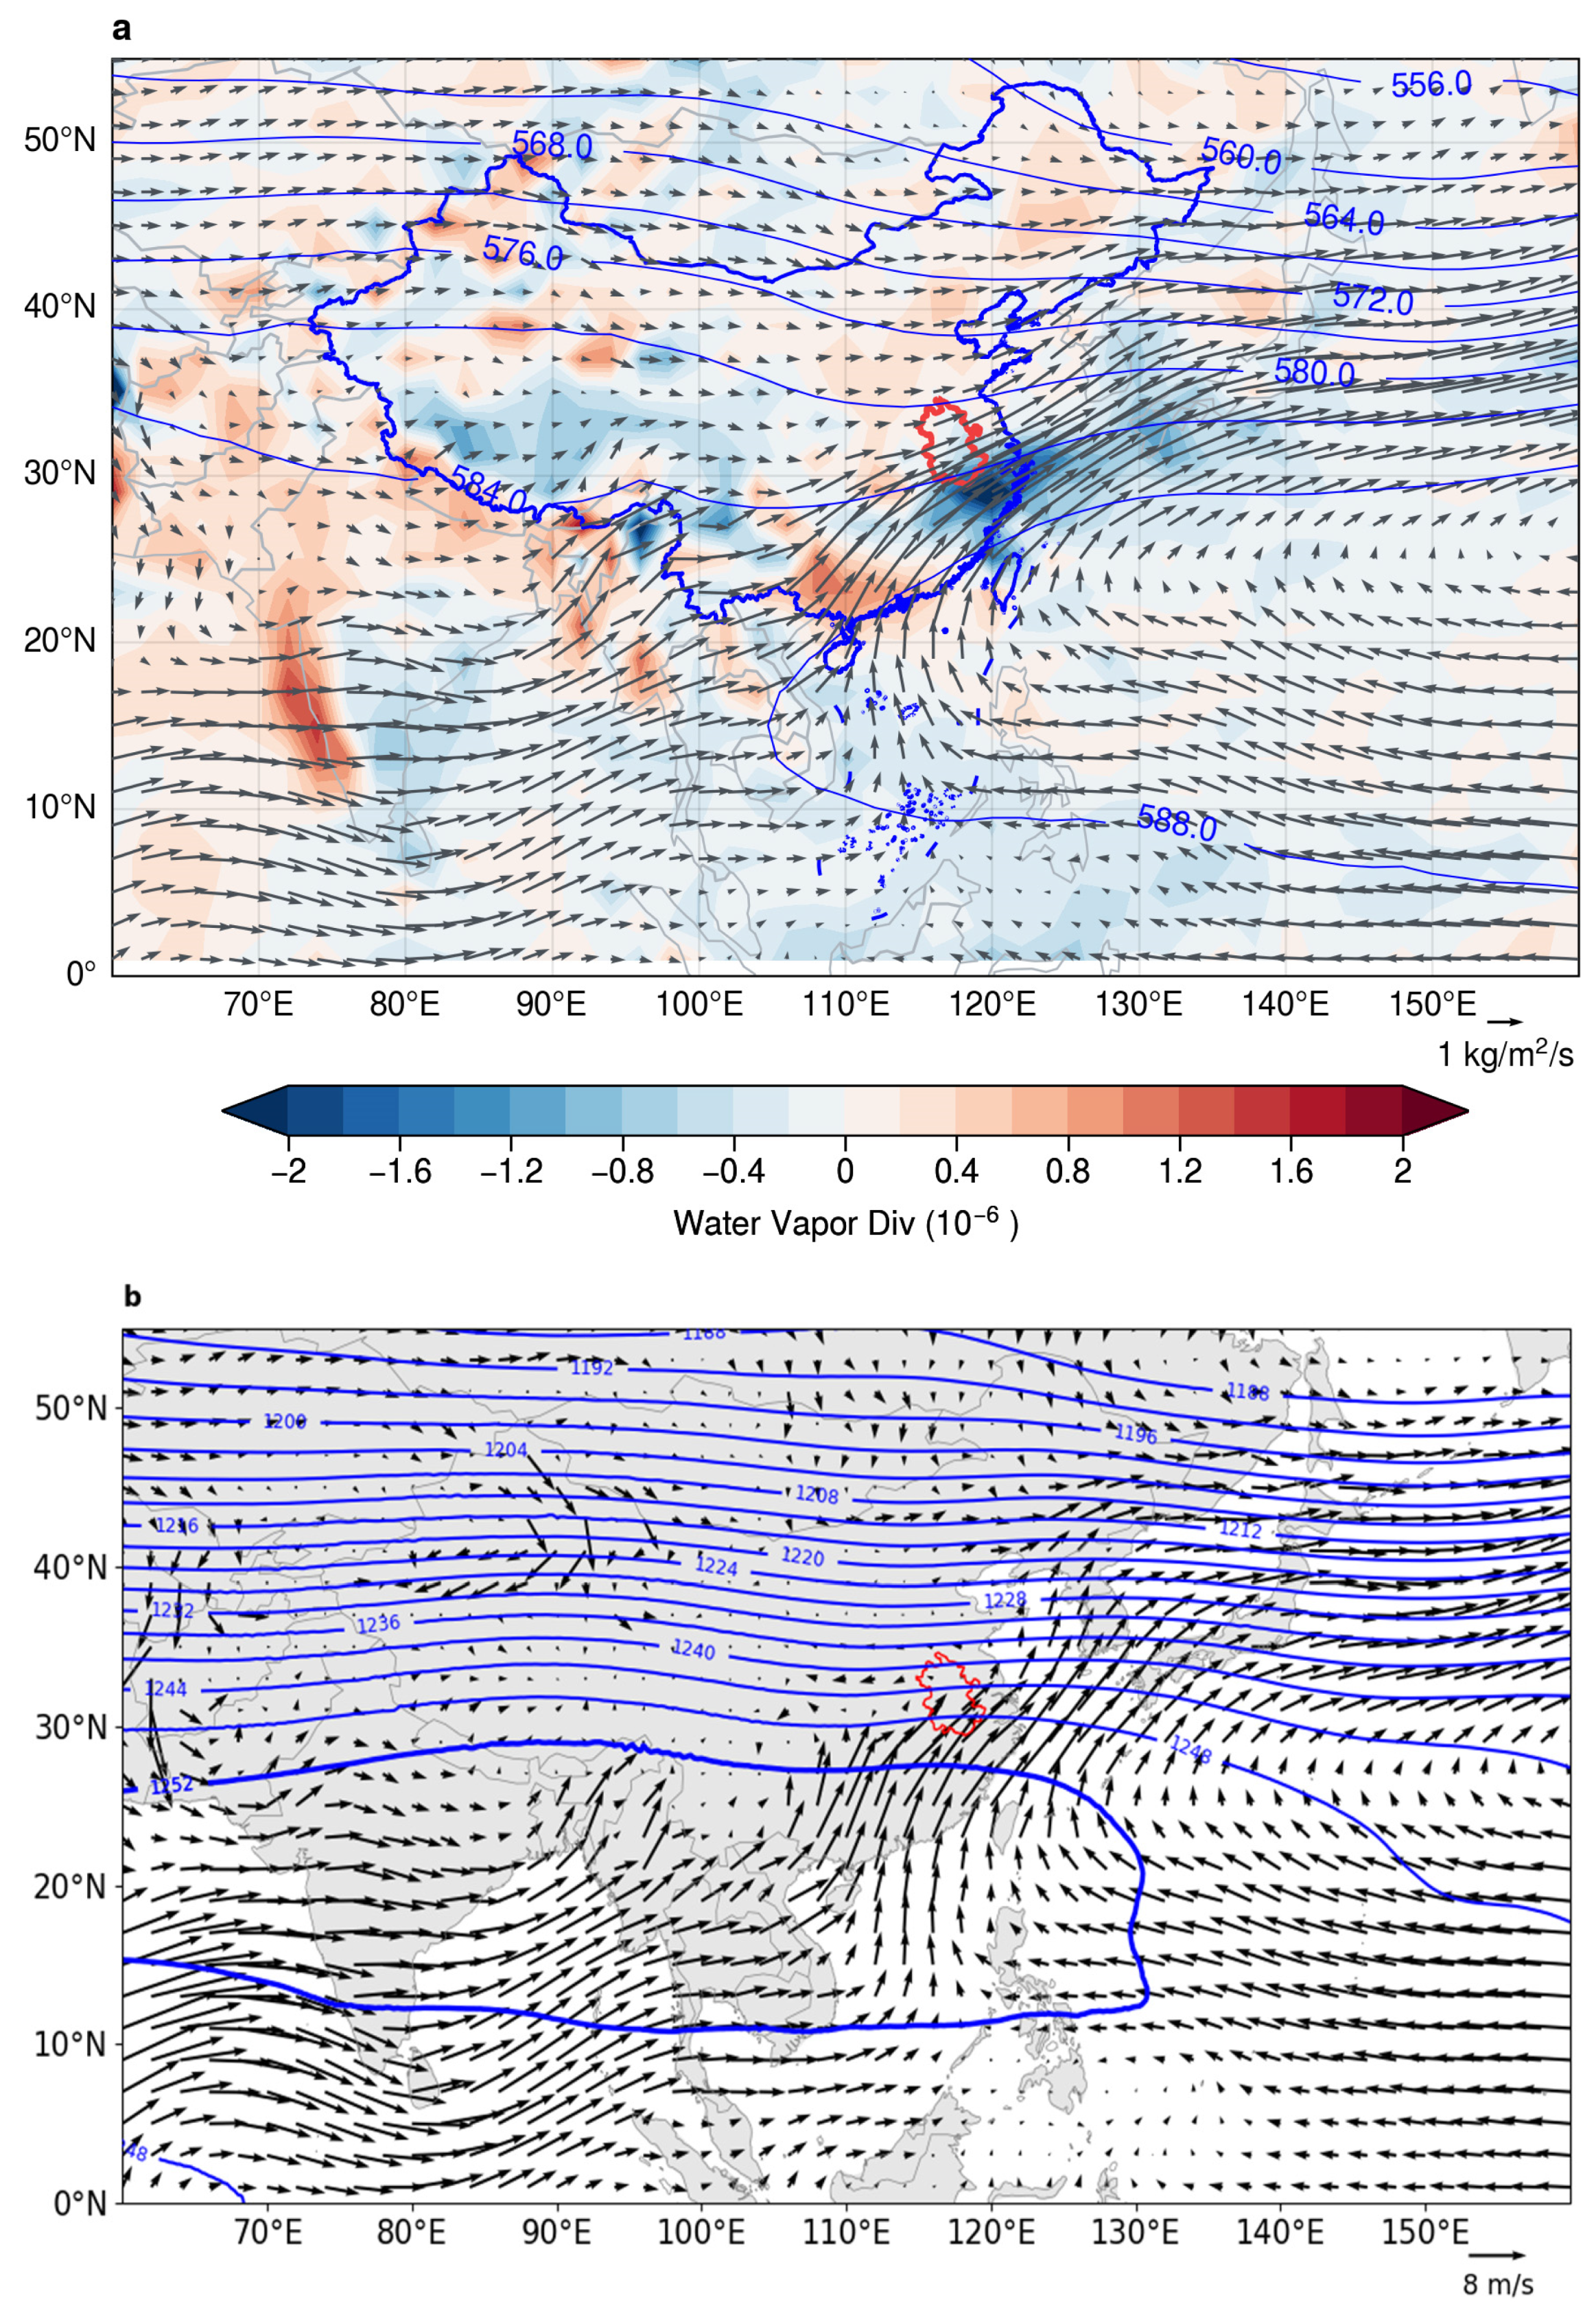
In the research area, there is a significant negative divergence, indicating that the convergence effect of water vapor is very pronounced (Figure 4a). This convergence leads to the accumulation of water vapor in the southern Anhui region, creating favorable conditions for heavy precipitation. The south or southeast winds along the western edge of the WPSH continue to transport warm, humid water vapor from the Western Pacific region to eastern China and the middle and lower reaches of the Yangtze River Basin. The average position of the subtropical high is generally shifted westward and northward, which enhances the stability of the water transport channels. In the mid- to high latitudes, the East Asian trough is located in North China, and the 584 dagpm contour line passes through the southern Anhui mountainous area. The research area lies in front of the trough, where the southwest airflow helps guide warm, humid air northward.
It can be seen from Figure 4b that the SAH extends eastward and northward in the rainstorm event, and its north side will form a strong upward movement, which is conducive to the uplift of low-level water vapor and the development of convection. The northern flank of the South Asia High is accompanied by a strong westerly jet stream (subtropical jet stream), and the divergence in the jet stream’s exit region promotes the occurrence of deep convection. The combination of high-altitude divergence and low-level convergence creates favorable conditions for vertical motion. Moreover, the presence of the South Asia High allows warm, humid air from its southern side to transport water vapor northward through the South Asian monsoon system, thereby providing abundant water vapor for heavy precipitation events. In the low-latitude regions near the Indian Ocean and the Bay of Bengal (10°–30° N), the 850 hPa wind field exhibits a strong southwest monsoon. The southwest flow transports warm, moist air from the Indian Ocean and the Bay of Bengal into the southern Anhui mountains, enriching the available water vapor for precipitation. Additionally, the southwest winds at lower levels, combined with orographic uplift, enhance the condensation of water vapor and precipitation, promoting the development of convection, which increases the intensity of local precipitation and the frequency of rainstorms.
In summary, the mountainous area of southern Anhui is located at the terminus of a major water vapor transport corridor and is influenced by both the South Asian monsoon and the WPSH. The South Asian monsoon transports water vapor from the Bay of Bengal and the South China Sea, while the south or southeast winds on the western side of the subtropical high transport additional water vapor from the Western Pacific. These two water vapor flows converge in the middle and lower reaches of the Yangtze River (including the mountainous areas in southern Anhui), resulting in negative water vapor flux divergence and water vapor convergence, which is conducive to the formation of rainstorms (Figure 4a). Additionally, the convergence of water vapor from the west is quite pronounced, and airflow in the northwestern low trough supplements the water vapor supply. The southern Anhui region is positioned in the zone controlled by southwest airflow in front of the East Asian trough, which also favors the northward movement of warm, moist air and low-level water vapor convergence. The orographic uplift effect enhances water vapor condensation and local precipitation intensity. The combination of warm, moist airflow and terrain uplift readily triggers convective precipitation, making rainstorm events more frequent and intense.

3.3.2. Relationship Between Circulation Indices and Rainstorm Events in the Southern Anhui Mountains

In order to better reflect the relationship between changes in the East Asian wind field and precipitation during the flood season in the mountainous areas of southern Anhui, the regional average deviation of 850 hPa meridional winds between the East Asian tropical monsoon trough (10°–20° N, 100°–150° E) and the East Asian subtropical zone (25°–35° N, 100°–150° E) was selected to define the EAM index [14]. The SAH and the WPSH are represented by intensity indices: The difference between the grid points with a geopotential high greater than 588 dagpm at 500 hPa and 588 dagpm within the range of 110°–180° E is accumulated, and the accumulated value is the WPSH index [37]. Accumulate the values of grid points with a potential height greater than 1252 dagpm on the 200 hPa isobaric surface within the range of 30°–120° E, and the difference between 1252 dagpm and the accumulated value is the SAH index [38]. The Tibetan Plateau Monsoon (PM) plays an important role in influencing weather and climate in the Tibetan Plateau’s surrounding regions, and then we select the PM index, which is defined as the deviation between the geopotential high anomaly values of four points (80° E, 32.5° N; 90° E, 25° N; 100° E, 32.5° N; 90° E, 40° N) at 600 hPa and one point (90° E, 32.5° N) in this study [39]. Rossby defined the average geostrophic westerly wind between the 35° N and 55° N latitude bands as the westerly wind index. In this study, we referred to Yan et al.’s research [40] to calculate the zonal index of key regions, which is defined as the geopotential height difference between 35° N and 55° N within the range of 110°–140° E at 500 hPa. And the IOBM is defined as the standardized SST anomaly averaged over the tropical Indian Ocean (20° S–20° N, 40°–120° E) [41].
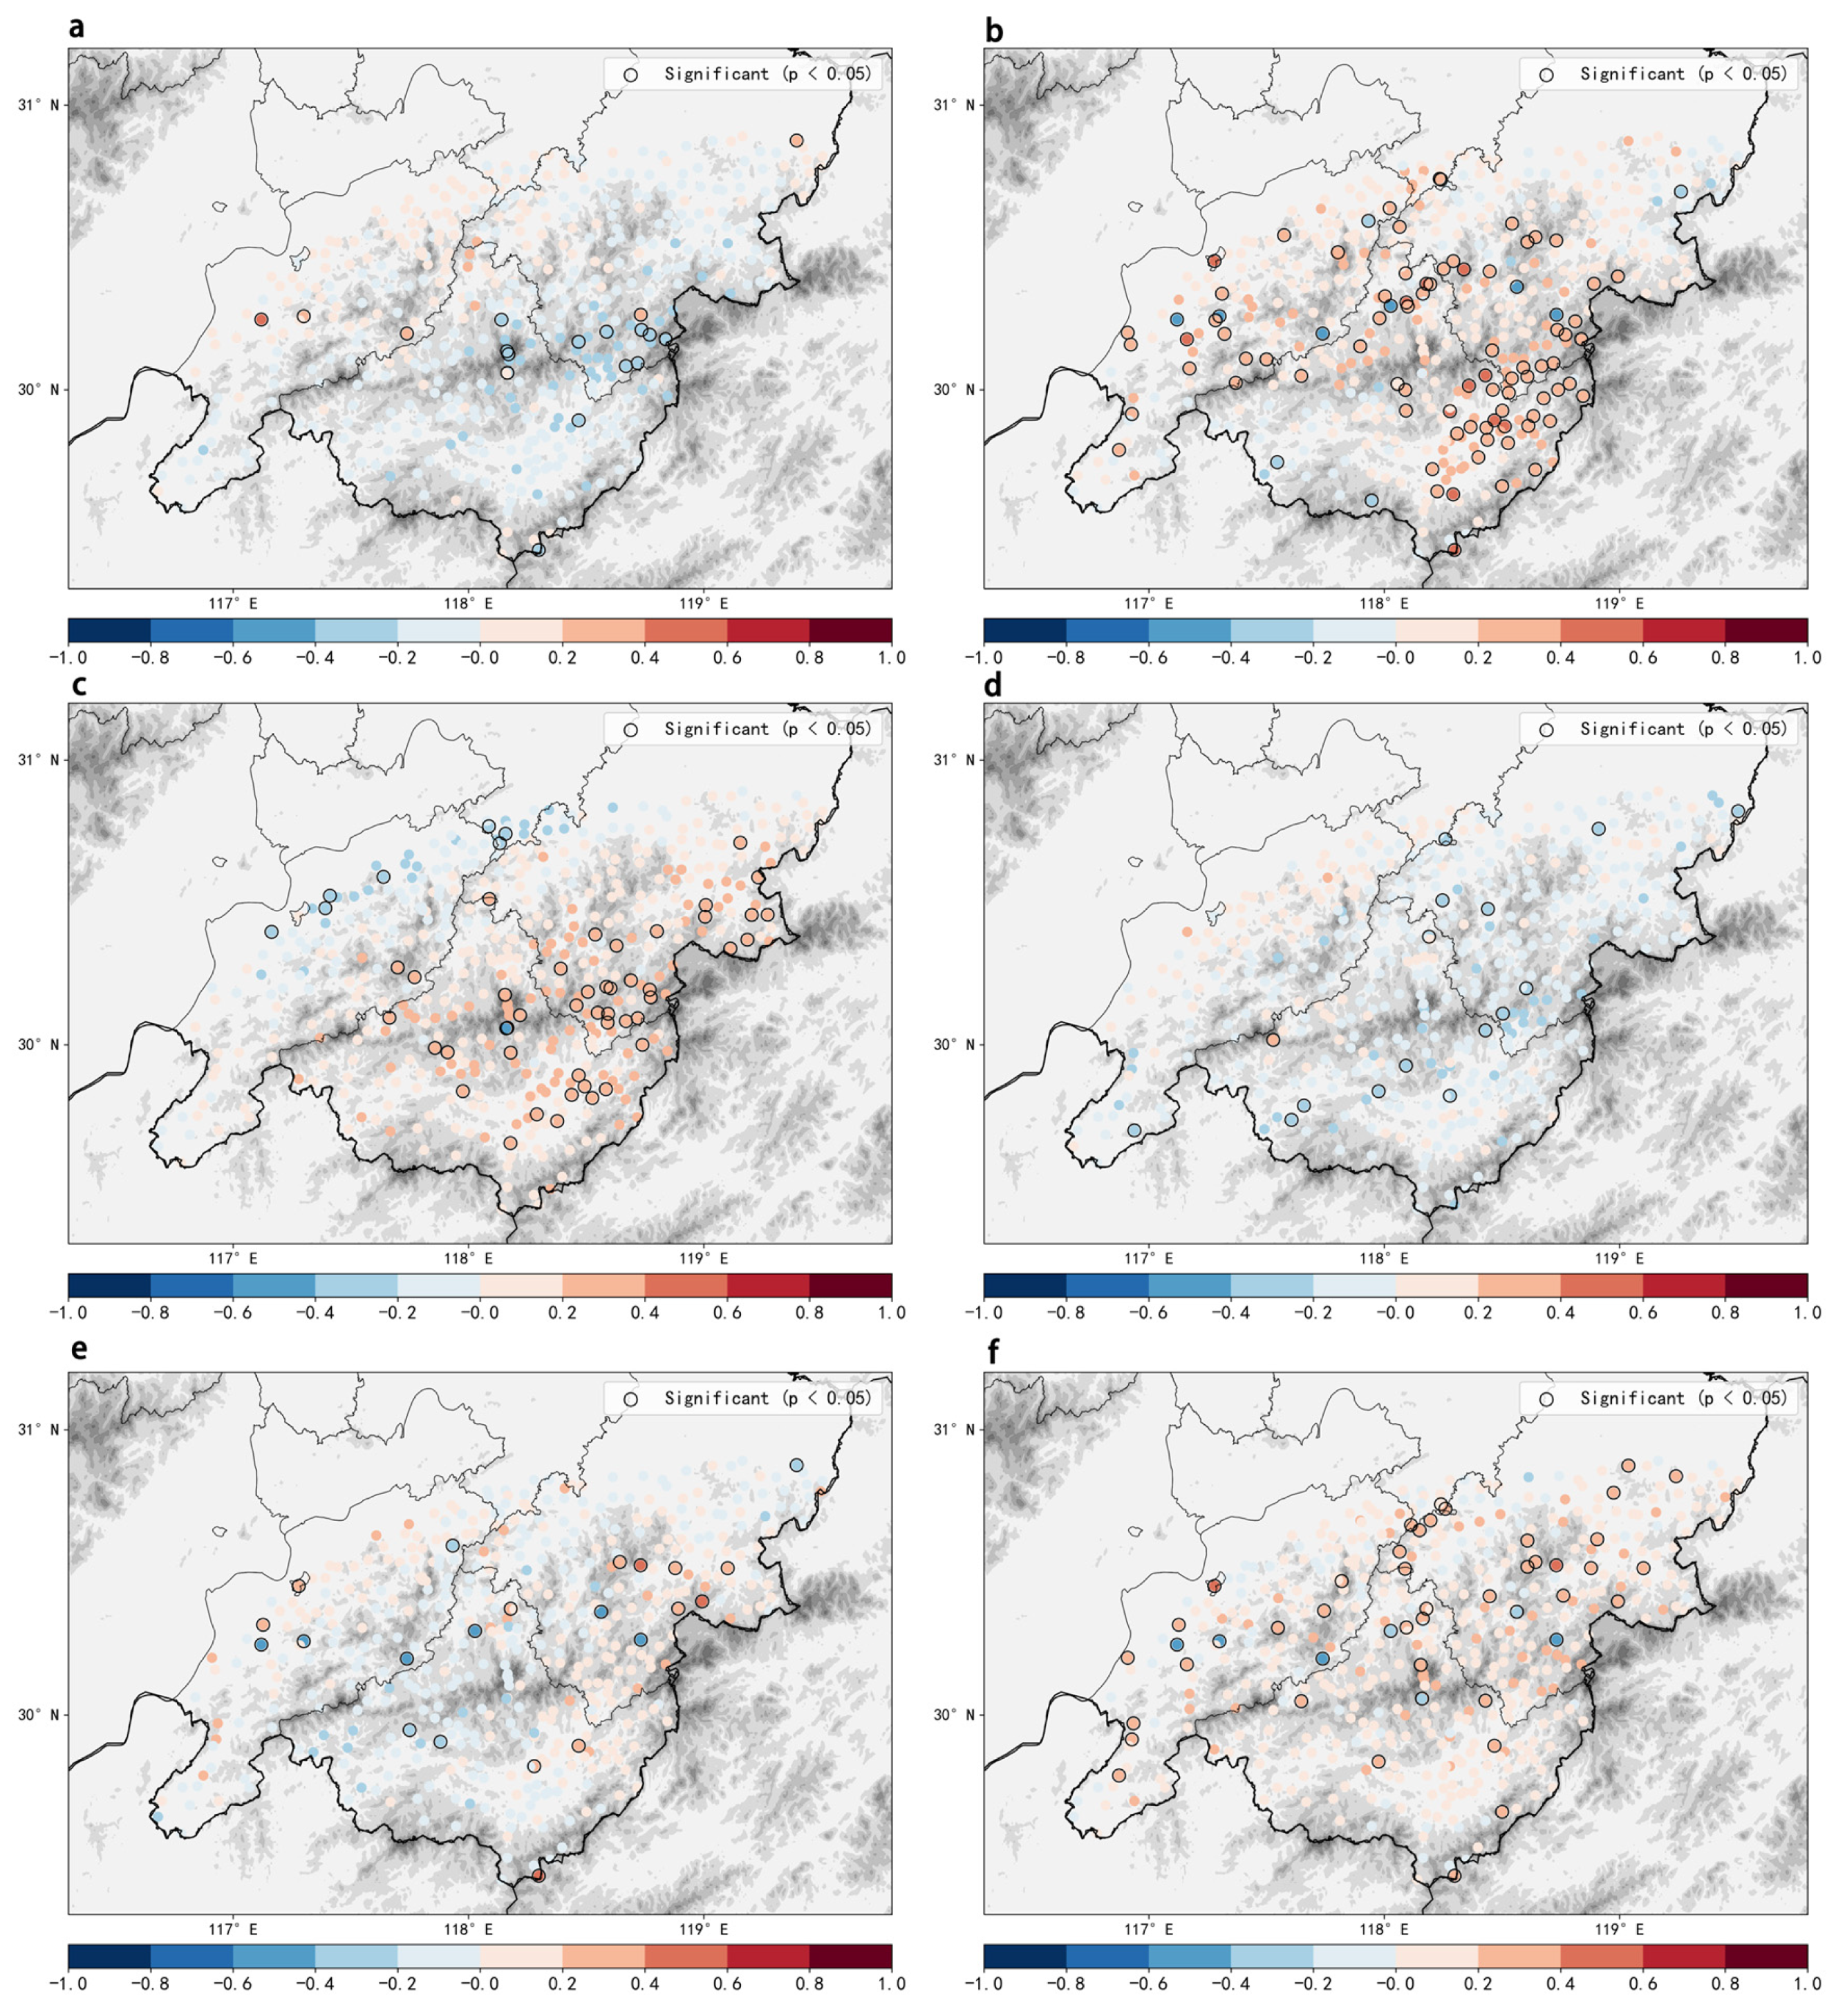
By analyzing the correlation between the circulation index and rainstorm event precipitation, it is found that there are many IOBM significantly related stations, mainly distributed in the southeast and west of the mountain area, with positive correlation as the main and negative correlation as individual stations (Figure 5b). This indicates that the IOBM positive phase has a certain promoting effect on the input of southeast airflow and precipitation and also promotes the transportation of southwest airflow affected by terrain. The westerly circulation has a significant impact on precipitation in the region, with significantly correlated stations mainly concentrated in the southeastern and northwestern mountainous areas of southern Anhui (Figure 5c). Overall, on the south side of the mountainous area, the positively correlated stations are more densely packed, indicating that the precipitation in this region has increased due to the influence of westerly circulation. This perhaps can be attributed to the interaction between the transport of humid air, enhanced precipitation caused by terrain uplift, and the promotion of strong convective activity. The distribution of SAH significantly correlated sites is relatively scattered (Figure 5f), mainly positively correlated, with a few northern sites showing negative correlation. When the SAH is active, it enhances the transport of water vapor in the southwest, which is conducive to heavy precipitation. The significant positive correlation sites of the WPSH index are only concentrated in the northwest and east of southern Anhui, with the east side being the most obvious (Figure 5e). It shows that the enhancement of the subtropical high brings warm and humid airflow in the southeast, which is conducive to the eastern rainstorm. The EAM index significantly correlated sites are mainly distributed in the central and northern parts of southern Anhui, with weak overall correlation; The south side is weakly negatively correlated, while the north side is mainly weakly positively correlated (Figure 5a). There are also few sites significantly correlated with the PM index, mostly negatively correlated, and weakly positively correlated in the northwest (Figure 5d). It shows that the intensity of the South Asia High and the plateau monsoon have limited direct impact on the rainstorm events in the mountainous areas of southern Anhui and only benefit the local rainstorm in the northwest of the mountainous areas.
Overall, the spatial distribution of correlation reflects the “push-pull” effect of the main rain belt position swing caused by different circulation patterns and regional precipitation, where some areas strengthen while others weaken, reflecting the complex interaction between circulation patterns, terrain, and local climate. IOBM, zonal index, and SAH index have many significant related stations, especially IOBM and zonal index. The positive correlation area is widely distributed, indicating that the Indian Ocean, the westerly circulation, and the South Asia High have an important modulation effect on rainstorms in the mountainous area of southern Anhui. It shows that when these circulation systems are strengthened, they are generally conducive to the occurrence of regional rainstorm events. The PM index, WPSH index, and other circulation indexes related to the plateau and subtropical high have a significant correlation with precipitation at some stations. The spatial distribution of EAM index correlation is scattered, and there are fewer significant related stations, indicating that the direct impact of EAM, subtropical high, and plateau monsoon on rainstorms in mountainous areas of southern Anhui is more local or limited.
According to the circulation index showing different time series change characteristics in the rainstorm process (Figure 6), we can conclude that the IOBM, zonal index, WPSH index, and SAH index have obvious upward trends, while the PM index and EAM index have weak downward trends, which indicates that the influence degree of different circulation situation fields has changed in the rainstorm events from 2022 to 2024. Combined with the spatial distribution and the trend chart of rainstorm events, the precipitation in the mountainous areas of southern Anhui has increased year by year due to the increased IOBM, zonal index, SAH index, and WPSH index indexes. Among them, the precipitation in the southeast and north is obviously affected, and the warm and humid air transport affected by IOBM, zonal index, WPSH index, and SAH index is enhanced, which is conducive to the occurrence of rainstorm events in the southeast and north of the mountain area.

3.4. Disaster Risk Assessment

In order to facilitate the study of regional rainstorm process intensity characteristics and disaster prevention and mitigation services, we propose an objective regional rainstorm process objective identification standard, namely the rainstorm daily comprehensive intensity index, considering the intensity and scope of rainfall. According to the hourly precipitation data of 217 rainstorm days collected by 459 meteorological stations in the mountainous area of southern Anhui Province in 2013–2024, six related factors (R50: average precipitation of all rainstorm stations (≥50 mm), S50: number of all rainstorm stations (≥50 mm), R100: average precipitation of all heavy rain stations (≥100 mm), S100: number of all heavy rain stations (≥100 mm), R3h: average precipitation of all heavy rain stations (≥50 mm/h), S3h: number of three hour heavy rain stations (≥50 mm/h)) are selected to calculate the daily comprehensive intensity of rainstorm through PCA, multiple linear regression fitting power index, and information entropy weight method, and the percentile (40%, 70%, 95%) of the intensity index is specified to divide the comprehensive intensity (Table 3).
Six disaster-causing factor values of 459 rainstorm stations that meet the standard of the single station rainstorm process are taken to form the original data matrix. Use the standardized data of the first six factors for PCA, extract the first principal component, and use it as the rainstorm assessment index. According to the information entropy weighting method, the entropy weights of the six disaster-causing factors are calculated as follows: a = 0.1112, b = 0.1298, c = 0.3812, d = 0.0757, e = 0.2529, and f = 0.0493. Weighted summation is used to construct the single station rainstorm process intensity index formula (Ir):
I r = a × R 50 + b × S 50 + c × R 100 + d × S 100 + e × R 3 h + f × S 3 h
According to multiple linear regression, the entropy weights of the six disaster-causing factors were calculated as a1 = 0.81, a2 = 0.721, a3 = 1.338, a4 = −1.02, a5 = −0.795, and a6 = 0.824, and a power-law weighted model (Mr) was constructed:
M r = R 50 2 a 1 × S 50 2 a 2 × R 100 a 3 × S 100 a 4 × R 3 h 2 a 5 × S 3 h a 6
According to the comprehensive intensity index of rainstorm days constructed by different methods, 54 rainstorm days are classified. It is found that the PCA method, multiple linear regression method, and information entropy weight method are consistent in identifying rainstorm days of different intensity levels, and the daily frequency of rainstorms decreases with the increase in intensity level. Among them, the weak rainstorm is the most frequent day, accounting for 40.1% of the total number; The occurrence frequency of moderate and strong rainstorm days accounted for 30.0% and 24.9%, respectively; The extra strong rainstorm days only occurred 11 times, accounting for 5.1% of the total times.
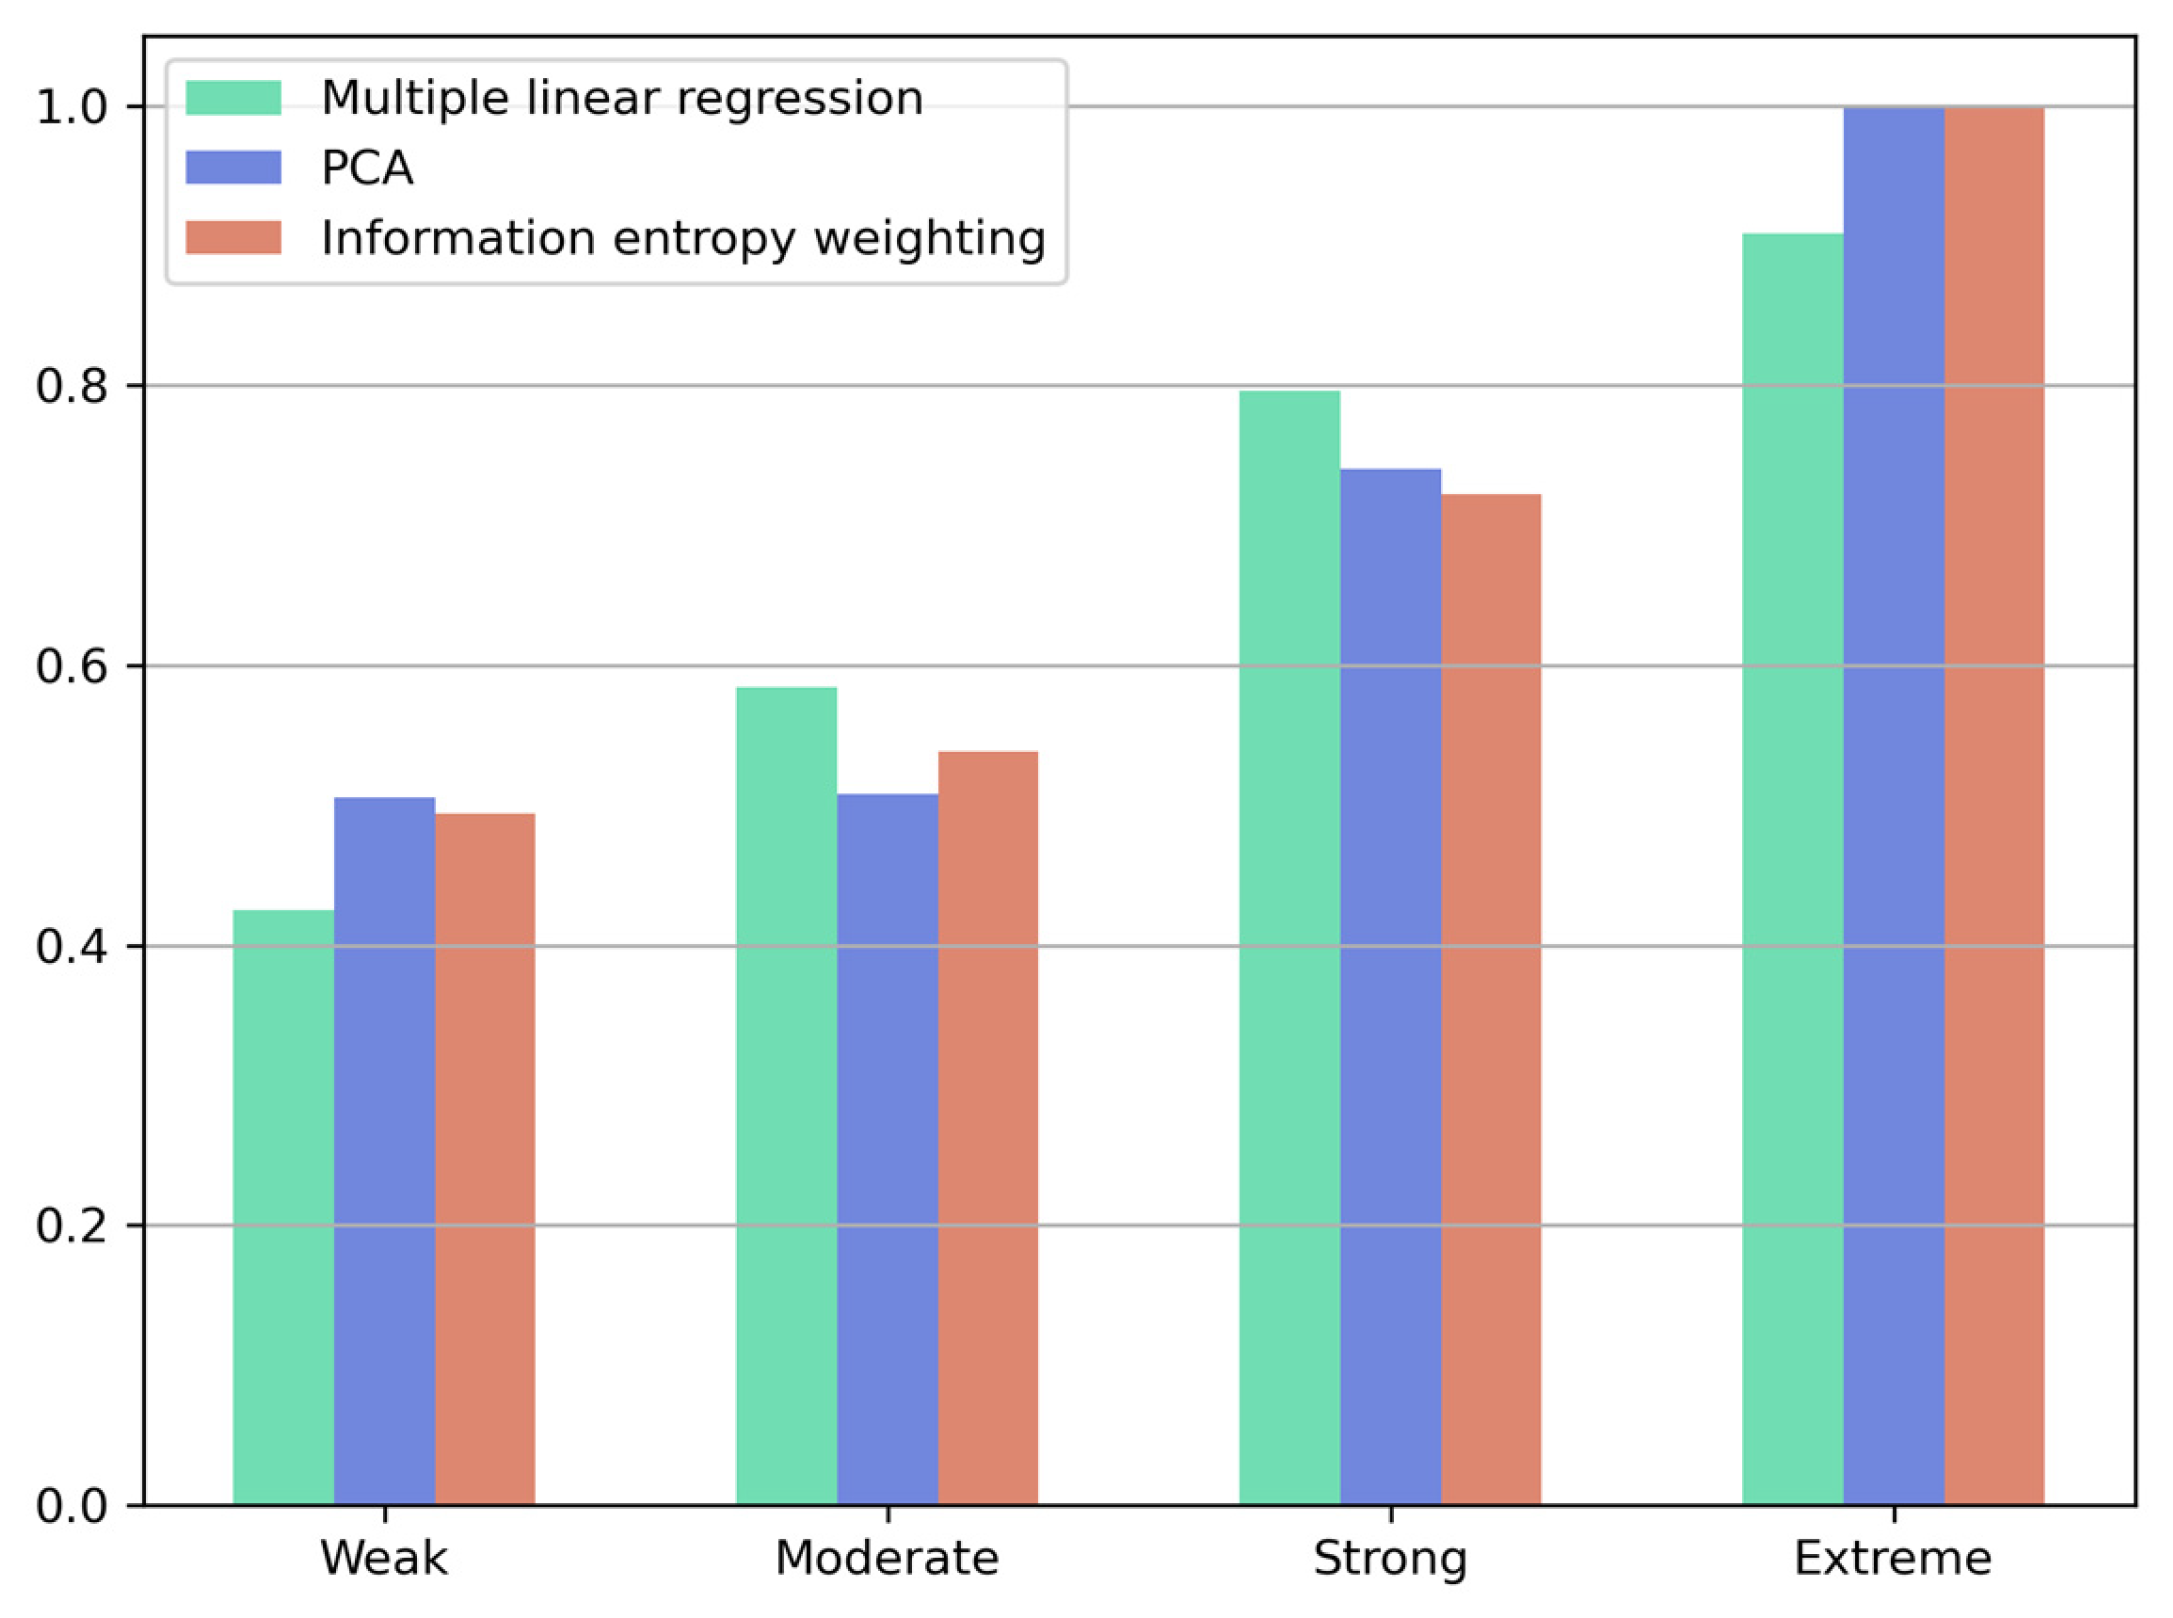
However, there are differences among the three methods in the identification of disaster-causing rainstorms. At moderate and above levels, the number of disaster-causing rainstorm days assessed by the multiple linear regression method accounted for a high proportion of 70.0% of the same level of rainstorm days, while the number of disaster-causing rainstorm days accounted for the lowest proportion of rainstorm days at the weak level, only 42.5% (Figure 7). It is possible to use the comprehensive intensity index classification of rainstorm days to estimate the disaster-causing nature of rainstorms and more effectively judge the disaster risk of rainstorms. Compared with the polynomial fitting method, the PCA method and the information entropy weight method only perform slightly better in identifying the days of extremely strong disaster-causing rainstorms, which means that the method is more capable of grading at the extreme level.

4. Discussion

This study reveals that extreme rainfall events in the mountainous areas of southern Anhui are closely related to multi-scale circulation characteristics. WPSH plays a leading role in regulating the occurrence and intensity of heavy rainfall. Specifically, the westward extension and northward displacement of WPSH create favorable conditions for warm and humid air to invade the region, becoming a “circulation corridor” that amplifies rainfall potential. This is consistent with early research. At the same time, the eastward and northward expansion of the SAH and the divergence of the high-altitude wind further intensify the uplift of low-level water vapor and the development of convection, creating favorable dynamic and water vapor conditions for extreme precipitation. In addition, the synergistic effect of the EAM and westerlies promotes the northward movement of warm and humid air currents and the convergence of low-level water vapor, enhancing the dynamic uplift required for regional extreme rainfall. The correlation analysis between actual observations and circulation indices shows that the interannual variations in multiple circulation indices, such as the WPSH index, IOBM, and SAH index, are significantly positively correlated with the frequency and intensity of heavy rainfall events in the mountainous areas of southern Anhui (Figure 6). Especially in the year when the WPSH, IOBM, and SAH indexes increase, the rainstorm and disastrous precipitation events in the mountainous area of southern Anhui show an obvious increasing trend (Figure 7). This is consistent with the research conclusion of Zhang et al. [42] that the Kelvin wave train excited by positive phase IOBM will enhance the anticyclone in the northwest Pacific, and the convergence of dry and cold air transported by the cyclone and warm and humid air transported by the anticyclone in the Yangtze River Basin will lead to an increase in the number of extreme precipitation days. However, some scholars have also proposed that during the summer when the IOBM phase is positive, the abnormal sea surface temperature in the Indian Ocean causes anomalous water vapor convergence and increased precipitation in the Jianghuai Basin and anomalous water vapor divergence and decreased precipitation in the areas south of the Yangtze River [43].
The trajectory analysis based on the HYSPLIT model shows that the water causing extreme rainfall in the mountainous areas of southern Anhui mainly comes from Southeast Asia, the South China Sea, and the Western Pacific. The low-level southwest wind effectively transports moisture northward, and when these moist air masses encounter complex terrain in the region, they converge and lift, while the upper troposphere water vapor is replenished from northwest China. The results further indicate that multi-source water supply is particularly important for regional extreme precipitation, and their combined effect enhances rainfall. These findings confirm previous research, identifying the importance of changes in water transport pathways driven by circulation variations as the primary driving factor for extreme rainfall events [19]. The dynamic interaction between large-scale circulation and water supply emphasizes the necessity of integrating trajectory and water flux analysis in regional rainfall research. However, the Euler method is suitable for large-scale meteorological analysis, and future research can focus on longer time scales and more rainstorm events [20].
Based on a deep understanding of circulation mechanisms and water pathways, this study emphasizes the importance of incorporating dynamic circulation indices and water flux diagnostics into disaster risk assessment in the mountainous areas of southern Anhui. The strong correlation between circulation anomalies (such as changes in WPSH, EAM, and SAH) and the occurrence of extreme rainfall highlights the value of these indicators in long-term monitoring and early warning [44]. Future risk assessment work should adopt high-resolution, multi-source datasets that integrate atmospheric, hydrological, and surface information to develop comprehensive, multi-scale disaster risk models. This type of model can improve the spatial and temporal resolution of predictions and enhance disaster preparedness and adaptation capabilities. In addition, the progress of numerical simulation and trajectory analysis can further clarify the causal relationship between circulation changes, water transport, and extreme rainfall, providing a scientific basis for disaster reduction strategies.
This paper mainly studies the circulation index and the rainstorm in the mountainous area of southern Anhui and uses some commonly used circulation indexes to calculate the correlation. The main time scale of the study is small and only discusses the rainstorm days, focusing on the local characteristics of the monsoon system without involving the global scale teleconnection phenomenon. During the rainy season, the interaction between the East Asian monsoon and the Western Pacific subtropical high determines the intensity and distribution of rainfall [45,46]. ENSO and IOD are global scale climate systems that play important regulatory roles in the strength and precipitation distribution of the East Asian monsoon by altering sea surface temperature distribution and atmospheric circulation [47,48]. However, ENSO has a certain lag in its impact on precipitation, usually having a significant effect on precipitation in the year or year following the event. In future research, we will incorporate the interaction between ENSO/IOD and the East Asian monsoon into the analytical framework and further elucidate the mechanism of precipitation anomalies in the mountainous areas of southern Anhui from a multi-scale perspective.
Finally, in view of the expected impact of climate change, especially the expected increase in the frequency and intensity of circulation anomalies, it is necessary to strengthen the research on the relationship between mountain disaster events in southern Anhui and the physical mechanism of rainstorms, and assess how future changes in circulation and water paths may change the risk model of extreme rainfall and related disasters in the region, which is crucial for sustainable disaster management.

5. Conclusions

This study systematically analyzed the formation mechanism, spatiotemporal distribution characteristics, and disaster risks of heavy rainfall events in the southern Anhui region in recent years. By integrating high-resolution precipitation observations, multi-source reanalysis data, and backward trajectory analysis, the main conclusions drawn are as follows:
  • The atmospheric circulation systems such as the WPSH, EASM, and SAH play a decisive role in regulating water vapor transport, convergence, and spatiotemporal variability of precipitation in the southern Anhui region. Especially with the westward extension and northward jump of WPSH, a channel for continuous invasion of warm and humid air currents has been formed. Combined with the synergistic effect of the westerly belt and monsoon system, it enhances the dynamic uplift, which is conducive to the occurrence of extreme precipitation.
  • The reverse trajectory and cluster analysis using the HYSPLIT model indicate that the main sources of extreme rainfall are Southeast Asia, the South China Sea, the Western Pacific, and inland regions of China, with multi-level and multi-channel transport. The terrain uplift in mountainous areas further improves precipitation efficiency, leading to significant spatial heterogeneity and local precipitation extremes.
  • The rainstorm disaster risk assessment based on principal component analysis, the entropy weight method, and multiple regression shows that the number of heavy rainfall stations and short-term extreme precipitation are important predictors of disaster risk, and the multiple linear regression fitting power index is the best for the assessment and classification of disaster-causing rainstorm events.
In summary, the combined effect of large-scale circulation systems and multi-source water vapor supply is the core driving force for extreme precipitation and disaster risk in the mountainous areas of southern Anhui. Strengthening high-resolution monitoring and dynamic risk assessment is of great significance for enhancing disaster prevention capabilities in the context of climate change. Future research should combine multi-source monitoring, satellite data, and numerical simulations to further focus on the coupled effects of climate change, underlying surface processes, and human activities on regional hydrometeorological disasters.

Author Contributions

Conceptualization, H.Z. and M.S.; Model debugging, M.S.; Data processing, M.S. and D.W.; Method, M.S. and W.Z.; Resources, Y.M. and H.Z.; Writing—original draft preparation, M.S.; Writing—review and editing, Y.M.; Visualization, M.S.; Supervision, Y.M. All authors have read and agreed to the published version of the manuscript.

Funding

This study was jointly funded by the Key Science & Technology Project of Anhui Province (grant no.: 202423l10050058) and the Innovation Development Program of Anhui Meteorology Bureau (grant no.: CXM202401).

Data Availability Statement

The data presented in this study are available on request from the first and corresponding authors.

Acknowledgments

The authors extend their sincere appreciation to the reviewers for their expertise and thoughtful review of this manuscript. We thank the technical support of the National Large Scientific and Technological Infrastructure “Earth System Numerical Simulation Facility” (https://cstr.cn/31134.02.EL (accessed on 14 July 2025)).

Conflicts of Interest

The authors declare no conflicts of interest.

References

  1. Li, X.; Du, Y. Statistical relationships between two types of heavy rainfall and low-level jets in South China. J. Clim. 2021, 34, 8549–8566. [Google Scholar] [CrossRef]
  2. Ou, Q.; Zhao, T.; Wang, S.; Liu, Y.; Wu, Y.Y.; Li, B.; Chen, X.H. Relating extreme precipitation events to atmospheric conditions and driving variables in China. Clim. Dyn. 2024, 62, 4925–4942. [Google Scholar] [CrossRef]
  3. Liu, W.H.; Wu, J.D.; Tang, R.M.; Ye, M.Q.; Yang, J. Daily precipitation threshold for rainstorm and flood disaster in the mainland of China: An economic loss perspective. Sustainability 2020, 12, 407. [Google Scholar] [CrossRef]
  4. Wang, B.; Liu, J.; Liu, G.; Gao, P.; Anwar, S.; Wu, Z.; Li, M.; Li, D. Spatiotemporal analysis and threshold modeling of rainfall-induced geological disasters in Anhui Province. Front. Earth Sci. 2025, 13, 1541242. [Google Scholar] [CrossRef]
  5. Guo, H.; Hu, W.; Yang, C.; Wan, F. Moisture sources and atmospheric circulation patterns for extreme rainfall event over North China Plain from 29 July to 2 August 2023. Earth Space Sci. 2024, 11, e2024EA003956. [Google Scholar] [CrossRef]
  6. Ding, Y.; Liu, Y.; Hu, Z.Z. The record-breaking Mei-yu in 2020 and associated atmospheric circulation and tropical SST anomalies. Adv. Atmos. Sci. 2021, 38, 1980–1993. [Google Scholar] [CrossRef]
  7. Chen, W.; Zhang, R.; Wu, R.; Wen, Z.; Zhou, L.; Wang, L.; Hu, P.; Ma, T.J.; Piao, J.L.; Song, L.; et al. Recent advances in understanding multi-scale climate variability of the Asian monsoon. Adv. Atmos. Sci. 2023, 40, 1429–1456. [Google Scholar] [CrossRef]
  8. Luo, Y.; Sun, J.; Li, Y.; Xia, R.; Du, Y.; Yang, S.; Zhang, Y.C.; Chen, J.; Dai, K.; Shen, X.S.; et al. Science and prediction of heavy rainfall over China: Research progress since the reform and opening-up of new China. J. Meteor. Res. 2020, 34, 427–459. [Google Scholar] [CrossRef]
  9. Wei, W.; Zhang, R.; Wen, M.; Kim, B.J.; Nam, J.C. Interannual variation of the South Asian high and its relation with Indian and East Asian summer monsoon rainfall. J. Clim. 2015, 28, 2623–2634. [Google Scholar] [CrossRef]
  10. Shang, K.; Liu, X.D.; Xie, X.N.; Sha, Y.Y.; Zhao, X.; Liu, J.H.M.; Wang, A.Q. Synergistic Impact of Midlatitude Westerly and East Asian Summer Monsoon on Mid-Summer Precipitation in North China. Atmosphere 2025, 16, 658. [Google Scholar] [CrossRef]
  11. Zhao, W.; Ma, Y.; Takemi, T.; Chen, X.; Cao, D. Investigating the underlying mechanisms of monsoon season heavy precipitation in central Asian high mountain areas. J. Clim. 2025, 38, 277–292. [Google Scholar] [CrossRef]
  12. Wang, G.; Hu, Z.; Yu, H.; Sun, G.; Fan, W.; Niu, R.; Zhang, B. Tibetan Plateau Vortex Activity and Its Relationship With the Tibetan Plateau Summer Monsoon and Precipitation. Int. J. Climatol. 2025, 45, e8713. [Google Scholar] [CrossRef]
  13. Hua, W.; Fan, G.; Wang, B. Variation of Tibetan Plateau Summer Monsoon and Its Effect on Precipitation in East China. Chin. J. Atmos. Sci. 2012, 36, 784–794. [Google Scholar]
  14. Zhang, Q.Y.; Tao, S.Y.; Chen, L.T. The interannual variability of East Asian summer monsoon indices and its association with the pattern of general circulation over East Asia. Acta Meteorol. Sin. 2003, 61, 559–569. [Google Scholar]
  15. Zhao, Y.; Cheng, J.; Feng, G.; Zhi, R.; Zheng, Z.; Zhang, Z. Analysis of the atmospheric direct dynamic source for the westerly extended WPSH and record-breaking Plum Rain in 2020. Clim. Dyn. 2022, 59, 1233–1251. [Google Scholar] [CrossRef]
  16. Li, X.; Zhou, W.; Chen, Y.D. Detecting the origins of moisture over southeast China: Seasonal variation and heavy rainfall. Adv. Atmos. Sci. 2016, 33, 319–329. [Google Scholar] [CrossRef]
  17. Yu, J.; Li, Q.; Ding, Y.; Ding, Y.; Wen, Z.; Gong, Z.; Sun, X.; Shen, X.; Dong, L. AMO modulation of interdecadal background of persistent heavy rainfall in summer over the Huaihe River Basin. Clim. Dyn. 2024, 62, 3621–3640. [Google Scholar] [CrossRef]
  18. Jiang, Z.; Ren, W.; Liu, Z.; Yang, H. Analysis of water vapor transport characteristics during the Meiyu over the Yangtze-Huaihe River valley using the Lagrangian method. Acta Meteorol. Sin. 2013, 71, 295–304. [Google Scholar]
  19. Yang, H.; Jiang, Z.; Liu, Z.; Zhang, Q. Analysis of climatic characteristies of water vapor transport based on the Lagrangian method: A comparison between Meiyu in the Yangtze-Huaihe River region and the Huaibei rainy season. Chin. J. Atmos. Sci. 2014, 38, 965–973. [Google Scholar]
  20. Sha, X.; Ding, J.; Chu, R.; Ma, X.; Li, X.; Xiao, Y.; Cheng, B.; Zhang, F.; Song, C.; Wang, S. Characteristics of Water Vapor Transport during the “7·20” Extraordinary Heavy Rain Process in Zhengzhou City Simulated by the HYSPLIT Model. Water 2024, 16, 2607. [Google Scholar] [CrossRef]
  21. Huang, S.; Xuan, W.; Qiu, H.; Ye, J.; Chen, X.; Nie, H.; Chen, H. Assessing Flood Risks in Coastal Plain Cities of Zhejiang Province, Southeastern China. Water 2024, 16, 3208. [Google Scholar] [CrossRef]
  22. Guo, P.; Yuan, Y.; Peng, Y.; Zhang, H.; Zhao, Y. Analysis of slope stability and disaster law under heavy rainfall. Geofluids 2021, 2021, 5520686. [Google Scholar] [CrossRef]
  23. Xiao, T.; Wang, Y.; Zhao, Y.; Jing, F.; Fang, Y. The hazard risk assessment of regional heavy rainfall over Sichuan Basin of China. Nat. Hazards 2017, 88, 1155–1168. [Google Scholar] [CrossRef]
  24. Liu, H.; Zhang, D.L. Analysis and prediction of hazard risks caused by tropical cyclones in Southern China with fuzzy mathematical and grey models. Appl. Math. Model. 2012, 36, 626–637. [Google Scholar] [CrossRef]
  25. Li, H.M.; An, J.J.; Qiu, X.X.; Zheng, L.L.; Liu, J.; Li, J.; Wu, R.J.; Zhou, X.Y. Characteristics of convective storm activity during the warm season over Anhui Province based on radar mosaic climatology and the possible causes. Torrential Rain Disasters 2023, 42, 554–562. [Google Scholar]
  26. Tong, J.; Wei, L.X.; Zhang, J.; Wang, D.Y. Statistical analysis of climatological characteristics of spring rainstorm in Anhui province. Torrential Rain Disasters 2016, 35, 504–510. [Google Scholar]
  27. Ren, M.; Chen, Y.; Qu, Y. Relationship between Rainstorm Areas and Some Physical Variables. Meteor Mon 2006, 32, 40–44. [Google Scholar]
  28. DB34/T 4271-2022; Classification of Regional Rainstorm Process. Anhui Provincial Administration for Market Regulation: Anhui, China, 2022.
  29. Zhao, L.; Wei, T.X.; Wang, L.R.; Zhang, A. Objective Identification and Characteristics Analysis of Regional Rainstorm Processes Based on a Comprehensive Intensity Index and Affected Areas. Clim. Environ. Res. 2024, 29, 430–442. (In Chinese) [Google Scholar]
  30. Loughner, C.P.; Fasoli, B.; Stein, A.F.; Lin, J.C. Incorporating Features from the Stochastic Time-Inverted Lagrangian Transport (STILT) Model into the Hybrid Single-Particle Lagrangian Integrated Trajectory (HYSPLIT) Model: A Unified Dispersion Model for Time-Forward and Time-Reversed Applications. J. Appl. Meteorol. Climatol. 2021, 6, 799–810. [Google Scholar] [CrossRef]
  31. Stein, A.F.; Draxler, R.R.; Rolph, G.D.; Stunder, B.J.B.; Cohen, M.D.; Ngan, F. NOAA’s HYSPLIT Atmospheric Transport and Dispersion Modeling System. Bull. Am. Meteorol. Soc. 2015, 96, 2059–2077. [Google Scholar] [CrossRef]
  32. Salman, A.D.; Al-Jumaily, K.J.; AL-Salihi, A.M. Aerosol-cloud-precipitation interactions over Iraq using MODIS satellite data and HYSPLIT model during (2008–2017). AIP Conf. Proc. 2020, 2290, 050005. [Google Scholar]
  33. Li, Y.; Tan, G.; He, X.; Zeng, N. Analyse of the characteristics of moisture transport in Luzhou extraordinary rainstorm based on HYSPLIT Model. Plateau Mt. Meteorol. Res. 2020, 40, 49–52. [Google Scholar]
  34. Tan, J.; Zhao, H.; Yang, R.; Liu, H.; Li, S.; Liu, J. An entropy-weighting method for efficient power-line feature evaluation and extraction from lidar point clouds. Remote Sens. 2021, 13, 3446. [Google Scholar] [CrossRef]
  35. Bucherie, A.; Hultquist, C.; Adamo, S.; Neely, C.; Ayala, F.; Bazo, J.; Kruczkiewicz, A. A comparison of social vulnerability indices specific to flooding in Ecuador: Principal component analysis (PCA) and expert knowledge. Int. J. Disaster Risk Reduct. 2022, 73, 102897. [Google Scholar] [CrossRef]
  36. Sulca, J.; Takahashi, K.; Espinoza, J.C.; Tacza, J.; Zubieta, R.; Mosquera, K.; Apaestegui, J. A multiple linear regression model for the prediction of summer rainfall in the northwestern Peruvian Amazon using large-scale indices. Clim. Dyn. 2024, 62, 4431–4451. [Google Scholar] [CrossRef]
  37. Feng, W.; Fan, G.Z.; Long, Y.Y. The influence of tropical ocean on the South Asia High and the Western Pacifica Subtropical High. Adv. Clim. Change Res. 2018, 14, 111–119. [Google Scholar]
  38. Hu, J.; Zhou, B.; Tao, L. Comparative Analysis of the Relation Between Characteristic Parameters of South Asia High and Summer Precipitation of China. Meteor Mon 2010, 36, 51–56. [Google Scholar]
  39. Tang, M.C. Some study process in plateau monsoon. Plateau Meteor 1993, 12, 95–101. (In Chinese) [Google Scholar]
  40. Yan, H.; Hu, J.; Fan, K.; Zhang, Y. The Analysis of Relationship between the Variation of Westerly Index in Summer and Precipitation during the Flood Period over China in the Last 50 Years. Chin. J. Atmos. Sci. 2007, 31, 717–726. [Google Scholar]
  41. Wei, Y.; Yu, H. The interdecadal weakening of the relationship between Indian Ocean sea surface temperature and summer precipitation in Central Asia. Geophys. Res. Lett. 2024, 51, e2023GL107371. [Google Scholar] [CrossRef]
  42. Zhang, P.; Duan, A.; Hu, J. Combined effect of the tropical Indian Ocean and tropical North Atlantic sea surface temperature anomaly on the Tibetan Plateau precipitation anomaly in late summer. J. Clim. 2022, 35, 7499–7518. [Google Scholar] [CrossRef]
  43. Sun, B.; Wang, H.; Zhou, B.; Li, H.; Zhu, B. A review on the interannual and interdecadal variations of water vapor transport over China during past decades. Adv. Water Sci. 2020, 31, 644–653. [Google Scholar]
  44. Cheng, Z.; Gao, H.; Cao, Y. Decadal enhancement of connection between Somalia cross-equatorial flow and summer precipitation in Huaihe River basin. Chin. J. Atmos. Sci. 2018, 42, 1363–1377. [Google Scholar]
  45. Liu, Y.T.; Xu, G.L.; Yang, Z.; Reng, X.Z.; Yang, X.C.; Li, A.J. Variation of Extreme Temperature and Its Association with Climate Indices in Anhui Province During the Past 56 Years. Res. Soil Water Conserv. 2021, 28, 245–255. [Google Scholar]
  46. Lou, D.J.; Wang, Y.G.; Chen, C. Circulation Characteristics and Precursory Signals of Abnormal Meiyu Rainfall in the Middle and Lower Reaches of the Yangtze River in the Past 20 Years. Meteor Mon 2022, 48, 1130–1139. [Google Scholar]
  47. Zeng, T.; Yang, D.; Guo, P.P.; Song, M.; Ma, L.; Xue, S.Y. Characteristics of Precipitation and Temperature Variation and Their Correlation with ENSO in Anhui Province during 1960–2012. Trop. Geogr. 2014, 34, 783–793. [Google Scholar]
  48. Wang, Y.X. Research on the Impact Mechanism of Indian Ocean Dipole on Summer Extreme Precipitation in the Middle and Lower Reaches of the Yangtze River Based on the 2020 “Violent Plum Blossom”. Master’s Thesis, Lanzhou University, Lanzhou, China, 2024. [Google Scholar]
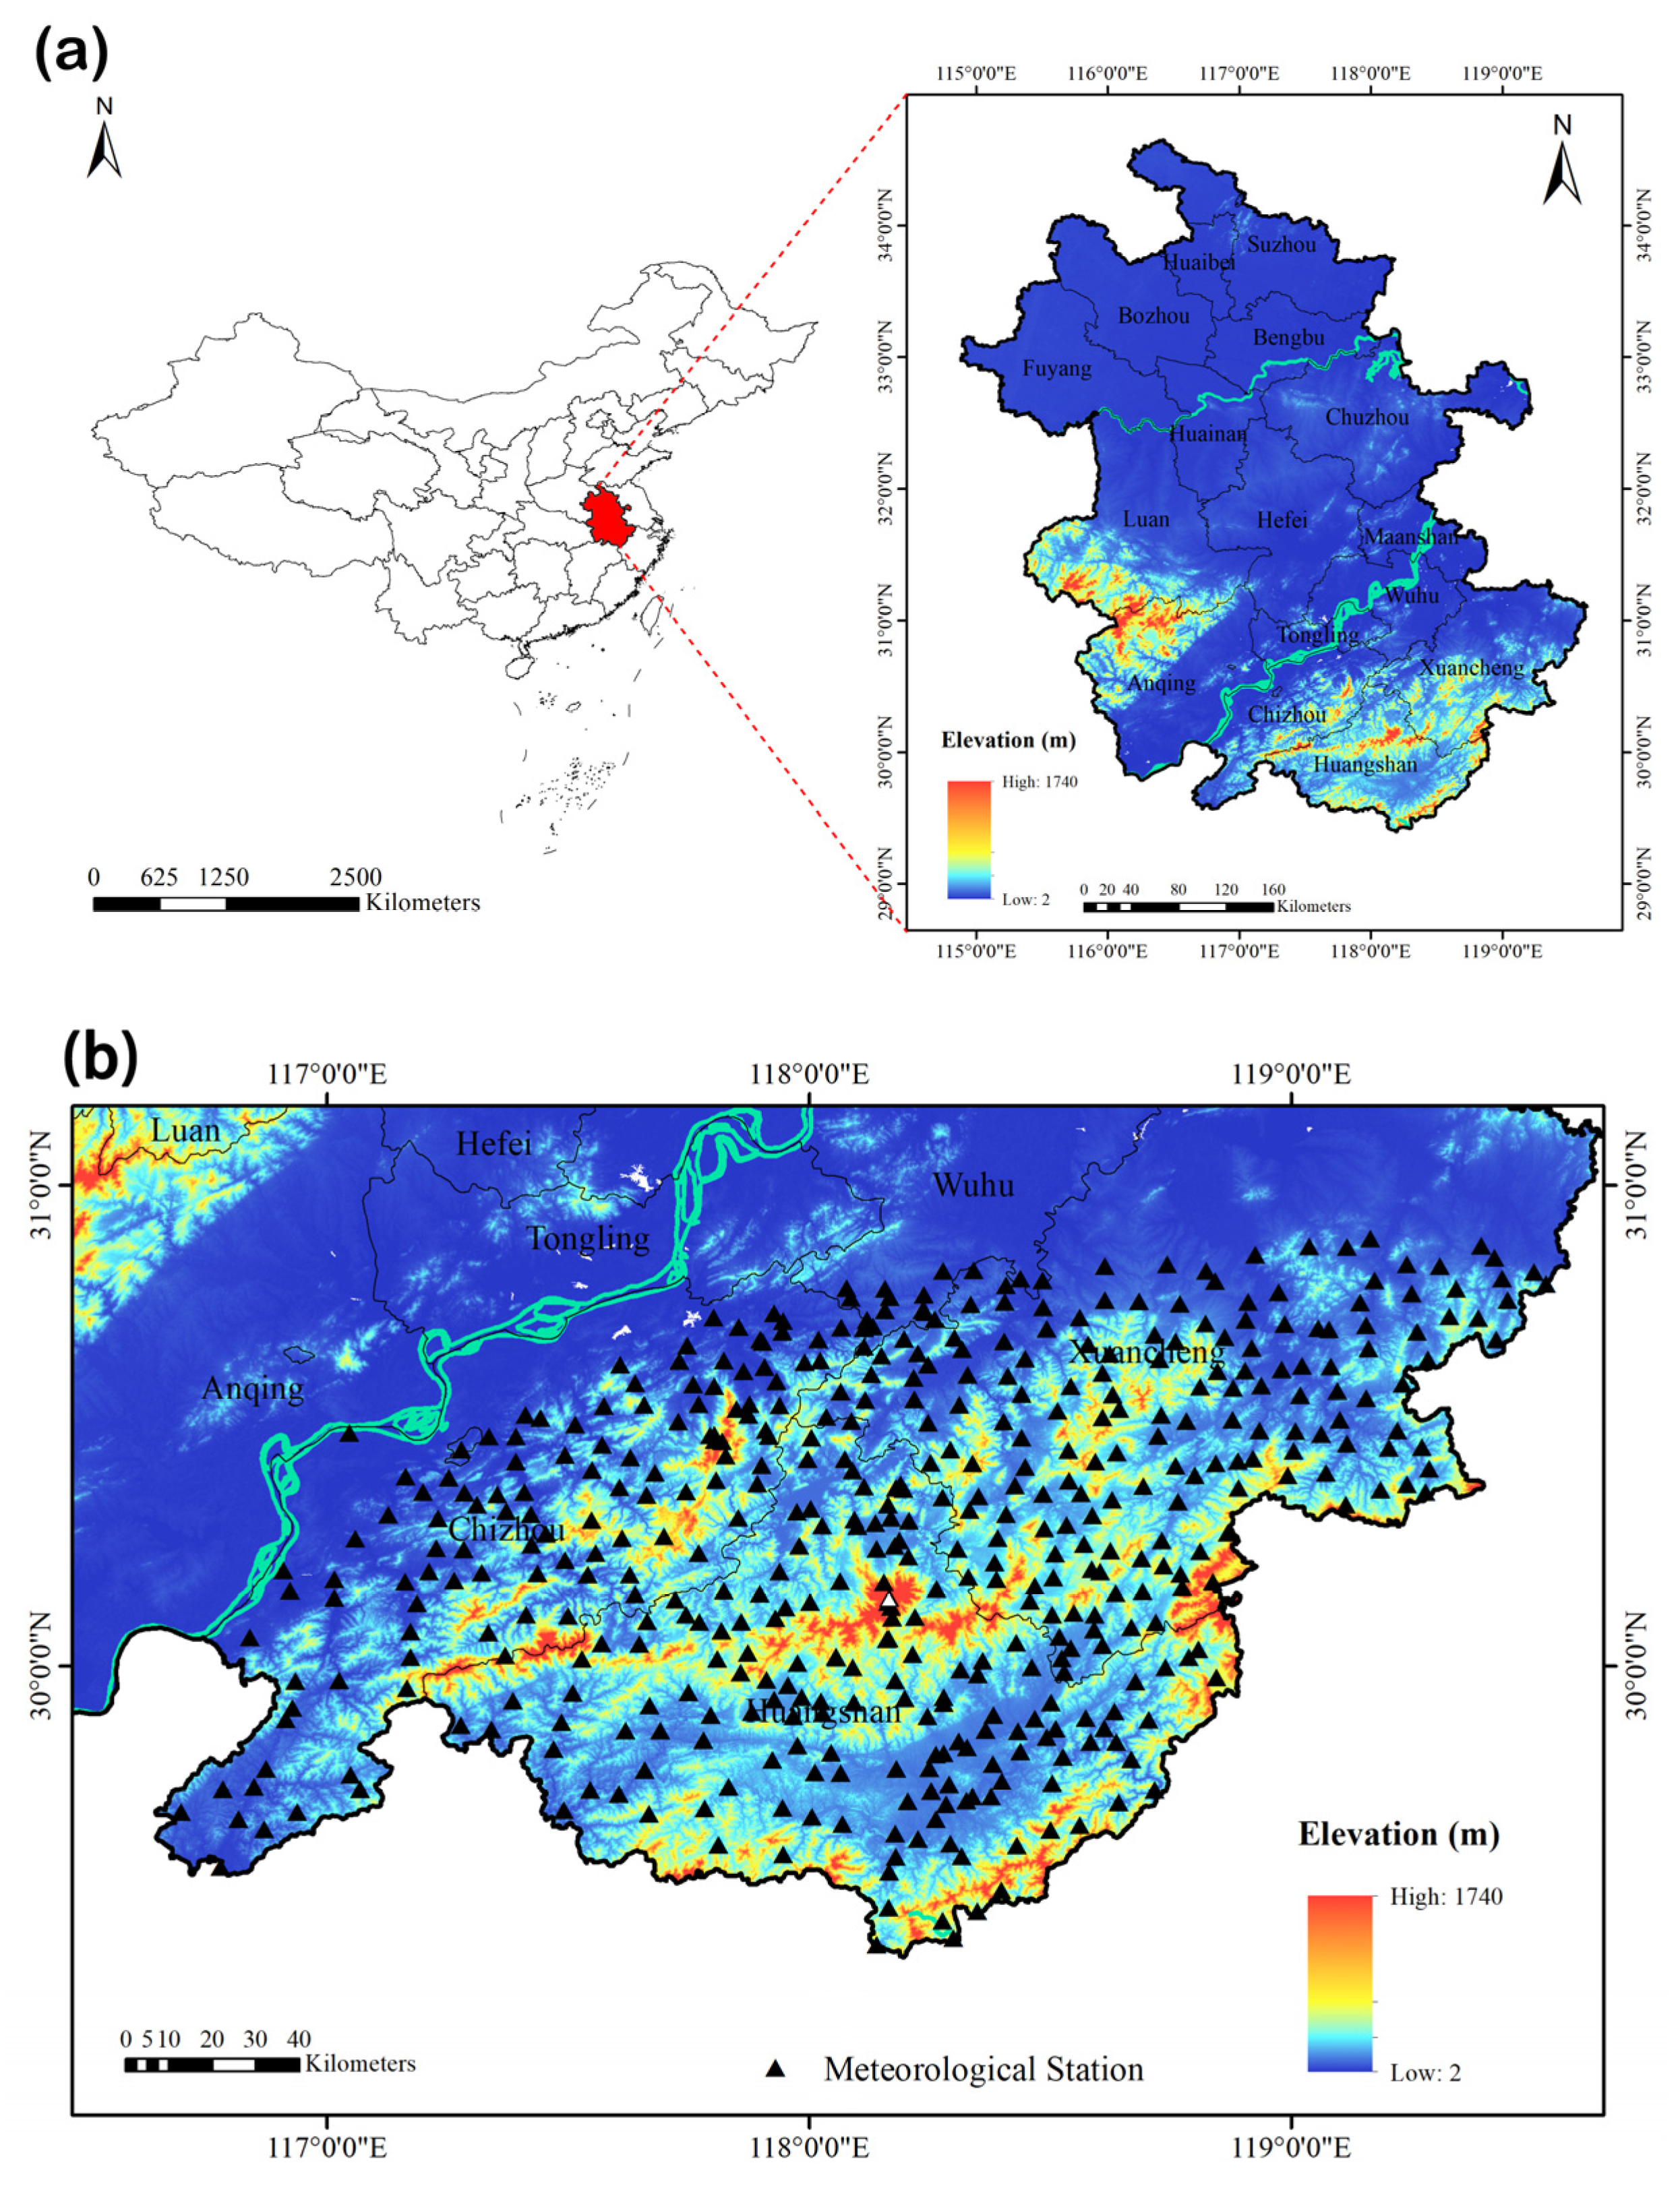
Figure 1. (a) Geographical location of the study area: Anhui, China, and (b) the distribution of meteorological stations.
Water 17 02906 g001
Figure 2. Distribution characteristics of (a) average precipitation and (b) extreme precipitation during 2022–2024 (the red star is labeled as Mount Huangshan Meteorological Station).
Water 17 02906 g002
Figure 3. Spatial distributions of water vapor transport channels at (a) 500 hPa, (b) 700 hPa, and (c) 850 hPa. The numbers at the end of each clustered trajectory line represent a specific cluster number, and the numbers in brackets indicate the proportion of the number of trajectories of this cluster to the total trajectories. The solid lines of red, blue, green, lake blue, and purple represent the 1–5 clustering tracks. The black star represents the Southern Anhui Mountains.
Water 17 02906 g003
Figure 4. Climate field distribution of (a) whole layer integrated water vapor flux (arrows, units: kg/m2/s) and its divergence (shaded, units: 10−6 g·(cm−2·hpa·s)−1), 500 hPa geopotential height (blue isolines, unit: dagpm), and (b) 850 hPa wind field (arrow, units: m/s), 200 hPa geopotential height (blue isolines, units: dagpm) of rainstorm events in the mountainous area of southern Anhui Province from 2022 to 2024. The red area indicates Anhui Province.
Water 17 02906 g004
Figure 5. Correlation between circulation index and rainstorm event precipitation (p < 0.05 marked by circle): (a) EAM index, (b) IOBM, (c) zonal index, (d) PM index, (e) WPSH index, (f) SAH index.
Water 17 02906 g005
Figure 6. Time series diagram of circulation index (standardized) of rainstorm events in the mountainous area of southern Anhui Province from 2022 to 2024.
Water 17 02906 g006
Figure 7. The ratio of disaster-causing rainstorm days to rainstorm days is estimated by PCA, the information entropy weight method, and multiple linear regression fitting power index.
Water 17 02906 g007
Table 1. Distribution of rainstorm days.
YearAprilMayJuneJulyAugustSeptember
Disaster EventNo Disaster EventDisaster EventNo Disaster EventDisaster EventNo Disaster EventDisaster EventNo Disaster EventDisaster EventNo Disaster EventDisaster EventNo Disaster Event
2022031033000000
2023021540040111
20240303111030301
Total0828184070412
Table 2. The contributions of water vapor sources at different levels to rainstorm events in the Southern Anhui Mountain Area from April to September 2022–2024.
LevelSoutheast AsiaSouth China SeaInland Areas of Northwest ChinaInland Areas of East China
500 hPa70%13%17%0
700 hPa32%34%8%26%
850 hPa059%13%26%
Total contribution102%106%38%52%
Table 3. Classification grade criteria of the rainstorm daily comprehensive intensity index.
Strength GradePercentile of Intensity Index
Extra strong>95%
Strong(70%, 95%]
Moderate(40%, 70%]
Weak≤40%
Disclaimer/Publisher’s Note: The statements, opinions and data contained in all publications are solely those of the individual author(s) and contributor(s) and not of MDPI and/or the editor(s). MDPI and/or the editor(s) disclaim responsibility for any injury to people or property resulting from any ideas, methods, instructions or products referred to in the content.