Abstract
This study investigates groundwater salinization in a section of a coastal aquifer in Rio Grande do Norte, Brazil, using frequency-domain electromagnetic (FDEM) measurements. With the global expansion of shrimp farming in ecologically sensitive coastal regions, there is an urgent need to assess associated risks and promote sustainable management practices. A key concern is the prolonged flooding of shrimp ponds, which accelerates saltwater infiltration into surrounding areas. To better delineate salinization plumes, we analyzed direct groundwater salinity measurements from 14 wells combined with 315 subsurface apparent conductivity measurements obtained using the FDEM method. Correlating these datasets improved the accuracy of salinity mapping, as evidenced by reduced variance in kriging interpolation. By integrating hydrogeological, hydrogeochemical, and geophysical approaches, this study provides a comprehensive characterization of groundwater salinity in the study area. Hydrogeological investigations delineated aquifer properties and flow dynamics; hydrogeochemical analyses identified salinity levels and water quality indicators; and geophysical surveys provided spatially extensive conductivity measurements essential for detecting and mapping saline intrusions. The combined insights from these methodologies enable a more precise assessment of salinity sources and support the development of more effective groundwater management strategies. Our findings demonstrate the effectiveness of integrating geophysical surveys with hydrogeological and hydrogeochemical data, confirming that shrimp farm ponds are a significant source of groundwater contamination. This combined methodology offers a low-impact, cost-effective approach that can be applied to other coastal regions facing similar environmental challenges.
1. Introduction
Pollution derived from human development and climate change represents a major threat to coastal ecosystems, which provide essential goods and services of high value to society [1]. Among these threats, groundwater salinization is a pressing issue that affects a significant number of coastal aquifers worldwide. Although salinization can occur naturally, it is most often linked to anthropogenic activities, particularly the overexploitation of groundwater resources and land-use practices that disrupt the ecological balance of coastal regions [2,3]. One notable activity that contributes to groundwater salinization is shrimp farming, which has expanded significantly in some coastal areas worldwide. Shrimp aquaculture is considered one of the most ecologically disruptive human activities due to its impact on fragile coastal environments [4]. Shrimp farming typically involves the direct extraction of seawater through artificial channels, which is then stored in ponds for cultivation. Inadequate waterproofing of these ponds often leads to leakage and surface flooding, accelerating groundwater contamination and salinization.
Although shrimp farming generates considerable economic benefits, it is also associated with severe environmental and social consequences. The most pressing concerns include aquifer salinization, soil fertility loss, agricultural land degradation, and ecosystem disruption [5,6]. These impacts underscore the need for rigorous monitoring and the development of sustainable management strategies to prevent further coastal degradation [7].
Brazil, with its extensive coastline, favorable sea temperatures, diversified agro-industrial base, and large domestic market, has long been an attractive location for shrimp farming [8,9]. Consequently, numerous shrimp ponds have been established across the country, contributing to groundwater salinization and soil degradation, particularly in coastal agricultural regions. These challenges highlight the importance of effective management practices and regulatory frameworks to mitigate the negative impacts of aquaculture [10].
Worldwide, several studies have investigated the impact of shrimp farming on groundwater salinization using hydrogeochemical, geophysical and remote sensing approaches. For instance, research has documented the salinization of groundwater linked to shrimp ponds in the Northeastern region of Brazil [11], the Mekong Delta of Vietnam [12], and low-lying areas of Southwestern Bangladesh [13]. Additionally, the application of remote sensing and Geographic Information Systems (GIS) has also proven valuable for monitoring land-use changes around shrimp farming areas, such as those observed in India [14].
In regions such as Baixa Quixaba, the environmental challenges posed by shrimp farming highlight the urgent need for cost-effective, reliable methodologies to assess and mitigate groundwater and soil salinization. Previous studies using hydrogeological and hydrogeochemical data from a limited number of wells and piezometers identified shrimp ponds as the primary source of salinization [15] but lacked spatial resolution for a comprehensive assessment.
To improve spatial accuracy and reliability of data interpretation, a detailed geophysical survey utilizing the frequency-domain electromagnetic (FDEM) technique was conducted as a complementary method for assessing groundwater salinization. This approach complements hydrogeological and hydrogeochemical data, offering a more precise and comprehensive understanding of the processes driving salinization. Enhancing spatial resolution strengthens the scientific basis for environmental policies and sustainable management strategies in vulnerable coastal regions.
2. Study Area and Regional Setting
2.1. Geographic and Environmental Conditions
The study area lies in Northeastern Brazil, along the northern coastline of Rio Grande do Norte, near the settlement of Baixa da Quixaba in the municipality of São Bento do Norte. This investigation was initiated in response to concerns expressed by local residents regarding the increasingly adverse environmental changes observed in the region. These changes primarily include the widespread die-off of natural vegetation, a substantial decline in soil productivity, and the persistent salinization of groundwater extracted from shallow wells, which serve as the main source of water for the community.
These environmental issues coincide with the establishment of shrimp farming operations. These aquaculture facilities utilize artificial ponds for shrimp cultivation, requiring high-salinity conditions for optimal production. The ponds are constructed at elevations slightly above sea level, allowing for the controlled inflow of seawater through a network of pumped pipelines. Once used, the water is discharged by gravity through a series of drainage channels that lead directly into the ocean. While this process is essential for the functionality of shrimp farming, it has significantly altered the local ecosystem by introducing saline water into the surrounding environment, thereby exacerbating groundwater contamination and affecting biodiversity.
The region features a tropical coastal environment with sand dunes, interdune lagoons, and sparse vegetation, forming a sensitive ecosystem highly vulnerable to anthropogenic disturbances. Figure 1 displays an aerial view of the study area, showing the spatial distribution of shrimp farming ponds and drainage canals embedded within the natural dune-lagoon systems, illustrating the extent of human modifications.

Figure 1.
Aerial view of the research area, highlighting the locations of the prawn ponds and the corresponding drainage systems that connect to the ocean. The upper section of the figure includes a global location sketch for context. Additionally, the image reveals the natural lagoons situated between the two farms, as well as the coastal dune belt. The lower section of the figure illustrates a conceptual hydrogeological cross-section.
The local hydrographic network involves small, intermittent rivers that typically terminate in ephemeral lagoons rather than discharging directly into the ocean. A nearly continuous belt of coastal dunes plays a crucial role in maintaining freshwater availability by acting as a natural reservoir that is periodically recharged by rainfall [16]. Tidal inlets connect landward tidal flats and lagoons to the sea [17]. The littoral zone is characterized by relatively low relief and siliciclastic shorelines. Beaches are commonly covered by Pleistocene to Holocene sand dunes, both vegetated and non-vegetated. This hydrological balance is essential for sustaining the region’s fragile ecosystems.
The coastal zone is further defined by its relatively low relief and predominantly siliciclastic shoreline. The geological framework consists of sand dunes that range from the Pleistocene to the Holocene epochs, encompassing both vegetated and non-vegetated formations. These dunes frequently extend inland from the beach, contributing to the overall morphological stability of the region. The underlying geology consists primarily of highly permeable sandy sediments, which facilitate the infiltration and movement of seawater into the groundwater system. This geological composition, combined with the operational practices associated with shrimp farming, has accelerated the salinization of local water resources, posing a significant threat to both potable water supplies and agricultural viability.
From a broader environmental perspective, this region illustrates the challenges of integrating aquaculture into fragile coastal systems. The ongoing degradation of groundwater and soil quality highlights the urgent need for sustainable management strategies that mitigate the adverse effects of shrimp farming. A sound understanding of the geographical and geological conditions is critical for effective interventions to preserve ecological integrity.
2.2. Geological and Climatic Conditions
Geologically, the study area lies within the Potiguar Basin, known for its complex stratigraphy. The basin is underlain by carbonate deposits of the Jandaíra Formation and siliciclastic Mesozoic sediments of the Açu Formation [18,19]. Overlying these are a relatively thin sequence of Neogene and Paleogene sediments belonging to the Barreiras Group. Additionally, Quaternary deposits comprising unconsolidated sands, silts, and clays are widespread. (Figure 1). This diverse framework plays a significant role in influencing groundwater dynamics, sediment transport processes, and the overall environmental susceptibility of the area to saline intrusion and land degradation.
Given the increasing pressures from shrimp farming, further research and policy interventions are necessary to safeguard natural resources. Sustainable aquaculture techniques, improved water management, and continuous monitoring are vital to mitigate long-term ecological impacts and ensure the well-being of both local populations and ecosystems.
3. Materials and Methods
To determine the origin and extent of groundwater salinity in the study area, a multi-disciplinary approach was adopted, combining hydrogeology, geochemistry, and geophysics. The methods and results of the first two have been previously published [15], but they are summarized here to maintain consistency with the geophysical results. The goal was to integrate all three methodologies to develop robust conclusions about groundwater salinity.
3.1. Hydrogeological Investigation
The hydrogeological characterization of the aquifer was based on data collected from a network of piezometers strategically distributed across the study area. This network consisted of six pre-existing piezometers (PZ-09, PZ-16, PZ-17, PZ-18, PZ-21, and PZ-22), supplemented by eight new installations (PZ-10, PZ-11, PZ-12, PZ-13, PZ-14, PZ-15, PZ-19, and PZ-20) that were specifically drilled to improve spatial coverage and data resolution.
The exact coordinates and elevations of piezometers and sampling points were determined using a high-precision geodetic GPS, ensuring reliable aquifer mapping. Groundwater levels were measured with an analog (±1 cm accuracy), providing consistent data for hydraulic gradient and flow directions within the aquifer. These measurements yielded key parameters of the aquifer essential for identifying potential pathways of saltwater intrusion and evaluating the influence of anthropogenic activities, particularly shrimp farming, on groundwater dynamics.
3.2. Hydrogeochemical Analysis
Groundwater samples collected using 1 L polythene bottles pre-cleaned with distilled water and diluted nitric acid (HNO3) eliminate any residual impurities. At each site, the bottles were rinsed multiple times with groundwater before final sampling.
Samples were sealed, stored, and transported at temperatures below 5 °C to preserve integrity. On-site physicochemical parameters, including electrical conductivity (EC), temperature (T °C), and pH, were measured immediately using portable, calibrated instruments.
Major ion analyses were conducted at the Brazilian Agricultural Research Company (EMBRAPA) laboratories following standard procedures [20]. Analytical errors were kept below 5%, ensuring precision in the results. Additionally, the ionic balance error (IBE) was calculated to verify the accuracy of cation and anion measurements. The IBE values fell within acceptable limits, confirming dataset reliability.
3.3. Geophysical Survey
Geophysical methods enhance hydrogeological research by providing spatially extensive data that complement hydrogeochemical observations. Because groundwater salinity strongly influences electrical properties, electromagnetic techniques are widely used for aquifer investigations [21,22,23].
For this study, the frequency-domain electromagnetic (FDEM) method was selected due to its speed, ease of operation, and ability to produce dense, cost-effective datasets of apparent conductivity. Measurements were obtained using a Geonics EM34-3 instrument (Mississauga, ON, Canada). The technique records both quadrature (Qu) and in-phase (Ph) components of the electromagnetic field. Under low induction number (LIN) conditions, the Qu response can be directly converted into apparent electrical conductivity (ECa, mS/m) using the formula:
where , μo is the magnetic permeability of free space (4π10−7 H/m), is the frequency (Hz), (Hs/Hp)Qu is the Qu component of the secondary Hs to primary Hp magnetic field coupling ratio, and s is the coil separation (m).
This equation assumes the instrument operates under low induction number (LIN) conditions. The skin depth (δ)—defined as the depth at which a plane wave is attenuated by approximately 37% of its surface value—is divided by the coil spacing to determine the dimensionless LIN parameter. When the induction number is very low, the quadrature-phase component can be directly converted into apparent conductivity [24].
Field tests were carried out by taking measurements in six configurations: vertical and horizontal dipoles, and 10, 20 and 40 m apart between dipoles. After the analysis of the test data, we assumed that the configuration of horizontal dipoles with a distance of 10 m between dipoles was the most sensitive for the detection of saline plumes, considering the shallow depth of the aquifer. Penetration depth in these conditions corresponds to ~ 7.5 m, and if there are no physical barriers to data acquisition, as was found in the current research, the process is fast (Figure 2).
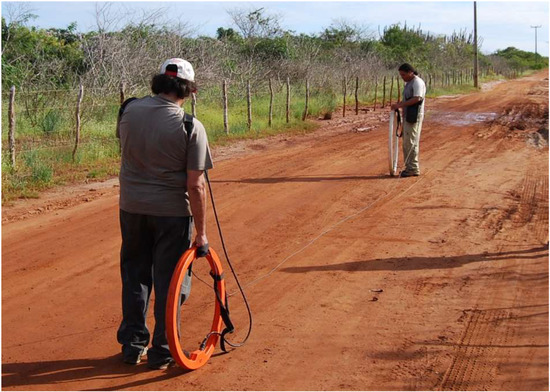
Figure 2.
FDEM measurements along a profile using horizontal dipoles 10 m apart.
Once the most appropriate methodology was defined, data acquisition was carried out along 16 profiles (Figure 3), with a spacing of points every 50 m. In total, 509 points were measured, which represents a total distance of 25 kilometers.
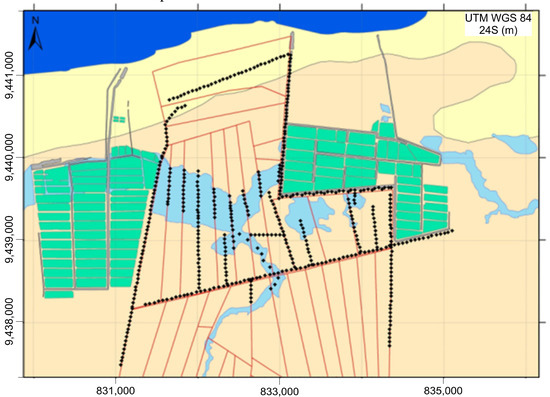
Figure 3.
Black dots show the location of FDEM stations distributed along profiles between the ponds of the two shrimp farms.
4. Results
The results obtained from each of the applied techniques are presented and analyzed separately in the following subsections. This structured approach allows for a detailed examination of each dataset before synthesizing the findings into a cohesive interpretation in the Section 5. Results obtained by each of the techniques are presented and interpreted separately in each of the subsections. The integration of all the results will be carried out later in the Section 5.
4.1. Hydrogeological Results
Figure 4 illustrates the results derived from the piezometric map and the delineated flow lines within the study area. Two significant trends emerge from the piezometric level distribution. The first trend follows a general regional flow from south to north, ultimately discharging into the sea. However, this regional pattern is disrupted by the presence of lagoons that become inundated during the wet season. The second notable trend is associated with the coastal dune belt, a natural formation situated near the shoreline that can reach elevations of up to 10 m. This dune belt functions as a watershed, directing water flow both inland and towards the inter-dune lagoons.
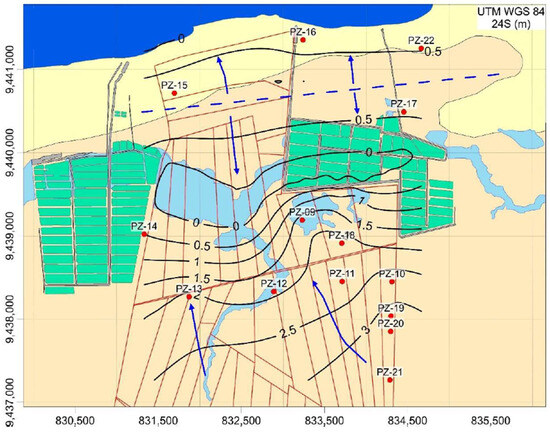
Figure 4.
Spatial distribution of hydraulic heads, illustrating the main groundwater flow (blue arrows) and the piezometric map of the studied site. The inferred groundwater watershed in the coastal dune area is depicted as a dashed blue line. Hydraulic head values are given in meters above mean ocean level.
This unique hydrogeological setting plays a crucial role in maintaining the delicate balance between fresh and saltwater systems. The dunes act as natural reservoirs, storing rainwater and subsequently facilitating groundwater recharge. Additionally, they serve as a natural drainage mechanism that prevents excessive saltwater intrusion, thereby preserving the freshwater quality within the aquifer.
4.2. Hydrogeochemical Results
As anticipated, groundwater within the study area exhibits a broad spectrum of electrical conductivity values, indicating significant spatial variability in water salinity. Measurements obtained from piezometers strategically placed throughout the aquifer reveal a conductivity range spanning from a minimum of 222 μS/cm to a maximum of 79,855 μS/cm. Figure 5 presents the interpolated isolines generated from these discrete data points, offering a visual representation of salinity distribution.

Figure 5.
Spatial distribution of electrical conductivity in groundwater samples collected from control piezometers. The salinity is lowest along the coast and highest in the shrimp aquaculture ponds. Isoline values are expressed in mS/cm.
One of the most unexpected findings is the low electrical conductivity recorded at the PZ-15 piezometer, located atop the dunes in close proximity to the coastline. Despite its coastal location, this site exhibits the lowest salinity levels within the study area. Conversely, the highest electrical conductivity values were detected at the PZ-12 piezometer, situated centrally between two shrimp aquaculture facilities, approximately three kilometers from the sea.
The observed salinity distribution does not appear to be directly attributable to natural seawater intrusion. Instead, the presence of freshwater near the coast, juxtaposed with elevated salinity in the vicinity of shrimp farming operations, suggests that anthropogenic factors—such as wastewater discharge or salt accumulation from aquaculture activities—may play a significant role in influencing the increases in groundwater salinity.
The hydrogeochemical characteristics of the samples have great variability, as applies to a coastal area where freshwater, saltwater and mixing water converge. The results of the analysis are shown in Table 1.

Table 1.
Hydrogeochemical results of analysis from groundwater samples from piezometers.
4.3. Geophysical Results
Electromagnetic (EM) measurements in the Frequency Domain were processed to correct for temperature variations and discrepancies between values obtained from intersecting survey profiles. Data points exhibiting high electrical conductivity or negative readings that failed to meet the linearity conditions for low induction numbers were adjusted following the manufacturer’s guidelines [25].
Figure 6 provides a direct representation of apparent conductivity, displayed using a contour color scale interval. The spatial distribution of conductivity highlights distinct variations in subsurface salinity. The highest apparent conductivity values (>300 mS/m) are concentrated between the shrimp ponds, indicating significant salinization of the subsurface materials. In contrast, the lowest apparent conductivity values (<50 mS/m), which are characteristic of non-salinized zones, are predominantly found in the northern section of the study area, near the coastline.
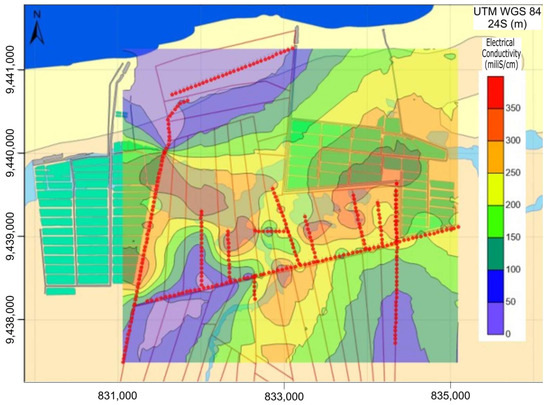
Figure 6.
Spatial distribution of apparent electrical conductivity (EC) from the FDEM survey revealed distinct patterns related to freshwater and saline environments. Low conductivity values (<50 mS/m) are concentrated near the shoreline, indicating freshwater zones. In contrast, the central region exhibits high conductivity values (>300 mS/m), which correspond to salinity plumes associated with shrimp farming ponds. Contour lines are expressed in mS/m. Red dots show the location of FDEM stations.
Interpreting apparent electrical conductivity values can be challenging, as they are influenced by multiple factors, including porosity, clay content, and the concentration of dissolved ions. However, in this case, the impact of extraneous variables appears to be minimal. The exceptionally high conductivity values detected in certain locations strongly suggest groundwater contamination resulting from saltwater infiltration, likely exacerbated by human activities such as aquaculture operations.
These findings provide crucial insights into the hydrogeological and hydrogeochemical processes at play within the study area. The integration of these results in the Section 5 will offer a more comprehensive understanding of the underlying mechanisms governing groundwater salinity and flow dynamics.
5. Discussion
5.1. Comparison of Hydrogeochemical and Geophysical Findings
The hydrogeochemical and geophysical results have been previously presented independently, and their interpretations have been discussed in the corresponding subsections. By integrating the findings from both methodologies, it becomes evident that saltwater intrusion is mitigated by freshwater lenses stored in the dunes. Additionally, salinity measurements from the limited number of piezometers indicate that groundwater is highly salinized inland but exhibits lower salinity levels closer to the coast. This underscores the importance of synthesizing both sources of information into a comprehensive model of groundwater salinity.
As a complementary approach, geophysical data acquired using the Frequency-Domain Electromagnetic (FDEM) technique further corroborates this interpretation. However, the apparent bulk electrical conductivity values obtained via geophysical surveys differ in meaning and magnitude from those derived directly from groundwater samples. To facilitate the integration of these datasets, a correlation must be established to convert geophysical data into equivalent groundwater salinity values.
5.2. Methodological Integration and Data Correlation
The transformation of geophysical measurements into groundwater salinity values is based on Archie’s Law, which defines the empirical relationship between the formation factor (F), porosity (φ), water saturation, and electrical resistivity in granular rocks [26]. The bulk conductivity of the subsurface is thus a sum of two components: electrolytic conductivity and ionic conductivity associated with clay minerals possessing high cation exchange capacity [27]. This relationship is expressed as follows:
where
ECa is the apparent bulk conductivity of the subsurface measured by geophysics;
ECw is the electrolytic conductivity of pore water;
T is the transmission connectivity between the pores;
θ is the porosity;
ECclay denotes the ionic conductivity of clay particles.
To achieve reliable data integration, simultaneous measurements of groundwater electrical conductivity and bulk conductivity were performed in selected piezometers. These piezometers covered a broad range of groundwater electrical conductivity values, spanning from 222 μS/cm in PZ-15 near the coast to a maximum of 52,330 μS/cm in PZ-12, located inland between shrimp farming ponds.
Figure 7 illustrates a strong linear correlation between both variables, with a correlation coefficient R2 equal to 0.987. The straight line of best m.s.q. fitting obtained has the equation y = 210.44 x − 5848.4. Therefore, considering that x is the bulk electromagnetic conductivity value of the subsurface measured by the FDEM survey, we will be able to calculate y as an equivalent value of the electrical conductivity of groundwater under each geophysical station.
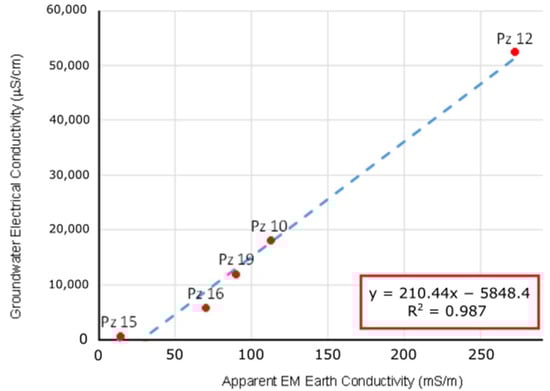
Figure 7.
The binary plot shows the relationship between groundwater electrical conductivity and the apparent electrical conductivity of the subsurface for the 10 HD frequency-domain EM survey.
The bulk electrical conductivity data from the geophysical survey has been converted into equivalent groundwater electrical conductivity, resulting in a new, integrated map (Figure 8). This refined map provides a clearer depiction of the origin, shape, and extent of the saline contamination plumes compared to the map based solely on groundwater conductivity measurements from the piezometers.
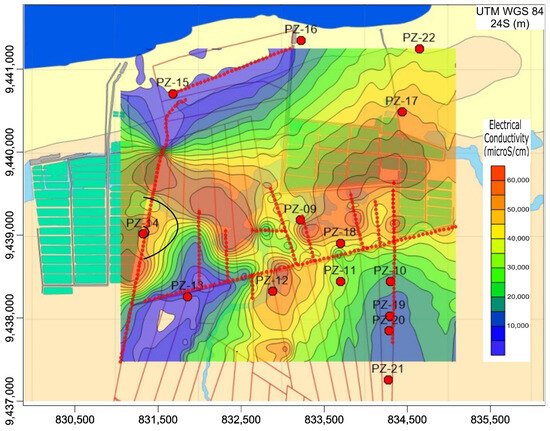
Figure 8.
Spatial distribution of electrical conductivity of groundwater integrating water and FDEM data, transformed into equivalent groundwater. Low conductivity values (<200 µS/cm) near the shoreline indicate freshwater presence, while high conductivity values (>6500 µS/cm) in the central region suggest salinity plumes linked to shrimp farming ponds. Conductivity contour lines are expressed in µS/cm.
The study area is not affected by agricultural or urban activities that could act as potential sources of groundwater pollution. Although the salinization originates from seawater, the underlying mechanism does not correspond to a conventional marine intrusion process. Rather, it is attributable to the discharge of saline effluents from shrimp culture facilities. Three main key lines of evidence support this interpretation. First, the presence of a natural dynamic barrier generated by rainfall recharges, although the dune system limits the direct intrusion of seawater. Second, elevated potassium concentrations are observed near ponds, consistent with the use of potassium salt as dietary supplements in shrimp farming. Third, the geometry of saline plumes has been precisely characterized through subsurface electrical conductivity mapping using frequency-domain electromagnetic methods (Figure 8). Consequently, the joint analysis of hydrogeological, hydrogeochemical, and geophysical data provided valuable insights into the origin of groundwater pollution and the extent of salinization. The data enabled the identification of key processes, such as groundwater flow and saltwater intrusion from shrimp farming ponds, and their impacts on groundwater quality. When integrated with hydrogeological and geophysical information, the hydrogeochemical results contributed to a robust and comprehensive assessment of groundwater salinity at the study site.
The results were compared using simple statistical analyses and graphically through contour maps. An outstanding contribution of this study is the correlation established between direct measurements of groundwater salinity from 14 wells and salinity values inferred from 315 subsurface conductivity measurements obtained with the FDEM method. Combining both datasets proved highly useful in improving the delineation of salinization plumes, as evidenced by the reduction in variance during kriging interpolation. Kriging variance is a measure of estimation precision that decreases as the number of informing samples increases [28].
The joint interpretation allowed us to determine both the extent of the saline plume and the origin of groundwater salinization, which is attributed to the seepage of hypersaline water from shrimp farming ponds. In addition to evaporation, harvest draining, and regulated outflow, a water budget study conducted on an inland shrimp farming pond under similar conditions estimated that seepage losses accounted for more than 20% of the total water output [29].
By integrating hydrogeological, hydrogeochemical, and geophysical approaches, this study provides a comprehensive characterization of groundwater salinity in the study area. Hydrogeological investigations delineated aquifer properties and flow dynamics, hydrogeochemical analyses quantified salinity levels and identified key water quality indicators, and geophysical surveys supplied spatially extensive conductivity measurements critical for detecting and mapping saline intrusions. Together, these complementary methods enable a more precise assessment of salinity sources and support the development of more effective groundwater management strategies.
The combined application of both techniques has proven that the origin of groundwater salinity in this area is produced by shrimp farming activities. The findings of this research underscore the vulnerability of coastal aquifers to poorly planned and inadequately managed human activities. In particular, the establishment of shrimp cultivation facilities—while potentially offering socio-economic benefits to local communities—can also generate severe environmental impacts, some of which may be irreversible or require costly and complex remediation. Achieving sustainable shrimp farming, therefore, demands the development of methodologies that enable the efficient design of production ponds, alongside the enforcement of legal frameworks mandating impact assessments and monitoring procedures such as those implemented in this study.
Given the adverse environmental impacts of shrimp farming in ecologically sensitive coastal regions, there is an urgent need to assess associated risks and promote sustainable management practices. Recent studies highlight several strategies: improving water management [30]; using impermeable liners in ponds and channels to prevent seepage [31]; establishing long-term monitoring networks [32]; implementing Integrated Coastal Zone Management (ICZM) policies to balance economic activities with environmental sustainability [33]; and training farmers on best practices and the environmental consequences of their activities to encourage more responsible aquaculture [34,35].
6. Conclusions
6.1. Key Findings and Their Significance
The findings of this study provide crucial insights into the extent and origin of groundwater salinization in a coastal aquifer impacted by shrimp farming activities. A comprehensive joint interpretation of geophysical, hydrogeological, and hydrogeochemical data demonstrates that the primary source of groundwater salinization is the leaching of hypersaline water from shrimp farming ponds and their associated network of filling and emptying channels. This process contributes significantly to the development of saline plumes, posing a serious threat to freshwater resources in coastal regions.
A key achievement of this study is the strong correlation observed between apparent electrical conductivity data, acquired using the frequency-domain electromagnetic (EM) method, and direct measurements of groundwater electrical conductivity from wells and piezometers. This correlation enabled the accurate conversion of geophysical data into equivalent groundwater conductivity values. As a result, the network of observation points was delineated with greater precision, providing a more comprehensive understanding of the geometry and evolution of saline plumes in the affected aquifers.
6.2. Future Research
While this study has provided valuable insights, further research is necessary to deepen the understanding of shrimp farming’s impact on coastal groundwater resources and explore potential mitigation strategies. Future studies should focus on the following:
- -
- Longitudinal Studies: Conducting extended temporal studies to track the progression of saline plume development and assess the long-term impacts of shrimp farming on aquifers.
- -
- Alternative Sustainable Aquaculture Techniques: Investigating eco-friendly aquaculture methods, such as integrated multi-trophic aquaculture (IMTA) systems, which can reduce environmental harm while maintaining productivity.
- -
- Hydrogeological Modeling: Developing advanced hydrogeological models that simulate the movement of saline plumes and predict future contamination scenarios under different management strategies.
- -
- Climate Change Impacts: Examining how climate change variables, such as sea-level rise and changing precipitation patterns, may exacerbate or mitigate the effects of shrimp farming on groundwater salinization.
In conclusion, this study underscores the need for sustainable management practices in shrimp farming to prevent groundwater salinization and protect coastal aquifers. By integrating geophysical, hydrogeological, and hydrogeochemical techniques, a cost-effective and non-intrusive approach has been demonstrated, which can be applied to other regions facing similar environmental challenges. These findings emphasize the vulnerability of coastal groundwater systems and the necessity of proactive measures to ensure the long-term sustainability of aquaculture and freshwater resources.
Author Contributions
Conceptualization, A.C.-P., J.A.B.-S. and F.P.L.-F.; methodology, A.C.-P. and J.A.B.-S.; resources, F.P.L.-F., L.C.M.-E. and J.A.B.-S.; fieldwork, E.B.S.d.S., L.C.M.-E. and A.d.M.-S.; data curation, A.C.-P., E.B.S.d.S. and A.S.; writing—original draft preparation, A.C.-P. and A.S.; writing—review and editing, A.C.-P., E.B.S.d.S., F.P.L.-F., A.S. and J.C.T. All authors have read and agreed to the published version of the manuscript.
Funding
This research received no external funding.
Data Availability Statement
All the necessary data to understand the results of this research are presented in the form of tables or maps. We offer to send the file with the 315 geophysical measurement points to anyone who requests it.
Conflicts of Interest
The authors declare no conflicts of interest.
References
- Martínez, M.L.; Intralawan, A.; Vázquez, G.; Pérez-Maqueo, O.; Sutton, P.; Landgrave, R. The coasts of our world: Ecological, economic and social importance. Ecol. Econ. 2007, 63, 254–272. [Google Scholar] [CrossRef]
- Custodio, E.; Bruggerman, G.A. Groundwater Problems in Coastal Areas; UNESCO: Paris, France, 1987; ISBN 978-92-3-102415-3. [Google Scholar]
- Mastrocicco, M.; Colombani, N. The issue of groundwater salinization in coastal areas of the mediterranean region: A review. Water 2021, 13, 90. [Google Scholar] [CrossRef]
- Páez-Osuna, F. The environmental impact of shrimp aquaculture: A global perspective. Environ. Pollut. 2001, 112, 229–231. [Google Scholar] [CrossRef] [PubMed]
- Hou, Y.; Yang, J.; Russoniello, C.J.; Zheng, T.; Wu, M.-L.; Yu, X. Impacts of coastal shrimp ponds on saltwater intrusion and submarine groundwater discharge. Water Resour. Res. 2022, 58, e2021WR031866. [Google Scholar] [CrossRef]
- Primavera, J.H. Overcoming the impacts of aquaculture on the coastal zone. Ocean. Coast. Manag. 2006, 49, 531–545. [Google Scholar] [CrossRef]
- Callaghan, D.P.; Bouma, T.J.; Klaassen, P.; van der Wal, D.; Stive, M.J.F.; Herman, P.M.J. Hydrodynamic forcing on salt-marsh development: Distinguishing the relative importance of waves and tidal flows. Estuar. Coast. Shelf Sci. 2010, 89, 73–88. [Google Scholar] [CrossRef]
- Roversi, F.; van Maanen, B.; Colonna Rosman, P.C.; Neves, C.F.; Scudelari, A.C. Numerical Modeling Evaluation of the Impacts of Shrimp Farming Operations on Long-term Coastal Lagoon Morphodynamics. Estuaries Coasts 2020, 43, 1853–1872. [Google Scholar] [CrossRef]
- Jablonski, S.; Filet, M. Coastal management in Brazil—A political riddle. Ocean. Coast. Manag. 2008, 51, 536–543. [Google Scholar] [CrossRef]
- Valenti, W.C.; Barros, H.P.; Moraes-Valenti, P.; Bueno, G.W.; Cavalli, R.O. Aquaculture in Brazil: Past, present and future. Aquac. Rep. 2021, 19, 100611. [Google Scholar] [CrossRef]
- Andrade Silva, S.; Navoni, J.A.; Lins Oliveira, J.E. Impact of shrimp farming effluents on estuarine areas: A study in the Guaraíras Lagoon region, Rio Grande Do Norte—Brazilian Northeast. Aquacult Int. 2025, 33, 68. [Google Scholar] [CrossRef]
- Tho, N.; Merckx, R.; Ut, V.N. Impacts of saline water irrigation and shrimp pond discharges on the surrounding waters of a coastal district in the Mekong delta of Vietnam. Environ. Earth Sci. 2014, 71, 2015–2027. [Google Scholar] [CrossRef]
- Rahman, A.K.M.M.; Ahmed, K.M.; Butler, A.P.; Hoque, M.A. Influence of surface geology and micro-scale land use on the shallow subsurface salinity in deltaic coastal areas: A case from southwest Bangladesh. Environ. Earth Sci. 2018, 77, 423. [Google Scholar] [CrossRef]
- Rekha, P.N.; Gangadharan, R.; Ravichandran, P.; Mahalakshmi, P.; Panigrahi, A.; Pillai, S.M. Assessment of impact of shrimp farming on coastal groundwater using Geographical Information System based Analytical Hierarchy Process. Aquaculture 2015, 448, 491–506. [Google Scholar] [CrossRef]
- Beltrão-Sabadía, J.A.; Casas-Ponsatí, A.; Sabino da Silva, E.B.; Sendrós, A.; Tapias, J.C.; Pinheiro Lima-Filho, F. Assessing the Origin and Mapping the Extension of Salinity Around Shrimp Culture Ponds in Rio Grande Do Norte (Brazil). Hydrology 2024, 11, 188. [Google Scholar] [CrossRef]
- Tabosa, W.F. Dinâmica Costeira da Região de São Bento do Norte e Caiçara do Norte—RN. Master’s Thesis, Universidade Federal do Rio Grande do Norte, Natal, Brasil, 2000. [Google Scholar]
- Bezerra, F.H.R.; Barreto, A.M.F.; Suguio, K. Holocene sea-level history on the Rio Grande do Norte State coast, Brazil. Mar. Geol. 2003, 196, 73–89. [Google Scholar] [CrossRef]
- Neto, P.; Soares, U.; Silva, J.G.; Roesner, E.H.H.; Florencio, C.P.P.; Souza, C.A.V.A.V.; Neto, O.C. Bacia Potiguar. Bol. Geociências Petrobras 2007, 15, 357–369. [Google Scholar]
- Melo, A.H.; Andrade, P.R.O.; Magalhães, A.J.C.; Fragoso, D.G.C.; Lima-Filho, F.P. Stratigraphic evolution from the early Albian to late Campanian of the Potiguar Basin, Northeast Brazil: An approach in seismic scale. Basin Res. 2020, 32, 1054–1080. [Google Scholar] [CrossRef]
- Clesceri, L.S.; Greenberg, A.E.; Eaton, A.D. Standard Methods for the Examination of Water and Wastewater, 20th ed.; APHA American Public Health Association: Washington, DC, USA, 1998. [Google Scholar]
- Stewart, M.T. Evaluation of electromagnetic methods for rapid mapping of salt-water interfaces in coastal aquifers. Groundwater 1982, 20, 538–545. [Google Scholar] [CrossRef]
- Himi, M.; Tapias, J.C.; Benabdelouahab, S.; Salhi, A.; Rivero, L.; Elgettafi, M.; El Mandour, A.; Stitou, J.; Casas, A. Geophysical characterization of saltwater intrusion in a coastal aquifer: The case of Martil-Alila plain (North Morocco). J. Afr. Earth Sci. 2017, 126, 136–147. [Google Scholar] [CrossRef]
- Nenna, V.; Herckenrath, D.; Knight, R.; Odlum, N.; McPhee, D. Application and evaluation of electromagnetic methods for imaging saltwater intrusion in coastal aquifers: Seaside Groundwater Basin, California. Geophysics 2013, 78, B77–B88. [Google Scholar] [CrossRef]
- McNeill, J.D. Electromagnetic Terrain Conductivity Measurements at Low Induction Numbers; Technical Note TN-6; Geonics, Ltd.: Mississauga, ON, Canada, 1980. [Google Scholar]
- McNeill, J.D. EM34–3 Survey Interpretation Techniques; Technical Note TN-5; Geonics, Ltd.: Mississauga, ON, Canada, 1980. [Google Scholar]
- Archie, G.E. The electrical resistivity log as an aid to determining some reservoir characteristics. Trans. Am. Inst. Min. Metall. Eng. 1942, 146, 54–62. [Google Scholar] [CrossRef]
- Hill, H.; Milburn, J. Effect of clay and water salinity on electrochemical behavior of reservoir rocks. Trans. Am. Inst. Min. Metall. Eng. 1956, 207, 31–38. [Google Scholar] [CrossRef]
- Amini, H.; Ashrafzadeh, A.; Khaledian, M. Enhancing groundwater salinity estimation through integrated GMDH and geostatistical techniques to minimize Kriging interpolation error. Earth Sci. Inform. 2024, 17, 283–297. [Google Scholar] [CrossRef]
- Braaten, R.O.; Flaherty, M. Salt balances of inland shrimp ponds in Thailand: Implications for land and water salinization. Environ. Conserv. 2001, 28, 357–367. [Google Scholar] [CrossRef]
- Agbasi, J.C.; Abu, M.; Pande, C.B.; Uwajingba, H.C.; Abba, S.I.; Egbueri, J.C. Groundwater salinization in coastal regions and the control mechanisms: Insights for sustainable groundwater development and management. In Sustainable Groundwater and Environment: Challenges and Solutions; Springer Nature: Cham, Switzerland, 2025; pp. 165–191. [Google Scholar]
- Nagaraju, T.V.; Sri Bala, G.; Ramanjaneya Raju, E.; Shukla, S.K. Enhancing Sustainability of Inland Aquaculture Ponds Using Geosynthetics. In Inland Aquaculture Sustainability and Effective Water Management Strategies: Optimizing Resources for Environmental Harmony; Springer Nature: Cham, Switzerland, 2025; pp. 99–109. [Google Scholar]
- Tiwari, P.; Rupesh, R.; Sharma, S.P. Integrated geophysical characterization of saltwater intrusion: An insight into coastal aquifers of West Bengal, India. Near Surf. Geophys. 2025, 23, 343–364. [Google Scholar] [CrossRef]
- Ahmed, R. Eco-Friendly Shrimp Farming: Balancing Economic Growth and Environmental Sustainability in Agriculture. Int. J. Sci. Educ. Sci. 2025, 2, 61–68. [Google Scholar] [CrossRef]
- Tran, T.; Duong, D.V.; Le, T.D.; Loc, H.H.; Chau, L.T.; Le, L.T.; Bui, X.T. Promoting sustainable shrimp farming: Balancing environmental goals, awareness, and socio-cultural factors in the Mekong Delta aquaculture. Aquac. Int. 2025, 33, 119. [Google Scholar] [CrossRef]
- Woźniacka, K.; Bickley, L.K.; Heal, R.D.; Maclean, I.M.; Hasan, N.A.; Haque, M.M.; Stentiford, G.D.; Early, R.; Devlin, M.; Tyler, C.R. Seeking environmentally sustainable solutions for inland aquaculture in Bangladesh. Environ. Chall. 2025, 18, 101062. [Google Scholar] [CrossRef]


Disclaimer/Publisher’s Note: The statements, opinions and data contained in all publications are solely those of the individual author(s) and contributor(s) and not of MDPI and/or the editor(s). MDPI and/or the editor(s) disclaim responsibility for any injury to people or property resulting from any ideas, methods, instructions or products referred to in the content. |
© 2025 by the authors. Licensee MDPI, Basel, Switzerland. This article is an open access article distributed under the terms and conditions of the Creative Commons Attribution (CC BY) license (https://creativecommons.org/licenses/by/4.0/).