Abstract
Based on monitoring data from 2019 to 2024 at 270 typical surface drinking water sources (SDWS) in the Pearl River Basin (PRB), the occurrence and health risks of metal and metalloid pollutants (MMPs) were analyzed from a large watershed scale and long-term evolution. The results indicated that the overall pollution status of 8 MMPs (As, Cd, Pb, Mn, Sb, Ni, Ba, V) were at a low level and the concentrations of Cd, Pb, Ni, Ba, and V exhibited downward trends from 2019 to 2024. The distribution of MMPs exhibited significant regional differences with the main influencing factors including geological conditions, industrial activities, and urban development. River-type drinking water sources might be more affected by pollution from human activities such as industrial wastewater discharge, and the concentration levels of MMPs were generally higher than those in lake-type drinking water sources. Monte Carlo simulation revealed that 33.08% and 12.90% of total carcinogenic risks (TCR) exceeded the threshold of 10−6 for adults and children, respectively. Ba and Ni were the main contributors to the TCR, while As posed a certain non-carcinogenic risk to children. Sensitivity analysis indicated that concentrations of As and Ba were the main factors contributing to health risks. Although highly stringent water pollution control and a water resource protection policy have been implemented, it is still suggested to strengthen the control of As, Ba, and Ni in industrial-intensive areas and river-type water sources in the PRB.
1. Introduction
Metal and metalloid contamination in surface water bodies, in particular, remains one of the critical environmental challenges [1,2,3]. Metal and metalloid pollutants (MMPs) not only severely impact water quality but also pose potential threats to ecosystems and human health [4,5]. These contaminants exhibit persistent environmental characteristics, including acute biotoxicity and bioaccumulative potential [6,7], and can readily enter organisms through water sources, causing long-term health hazards [4,8]. The toxicological effects of MMPs manifest as damage to human nervous, hepatic, renal, and immune systems [6,9], even increasing cancer risks. For instance, Pb contamination may induce neurological impairment [6,10], particularly affecting children’s intellectual development, while Cd is associated with renal dysfunction and osteoporosis [6,11]. Arsenic and nickel have been categorized by the International Agency for Research on Cancer (IARC) as Grade 1 carcinogens. Additionally, when MMPs accumulate biologically within aquatic organisms, they potentially magnify threats to human well-being through trophic transfer across food webs [12,13,14].
The Pearl River Basin (PRB) extends across multiple Chinese administrative regions including Yunnan, Guizhou, Guangxi, Guangdong, Hunan, Jiangxi, and Fujian provinces, while also encompassing both Hong Kong and Macao Special Administrative Regions. This basin’s hydrological system is ecologically integrated with the Pearl River Delta ecosystem and serves as a crucial drinking water source for the south of China. However, industrial and agricultural intensification and high population density in certain areas of the PRB have resulted in varying degrees of metal and metalloid contamination in surface water bodies and drinking water sources [15,16,17]. The Beijiang River Basin, downstream of the PRB where concentrated metal processing industries are located, experienced Pb and Cd contamination events [18,19]. Industrial clusters in the northern part of Guangdong Province caused severe metal and metalloid pollution in adjacent constructed wetlands [20]. Currently, studies on MMPs in surface drinking water sources (SDWS) from a large watershed scale are still lacking. Studies indicated that the main source of MMPs in the water of the Pearl River Delta estuary in southern Guangzhou is various industrial wastewater from upstream areas [21,22]. Metal and metalloid pollution may originate from various sources, including industrial emissions, agricultural fertilization, and landfill of urban waste.
Although there have been extensive studies on metal and metalloid pollution in rivers and lakes, most existing studies have focused on the occurrence characteristics of MMPs in surface water or sediments of water body in specific areas [23,24]. Long-term monitoring of MMPs in the water environment of the PRB has not been systematically studied. Moreover, the pollution level and human health risk in SDWS of the PRB are still unknown. Therefore, this study selected eight typical MMPs (As, Cd, Pb, Mn, Sb, Ni, Ba, V) and systematically analyzed the pollution level and spatio-temporal distribution of these contaminants in SDWS of the PRB. Moreover, human health risk evaluations were conducted to establish a scientific foundation for MMPs regulation and health hazard management strategies within drinking water supplies.
2. Materials and Methods
2.1. Study Area
The PRB incorporates the Pearl River main flow (predominantly the Xijiang River) alongside its tributary systems, encompassing the Beijiang, Dongjiang, Liujiang, and Ganjiang watercourses. For analytical purposes, we segmented the PRB into three distinct zones based on hydrological flow patterns: upper, middle, and lower reaches. The upper segment primarily traverses Yunnan and Guizhou Provinces, while the middle section flows through Guangxi, and the lower portion runs within Guangdong. Our investigation examined 270 surface drinking water sources (SDWS), comprising 142 river-type and 128 lake-type water source locations. Figure 1 depicts both the geographical research domains and the spatial distribution of SDWS.
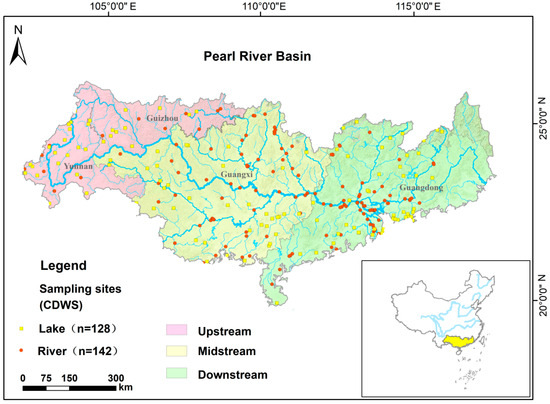
Figure 1.
Distribution of surface drinking water sources (SDWS) in the Pearl River Basin.
2.2. Data Sources
This investigation leveraged datasets from the Ministry of Ecology and Environment of China, gathered in meticulous adherence to the Technical Specifications for Surface Water Environmental Quality Monitoring (HJ/T 91-2022) guidelines [25]. Both water collection procedures and subsequent laboratory analyses followed stringent standardized methodologies to maximize data precision and ensure measurement consistency. The dataset comprises monthly monitoring records from 2019 to 2024 for all 270 SDWS, including eight typical MMPs (As, Cd, Pb, Mn, Sb, Ni, Ba, V) and six conventional parameters (CODMn, NH3-N, TP, SO42−, NO3−, Cl−). Annual averages were calculated from 12 monthly measurements to minimize seasonal variability. The carcinogenic grade and water quality standards of eight MMPs can be found in Table S1 of the Supporting Materials. The analytical methods and limits of detection for eight MMPs and six water chemical parameters are listed in Tables S2 and S3. The information on data quality assurance and quality control can be seen in Text S1.
2.3. Assessment of MMP Pollution Levels
The pollution levels of MMPs in SDWS were evaluated using the Heavy Metal Pollution Index (HPI) (Equation (1)), the Nemerow Index (NI) (Equation (2)), and the Contamination Degree (CD) (Equation (3)). The classification criteria for these indices were established based on methodologies from previous studies [26,27,28], which can be found in Table S4 of the Supporting Materials.
where Mi represents the measured concentration of each specific metal/metalloid within the analyzed sample, Si denotes the regulatory threshold concentration for that particular metal/metalloid in surface drinking water sources as stipulated by the Environmental Quality Standards for Surface Water (GB 3838-2002) [29], and n signifies the total quantity of distinct metal and metalloid species evaluated in this investigation.
2.4. Method of Health Risk Assessment
This investigation utilized the US EPA’s health risk assessment methodology as a quantitative framework for examining connections between hazardous compounds and human well-being. We implemented Monte Carlo simulations to determine non-carcinogenic hazards (expressed as hazard quotient, HQ) and carcinogenic risks (CR) from MMPs through consumption or skin exposure across diverse demographic segments [30,31]. The HQ represents the dimensionless risk ratio for water absorption via ingestion or dermal routes, while THI denotes the total hazard index (also dimensionless), encompassing the collective non-carcinogenic risk from all MMPs. When HQ or THI exceeds 1, potential adverse health impacts may emerge; conversely, values below 1 indicate absence of detrimental health effects [32]. CR quantifies the carcinogenic risk probability assuming sustained exposure to chemical contaminants, whereas TCR encompasses the aggregate carcinogenic risk from all MMPs. Remedial action generally becomes necessary when cumulative carcinogenic risk surpasses 10−4. For scenarios where baseline cancer risk falls within 10−6 to 10−4, intervention decisions require site-specific evaluation. Typically, risk-based preliminary remediation targets become unnecessary for substances exhibiting cumulative cancer risk below 10−6.
We quantified HQ values for adults and children through water consumption (HQingestion) and cutaneous absorption (HQdermal):
The CR for MMPs via ingestion and dermal absorption of surface water by residents was calculated using Equations (7)–(9):
In these equations, Measured Environmental Concentration (MEC) signifies individual pollutant concentrations in water (µg/L); Ingestion Rate (IR) reflects daily water consumption volume (L/day); EF quantifies yearly exposure frequency (days/year); ED represents exposure duration (years); ABS indicates the dimensionless gastrointestinal absorption coefficient; BW denotes average body mass (kg); AT represents average exposure duration (days); SA measures potentially exposed skin surface area (cm2); KP indicates metal dermal permeability coefficient (cm/hour); ET quantifies exposure duration (h/event); CF represents the conversion factor (cm3). RfD denotes pollutant reference dose, while SF indicates slope factor. Table 1 compiles all parameters employed in our health risk assessment model [33,34].

Table 1.
Parameters of influencing factors in the health risk assessment model and best-fit distribution model for target pollutant concentrations.
2.5. Data Analysis
The spatial distribution of water sources and contaminants was mapped using the geographic information system ArcGIS (ESRI ArcGIS v10.3). Monte Carlo simulations were performed with Oracle Crystal Ball® (v11.1.2.4) to predict human carcinogenic and non-carcinogenic risk values (10,000 iterations). An integrated approach combining ArcGIS and statistical data analysis was employed to evaluate MMP concentration levels by comparing monthly monitoring data across different regions and time points. Mann–Whitney U test was performed by SPSS (IBM SPSS statistics 26.0).
3. Analysis and Discussion
3.1. Water Chemical Parameters
The statistical results of basic water quality indicators (CODMn, NH3-N, TP, SO42−, NO3−, Cl−) are shown in Figure 2. Compared with 2019, NH3-N concentrations showed a significant downward trend from 2020 to 2024 (p < 0.001, Figure 2b), while Cl− showed an upward trend (Figure 2f). The NH3-N concentration (mean value ± standard deviation) decreased from 0.159 ± 0.154 mg/L (2019) to 0.103 ± 0.112 mg/L (2024), while Cl− increased from 5.123 ± 12.134 mg/L to 7.099 ± 11.26 mg/L. Additionally, concentrations of CODMn (1.74–1.82 mg/L), TP (0.033–0.039 mg/L), SO42− (11–13 mg/L), and NO3− (0.85–0.90 mg/L) showed minimal inter-annual variations (Figure 2a,c–e), remaining relatively stable. The decline in NH3-N concentration indicates effective control of urban sewage emissions [35,36].
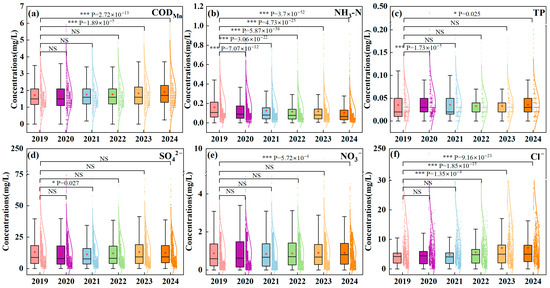
Figure 2.
Evolution trends of annual concentration levels of CODMn (a), NH3-N (b), TP (c), SO42− (d), NO3− (e), and Cl− (f) from 2019 to 2024 (NS indicates no significance, * indicates p < 0.05, and *** indicates p < 0.001).
3.2. Overall Pollution Level of MMPs
Table 2 presents the concentration statistics of the MMPs detected in SDWS of the PRB. Overall, the detection rates of these target contaminants ranged from 61% to 82%. Two or more MMPs were detectable in water samples, and the three MMPs with the highest mean concentrations were Ba (15.55 μg/L), Mn (7.43 μg/L), and V (1.32 μg/L). Additionally, the three MMPs with the highest coefficient of variation were Cd (329.48%), Pb (249.64%), and Mn (167.70%). Although Cd had the lowest detected concentration, it had the maximum coefficient of variation, which indicates the most dispersed concentration distribution and significant spatio-temporal heterogeneity. It is suggested that Cd in drinking water sources may be strongly influenced by human activities. Comparing with China’s Surface Water Environmental Quality Standards [29], none of the MMPs exceeded the limit concentrations for drinking water sources. However, the maximum concentrations of As and V exceeded the Standards for Drinking Water Quality of China and the Guidelines for Drinking-Water Quality of the World Health Organization (Table S1).

Table 2.
Concentration statistics of metal and metal-like pollutants (MMPs) in SDWS of the Pearl River Basin.
A recent large-scale survey of heavy metals in Chinese surface waters [37] found that the concentrations of Ba (mean = 30.60 μg/L) and As (mean = 1.74 μg/L) were higher than those in this study. Compared with SDWS in the Yangtze River and Yellow River Basins of China [38,39], the concentrations of the eight MMPs were at the same levels or lower in the PRB. A long-term study on the Freiberger Mulde river in Germany showed that the concentrations of Mn (mean = 74.27 µg/L) and Cd (mean = 2.98 µg/L) were higher than those in this study, and the concentrations of Mn and Cd in this study are also lower than the world river average [37].
HPI, NI, and CD indices were employed for comprehensive assessment of MMP contamination levels in SDWS (Table 3). The HPI values exhibited a range from 1.37 × 10⁻⁶ to 87.08, yielding an average measurement of 3.95. Based on established HPI classification parameters, 14,897 samples (constituting 94.87% of the total) demonstrated low heavy metal contamination, 746 samples (representing 4.75%) displayed moderate contamination levels, while only 18 samples (comprising 0.38%) manifested relatively high contamination profiles. The NI metric ranged from 3.75 × 10⁻⁶ to 1.28, with a calculated mean value of 0.12, wherein over 99% source samples registered low contamination classifications (NI < 1). Furthermore, the CD index spanned from 5.0 × 10⁻⁶ to 5.20, averaging 0.25 across all measurements. Every drinking water source sample analyzed fell within the low pollution category (CD < 6.00). From a comparative perspective, both CD and NI methodologies produced concordant assessment outcomes among the three pollution evaluation frameworks implemented in this study. The average HPI was significantly lower than the critical value of 100.00, indicating acceptable levels of contamination. Sb and Cd have relatively larger contribution to HPI among the eight MMPs.

Table 3.
Statistics of pollution level index of MMPs (unit-less).
3.3. Temporal Variations in MMPs
From 2019 to 2024, the majority of eight MMPs displayed a decreasing trend in concentration level (Figure 3 and Figure S1). Specifically, the average concentration of Cd exhibited a continuous decrease from 0.086 ± 0.34 μg/L in 2019 to 0.030 ± 0.038 μg/L in 2024. The concentration of V showed a steady decline from 1.772 ± 3.417 μg/L in 2019 to 1.038 ± 1.336 μg/L in 2023, followed by a slight increase to 1.131 ± 1.617 μg/L in 2024. The concentration of Pb initially rose and then decreased, starting at 0.583 ± 1.279 μg/L in 2019, peaking at 0.673 ± 1.509 μg/L in 2021, and subsequently dropping to 0.213 ± 0.434 μg/L in 2024. Meanwhile, the concentration levels of Ni and Ba also decreased during the six years. The median and average concentrations of As, Mn, and Sb fluctuated slightly from 2019 to 2024, but remained relatively stable overall. Recent studies also reported that the Yangtze River and Yellow River Basins have experienced evident decrease in heavy metals content in SDWS over the past few years [38,39]. This can be attributed to the implementation of highly stringent water pollution control and water resource protection in China since 2015.
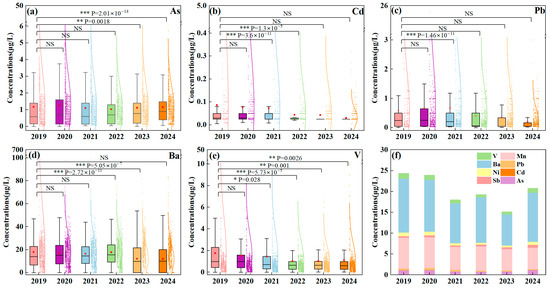
Figure 3.
Evolution trends of annual concentration levels of As (a), Cd (b), Pb (c), Ba (d), V (e), and distribution of MMPs (f) in SDWS of the Pearl River Basin from 2019 to 2024 (NS indicates no significance, * indicates p < 0.05, ** indicates p < 0.01, and *** indicates p < 0.001).
3.4. Spatial Distribution of MMPs
Figure 4 illustrates the concentration distribution of the eight MMPs in SDWS across the PRB. The metalloid As was mainly distributed in the lower reach of the PRB, particularly in the Beijiang River and its vicinity, potentially originating from industrial waste residues or wastewater discharged by sectors like smelting, dyeing, and tanning [40,41,42]. Ba and Sb were predominantly found in the central regions of the PRB, encompassing Guangxi Province and the downstream Pearl River Delta. Cd was more prevalent in Gejiu (Yunnan Province), southwestern Guizhou Province, and northern Guangdong Province. Ni was primarily concentrated in the downstream Pearl River Delta and southwestern Guangdong Province, while Pb exhibited higher levels in the upper reach of the PRB, as well as in northern and southwestern Guangdong Province. The presence of Sb, Cd, Ni, and Pb may be linked to emissions from mining, electroplating, and smelting industries, whereas Cd and Pb levels could also be influenced by the application of fertilizers and pesticides [43,44]. The metalloid V had broad distribution throughout the PRB, while Mn was primarily found in downstream areas and eastern Guangdong Province. Metal and metalloid levels in drinking water sources were notably elevated in the lower reach of the PRB, showing considerable regional disparities.

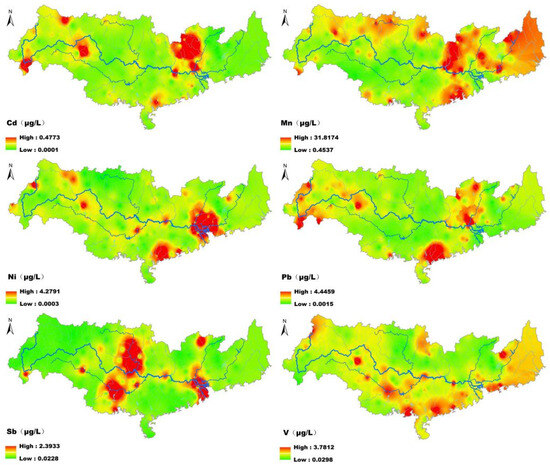
Figure 4.
Spatial distribution of average concentrations of MMPs in SDWS of the Pearl River Basin.
Major sources of MMPs in water environment comprised natural geological attributes, local industrial operations, and urban expansion. Among them, natural geological attributes refer to the weathering and dissolution of rock minerals and sediments, industrial operations result in the discharge of wastewater and waste from industries such as mining, metallurgy, chemical engineering, and electronics, while urban expansion contributes to the discharge of urban sewage and agricultural runoff. Climate and geochemical factors can affect the form and concentration of MMPs in water, including water temperature, pH, dissolved oxygen, redox potential, coexisting ions and adsorption, natural organic matter, etc. The MMPs in drinking water sources may be influenced by one or more of these factors, resulting in differences in the distribution of high concentration areas. These factors are very complex, but in general, the overall concentration level of MMPs is relatively high due to the denser population and industrial distribution in the lower reaches of the PRB.
Figure 5 displays the concentration distributions of the eight MMPs in river-type and lake-type SDWS in the PRB. The results of the Mann–Whitney U test show a significant difference in distribution of data between the two types of SDWS (p < 0.05, Table S5). The findings indicate that the concentration levels of As, Sb, Ni, and Ba were typically elevated in river-type water sources compared to lake-type sources, as evidenced by their ranges, medians, and means. Pb, V, and Mn also showed higher median and average concentrations in river-type SDWS.
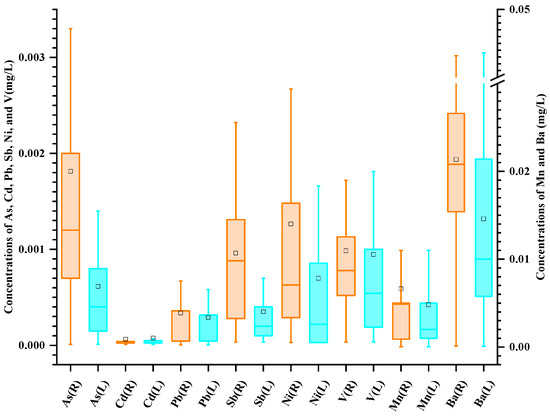
Figure 5.
Concentrations of MMPs in river-type and lake-type SDWS of the Pearl River Basin. (R represents river-type SDWS and L represents lake-type SDWS).
This disparity implied that river-type SDWS were more vulnerable to human-induced pollution, like industrial effluent discharge [45], while the presence of MMPs in lake-type SDWS was predominantly linked to natural background factors or internal sediment release [46,47]. River-type SDWS is a relatively open system influenced by more sewage outlets and agricultural non-point sources from the upstream. The MMPs in lake-type SDWS may mainly come from natural geochemical processes. For example, lakes in enriched areas of manganese deposits, black shale, and apatite have higher natural background concentrations of Mn and V. Their distribution ratios in water and sediment are more susceptible to factors such as temperature, dissolved oxygen, pH, etc. The climate and hydrology changes in recent years may intensify the impact of these factors in lake-type SDWS. These could explain the significant difference in the distribution of concentration data between the two types of SDWS.
3.5. Health Risk Assessment
This study assessed the health risks associated with the eight MMPs present in drinking water sources within the PRB. The evaluation included the calculation of hazard quotient (HQ), total hazard index (THI), and carcinogenic risk (CR). Utilizing the health risk assessment model endorsed by the US EPA, both carcinogenic and non-carcinogenic risks posed by the identified pollutants were determined for different populations (adults and children) through ingestion and dermal exposure pathways. Considering that the conventional water purification process of waterworks had very limited removal efficiency (less than 10%) for the eight MMPs, this study directly used the concentration of metals and metalloids in the drinking source water for health risk assessment.
3.5.1. Non-Carcinogenic Risk
Monte Carlo simulations generated HQ and CR values for the target pollutants (Table 4 and Table 5). Analysis revealed that HQ values for the eight MMPs followed this hierarchical sequence: As > Sb > Cd > Mn > V > Pb > Ba > Ni. When HQ measurements register below 1.0, this signifies absence of potential non-carcinogenic human health hazards [48,49]. The 95th percentile threshold typically serves as the benchmark for determining whether pollutant health risks exceed regulatory standards [48,50]. Our investigation determined that adult mean HQ values through oral consumption and cutaneous exposure were 8.06 × 10⁻² and 1.74 × 10⁻⁴ respectively, while corresponding mean HQ values for pediatric subjects via ingestion and dermal pathways measured 0.26 and 4.04 × 10⁻⁴ respectively. Consequently, dermal contact HQ values consistently registered lower than ingestion-related measurements, thus contributing proportionally less to the overall THI calculations across both demographic categories.

Table 4.
Statistical data of the HQ and CR to adults and children via ingestion of MMPs based on Monte Carlo simulation.

Table 5.
Statistical data of the HQ and CR to adults and children via dermal exposure to MMPs based on Monte Carlo simulation.
This suggests that oral ingestion is the primary pathway for adverse effects and non-carcinogenic risks to humans when surface water is used as a drinking water source [51,52]. It also indicates differences in non-carcinogenic risks among different populations, with children exhibiting slightly higher HQ values than adults for both oral ingestion and dermal contact, which is consistent with previous studies [53,54,55,56,57].
In Figure 6, the HQ values of the MMPs, except for As, in the PRB remain within safe limits. The red shaded region in the diagram signifies an unacceptable risk level. It can be observed that the 95th percentile ranges of the HI for adults and children were 2.66 × 10⁻³ to 0.21 and 8.63 × 10⁻³ to 0.71, respectively. About 1.14% of children had THI values surpassing the acceptable threshold of 1.0, mainly due to the HQingestion-As component, with 0.54% of children exceeding the 1.0 threshold for HQingestion-As. Conversely, the 95th percentiles of the remaining seven MMPs ranged from 10−4 to 10−1, contributing minimally to the THI. In summary, the metalloid As emerges as the primary factor causing potential non-carcinogenic risk in SDWS within the PRB.
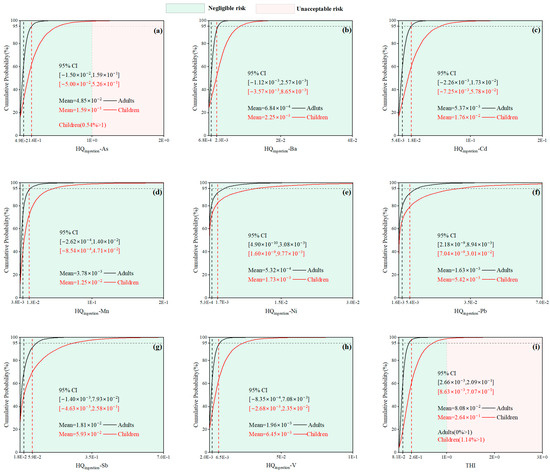
Figure 6.
Non-carcinogenic risks of As (a), Ba (b), Cd (c), Mn (d), Ni (e), Pb (f), Sb (g), V (h), and THI (i) in adults and children by oral route ingestion.
3.5.2. Carcinogenic Risk
Among the selected target pollutants, the metal Mn is not listed as a carcinogen by the IARC. Therefore, this study calculated the carcinogenic risks of the other seven MMPs. As shown in Table 4 and Table 5, the calculated CRingestion values for adults and children ranged from −7.59 × 10⁻⁴ to 1.65 × 10⁻³ and −3.54 × 10⁻⁴ to 6.12 × 10⁻⁴, respectively, while the CRdermal values ranged from −1.63 × 10⁻⁶ to 2.86 × 10⁻⁶ and −5.20 × 10⁻⁷ to 1.19 × 10⁻⁶, respectively. According to the US EPA classification of CR, a threshold of 10−6 is generally considered negligible [48]. Since the CR values for both adults and children via dermal exposure did not exceed 10−6, the carcinogenic risk posed by dermal exposure to the local population was negligible.
Figure 7 presents the cumulative frequency curves of CR for seven orally ingested MMPs, with the blue shaded area indicating the warning risk zone. The CR values of these seven MMPs were ranked in descending order as Ba > Ni > As > V > Sb > Cd > Pb. The mean CR values for both Cd and Pb fell below the threshold, indicating that their carcinogenic risks to the local population were negligible. As shown in Figure 7, 33.08% of adults and 12.90% of children exhibited TCR values exceeding the risk threshold (10−6). Ba and Ni were the primary contributors to TCR exceeding the risk threshold, with Ba making the most significant contribution. The selected pollutants consistently demonstrated higher carcinogenic risks in adults than in children, likely due to adults’ longer exposure duration. In summary, the MMPs in drinking water sources of the PRB posed potential carcinogenic risks. Unlike non-carcinogenic risk outcomes, adults represented a more sensitive population group.
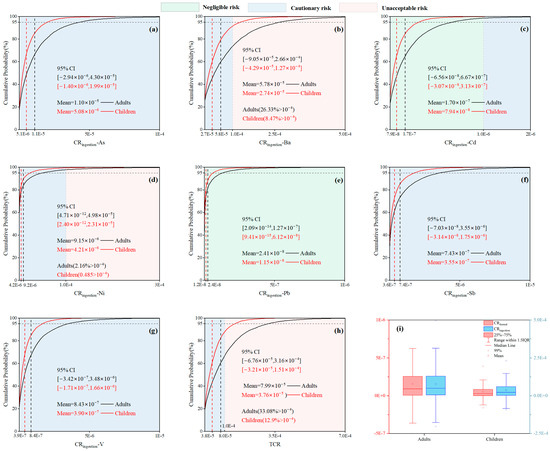
Figure 7.
Carcinogenic risks of As (a), Ba (b), Cd (c), Ni (d), Pb (e), Sb (f), V (g), and TCR (h) in adults and children by oral route intake, and comparison of carcinogenic risks by oral and dermal routes in adults and children (i).
3.5.3. Sensitivity Analysis
A comprehensive sensitivity analysis was implemented to clarify the relative contributions of various exposure routes and parameter fluctuations toward uncertainty quantification in aggregate carcinogenic and non-carcinogenic risk assessments. Examination of the non-carcinogenic risk evaluation outcomes identified the metalloid arsenic as the predominant contributor to observed health hazards. Consequently, our sensitivity investigation specifically focused on arsenic concentration variability alongside other pertinent parameters, excluding factors with minimal influence on overall risk characterization.
It is depicted in Figure 8a,b that the parameter sensitivity concerning HQ risks through dermal and ingestion pathways showed consistent patterns. Notably, all parameters, with the exception of body weight (BW), present positive contribution rates. The concentration of As stood out with the highest contribution rate, exceeding 90% across different pathways, particularly affecting adults. In the dermal pathway, exposure time (ET) emerged as another critical factor in non-carcinogenic risk assessment, contributing 26% for both adults and children. In the oral ingestion pathway, ingestion rate (IR) and exposure frequency (EF) exhibited positive correlations with health risks. Conversely, BW demonstrated negative contribution rates across different demographic groups. Despite the relatively small and negligible contribution values, it is essential to note that BW had a more pronounced impact on children, consistent with prior research [58,59]. Figure 8c,d illustrate the parameter sensitivity regarding TCR through dermal and ingestion pathways, considering all target pollutant concentrations and parameters.
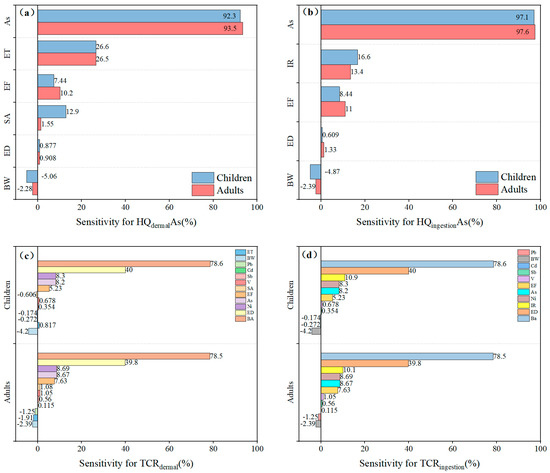
Figure 8.
Contributions of input variables to non-carcinogenic versus carcinogenic risk in adults and children. (a) sensitivity concerning HQ risk of As through dermal pathway, (b) sensitivity concerning HQ risk of As through ingestion pathway, (c) sensitivity concerning TCR risk through dermal pathway, (d) sensitivity concerning TCR risk through ingestion pathway.
Among these two pathways, the concentration of Ba contributed approximately 78.5% to the positive effect on TCR. ED was another major sensitive factor in health risk assessment, showing a positive correlation with TCR (39.8–40.0%). The TCR of MMPs accumulated with prolonged exposure duration. Although BW exhibited a negative correlation in both adult and child populations, its influence was minimal, which aligned with the findings of non-carcinogenic risk analysis. In summary, pollutant concentration was the most sensitive factor in the health risk assessment of MMPs, with As and Ba being the primary contributors to the sensitivity analysis of HQ and CR.
4. Conclusions
This study systematically examined the pollution characteristics and associated health risks of metal and metalloid pollutants (MMPs) in surface drinking water sources (SDWS) in the Pearl River Basin (PRB) from 2019 to 2024. The findings revealed that the overall water quality within the research area remained stable and satisfactory. Concentrations of eight specified pollutants (As, Cd, Pb, Mn, Sb, Ni, Ba, V) were all found to meet water quality standards for SDWS. Furthermore, the concentrations of Cd, Pb, Ni, Ba, and V displayed a decreasing trend annually, indicating that the current levels of MMPs in SDWS of the PRB are generally managed effectively. Notably, MMPs exhibited notable regional disparities, with downstream and river-type water sources in the PRB experiencing more pronounced impacts from human activities such as industrial operations and urban expansion. Oral ingestion was identified as the primary pathway for adverse health effects and non-carcinogenic risks posed by MMPs, with As posing a certain non-carcinogenic risk to children. For adults and children, 33.08% and 12.90% of the total carcinogenic risks (TCR), respectively, exceeded the risk threshold of 10−6, which indicated potential carcinogenic risk of MMPs to human heath. Ba and Ni were the major contributors to carcinogenic risk, among which Ba exhibited the highest contribution rate. The carcinogenic risk of MMPs was higher for adults than for children. Sensitivity analysis further confirmed that the concentration of As derived non-carcinogenic risk; while the concentration of Ba influenced carcinogenic risk. Subsequent research is recommended to enhance dynamic monitoring in industrial-intensive areas and river-type drinking water sources. Pollution control strategies need optimizing for high-risk factors of As, Ba, and Ni, including stricter discharge rules of wastewater and ecological restoration of mine tailings. Meanwhile, early warning capabilities for health risks and water purification technology should be improved to ensure drinking water safety.
Supplementary Materials
The following supporting information can be downloaded at https://www.mdpi.com/article/10.3390/w17192873/s1, Figure S1: Annual concentration levels of Mn, Ni, and Sb in SDWS of Pearl River Basin; Table S1: The standards of water quality for 8 MMPs; Table S2: The analytical methods and limits of detection for 8 MMPs; Table S3: Standards of chemical parameters for surface water in China and their analytical methods; Table S4: Ranking criteria of pollution level; Table S5: Results of Mann-Whitney U test between river and lake sources; Text S1: Data quality assurance and quality control.
Author Contributions
Methodology, Y.Z., S.H. and K.Z.; Software, Y.H.; Validation, Y.H.; Formal analysis, Y.H. and Y.Y.; Data curation, Y.H. and Y.Y.; Writing—original draft, B.L. and S.H.; Writing—review & editing, Y.H., S.H. and S.C.; Supervision, X.T.; Funding acquisition, Q.F. All authors have read and agreed to the published version of the manuscript.
Funding
This work was funded by the Open Research Fund of State Environmental Protection Key Laboratory of Drinking Water Source Protection (No. 2024YYSYKFYB04), the Fundamental Research Funds for the Central Public-interest Scientific Institution (No. 2024YSKY-02).
Data Availability Statement
The original contributions presented in this study are included in the article/Supplementary Materials. Further inquiries can be directed to the corresponding author.
Acknowledgments
We appreciate the support in original data collection provided by the China National Environ-mental Monitoring Centre.
Conflicts of Interest
The authors declare no conflicts of interest.
References
- Kumar, A.; Kumar, V.; Pandita, S.; Singh, S.; Bhardwaj, R.; Varol, M.; Rodrigo-Comino, J. A global meta-analysis of toxic metals in continental surface water bodies. J. Environ. Chem. Eng. 2023, 11, 109964. [Google Scholar] [CrossRef]
- Amin, S.; Muhammad, S.; Fatima, H. Evaluation and risks assessment of potentially toxic elements in water and sediment of the Dor River and its tributaries, Northern Pakistan. Environ. Technol. Innov. 2021, 21, 101333. [Google Scholar] [CrossRef]
- Giri, S. Water quality prospective in Twenty First Century: Status of water quality in major river basins, contemporary strategies and impediments: A review. Environ. Pollut. 2021, 271, 116332. [Google Scholar] [CrossRef] [PubMed]
- Haque, M.A.; Khatun, B.; Jewel, M.A.S.; Ara, J.; Islam Kazal, M.S.; Hasan, J. Assessment of water quality and heavy metal indices in a tropical freshwater river for aquatic life and public health standard. Ecol. Indic. 2024, 169, 112862. [Google Scholar] [CrossRef]
- Fulke, A.B.; Ratanpal, S.; Sonker, S. Understanding heavy metal toxicity: Implications on human health, marine ecosystems and bioremediation strategies. Mar. Pollut. Bull. 2024, 206, 116707. [Google Scholar] [CrossRef]
- Mitra, S.; Chakraborty, A.J.; Tareq, A.M.; Emran, T.B.; Nainu, F.; Khusro, A.; Idris, A.M.; Khandaker, M.U.; Osman, H.; Alhumaydhi, F.A.; et al. Impact of heavy metals on the environment and human health: Novel therapeutic insights to counter the toxicity. J. King Saud Univ. Sci. 2022, 34, 101865. [Google Scholar] [CrossRef]
- Ustaoğlu, F.; Islam, M.S. Potential toxic elements in sediment of some rivers at Giresun, Northeast Turkey: A preliminary assessment for ecotoxicological status and health risk. Ecol. Indic. 2020, 113, 106237. [Google Scholar] [CrossRef]
- Yilmaz, A.B. Levels of heavy metals (Fe, Cu, Ni, Cr, Pb, and Zn) in tissue of Mugil cephalus and Trachurus mediterraneus from Iskenderun Bay, Turkey. Environ. Res. 2003, 92, 277–281. [Google Scholar] [CrossRef]
- Xu, X.; Luo, P.; Li, S.; Zhang, Q.; Sun, D. Distributions of Heavy Metals in Rice and Corn and Their Health Risk Assessment in Guizhou Province. Bull. Environ. Contam. Toxicol. 2022, 108, 926–935. [Google Scholar] [CrossRef]
- Balali-Mood, M.; Naseri, K.; Tahergorabi, Z.; Khazdair, M.R.; Sadeghi, M. Toxic Mechanisms of Five Heavy Metals: Mercury, Lead, Chromium, Cadmium, and Arsenic. Front. Pharmacol. 2021, 12, 643972. [Google Scholar] [CrossRef]
- Meng, F.; Liu, D.; Bu, T.; Zhang, M.; Peng, J.; Ma, J. Assessment of pollution and health risks from exposure to heavy metals in soil, wheat grains, drinking water, and atmospheric particulate matter. J. Environ. Manag. 2025, 376, 124448. [Google Scholar] [CrossRef]
- Asefa, E.M.; Damtew, Y.T.; Mengistu, D.A.; Tolera, S.T.; Dugasa, F.F.; Berhanu, A.; Enoe, J.; Ober, J.; Teklu, B.M.; Weldemariam, E.D. Heavy metals in Ethiopian drinking water and public health risks: Insights from nationwide and regional analysis. Sci. Total Environ. 2024, 947, 174527. [Google Scholar] [CrossRef]
- Meng, T.; Wang, C.; Florkowski, W.J.; Yang, Z. Determinants of urban consumer expenditure on aquatic products in Shanghai, China. Aquac. Econ. Manag. 2023, 27, 1–24. [Google Scholar] [CrossRef]
- Sharma, M.K.; Jain, C.K.; Singhal, D.C.; Choubey, V.K. Kinetics of sorption of lead on bed sediments of River Hindon, India. Environ. Monit. Assess. 2008, 157, 11–21. [Google Scholar] [CrossRef]
- Zheng, B.; Huang, G.; Liu, L.; Zhai, M.; Guan, Y. Metabolism of urban wastewater: Ecological network analysis for Guangdong Province, China. J. Clean. Prod. 2019, 217, 510–519. [Google Scholar] [CrossRef]
- Wu, W.; Qu, S.; Nel, W.; Ji, J. The impact of natural weathering and mining on heavy metal accumulation in the karst areas of the Pearl River Basin, China. Sci. Total Environ. 2020, 734, 139480. [Google Scholar] [CrossRef] [PubMed]
- Zhen, G.; Li, Y.; Tong, Y.; Yang, L.; Zhu, Y.; Zhang, W. Temporal variation and regional transfer of heavy metals in the Pearl (Zhujiang) River, China. Environ. Sci. Pollut. Res. 2016, 23, 8410–8420. [Google Scholar] [CrossRef] [PubMed]
- Jiang, A.; Gong, L.; Ding, H.; Wang, M. Cancer Mortality and Long-Term Environmental Exposure of Cadmium in Contaminated Community Based on a Third Retrospective Cause of Death Investigation of Residents Living in the Guangdong Province from 2004 to 2005. Biol. Trace Elem. Res. 2021, 199, 4504–4515. [Google Scholar] [CrossRef] [PubMed]
- Wang, L.; Wang, X.; Chen, H.; Wang, Z.; Jia, X. Oyster arsenic, cadmium, copper, mercury, lead and zinc levels in the northern South China Sea: Long-term spatiotemporal distributions, combined effects, and risk assessment to human health. Environ. Sci. Pollut. Res. 2022, 29, 12706–12719. [Google Scholar] [CrossRef]
- Leung, H.M.; Duzgoren-Aydin, N.S.; Au, C.K.; Krupanidhi, S.; Fung, K.Y.; Cheung, K.C.; Wong, Y.K.; Peng, X.L.; Ye, Z.H.; Yung, K.K.L.; et al. Monitoring and assessment of heavy metal contamination in a constructed wetland in Shaoguan (Guangdong Province, China): Bioaccumulation of Pb, Zn, Cu and Cd in aquatic and terrestrial components. Environ. Sci. Pollut. Res. 2016, 24, 9079–9088. [Google Scholar] [CrossRef]
- Zhao, Y.; Wu, R.; Cui, J.; Gan, S.; Pan, J.; Guo, P. Improvement of water quality in the Pearl River Estuary, China: A long-term (2008–2017) case study of temporal-spatial variation, source identification and ecological risk of heavy metals in surface water of Guangzhou. Environ. Sci. Pollut. Res. 2020, 27, 21084–21097. [Google Scholar] [CrossRef] [PubMed]
- Geng, J.; Wang, Y.; Luo, H. Distribution, sources, and fluxes of heavy metals in the Pearl River Delta, South China. Mar. Pollut. Bull. 2015, 101, 914–921. [Google Scholar] [CrossRef] [PubMed]
- Lao, X.; Tam, N.F.Y.; He, H.; Su, X.; Zhong, M.; Wu, Q.; Liu, Y.; Huang, X.; Wei, L.; Liu, Y.; et al. Distribution Characteristics and Assessment of Heavy Metal Pollution in Sediments of Fengyuan River, Guangdong. Environ. Forensics 2025, 26, 236–248. [Google Scholar] [CrossRef]
- Cai, Y.; Han, Z.; Lu, H.; Zhao, R.; Wen, M.; Liu, H.; Zhang, B. Spatial-temporal variation, source apportionment and risk assessment of lead in surface river sediments over ~20 years of rapid industrialisation in the Pearl River Basin, China. J. Hazard. Mater. 2024, 464, 132981. [Google Scholar] [CrossRef]
- HJ 91.2-2022; Technical Specifications for Surface Water Environmental Quality Monitoring. Ministry of Ecology and Environment of China: Beijing, China, 2022.
- Sheng, D.; Meng, X.; Wen, X.; Wu, J.; Yu, H.; Wu, M. Contamination characteristics, source identification, and source-specific health risks of heavy metal(loid)s in groundwater of an arid oasis region in Northwest China. Sci. Total Environ. 2022, 841, 156733. [Google Scholar] [CrossRef]
- Tao, H.; Al-Hilali, A.A.; Ahmed, A.M.; Mussa, Z.H.; Falah, M.W.; Abed, S.A.; Deo, R.; Jawad, A.H.; Abdul Maulud, K.N.; Latif, M.T.; et al. Statistical and spatial analysis for soil heavy metals over the Murray-Darling river basin in Australia. Chemosphere 2023, 317, 137914. [Google Scholar] [CrossRef]
- Yuan, Z.; Li, Q.; Ma, X.; Han, M. Assessment of heavy metals contamination and water quality characterization in the Nanming River, Guizhou Province. Environ. Geochem. Health 2020, 43, 1273–1286. [Google Scholar] [CrossRef]
- GB 3838-2002; Environmental Quality Standards for Surface Water. Ministry of Ecology and Environment of China: Beijing, China, 2002.
- Ariyan, T.N.; Quraishi, S.B.; Nur E Alam, M.; Khan, M.S.R.; Faria, F.F.; Kabir, A. Comprehensive analysis and human health risk assessment of tap water quality in Dhaka City, Bangladesh: Integrating source identification, index-based evaluation, and heavy metal assessment. J. Hazard. Mater. 2025, 485, 136837. [Google Scholar] [CrossRef]
- Zhang, K.; Chang, S.; Zhang, Q.; Bai, Y.; Wang, E.; Zhang, M.; Fu, Q.; Wei, L.; Yu, Y. Heavy metals in influent and effluent from 146 drinking water treatment plants across China: Occurrence, explanatory factors, probabilistic health risk, and removal efficiency. J. Hazard. Mater. 2023, 450, 131003. [Google Scholar] [CrossRef]
- Eid, M.H.; Tamma, A.A.; Saeed, O.; Székács, A.; Abukhadra, M.R.; El-Sherbeeny, A.M.; Bence, C.; Mikita, V.; Kovács, A.; Szűcs, P. Advanced approach combines integrated weight water quality index and potential toxic elements for environmental and health risk assessment supported by simulation technique in Oued Souf, Algeria. Sci. Rep. 2024, 14, 17805. [Google Scholar] [CrossRef]
- Hasan, A.B.; Reza, A.H.M.S.; Siddique, M.A.B.; Akbor, M.A.; Nahar, A.; Hasan, M.; Uddin, M.R.; Zaman, M.N.; Islam, I. Origin, spatial distribution, sediment contamination, ecological and health risk evaluation of trace metals in sediments of ship breaking area of Bangladesh. J. Hazard. Mater. 2024, 465, 133214. [Google Scholar] [CrossRef]
- Meng, F.; Cao, R.; Zhu, X.; Zhang, Y.; Liu, M.; Wang, J.; Chen, J.; Geng, N. A nationwide investigation on the characteristics and health risk of trace elements in surface water across China. Water Res. 2024, 250, 121076. [Google Scholar] [CrossRef]
- Zhang, K.; Qadeer, A.; Chang, S.; Tu, X.; Shang, H.; Khan, M.A.; Zhu, Y.; Fu, Q.; Yu, Y.; Feng, Y. Short-chain PFASs dominance and their environmental transport dynamics in urban water systems: Insights from multimedia transport analysis and human exposure risk. Environ. Int. 2025, 202, 109602. [Google Scholar] [CrossRef]
- Ma, X.; Brookes, J.; Wang, X.; Han, Y.; Ma, J.; Li, G.; Chen, Q.; Zhou, S.; Qin, B. Water quality improvement and existing challenges in the Pearl River Basin, China. J. Water Process Eng. 2023, 55, 104184. [Google Scholar] [CrossRef]
- Liu, H.; Sun, S. Assessing trace element-related health risks in urban centralized drinking water sources in China. Water Res. 2025, 285, 124118. [Google Scholar] [CrossRef] [PubMed]
- Zhang, K.; Chang, S.; Tu, X.; Yu, Y.; Shang, H.; Wang, E.; Fu, Q. A comprehensive study of heavy metals in centralized drinking water sources of the Yangtze River Basin: Levels, sources, and probabilistic health risk. Water 2024, 16, 3495. [Google Scholar] [CrossRef]
- Xie, F.; Yu, M.; Yuan, Q.; Meng, Y.; Qie, Y.; Shang, Z.; Luan, F.; Zhang, D. Spatial distribution, pollution assessment, and source identification of heavy metals in the Yellow River. J. Hazard. Mater. 2022, 436, 129309. [Google Scholar] [CrossRef] [PubMed]
- Zhou, Y.; Ding, H.; Wang, Z.; Li, M.; Zhang, J.; Li, X. Characterizing the changes in the source apportionment of metal in surface waters by an integrated approach. ACS EST Water 2023, 3, 2041–2052. [Google Scholar] [CrossRef]
- Luo, C.; Routh, J.; Luo, D.; Wei, L.; Liu, Y. Arsenic in the Pearl River Delta and its related waterbody, South China: Occurrence and sources, a review. Geosci. Lett. 2021, 8, 12. [Google Scholar] [CrossRef]
- Song, M.W.; Huang, P.; Li, F.; Zhang, H.; Xie, K.Z.; Wang, X.H.; He, G.X. Water quality of a tributary of the Pearl River, the Beijiang, Southern China: Implications from multivariate statistical analyses. Environ. Monit. Assess. 2010, 172, 589–603. [Google Scholar] [CrossRef]
- Huang, L.; Deng, C.; Huang, N.; Huang, X. Multivariate statistical approach to identify heavy metal sources in agricultural soil around an abandoned Pb–Zn mine in Guangxi Zhuang Autonomous Region, China. Environ. Earth Sci. 2012, 68, 1331–1348. [Google Scholar] [CrossRef]
- Van Luyen, N.; Savichev, O.G. Assessing the Influence of the Mining Operations on the State of Streams in the Northern Part of the Red River Basin (Viet Nam). Geogr. Nat. Resour. 2018, 39, 182–188. [Google Scholar] [CrossRef]
- Li, Y.; Zhang, J.; Song, N.; Wang, Y.; Yu, J.; He, L.; Yang, R.; Yang, L.; He, D. Assessment of health risk and identification of pollution sources of heavy metals in water in Chongqing’s wastewater treatment plants based on ICP-MS. Environ. Pollut. 2025, 373, 126193. [Google Scholar] [CrossRef] [PubMed]
- Zhao, Z.; Wang, S.; Lu, W.; Yang, W.; Li, S. Water quality assessment, possible origins and health risks of toxic metal(loid)s in five cascade reservoirs in the upper Mekong. J. Clean. Prod. 2024, 441, 141049. [Google Scholar] [CrossRef]
- Mir, I.A.; Ghosh, P.; Bhattacharaya, A.; Baalousha, M. Origin, distribution, fate, and risks of potentially toxic elements in the aquatic environment of Bengaluru metropolis, India. J. Hazard. Mater. 2024, 480, 135962. [Google Scholar] [CrossRef]
- Peng, S.; Xiao, X.; Zou, H.; Yang, Z.; Ahmad, U.M.; Zhao, Y.; Chen, H.; Li, G.; Liu, G.; Duan, X.; et al. Levels, origins and probabilistic health risk appraisal for trace elements in drinking water from Lhasa, Tibet. Environ. Geochem. Health 2022, 45, 3405–3421. [Google Scholar] [CrossRef]
- Jiménez-Oyola, S.; Valverde-Armas, P.E.; Romero-Crespo, P.; Capa, D.; Valdivieso, A.; Coronel-León, J.; Guzmán-Martínez, F.; Chavez, E. Heavy metal(loid)s contamination in water and sediments in a mining area in Ecuador: A comprehensive assessment for drinking water quality and human health risk. Environ. Geochem. Health 2023, 45, 4929–4949. [Google Scholar] [CrossRef]
- Saha, N.; Rahman, M.S. Groundwater hydrogeochemistry and probabilistic health risk assessment through exposure to arsenic-contaminated groundwater of Meghna floodplain, central-east Bangladesh. Ecotoxicol. Environ. Saf. 2020, 206, 111349. [Google Scholar] [CrossRef]
- Seleem, E.M.; Mostafa, A.; Mokhtar, M.; Salman, S.A. Risk assessment of heavy metals in drinking water on the human health, Assiut City, and its environs, Egypt. Arab. J. Geosci. 2021, 14, 427. [Google Scholar] [CrossRef]
- Tong, S.; Li, H.; Tudi, M.; Yuan, X.; Yang, L. Comparison of characteristics, water quality and health risk assessment of trace elements in surface water and groundwater in China. Ecotoxicol. Environ. Saf. 2021, 219, 112283. [Google Scholar] [CrossRef]
- Jin, Y.; Zhou, Q.; Wang, X.; Zhang, H.; Yang, G.; Lei, T.; Mei, S.; Yang, H.; Liu, L.; Yang, H.; et al. Heavy Metals in the Mainstream Water of the Yangtze River Downstream: Distribution, Sources and Health Risk Assessment. Int. J. Environ. Res. Public Health 2022, 19, 6204. [Google Scholar] [CrossRef]
- Kaur, L.; Rishi, M.S.; Siddiqui, A.U. Deterministic and probabilistic health risk assessment techniques to evaluate non-carcinogenic human health risk (NHHR) due to fluoride and nitrate in groundwater of Panipat, Haryana, India. Environ. Pollut. 2020, 259, 113711. [Google Scholar] [CrossRef] [PubMed]
- Chen, X.; Fu, X.; Li, G.; Zhang, J.; Li, H.; Xie, F. Source-specific probabilistic health risk assessment of heavy metals in surface water of the Yangtze River Basin. Sci. Total Environ. 2024, 926, 171923. [Google Scholar] [CrossRef] [PubMed]
- Dahmardeh Behrooz, R.; Kaskaoutis, D.G.; Grivas, G.; Mihalopoulos, N. Human health risk assessment for toxic elements in the extreme ambient dust conditions observed in Sistan, Iran. Chemosphere 2021, 262, 127835. [Google Scholar] [CrossRef] [PubMed]
- Zhang, K.; Chang, S.; Tu, X.; Wang, E.; Yu, Y.; Liu, J.; Wang, L.; Fu, Q. Heavy metals in centralized drinking water sources of the Yangtze River: A comprehensive study from a basin-wide perspective. J. Hazard. Mater. 2024, 469, 133936. [Google Scholar] [CrossRef]
- Cheng, W.; Yin, H.; Dong, F.; Li, X.; Zhang, D.; Lu, C. Analysis and probabilistic health risk assessment of vertical heavy metal pollution in the water environment of reservoir in the west coast new area of Qingdao, China. Environ. Pollut. 2024, 362, 125021. [Google Scholar] [CrossRef]
- Dippong, T.; Resz, M.-A.; Tănăselia, C.; Cadar, O. Assessing microbiological and heavy metal pollution in surface waters associated with potential human health risk assessment at fish ingestion exposure. J. Hazard. Mater. 2024, 476, 135187. [Google Scholar] [CrossRef]
Disclaimer/Publisher’s Note: The statements, opinions and data contained in all publications are solely those of the individual author(s) and contributor(s) and not of MDPI and/or the editor(s). MDPI and/or the editor(s) disclaim responsibility for any injury to people or property resulting from any ideas, methods, instructions or products referred to in the content. |
© 2025 by the authors. Licensee MDPI, Basel, Switzerland. This article is an open access article distributed under the terms and conditions of the Creative Commons Attribution (CC BY) license (https://creativecommons.org/licenses/by/4.0/).