Article

A KPCA-ISSA-SVM Hybrid Model for Identifying Sources of Mine Water Inrush Using Hydrochemical Indicators

1
YingDa Insurance Asset Management Co., Ltd., Beijing 100010, China
2
School of Resources and Geosciences, China University of Mining and Technology, Xuzhou 221000, China
3
The Second Exploration Team of Jiangsu Coal Geology Bureau, Xuzhou 221001, China
*
Authors to whom correspondence should be addressed.
Water 2025, 17(19), 2859; https://doi.org/10.3390/w17192859
Submission received: 25 August 2025 / Revised: 27 September 2025 / Accepted: 28 September 2025 / Published: 30 September 2025

Abstract

Early identification of mine water inrush types and determination of water sources are prerequisites for water disaster monitoring and early warning. A mine water source identification model is proposed to improve the accuracy of water source prediction based on Kernel Principal Component Analysis (KPCA) and Support Vector Machine (SVM) models optimized by the Improved Sparrow Search Algorithm (ISSA). Nine conventional hydrochemical indicators are selected, including Ca2+, Mg2+, Na++K+, HCO3, Cl, SO42−, total hardness, alkalinity, and pH. KPCA can realize the dimensionality reduction to eliminate the redundancy of information between discriminant indices, simplify the model structure, and enhance the calculation speed of the predicted model. The penalty factor C and kernel parameter g of the SVM model are optimized by the Sparrow Search Algorithm (SSA). In addition, comparative analysis with the SVM, SSA-SVM, and ISSA-SVM models demonstrates that the KPCA and ISSA significantly enhance the classification performance of the SVM model. The KPCA-ISSA-SVM model outperforms three contrastive models in terms of accuracy, precision, recall, Kappa coefficient, Matthews Correlation Coefficient, and geometric mean values of 90.75%, 0.90, 0.88, 0.89, 0.87, and 0.89, respectively. These outcomes underscore the superior performance of the KPCA-ISSA-SVM hybrid model and its potential for effectively identifying mine water sources. This research can serve to identify the mine water sources.

1. Introduction

With the depletion of shallow coal resources extracted during mining phases in the North China region, mining operations are gradually extending deeper into areas with abundant coal reserves and high-rank coal. However, due to increased mining depth, intensity, and scale, more complex geological conditions pose a significant threat to workplace safety in mining environments, often inducing various geological disasters, such as mine water inrush accidents [1,2]. Over the past decades, coal mines have experienced 164 water hazard incidents related to mining activities, causing 776 fatalities and substantial economic losses. This indicates the continued severity of water hazards linked to mining in China [3]. Thus, the rapid and accurate recognition of mine water inrush sources is a vital precondition for subsequent water disaster prevention and management efforts [4,5]. Numerous mine water inrush source identification (MWISI) methods in mining practices have emerged in response to mining-induced water disaster accidents.

1.1. Traditional Approach

Reviewing previous case studies over the past decade, the current academic consensus has identified five methodological frameworks for MWISI. These frameworks include (1) the hydrogeological discrimination method [6,7]; (2) the hydro-chemical analysis method [8,9]; (3) the mathematical theory-based discrimination method [10,11]; (4) the spectroscopic analysis method [12,13]; and (5) the machine learning discrimination model [14,15].
Usually, the hydrogeological method mainly relies on the water temperature and table characteristics collected during mining [16]. The water inrush sources are identified by comparing the water temperature at the inrushing water locations with that of the aquifers and integrating it with water table changes monitored by hydrological observation holes. However, this method exhibits limited accuracy due to the susceptibility of groundwater temperature to environmental disturbances. Consequently, its current application is primarily restricted to rapid preliminary screening of water inrush sources in uncomplicated geological conditions. However, hydrochemical fingerprinting techniques have gained widespread recognition for MWISI [17,18,19,20,21]. These methodologies can be classified into three principal categories: traditional hydro-chemical analysis, trace element signatures, and environmental isotope tracers. A synergistic approach integrating isotopic analysis with traditional hydrochemical methods has demonstrated enhanced identification capability. This integrated tracer methodology significantly improves the accuracy of MWISI [22]. Furthermore, combining trace elements and environmental isotopes provides complementary advantages. Due to their chemical stability, the isotopic techniques offer superior tracing precision, but costs and time-consuming efforts often constrain the testing process.

1.2. Machine Learning

With the emergence of artificial intelligence technology and its rapid development, machine learning algorithms are being introduced and applied to deeply analyze the data features in various fields, such as the mining industry. A Back Propagation (BP) neural network is a multi-layer feedforward network trained by error backpropagation, and its algorithm is called the BP algorithm [23,24]. A BP–Fisher recognition model is constructed to discuss the similarity between known water sources and inrush water [25]. The BP neural network or LightGBM model optimized by particle swarm optimization (PSO) is proposed [26,27]. LightGBM is an improved framework based on the Gradient Boosting Decision Tree. It iteratively builds multiple decision trees, with each tree correcting the prediction error of the previous tree, and finally outputs the prediction results in an accumulated manner [28,29,30]. The SIOA-DFNN model is applied to discriminate the roof water inrush sources in the Bingchang mining area [31]. The optimized models are proposed to predict water inrush sources from multiple aquifers, such as ELM-CNN, MFO-LSSVM, and IGA-ELM [32,33,34]. In addition, hybrid prediction models integrated with water spectral data, such as CSSOA-RF and GA-XGBoost, have been successfully applied to mine water identification [35,36]. Related work is demonstrated in Appendix A Table A1.

1.3. Study Content and Aim

In this study, we aimed to develop a robust and efficient model for accurately identifying the source of mine water inrush, a critical task for predicting and preventing catastrophic mine water disasters. To achieve this, we addressed three primary research issues: (1) How can we effectively process and reduce the dimensionality of complex hydro-chemical data to enhance model performance? (2) How can we optimize the parameters of a predictive model to achieve the highest possible discrimination accuracy between different water sources? (3) How does a purpose-built hybrid model perform compared to other standard models when applied to real-world data?
Considering that the water–rock interaction in different aquifers of different lithologies may vary, the concentrations of the primary ions produced in the water also differ. We selected nine hydrochemical indices and implemented an integrated analytical framework based on these questions. K–means cluster analysis (KCA) was initially employed to reorganize water sample types. Subsequently, kernel principal component analysis (KPCA) was applied to eliminate redundant information and reduce data dimensionality, thereby improving computational efficiency. For the core prediction task, a support vector machine (SVM) model was chosen for its strength in classification. Recognizing that the model’s accuracy is highly sensitive to its penalty factor C and kernel parameter g, we utilized an improved sparrow search algorithm (ISSA) to optimize these parameters and enhance its discriminative power. The performance of the KPCA-ISSA-SVM hybrid model was then rigorously evaluated by applying it to a practical case: identifying water sources from the limestone aquifers of the Gubei colliery. Through a comparative analysis with three alternative models, we discuss the model’s adaptability, traceability, and superior performance based on standard evaluation metrics. This model provides a significant methodological advancement for mine water inrush source identification and offers a reliable tool for improving mine safety.

2. Materials and Methods

2.1. K–Means Cluster Analysis (KCA)

K–means clustering is a commonly used distance-based clustering algorithm that aims to divide a dataset into K clusters. The algorithm’s goal is to minimize the sum of the distances from the points within each cluster to the cluster center [37]. The basic processes are as follows:
(1)
Initialization: Select a preset number of clusters K, and randomly choose K data points as the initial cluster centers.
(2)
Assignment step: Assign each data point to the nearest cluster center, typically using the Euclidean distance method to determine the distance between the points x = (x1, x2, …, xd) and centers c = (c1, c2, …, cd). The mathematical expression is as follows:
d ( x , c ) = i = 1 d ( x i c i ) 2
(3)
Update step: Calculate the mean (i.e., centroid) of all data points within each cluster and set this mean as the new cluster center.
(4)
Repetition step: Repeat the assignment and update steps until the cluster centers no longer change or change slightly, or reach the maximum number of iterations.

2.2. Kernel Principal Component Analysis (KPCA)

KPCA is a nonlinear data processing method based on a high-dimensional feature space, successfully achieving dimension reduction in linear indivisible datasets by mapping the data from the original space to this space and processing it using PCA. Compared to PCA, KPCA can capture more sample information and better preserve the local structural information of the data, thus providing a more accurate feature representation [38,39,40]. Its specific implementation steps are as follows:
(1)
The KPCA maps the raw water chemistry characterization data to the high-dimensional space φ, forming new data φ(ei) = [φ(e1), φ(e2),……, φ(en)]. We assume that the samples in the high-dimensional space have shown a trend of centralization, and the covariance matrix is as follows:
S = 1 n i n φ ( e i ) φ ( e j ) T = 1 n φ φ T
(2)
By introducing the kernel function K* = φTφ, the data in S is solved by principal component analysis:
K * ζ = λ ζ
where λ is the eigenvalue and ζ is the eigenvector.
(3)
The cumulative contribution rate is set as 95%, in descending order, and takes the first m eigenvalues λ j with their corresponding eigenvectors ζ j  (j = 1, 2,…, m):
j = 1 m λ j / i = 1 m λ i 85 %
(4)
The nonlinear samples H from the dimension reduction mapping are counted when the cumulative contribution rate meets the set requirements:
H = i = 1 n ζ i φ ( e i ) T = ζ T φ ( e 1 , e ) , , φ ( e i , e ) T

2.3. Support Vector Machine Optimized by Improved Sparrow Search Algorithm (ISSA-SVM)

The support vector machine (SVM) algorithm is a statistical theory based on the structural risk minimization method proposed [41,42]. It has strong learning and generalization abilities and can effectively solve problems such as small-sample, non-linearity, and local minimum to achieve effective classification. Its basic principle is to find an optimal classification hyperplane that maximizes the distance between different sample data sets and the hyperplane. For the nonlinear problems, the classification hyperplane equation can be expressed as:
ω ϕ ( x ) + b = 0
The decision function is f ( x ) = s i g n ( ω ϕ ( x ) + b ) . As such, the problem of solving the optimal classification hyperplane can be expressed as:
min 1 2 ω 2 + C i = 1 l ζ i s . t . y i ( ω T ϕ ( x i ) + b ) 1 ζ i
where ζ i 0 , i = 1 , 2 , , l ;  C is the penalty factor.
Given that local extreme points easily attract the traditional sparrow search algorithm (SSA), it leads to premature algorithm convergence and fails to find the global optimal solution. As the aggregation degree of the iterative population increases, the convergence speed gradually decreases. However, the improved sparrow search algorithm (ISSA) can eliminate the problems of uneven initial population distribution and the tendency to fall into local optima in the traditional SSA.
By adopting the ISSA to optimize the penalty factor C and kernel parameter g affecting the SVM model, the SVM’s performance in classification and prediction tasks can be significantly enhanced. It accelerates the parameter convergence process and improves the model’s accuracy and stability, enabling the SVM model to achieve superior global solutions, thus making the SVM model more efficient and reliable when handling complex data.
The workflow of the KPCA-ISSA-SVM model is shown in Figure 1.

3. Application Case

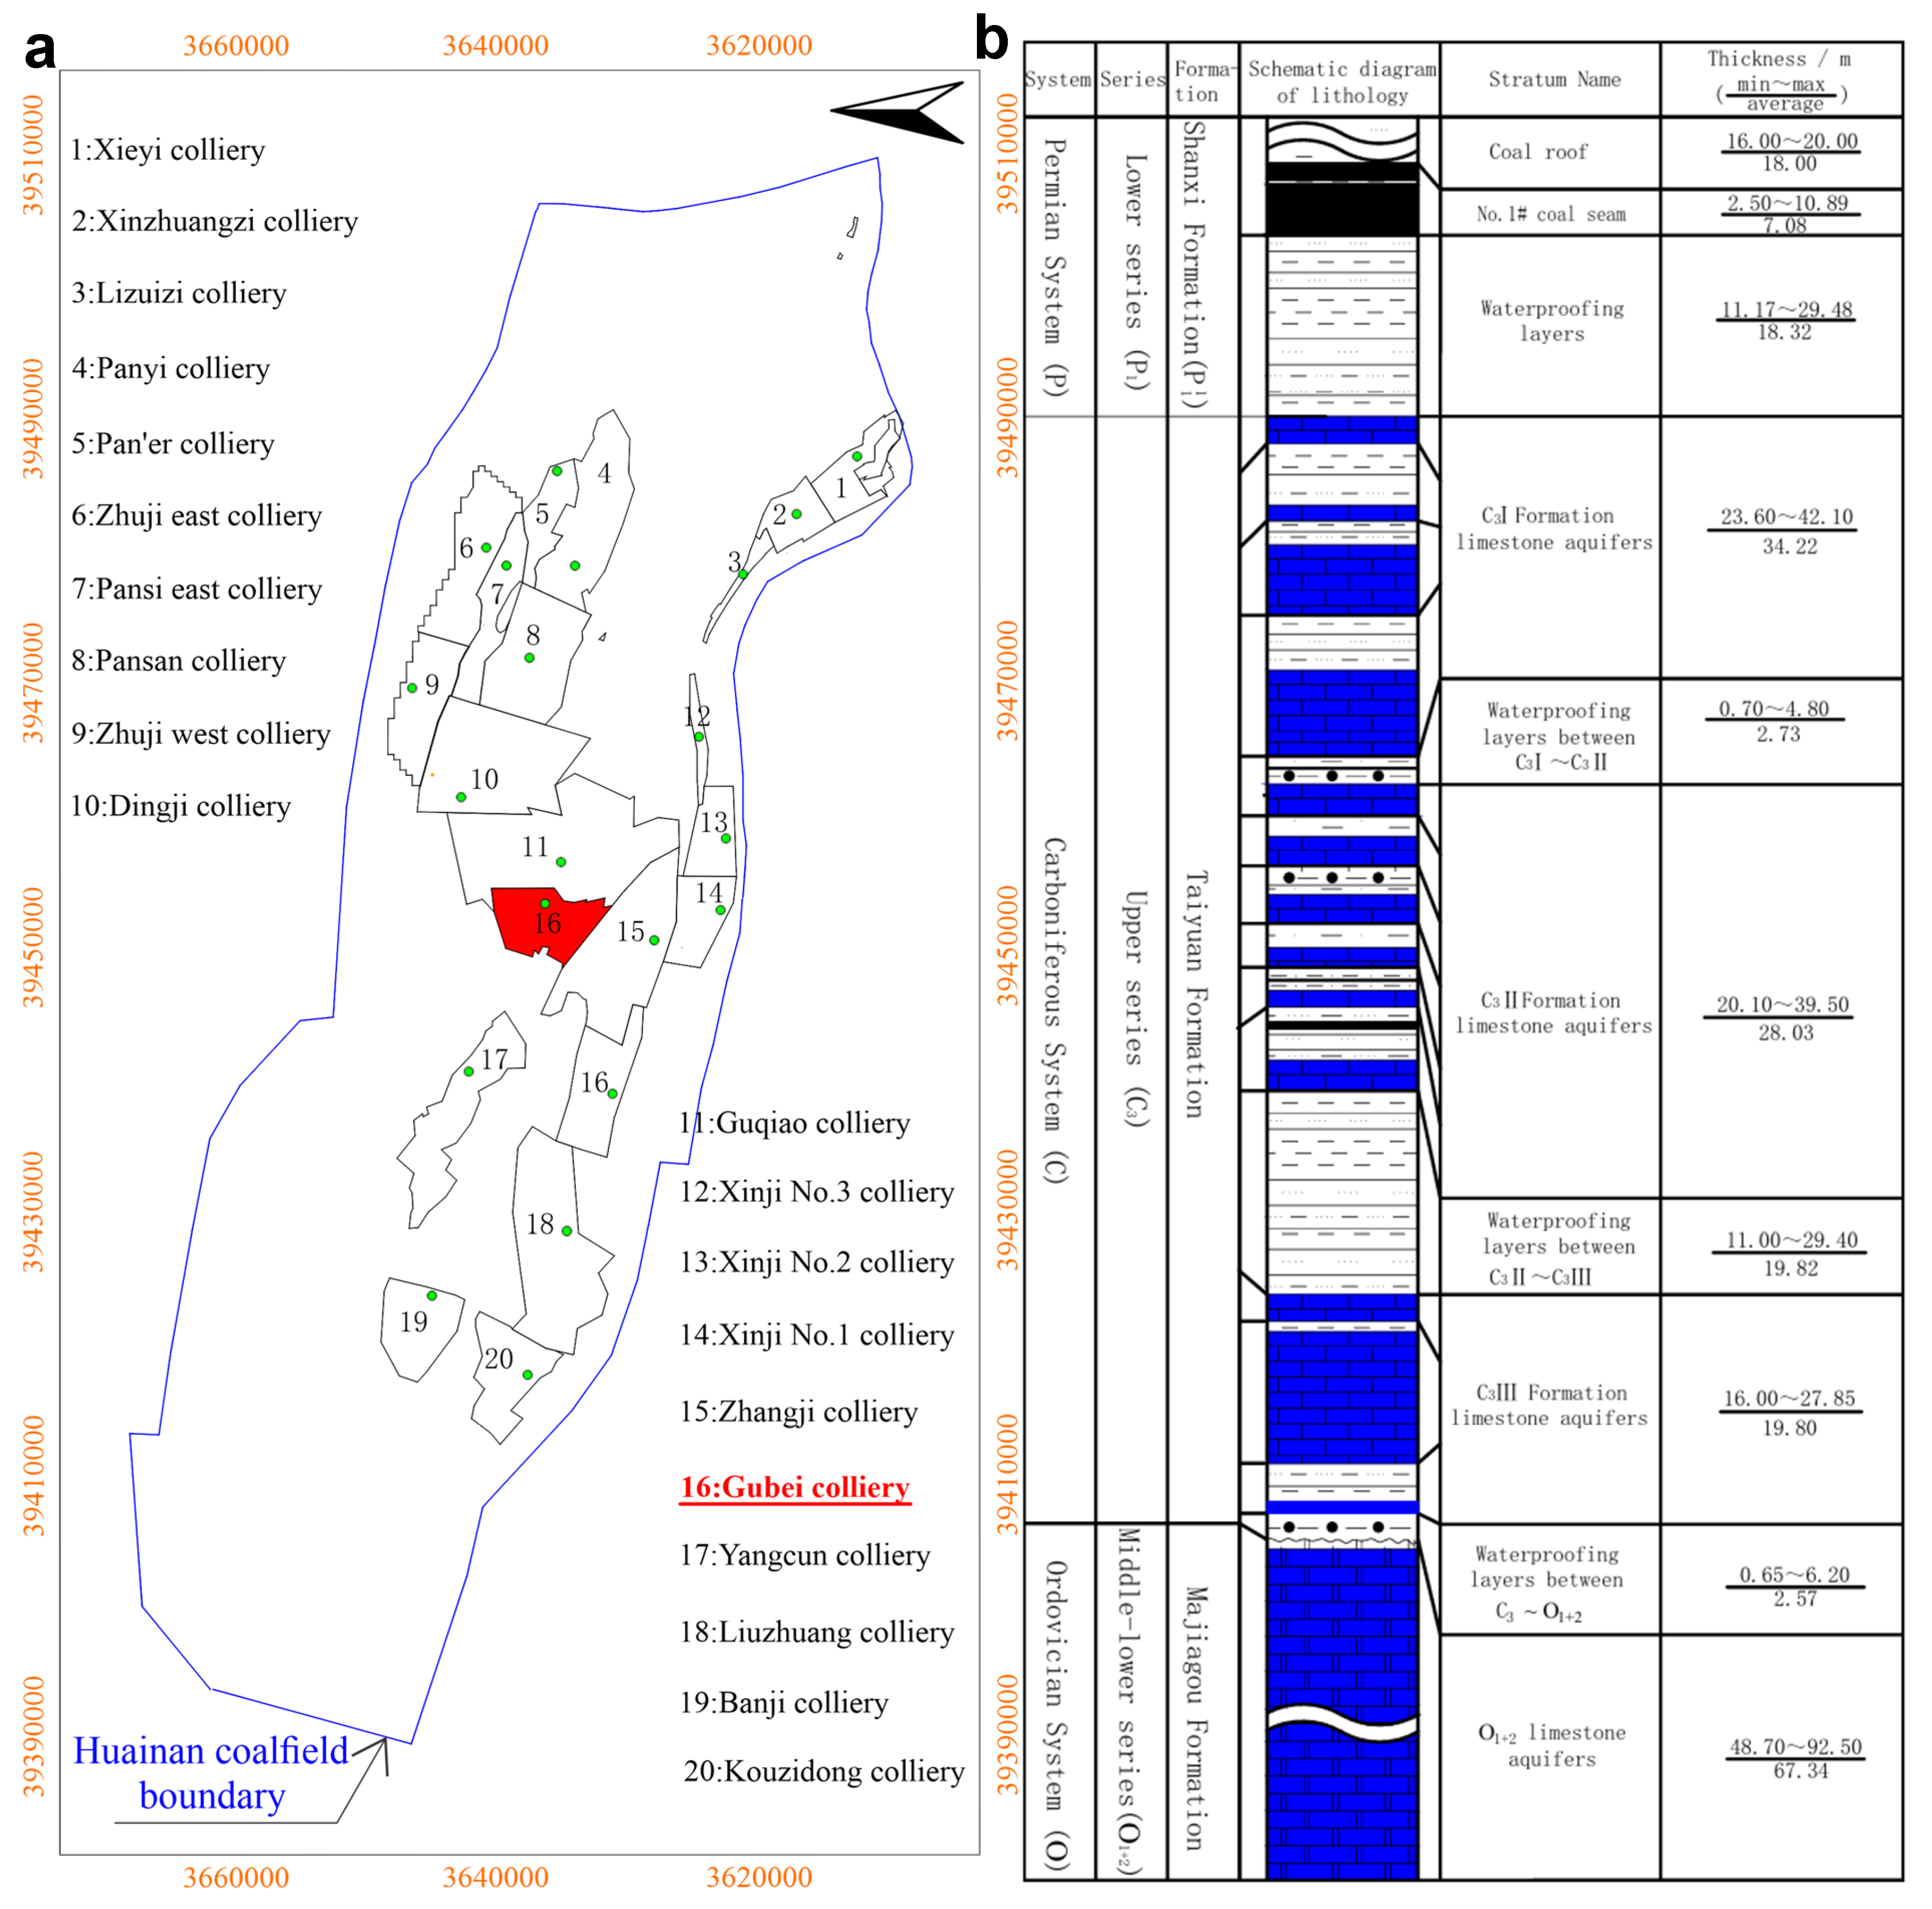
In this study, we take the Gubei colliery, located in the Huainan coalfield (see Figure 2a), as an application case to discuss the limestone water source identification, including the Carboniferous Taiyuan Formation (C3I, C3II, and C3III) and Ordovician Majiagou Formation (O1+2). Currently, No.1# coal seam, one of the A Group coal seams, is extracted in the study area. In Huainan coalfield, Pan’er colliery suffered from a severe limestone water inrush accident in 2017 while mining the No.1# coal seam. Ordovician limestone water swarmed into the 12123 roadway and eventually led to the flooding of the mine. In addition, two incidents of limestone water inrushes happened in the Panyi colliery (2015) and Xieqiao colliery (2018). Therefore, limestone water inrush source identification work is necessary for safe production.
In the Gubei colliery, the distance between the No.1# coal seam floor and the limestone aquifer of the Taiyuan Formation ranges from 11.17 m to 29.48 m, with an average distance of 18.32 m (see Figure 2b). After the No.1#coal seam is mined, the “lower three zones” are formed in the rock strata of the No.1# coal seam floor. In addition, adverse geological structures such as water-conducting faults or karst collapse columns may exist. High-pressure limestone water inrush is highly likely to occur during coal mining.
During geological exploration, we collected four types of water samples, including 41 groups of C3I water samples, 34 groups of C3II water samples, 13 groups of C3III water samples, and 12 groups of O1+2 water samples. The 2.5 L pre-cleaned polyethylene bottles were rinsed three times with the water sample, and the water samples were sealed and labelled quickly. After the water samples were returned to the laboratory, the rotary vane vacuum pump was used for the filtration treatment. Each water sample’s charge balance error (CBE) should fall into the range of 5.0%. If the data with the CBE is greater than ±5.0%, it will not be considered in this study. The approach for determining the CBE is expressed by Equation (8) [43].
C B E = Z m c Z m a Z m c + Z m a × 100 %
where Z is the charge number of the ions, and mc and ma are the milligram equivalent concentrations of cations and anions, respectively.
Based on calculation and analysis, 70 groups of water samples (20 groups of C3I water samples, 26 groups of C3II water samples, 10 groups of C3III water samples, 11 groups of O1+2 water samples) met the screening criteria (CBE ≤ ±5.0%) in total.

4. Results and Discussion

4.1. K–Means Clustering Results

K–means clustering analysis is performed on the MATLAB R2023a platform. The visualized analysis results are shown in Figure 3. As shown in Figure 3a, the distribution of sample points of different categories is separated, indicating that the K–means clustering effect is good, except for five sample points of the C3I cluster that fall into the range of the C3II cluster. This inconsistency with test results may be related to the hydrogeological processes and local geologic structure. We reclassify the type of these five sample points into the C3II cluster, considering the existence of test bias and water conductivity between aquifers. Figure 3b demonstrates the silhouette distribution of four types of water samples. The silhouette values of most samples are relatively high, indicating that the clustering structure is stable. In addition, we present the contribution degrees of nine hydro-chemical indicators to four types of clustering, as shown in Figure 3c. Suppose the intensity of a particular index is significantly high or low in a specific cluster. In that case, this indicator substantially distinguishes this cluster from other clusters. For cluster 1, the discriminative indices are Mg2+, Cl, SO42−, and pH. K+ + Na+, Alk., and pH can be significant indices to characterize cluster 2. K+ + Na+, Cl, and pH contribute more to cluster 3. While K+ + Na+, HCO3, SO42−, and Alk., contribute a lot to discriminating cluster 4.

4.2. Correlation Analysis of Hydro-Chemical Indicators

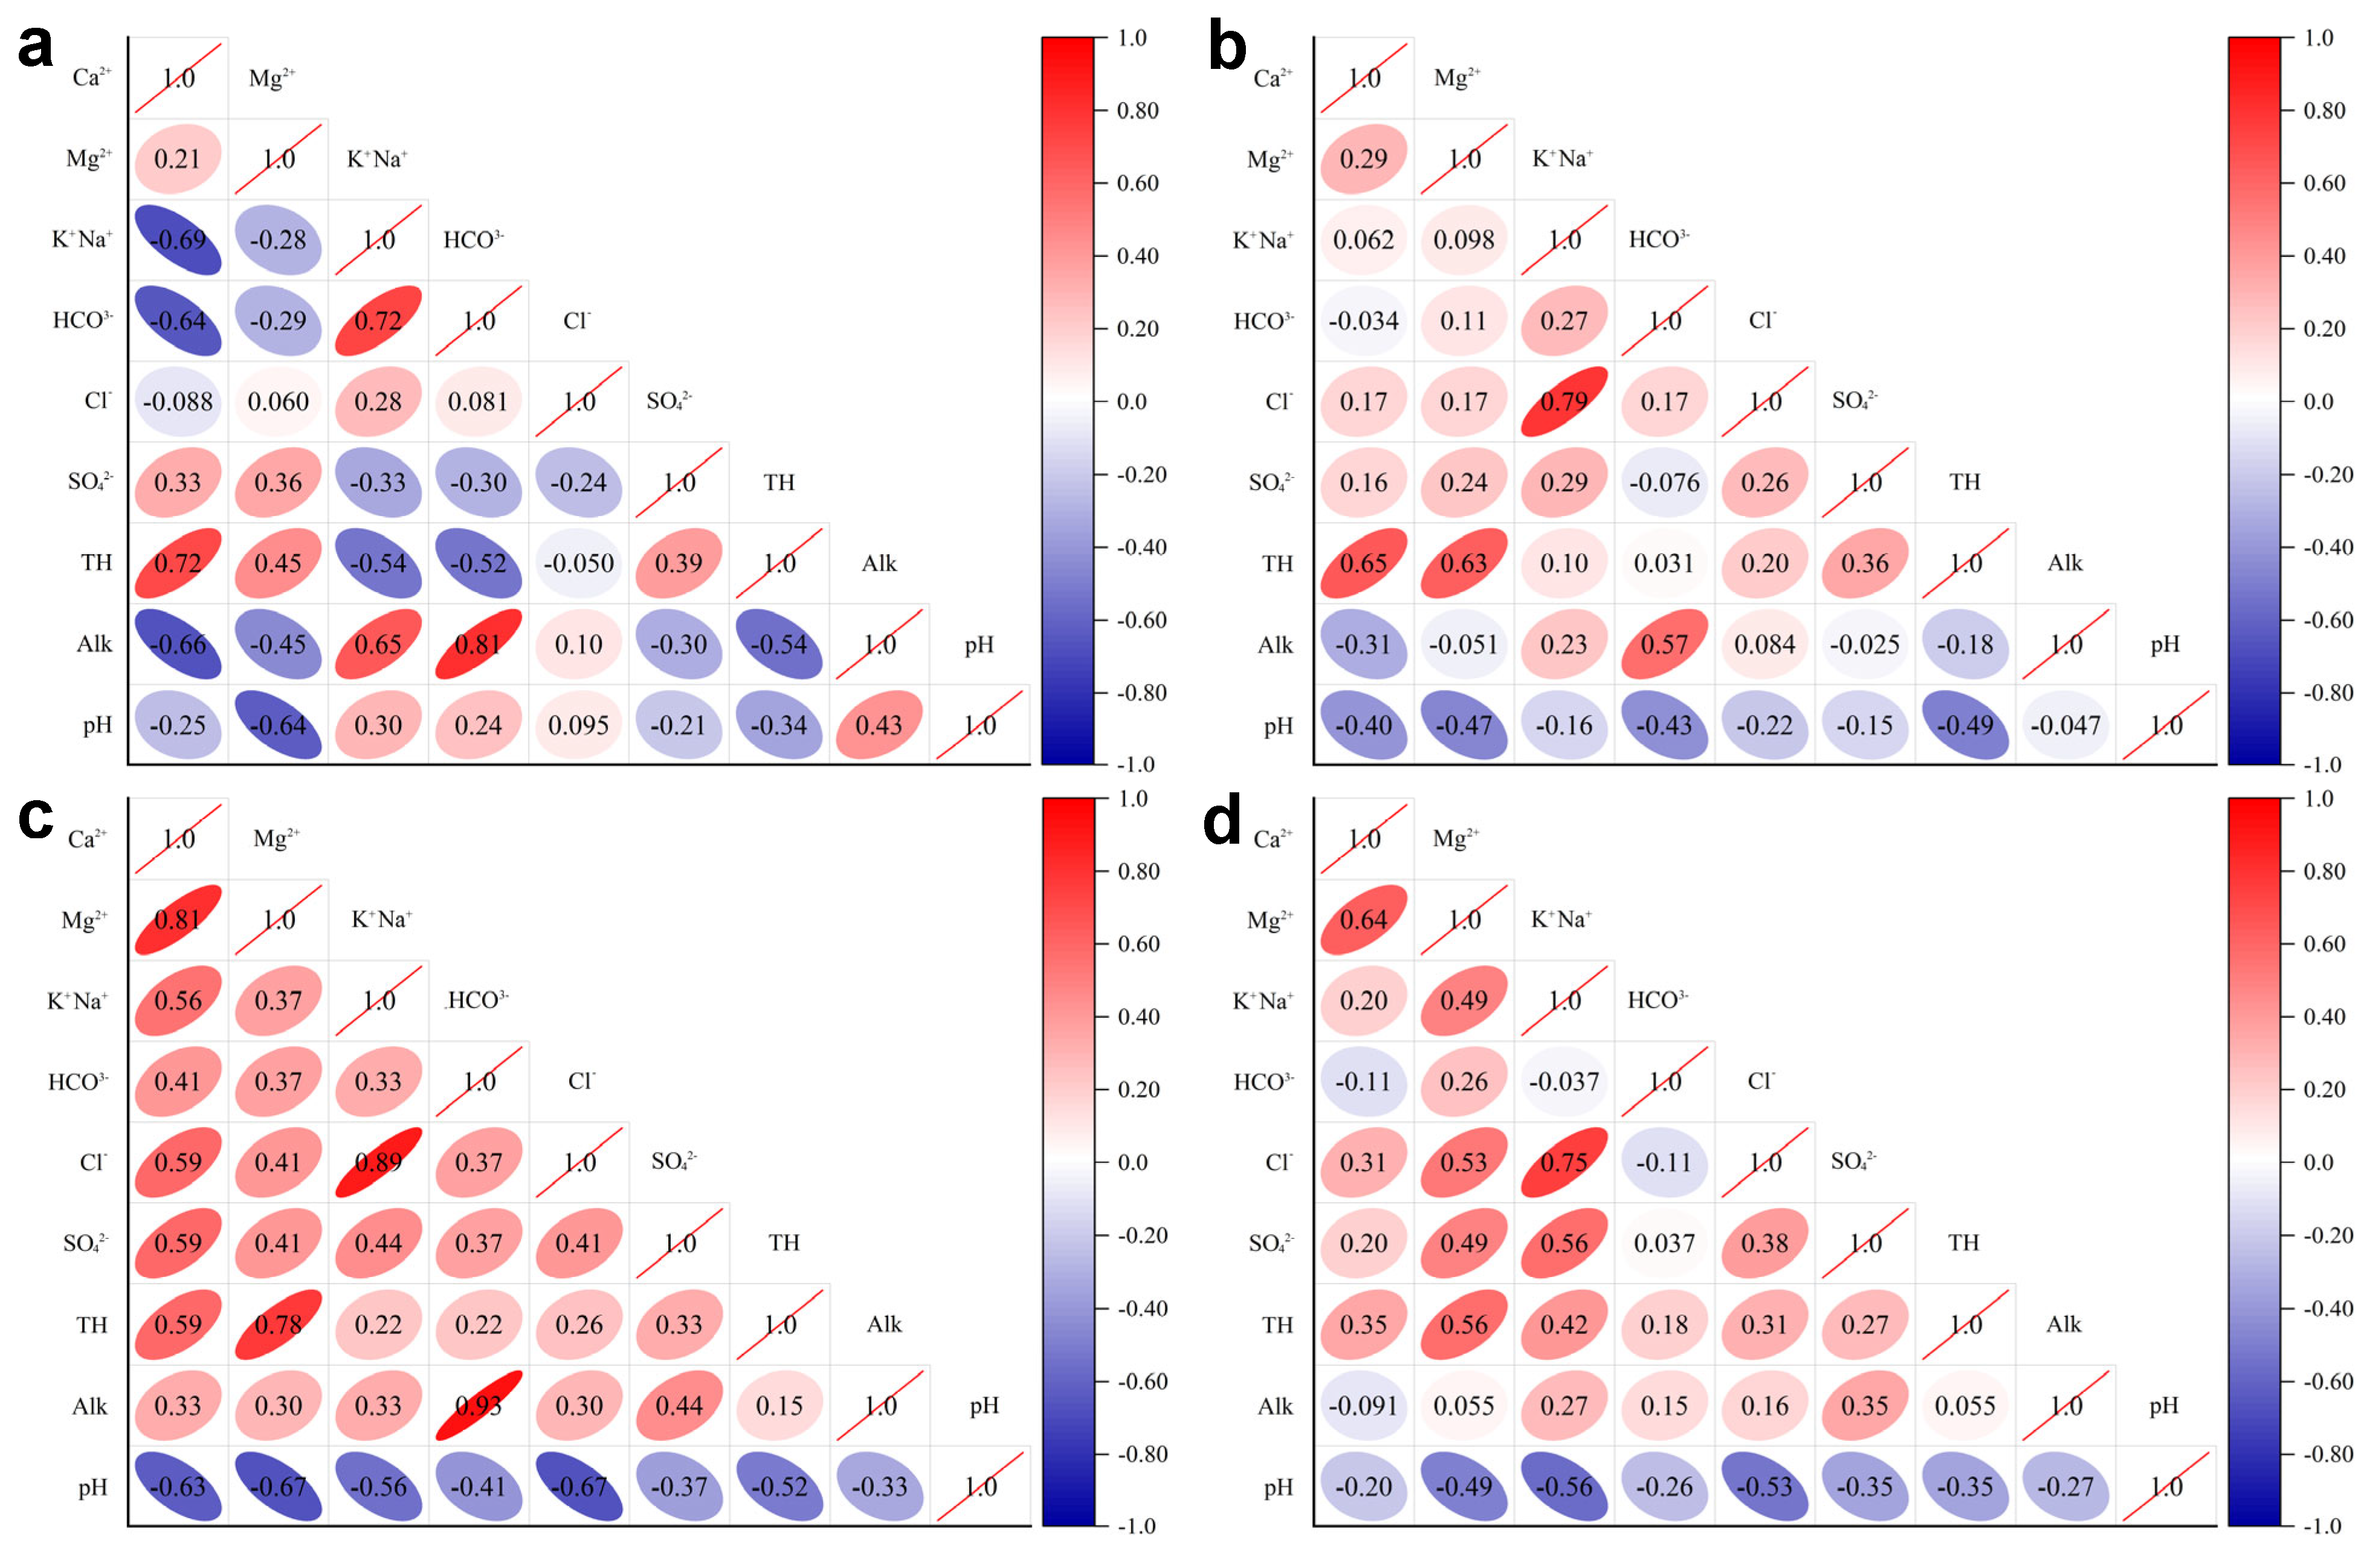
We make the correlation analysis of the raw data, as shown in Figure 4. We can see that a higher correlation exists between some indices, such as the correlation coefficient between HCO3 and Alk., K+ + Na+ and Cl, Ca2+ and TH, which is more than 0.7 in the C3I water sample, indicating that redundant information among the indices exists. Once these indices, without being pre-processed, are directly used in the MWISI, they will inevitably reduce the accuracy of the model’s discrimination. As such, KPCA must be applied to realize dimensionality reduction to overcome information redundancy between discriminant indices.
Similarly, we use MATLAB R2023a software to extract the six main features from nine hydro-chemical indices, as shown in Figure 5. The cumulative contribution rate of these six features is about 95%, which captures most of the data’s information. After extracting features from the original indices using KPCA, the data with six features is divided into two groups (training and testing samples) in a 7:3 ratio. KPCA helps simplify the hybrid model’s structure and speeds up its calculations.

4.3. MWISI Results Based on the KPCA-ISSA-SVM Model

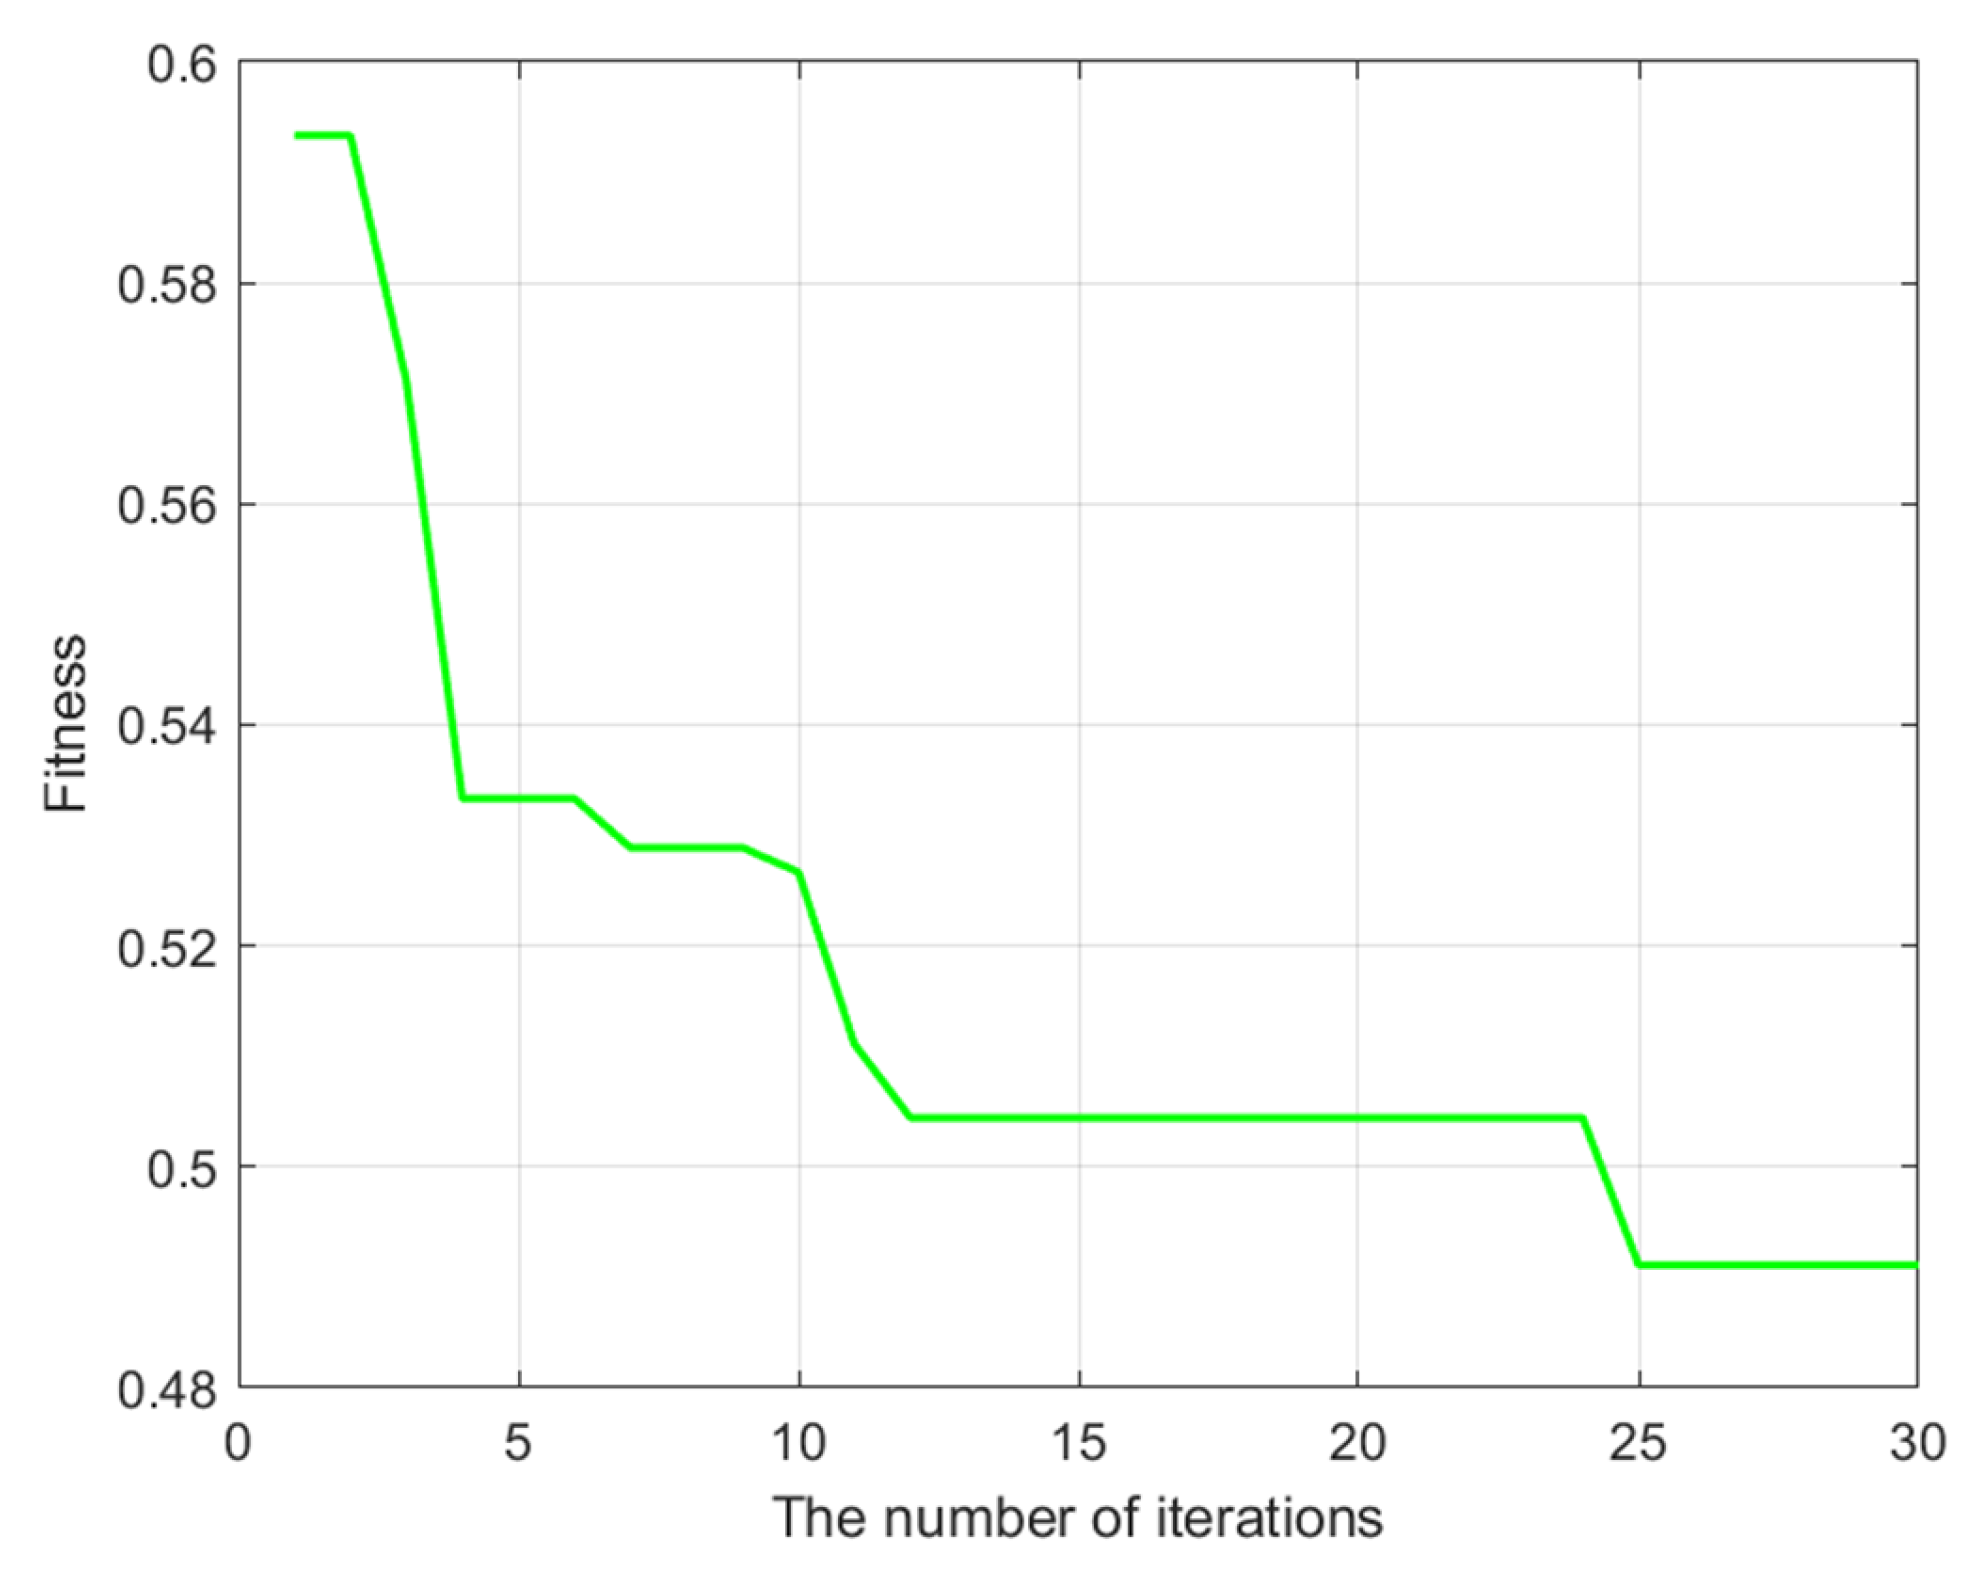
In the KPCA-ISSA-SVM model, the penalty factor C and kernel parameter g range from 0 to 5.0, and a population quantity is set to 8 in ISSA. A maximum number of iterations is set to 30. Figure 6 shows the iterative fitness curve throughout the training process, which is based on the data training, and plots the fitness values for each iteration. As the number of iterations increases, the optimal fitness steadily declines. When the KPCA-ISSA-SVM model undergoes twenty-five iterations, its fitness reaches its lowest point, indicating high convergence accuracy. The model’s misclassification rate has decreased when the fitness value does not noticeably change at later iterations. We utilize the improved sparrow search algorithm (ISSA) to optimize and obtain the optimal parameters, including the penalty factor C and kernel parameter g, and the results are C = 3.2587 and g = 3.8268. Finally, we have established the KPCA-ISSA-SVM hybrid model to identify mine water sources.
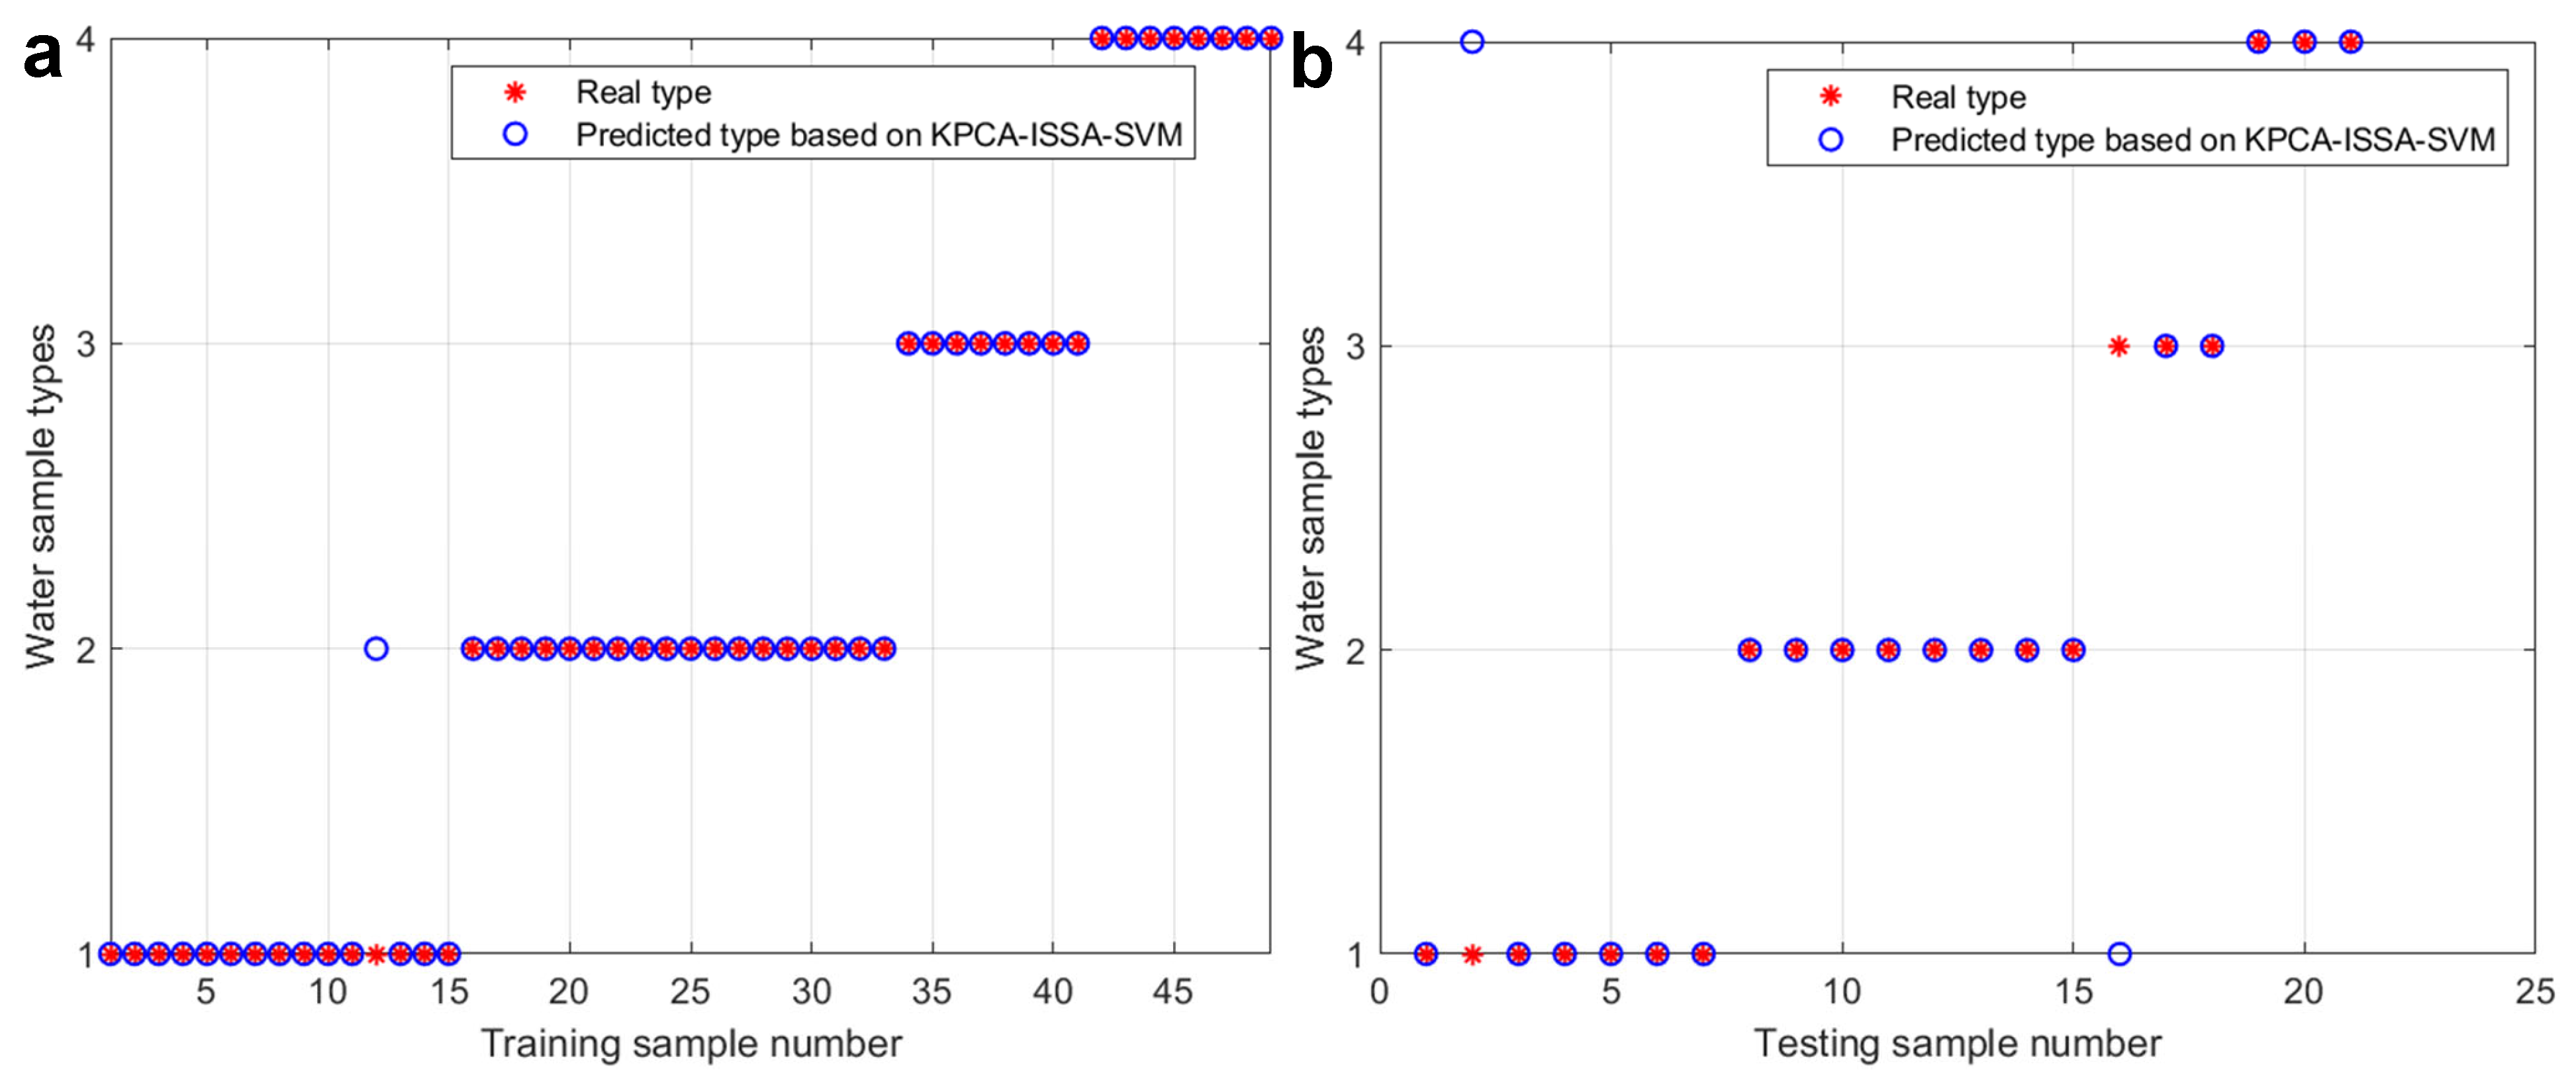
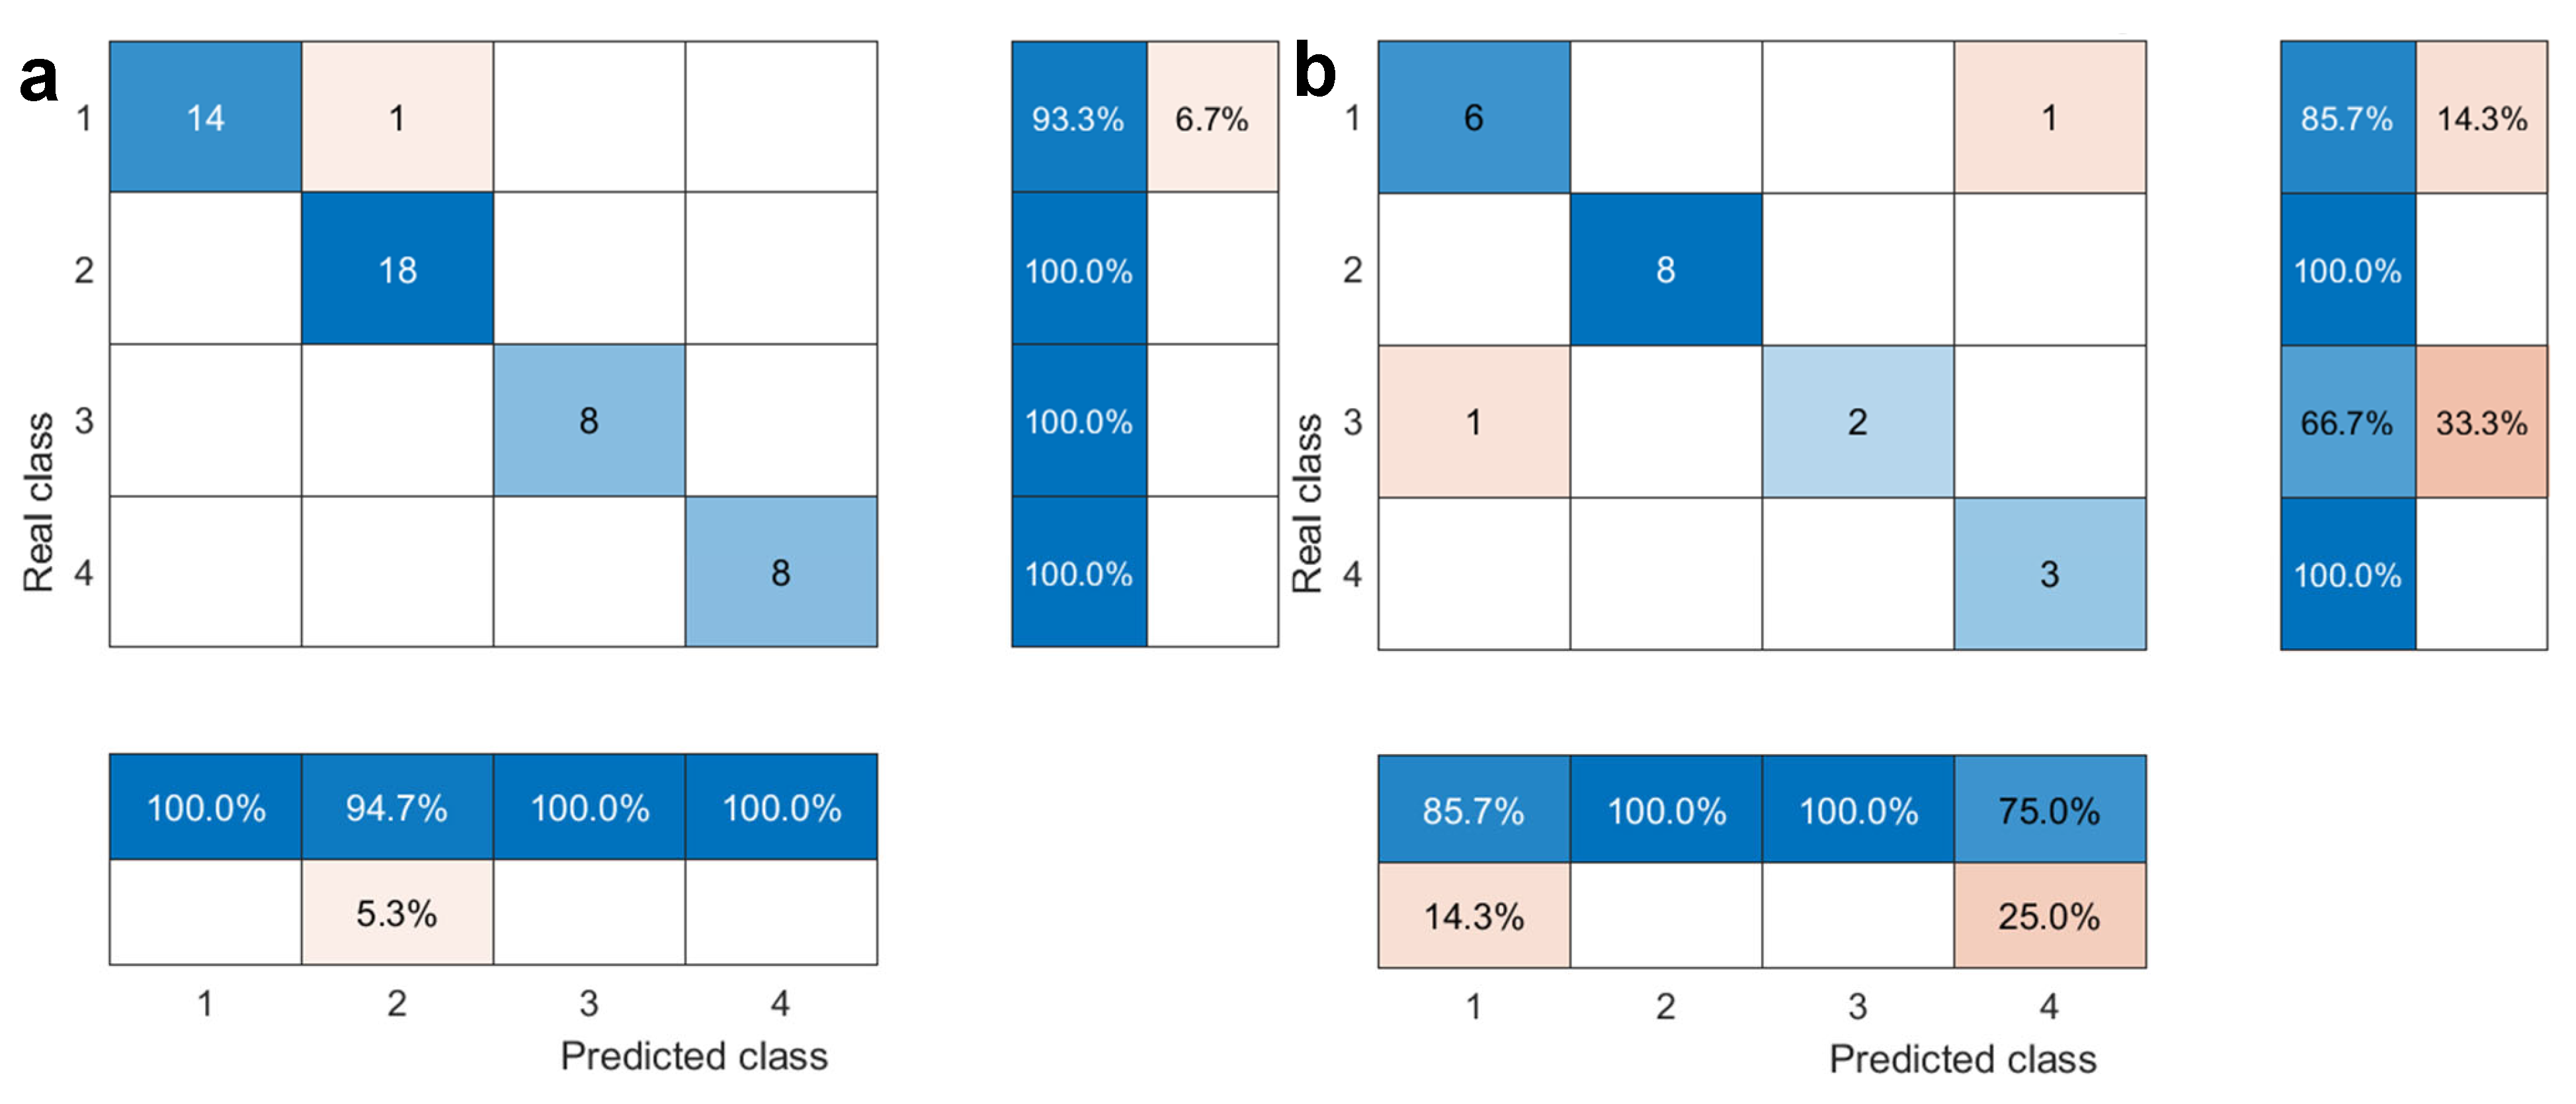
Figure 7 shows the prediction results of the KPCA-ISSA-SVM hybrid model for the training and testing datasets, and Figure 8 shows the confusion matrix. Figure 7a and Figure 8a show that the model exhibits a misclassification rate of 2.04% for the training samples, i.e., a discrimination accuracy of 97.96%. This indicates that the model is better suited to the training samples.
To assess the generalization performance of the trained KPCA-ISSA-SVM model, a total of twenty-one test samples representing four distinct aquifer types were utilized for evaluation. Figure 7b and Figure 8b illustrate these test samples’ prediction outcomes. The results indicate an overall error rate of 9.52%, corresponding to a classification accuracy of 90.48%. Among the four water source types, one sample from the C3I category was incorrectly classified as O1+2, and one sample from the C3III category was misidentified as C3I. The remaining nineteen samples were accurately classified. Considering the prediction performance of the training dataset and the test dataset, we have conducted additional trials using Bayesian Optimization and Grid Search. The results show that Grid Search and Bayesian Optimization can alleviate the overfitting of the training dataset; however, the prediction accuracy and other performance metrics decrease for the testing dataset. It is specifically manifested in the following aspects: Grid Search achieves the prediction accuracy of 81.0% but requires significantly longer computation time. Bayesian Optimization can achieve an accuracy of 85.7% with better efficiency than Grid Search. ISSA still outperformed both with the accuracy of 90.48%, while also showing faster convergence and better stability in multiple runs.
These findings demonstrate the effectiveness of the KPCA-ISSA-SVM model in identifying mine water inrush sources, highlighting its practical advantages such as user-friendliness, computational efficiency, and high predictive accuracy on training and testing datasets.

4.4. Comparative Analysis of Different Predicted Models

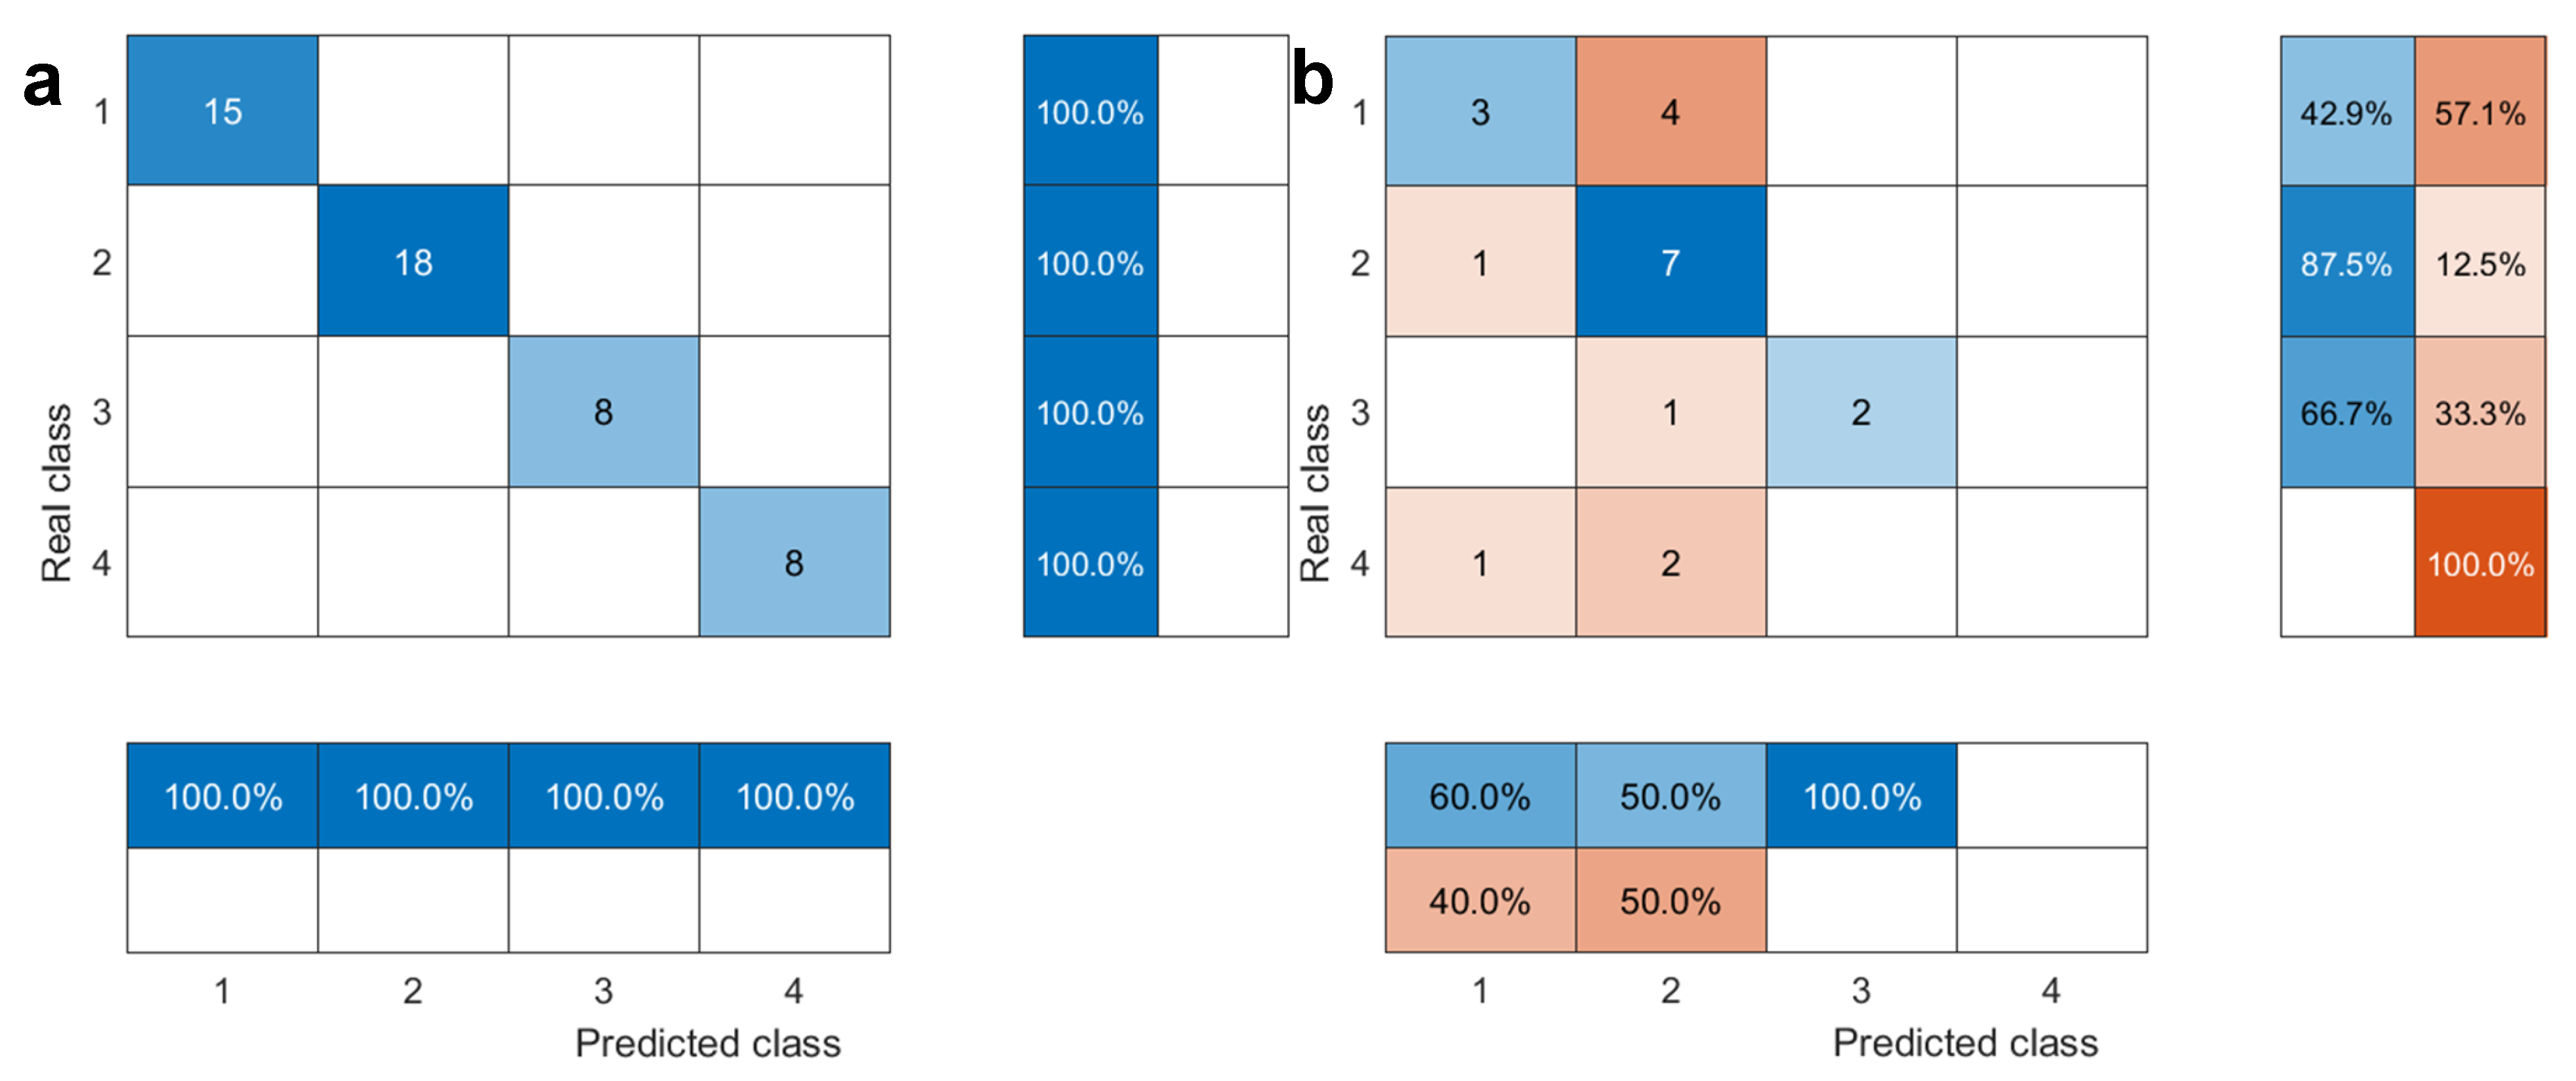
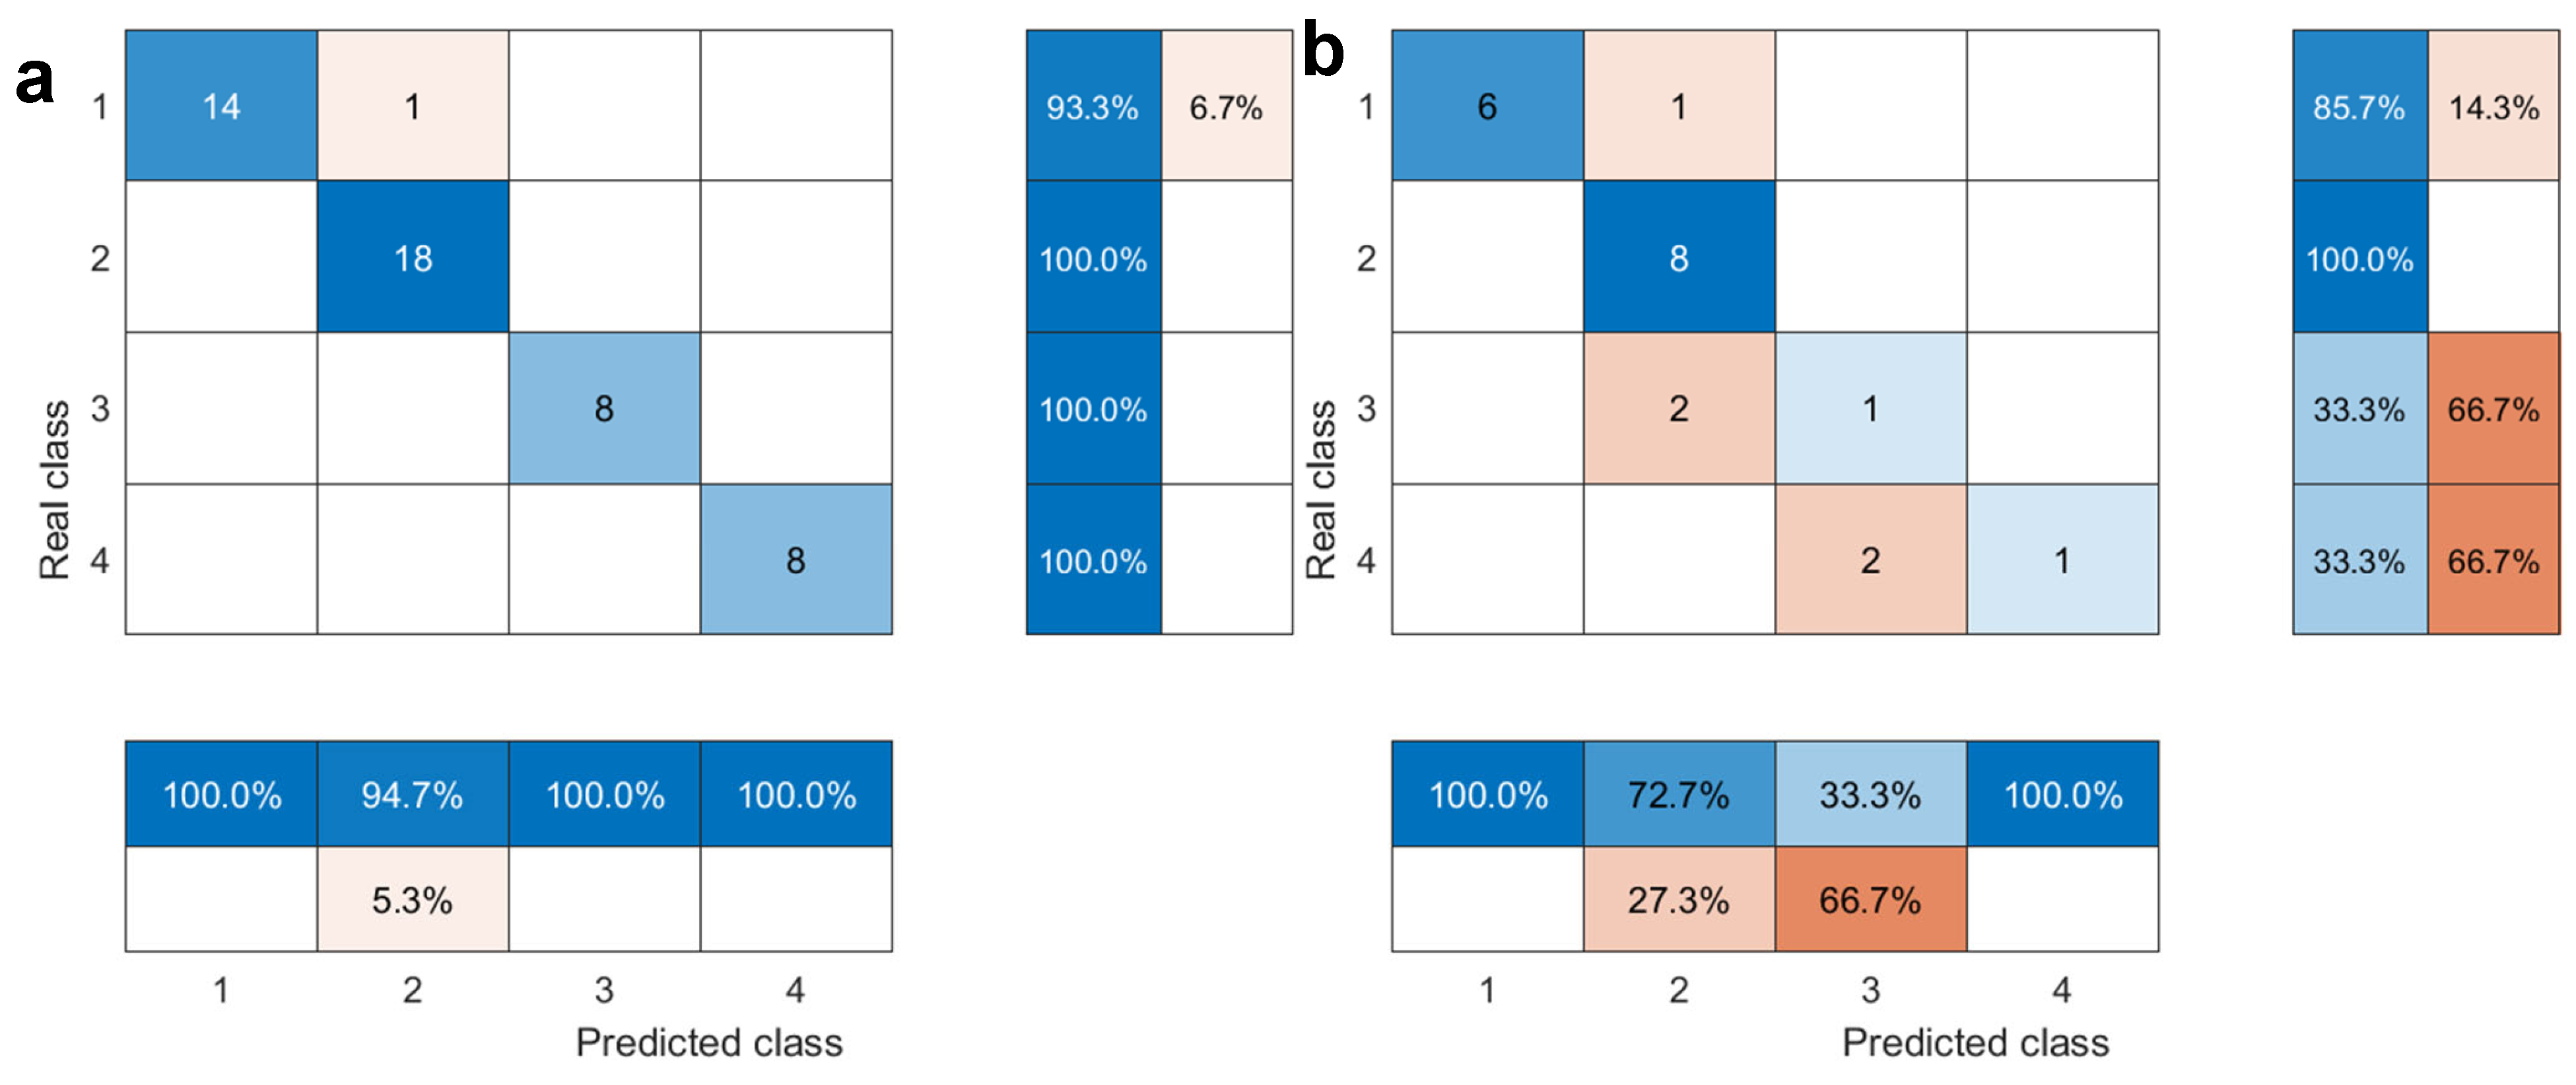
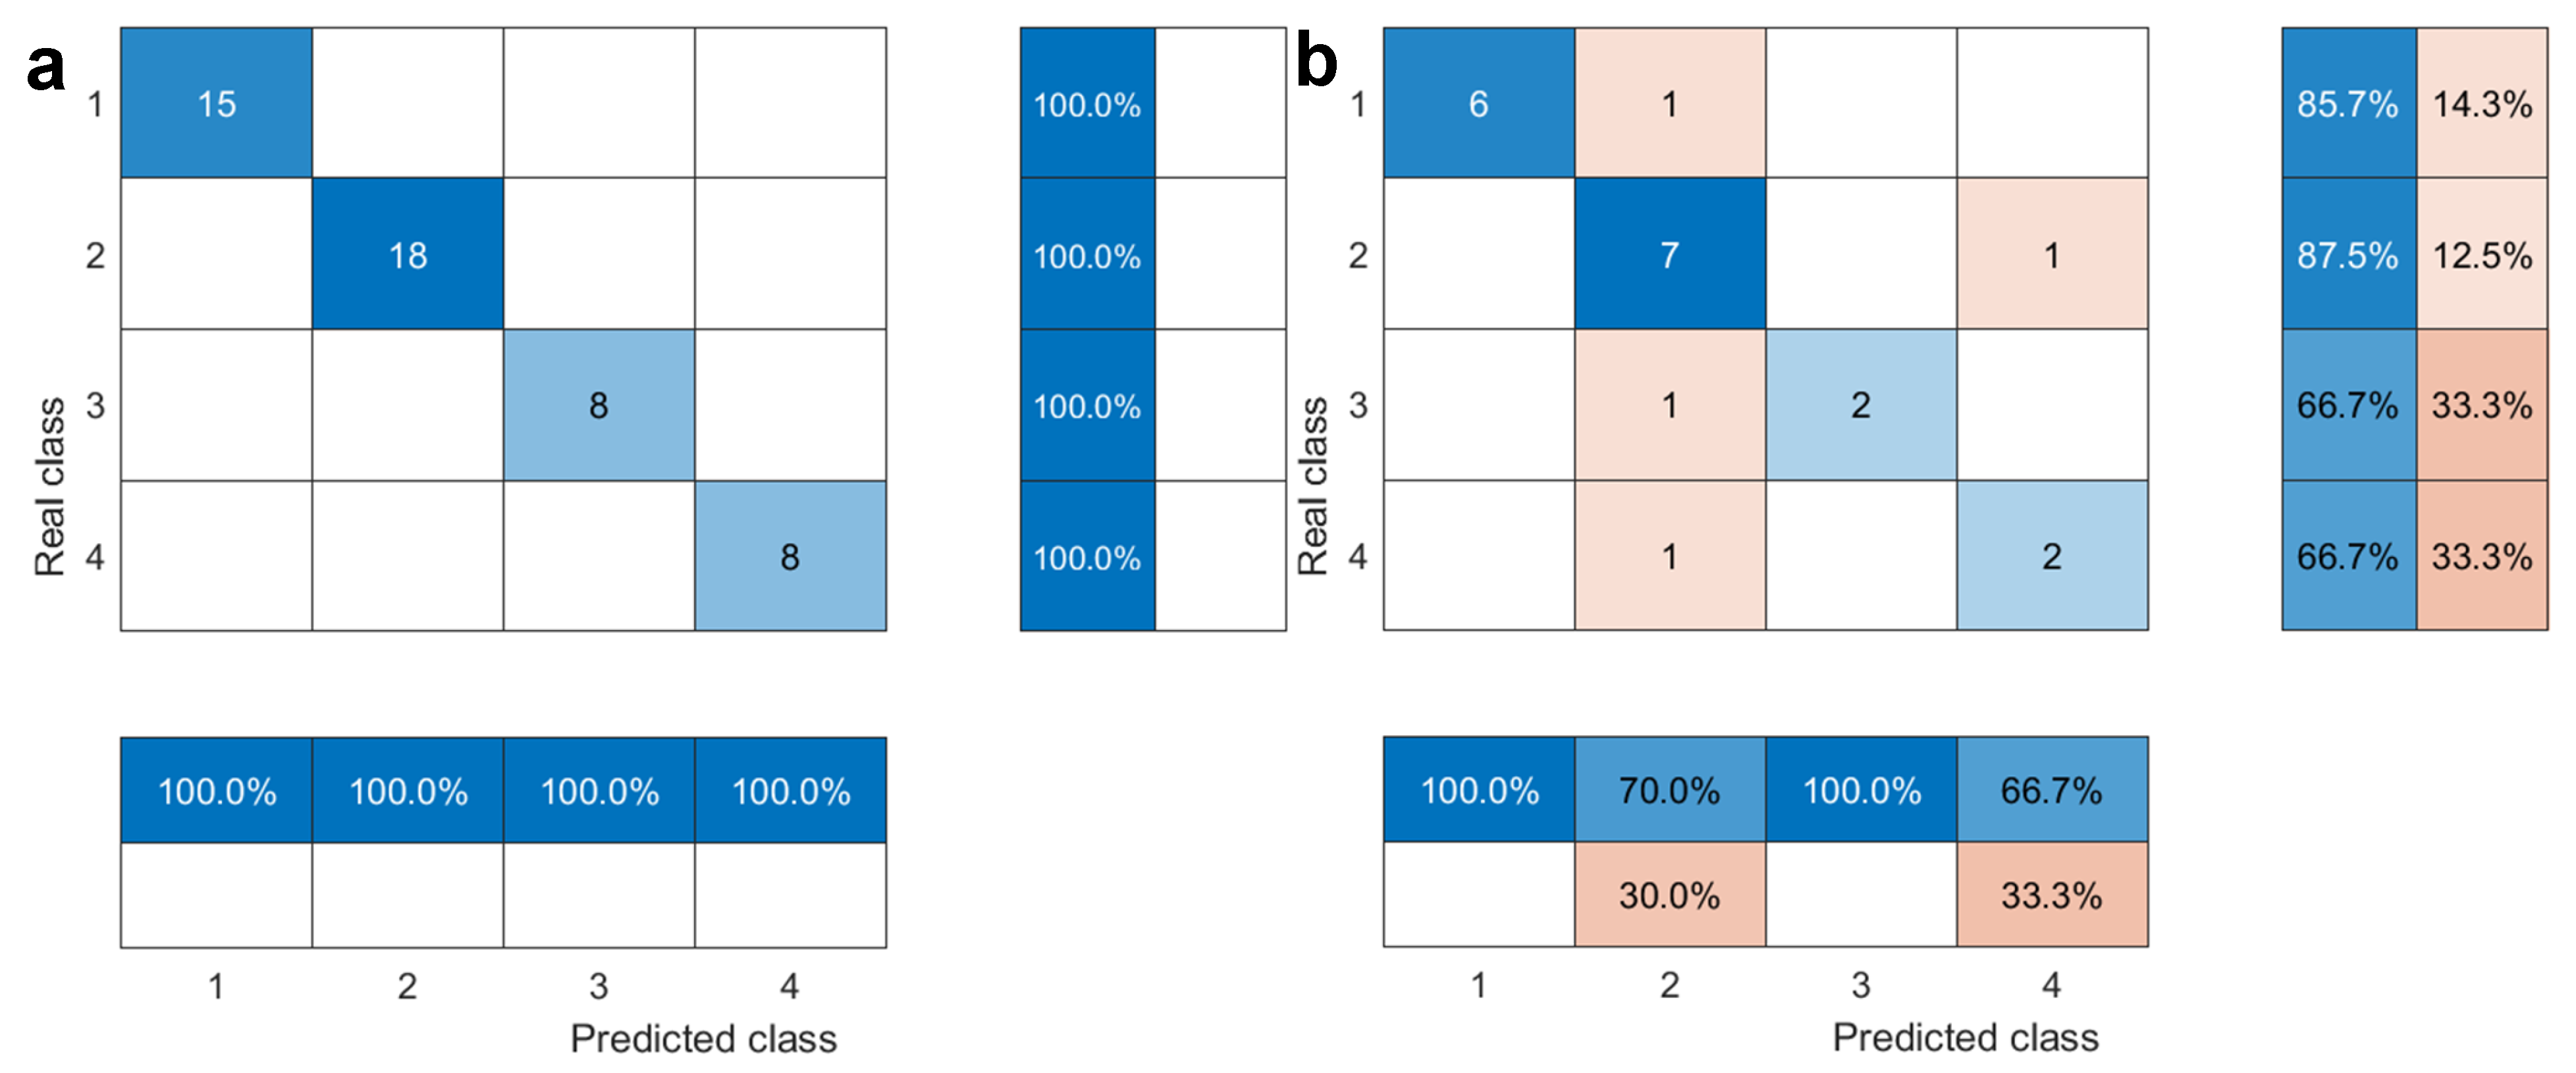
To highlight the superiority and advantage of the KCPA-ISSA-SVM hybrid model in water source classification and recognition, the SVM, SSA-SVM, and ISSA-SVM models are selected as the comparative models in this study. To ensure a fair comparison, all models are subjected to hyperparameter optimization under identical conditions with the target model. A performance comparison between these models and the KCPA-ISSA-SVM model was conducted using the training samples. The comparative outcomes are summarized in Figure 9, while the corresponding confusion matrices for both training and testing sets are provided in Figure 10, Figure 11 and Figure 12.
A comparative analysis of the four models reveals that the KCPA-ISSA-SVM model achieves the highest discrimination accuracy on the training samples. In contrast, the traditional SVM model yields the lowest. The remaining models, ranked in descending order of performance, are the ISSA-SVM model followed by the SSA-SVM model. These results clearly demonstrate that integrating the SSA algorithm enhances discriminative accuracy compared to the standard SVM, and that the improved ISSA algorithm outperforms the SSA variant. Most significantly, the KCPA-ISSA-SVM model—which incorporates kernel principal component analysis and is optimized with the ISSA algorithm—substantially improves discrimination accuracy over both the SSA-SVM and ISSA-SVM models.
To comprehensively assess the performance of the four models, their discrimination outcomes were examined using the confusion matrices derived from the testing samples. Each model was evaluated across multiple metrics—including precision (P), recall (R), F1-score, Kappa coefficient (K), Matthews Correlation Coefficient (MCC), and geometric mean (G-mean)—All computed based on the confusion matrix [44,45,46,47]. The definitions and implications of these metrics are outlined below: Precision refers to the proportion of correctly predicted positive instances among all predicted positives. Recall indicates the percentage of actual positive cases that were accurately predicted. The F1-score, ranging from 0 to 1, represents the harmonic mean of precision and recall, and is particularly useful for evaluating classification performance on imbalanced datasets. The Kappa statistic serves as a measure of classification consistency beyond chance agreement. MCC incorporates all elements of the confusion matrix and offers a balanced evaluation that is robust to class imbalance, with values between −1.0 and 1.0, where higher values indicate better predictive performance. In multi-class settings, MCC is generalized using a confusion matrix over K classes. In addition, the G-mean metric is usually employed to assess classifier performance on imbalanced data distributions. The quantitative formula for calculating evaluation metrics is presented by Equation (9).
P = T P T P + F P R = T P T P + F N F 1 s c o r e = 2 × P × R P + R K = P 0 P e 1 P e M C C = c × s k K p k × t k ( s 2 k K p k 2 ) ( s 2 k K t k 2 ) G m e a n = P × R
In the context of a confusion matrix, TP refers to the count of true positive predictions, FP to false positives, FN to false negatives, and TN to true negatives. P0 is the total number of correctly classified water samples divided by the total number of water samples, i.e., the overall classification accuracy. Pe is the model’s predictive accuracy based on each class’s prediction. c = k K C k k is the total number of correctly predicted water samples, k = 1, 2, 3, 4, and K = 4. s = i K j K C i j is the total number of water samples. p k = i K C k i is the number of times that class k is predicted in the column direction. t k = i K C i k is the number of times that class k truly occurred in the row direction.
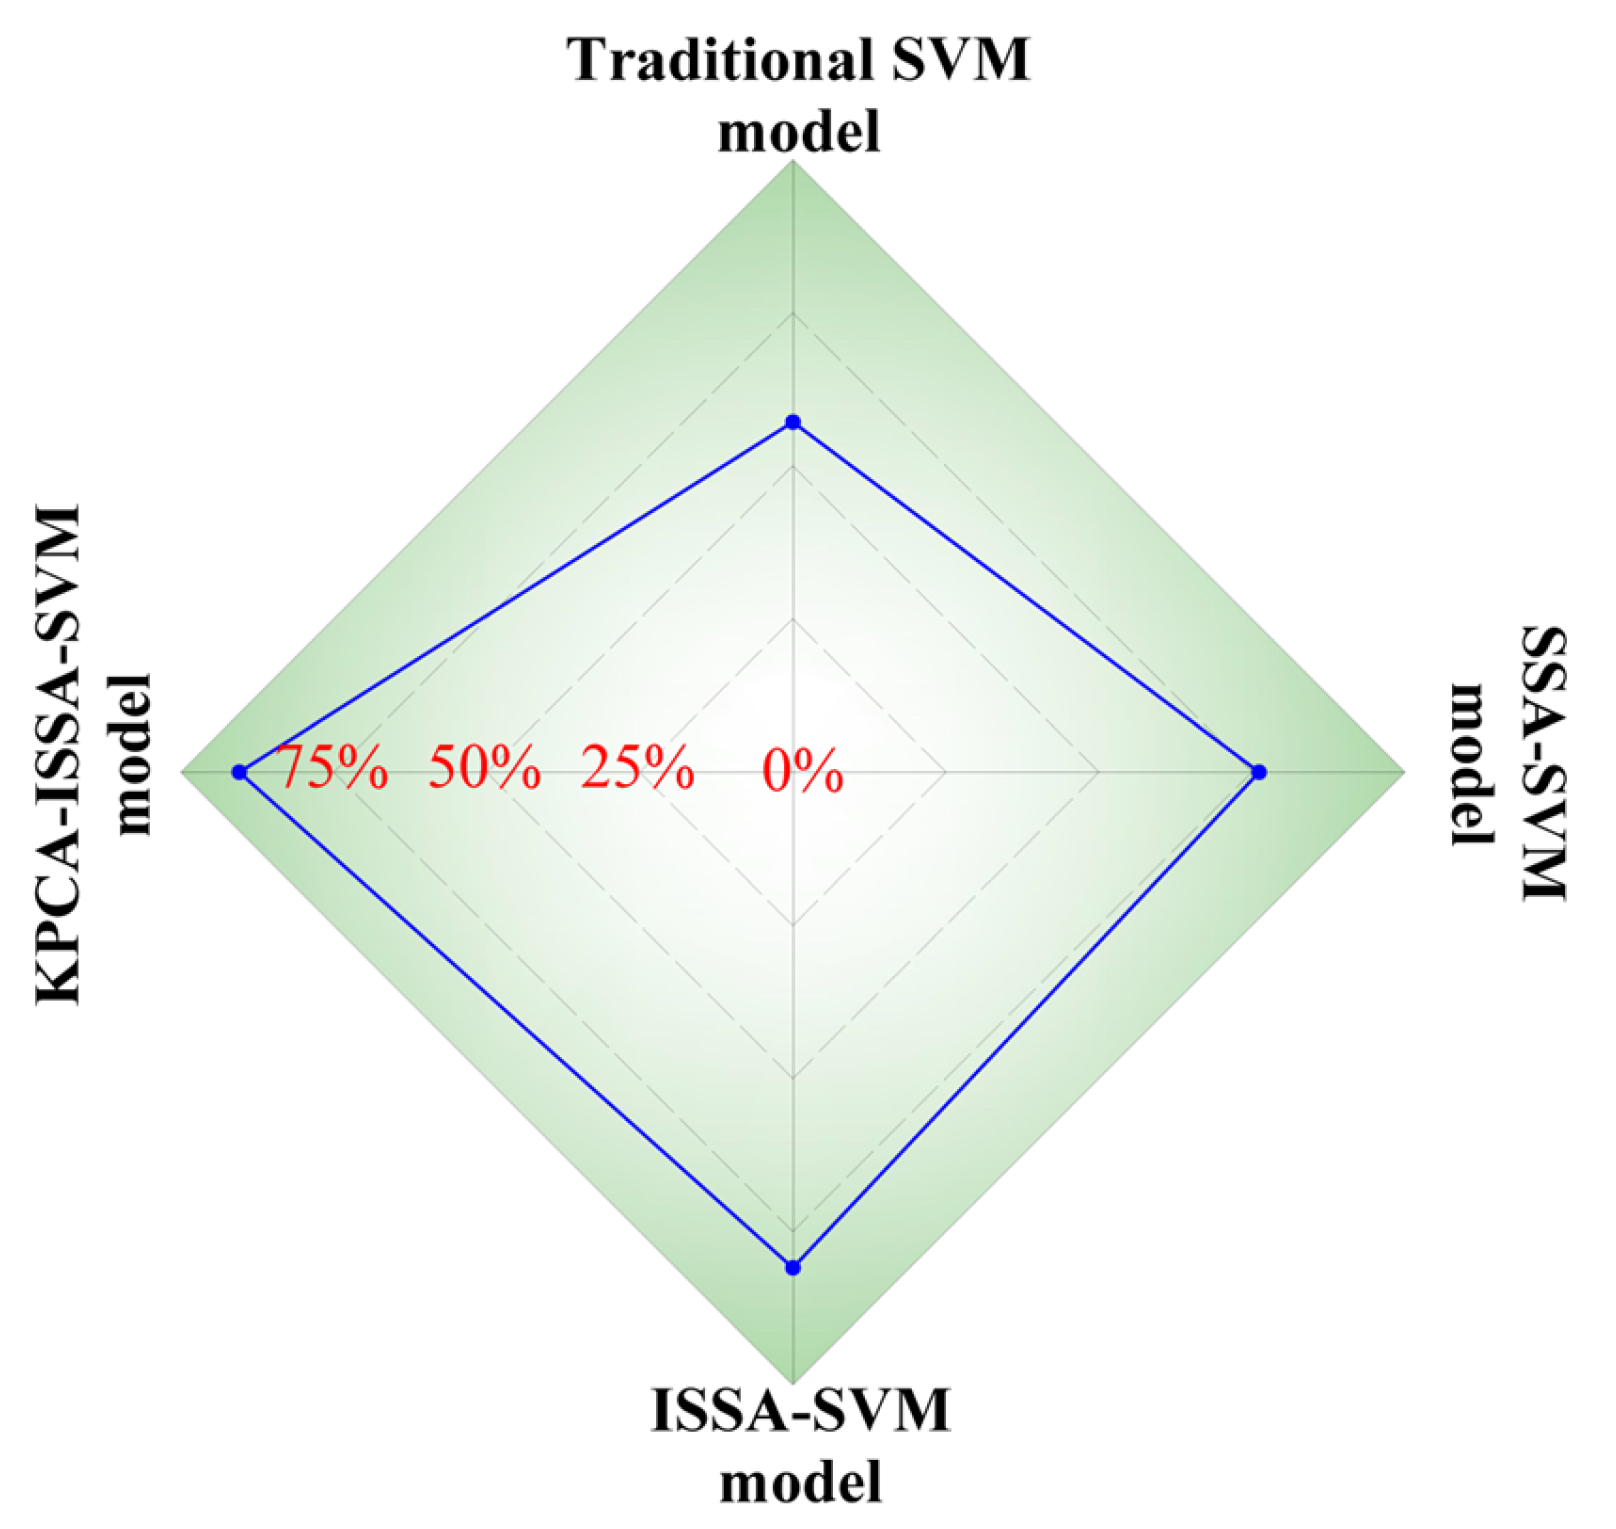
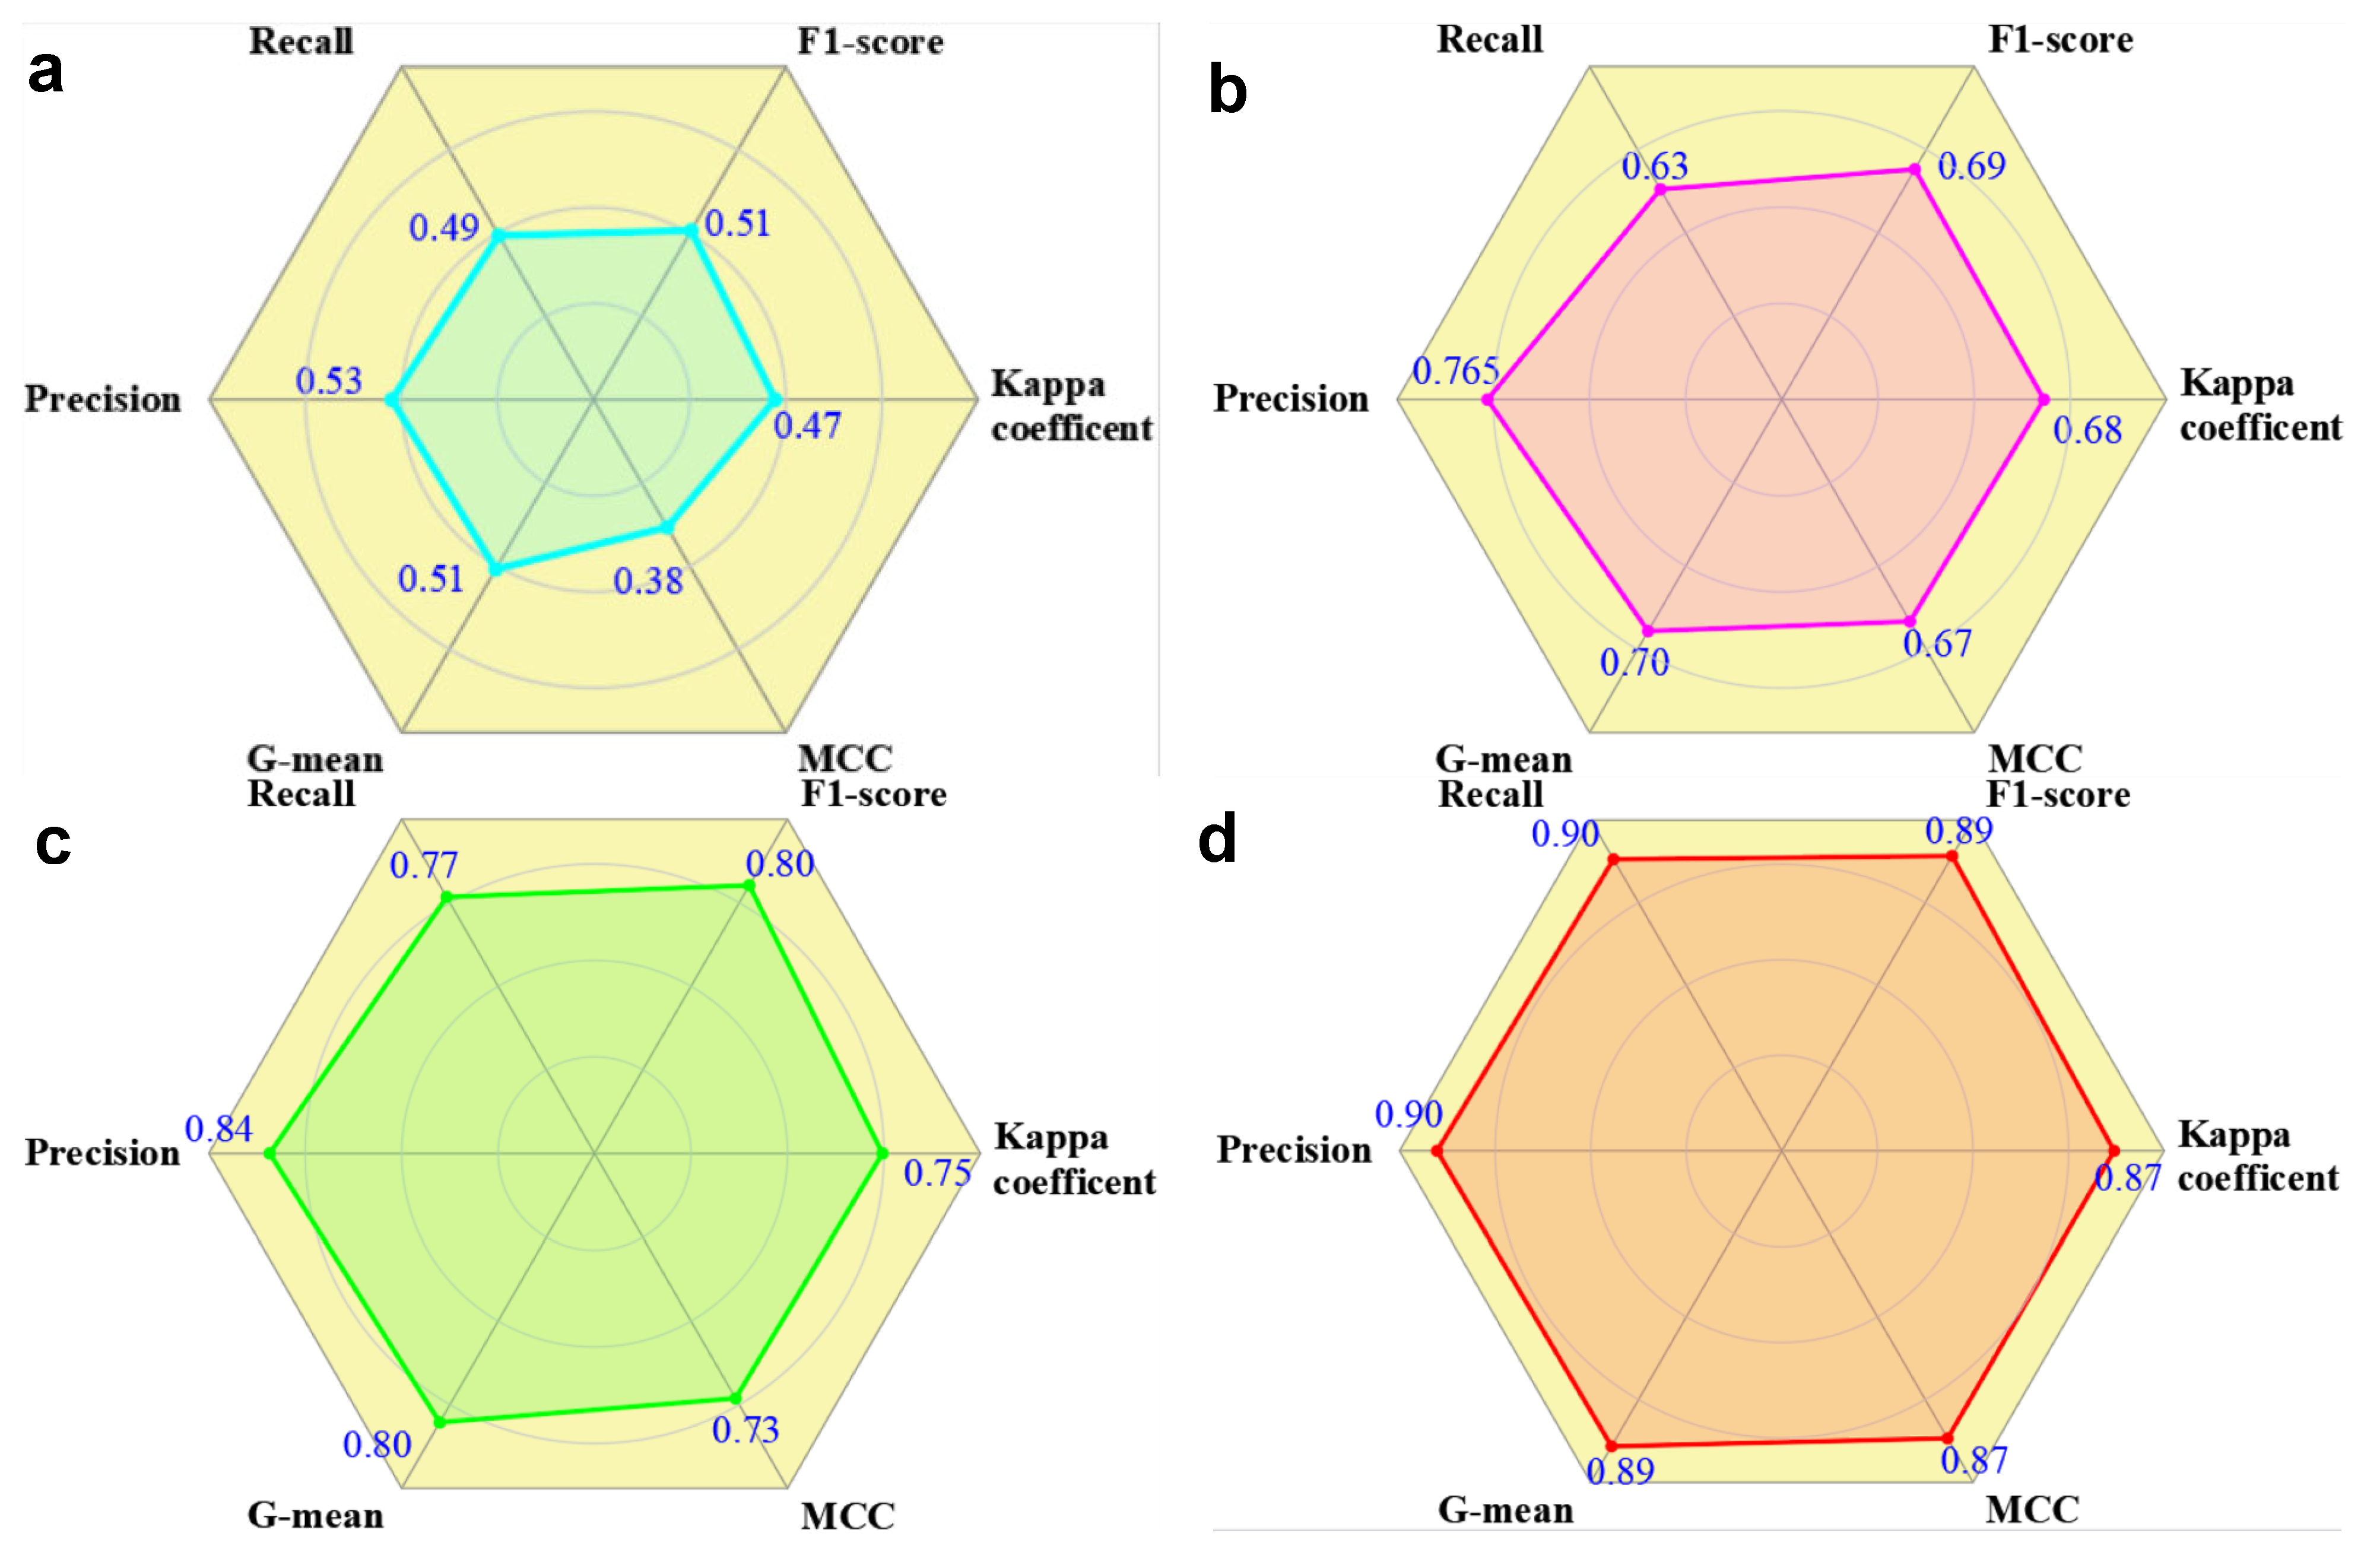
Using Equation (9), the confusion matrices of the testing samples for the four models were computed, and the results of seven evaluation metrics for the four comparative models are illustrated in Figure 13. The KPCA-ISSA-SVM model demonstrated significantly higher values in six evaluation metrics, suggesting that it outperforms the other three models regarding adaptability and robustness. The calculation results are P = 0.90, R = 0.88, F1-score = 0.89, K = 0.87, MCC = 0.87, and G-mean = 0.89. The performance of traditional SVM is the worst in identifying water source types. In addition, to confirm that the proposed model is superior to SVM, SSA-SVM, and ISSA-SVM, we have conducted a paired statistical significance test on the K-fold cross-validation results of the KPCA-ISSA-SVM model and the best-performing baseline model (ISSA-SVM), taking the F1-score as an example. We adopted the non-parametric Wilcoxon signed-rank test, which does not rely on the assumption of normal distribution and applies to the case of small samples. Our preliminary test results are as follows: Based on the paired F1-score of 5-fold cross-validation, the p-value of the performance difference between KPCA-SAIS-SVM and SAIS-SVM is 0.042 (significance level α = 0.05). This result provides statistical evidence indicating that our proposed model’s performance improvement is statistically significant. Considering that the amount of the selected dataset in this study is relatively smaller (<100 water samples), the KPCA-ISSA-SVM model may achieve better prediction results if more water samples are involved.

5. Conclusions

In this study, taking the Gubei colliery in Huainan mining area as an application case, 70 groups of water samples after CBE calculation are selected from four limestone aquifers (C3I, C3II, C3III, and O1+2). Nine hydrochemical indicators are chosen, and the KPCA is performed on the indicators to eliminate redundant information between the raw data. The Improved Sparrow Search Algorithm (ISSA) is employed to automatically determine the optimal values of the SVM model’s two pivotal parameters: the penalty factor C and the kernel parameter g. Finally, we establish the KPCA-ISSA-SVM hybrid model and conduct the prediction effect verification analysis with the other comparative models. The specific conclusions are as follows:
(1)
Nine hydro-chemical indicators include Ca2+, Mg2+, K++Na+, HCO3, Cl, SO42−, total hardness (TH), alkalinity (Alk.), and pH. Statistical analysis reveals significant correlations between ions, such as K++, Na+, Ca2+, and TH. Utilizing the KPCA to realize dimensionality reduction is necessary for overcoming information redundancy. Six new features are extracted from raw data with an information content of 95%.
(2)
The optimized KPCA-ISSA-SVM model is trained with 49 water samples, and the results show that the model has a better fitting capability. In addition, the prediction accuracy of the testing water samples using the trained model is 90.476% (=19/21).
(3)
A comparative study is conducted to evaluate the KPCA-ISSA-SVM model against three benchmark models (SVM, SSA-SVM, and ISSA-SVM) through seven evaluation metrics of accuracy, P, R, F1-score, K, MCC, and G-mean. The results show that the KPCA-ISSA-SVM model demonstrated significantly higher values in seven evaluation indexes, suggesting that it outperforms the other benchmark models.
Although some achievements have been made, there are still some limitations to be improved in this study. The proposed hybrid model obtained from the limited data may not be applied to mines in other mining areas, and even other mines in the same mining area. In addition, the small dataset in this study may lead to overfitting of the data and thereby reduce the prediction accuracy of the proposed model. However, an extensive data library can be established as mine water chemistry data accumulates. In the event of a mine water inrush accident, using mature machine learning algorithms, the source of the water inrush can be quickly identified, enabling prompt and effective measures to be taken to reduce the impact of the disaster.

Author Contributions

Conceptualization, X.L. and Q.W.; methodology, X.L.; software, B.X.; validation, J.Z.; formal analysis, J.Z.; investigation, B.X.; resources, J.Z.; data curation, Q.W.; writing—original draft preparation, J.Z.; writing—review and editing, Q.W.; visualization, X.L.; supervision, B.X.; project administration, B.X.; funding acquisition, J.Z. All authors have read and agreed to the published version of the manuscript.

Funding

This research was funded by the Postgraduate Research & Practice Innovation Program of Jiangsu Province (No. KYCX23_2760), the Fundamental Research Funds for the Central Universities (No.2023XSCX003), and the Graduate Innovation Program of China University of Mining and Technology (No.2023WLKXJ003).

Data Availability Statement

The data presented in this study are available upon request from the corresponding author.

Conflicts of Interest

Author Xikun Lu was employed by YingDa Insurance Asset Management Co., Ltd. The remaining authors declare that the research was conducted in the absence of any commercial or financial relationships that could be construed as a potential conflict of interest.

Appendix A

Table A1. Mine water source identification related to machine learning.
Study (Author, Year)Machine Learning Techniques AppliedData TypesApplication CasePerformance
Wei et al. (2022) [14]PCSOM-GWOSVMhydrochemical dataZhaogezhuang minediscrimination time = 1.1255 s
Wang et al. (2023) [15]KPCA-ISSA-KELMhydrochemical dataaccuracy increased by 4.17%
Chen et al. (2022) [25]BP–Fisherhydrochemical dataLuxi mining areaverification by hydrological observation holes
Ji et al. (2022) [26]PSO-LightGBMhydrochemical dataDonghuatuo minehighest accuracy of 97.22%
Jiang et al. (2024) [27]FA-PSO-BPhydrochemical dataGubei mineaccuracy = 100%
Cui et al. (2025) [31]SIOA-GWO-DFNNhydrochemical dataBingchang mining areaaccuracy = 92.5%
Fang et al. (2022) [32]ELM-CNNspectral data/electrical conductivityNo.2 mineaccuracy = 86.0%
Bi et al. (2024) [33]MFO-LSSVMhydrochemical dataYuanyi mineaccuracy = 94.1%
Lin et al. (2021) [34]IGA-ELMhydrochemical dataZhaogezhuang mining areaaccuracy = 95.0%
Dong et al. (2024) [35]CSSOA-RFspectra dataDonghuatuo mineaccuracy = 100%
Li et al. (2022) [36]GA-XGBoostspectra dataHuangyuchuan mineaverage accuracy = 94.0%

References

  1. Zhao, Y.; Wu, Q.; Chen, T.; Zhang, X.; Du, Y.; Yao, Y. Location and flux discrimination of water inrush using its spreading process in underground coal mine. Safety Sci. 2020, 124, 104566. [Google Scholar] [CrossRef]
  2. Wu, M.; Ye, Y.; Hu, N.; Wang, Q.; Tan, W. Visualization analysis and progress of mine water inrush disaster-related research. Mine Water Environ. 2022, 41, 599–613. [Google Scholar] [CrossRef]
  3. Dong, S.; Zheng, L.; Tang, S.; Shi, P. A scientometric analysis of trends in coal mine water inrush prevention and control for the period 2000–2019. Mine Water Environ. 2020, 39, 3–12. [Google Scholar] [CrossRef]
  4. Meng, Z.; Li, G.; Xie, X. A geological assessment method of floor water inrush risk and its application. Eng. Geol. 2012, 143, 51–60. [Google Scholar] [CrossRef]
  5. Ji, Y.; Yu, L.; Wei, Z.; Ding, J.; Dong, D. Research progress on identification of mine water inrush sources: A visual analysis perspective. Mine Water Environ. 2025, 44, 3–15. [Google Scholar] [CrossRef]
  6. Yin, H.; Zhao, H.; Xie, D.; Sang, S.; Shi, Y.; Tian, M. Mechanism of mine water inrush from overlying porous aquifer in Quaternary: A case study in Xinhe coal mine of Shandong Province, China. Arab. J. Geosci. 2019, 12, 163. [Google Scholar] [CrossRef]
  7. Hou, Z.; Huang, L.; Zhang, S.; Han, X.; Xu, J.; Li, Y. Identification of groundwater hydrogeochemistry and the hydraulic connections of aquifers in a complex coal mine. J. Hydrol. 2024, 628, 130496. [Google Scholar] [CrossRef]
  8. Lu, C.; Cheng, W.; Yin, H.; Li, S.; Zhang, Y.; Dong, F.; Cheng, Y.; Zhang, X. Study on inverse geochemical modeling of hydrochemical characteristics and genesis of groundwater system in coal mine area—A case study of Longwanggou coal mine in Ordos Basin. Environ. Sci. Pollut. Res. 2024, 31, 16583–16600. [Google Scholar] [CrossRef]
  9. Li, P.; Wei, J.; Xu, J.; Li, F.; Liu, B.; Zheng, Y.; Chai, J. Simulation of abnormal evolution and source identification of groundwater chemistry in coal-bearing aquifers at Gaohe coal mine, China. Water 2024, 16, 2506. [Google Scholar] [CrossRef]
  10. Huang, P.; Yang, Z.; Wang, X.; Ding, F. Research on Piper-PCA-Bayes-LOOCV discrimination model of water inrush source in mines. Arab. J. Geosci. 2019, 12, 334. [Google Scholar] [CrossRef]
  11. Hou, E.; Wen, Q.; Che, X.; Wei, J.; Ye, Z. Study on recognition of mine water sources based on statistical analysis. Arab. J. Geosci. 2020, 13, 5. [Google Scholar] [CrossRef]
  12. Yan, P.; Li, G.; Wang, W.; Zhao, Y.; Wang, J.; Wen, Z. A mine water source prediction model based on LIF technology and BWO-ELM. J. Fluoresc. 2024, 35, 1063–1078. [Google Scholar] [CrossRef] [PubMed]
  13. Ma, X.; Yan, P.; Wang, K. Identification of mine water source by random forest combined with laser-induced fluorescence spectra. Front. Environ. Sci. 2024, 12, 1392496. [Google Scholar] [CrossRef]
  14. Wei, Z.; Dong, D.; Ji, Y.; Ding, J.; Yu, L. Source discrimination of mine water inrush using multiple combinations of an improved support vector machine model. Mine Water Environ. 2022, 41, 1106–1117. [Google Scholar] [CrossRef]
  15. Wang, W.; Cui, X.; Qi, Y.; Xue, K.; Liang, R.; Sun, Z.; Tao, H. Mine water inrush source discrimination model based on KPCA-ISSA-KELM. PLoS ONE 2024, 19, e0299476. [Google Scholar] [CrossRef]
  16. Zeng, Y.; Mei, A.; Wu, Q.; Meng, S.; Zhao, D.; Hua, Z. Double verification and quantitative traceability: A solution for mixed mine water sources. J. Hydrol. 2024, 630, 130725. [Google Scholar] [CrossRef]
  17. Liu, Q.; Sun, Y.; Xu, Z.; Xu, G. Application of the comprehensive identification model in analyzing the source of water inrush. Arab. J. Geosci. 2018, 11, 189. [Google Scholar] [CrossRef]
  18. Guo, C.; Gao, J.; Wang, S.; Zhang, C.; Li, X.; Guo, J.; Lu, L. Groundwater geochemical variation and controls in coal seams and overlying strata in the Shennan mining area, Shaanxi, China. Mine Water Environ. 2022, 41, 614–628. [Google Scholar] [CrossRef]
  19. Huang, P.; Gao, H.; Su, Q.; Zhang, Y.; Cui, M.; Chai, S.; Li, Y.; Jin, Y. Identification of mixing water source and response mechanism of radium and radon under mining in limestone of coal seam floor. Sci. Total Environ. 2023, 857, 159666. [Google Scholar] [CrossRef]
  20. Shi, L.; Ma, X.; Han, J.; Su, B. Identification of limestone aquifer inrush water sources in different geological ages based on trace components. Sustainability 2023, 15, 11646. [Google Scholar] [CrossRef]
  21. Wu, D.; Wu, J.; Wei, C.; Gao, X.; Li, B.; Lu, J. Identification and prediction of mixed water sources in adjacent limestone aquifers based on conventional hydrochemistry and strontium isotopes. J. Earth Syst. Sci. 2024, 133, 44. [Google Scholar] [CrossRef]
  22. Zhong, X.; Wu, Q.; Tang, B.; Wang, Y.; Chen, J.; Zeng, Y. Hydrogeochemical mechanisms and hydraulic connection of groundwaters in the Dongming opencast coal mine, Hailar, Inner Mongolia. Mine Water Environ. 2024, 43, 28–40. [Google Scholar] [CrossRef]
  23. Silaban, H.; Zarlis, M. Sawaluddin Analysis of accuracy and epoch on back-propagation BFGS Quasi-Newton. J. Phys. Conf. Ser. 2017, 930, 012006. [Google Scholar] [CrossRef]
  24. Asadisaghandi, J.; Tahmasebi, P. Comparative evaluation of back-propagation neural network learning algorithms and empirical correlations for prediction of oil PVT properties in Iran oilfields. J. Pet. Sci. Eng. 2011, 78, 464–475. [Google Scholar] [CrossRef]
  25. Chen, Y.; Tang, L.; Zhu, S. Comprehensive study on identification of water inrush sources from deep mining roadway. Environ. Sci. Pollut. Res. 2022, 29, 19608–19623. [Google Scholar] [CrossRef]
  26. Ji, Y.; Dong, D.; Mei, A.; Wei, Z. Study on key technology of identification of mine water inrush source by PSO-LightGBM. Water Supply 2022, 22, 7416–7429. [Google Scholar] [CrossRef]
  27. Jiang, Q.; Liu, Q.; Liu, Y.; Chai, H.; Zhu, J. Groundwater chemical characteristic analysis and water source identification model study in Gubei coal mine, Northern Anhui Province, China. Heliyon 2024, 10, e26925. [Google Scholar] [CrossRef] [PubMed]
  28. Hancock, J.; Khoshgoftaar, T.M. Leveraging LightGBM for categorical big data. In Proceedings of the 2021 IEEE Seventh International Conference on Big Data Computing Service and Applications (BigDataService), Oxford, UK, 23–26 August 2021; pp. 149–154. [Google Scholar]
  29. Gaurav, A.; Gupta, B.B.; Chui, K.T. Optimized cyber attack detection in iot networks using feature selection and LightGBM. In Proceedings of the 2024 27th International Symposium on Wireless Personal Multimedia Communications (WPMC), Greater Noida, India, 17–20 November 2024; pp. 1–5. [Google Scholar]
  30. Janizadeh, S.; Thi Kieu Tran, T.; Bateni, S.M.; Jun, C.; Kim, D.; Trauernicht, C.; Heggy, E. Advancing the LightGBM approach with three novel nature-inspired optimizers for predicting wildfire susceptibility in Kauaʻi and Molokaʻi Islands, Hawaii. Expert Syst. Appl. 2024, 258, 124963. [Google Scholar] [CrossRef]
  31. Cui, M.; Hou, E.; Feng, D.; Che, X.; Xie, X.; Hou, P. Identification of the water inrush source based on the deep learning model for mines in Shaanxi, China. Mine Water Environ. 2025, 44, 133–148. [Google Scholar] [CrossRef]
  32. Fang, B. Method for quickly identifying mine water inrush using convolutional neural network in coal mine safety mining. Wirel. Pers. Commun. 2022, 127, 945–962. [Google Scholar] [CrossRef]
  33. Bi, Y.; Shen, S.; Wu, J. An improved LSSVM discrimination model based on factor analysis and moth flame optimization algorithm for identifying water inrush sources across multiple aquifers in mines. Environ. Earth Sci. 2024, 83, 424. [Google Scholar] [CrossRef]
  34. Lin, G.; Jiang, D.; Dong, D.; Fu, J.; Li, X. A multilevel recognition model of water inrush sources: A case study of the Zhaogezhuang mining area. Mine Water Environ. 2021, 40, 773–782. [Google Scholar] [CrossRef]
  35. Dong, D.; Meng, F.; Zhang, J.; Zhang, J.; Lin, X. Comprehensive study on the electrical characteristics and full-spectrum tracing of water sources in water-rich coal mines. Water 2024, 16, 2673. [Google Scholar] [CrossRef]
  36. Li, X.; Dong, D.; Liu, K.; Zhao, Y.; Li, M. Identification of mine mixed water inrush source based on genetic algorithm and XGBoost algorithm: A case study of Huangyuchuan mine. Water 2022, 14, 2150. [Google Scholar] [CrossRef]
  37. Zhu, Y.; Yu, J.; Jia, C. Initializing K-means clustering using affinity propagation. In International Conference on Hybrid Intelligent Systems (HIS), Proceedings of the 2009 Ninth International Conference on Hybrid Intelligent Systems, Shenyang, China, 12–14 August 2009; Pan, J.S., Li, J., Abraham, A., Eds.; IEEE Computer Society: Los Alamitos, CA, USA; Volume 1, 2009; pp. 338–343. [Google Scholar]
  38. Kitagawa, Y.; Ishigoka, T.; Azumi, T. Anomaly prediction based on k-means clustering for memory-constrained embedded devices. In International Conference on Machine Learning and Applications (ICMLA), Proceedings of the 2017 16th IEEE International Conference on Machine Learning and Applications (ICMLA), Cancun, Mexico, 18–21 December 2017; Chen, X., Luo, B., Luo, F., Palade, V., Wani, M.A., Eds.; IEEE: New York, NY, USA, 2017; pp. 26–33. [Google Scholar]
  39. Liu, Z.; Chen, D.; Bensmail, H.; Xu, Y. Clustering gene expression data with kernel principal components. J. Bioinform. Comput. Biol. 2005, 3, 303–316. [Google Scholar] [CrossRef]
  40. Vo, H.X.; Durlofsky, L.J. Regularized kernel PCA for the efficient parameterization of complex geological models. J. Comput. Phys. 2016, 322, 859–881. [Google Scholar] [CrossRef]
  41. Vapnik, V.; Izmailov, R. Synergy of monotonic rules. J. Mach. Learn. Res. 2016, 17, 136. [Google Scholar]
  42. Vapnik, V.; Izmailov, R. Reinforced SVM method and memorization mechanisms. Pattern Recogn. 2021, 119, 108018. [Google Scholar] [CrossRef]
  43. Zhao, D.; Zeng, Y.; Wu, Q.; Du, X.; Gao, S.; Mei, A.; Zhao, H.; Zhang, Z.; Zhang, X. Source discrimination of mine gushing water using self-organizing feature maps: A case study in Ningtiaota coal mine, Shaanxi, China. Sustainability 2022, 14, 6551. [Google Scholar] [CrossRef]
  44. Chicco, D.; Jurman, G. The advantages of the Matthews Correlation Coefficient (MCC) over F1 score and accuracy in binary classification evaluation. BMC Genom. 2020, 21, 6. [Google Scholar] [CrossRef]
  45. Grandini, M.; Bagli, E.; Visani, G. Metrics for multi-class classification: An overview. arXiv 2020. [Google Scholar] [CrossRef]
  46. Tewari, S.; Dwivedi, U.D. A Comparative Study of heterogeneous ensemble methods for the identification of geological lithofacies. J. Petrol. Explor. Prod. Technol. 2020, 10, 1849–1868. [Google Scholar] [CrossRef]
  47. Prasad, A.; Chandra, S. PhiUSIIL: A diverse security profile empowered phishing URL detection framework based on similarity index and incremental learning. Comput. Secur. 2024, 136, 103545. [Google Scholar] [CrossRef]
Figure 1. Workflow of the KPCA-ISSA-SVM model.
Water 17 02859 g001
Figure 2. Location of the study area and spatial structure of limestone aquifers. (a) Distribution of collieries in the Huainan coalfield. (b) Limestone aquifer structures.
Water 17 02859 g002
Figure 3. K–means clustering analysis visualization results. (a) K–means clustering results (PCA space). (b) Silhouette distribution. (c) Cluster center feature intensity.
Water 17 02859 g003
Figure 4. Correlation analysis of hydro-chemical indicators. (a) C3I water samples. (b) C3II water samples. (c) C3III water samples. (d) O1+2 water samples.
Water 17 02859 g004
Figure 5. Features extracted by KPCA.
Water 17 02859 g005
Figure 6. Convergence curve for the KPCA-ISSA-SVM model.
Water 17 02859 g006
Figure 7. Comparison between predicted and real types. (a) Training samples. (b) Testing samples.
Water 17 02859 g007
Figure 8. Confusion matrices for the training and testing samples. (a) Training samples. (b) Testing samples.
Water 17 02859 g008
Figure 9. Discrimination accuracy contrast among different models.
Water 17 02859 g009
Figure 10. Traditional SVM model. (a) Training samples. (b) Testing samples.
Water 17 02859 g010
Figure 11. SSA-SVM model. (a) Training samples. (b) Testing samples.
Water 17 02859 g011
Figure 12. ISSA-SVM model. (a) Training samples. (b) Testing samples.
Water 17 02859 g012
Figure 13. Radar chart of evaluation metrics results for comparative models. (a) Traditional SVM model. (b) SSA-SVM model. (c) ISSA-SVM model. (d) KPCA-ISSA-SVM model.
Water 17 02859 g013
Disclaimer/Publisher’s Note: The statements, opinions and data contained in all publications are solely those of the individual author(s) and contributor(s) and not of MDPI and/or the editor(s). MDPI and/or the editor(s) disclaim responsibility for any injury to people or property resulting from any ideas, methods, instructions or products referred to in the content.