Article

Analysis of Driving Factors of Groundwater Chemical Characteristics at Different Depths and Health Effects of Nitrate Exposure in Zhengzhou City, China

1
College of Geosciences and Engineering, North China University of Water Resources and Electric Power, Zhengzhou 450046, China
2
National Key Laboratory of Water Disaster Prevention, Hohai University, Nanjing 210098, China
3
Henan Electric Power Survey & Design Institute, Zhengzhou 450007, China
4
Henan Hydrology and Water Resources Forecasting Center, Zhengzhou 450003, China
*
Author to whom correspondence should be addressed.
Water 2025, 17(19), 2851; https://doi.org/10.3390/w17192851
Submission received: 2 September 2025 / Revised: 23 September 2025 / Accepted: 27 September 2025 / Published: 30 September 2025
(This article belongs to the Section Hydrogeology)

Abstract

Groundwater is a vital water source for human survival and regulates the hydrological cycle within the uppermost strata. Through the processes of recharge and discharge, as well as solute exchange, it interacts with surface water systems in Zhengzhou, e.g., the Yellow River and the Jialu River. Therefore, systematically assessing its hydrochemical characteristics, driving factors, and health risks is crucial for ensuring the safety of public drinking water and regional development. This study focuses on shallow (45~55 m), medium-deep (80~350 m), deep (350~800 m), and ultra-deep (800~1200 m) groundwater in Zhengzhou City. A descriptive statistical analysis was employed to identify the primary chemical constituents of groundwater at various depths within the study area. Piper diagrams and the Shukarev classification method were employed to determine the hydrochemical types of the groundwater. Additionally, Gibbs diagrams, correlation coefficient methods, ion ratio coefficient methods and chlorine–alkali indices were employed to investigate the formation mechanisms of the chemical components of the groundwater, and the health risks in the study area were evaluated. Results: Ca2+ dominates the shallow/medium-deep groundwater, Na+ dominates the deep/ultra-deep groundwater; HCO3 (70~82%) is the dominant anion. Water chemistry shifts from HCO3-Ca to HCO3-Na with depth. Solubilisation, cation exchange, counter-cation exchange, and mixed processes primarily govern the formation of the groundwater’s chemical composition in the study area. Nitrate health risk assessments indicate significant differences in non-carcinogenic risks across four population groups (infants, children, young adults, and adults). Medium-depth groundwater poses a potential risk to all groups, while shallow and deep groundwater threaten only infants. Ultra-deep groundwater carries the lowest risk.

Graphical Abstract

1. Introduction

Groundwater is the most abundant available freshwater resource on the planet [1] with a total volume of 23.4 × 10⁶ km3. Accounting for 30% of the world’s freshwater resources and 2.5% of the planet’s total water volume [2], it plays a pivotal role in social, economic, and environmental aspects [3]. In recent decades, as surface water shortages have intensified, semi-arid and arid regions worldwide have increasingly relied on groundwater resources [4]. Presently, over 2.5 billion people worldwide obtain their drinking water from these sources, with approximately 40% of agricultural irrigation water also being sourced from groundwater [5]. Changes in the natural environment (e.g., rock weathering, atmospheric precipitation, surface water replenishment) and increased human activities (e.g., sewage discharge, agricultural fertilisation, and industrial processes) [6] have led to a shortage of freshwater resources, thereby altering the vulnerability of groundwater systems [7] and exacerbating water quality degradation issues.
The interaction of groundwater with the surrounding aquifer medium during its flow has a significant impact on the chemical composition and evolution of the groundwater system. Furthermore, human activities are intrinsically linked to groundwater quality [4], with practices such as sewage discharge and fertiliser application significantly altering groundwater hydrochemical characteristics (ion concentrations, pH, salinity). Conversely, these altered hydrochemical characteristics directly determine the overall quality of groundwater [8]. Nitrates, a constituent of groundwater pollutants [7], have been observed to accumulate due to the excessive use of nitrogen fertilisers in agriculture and infiltration of domestic sewage. Additionally, nitrates undergo further migration and transformation through hydrorock interactions. The quality of the groundwater is a critical factor in determining the safety of the drinking water in a given region [9]. Prolonged ingestion of water contaminated with nitrates has been demonstrated to engender an elevated risk of developing various pathologies, including methemoglobinemia, digestive system cancers, diabetes, and thyroid diseases [10,11]. Groundwater resources serve as the final receptor of pollutants in the water cycle. Furthermore, once contaminated, these resources are difficult to restore [12,13]. Therefore, the degradation of groundwater quality has become a potential environmental risk. Its continued deterioration may pose cumulative hazards to public health, safety, and ecosystem service functions. Furthermore, this deterioration may trigger irreversible critical risks [14,15]. In light of these findings, a systematic analysis of groundwater quality, an assessment of the extent of pollutant contamination, and an evaluation of the risks to human health are imperative. These efforts provide a foundation for the effective management of groundwater and the regulation of pollutants [16].
As early as the 20th century, the issue of nitrate contamination of groundwater had already attracted international attention [17]. Scholars have carried out a considerable amount of research based on the chemical characteristics of groundwater. According to the characteristics and driving factors of pollution, one study of typical alluvial fan plains in northern China pointed out that human activities (agricultural fertilisation, industrial and domestic sewage discharge) are the dominant factors of nitrate accumulation [18]. Another study focusing on the semi-urban area of southern India also reached a similar conclusion: 43.3% of the samples had excessive nitrate content, which was mainly affected by anthropogenic sources, such as domestic sewage and agricultural activities [19]. A study in the Fereydan region of Iran further confirmed that nitrates are mainly derived from fertilisers and domestic sewage [20]. In order to further analyse the source and transformation mechanism of nitrates, some studies have adopted a multi-technology joint analysis strategy. For example, the integrated application of hydrogeochemical, stable isotope, and MixSIAR models in the hilly region of China revealed the temporal and spatial variation characteristics of surface water–groundwater interaction, nitrate source, and the transformation process driven by seasonal nitrate input in the hilly region of China, and clarifies the regulation mechanism of high-intensity anthropogenic nitrogen input and seasonal hydrological changes on regional hydrochemical characteristics and nitrogen cycle [21]. In the Birimian area of Ghana, the “source-distribution-risk“ chain of groundwater fluoride and nitrate pollution was systematically analysed by combining Kriging interpolation, artificial neural network model, and stoichiometric analysis, emphasising the interaction between geological background and agricultural activities, as well as the high exposure risk of vulnerable groups, such as infants [22]. From a global and regional perspective, a systematic assessment of 292 groundwater sites in the region showed that agricultural fertilisers, industrial wastewater, domestic sewage, and landfill leachate were the main pollutants, of which more than 50 ppm nitrate pollution was particularly serious in Asia, Africa, and the Mediterranean region. Among various removal technologies, the catalytic reduction method has high conversion efficiency and no secondary pollution (such as the formation of toxic intermediates (such as dangerous by-products in the nitrite–nitrogen conversion pathway, the release of residual chemical agents during the treatment process, or accidental changes in the aquatic microbial community, resulting in damage to ecosystem stability), and has attracted much attention [23]. In a case closer to the study area, the principal component analysis of 2348 groundwater samples (2015–2018) in rural areas of Yantai, China, showed that the problem of groundwater nitrate pollution was prominent, which was related to total dissolved solids, total hardness, and chloride, among others. It is speculated that this phenomenon may be due to the interaction between fertiliser and geological factors [24]. One study of the Haouz Plain in Morocco (2015–2018) showed that long-term overexploitation led to a significant decline in groundwater levels (from 1971 to 2020, the proportion of areas with water levels exceeding 40 m increased from 13% to 65%). Shallow groundwater (<40 m) gradually disappeared, and deep groundwater (40–130 m) became the main mining target, which in turn affected the distribution pattern of salt and nitrate [25]. In addition, the study of an intensive agricultural area in Northwest China comprehensively used chemical indicators, double isotopes, random forest model, and Bayesian stable isotope mixing model (MixSIAR). It was found that there was significant nitrate accumulation in the 0–400 m deep soil layer of farmland and a kiwifruit orchard, and soil nitrogen (SN) was identified as the main source of nitrate in the groundwater [12]. The collective findings of these studies underscore the preeminent impact of anthropogenic activities on groundwater nitrate contamination and the pervasive nature of the associated health hazards. This compelling evidence serves as a foundational rationale for the present research, which aims to investigate the vertical stratification patterns and the variability in risk associated with nitrate contamination at varying burial depths.
Zhengzhou city’s water supply is predominantly reliant on surface water sources. The city’s water security is contingent upon this single-source structure (based on the South-to-North Water Diversion Project, the Yellow River water is the supplementary water source, both of which are surface water systems), which renders it vulnerable to potential disruptions. Zhengzhou possesses relatively abundant groundwater resources, making groundwater particularly crucial as an emergency water source under extreme conditions [26]. However, the majority of studies on Zhengzhou’s groundwater have centred on evaluating water resource quantities, with scant research directed towards understanding the vertical variation patterns of water chemistry components. This has led to a superficial understanding of the hydrochemical characteristics and formation mechanisms of aquifers at varying burial depths. Additionally, there is a paucity of in-depth understanding regarding the health risks associated with nitrate pollution, particularly about the sensitivity differences among various populations exposed to groundwater at different depths. This is imperative for the implementation of precise groundwater management and the safeguarding of public health. Therefore, the present study aims to address these gaps through comprehensive research and analysis. A comprehensive approach integrating diverse analytical techniques (Piper, Gibbs, ion ratio coefficients, and chlor–alkali index) was employed to systematically assess the water chemistry characteristics and formation mechanisms of groundwater samples collected at varying burial depths in select areas of Zhengzhou. A stratified health risk model was employed to assess the non-carcinogenic risks of nitrate exposure for different age groups, thereby determining the associated health risks of nitrate in groundwater within the study area. This research provides a scientific foundation for the management of water resources in Zhengzhou and establishes the foundation for the sustainable development of water resources in the region.

2. Study Region

Zhengzhou, the core city of the Central Plains Economic Zone, is distinguished by its rich historical and cultural heritage. The city is located in the north-central part of Henan Province, at the boundary between the middle and lower reaches of the Yellow River. The southwestern part of the region is bordered by the Loess Plateau and the Song Mountains, while the southeastern area is part of the Huanghuai Plain. The topography of the region is characterised by a general slope from southwest to northeast; the gradient of the slope ranges from 3‰ to 8‰, thereby forming a stepped incline in this direction. The city’s total area is 7567 km2, of which 744.15 km2 comprises the built-up area of the central urban district. The remaining 6822.85 km2 comprises rural and agricultural land, ecological and natural land, undeveloped/undevelopable land, and other non-urbanised land (including transportation corridors, such as railways and motorways) within the municipal jurisdiction. The city functions as a significant transportation nexus. The sampling points within the designated study area are predominantly situated within the urban built-up area, as illustrated in Figure 1.
The study area is characterised by a temperate continental monsoon climate, with distinct seasonal variations [27]. The mean annual precipitation is 400~700 mm, with rainfall concentrated between June and September, with August receiving the greatest amount, accounting for approximately 70% of the annual precipitation. The mean annual water surface evaporation is 1221 mm [28].
The geographical area under scrutiny (illustrated in Figure 1) encompasses the Yellow River basin, through which several surface watercourses pass, including the Jia Lu River, Dongfeng Channel, Jinshui River, and Suo Xu River. The study area is characterised by the predominance of groundwater, which is predominantly found within the pores of loose rock formations. The classification of aquifers in this region is dependent on factors such as burial depth and hydraulic properties, and the resulting categorisation system is outlined in [29]. The classification system utilised in this study identifies four distinct categories: shallow groundwater, medium-deep groundwater, deep groundwater, and ultra-deep groundwater. The respective burial depths for these categories are reported as 45~55 m, 80~350 m, 350~800 m, and 80~1200 m, respectively. The lithological characteristics of each aquifer are illustrated in Table 1.
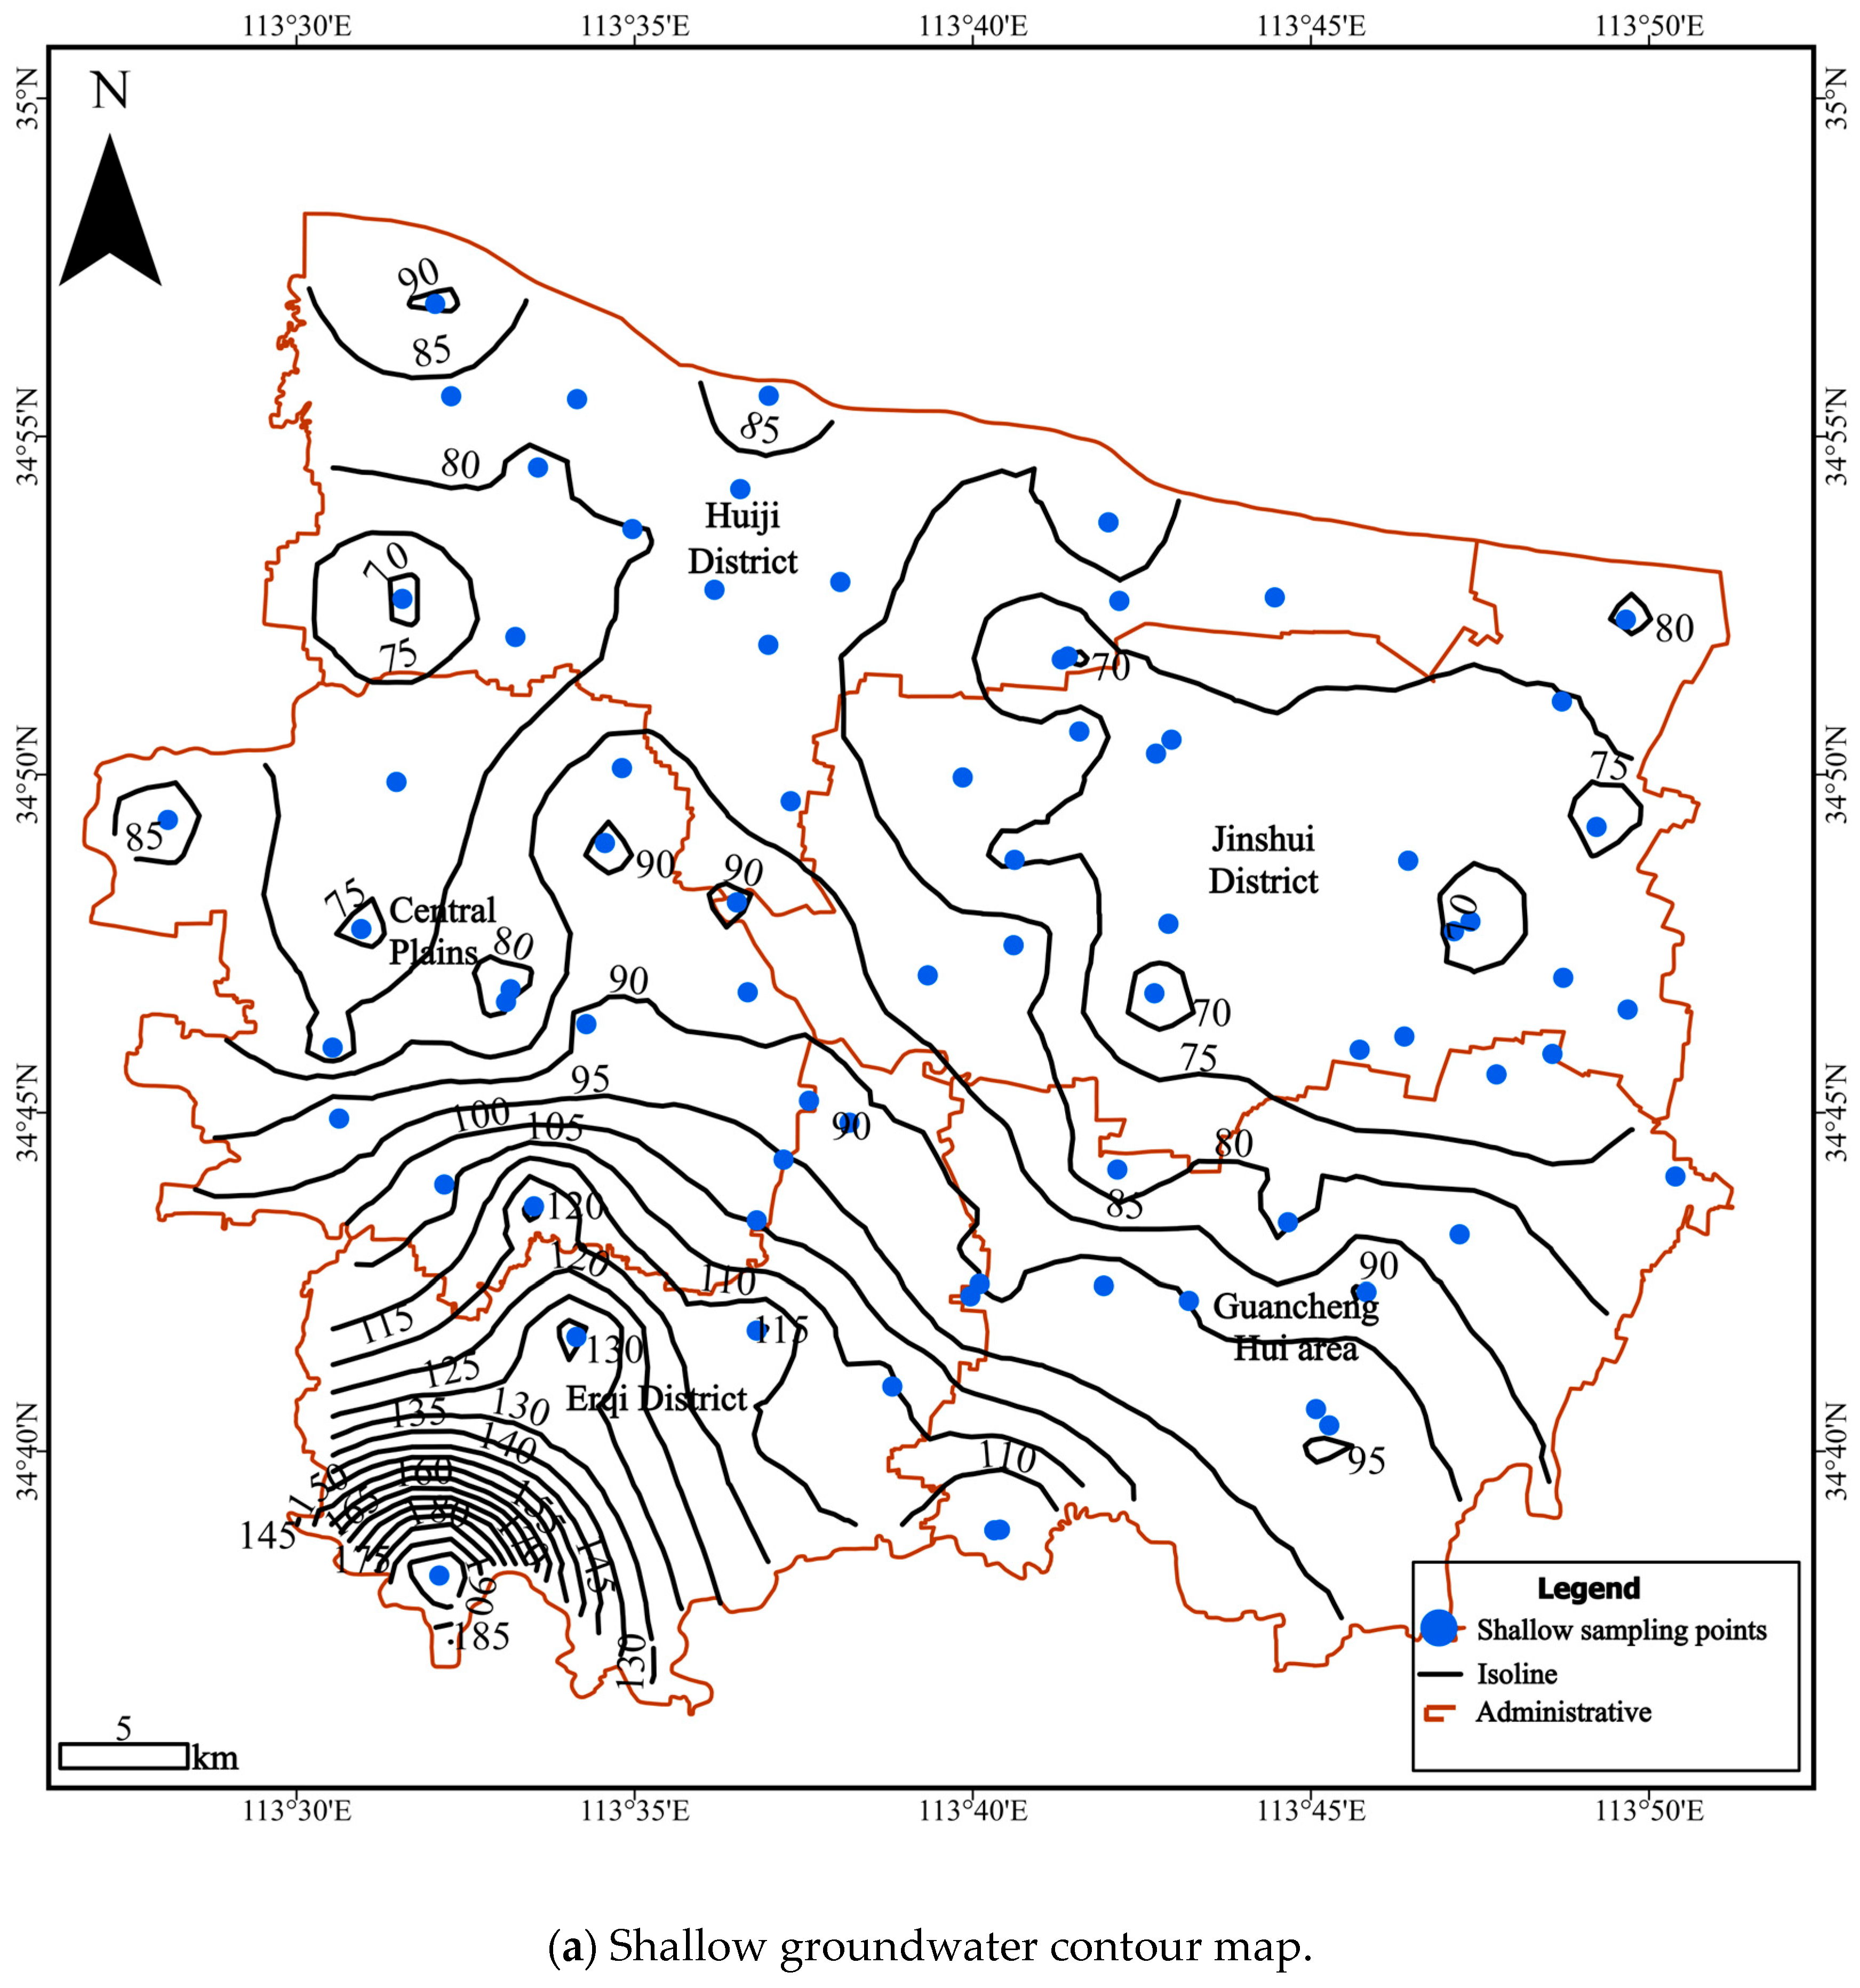
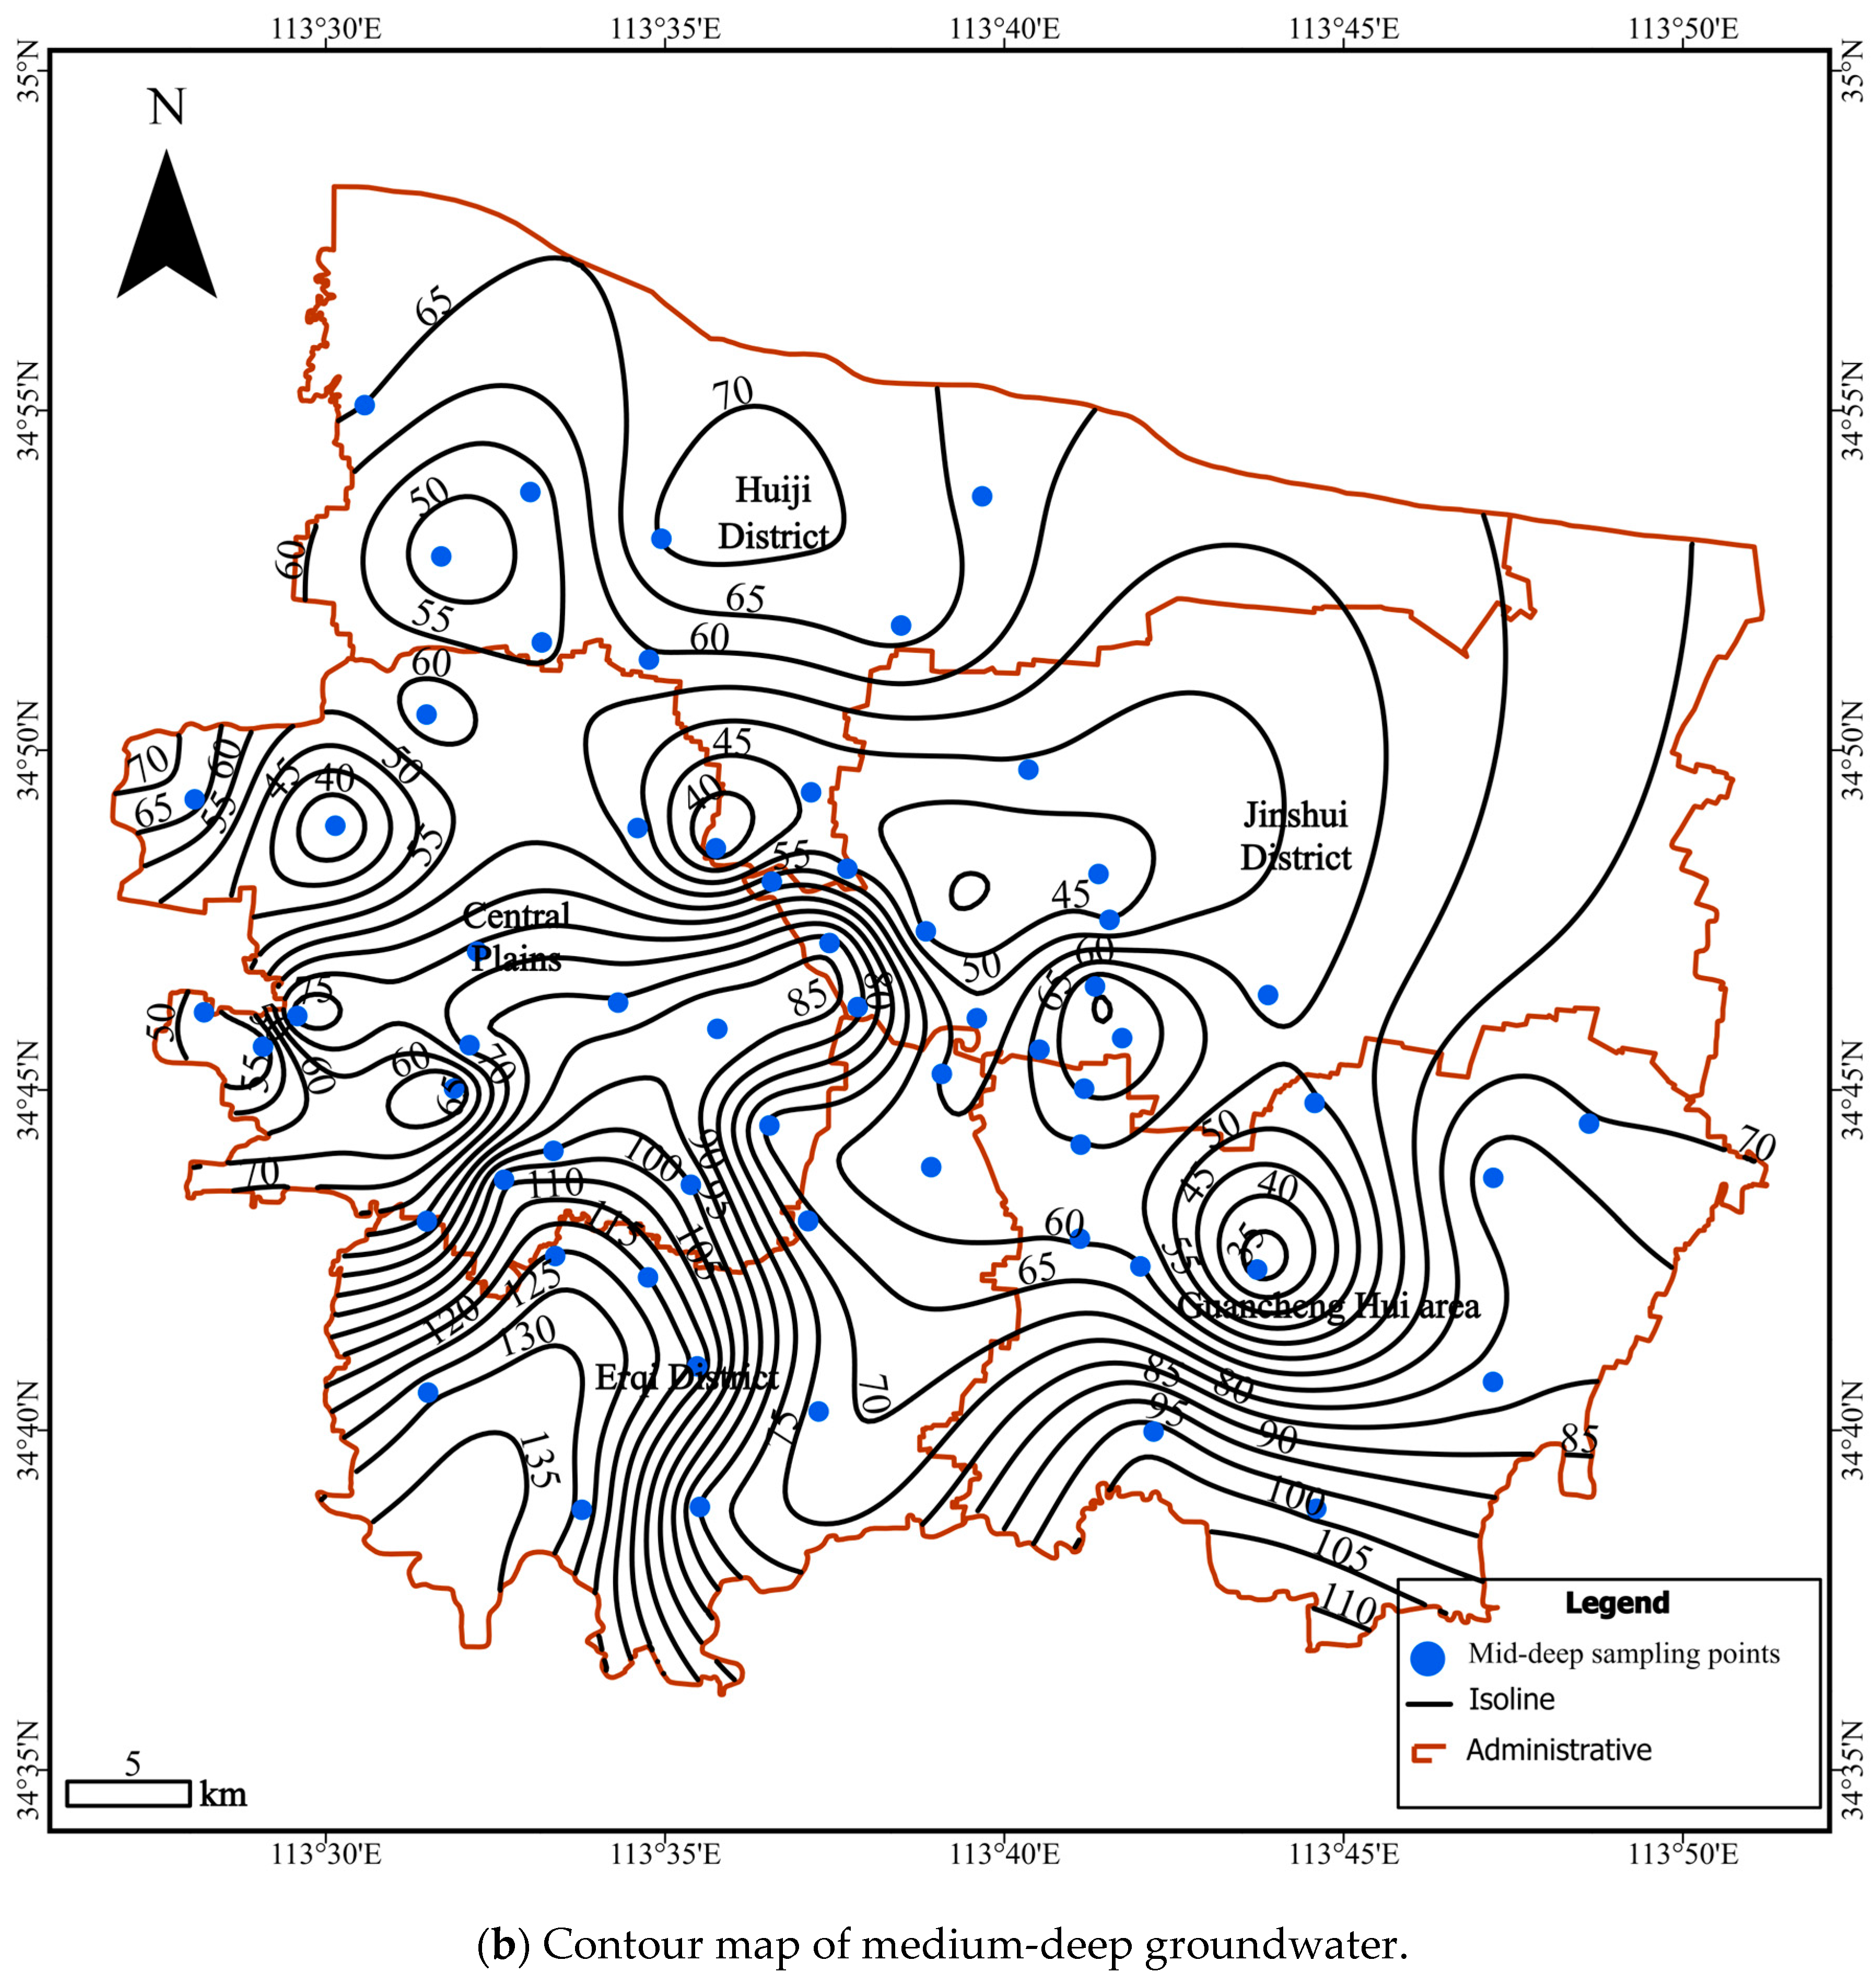
The primary cations and anions in shallow and medium-deep groundwater, along with their mean values, demonstrate a high degree of similarity. Given that both the shallow and medium-deep aquifers in the study area are subject to large-scale extraction and utilisation, particularly the long-term intensive extraction of medium-deep groundwater, which has caused a sharp decline in water levels, the isohyetal maps of shallow and medium-deep groundwater drawn based on water level monitoring data are shown in Figure 2. The movement of water within the hydrosphere is characterised by the influx of shallow groundwater into and subsequent replenishment of medium-depth groundwater. This dynamic process results in the intermingling of the water chemistry of the two aquifers.

3. Materials and Methods

3.1. Groundwater Sampling and Analysis

In 2019, a groundwater sampling programme was conducted in the study area delineated in Figure 1 within the city of Zhengzhou. A total of 91 water samples were collected, comprising 35 samples from shallow depths, 40 from medium-depth, 11 from deep, and 5 from ultra-deep levels. Samples were collected using dry and clean sampling bottles, which were rinsed 2~3 times with groundwater from the study area before sample collection. After collection, the groundwater samples were refrigerated and expedited to the Henan Provincial Geological Engineering Survey Institute laboratory for monitoring and analysis at the earliest opportunity.
The testing parameters encompass a range of ions and parameters, including K+, Na+, Mg2+, Ca2+, SO42−, Cl, HCO3, NO3, F, pH, total dissolved solids (TDS), total hardness (TH, expressed as CaCO3), and ammonia nitrogen (expressed as N). The concentrations of anions and cations were determined using a DX-120 ion chromatograph and inductively coupled plasma atomic emission spectrometry (ICP-AES). The determination of K+, Na+, Mg2+, Ca2+, and total hardness (expressed as CaCO3) was conducted using the flame atomic absorption spectrophotometric method. The determination of total hardness (expressed as CaCO3) was conducted using the sodium ethylenediaminetetraacetate (EDTA) titration method. The determination of SO42−, Cl, HCO3, NO3, F, pH, TDS, and ammonia nitrogen (expressed as N) was conducted through the utilisation of turbidity measurement, silver titration, titration, ultraviolet spectrophotometry, fluoride reagent spectrophotometry, glass electrode method, gravimetric method, and Nessler’s reagent spectrophotometry, respectively. The %CBE is defined as the percentage of ionic charge balance error, calculated using Formula (1) [18]. The results indicate that the %CBE of the analytical data for the groundwater samples collected in this study were all less than ±5%, demonstrating good analytical precision.
% C B E = i m c e i + i m c e i j m c e j + + j m c e j
The hydrochemical types of groundwater can be studied using Piper’s three-line diagram and Shukarev’s classification system [28]. In this study, Origin 2024 software was utilised to plot the Piper diagrams and to analyse the Pearson correlation coefficients between the TDS content and various ion concentrations in the study area [29]. This established the “contribution rate” and “linear relationship strength” of specific ions to the TDS in the water. The analysis of water samples indicated that 73% of the samples were classified as hard, and an additional 9% were deemed to be very hard. The total hardness concentration of the ultra-deep groundwater ranged from 43.80 to 264.88 mg/L, with an average of 101.36 mg/L. Of the samples analysed, 80% were classified as soft and 20% as hard.
The chlor–alkali index has been widely employed in the analysis of ion exchange occurrence [30], with its calculation formula expressed as follows [31]:
C AI-I = γ ( C l ) γ N a + + K + γ C l
C AI-II = γ ( C l ) γ N a + + K + γ S O 4 2 + γ H C O 3 + γ C O 3 2 + γ N O 3

3.2. Human Health Risk Assessment

A human health risk assessment is a method recommended by the US Environmental Protection Agency (USEPA) [32] that links the degree of water pollution to human health and quantitatively describes the harm of pollutants in groundwater to human health [33]. Its extensive utilisation in the domain of groundwater pollutants has been well-documented [34]. This method is founded on four internationally recognised steps: namely, hazard identification, dose–response analysis, exposure assessment, and risk characterisation [35].
The three potential exposure routes are as follows: oral ingestion, inhalation via air, and skin absorption [20]. It is evident that, owing to the low volatility of nitrates, the risk of exposure through inhalation is negligible. Consequently, it is widely accepted that nitrates present a significant health hazard, primarily through the ingestion pathway and via dermal contact. Given that the groundwater in Zhengzhou is primarily used for drinking, this study considers the ingestion of drinking water as the exposure route. The primary method of assessment employed in this context is outlined by the following formula [36]:
H Q = C w × I R × E F × E D B W × A T × R f D
A T = E D × 365
In the formula, Cw (mg/L) denotes the mass concentration of the target substance (i.e., nitrate), IR (L·d−1) is the daily water intake rate, EF (d·a−1) is the exposure frequency, ED (a) is the exposure duration, BW (kg) is the average body weight, AT (day) is the average time, and RfD (mg·kg−1·d−1) is the reference dose for the pollutant. The values of relevant parameters for each group are shown in Table 2.

4. Results and Discussion

4.1. Groundwater Chemistry

4.1.1. Descriptive Statistics

The initial understanding of the chemical characteristics of groundwater in a region can be facilitated by the calculation of descriptive statistics of its chemical composition. The statistical tables illustrating the major chemical components of the groundwater in Zhengzhou City for the years 2015 and 2019 can be found in Table 3 and Table 4, respectively.
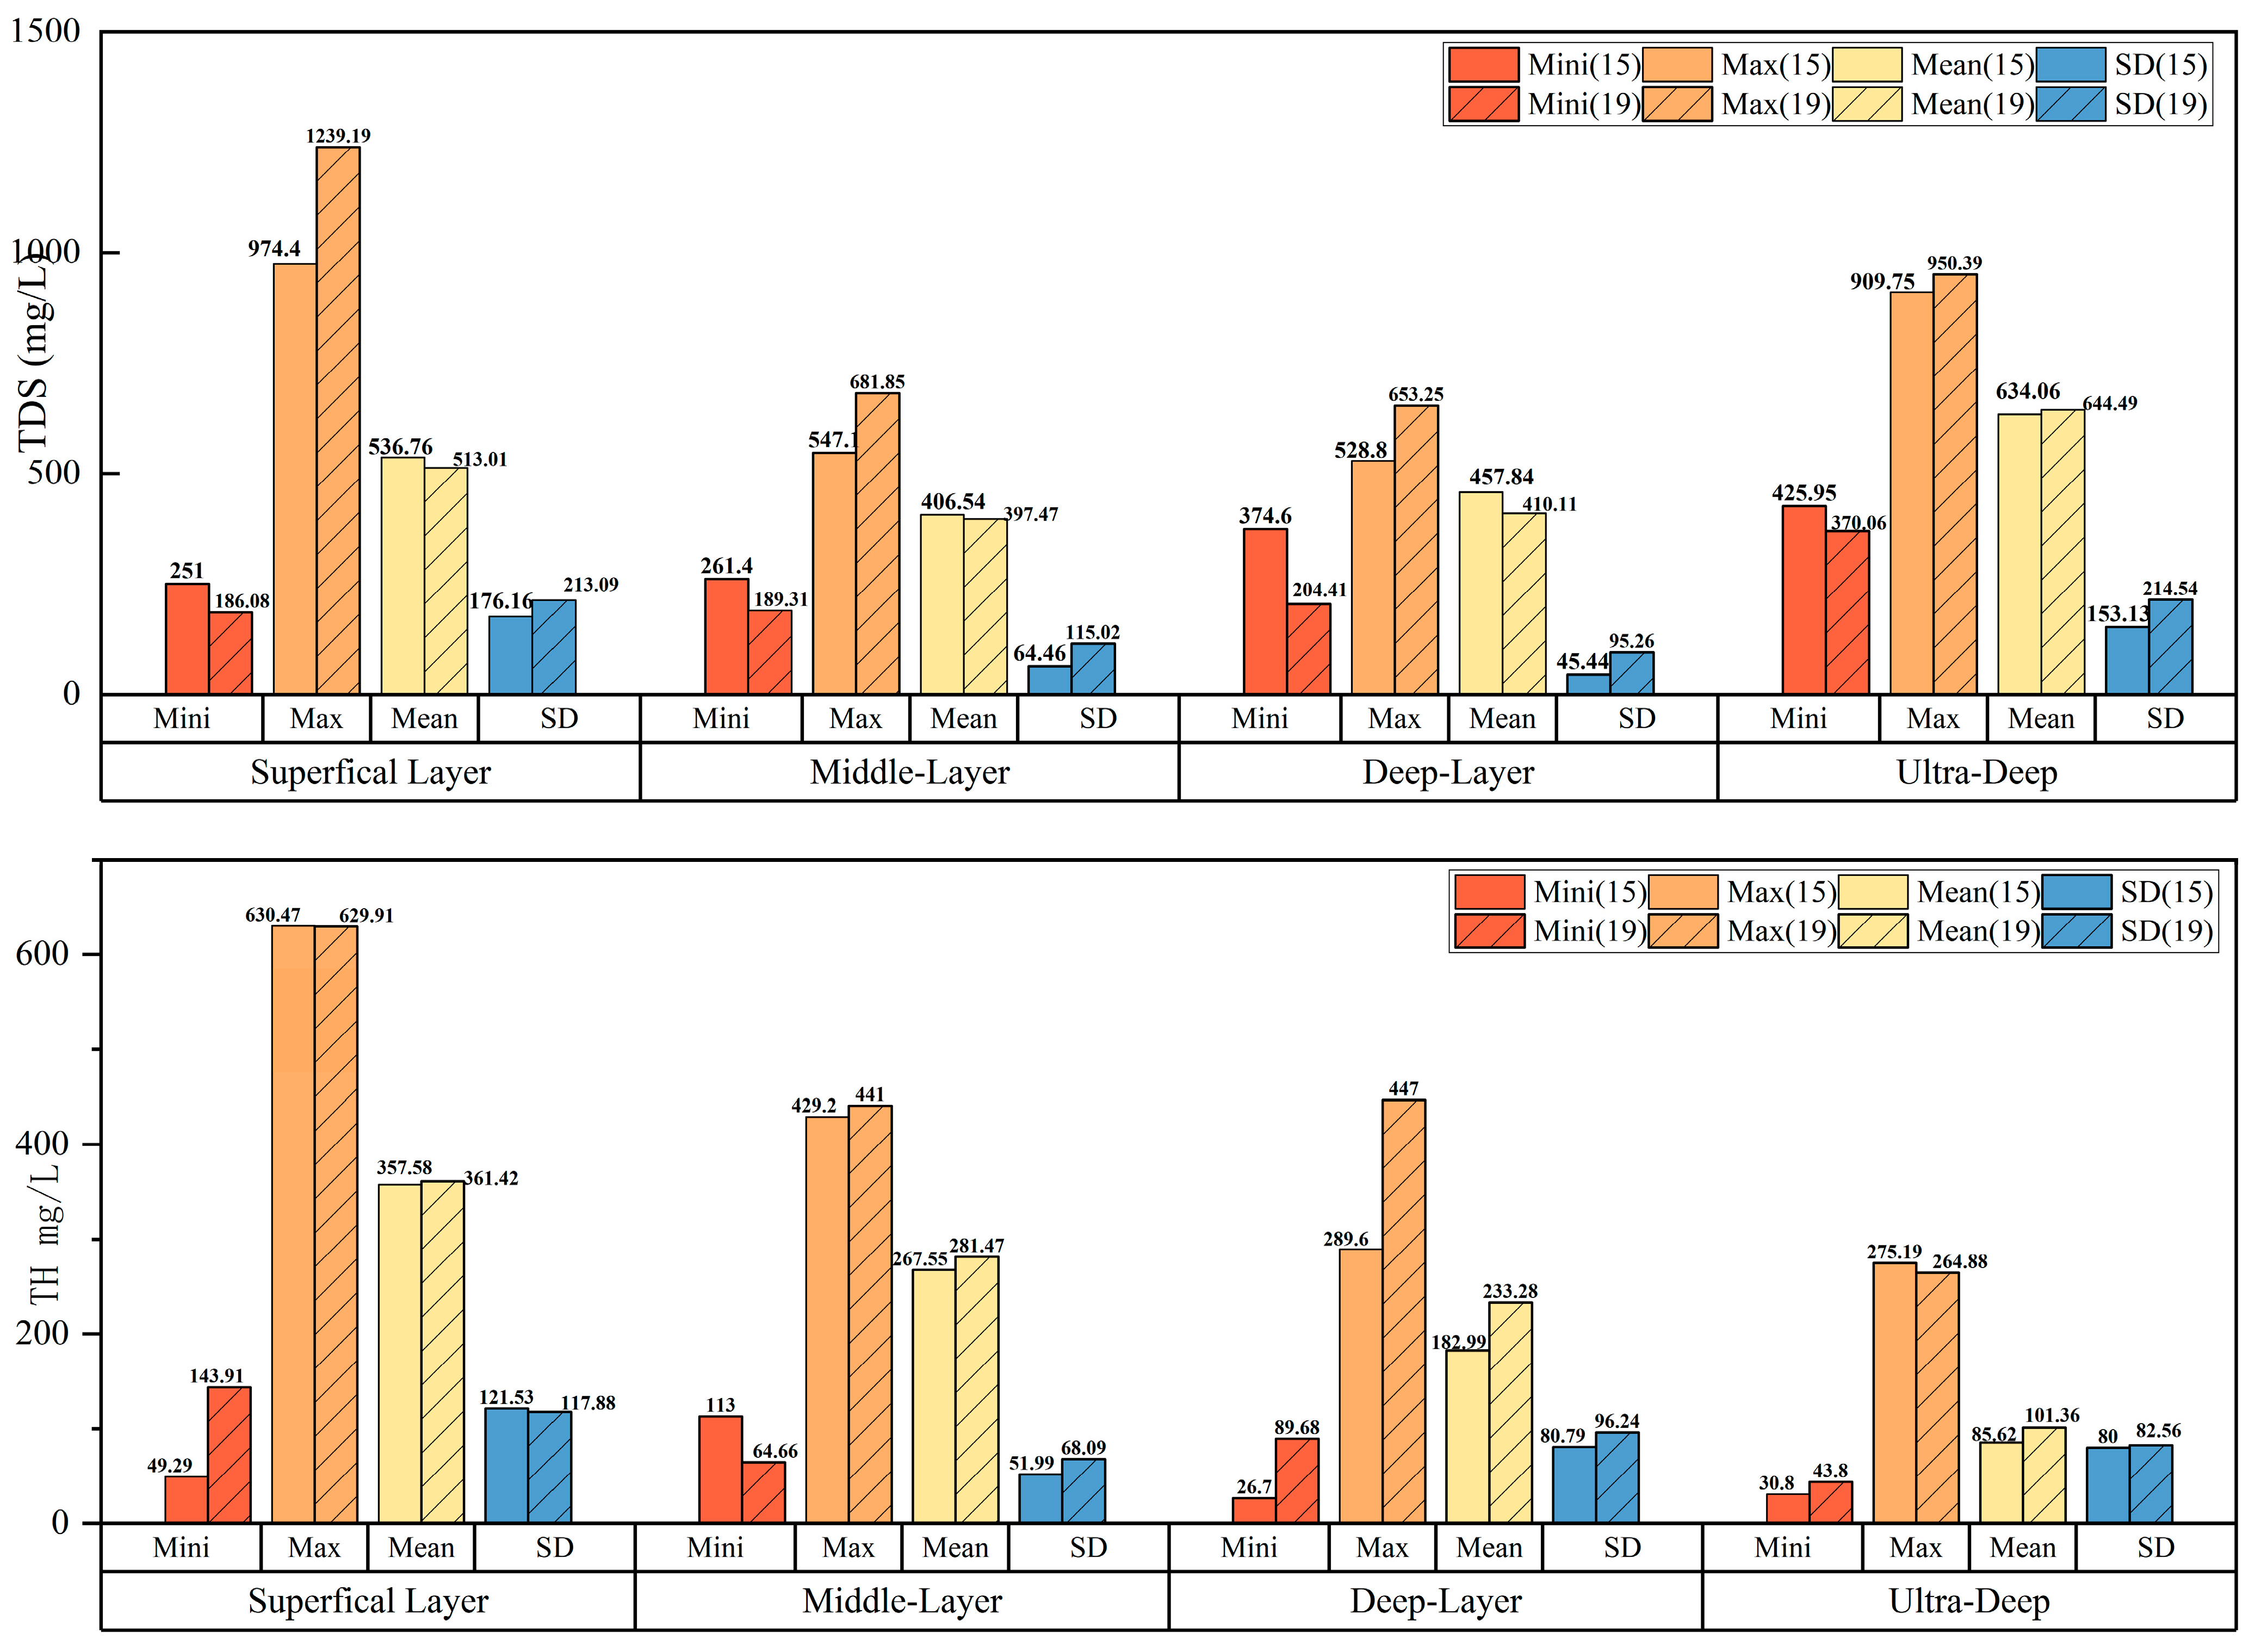
The pH value of the drinking water is a significant indicator of water quality and suitability. In the event of the pH value being excessively low, there is a marked increase in the corrosiveness of the water, which has the potential to cause erosion to water supply pipelines or water-related equipment. Conversely, if the pH value is too high, this has an effect on the taste of the water, and there is also the possibility of a risk to human skin [37]. In 2015, the groundwater samples obtained from the designated study area exhibited pH values ranging from 7.00 to 8.15, thereby indicating the presence of water with a weakly alkaline nature. Samples obtained from shallow groundwater sites exhibited a pH range of 7.01 to 8.09, with an average of 7.52. Medium-depth samples registered pH values from 7.00 to 8.15, with an average of 7.51. Deep samples demonstrated a pH range of 7.00 to 8.10, with an average of 7.32. Ultra-deep samples exhibited pH values from 7.11 to 7.76, with an average of 7.37. In 2019, the pH values across the four different burial depths exhibited minimal variation, ranging from 7.5 to 7.9, indicative of weakly alkaline water. The pH values of the groundwater at shallow sampling sites ranged from 7.51 to 7.82, with an average of 7.67; the pH values of the groundwater at medium-deep sampling sites ranged from 7.62 to 7.80, with an average of 7.64; the pH values of the groundwater at deep sampling sites ranged from 7.53 to 7.82, with an average of 7.79; and the pH values of the groundwater at ultra-deep sampling sites ranged from 7.55 to 7.75, with an average of 7.67. A study of the groundwater samples collected in 2015 and 2019 revealed that all samples exhibited pH values within the permissible range of 6.6 to 8.5, as stipulated by the groundwater quality standard [38].
In 2015, the TDS concentration of shallow groundwater ranged from 251.00 to 974.40 mg/L, with an average value of 536.76 mg/L. The TDS concentration of medium-to-deep groundwater ranged from 261.40 to 547.10 mg/L, with an average value of 406.54 mg/L. The range of TDS concentrations in deep groundwater ranged from 374.60 to 528.80 mg/L, with an average of 457.84 mg/L; in ultra-deep groundwater, the range was from 425.95 to 909.75 mg/L, with an average of 634.06 mg/L. Water samples from all four aquifers—shallow, medium-deep, deep, and ultra-deep—exhibited TDS concentrations below 1000 mg/L, falling within the regulatory limits. These waters meet the criteria for being classified as freshwater suitable for potable supply.
In 2019, the TDS concentration of shallow groundwater ranged from 186.08 to 1239.19 mg/L, with an average of 513.01 mg/L. The TDS levels in 97% of water samples were found to be below 1000 mg/L, meeting the criteria for potable water, while 3% exceeded this threshold, rendering them suitable for irrigation purposes. The TDS concentrations in medium-to-deep groundwater ranged from 204.41 to 653.25 mg/L, with an average of 410.11 mg/L. The TDS concentrations in deep groundwater ranged from 189.31 to 681.85 mg/L, with an average of 397.47 mg/L. This study found that ultra-deep groundwater TDS concentrations ranged from 370.06 to 950.39 mg/L, with an average of 644.49 mg/L. Water samples from the middle-deep, deep, and ultra-deep aquifers all exhibited TDS concentrations within standard limits, thus meeting the criteria for classification as freshwater suitable for drinking water supply.
Total hardness (TH) is indicative of the total concentration of calcium and magnesium ions in groundwater and is a significant indicator for water quality monitoring [39]. Following the classification criteria for groundwater established in [20], the mineral hardness of water is typically categorised as follows: <75 mg/L is soft, 75~150 mg/L is moderately hard, 150~300 mg/L is hard, and >300 mg/L is very hard (Sawyer and McCarthy 1967) [19]. In 2015, the TH concentration in shallow groundwater ranged from 49.29 to 630.47 mg/L, with an average of 357.58 mg/L. The analysis revealed that 4% of the water samples were classified as soft, 4% were moderately hard, 24% were hard, and 68% were very hard. The TH concentration in medium-deep groundwater ranged from 113.00 to 429.20 mg/L, with an average of 267.55 mg/L. This study found that 3.8% of the water samples were moderately hard, 73.6% were hard, and 22.6% were very hard. Additionally, the analysis revealed that deep groundwater TH concentrations ranged from 226.70 to 289.60 mg/L, with an average of 182.99 mg/L. The samples were classified into three categories based on their hardness: soft (10.5%), moderately hard (26.3%), and hard (63.2%). Ultra-deep groundwater TH concentrations ranged from 330.80 to 275.19 mg/L, with an average of 85.62 mg/L. The majority of the samples (76.9%) were classified as soft, while 7.7% were moderately hard and 15.4% were hard.
In 2019, the TH concentration in shallow groundwater ranged from 143.91 to 629.87 mg/L, with an average value of 361.42 mg/L. This study found that 3% of the water samples were classified as moderately hard, 40% as hard, and 57% as very hard. The total hardness concentrations in mesophilic groundwater ranged from 64.66 to 441.00 mg/L, with an average of 281.47 mg/L. The investigation revealed that 2.5% of the samples were classified as soft, 65% were categorised as hard, and 32.5% were designated as very hard. The total hardness concentration of deep groundwater ranged from 89.68 to 447.00 mg/L, with an average of 233.28 mg/L. In the present study, 18% of the samples were found to be moderately hard, 73% were found to be hard, and 9% were found to be very hard. The total hardness concentration of ultra-deep groundwater ranged from 43.80 to 264.88 mg/L, with an average of 101.36 mg/L. The analysis revealed that 80% of the water samples were classified as soft, while the remaining 20% were designated as hard. In general, the mean total hardness of groundwater is found to decrease in a gradual manner with increasing burial depth. This phenomenon can be illustrated by the following sequence: shallow layer > medium-deep layer > deep layer > ultra-deep layer.
Statistical plots of TDS and TH in different aquifers between 2015 and 2019, as shown in Figure 3.

4.1.2. Major Cations and Anions Analysis

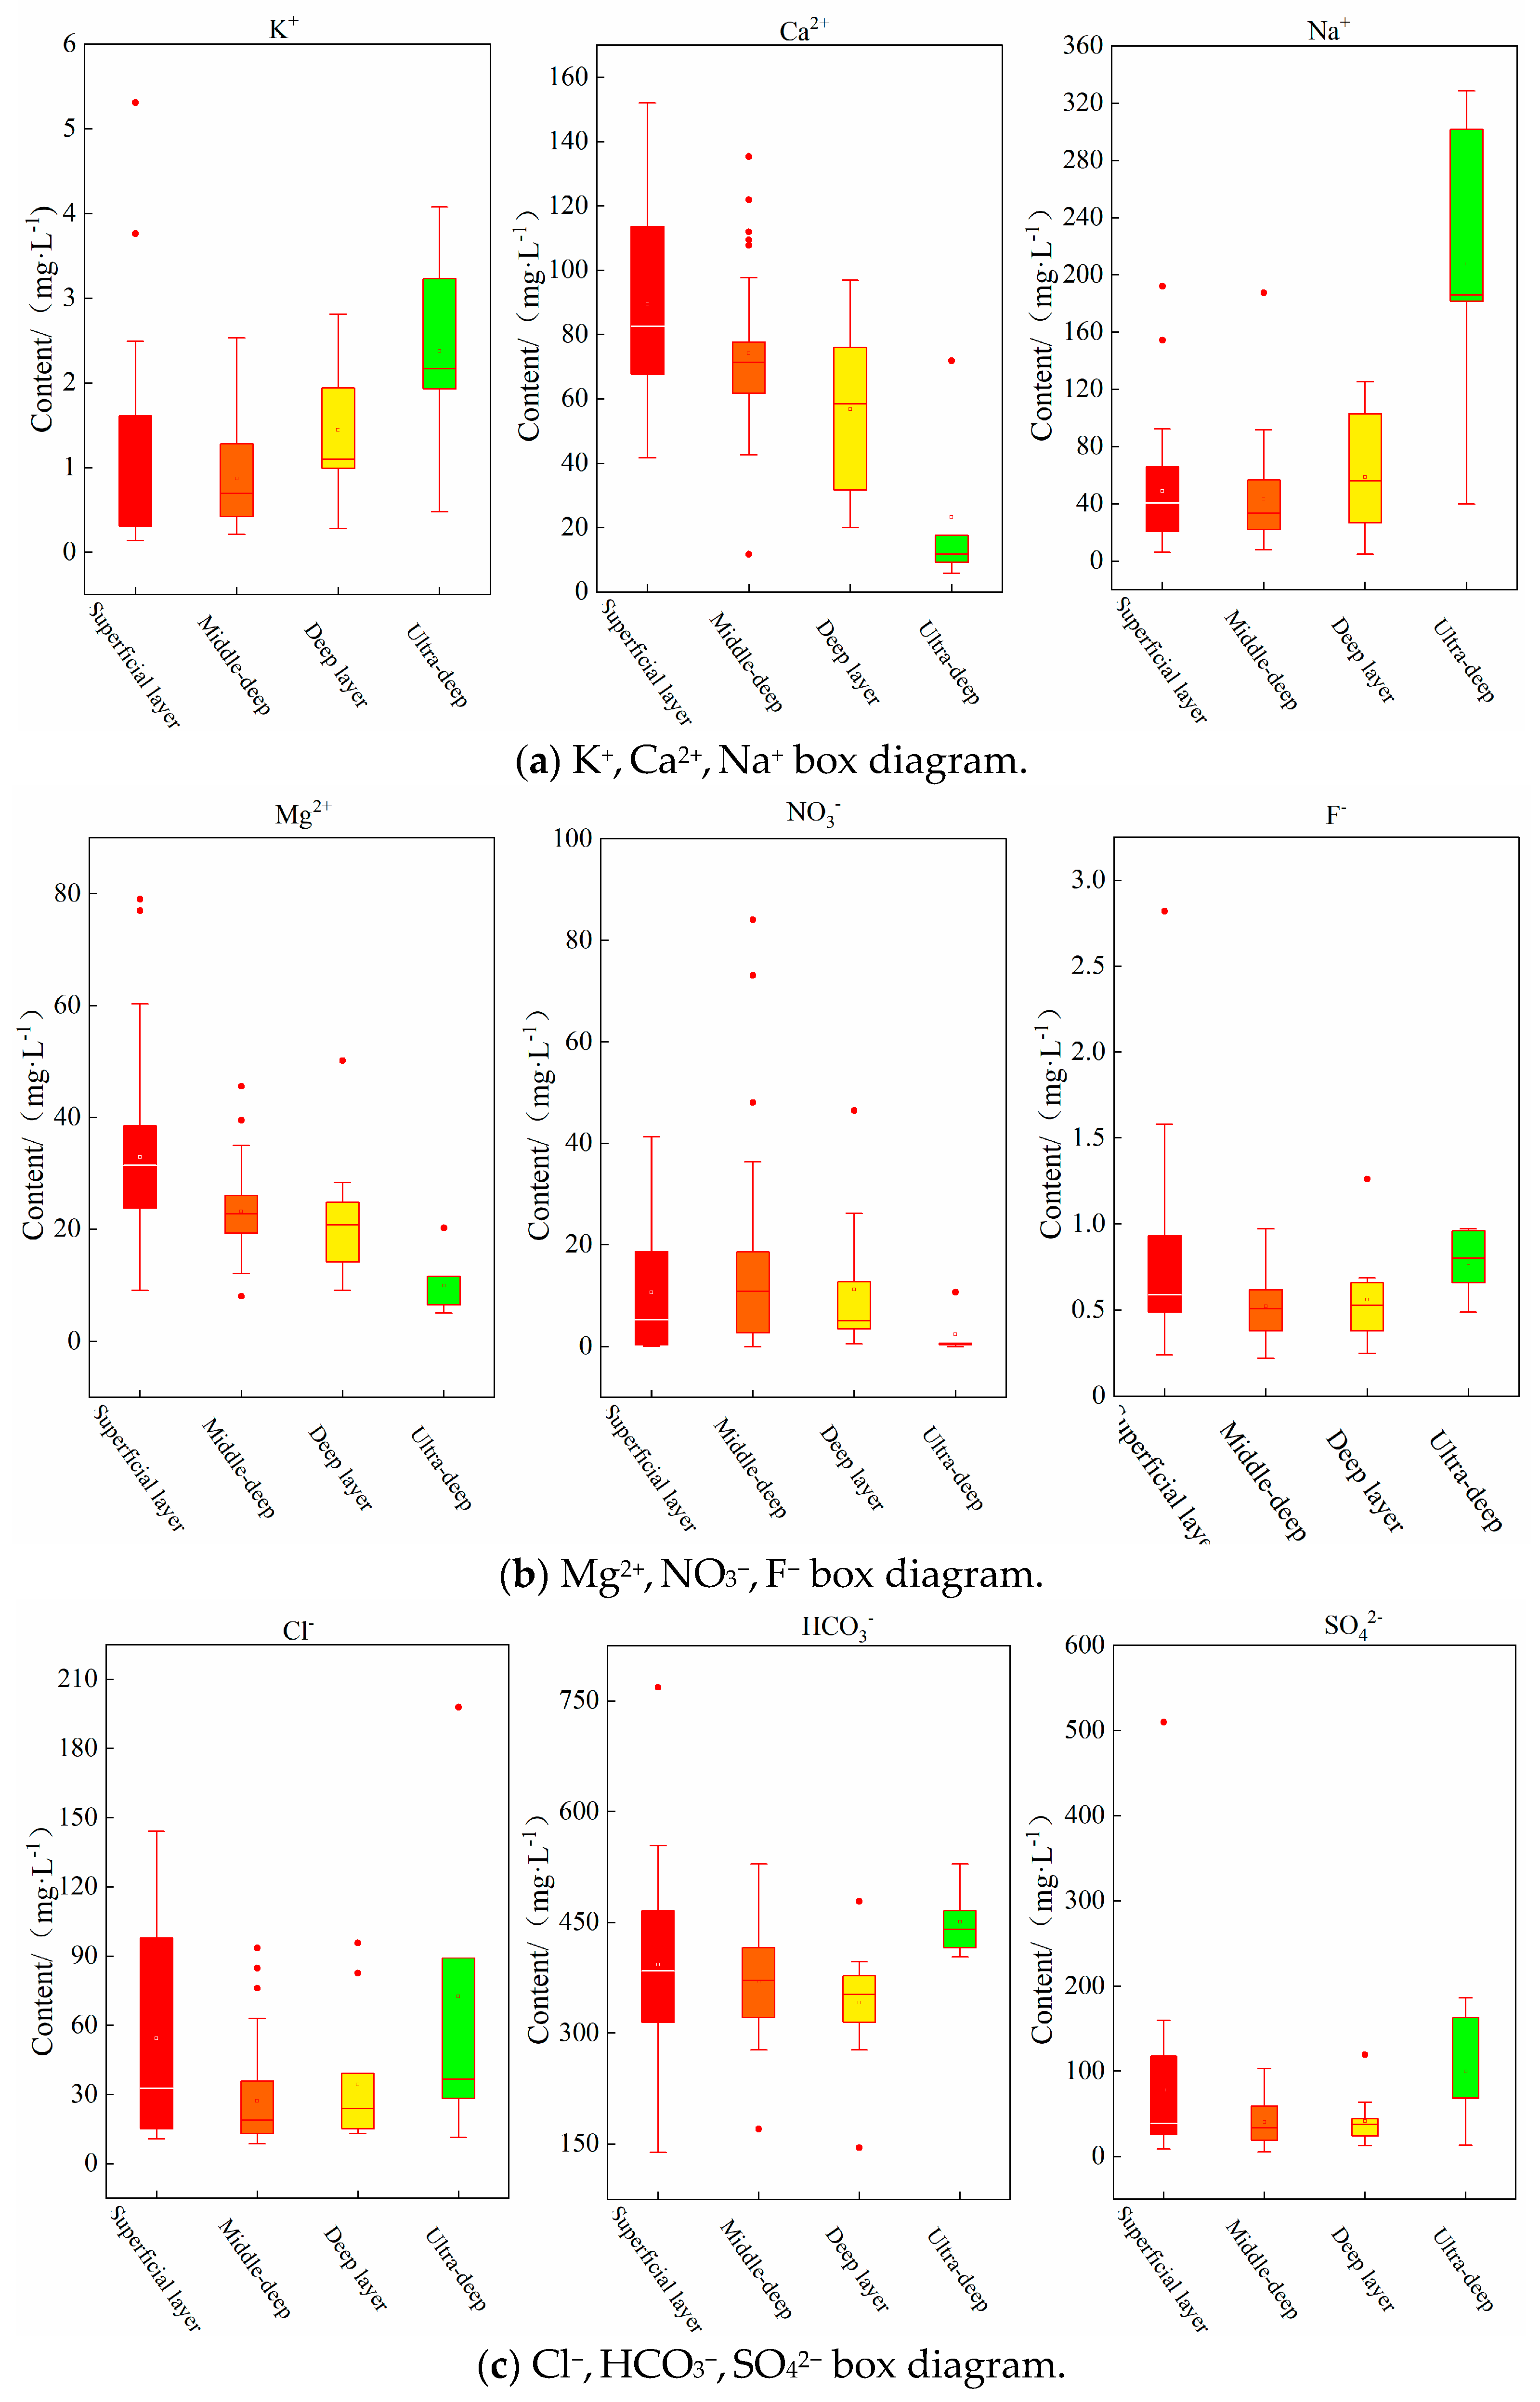
The box plot illustrating the main cation concentrations in the study area is presented in Figure 4. As demonstrated in Figure 4a–c, the predominant cation concentrations in shallow groundwater and medium-deep groundwater are Ca2+ > Na+ > Mg2+ > K+, with Ca2+ constituting over 50% of the total cation concentration and Na+ accounting for approximately 30%. In the context of deep groundwater and ultra-deep groundwater, the predominant cation concentrations are Na+ > Ca2+ > Mg2+ > K+. In deep groundwater, Na+ and Ca2+ account for over 40% of the primary cation concentrations, while in ultra-deep groundwater, Na+ accounts for over 85%, making it the dominant cation. As burial depth increases, the concentration and percentage of Na+ also increase, with the average concentration rising from 43.57 mg/L to 207.56 mg/L, and the percentage increasing from 28.3% to 85.35%. Conversely, the concentrations and percentages of Ca2+ and Mg2+ decrease with increasing burial depth. The mean concentration of Ca2+ decreased from 89.62 mg/L to 23.22 mg/L, and its percentage decreased from 51.96% to 9.55%, thus transforming from a primary to a secondary cation. Concurrently, the percentage of Mg2+ decreased from 19.09% to 4.12%. The concentrations of major anions in groundwater at varying burial depths within the designated study area exhibit a sequential pattern, with HCO3 ranking foremost, followed by SO42−, Cl, NO3, and finally F. HCO3 accounts for 70~82% of the total anion content, with its concentration showing minimal variation with burial depth and maintaining a high proportion, making it the dominant anion in the groundwater of the study area.

4.1.3. Hydrochemical Types

The water chemistry types of groundwater can be studied using the Piper three-line diagram (Figure 5) and the Shukarev classification method [40]. The Piper diagram indicates that, in 2015, 92% of shallow groundwater samples, 87% of mid-to-deep groundwater samples, 21% of deep groundwater samples, and 8% of ultra-deep groundwater samples in the study area fell within Zone 5. Conversely, one shallow sample, 9% of mid-to-deep samples, 58% of deep samples, and one ultra-deep sample fell within Zone 9, where no pair of cation and anion percentages exceeded 50%. A total of 77% of ultra-deep samples, 21% of deep samples, one shallow sample, and two medium-deep samples fell within Zone 8, indicating carbonate alkalinity exceeding 50%. One ultra-deep groundwater sample fell within Zone 7, indicating non-carbonate alkalinity exceeding 50%. A cation triangle analysis revealed that shallow, meso-superficial, and deep sampling points clustered predominantly in the lower left and central regions, indicating Ca2+ and Na+ as dominant cations. Ultra-deep sampling points concentrated in the lower right, showing Na+ as absolutely predominant. Anion triangle sampling points are primarily clustered in the lower left, indicating HCO3 as the dominant anion.
In 2019, 85% of the shallow groundwater samples, all of the medium-deep groundwater samples, 75% of the deep groundwater samples, and 20% of the ultra-deep groundwater samples were classified within Zone 5, where the carbonate hardness exceeds 50%. A total of 14% of the shallow groundwater samples and 18% of the deep groundwater samples fall into Zone 9, where no pair of cation and anion percentages exceeds 50%; 60% of the ultra-deep groundwater samples fall into Zone 8, indicating that the carbonate alkalinity exceeds 50%; and one sample of ultra-deep groundwater falls into Zone 7, indicating that the non-carbonate alkalinity exceeds 50%. An analysis of the cation triangle reveals that the sampling points for shallow, medium-deep, and deep groundwater are predominantly located in the lower left and central regions. This observation indicates that the predominant cations are calcium (Ca2+) and sodium (Na+). The distribution of sampling points for ultra-deep groundwater is predominantly concentrated in the lower right region, exhibiting an absolute dominance of Na+. By contrast, the sampling points designated for the anion triangle are primarily situated in the lower left corner, with a minor presence in the central area, suggesting that anions are predominantly HCO3. However, it is notable that only one shallow groundwater sampling point exhibited anions primarily composed of HCO3 and SO42−.
The results from the Piper diagram demonstrate that the hydrochemical types in 2015 and 2019 are largely consistent. Consequently, this study designates 2019 as the pivotal year for subsequent analysis.
Table 5 describes the chemical characteristics of each zone. By plotting the groundwater samples on this diagram, one can visually determine the dominant chemical types in the different aquifers and understand the chemical composition characteristics and evolution patterns of the groundwater in the study area.
As Shukarev’s results indicate, the shallow groundwater of the study area is characterised by 12 distinct types of groundwater chemistry. The HCO3-Ca type is identified as the most prevalent, accounting for 26% of the total, and is predominantly distributed in the southern and central regions of the study area. The central, northwestern, and southeastern regions are characterised by water of the HCO3-(Mg·Ca) type, whilst the northeastern Yellow River area and eastern regions are dominated by water of the HCO3-(HCO3·Cl, HCO3·SO4)-(Ca·Na·Mg) type. Along the groundwater flow direction, i.e., from a southwesterly to an easterly direction, the predominant cations undergo a transition from Ca2+ to Ca2+ and Mg2+, ultimately stabilising at a composition of Na+, Ca2+, and Mg2+. By contrast, the anions primarily comprise HCO3, gradually transitioning to HCO3, SO42−, and Cl, accompanied by corresponding increases in the total dissolved solids (TDS).
The middle aquifer is distinguished by the presence of eight distinct types of groundwater chemistry. The predominant HCO3-(Na·Ca) type of water constitutes 42% of the total, and is distributed across the southwestern, northwestern, and southern regions of the study area, as well as in the southern part of Putian Township. The second most prevalent type is the HCO3-Ca type water, accounting for 25%, distributed in the southern part of the central study area. The predominant water type in the northeastern region is characterised by the presence of HCO3-(Na·Ca) ions. The study area is characterised by the presence of HCO3-(Ca·Na·Mg) type water and HCO3·Cl-Ca·Mg type water. Along the direction of the groundwater flow, i.e., from southwest to northeast, the primary cations are Ca2+ and Mg2+, gradually transitioning to Ca2+ and Na+, then to Na+, Ca2+, and Mg2+; the anions are consistently dominated by HCO3, with the corresponding TDS values gradually increasing.
This study identified seven distinct types of groundwater chemistry in deep groundwater, with the HCO3-Ca·Mg type being the most prevalent, accounting for 36% of the total. The distribution of this type is primarily concentrated in the central, southwestern, and southern regions of the study area. In the northwestern and southeastern regions, the HCO3-Ca·Na type and the HCO3-Na type are predominant. The HCO3-(Ca·Mg·Na) type has been identified in the western part of the central region and the northeastern region; the HCO3·Cl-Na type has been identified along the Yellow River; and the HCO3-Ca type has been identified in the central part.
The water chemistry of the ultra-deep groundwater is predominantly the HCO3-Na type, accounting for 60% of the samples; the HCO3·Cl-Na type and HCO3-Ca type each account for 20%, with both types distributed in the northeastern part of the study area.

4.2. Hydrochemical Formation

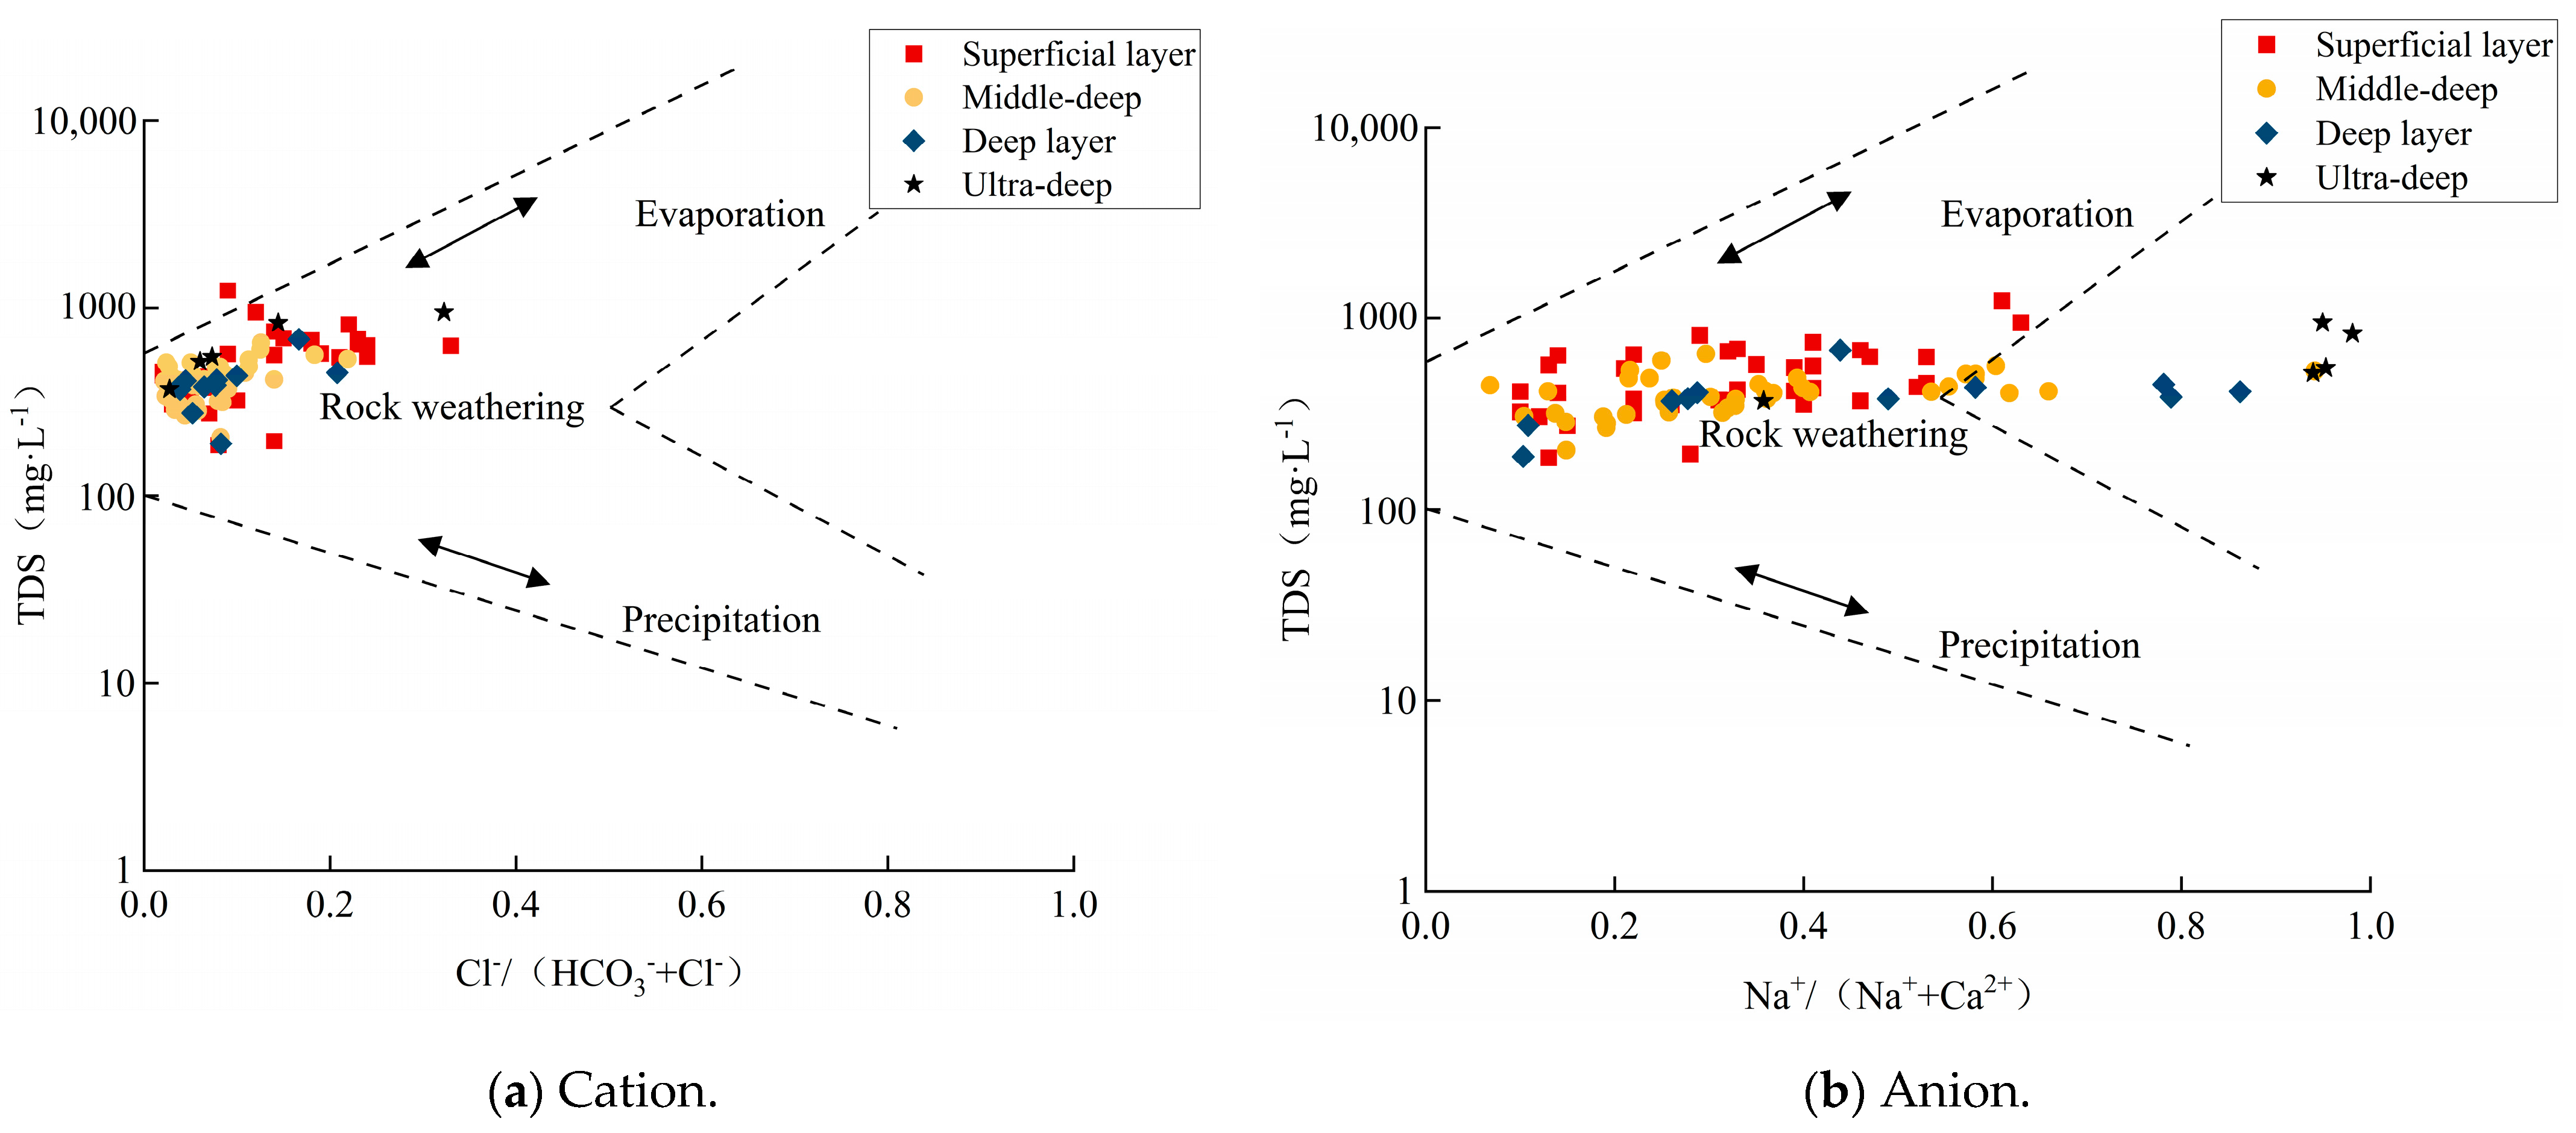
Under normal circumstances, groundwater is controlled by three natural mechanisms, including atmospheric precipitation, rock weathering, and evaporation and concentration [41,42]. Gibbs diagrams are employed extensively to elucidate the predominant formation mechanisms of groundwater on a global scale [43]. As demonstrated in Figure 6, an analysis of the Gibbs diagram of the study area indicates that the majority of the sampling points are situated within the rock weathering zone. This suggests that the formation mechanisms of groundwater chemical components in this region are primarily associated with rock weathering processes, while the influences of evaporation, concentration, and atmospheric precipitation replenishment are relatively minor. However, the data from four sampling points in the ultra-deep groundwater and three sampling points in the deep groundwater do not fall within the aforementioned range, indicating a certain degree of uniqueness. This finding indicates that the chemical composition of groundwater is not solely influenced by rock weathering.
The subsequent utilisation of endpoint diagrams to ascertain the provenance of chemical components from rock weathering, as illustrated in Figure 7, is a subject that merits further investigation. The Ca2+/Na+-Mg2+/Na+ relationship diagram and the Ca2+/Na+-HCO3−/Na+ relationship diagram indicate that the primary contribution to erosion comes from carbonates and silicates [44]. The distribution of sampling points primarily between carbonate rock and silicate rock control zones suggests that the chemical composition of groundwater in the study area is predominantly influenced by the weathering of carbonate and silicate rocks, with a comparatively smaller contribution from evaporite rocks. Further analysis indicates that the formation and evolution of groundwater chemical components in the study area are primarily controlled by a combination of dissolution, cation exchange, and counterion exchange processes.

4.2.1. Solubilisation

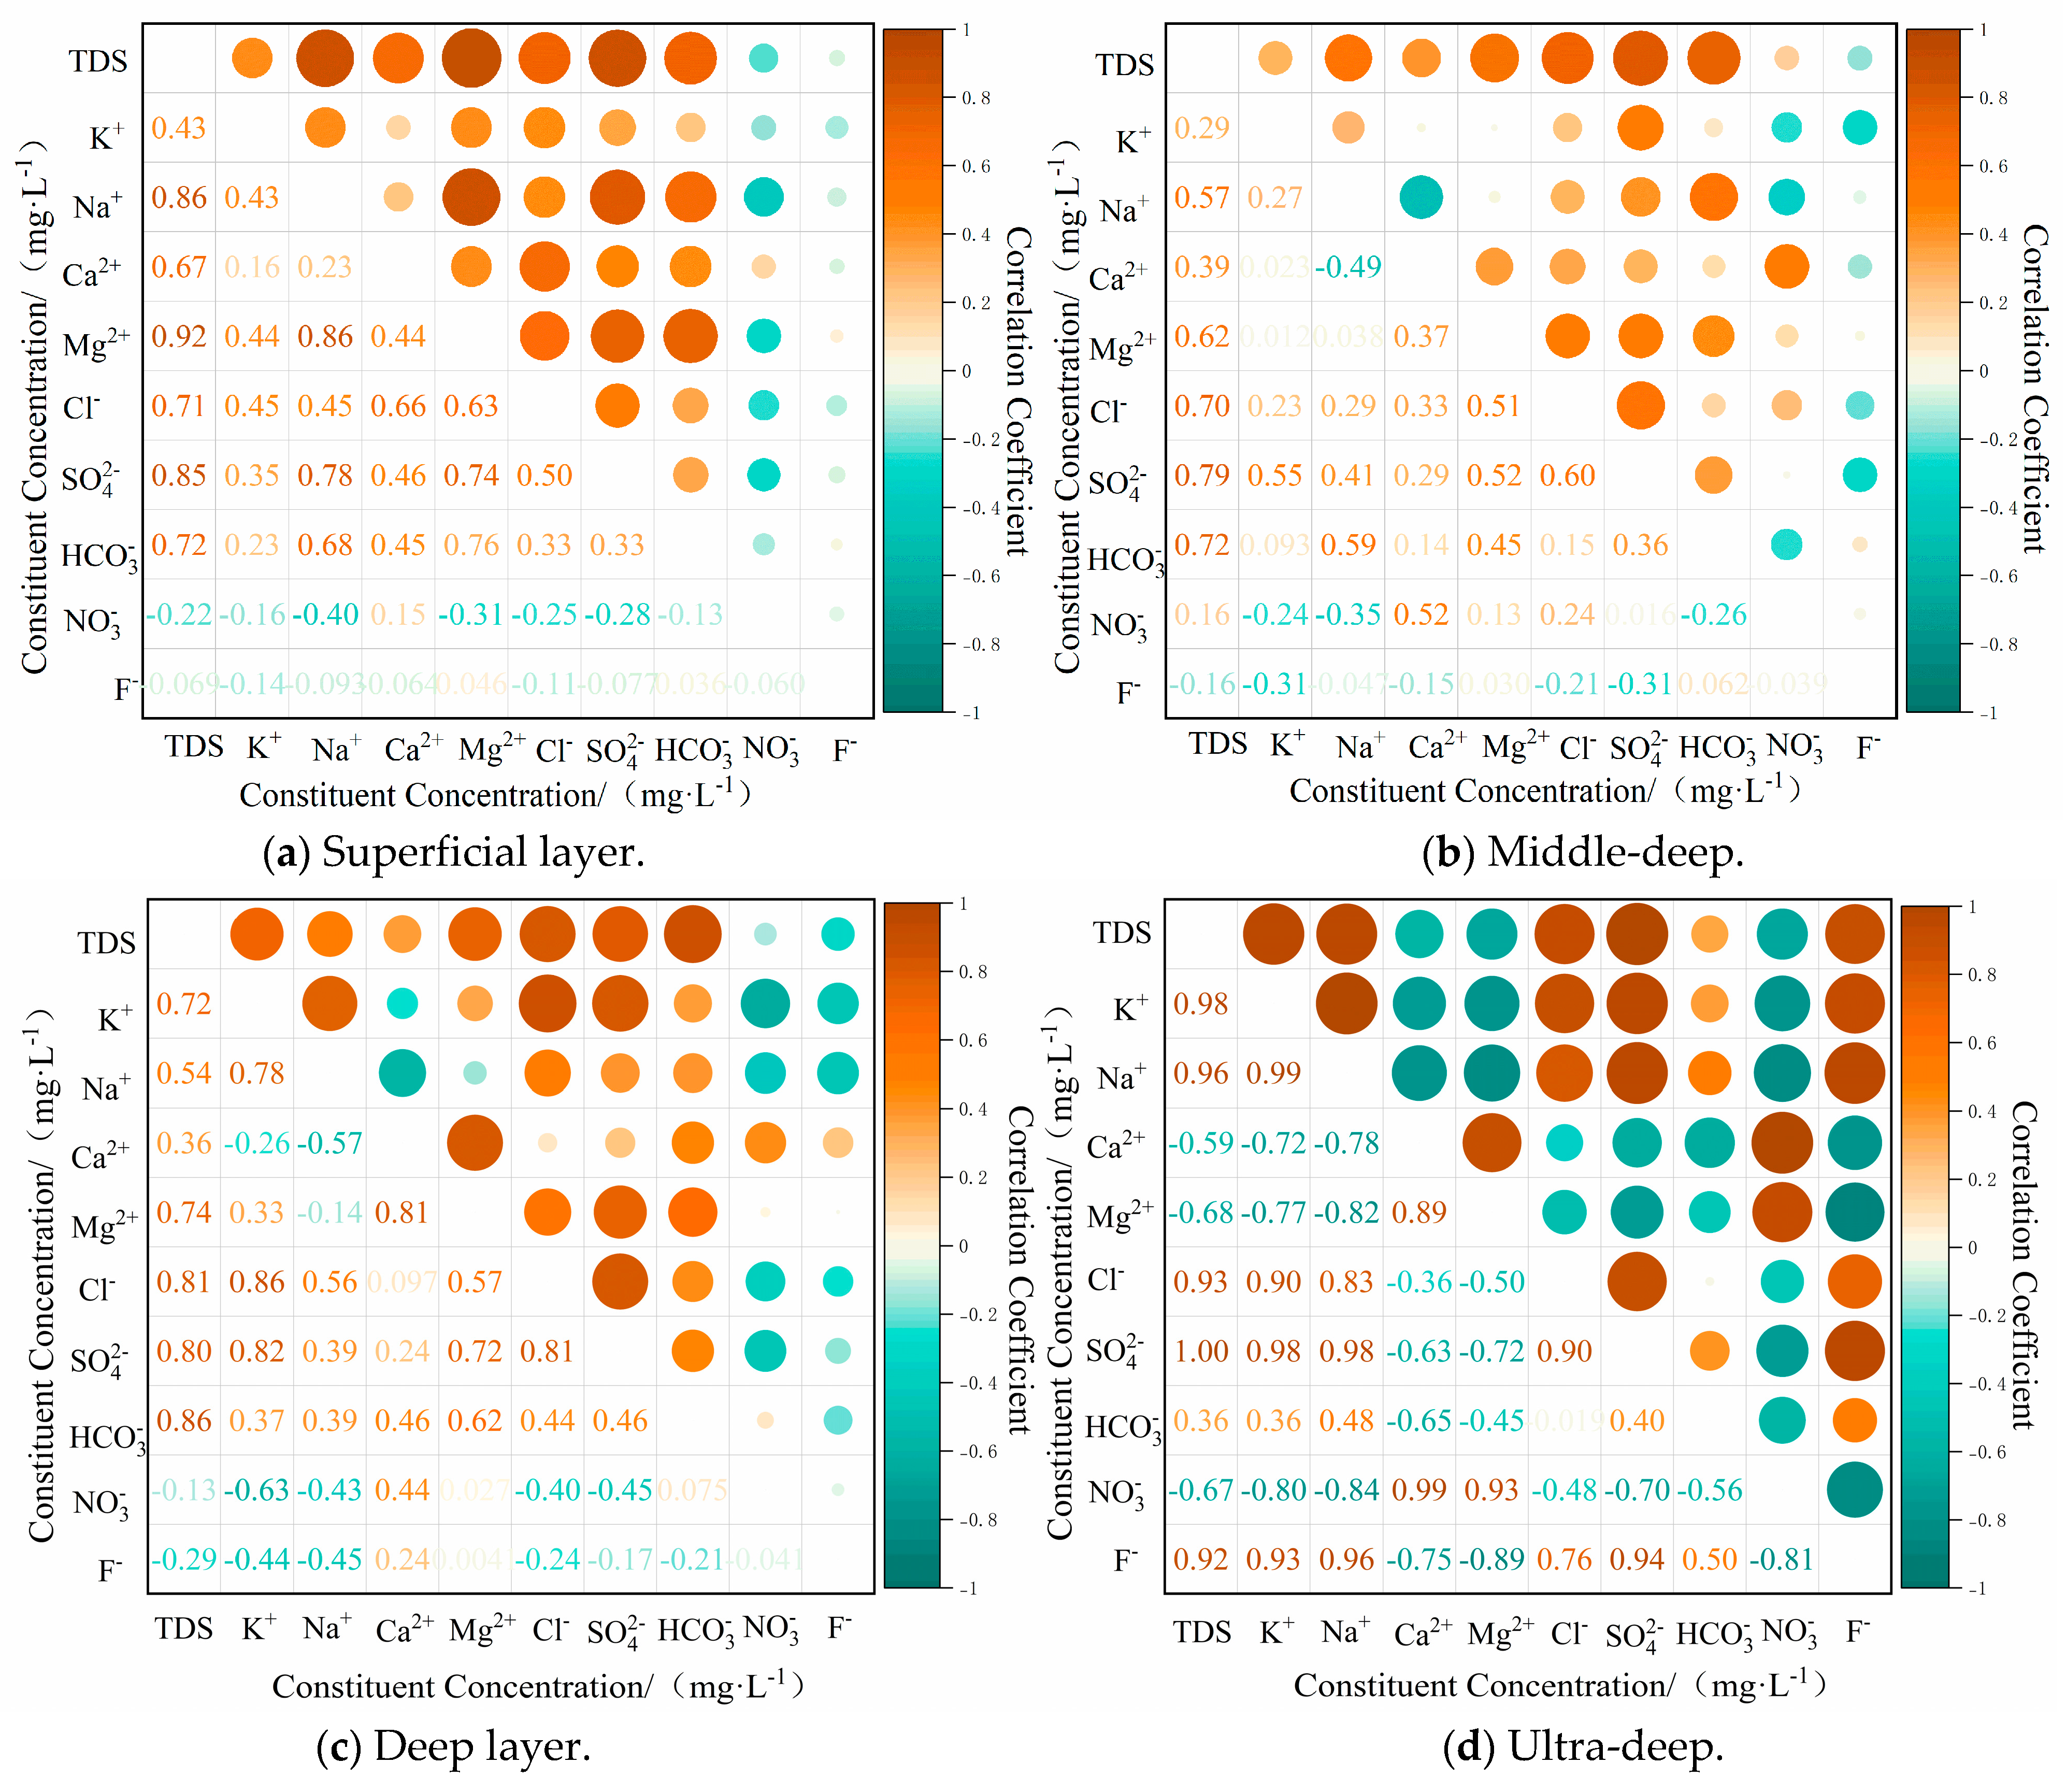
The preceding analysis demonstrates that leaching constitutes a primary function in the formation and evolution of groundwater chemical components within the designated area. Groundwater is subject to continuous water–rock interactions with surrounding rock layers during the runoff process, thereby promoting the continuous dissolution of soluble components in the rock layers. This, in turn, leads to a continuous increase in the total dissolved solids (TDS) and major ion content of the groundwater. In this dynamic process, solubilisation typically exerts a dominant influence on the formation and evolution of groundwater chemical components. The Pearson correlation coefficients [45] between the TDS content and ion concentrations in the study area were analysed using Origin 2024 software (see Figure 8). The data demonstrate a substantial correlation between the groundwater TDS content and major anions and cations (except for NO3 and F) across varying burial depths. This finding serves to further substantiate the mechanism by which dissolution predominates in determining the chemical characteristics of water. The mean Cl content of groundwater at varying burial depths within the study area ranges from 27 to 72 mg/L, constituting approximately 10% of the total anion content. The presence of a low abundance is indicative of intense equilibrium processes involving water–rock dissolution and precipitation. These processes are driven by ongoing solubilisation, resulting in the continuous migration and precipitation of chloride ions from the rock layers. This process ultimately leads to the formation of a low-TDS groundwater system that is dominated by HCO3. The average Cl concentration in mid-to-deep groundwater is 27 mg/L, accounting for 6% of the total anion content. This anomalous phenomenon is attributable to alterations in the hydrodynamic conditions occasioned by long-term over-extraction. The extraction-induced drawdown of groundwater level is known to significantly increase the hydraulic gradient, thereby accelerating groundwater flow processes and intensifying the leaching of soluble components in the aquifer.
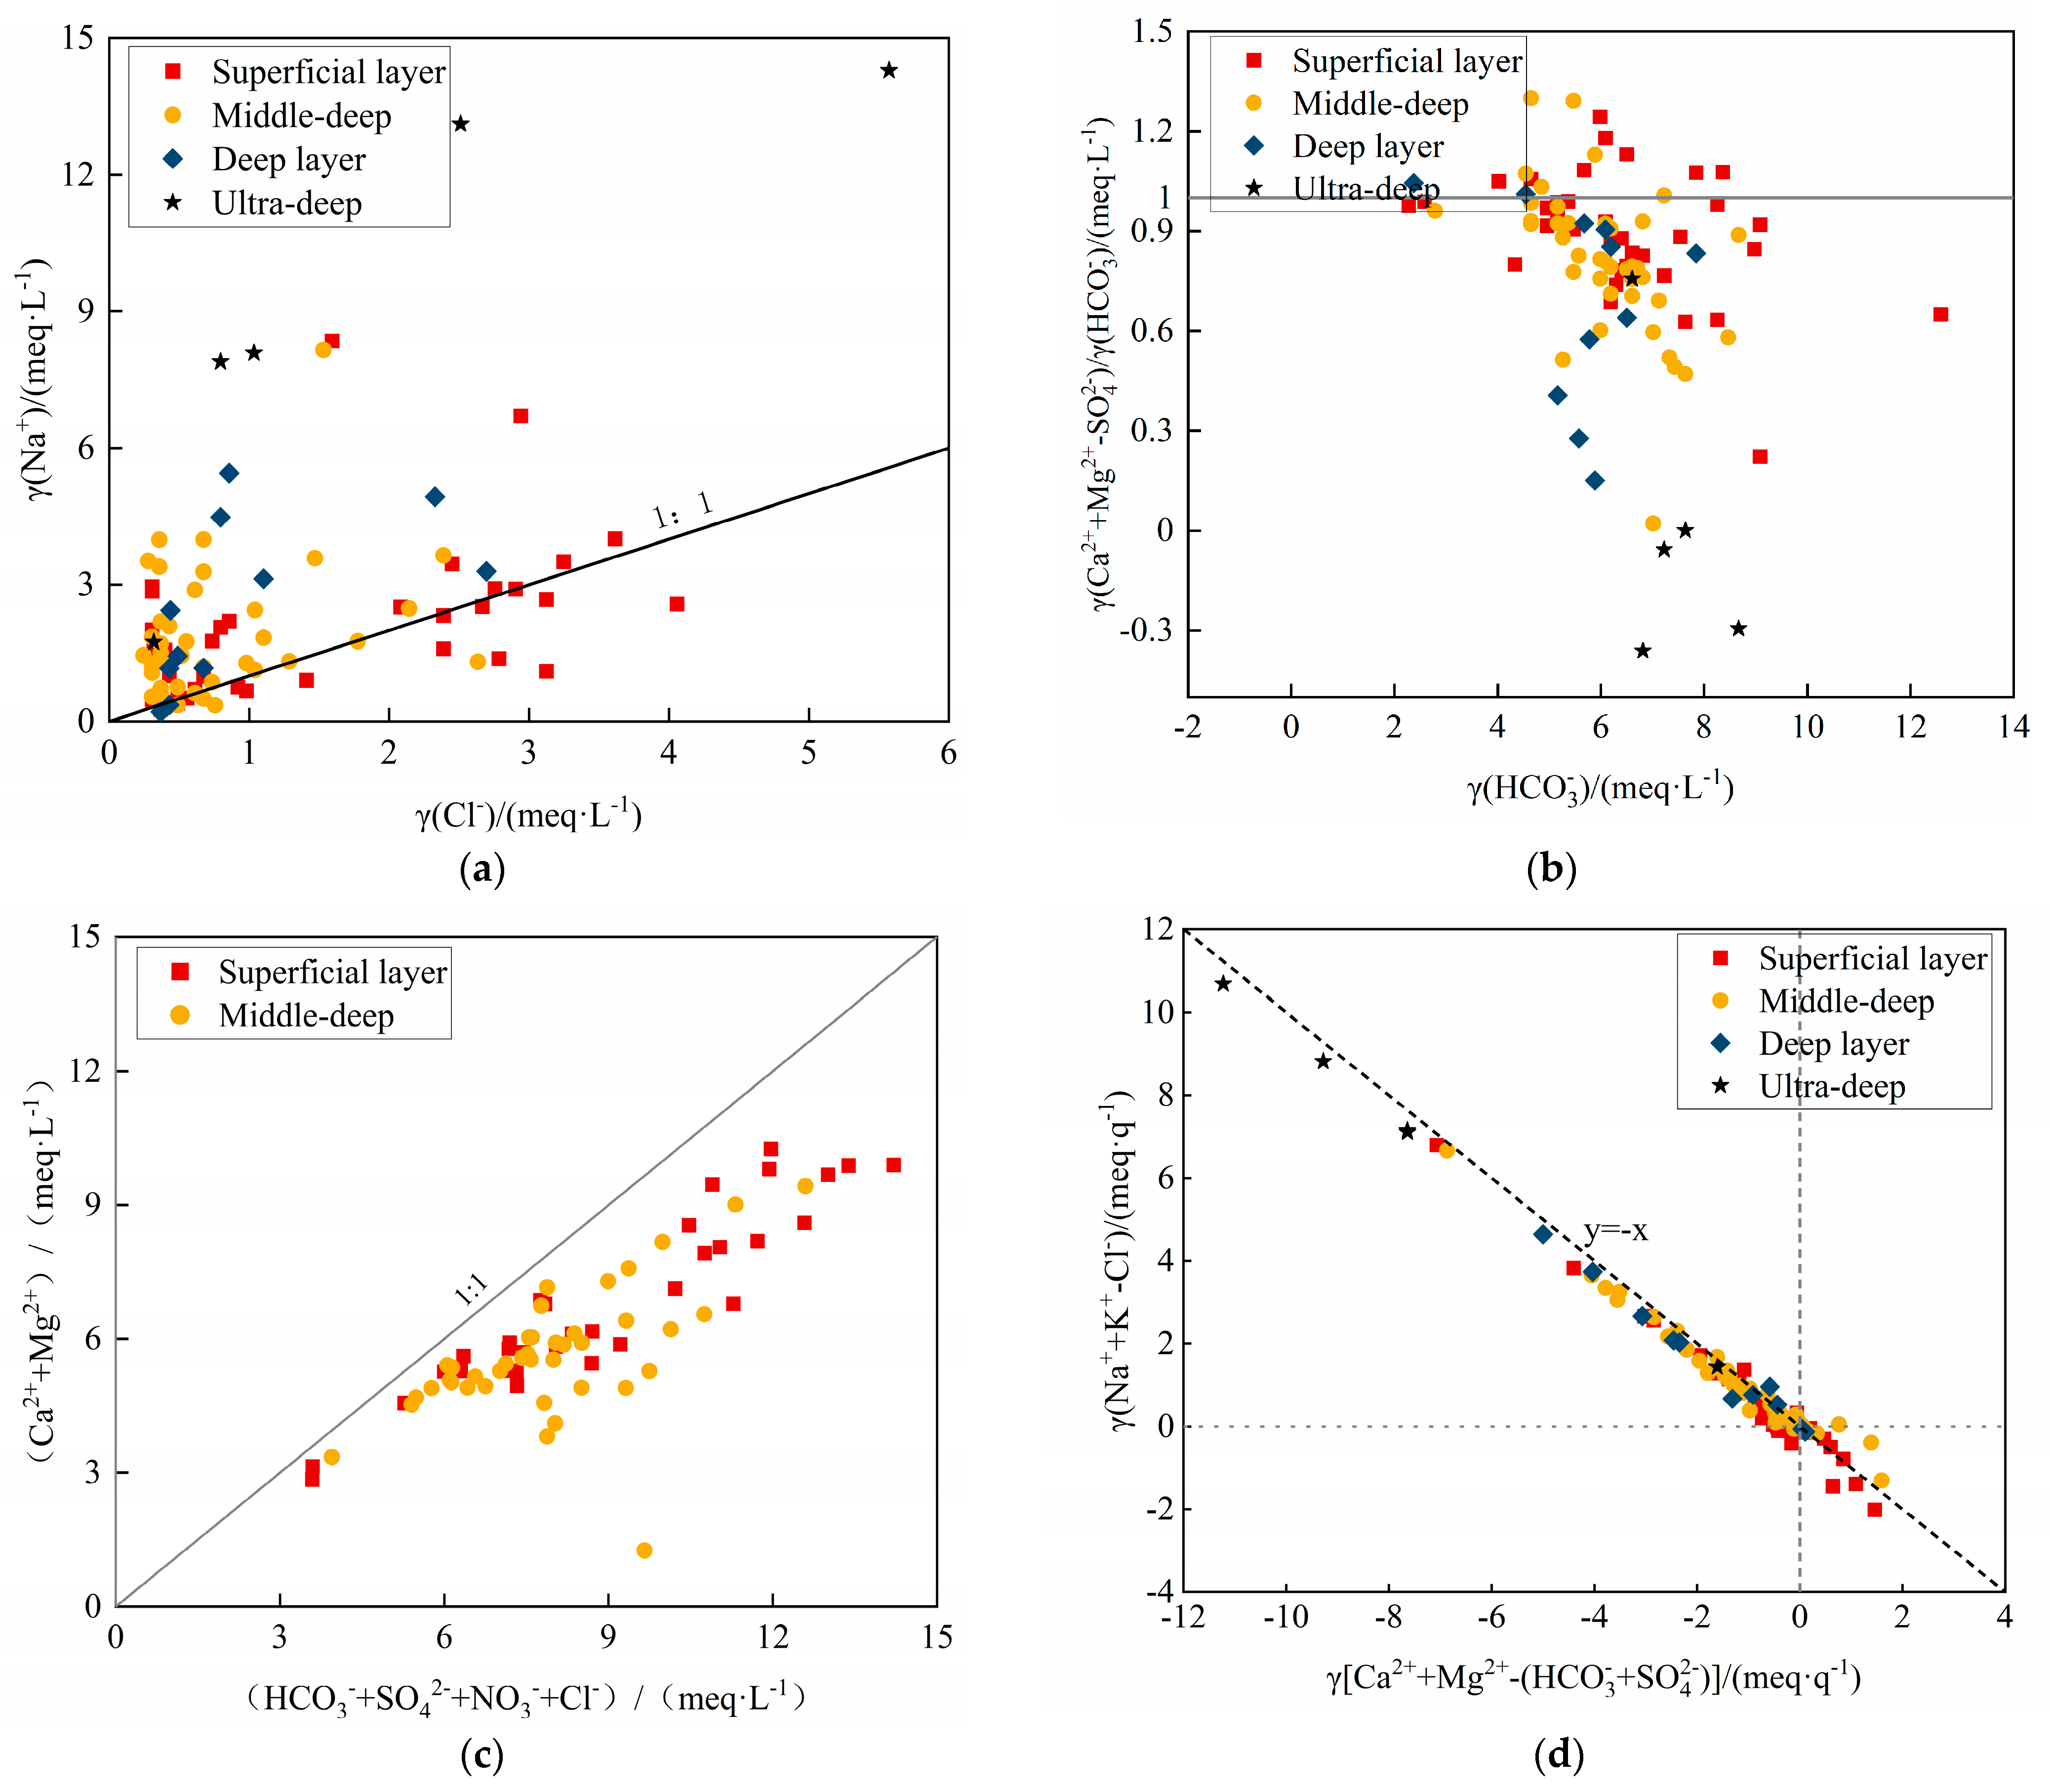
The ion ratio coefficient method [41] can be utilised to ascertain the specific mineral sources of chemical components in the groundwater within the study area. The ion ratio relationship diagram for the study area is shown in Figure 9. As demonstrated in Figure 9a, the study area displays a range of Na+ source mechanisms at varying depths. In the absence of other factors, if salt rock dissolution is the sole source, the γ(Cl−)/γ(Na+) value should be approximately equal to 1 [46]. The distribution of γ(Cl)/γ(Na+) (representing the milliequivalent ratio of Na+ to Cl) indicates that 51.4% of the shallow groundwater sampling points, 37.5% of the mid-deep groundwater sampling points, and 18.2% of the deep groundwater sampling points are distributed near the 1:1 line, indicating that the Na+ in these areas primarily originates from the dissolution of salt rocks. The results indicate that approximately 31.4% of the shallow sampling points, 57.5% of the mid-deep sampling points, and 100% of the ultra-deep sampling points are located to the left of the 1:1 line. This suggests that the Na+ in these samples is more likely to be derived from the dissolution of silicates or cation exchange processes. Furthermore, a limited number of shallow and medium-depth groundwater sampling points are located to the right of the 1:1 line, indicating that reverse cation exchange has occurred in these water samples (Figure 10), leading to Na+ loss and resulting in Na+ concentrations lower than Cl concentrations.
The γ(Ca2+ + Mg2+ + SO42−)/γ(HCO3) equivalence ratio analysis (Figure 9b) indicates that the groundwater in the study area follows three geochemical evolution pathways. The proportion of the shallow groundwater sampling points was found to be 54.3%, whilst the proportion of the medium-deep groundwater sampling points was found to be 40%. The distribution of the deep groundwater sampling points in proximity to the line where γ(Ca2++Mg2+-SO42−)/γ(HCO3) = 1 indicates that the dissolution of carbonate minerals is the primary source of Ca2+, Mg2+, and HCO3 in this portion, accounting for approximately 37% of the total. The results of this study indicate that 1% of the shallow groundwater sampling points, 52.5% of the medium-deep groundwater sampling points, 54.5% of the deep groundwater sampling points, and 100% of the ultra-deep groundwater sampling points have a ratio less than 1, indicating that Ca2+ and Mg2+ are less abundant than HCO3 in the water samples, with cation exchange being the primary cause (Figure 9d and Figure 10). Furthermore, the ultra-deep groundwater sampling points are situated well below the line of best fit (γ(Ca2+ + Mg2+ − SO42−)/γ(HCO3)) = 1. It can thus be concluded that the concentrations of calcium (Ca2+) and magnesium (Mg2+) in ultra-deep groundwater are significantly lower than those of bicarbonate (HCO3). This finding indicates that strong cation exchange occurs in ultra-deep groundwater, resulting in a substantial decrease in the concentrations of calcium and magnesium. It has been established that there is an equilibrium between Na+ and K+ in the exchange rock and soil, and HCO3. A limited number of shallow and medium-depth sampling points have been observed to exhibit values above the line of best fit, which indicates an excess of Ca2+ and Mg2+. These sampling points have been found to have higher Ca2+ concentrations, ranging from 1.3 to 1.6 times the average value. It has been hypothesised that the sources of Ca2+ and Mg2+ may be associated with human input and may exist in the form of NO3 and Cl [47]. As illustrated in Figure 9c, the majority of sampling points in the shallow and medium-deep layers exhibit γ(HCO3 + SO42− + NO3 + Cl)/γ(Ca2+ + Mg2+) values that are well distributed near the 1:1 line, with correlation coefficients of 0.82 and 0.96, respectively. This finding suggests that the excess Ca2+ and Mg2+ are likely to be a consequence of anthropogenic activities.

4.2.2. Cationic Alternating Adsorption

As illustrated in the relationship diagram of γ [Ca2+ + Mg2+ − (HCO3 + SO42−)] − γ(Na+ + K+ − Cl) [48], the exchange interaction between cations Ca2+, Mg2+ and Na+, K+ can be determined. When the product of Ca2+ and Mg2+ minus (HCO3 and SO42−) minus (Na+ and K+ minus Cl) exhibits a linear negative correlation with a slope of −1, this indicates significant cation exchange. As demonstrated in Figure 9d, the values of γ [Ca2+ + Mg2+ − (HCO3 + SO42−)] − γ(Na+ + K+ − Cl) for groundwater at varying burial depths within the study area demonstrate a unidirectional negative correlation, with slopes of −1. The regression coefficients, represented by 0027, −1.0964, −1.0805, and −1.0396, respectively, demonstrate a high degree of correlation with the data, with the coefficient of determination R2 exceeding 0.9 in all cases. This finding suggests that cation exchange is a significant process in the groundwater of the study area and that cation exchange contributes substantially to the Na+ and K+ concentrations in the groundwater.
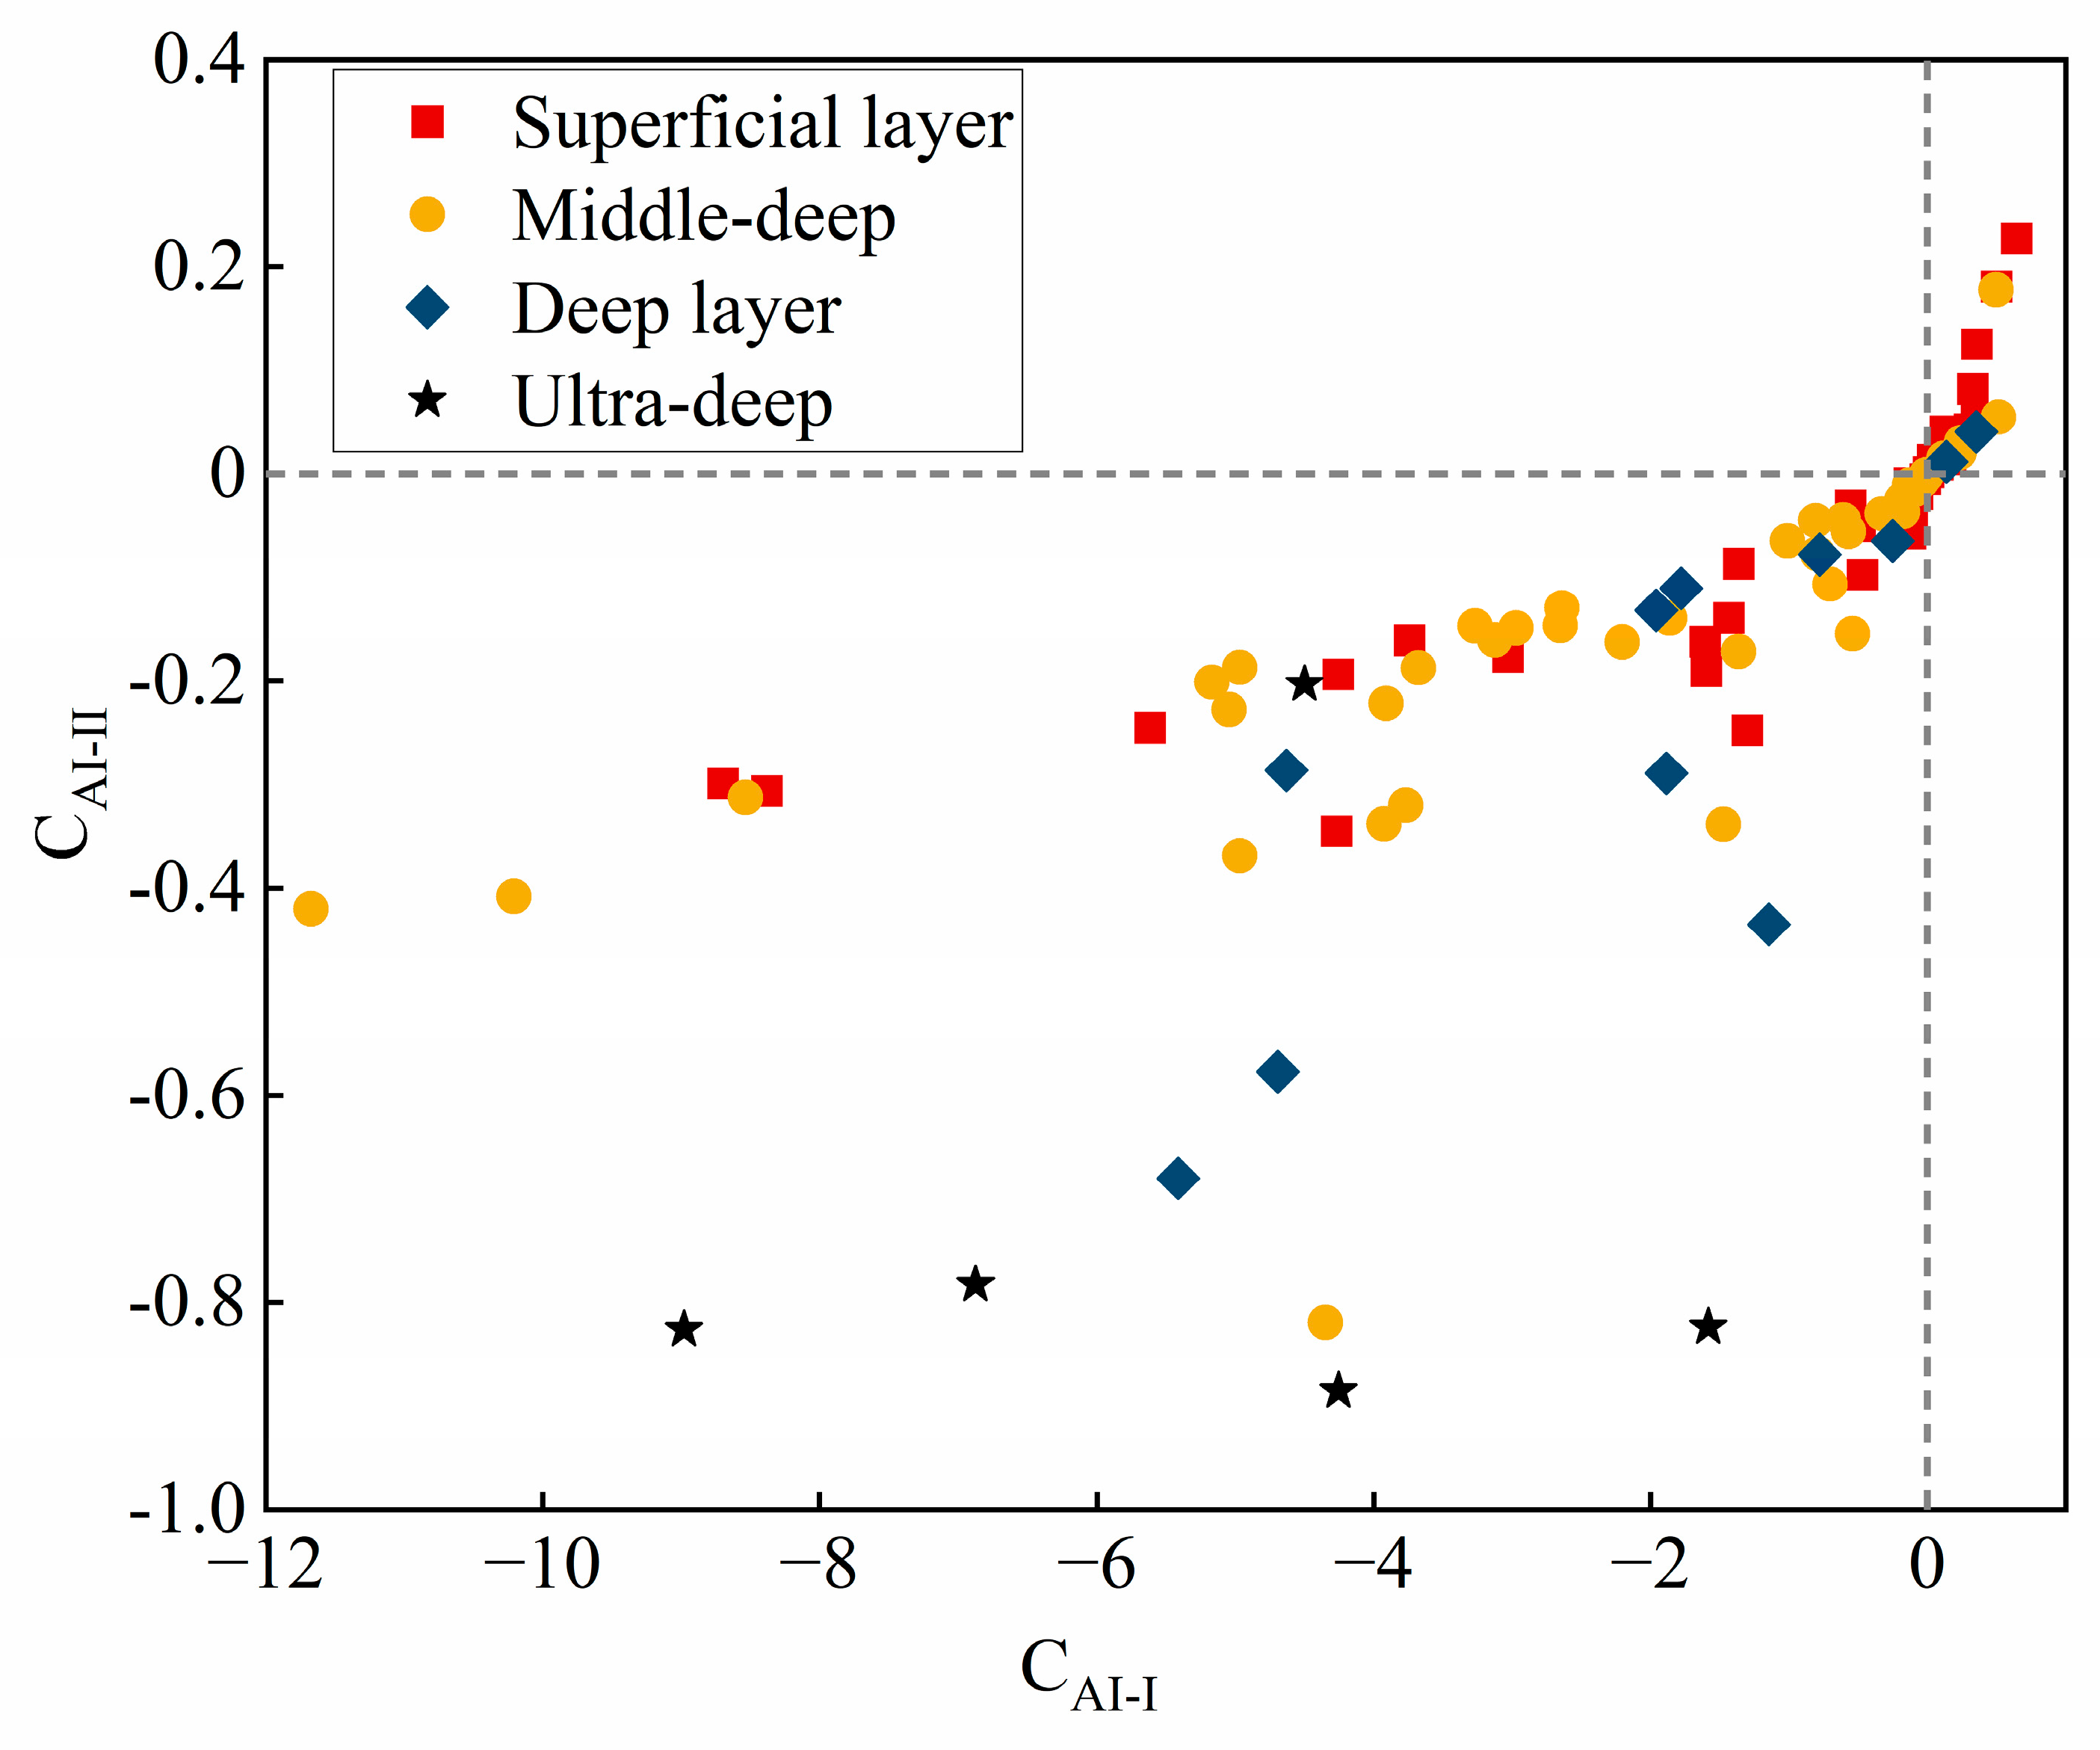
An analysis of the results of the chlor–alkali index (Figure 10) reveals the following observations: The analysis of the shallow groundwater samples revealed that 66% of the sampling points exhibited CAI-I and CAI-II values less than 0, while 34% of the sampling points demonstrated CAI-I and CAI-II values greater than 0. This finding suggests that both cation exchange and counter-cation exchange processes occurred concurrently in the shallow groundwater within the study area. In 66% of the shallow groundwater sampling points, Ca2+ and Mg2+ in the groundwater underwent cation exchange with Na+ and K+ in the surrounding rock layers, while in 34% of the sampling points, Na+ and K+ in the groundwater underwent anion exchange with Ca2+ and Mg2+ in the surrounding rock layers. The findings of this study indicate that, at 88% of the sampling points in the medium-deep groundwater, 91% of the sampling points in the deep groundwater, and 100% of the sampling points in the ultra-deep groundwater, CAI-I and CAI-II are less than 0. This suggests that cation exchange is the primary process occurring in the medium-deep and deep groundwater, with weak counter-cation exchange also taking place, while cation exchange is the primary process occurring in the ultra-deep groundwater.

4.3. Health Risk Assessment of Nitrate in Groundwater

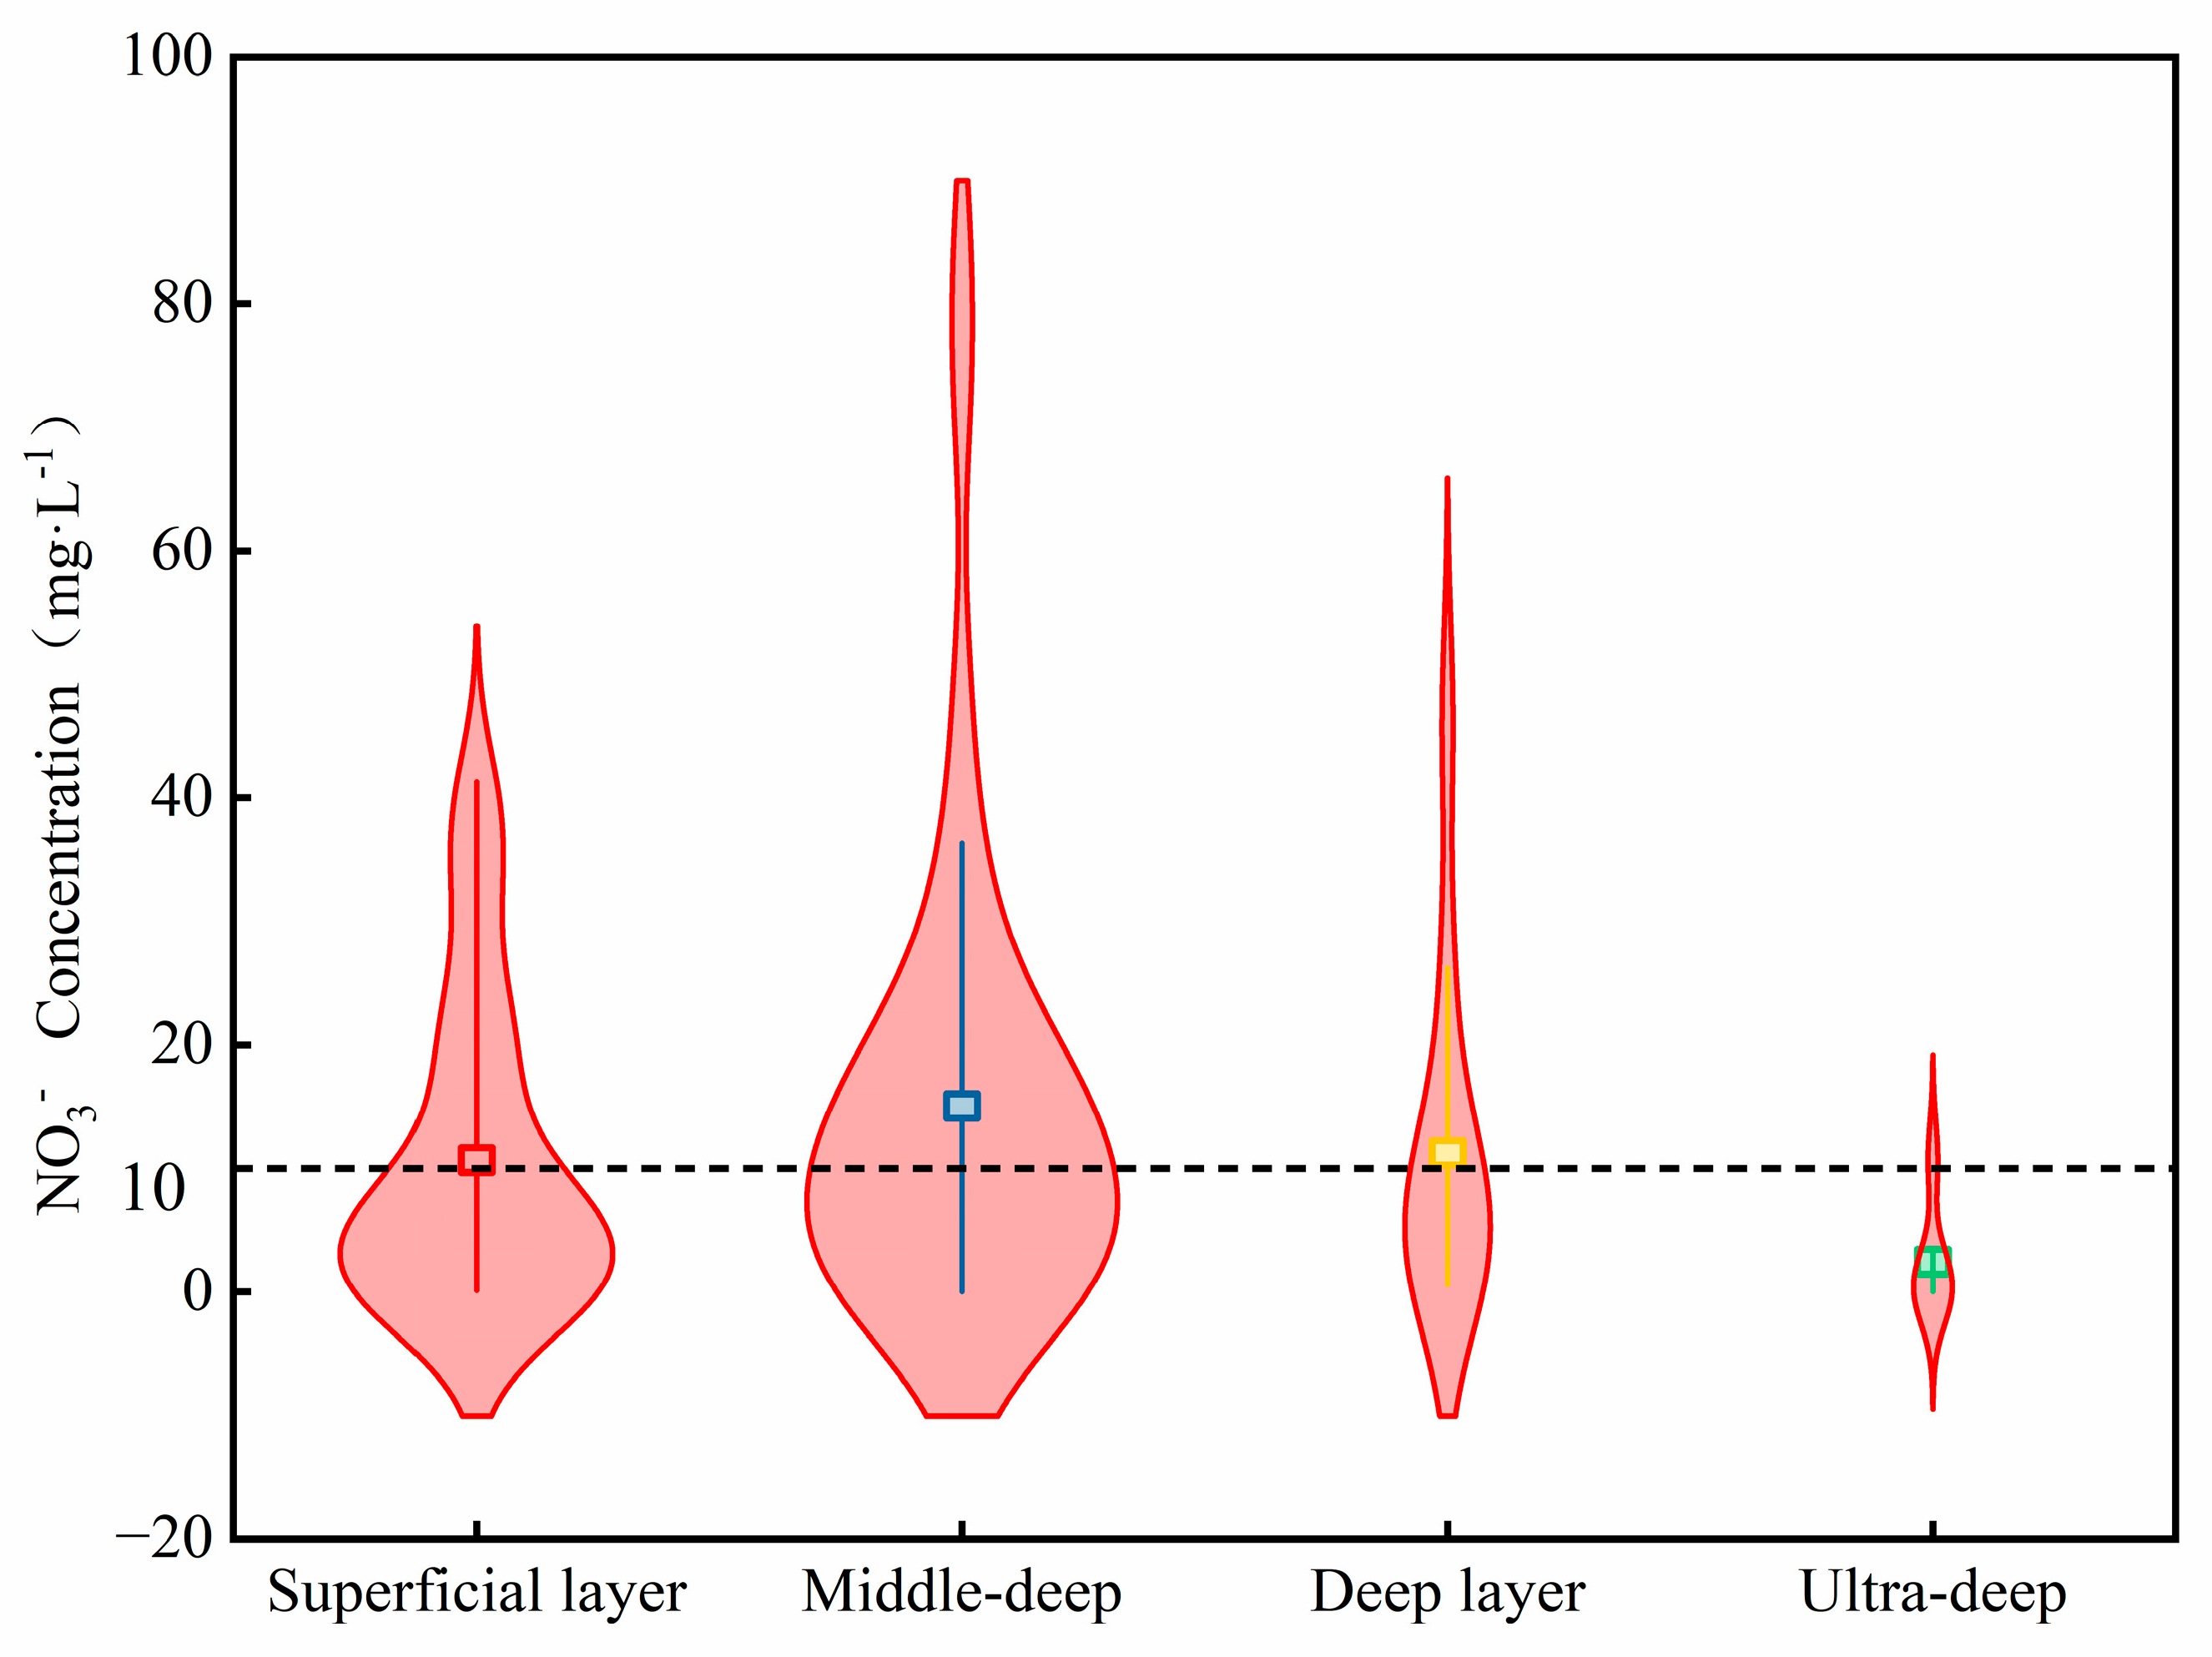
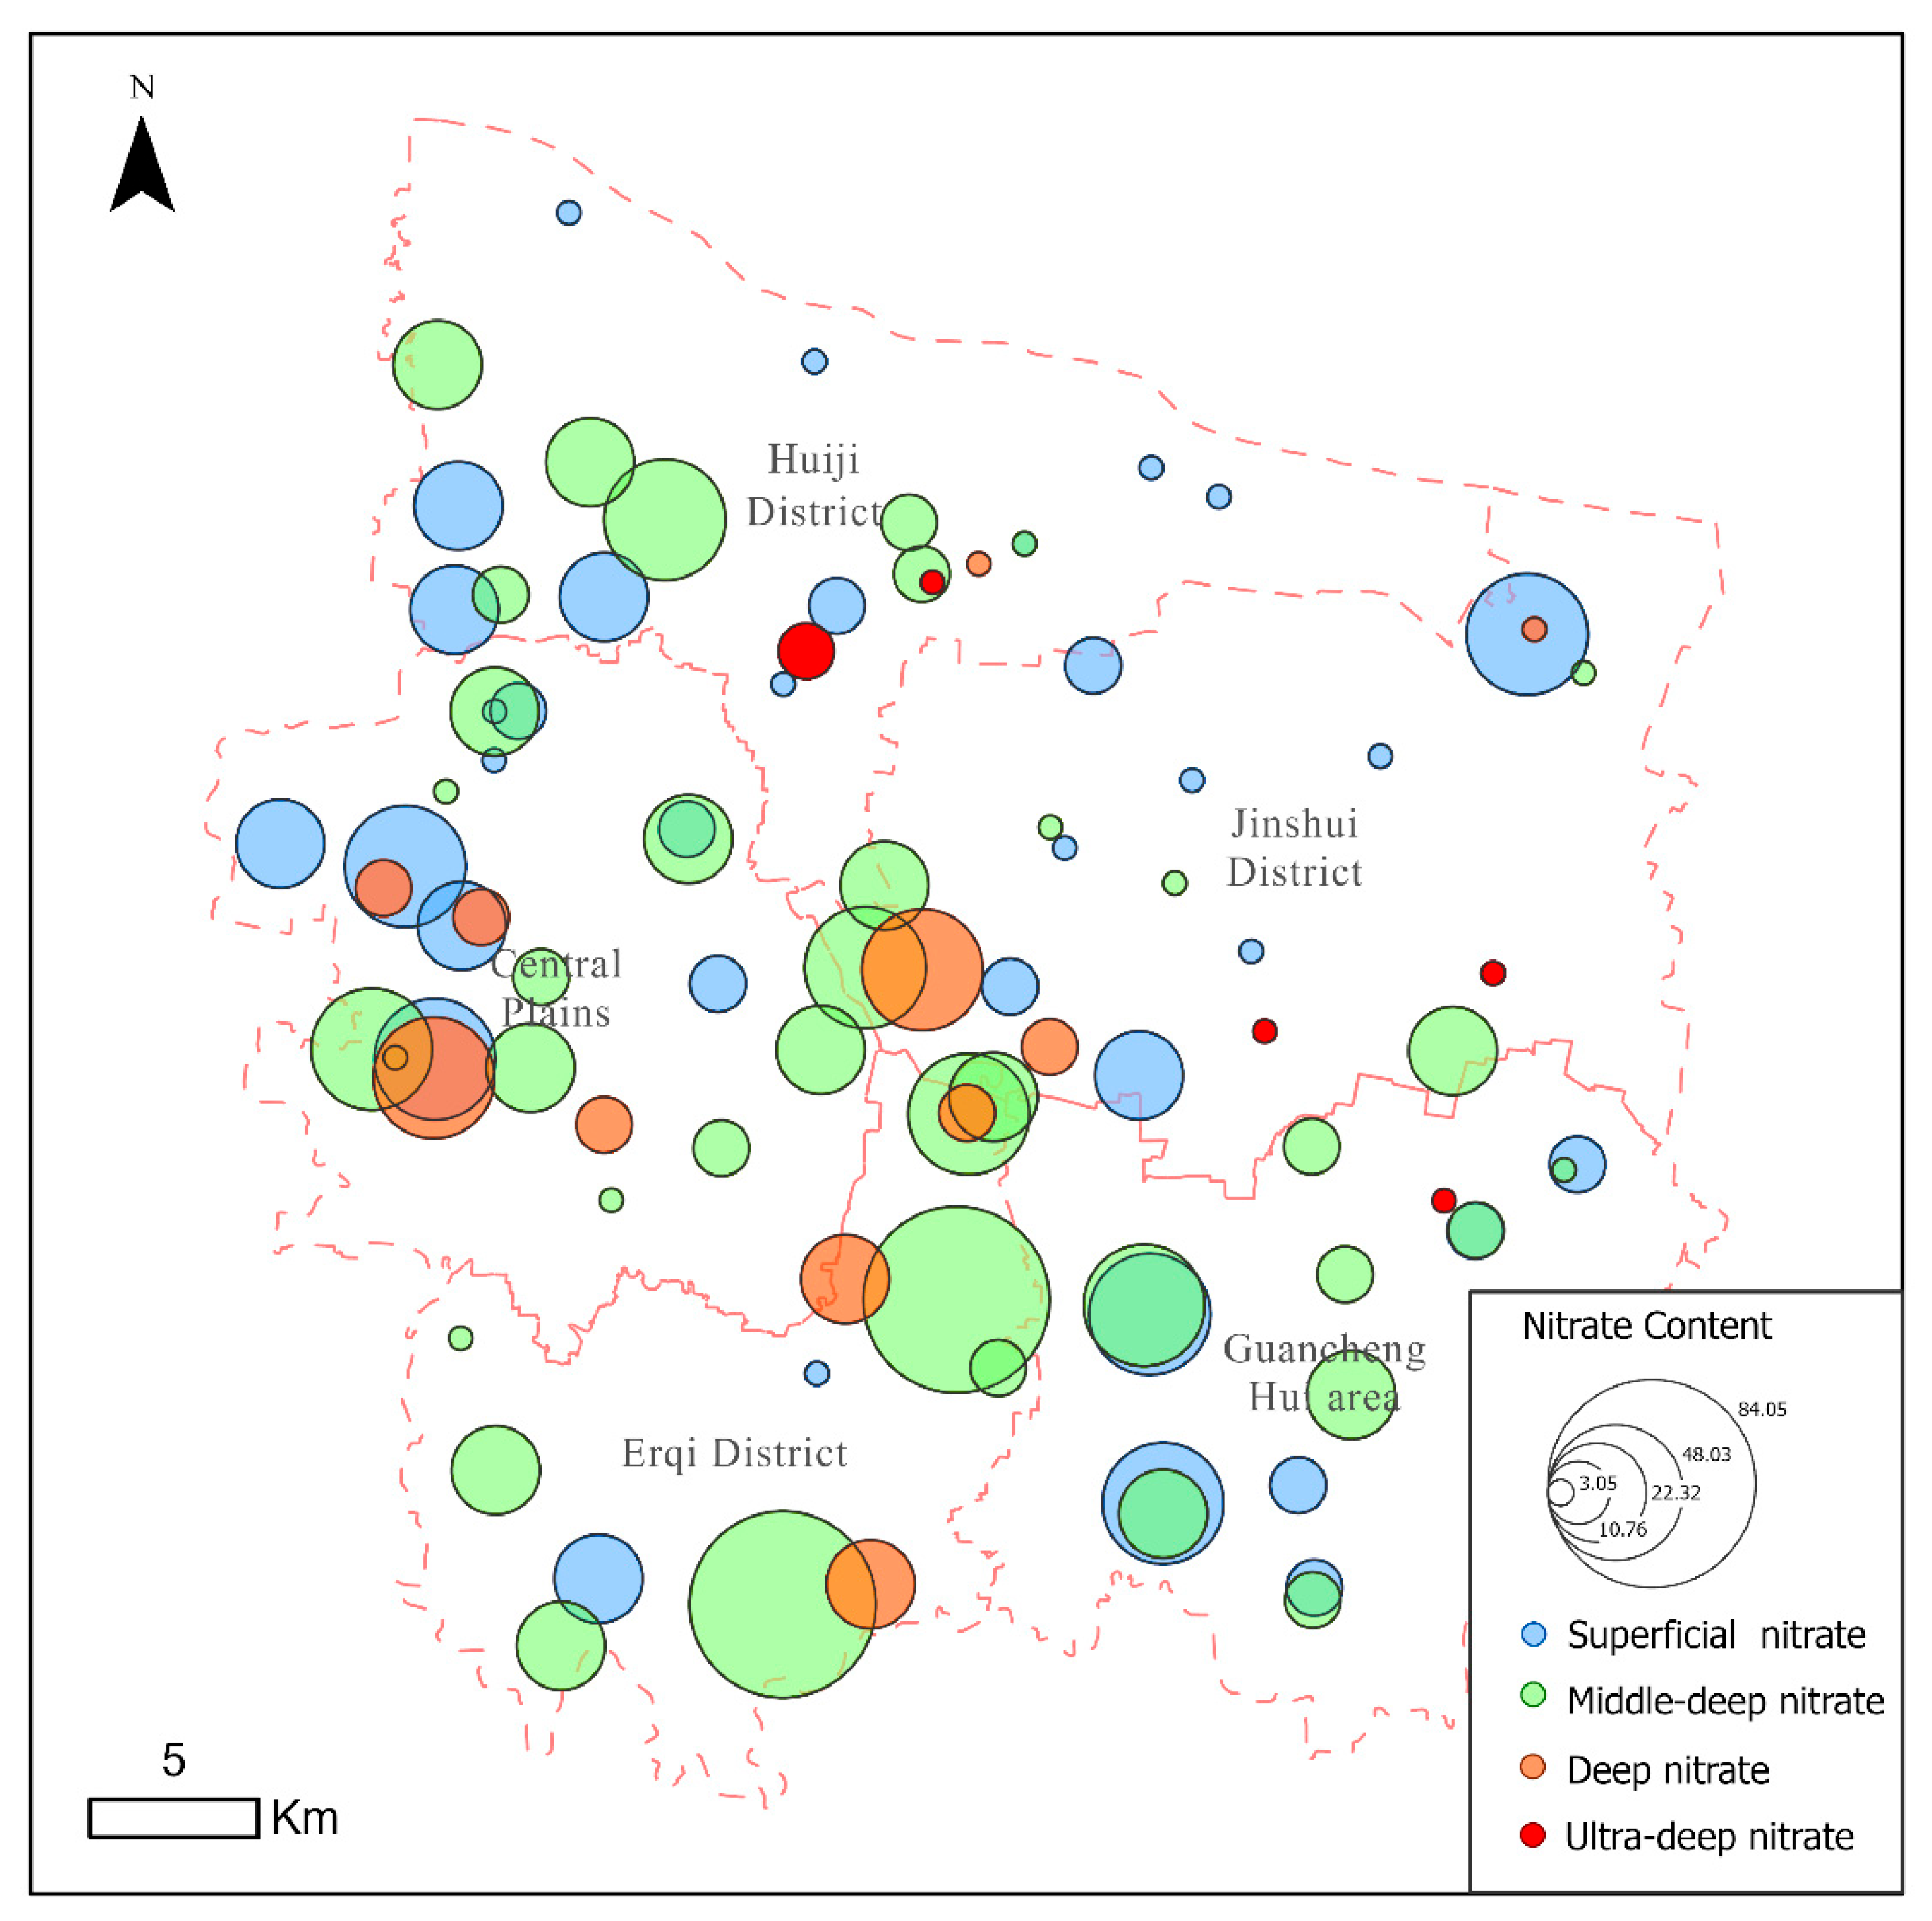
Following the stipulations set out in the Chinese National Standard for Drinking Water Quality [49], the maximum permissible concentration of nitrate (expressed in terms of nitrogen) in drinking water is generally established at 10 mg/L [50]. The World Health Organisation [51] (WHO) limits nitrate levels in drinking water to less than 10 mg/L. As demonstrated in Table 4 and Figure 11, the nitrate concentration in the shallow groundwater ranges from 0.1 to 41.28 mg/L, with an average of 10.67 mg/L. A total of 34.3% of the sampling points are not recommended for drinking water use. In the medium-deep groundwater, nitrate concentrations range from 0 to 84.05 mg/L, with an average of 4.35 mg/L, and 52. In the context of this study, it was determined that 5% of the sampling points were not recommended for drinking water use. The nitrate concentrations in deep groundwater ranged from 0.57 to 46.49 mg/L, with an average of 11.27 mg/L. Furthermore, 36.4% of the sampling points were not recommended for drinking water use. In the ultra-deep groundwater, nitrate concentrations ranged from 0 to 10.76 mg/L, with an average of 2.93 mg/L. Conclusively, 20% of the sampling points were not recommended for drinking water use.
The spatial variation of nitrate concentrations in groundwater was analysed using ArcGIS Pro 3.3 software [52,53]. Typically, NO3 is highly soluble in water and easily reaches the groundwater table, with high concentrations primarily caused by human activities, such as excessive fertiliser application in agriculture, improper discharge of domestic wastewater, and leakage of animal manure [54]. The spatial distribution of nitrate-nitrogen in the groundwater within the study area is illustrated in Figure 12. The distribution of high nitrate concentrations in the shallow groundwater is predominantly concentrated in the western, southern, and northeastern regions, aligning with the runoff direction (southwest to northeast). In the medium-deep groundwater, high nitrate concentrations are primarily distributed in the central and southern regions, with higher concentrations observed in the south than in the central region. In the deep groundwater, high nitrate concentrations are primarily concentrated in the central region, with a minor presence observed in the western region. In the ultra-deep groundwater, high nitrate concentrations are distributed in the northwestern region.
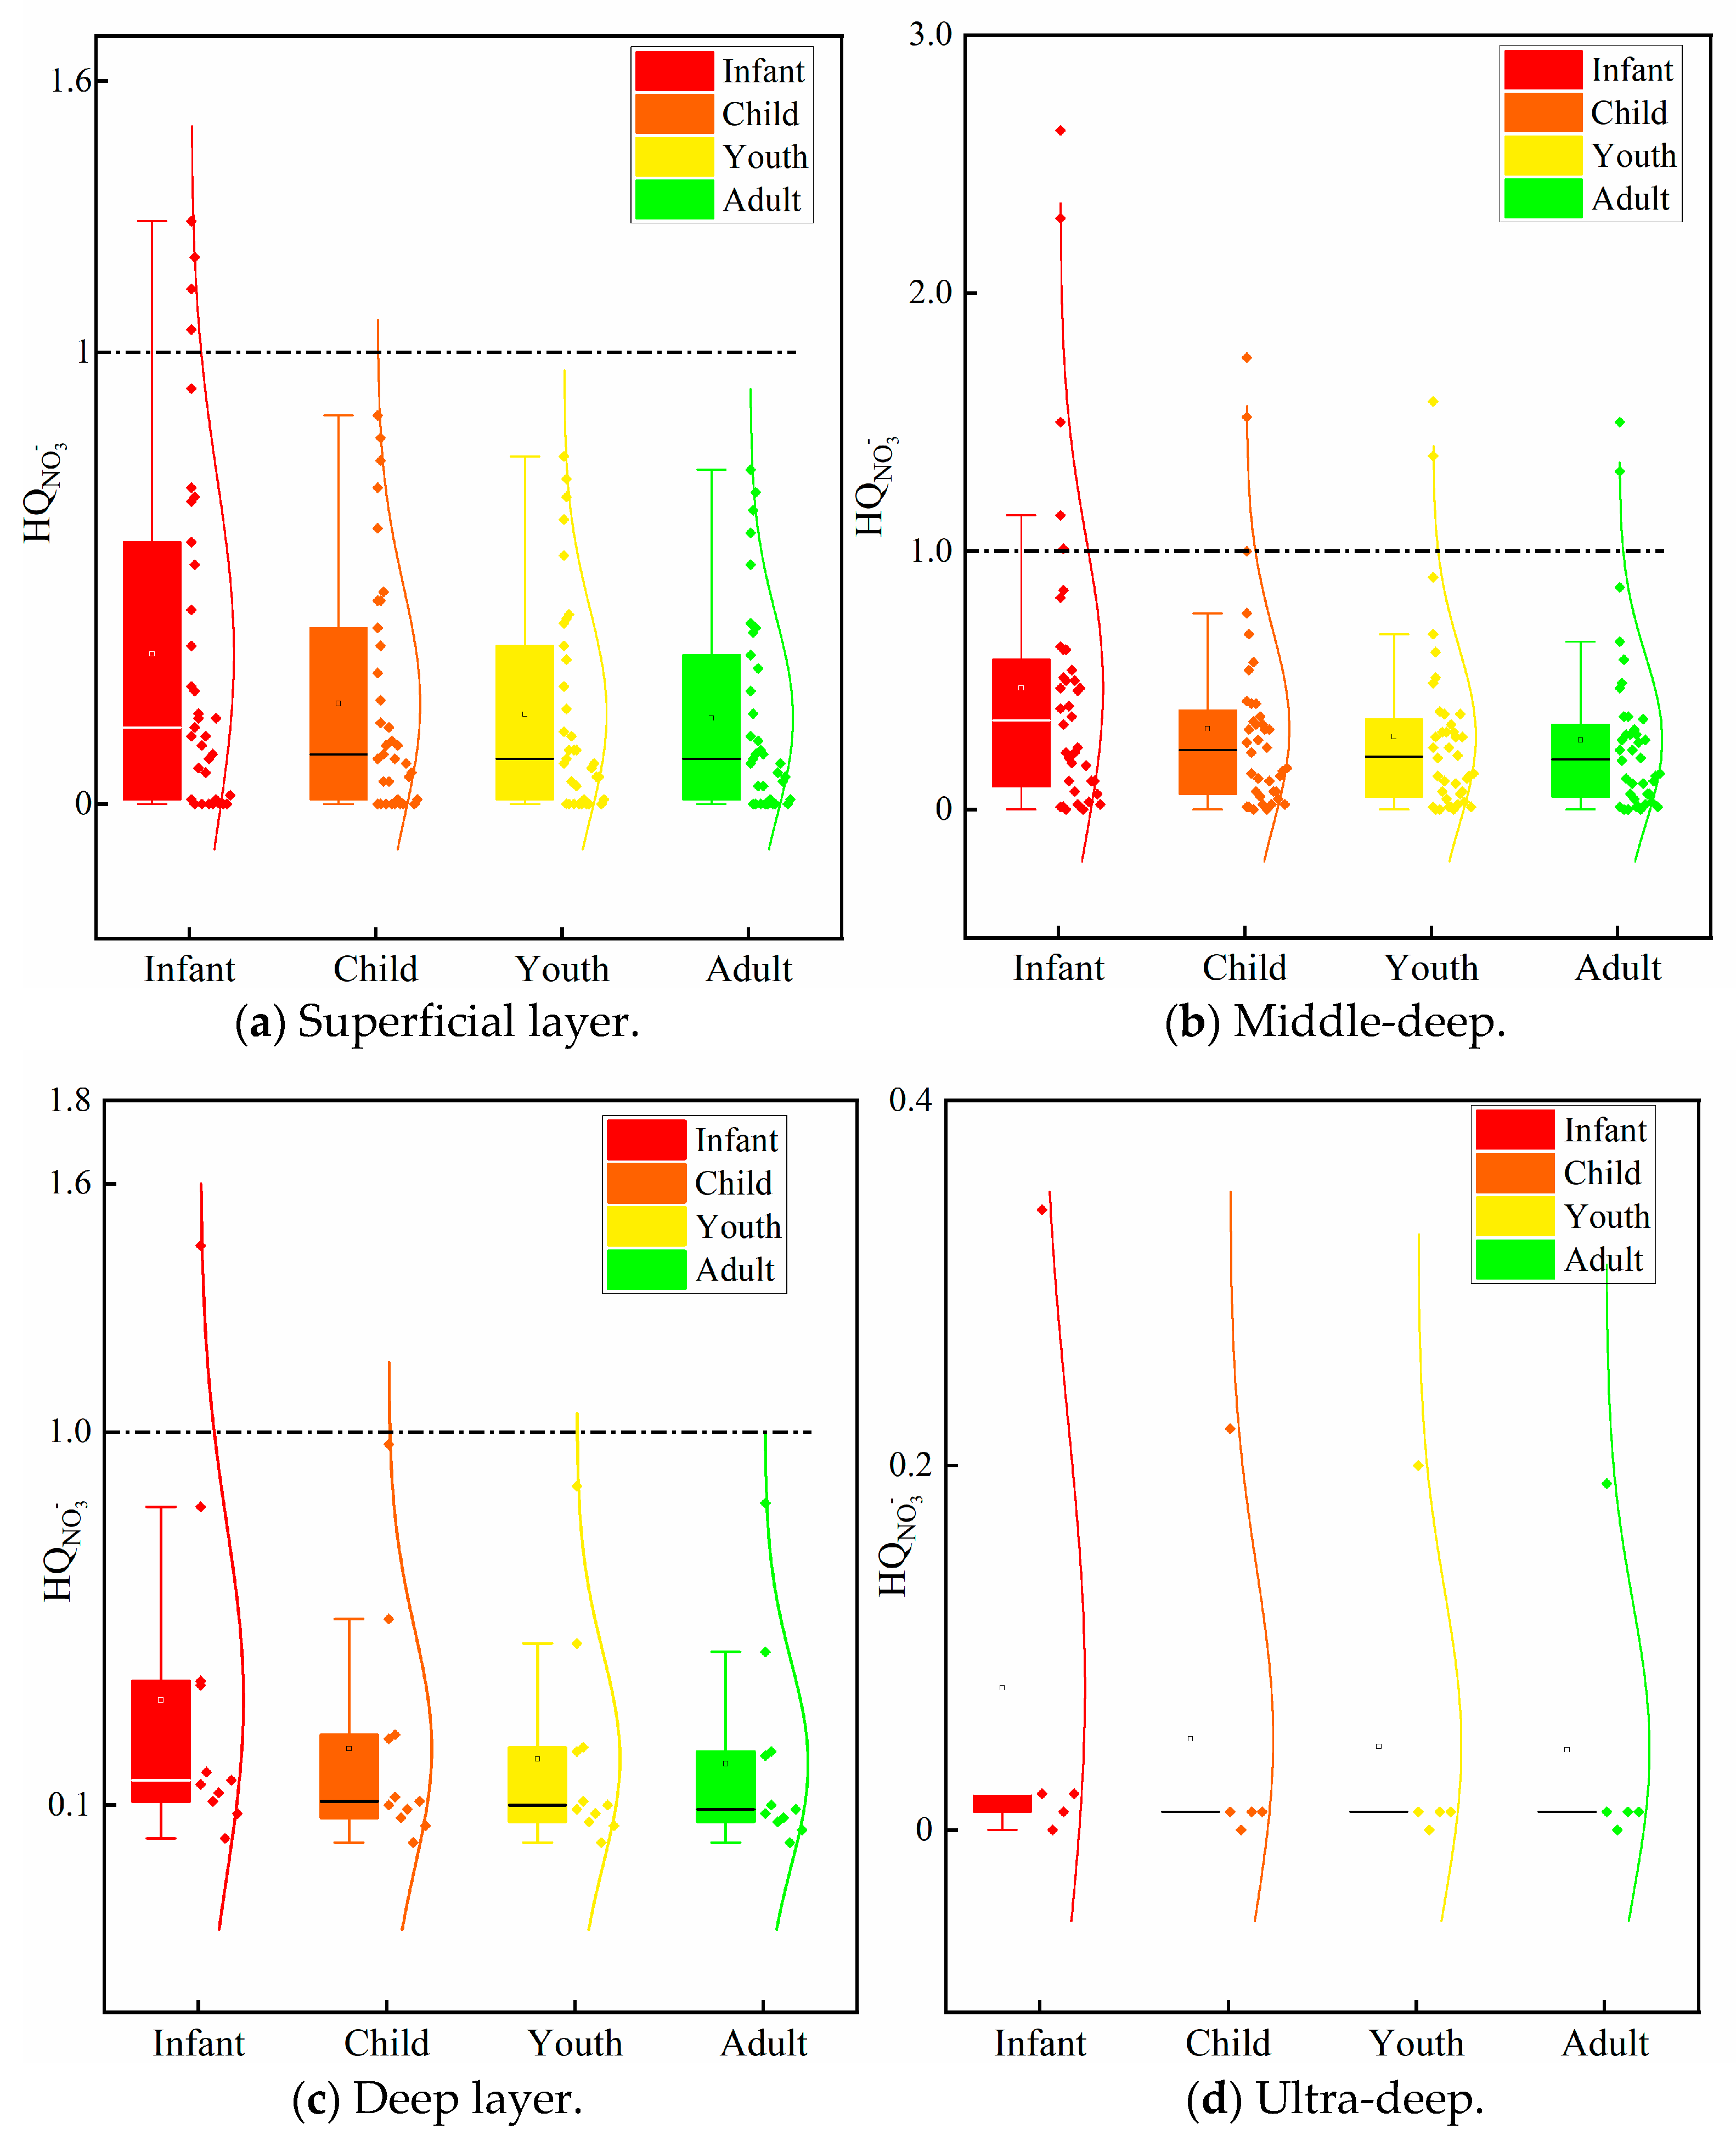
The presence of nitrates in groundwater has been demonstrated to pose a significant health risk to humans. Nitrates themselves are characterised by low toxicity, but under specific conditions, their metabolic products—nitrites and nitrosamines—have the potential to compromise human health. It is well-documented that the long-term ingestion of high concentrations of nitrates can result in a range of physiological symptoms, including lethargy, a decline in work capacity, dizziness, and, in extreme cases, loss of consciousness. Furthermore, nitrosamines have been demonstrated to pose a risk of teratogenicity and mutagenicity. Furthermore, the pH value of gastric fluid in children and infants is close to neutral, which is conducive to the proliferation of nitrate-reducing bacteria. Consequently, nitrates pose a heightened risk to children and infants [55]. In this study, the nitrate contamination of drinking water was incorporated into the human health risk assessment, with the potential risks to humans evaluated accordingly. The HQ values for various parameters of the groundwater in the study area were calculated, with the results displayed in Figure 13.
The results of the shallow groundwater samples are as follows: The NO3-N HQ values for the groundwater range from 0 to 1.29, with four samples (11%) exceeding 1, falling within the 1~4 range, indicating a moderate potential risk. The HQ values for children, adolescents, and adults range from 0 to 0.86, 0 to 0.77, and 0 to 0.74, respectively, all below 1, indicating no potential risk. In the case of the mid-to-deep groundwater, the NO3 infant HQ values range from 0 to 2.65, with four (10%) HQ values falling within the 1~4 range, indicating a moderate potential risk. For children, the HQ value range is 0 to 1.75, with two (5%) HQ values falling within the range of 1 to 4, indicating a moderate potential risk. For adolescents, the HQ value range is 0 to 1. The mean value of the HQ was found to be 58, with two (5%) HQ values falling within the range of 1 to 4, indicating a moderate potential risk. The HQ values for adults ranged from 0 to 1.50, with two (5%) HQ values falling within the range of 1 to 4, indicating a moderate potential risk. In the deep groundwater, the NO3 HQ values range from 0.02 to 1.45, with one (9%) HQ value falling within the range of 1 to 4, indicating a moderate potential risk. The HQ values for children, adolescents, and adults range from 0.01 to 0.97, 0.01 to 0.87, and 0.01 to 0.83, respectively, all of which are below 1, indicating no potential risk [49]. A comprehensive analysis indicates that the potential non-carcinogenic risk in the medium-deep groundwater is higher than in the shallow, deep, and ultra-deep groundwater. Furthermore, it has been observed that infants demonstrate heightened sensitivity and are subject to elevated health risks. Consequently, the utilisation of groundwater for drinking purposes poses a heightened health risk to infants.
A study of the overall potential non-carcinogenic risks for different population groups reveals that all water samples showed the highest risk for infants, followed by children, adolescents, and adults, indicating that younger age groups have weaker resistance to contaminated water bodies. Nitrate levels in the groundwater are typically negligible under conditions not influenced by human activities. The predominant factors contributing to elevated nitrate concentrations in groundwater within the designated study area are of anthropogenic origin. These include irrigation practices, septic tanks, sewage leaks, and the degradation of organic waste. Human activities have been demonstrated to alter the original chemical composition of groundwater, whilst also, to a certain extent, modifying the original groundwater circulation patterns within the region. It is therefore recommended that Zhengzhou City prioritise vulnerable populations when managing water supply systems.

5. Conclusions

The present study investigates the distribution and sources of elevated nitrate levels in groundwater at four different burial depths: shallow, medium-deep, deep, and ultra-deep. This study analyses the formation of groundwater chemistry, groundwater types, and the risks of nitrate pollution to human health, drawing the following conclusions:
(1)
The major cation concentrations in the shallow groundwater and the medium-deep groundwater are similar, with Ca2+ > Na+ > Mg2+ > K+, while those in the deep groundwater and the ultra-deep groundwater are approximately Na+ > Ca2+ > Mg2+ > K+. In the deep groundwater, Na+ and Ca2+ account for over 40% of the total dissolved solids, and in the ultra-deep groundwater, the Na+ content reaches as high as 85%. The percentage of Na+ increases gradually with the burial depth of the sampling points, while the percentage of Ca2+ decreases in a similar, gradual fashion. The predominant controlling factor in this phenomenon is cation exchange. The primary anion concentrations in the groundwater at varying burial depths are as follows: HCO3 > SO42− > Cl > NO3 > F. HCO3 has been found to account for 70~82% of the total anion concentration, thus establishing itself as the dominant anion in the study area’s groundwater.
(2)
The analysis of water chemistry indicates the presence of 12 distinct types of shallow groundwater chemistry within the designated study area. The HCO3-Ca type is identified as the predominant chemistry, accounting for 26% of the total, and is primarily distributed in the southern and central regions of the study area. The investigation revealed eight distinct types of groundwater chemistry in the medium-deep layer, primarily HCO3-Ca·Mg type, accounting for 42%, predominantly distributed in the southwestern, northwestern, and southern parts of Putian Township; followed by the HCO3-Ca type, accounting for 25%, primarily distributed in the central-southern part of the study area. The chemical composition of the deep groundwater is characterised by seven distinct water types, predominantly the HCO3-Ca·Mg type, accounting for 36% of the total, and predominantly distributed in the central, southwestern, and southern regions. The investigation revealed that the ultra-deep groundwater predominantly exhibits the HCO3-Na type, accounting for 60%, and is distributed throughout the northeastern part of the study area.
(3)
The chemical components present in the groundwater of the study area are of the rock-weathering type, with the predominant source of these components being the weathering of carbonate rocks. The predominant factors that govern the process of chemical component formation include leaching, cation exchange, counter-cation exchange, and mixing.
(4)
The potential non-carcinogenic risks associated with the medium-to-deep groundwater are higher than those of the shallow, deep, and ultra-deep groundwater. The mid-deep groundwater has the potential to pose risks to all four categories of people, while the shallow and deep groundwater only pose potential risks to infants. It is therefore recommended that Zhengzhou prioritise restricting agricultural non-point source pollution inputs into the mid-deep aquifer recharge areas (e.g., controlling nitrogen fertiliser application rates, establishing buffer zones), installing nitrate real-time monitoring wells in sensitive areas, and focusing particularly on vulnerable groups in water supply management.

Author Contributions

Funding acquisition, Data collection, C.Z.; Data analysis, Data processing, Thesis writing, X.L.; Research supervision, S.Z.; Thesis supervision and revision, G.Z.; Technical validation, J.Z.; Data validation, L.J.; Literature review, W.L. and D.L. All authors have read and agreed to the published version of the manuscript.

Funding

This work was supported by the [Natural Science Foundation of Henan Province] (Grant numbers [232300420442]) and [The Belt and Road Special Foundation of the National Key Laboratory of Water Disaster Prevention] (Grant numbers [2021490911]).

Data Availability Statement

The original contributions presented in this study are included in the article. Further inquiries can be directed to the corresponding author.

Acknowledgments

Throughout the entire process of writing this thesis, I received a great deal of support and assistance. Xujing Liu especially want to thank her team members for their excellent cooperation and patient support. Xujing Liu also want to thank my supervisor, Chunyan Zhang, for the valuable guidance she provided throughout my learning process. You provided me with the necessary tools, enabling me to choose the right direction and to successfully complete my thesis.

Conflicts of Interest

Author Shuailing Zhang was employed by the company Henan Electric Power Survey & Design Institute. The remaining authors declare that the research was conducted in the absence of any commercial or financial relationships that could be construed as a potential conflict of interest.

References

  1. Sheng, D.; Meng, X.; Wen, X.; Wu, J.; Yu, H.; Wu, M.; Zhou, T. Hydrochemical characteristics, quality and health risk assessment of nitrate enriched coastal groundwater in northern China. J. Clean. Prod. 2023, 403, 136872. [Google Scholar] [CrossRef]
  2. Frappart, F.; Merwade, V.M. Groundwater systems worldwide. Front. Earth Sci. 2022, 10, 1097789. [Google Scholar] [CrossRef]
  3. Cao, T.; Han, D.; Song, X.; Trolle, D. Subsurface hydrological processes and groundwater residence time in a coastal alluvium aquifer: Evidence from environmental tracers (δ18O, δ2H, CFCs, 3H) combined with hydrochemistry. Sci. Total Environ. 2020, 743, 140684. [Google Scholar] [CrossRef] [PubMed]
  4. Liu, M.; Xiao, C.; Liang, X.; Wei, H. Response of groundwater chemical characteristics to land use types and health risk assessment of nitrate in semi-arid areas: A case study of Shuangliao City, Northeast China. Ecotoxicol. Environ. Saf. 2022, 236, 113473. [Google Scholar] [CrossRef]
  5. Vadiati, M.; Adamowski, J.; Beynaghi, A. A brief overview of trends in groundwater research: Progress towards sustainability? J. Environ. Manag. 2018, 223, 849–851. [Google Scholar] [CrossRef]
  6. Yin, Z.; Luo, Q.; Wu, J.; Xu, S.; Wu, J. Identification of the long-term variations of groundwater and their governing factors based on hydrochemical and isotopic data in a river basin. J. Hydrol. 2021, 592, 125604. [Google Scholar] [CrossRef]
  7. Li, Z.; Yang, Q.; Xie, C.; Lu, X. Source identification and health risks of nitrate contamination in shallow groundwater: A case study in Subei Lake basin. Environ. Sci. Pollut. Res. Int. 2023, 30, 13660–13670. [Google Scholar] [CrossRef] [PubMed]
  8. Liu, J.; Gao, Z.; Zhang, Y.; Sun, Z.; Sun, T.; Fan, H.; Wu, B.; Li, M.; Qian, L. Hydrochemical evaluation of groundwater quality and human health risk assessment of nitrate in the largest peninsula of China based on high-density sampling: A case study of Weifang. J. Clean. Prod. 2021, 322, 129164. [Google Scholar] [CrossRef]
  9. Pandey, S.; Mohapatra, G.; Arora, R. Groundwater quality, human health risks and major driving factors in arid and semi-arid regions of Rajasthan, India. J. Clean. Prod. 2023, 427, 139149. [Google Scholar] [CrossRef]
  10. Liu, R.; Xie, X.; Hou, Q.; Han, D.; Song, J.; Huang, G. Spatial distribution, sources, and human health risk assessment of elevated nitrate levels in groundwater of an agriculture-dominant coastal area in Hainan Island, China. J. Hydrol. 2024, 634, 131088. [Google Scholar] [CrossRef]
  11. Adimalla, N. Spatial distribution, exposure, and potential health risk assessment from nitrate in drinking water from semi-arid region of South India. Hum. Ecol. Risk Assess. Int. J. 2019, 26, 310–334. [Google Scholar] [CrossRef]
  12. Wang, D.; Li, P.; Yang, N.; Yang, C.; Zhou, Y.; Li, J. Distribution, sources and main controlling factors of nitrate in a typical intensive agricultural region, northwestern China: Vertical profile perspectives. Environ. Res. 2023, 237, 116911. [Google Scholar] [CrossRef] [PubMed]
  13. Qi, S.; Feng, Q.; Zhu, M.; Shu, H.; Liu, W.; Yang, L.; Yin, Z.; Zhang, C. Source apportionment of nitrates in different aquifers in an arid region, northwestern China. J. Clean. Prod. 2022, 374, 133969. [Google Scholar] [CrossRef]
  14. Xiong, H.; Wang, Y.; Guo, X.; Han, J.; Ma, C.; Zhang, X. Current status and future challenges of groundwater vulnerability assessment: A bibliometric analysis. J. Hydrol. 2022, 615, 128694. [Google Scholar] [CrossRef]
  15. Chen, K.; Liu, Q.; Peng, W.; Liu, X. Source apportionment and natural background levels of major ions in shallow groundwater using multivariate statistical method: A case study in Huaibei Plain, China. J. Environ. Manag. 2022, 301, 113806. [Google Scholar] [CrossRef] [PubMed]
  16. Feng, W.; Wang, C.; Lei, X.; Wang, H.; Zhang, X. Distribution of Nitrate Content in Groundwater and Evaluation of Potential Health Risks: A Case Study of Rural Areas in Northern China. Int. J. Environ. Res. Public Health 2020, 17, 9390. [Google Scholar] [CrossRef]
  17. Fenech, C.; Rock, L.; Nolan, K.; Tobin, J.; Morrissey, A. The potential for a suite of isotope and chemical markers to differentiate sources of nitrate contamination: A review. Water Res. 2012, 46, 2023–2041. [Google Scholar] [CrossRef] [PubMed]
  18. Xiao, Y.; Hao, Q.; Zhang, Y.; Zhu, Y.; Yin, S.; Qin, L.; Li, X. Investigating sources, driving forces and potential health risks of nitrate and fluoride in groundwater of a typical alluvial fan plain. Sci. Total Environ. 2022, 802, 149909. [Google Scholar] [CrossRef]
  19. Adimalla, N.; Qian, H. Groundwater chemistry, distribution and potential health risk appraisal of nitrate enriched groundwater: A case study from the semi-urban region of South India. Ecotoxicol. Environ. Saf. 2021, 207, 111277. [Google Scholar] [CrossRef] [PubMed]
  20. Amiri, V.; Sohrabi, N.; Li, P.; Amiri, F. Groundwater Quality for Drinking and Non-Carcinogenic Risk of Nitrate in Urban and Rural Areas of Fereidan, Iran. Expo. Health 2022, 15, 807–823. [Google Scholar] [CrossRef]
  21. Wu, Y.; Wang, J.; Liu, Z.; Li, C.; Niu, Y.; Jiang, X. Seasonal nitrate input drives the spatiotemporal variability of regional surface water-groundwater interactions, nitrate sources and transformations. J. Hydrol. 2025, 655, 132973. [Google Scholar] [CrossRef]
  22. Abu, M.; Egbueri, J.C.; Agbasi, J.C. Kriging-interpolated mapping and predictive modeling of groundwater F and NO3 contamination with chemometric and health risk assessments in Ghana’s Birimian Province. Environ. Geochem. Health 2025, 47, 165. [Google Scholar] [CrossRef]
  23. Abascal, E.; Gomez-Coma, L.; Ortiz, I.; Ortiz, A. Global diagnosis of nitrate pollution in groundwater and review of removal technologies. Sci. Total Environ. 2022, 810, 152233. [Google Scholar] [CrossRef]
  24. Yu, G.; Wang, J.; Liu, L.; Li, Y.; Zhang, Y.; Wang, S. The analysis of groundwater nitrate pollution and health risk assessment in rural areas of Yantai, China. BMC Public Health 2020, 20, 437. [Google Scholar] [CrossRef] [PubMed]
  25. Sahraoui, H.; Fakir, Y.; Bouimouass, H.; Tweed, S.; Leblanc, M.; Benaddi, R.; Chehbouni, A. Spatial and depth distribution of salinity and nitrate in a depleted alluvial aquifer (Haouz plain, Morocco). J. Hydrol. Reg. Stud. 2025, 57, 102143. [Google Scholar] [CrossRef]
  26. Zhang, Z.; Ma, C.; Zhang, D.; Ma, Y.; Huang, P. Integrating the impact of large-scale hydraulic engineering with a sustainable groundwater development strategy: A case study of Zhengzhou City, China. Sci. Total Environ. 2022, 838, 156579. [Google Scholar] [CrossRef] [PubMed]
  27. Yuan, W.; Wang, Z.; Zhang, T.; Liu, Z.; Ma, Y.; Xiong, Y.; An, F. Assessment and Prediction of Groundwater Vulnerability Based on Land Use Change—A Case Study of the Central Urban Area of Zhengzhou. Water 2024, 16, 3716. [Google Scholar] [CrossRef]
  28. Wang, G.; Zhang, M.; Wang, S.; Fu, Y.; Lu, J. Effects of extreme heavy rainfall on groundwater in different layers-Taking Zhengzhou 7 · 20 heavy rainstorm as an example. Groundwater 2024, 46, 79–84. (In Chinese) [Google Scholar] [CrossRef]
  29. Wu, B.; Guo, X.; Jia, X.; Guo, L.; Tang, H.; Liu, S. Vulnerability assessment of shallow groundwater in the central urban area of Zhengzhou. Environ. Prot. Sci. 2022, 48, 135–139+144. (In Chinese) [Google Scholar] [CrossRef]
  30. Zhang, B.; Chen, L.; Li, Y.; Liu, Y.; Li, C.; Kong, X.; Zhang, Y. Impacts of River Bank Filtration on Groundwater Hydrogeochemistry in the Upper of Hutuo River Alluvial Plain, North China. Water 2023, 15, 1343. [Google Scholar] [CrossRef]
  31. Duvva, L.K.; Panga, K.K.; Dhakate, R.; Himabindu, V. Health risk assessment of nitrate and fluoride toxicity in groundwater contamination in the semi-arid area of Medchal, South India. Appl. Water Sci. 2021, 12, 11. [Google Scholar] [CrossRef]
  32. Adimalla, N. Controlling factors and mechanism of groundwater quality variation in semiarid region of South India: An approach of water quality index (WQI) and health risk assessment (HRA). Environ. Geochem. Health 2020, 42, 1725–1752. [Google Scholar] [CrossRef] [PubMed]
  33. Tian, H.; Liang, X.; Gong, Y.; Kang, Z.; Jin, H. Health risk assessment of nitrate pollution in shallow groundwater: A case study in Changchun New District, China. Houille Blanche 2019, 105, 45–58. [Google Scholar] [CrossRef]
  34. Adimalla, N.; Wu, J. Groundwater quality and associated health risks in a semi-arid region of south India: Implication to sustainable groundwater management. Hum. Ecol. Risk Assess. Int. J. 2019, 25, 191–216. [Google Scholar] [CrossRef]
  35. Adimalla, N.; Li, P.; Qian, H. Evaluation of groundwater contamination for fluoride and nitrate in semi-arid region of Nirmal Province, South India: A special emphasis on human health risk assessment (HHRA). Hum. Ecol. Risk Assess. Int. J. 2018, 25, 1107–1124. [Google Scholar] [CrossRef]
  36. Gan, L.; Huang, G.; Pei, L.; Gan, Y.; Liu, C.; Yang, M.; Han, D.; Song, J. Distributions, origins, and health-risk assessment of nitrate in groundwater in typical alluvial-pluvial fans, North China Plain. Environ. Sci. Pollut. Res. Int. 2022, 29, 17031–17048. [Google Scholar] [CrossRef]
  37. Wang, Y.; Li, P. Appraisal of shallow groundwater quality with human health risk assessment in different seasons in rural areas of the Guanzhong Plain (China). Environ. Res. 2021, 207, 112210. [Google Scholar] [CrossRef] [PubMed]
  38. GB/T 14848—2017; Groundwater Quality Standard. China Standards Press: Beijing, China, 2017.
  39. Ji, Y.; Wu, J.; Wang, Y.; Elumalai, V.; Subramani, T. Seasonal Variation of Drinking Water Quality and Human Health Risk Assessment in Hancheng City of Guanzhong Plain, China. Expo. Health 2020, 12, 469–485. [Google Scholar] [CrossRef]
  40. Gao, Y.; Qian, H.; Ren, W.; Wang, H.; Liu, F.; Yang, F. Hydrogeochemical characterization and quality assessment of groundwater based on integrated-weight water quality index in a concentrated urban area. J. Clean. Prod. 2020, 260, 121006. [Google Scholar] [CrossRef]
  41. Su, C.; Nie, s.; Zou, S.; Zhao, G.; Luo, F.; Huang, Q.; Ba, J.; Li, X.; Liang, J.; Yang, Y. Hydrochemical characteristics and genesis analysis of strontium-rich groundwater in Xintian, Hunan. Mod. Geol. 2018, 32, 554–564. (In Chinese) [Google Scholar] [CrossRef]
  42. Liu, J.; Peng, Y.; Li, C.; Gao, Z.; Chen, S. An investigation into the hydrochemistry, quality and risk to human health of groundwater in the central region of Shandong Province, North China. J. Clean. Prod. 2021, 282, 125416. [Google Scholar] [CrossRef]
  43. Wei, M.; Wu, J.; Li, W.; Zhang, Q.; Su, F.; Wang, Y. Groundwater Geochemistry and its Impacts on Groundwater Arsenic Enrichment, Variation, and Health Risks in Yongning County, Yinchuan Plain of Northwest China. Expo. Health 2021, 14, 219–238. [Google Scholar] [CrossRef]
  44. Marghade, D.; Malpe, D.B.; Duraisamy, K.; Patil, P.D.; Li, P. Hydrogeochemical evaluation, suitability, and health risk assessment of groundwater in the watershed of Godavari basin, Maharashtra, Central India. Environ. Sci. Pollut. Res. Int. 2021, 28, 18471–18494. [Google Scholar] [CrossRef]
  45. Zhang, Q.; Wei, A.; Ren, J.; Qian, H.; Hou, K. Multi-isotope tracer for identifying nitrate sources in shallow groundwater in a large irrigation area, China. J. Environ. Manag. 2025, 376, 124424. [Google Scholar] [CrossRef] [PubMed]
  46. Chen, J.; Huang, Q.; Lin, Y.; Fang, Y.; Qian, H.; Liu, R.; Ma, H. Hydrogeochemical Characteristics and Quality Assessment of Groundwater in an Irrigated Region, Northwest China. Water 2019, 11, 96. [Google Scholar] [CrossRef]
  47. Zhang, Q.; Hu, Y.; Zhang, Y.; Nie, B. analysis of chemical characteristics and controlling factors of groundwater in alluvial-proluvial fan of Jianjiang River. Environ. Sci. 2019, 40, 3089–3098. (In Chinese) [Google Scholar] [CrossRef]
  48. Liu, C.; Liu, F.; Zhen, P.; Guo, X.; Chai, H.; Guo, Y. Groundwater hydrochemical change characteristics and controlling factors of typical pressure mining area in Hebei. Environ. Sci. 2025, 46, 2193–2205. (In Chinese) [Google Scholar] [CrossRef]
  49. GB 5749-2022; Sanitary Standards for Drinking Water. State Administration for Market Regulation and Standardization Administration of China: Beijing, China, 2022.
  50. Wei, X.; Zhou, Y.; Ran, L.; Chen, M.; Zou, J.; Fan, Z.; Fu, Y. Sources and Transformation of Nitrate in Shallow Groundwater in the Three Gorges Reservoir Area: Hydrogeochemistry and Isotopes. Water 2024, 16, 3299. [Google Scholar] [CrossRef]
  51. World Health Organization (WHO), Guidelines for Drinking-Water Quality: Fourth Edition Incorporating the First and Second Addenda; World Health Organization (WHO): Geneva, Switzerland, 2022.
  52. Adimalla, N. Groundwater Quality for Drinking and Irrigation Purposes and Potential Health Risks Assessment: A Case Study from Semi-Arid Region of South India. Expo. Health 2018, 11, 109–123. [Google Scholar] [CrossRef]
  53. Gugulothu, S.; Subba Rao, N.; Das, R.; Duvva, L.K.; Dhakate, R. Judging the sources of inferior groundwater quality and health risk problems through intake of groundwater nitrate and fluoride from a rural part of Telangana, India. Environ. Sci. Pollut. Res. Int. 2022, 29, 49070–49091. [Google Scholar] [CrossRef] [PubMed]
  54. Adimalla, N.; Qian, H.; Nandan, M.J. Groundwater chemistry integrating the pollution index of groundwater and evaluation of potential human health risk: A case study from hard rock terrain of south India. Ecotoxicol. Environ. Saf. 2020, 206, 111217. [Google Scholar] [CrossRef] [PubMed]
  55. Hu, Y.; You, M.; Liu, G.; Dong, Z. Distribution and potential health risk of nitrate in centralized groundwater sources of Wanbei Plain, Central China. J. Water Supply Res. Technol. Aqua 2021, 70, 684–695. [Google Scholar] [CrossRef]
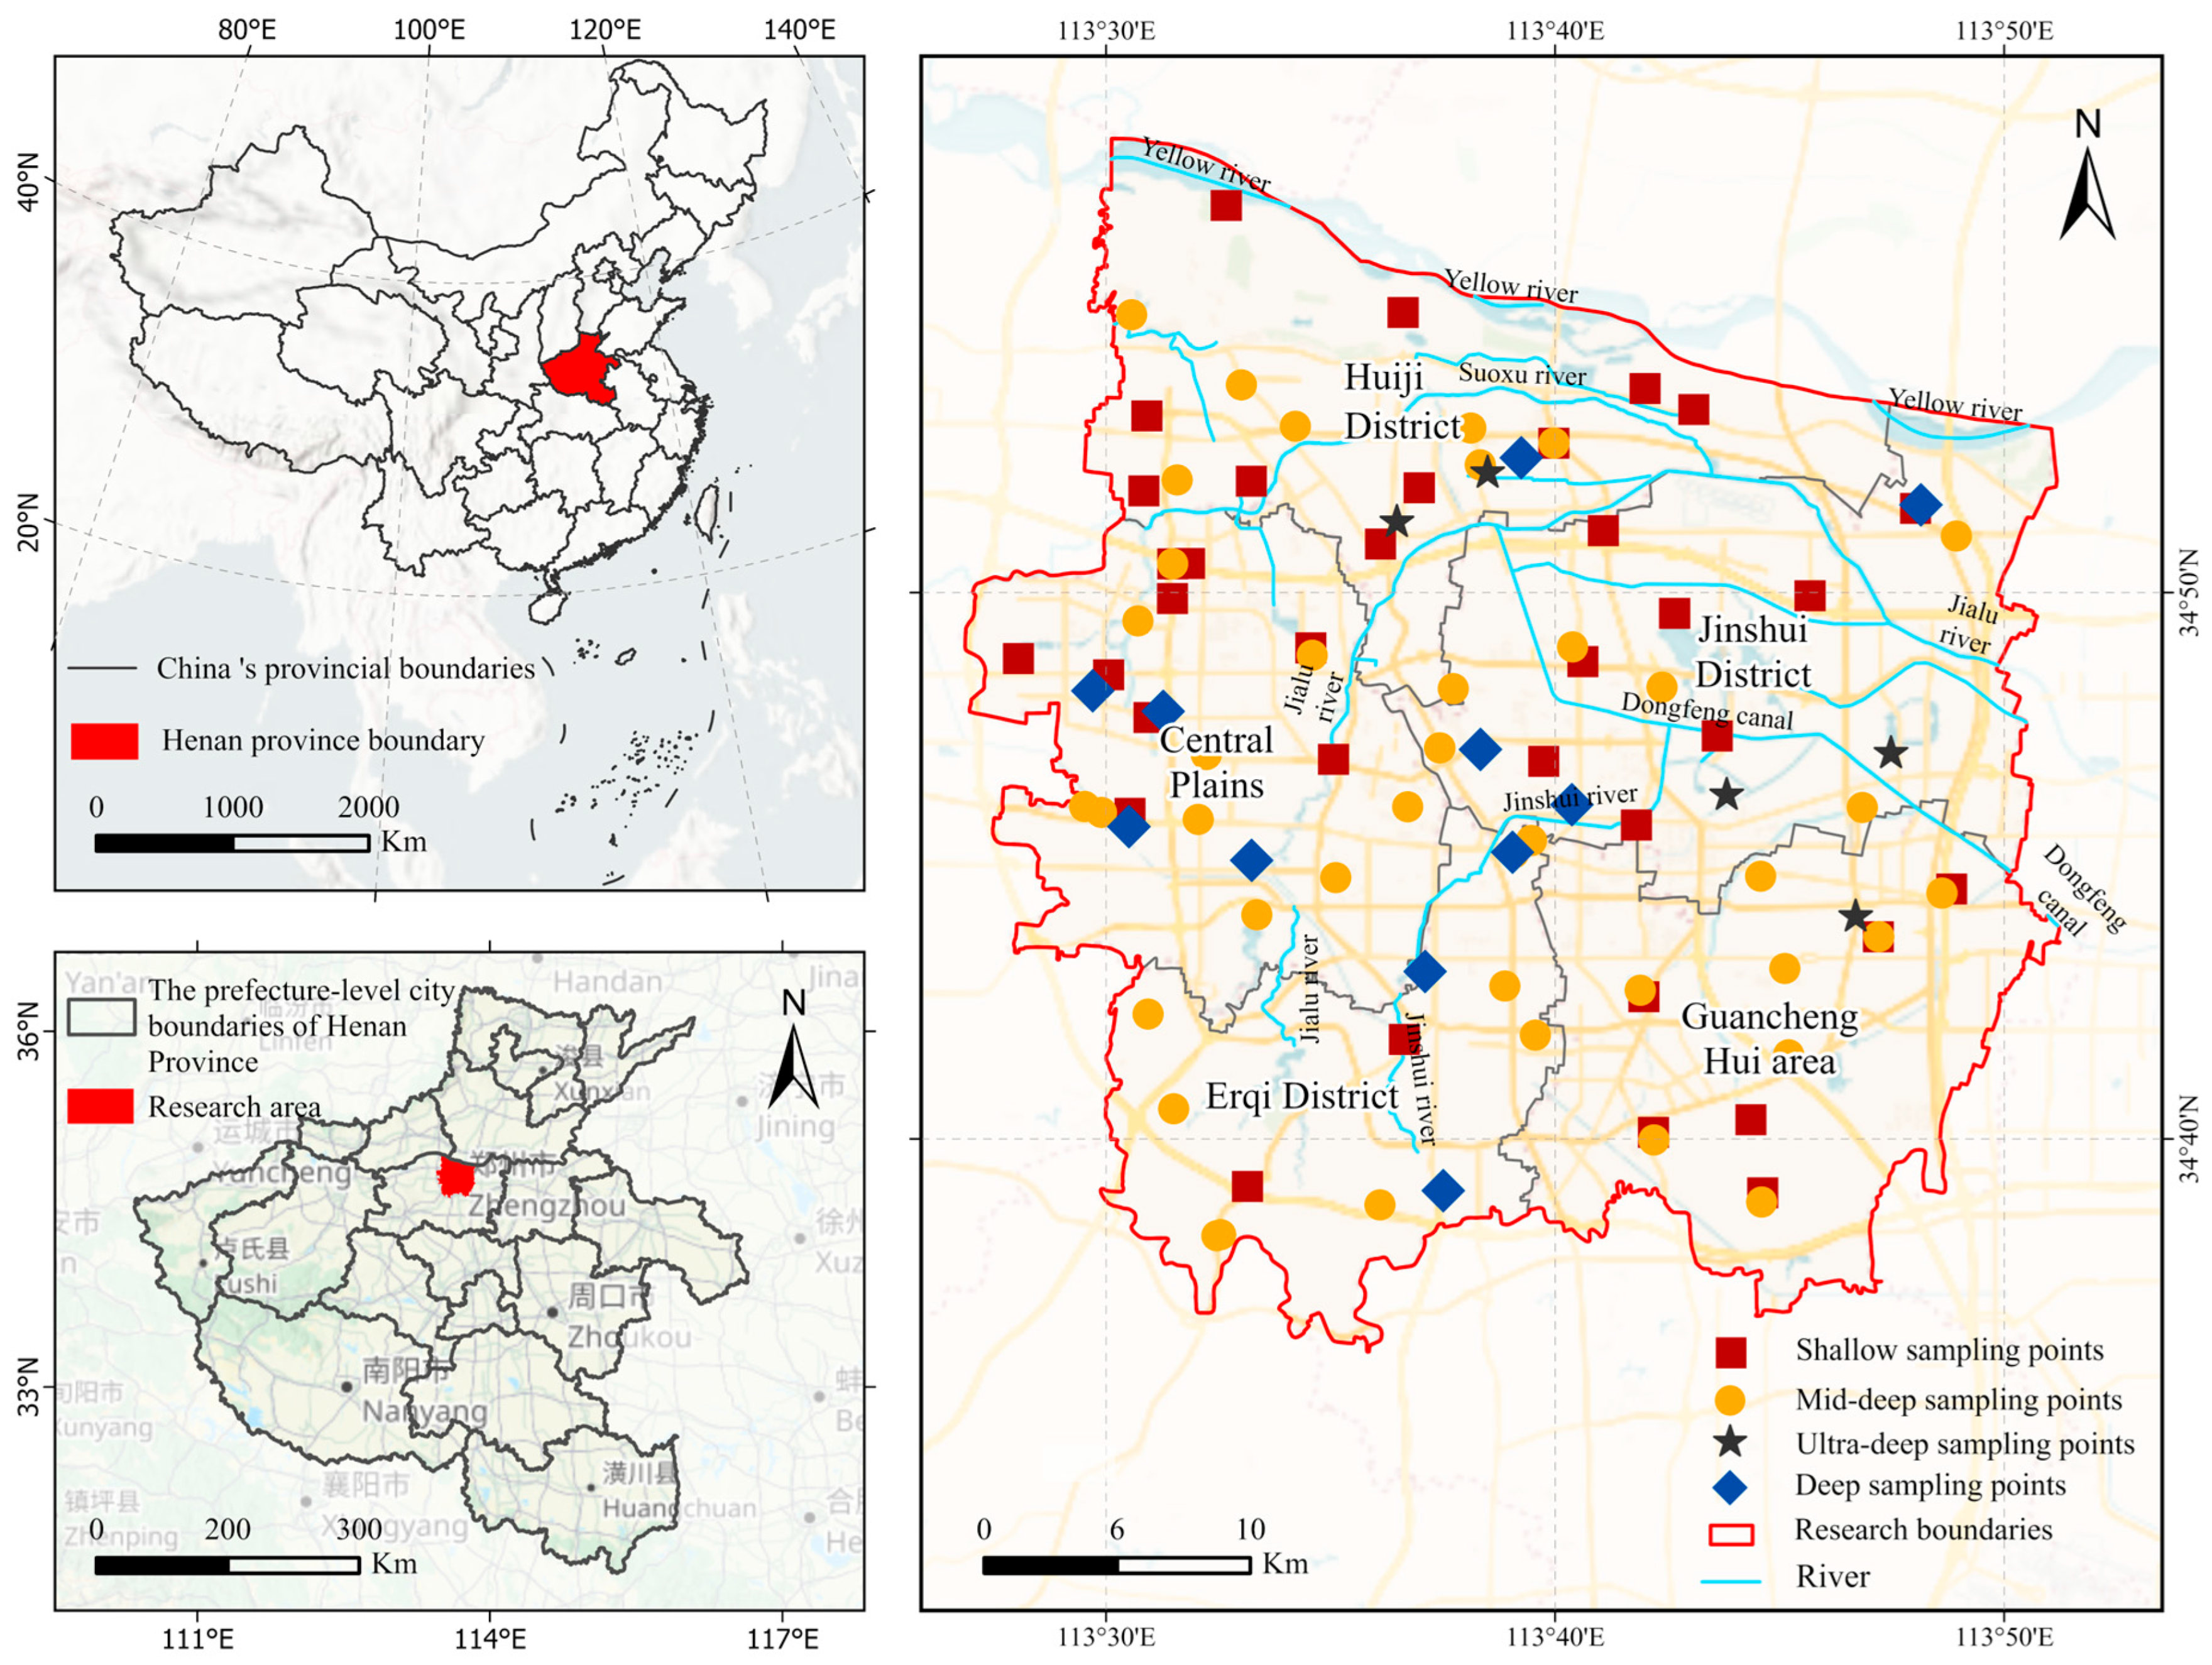
Figure 1. Study area and distribution of groundwater sampling sites. (This figure illustrates the location of the study area and the distribution of groundwater sampling sites. The top-left subfigure shows the location of Henan Province (marked in red) within China. The bottom-left subfigure further pinpoints the research area (marked in red) within Henan Province. The right subfigure presents the detailed distribution of different types of groundwater sampling points in the research area: red squares represent shallow sampling points, yellow circles represent mid-deep sampling points, black stars represent ultra-deep sampling points, and blue diamonds represent deep sampling points. Red lines denote the boundaries of the research area, and blue lines represent rivers).
Water 17 02851 g001
Figure 2. Contour Map of Shallow and Medium-Deep Groundwater Levels in Zhengzhou During the Dry Season. (The two maps depict the shallow and medium-deep groundwater level contour lines during Zhengzhou’s dry season: (a) shows the shallow groundwater level contour lines, while (b) displays the medium-deep groundwater level contour lines. In the figures: blue dots denote groundwater sampling points; black lines represent contour lines, unit: metres, interval: 5 meters; orange lines delineate administrative boundaries. The compass rose in the upper left corner indicates map orientation, while the scale in the lower left corner denotes distances in kilometres).
Water 17 02851 g002aWater 17 02851 g002b
Figure 3. Comparison of statistical characteristics of TDS and TH in different aquifers (2015–2019). (These two bar charts compare the statistical characteristics of total dissolved solids (TDS) and total hardness (TH) across different aquifers from 2015 to 2019. The upper chart displays the minimum (Mini), maximum (Max), mean, and standard deviation (SD) of the TDS for the shallow, intermediate, deep, and ultra-deep aquifers in both 2015 and 2019. The lower chart presents the corresponding statistical indicators for the TH across these aquifers during the two years. Different colours and patterns distinguish the 2015 data (solid) from the 2019 data (grid pattern), facilitating the comparison of hydrochemical parameter trends between aquifer types and years).
Water 17 02851 g003
Figure 4. Box diagram of water chemistry statistical analysis of water samples in the study area. (This figure presents statistical distributions of various hydrochemical constituents in water samples from different aquifers within the study area (red denotes shallow aquifers, orange denotes medium-deep aquifers, yellow denotes deep aquifers, and green denotes ultra-deep aquifers). Within the box plots, the box represents the interquartile range (the upper quartile and lower quartile), the line within the box indicates the median, the whiskers extend to the minimum and maximum values, and points outside the box (red dots in the figure) represent outliers. (a) Box plots for K+, Ca2+, and Na+, respectively, illustrating the distribution characteristics of these ions across different aquifers. (b) Box plots for Mg2+, NO3, and F, illustrating the distribution characteristics of these ions across different aquifers. (c) Box plots for Cl, HCO3, and SO42−, illustrating the distribution characteristics of these ions across different aquifers).
Water 17 02851 g004
Figure 5. Piper diagram of groundwater in the study area. This diagram presents the Piper diagram for the study area, used to analyse the chemical types of groundwater within the region. (a) Piper diagram for the study area in 2015. (b) Piper diagram for the study area in 2019. Different symbols represent groundwater samples from distinct aquifers: black squares denote shallow aquifers, red dots indicate medium-depth aquifers, blue triangles represent deep aquifers, and green inverted triangles signify ultra-deep aquifers. The central section shows the main correlations: the upper rhombus area displays relationships between major cations (Ca2+, Mg2+, Na+ + K+) and anions (Cl + SO42−, CO32− + HCO3). The two triangular regions below detail the distribution of cations (Ca2+, Mg2+, Na+ + K+) and anions (Cl, SO42−, CO32− + HCO3), respectively. Upper right section: Magnesium-type (A), Calcium-type (B), Sodium-type (C), Sulphate-type (D), Bicarbonate-type (E), and Chlorate-type (F). Upper left section: Zone classification.
Water 17 02851 g005
Figure 6. Represents the Gibbs diagram of the groundwater chemical control mechanism. These two Gibbs diagrams analyse the chemical control mechanisms of groundwater in the study area, with different symbols representing groundwater samples from distinct aquifers: red squares denote shallow aquifers, yellow rhombuses denote medium-deep aquifers, blue circles denote deep aquifers, and black asterisks denote ultra-deep aquifers, arrows indicate the trend for each effect.. Diagram (a) illustrates cation-related mechanisms, with the x-axis representing Cl/(HCO3 + Cl) and the y-axis representing the TDS (mg·L1). (b) depicts an anion-related mechanism. The x-axis represents Na+/(Na+ + Ca2+) and the y-axis shows the TDS (mg·L−1). The diagrams encompass three primary chemical control processes: rock weathering, evaporation, and precipitation. By plotting groundwater samples onto these diagrams, the key processes governing groundwater chemistry within different aquifers can be visually identified.
Water 17 02851 g006
Figure 7. Ion ratio end-member diagram of the study area. The figure comprises two ion ratio endpoint diagrams, with different symbols denoting groundwater samples from distinct aquifers: red squares indicate shallow aquifers, yellow circles denote medium-to-deep aquifers, blue diamonds represent deep aquifers, and black asterisks signify ultra-deep aquifers; The regions labelled ‘Silicate Rock’, ‘Carbonate Rock’, and ‘Evaporite Salt Rock’ respectively denote the terminal zones for silicate, carbonate, and evaporite salt rock ion sources. (a) Presents the Ca2+/Na+ versus Mg2+/Na+ diagram, used to identify contributions from silicate, carbonate, and evaporite salt rocks to groundwater ions. (b) Employs the Ca2+/Na+ versus HCO3/Na+ diagram to further distinguish the effects of carbonate dissolution and other processes on groundwater chemistry.
Water 17 02851 g007
Figure 8. Correlation matrix diagram of the hydrochemical parameters of the groundwater. (This diagram presents a correlation matrix of the groundwater chemical parameters across different aquifer depths (shallow, medium-deep, deep, and ultra-deep) within the study area. Through colour gradients (blue → orange-red corresponding to negative → positive correlation coefficients) and numerical values within squares, it illustrates the linear correlation between the TDS and ion concentrations, such as K+ and Na+, the size of the circle represents the strength of the correlation coefficient between different water quality components. (a) Shallow aquifer: the TDS exhibits strong positive correlations with most major ions (K+, Na+, etc.), while NO3 and F show more pronounced negative correlations with other ions. (b) Medium-deep aquifer: Na+ demonstrates prominent positive correlations with the TDS and K+, with some ions (e.g., NO3) exhibiting significant negative correlations. (c) Deep layer: K+ exhibits correlation coefficients close to 1 with the TDS and Na+; correlations between Mg2+, SO42− and other ions reflect the stability of deep-water–rock interactions. (d) Ultra-deep layer: Most ions show extensive strong positive correlations).
Water 17 02851 g008
Figure 9. Ion ratio diagram of the study area. (a) γ(Cl) − γ(Na+) diagram; (b) γ(HCO3) − γ(Ca2+ + Mg2+ − SO42−)/γ(HCO3) diagram; (c) γ(HCO3 + SO42− + NO3 + Cl) − γ(Ca2+ + Mg2+) diagram; (d) γ[(Ca2+ + Mg2+ − (HCO3 + SO42−)] − γ(Na+ + K+ − Cl) diagram.
Water 17 02851 g009
Figure 10. Groundwater chlor–alkali index value in the study area.
Water 17 02851 g010
Figure 11. The distribution map of the groundwater nitrate-nitrogen concentration in the study area. (This violin plot illustrates the distribution of nitrate-nitrogen (NO3) concentrations in the groundwater across different aquifers (shallow, medium-deep, deep, and ultra-deep) within the study area. The vertical axis represents the nitrate-nitrogen concentration (unit: mg·L1), while the horizontal axis denotes the respective aquifer. The shape of each violin plot reflects the density distribution of the nitrate-nitrogen concentration data: wider areas indicate a higher frequency of data points at that concentration. The internal box plot structure displays the interquartile range (box), median (median line within the box), and the distribution of data between the minimum and maximum values (box whiskers)).
Water 17 02851 g011
Figure 12. Spatial distribution of nitrate. ( This map illustrates the spatial distribution of nitrate across different aquifers within the study area, encompassing Huiji District, Jinshui District, Guancheng Hui District, Erqi District, and the Central Plains region. Circles of varying colours and sizes denote the nitrate concentrations within each aquifer: blue circles indicate shallow-level nitrates, green circles denote medium-to-deep-level nitrates, orange circles represent deep-level nitrates, and red circles signify ultra-deep-level nitrates. Circle size is proportional to nitrate concentration. Red dashed lines denote administrative boundaries, with the black arrow in the upper left corner indicating north. The scale in the lower left corner represents a distance of 5 kilometres).
Water 17 02851 g012
Figure 13. Groundwater nitrate risk coefficient box plot.
Water 17 02851 g013
Table 1. Table of aquifer characteristics in the study area.
Aquifer TypeBurial Depth (m)Lithological CharacteristicsAquifer
Properties
Thickness (m)Set of Streams
Superficial layer45~55It is dominated by fine sand, containing a clay lens, and locally visible sand–gravel layer.Diving or Confined water25~45Flowing from southwest to northeast
Middle-deep80~350It is mainly composed of medium-coarse sand and gravel-bearing medium sand, with brown–red clay layers between layers.Confined water21~41From southwest and west to northeast and east
Deep layer350~800Dense sand gravel and brown yellow clay are interbedded, and the degree of cementation is high.Confined water34~140From southwest to northeast
Ultra-deep800~1200It is mainly composed of thick glutenite, containing calcareous cement and weak permeability.Confined water86~170From west to east or from east to south
Table 2. Calculate the parameters of nitrate harm to human health.
ParametersInfantChildYouthAdult
RfD (mg·kg−1·d−1)1.61.61.61.6
IR (L·d−1)0.51.01.52
BW (kg)10305070
ED (a)161230
EF (d·a−1)365365365365
Notes: RfD: Reference Dose; IR: Intake rate; BW: Body Weight; ED: Exposure Duration; EF: Exposure Frequency. Note: This table cites reference [7].
Table 3. Descriptive statistical results of main chemical components of the groundwater in 2015.
Aquifer TypeParametersPHEC/μs·cm−1Ion Concentration/(mg·L−1)
Na+K+Ca2+Mg2+HCO3ClSO42−NO3FTDSTH
Superficial LayerMinimum7.01452.0014.690.2210.690.008.80146.5010.140.000.31251.0049.29
Maximum8.091451.00164.7015.77176.0070.32158.90775.40141.80100.101.22974.40630.47
Mean7.52804.0857.381.9593.1329.8666.49417.1658.7520.020.58536.76357.58
SD0.28231.2737.003.3136.6714.0440.79125.3340.1926.490.23176.16121.53
CV3.72%28.76%64.48%169.68%39.37%47.02%61.35%30.04%68.40%132.30%38.78%32.82%33.99%
Middle-DeepMinimum7.00433.0014.280.1923.039.976.99238.109.940.000.15261.40113.00
Maximum8.15813.00148.303.38108.6037.90110.60476.2087.6591.411.05547.10429.20
Mean7.51624.8349.711.0968.6822.8328.45366.9136.8115.040.46406.54267.55
SD0.3496.9826.960.7115.915.3917.0247.3122.7715.530.1964.4651.99
CV4.53%15.52%54.24%65.59%23.16%23.62%59.84%12.90%61.86%103.29%40.39%15.86%19.43%
Deep-LayerMinimum7.00563.0045.770.814.932.9915.80317.5017.840.120.16374.6026.70
Maximum8.10796.00181.903.1170.7338.9087.77432.44114.5538.050.37528.80289.60
Mean7.32691.84104.402.1341.3818.8541.96364.3755.649.150.25457.84182.99
SD0.3168.2639.590.6317.959.7515.8226.6923.8710.410.0745.4480.79
CV4.23%9.87%37.92%29.44%43.38%51.75%37.70%7.33%42.90%113.74%26.48%9.92%44.15%
Ultra-DeepMinimum7.11590.0055.791.047.401.0015.80354.1033.800.000.28425.9530.80
Maximum7.761355.00324.204.4574.8420.95159.75622.80299.705.141.39909.75275.19
Mean7.37954.08214.572.6121.457.2955.32465.4096.751.740.72634.0685.62
SD0.20230.9376.650.9721.556.4535.8877.7666.431.930.31153.1380.00
CV2.71%24.20%35.72%37.24%100.49%88.50%64.86%16.71%68.66%110.54%43.70%24.15%93.44%
Table 4. Descriptive statistical results of main chemical components of the groundwater in 2019.
Aquifer TypeParametersPHEC/μs·cm−1Ion Concentration/(mg·L−1)
Na+K+Ca2+Mg2+HCO3ClSO42−NO3FTDSTH
Superficial LayerMinimum7.512716.140.1441.769.12138.5410.878.890.100.24186.08143.91
Maximum7.821832192.105.31152.0279.02768.27144.06509.8041.282.821239.19629.87
Mean7.67781.8048.821.1189.6132.92393.1354.4577.9010.670.75513.01361.42
SD0.08317.9038.461.0829.3015.99117.8942.1988.8512.320.48213.09117.88
CV1.09%40.66%78.77%97.48%32.69%48.57%29.99%77.48%114.05%115.46%64.13%41.54%32.62%
Middle-DeepMinimum7.62291.008.020.2111.698.10170.038.705.150.000.22204.4164.66
Maximum7.80985.00187.602.53135.3145.59528.9793.50103.2084.050.97653.25441.00
Mean7.64631.3843.570.8774.1523.21370.1227.2440.434.350.52410.11281.47
SD0.10155.4133.550.5622.057.1569.8521.1025.5018.280.1995.2668.09
CV1.27%24.61%77.00%64.00%29.74%30.79%18.87%77.46%63.07%121.49%36.12%23.23%24.19%
Deep- LayerMinimum7.532844.810.2820.059.12144.8413.0512.920.570.25189.3189.68
Maximum7.791016125.402.8196.8950.15478.5995.68119.4046.491.26681.85447.00
Mean7.69642.9158,71.4556.8021.78341.7734.2341.6811.270.56397.47233.28
SD0.07183.6140.460.7723.3710.5578.6627.1427.9413.090.26115.0296.24
CV0.91%28.56%68.93%52.99%41.14%48.45%23.01%79.30%67.03%116.15%46.55%28.94%41.26%
Ultra-DeepMinimum7.55563.0039.990.485.855.07528.9711.3013.430.000.49370.0643.80
Maximum7.751393.00328.604.0871.8320.26403.02197.88186.6010.760.97950.39264.88
Mean7.67977.80207.562.3823.2210.03450.8872.6699.923.930.78644.49101.36
SD0.08327.30102.681.2224.615.5844.6467.7964.744.150.18214.5482.56
CV1.05%33.47%49.47%51.40%105.96%55.64%9.90%93.30%64.80%105.53%23.57%33.29%81.45%
Note: SD: Standard deviation; CV: Coefficient variation; EC: Electrical conductivity.
Table 5. Piper three-line diagram partition water chemical characteristics description.
Partition CodeChemical Characteristics
1Alkaline earth metal ions are greater than alkali metal ions.
2Alkali metal ions are greater than alkaline earth metal ions.
3Weak acid root is greater than strong acid root.
4Strong acid root is greater than weak acid root.
5Carbonate hardness > 50%.
6Non-carbonate hardness > 50%.
7Non-carbonate base > 50%.
8Carbonate base > 50%.
9No pair of anions and cations > 50%.
Disclaimer/Publisher’s Note: The statements, opinions and data contained in all publications are solely those of the individual author(s) and contributor(s) and not of MDPI and/or the editor(s). MDPI and/or the editor(s) disclaim responsibility for any injury to people or property resulting from any ideas, methods, instructions or products referred to in the content.