Article

Simulation of Water Renewal Time in West Lake Based on Delft3D and Its Environmental Impact Analysis

1
Key Laboratory of Space Active Opto-Electronics Technology, Shanghai Institute of Technical Physics of the Chinese Academy of Sciences, Shanghai 200083, China
2
School of Electronic, Electrical and Communication Engineering, University of Chinese Academy of Sciences, Beijing 100049, China
3
State Key Laboratory of Satellite Ocean Environment Dynamics, Second Institute of Oceanography, Ministry of Natural Resources, Hangzhou 310012, China
4
Ocean College, Zhejiang University, Zhoushan 316000, China
5
Hangzhou West Lake Administration, Hangzhou 310006, China
*
Authors to whom correspondence should be addressed.
Water 2025, 17(19), 2847; https://doi.org/10.3390/w17192847
Submission received: 29 August 2025 / Revised: 24 September 2025 / Accepted: 26 September 2025 / Published: 29 September 2025

Abstract

Artificial water replenishment has improved the ecological environment of West Lake by introducing external clean water, but pollution issues still persist in some local regions. However, whether enhancing water exchange through internal water diversion within the lake can improve local water quality remains unverified. This study employed the Delft3D hydrodynamic model to simulate the spatiotemporal distribution of local water renewal time in West Lake, revealing that regions with prolonged water renewal times exhibited diminished resilience to water quality disturbances. This study utilized the Random Forest algorithm to determine the responsiveness of West Lake’s water transparency to parameters such as local water renewal time, and further discussed the impact of reducing local water renewal time on transparency under different water quality conditions. The results indicate that the sensitivity of West Lake’s transparency to water quality parameters closely resembles that of lakes with rainwater storage. The primary mechanism by which external water diversion improves transparency is through pollutant dilution, whereas enhanced local water exchange capacity contributes minimally to this effect. This conclusion demonstrates that localized internal water diversion within the lake is only suitable for preventing ecological issues such as regional eutrophication and algal blooms, but cannot effectively improve the overall lake ecosystem. Furthermore, this study identifies key factors affecting water transparency in artificially managed waters, highlighting priority monitoring indicators for similar water bodies. It also provides evidence to support research on aquatic optics and the development of remote sensing algorithms for such waters.

1. Introduction

Lakes serve as indispensable components of human economic and social systems. However, many lakes are experiencing eutrophication, declining water levels, and reduced biodiversity due to the combined impacts of human activities and climate change [1,2,3]. Artificial water replenishment (WR), which introduces high-quality external water into receiving lakes, is a commonly used engineering solution for a lake’s ecological restoration [4,5,6,7]. In the 1980s, Hangzhou’s West Lake—an internationally renowned urban landscape lake in eastern China—experienced severe eutrophication and ecological degradation due to impacts from agricultural wastewater and domestic sewage within its basin [8]. To improve the ecological environment of West Lake, the Hangzhou Municipal People’s Government implemented the West Lake WR Project starting in 1986, while simultaneously controlling the pollution sources entering the lake. This project introduced clean, pre-sedimented water into West Lake. After 2003, the scale of the West Lake WR Project was further expanded [9]. As a result, the average hydraulic retention time (HRT) in West Lake was reduced from 12 months to just 1 month, with a concomitant decrease in overall pollutant concentrations and an improvement in eutrophication [8,9,10]. The improvement in water quality is primarily attributed to the enhanced water exchange capacity (i.e., reduced HRT), in addition to the dilution effect of external clean water on the original nitrogen, phosphorus, and suspended substances (SSs). However, the specific contributions of these two physical processes to water quality improvement remain unclear [11,12,13]. The water quality improvement effects of WR in West Lake are spatially heterogeneous. Compared to the eastern lake zones farther from the water inlets, the western regions with shorter water age demonstrate better ecological conditions. Certain enclosed regions, such as Beilihu, contain perennial low-flow zones with limited water exchange capacity [14]. Therefore, the management authority proposes to implement localized internal water diversion to enhance hydrodynamic connectivity and flow velocity between Beilihu and its adjacent regions, thereby improving the ecological conditions in this basin.
Since internal lake circulation cannot alter the average HRT, controversy persists regarding whether merely increasing flow velocity and hydrodynamic connectivity can effectively enhance lake water quality. Research findings from some scholars indicate that internal water circulation does not facilitate an overall reduction in pollutant concentrations, and may even lead to localized accumulation of contaminants within the lake [15,16,17]. Some scholars argue that excessive flow velocities or wave heights may induce particle resuspension, thereby increasing SSs [18,19]. On the other hand, a study on Suzhou River demonstrated that maintaining appropriate flow velocities can effectively enhance water transparency [20]. Studies by other proponents indicate that maintaining appropriate flow velocities and water exchange capacity can effectively suppress algal overgrowth and reduce the probability of algal bloom occurrence [21,22,23,24,25,26,27]. Furthermore, additional research findings show that enhanced hydrodynamic conditions contribute to increased dissolved oxygen levels and improved self-purification capacity in water bodies [28,29]. In summary, increasing local water flow velocity has varying effects on different water quality parameters and whether an internal lake circulation project can improve key water quality indicators in the study area serves as the most critical metric for evaluating its effectiveness. Transparency is recognized as the most critical indicator for assessing West Lake’s environmental quality due to its significant impact on both the landscape effect of urban landscape lakes and biodiversity conservation [30,31,32,33,34,35]. Therefore, evaluating the influence of various hydrodynamic and water quality conditions on West Lake’s transparency is an essential prerequisite for determining the site selection and scale of internal circulation engineering projects.
Focusing on West Lake, this study utilized high-resolution spatial simulations of local water renewal time (LWRT) from a two-dimensional hydrodynamic model Delft3D. By integrating multi-parameter water quality monitoring data with transparency (Secchi disk depth) as the core evaluation metric, we employed Random Forest (RF) algorithms to assess the ecological impact of LWRT [20,36,37]. The research analyzes spatial distributions of flow velocity and LWRT, characterizes monthly hydrodynamic variations in typical lake zones, and identifies permanganate index (CODMn), chlorophyll-a (Chla), and SSs as key transparency determinants. The study innovates by simplifying tracer-based HRT algorithms to develop a new LWRT metric, which precisely evaluates intra-lake water exchange capacity and is verified as a significant transparency-influencing factor. These findings provide scientific support for transparency management in landscape lakes, related research initiatives, and optimized planning of local water diversion projects.

2. Materials and Methods

2.1. Study Area

Hangzhou West Lake, a globally celebrated urban landscape lake, covers a water area of 6.5 km2 with an average depth of 2.27 m. Characterized by a subtropical monsoon climate, it receives greater precipitation in spring and summer than in autumn and winter. Prior to the implementation of the WR project, West Lake had only 4 outlet channels: Yuehu, Beilihu, Shengtangzha and Yongjinzha. Runoff and precipitation served as its primary water sources, while agricultural and domestic wastewater within the runoff led to severe eutrophication in the lake [8,9]. After the implementation of WR projects, the lake system now comprises 6 inlet channels connected to sedimentation basins and 5 additional outlet channels. As shown in Figure 1a, most inlets are distributed along the western shore, specifically at Dujingsheng, Zuibailou, Wuguitan, Huangmielou, Nanhu, and Changqiaoxi. Conversely, the majority of additional outlets are located on the eastern side of West Lake, including Wugongyuan, Yigongyuan, Dahua, Yongjinzha, Jinniuchi, and Liulang. Due to this design, a significant water quality disparity exists between the eastern and western regions of West Lake. As illustrated in Figure 1c, the western region demonstrates a higher five-year average transparency compared to the eastern region.
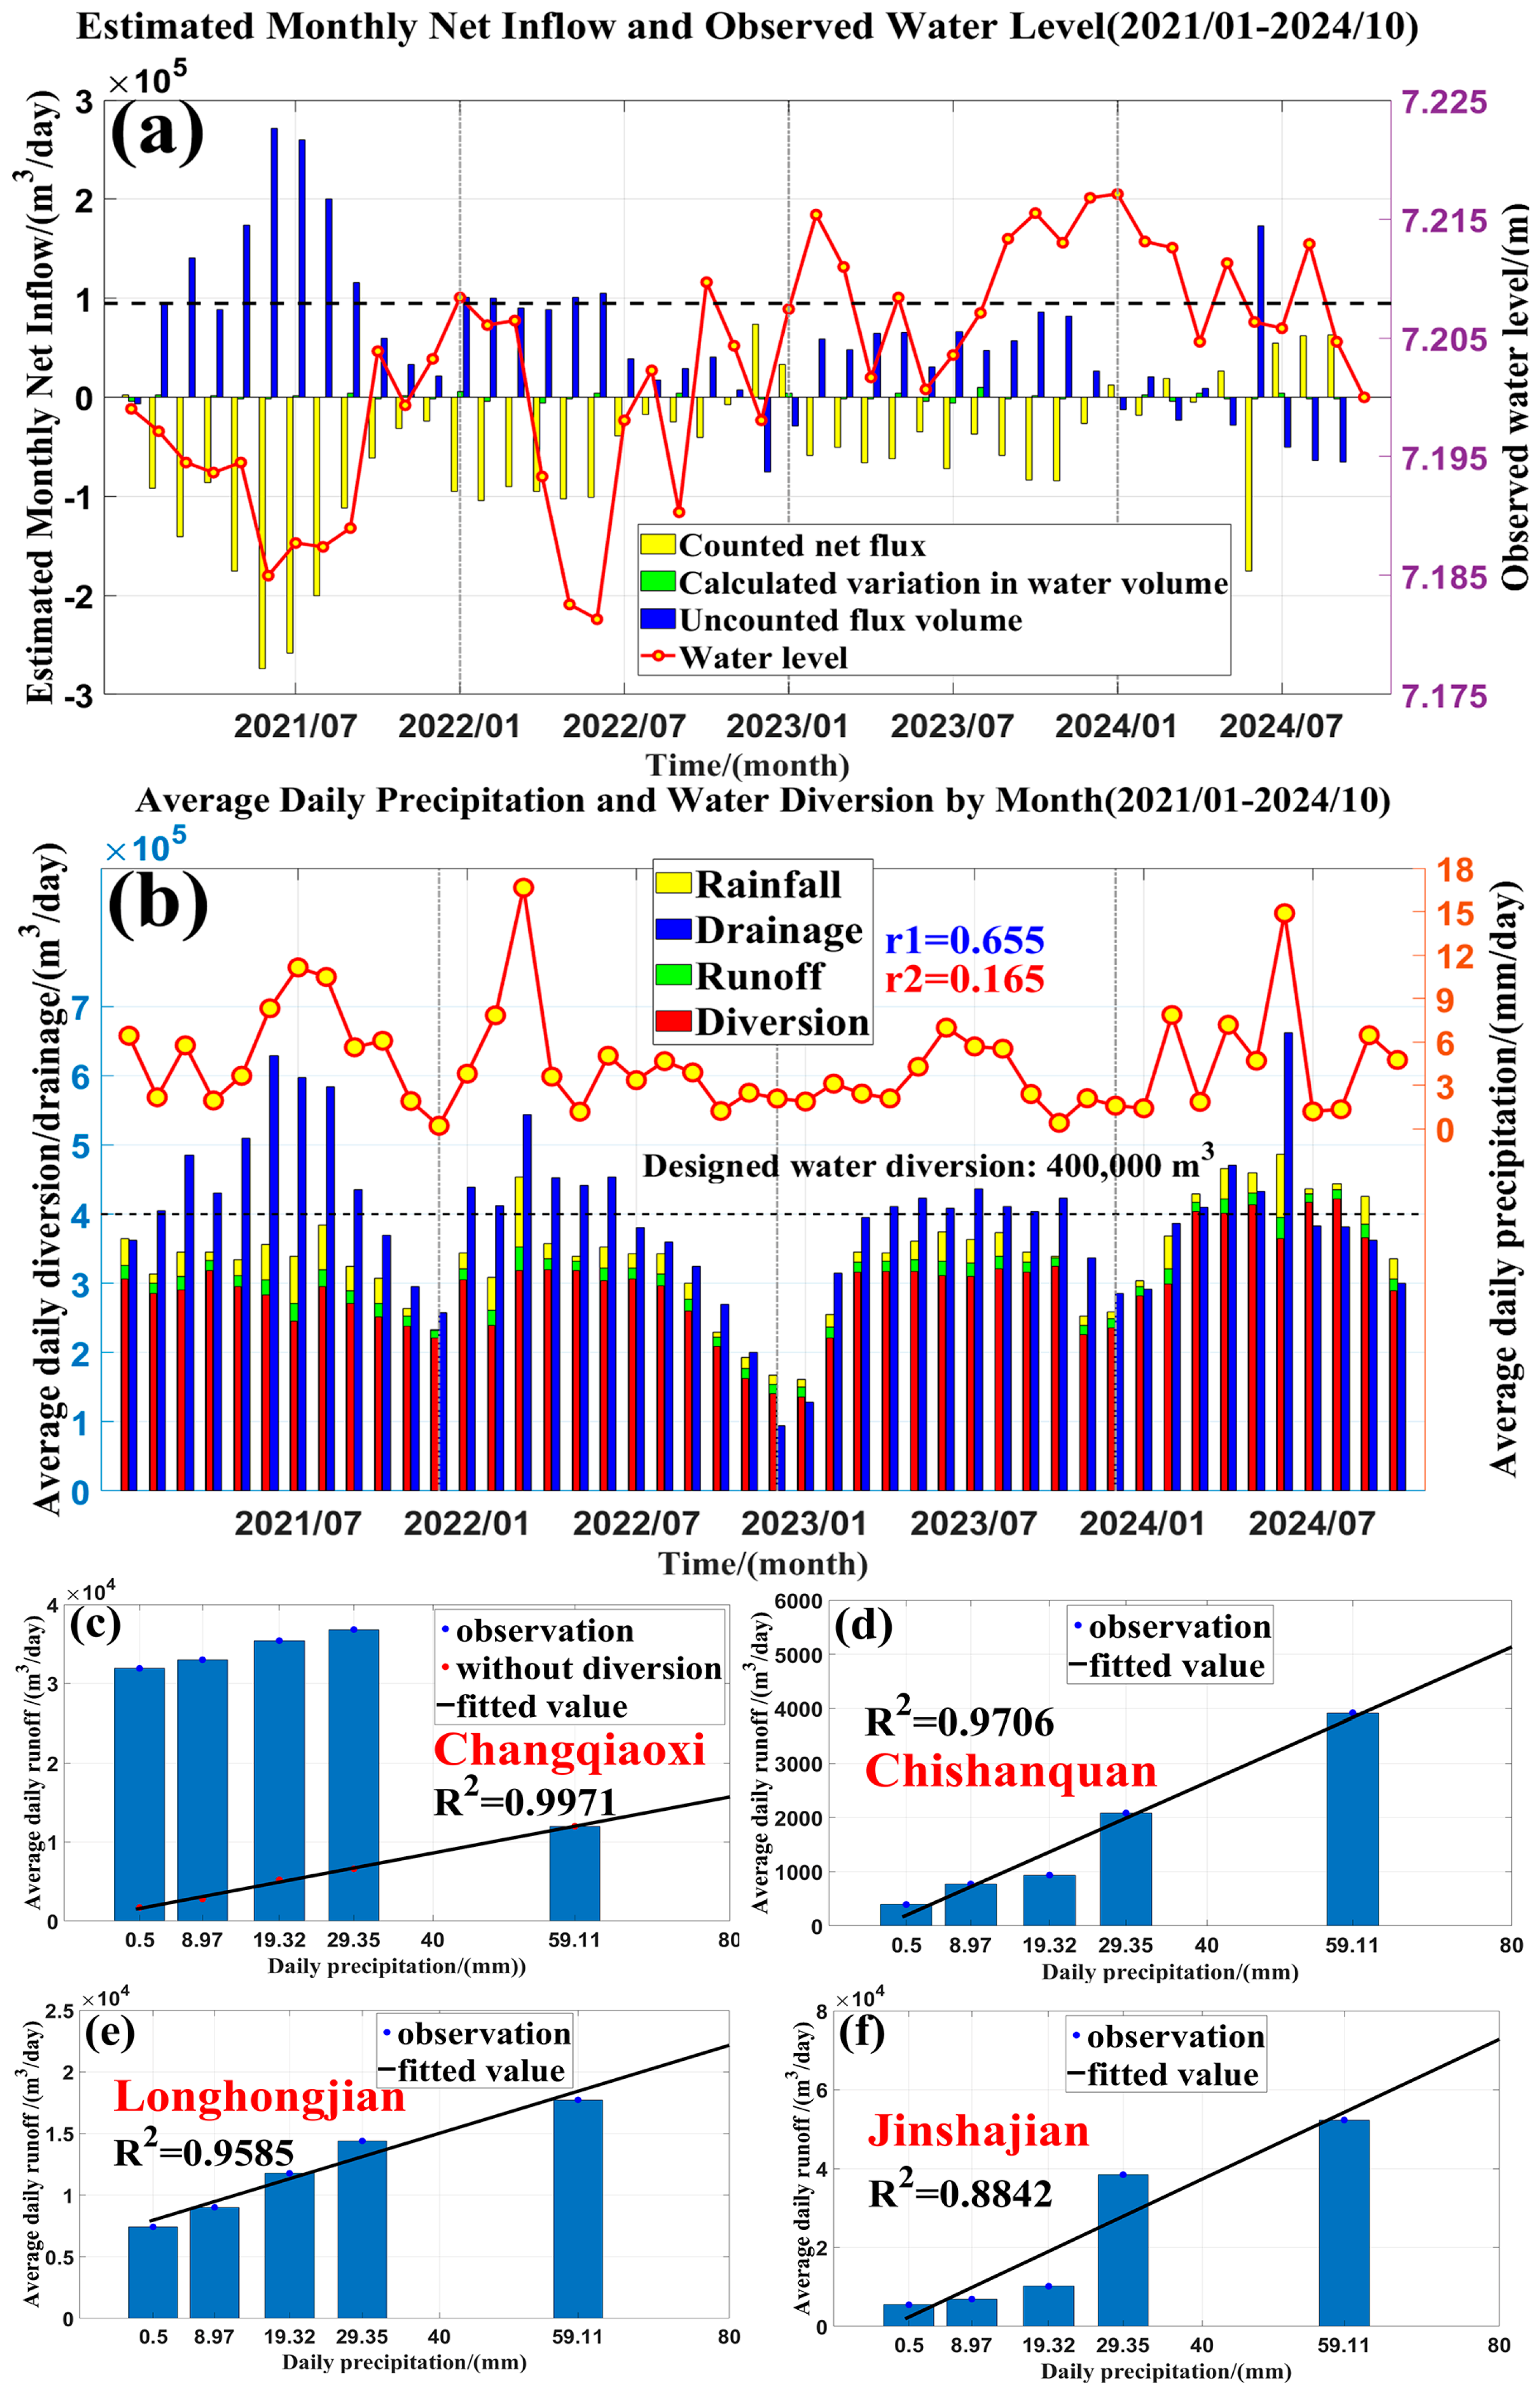
Following the implementation of the water diversion project, West Lake’s water level has been stably maintained at around 7.2 m through artificial regulation, with daily fluctuations of approximately 2 cm (Figure 2a). According to the original design, pretreated Qiantang River water was supposed to be diverted into the lake through 6 inlets at a rate of 400,000 tons per day after passing through sedimentation basins. However, operational data collected from January 2021 to October 2024 revealed that only 5 months out of the 46-month monitoring period achieved the designed daily water diversion target (Figure 2b). The lowest diversion volume occurred in January 2023, when the average daily water supply dropped to just 136,000 tons, representing only 34% of the designed capacity. The mean actual daily water diversion is 292,000 t/d, with a 95% confidence interval (CI) of (106,426;434,027) t/d. This does not indicate that the current water diversion volume fails to meet the design standard in a statistical sense. Similarly, outlet channel data revealed that discharge volumes exceeded 400,000 tons/day during 25 of the 46 monitored months (54.3%). The lake’s daily discharge volume showed strong correlation with precipitation (Pearson correlation coefficient = 0.655), reflecting operational adjustments for water level control. In contrast, the diversion volume exhibited much weaker dependence on rainfall (Pearson correlation coefficient = 0.165), with water supply capacity being primarily constrained by source water availability and sedimentation basin efficiency.
Runoff input serves as another water source for West Lake, exerting important influences on its flow-field structure while simultaneously functioning as a primary contributor of nitrogen and phosphorus pollutants [38]. The lake receives inflow through 4 major rivers, whose entry inlets are predominantly concentrated along the western shoreline. These consist of Jinshajian, Chishanquan (also known as Chishanxi), Longhongjian, and Changqiaoxi. The last river inlet simultaneously operates as a water diversion inlet with a daily transfer capacity of approximately 30,000 tons.
Field measurements demonstrate a linear correlation between runoff volume and precipitation in the West Lake catchment area, with runoff responding rapidly to rainfall increases. Peak discharge typically occurs within 1 h after maximum precipitation intensity [39,40]. Based on these findings, this study established regression relationships between daily average runoff and daily precipitation for the 4 rivers. For Changqiaoxi river, the first 4 measured data (with daily precipitation below 30 mm/day) included artificial diversion components and were excluded before fitting. The 4 determination coefficients (R2) were 0.9971, 0.9706, 0.9585, and 0.8842, respectively, all falling within acceptable ranges. According to these estimates, the average ratio of the 4 major rivers’ input volume to artificial diversion volume was 6.2%, with a maximum value of 10.6% and minimum of 3.1%. Under non-extreme precipitation conditions, artificial water diversion remains the primary water source for West Lake.

2.2. Water Quality Parameters

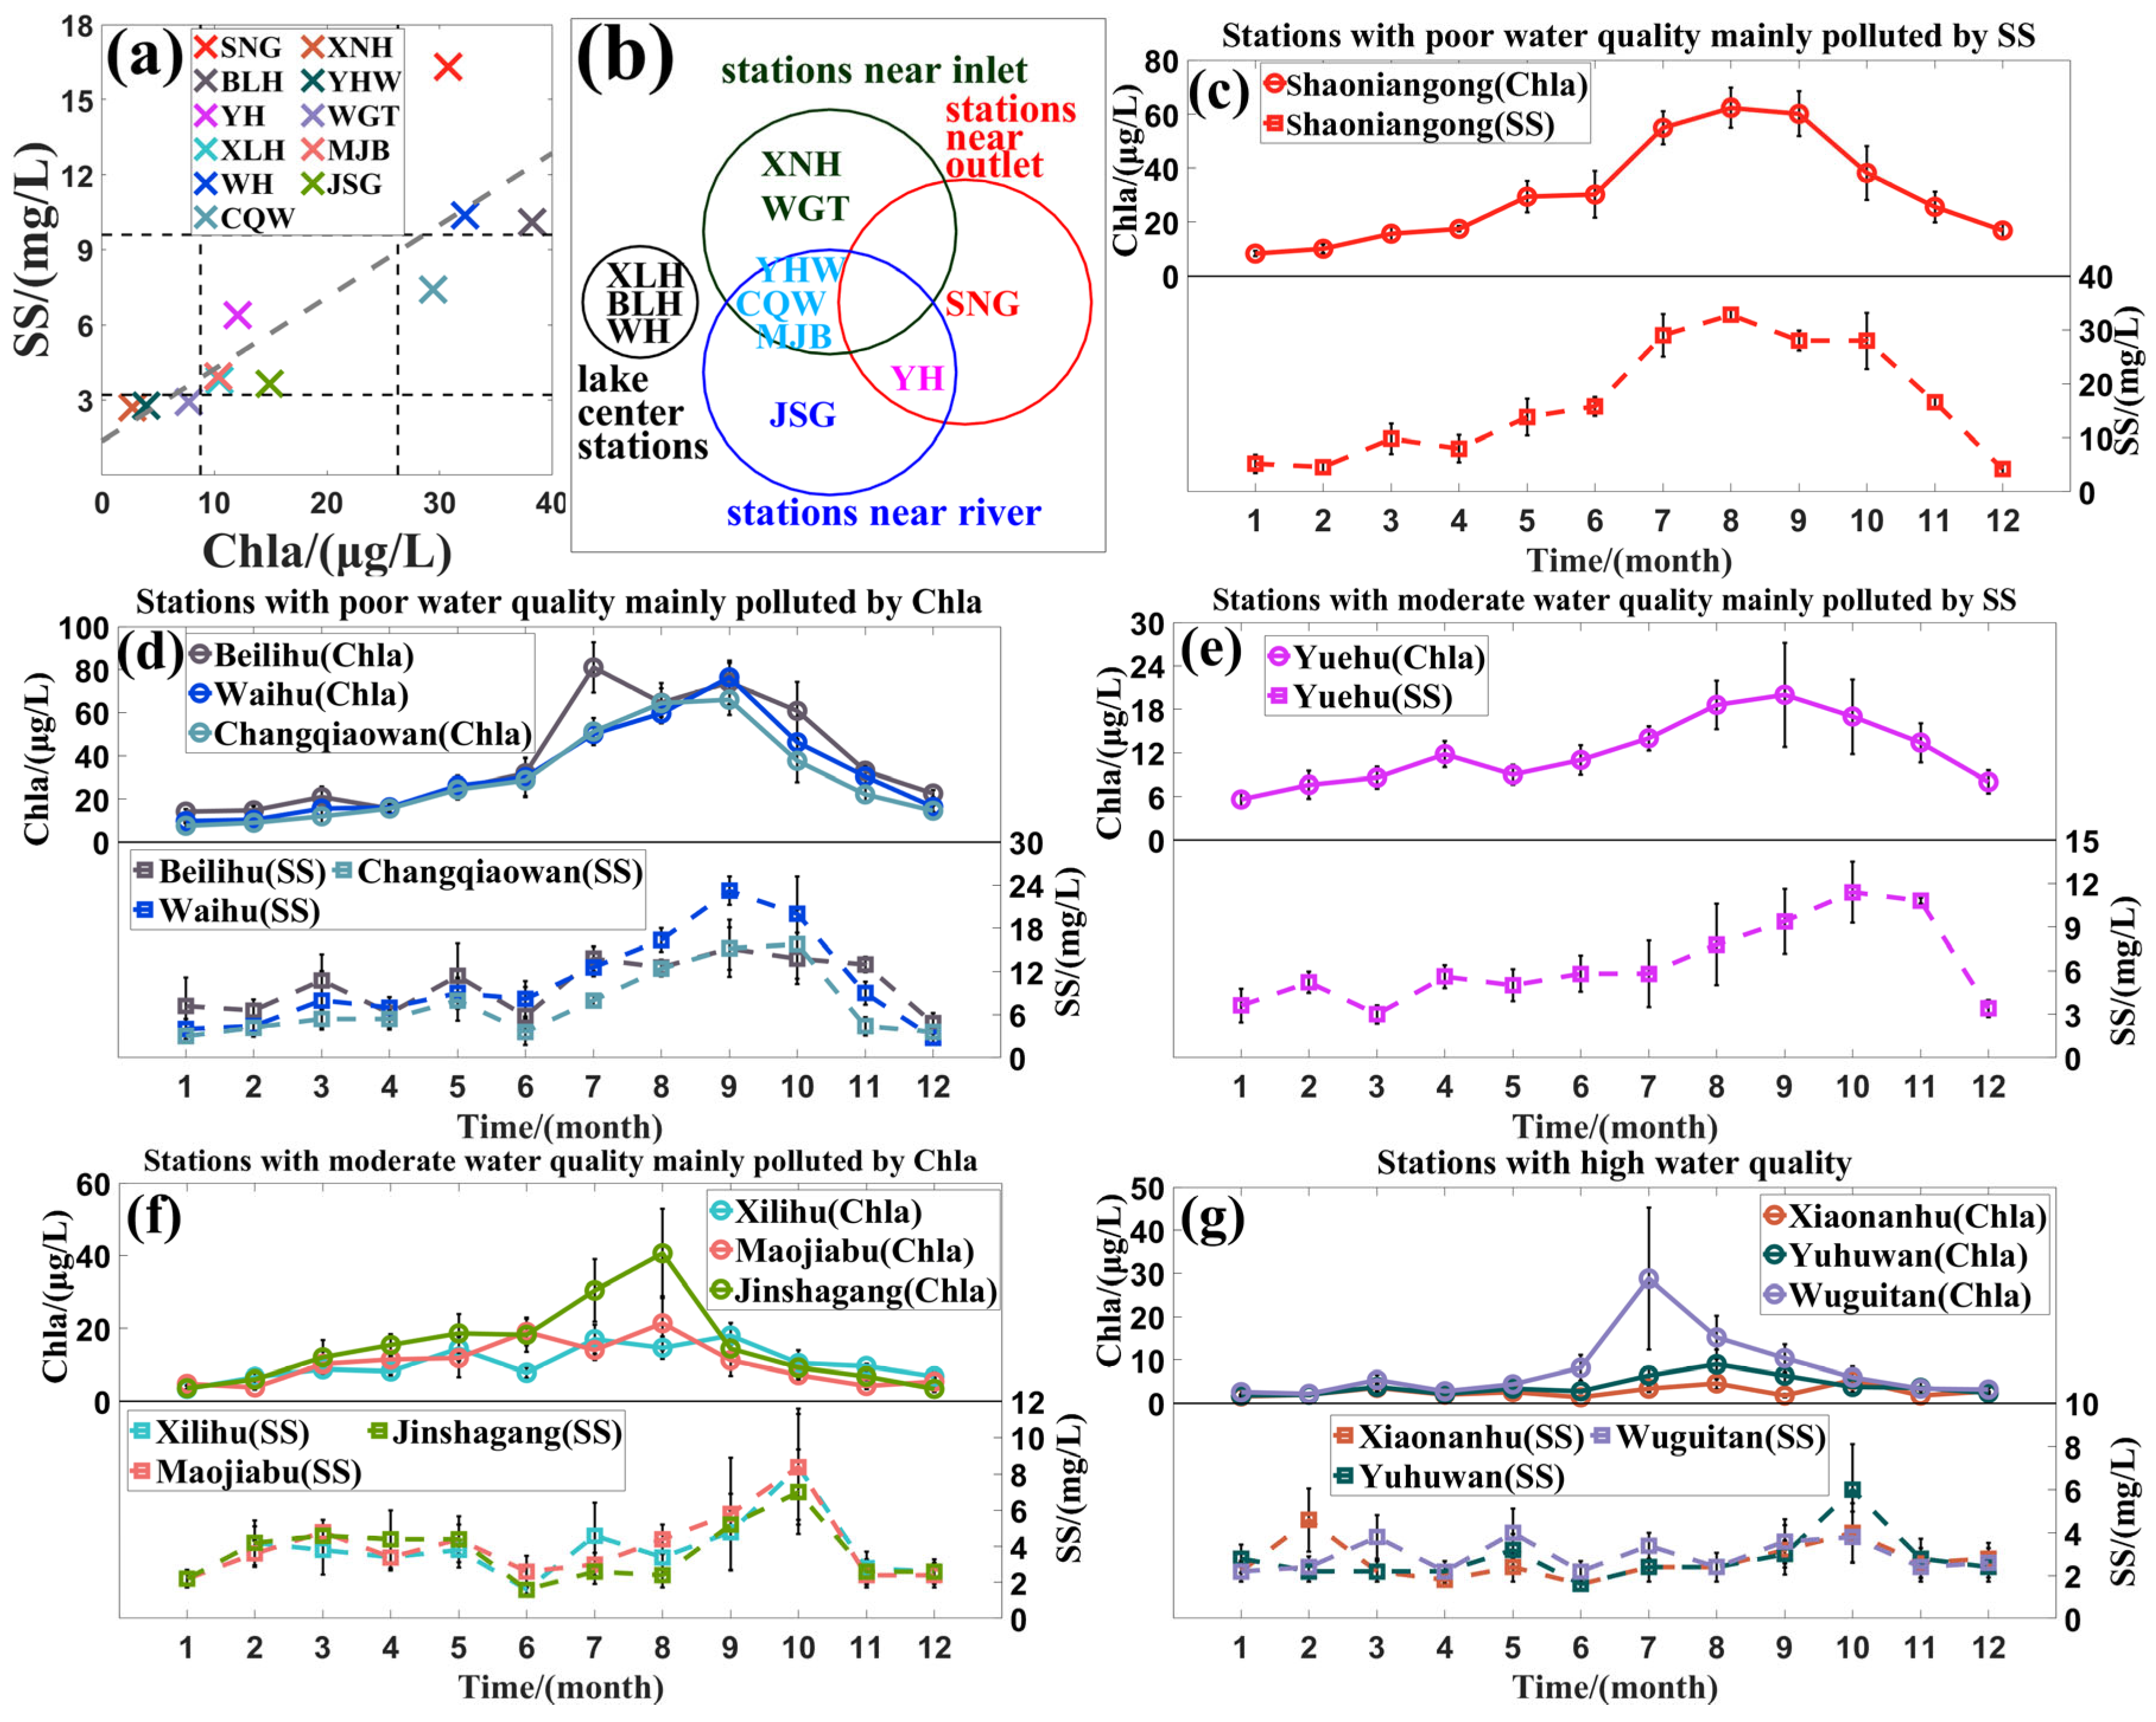
To prevent algal blooms and water quality deterioration, the management authority has established water quality monitoring stations at 11 key locations across the whole West Lake, including the offshore areas of Xilihu (XLH), Beilihu (BLH) and Waihu (WH), the water inlet-adjacent zones of Xiaonanhu (XNH) and Wuguitan (WGT), the river inlet-proximate station Jinshagang (JSG), areas simultaneously adjacent to both artificial water inlets and natural river inlets of Yuhuwan (YHW), Changqiaowan (CQW) and Maojiabu (MJB), the outlet and nearby river inlet station Yuehu (YH), and the outlet-proximate Shaoniangong (SNG) station, with their specific spatial distribution shown in Figure 1c. The water quality monitoring parameters included: transparency, water temperature (T), dissolved oxygen concentration (DO), pH, CODMn, SS, alkalinity, total hardness (TH), total phosphorus (TP), soluble reactive phosphate concentration (SRP), total nitrogen (TN), ammonia nitrogen (AN), nitrite concentration (NO2), nitrate concentration (NO3), sulfate concentration (SO42−), chloride concentration (Cl), fluoride concentration (F), and Chla. For data analysis, this study employed the measured monthly average data for all aforementioned water quality parameters across all monitoring stations in 2022, which were provided by the Hangzhou West Lake Administration (available on https://westlake.hangzhou.gov.cn/ (accessed on 23 August 2024.)). Due to varying spatial locations and hydrodynamic conditions, significant differences in water quality parameters were observed across these monitoring stations. Based on the average Chla concentration and SS concentration at each monitoring station, this study classified the 11 stations into 5 distinct categories (Figure 3a) [25]. The 5 categories consisted of stations with poor water quality primarily polluted by SSs (Shaoniangong), stations with poor water quality primarily polluted by Chla (Beilihu, Waihu, and Changqiaowan), stations with moderate water quality primarily polluted by SSs (Yuehu), stations with moderate water quality primarily polluted by Chla (Xilihu, Maojiabu, and Jinshagang), and stations with high water quality (Xiaonnahu, Yuhuwan, and Wuguitan) (Figure 3c–g). Subsequent analysis will investigate the influence of LWRT on transparency across these distinct water quality environments.

2.3. Hydrodynamic Model

The flow velocity in West Lake exists at a tiny magnitude (<10 mm/s), making measurements prone to disturbances from nearby tourist boats and presenting challenges for instrument observations. It was not until 2013 that researchers, notably You et al., first obtained velocity data suitable for validating stratified flow fields in West Lake by employing an acoustic Doppler current profiler (ADCP, an acoustic Doppler-based instrument used for measuring three-dimensional flow velocity across multiple depth layers in water [41,42].) suspended beneath buoys [43]. However, this method is time-consuming, economically costly, and cannot be applied to large-scale, long-term sequential studies of West Lake. In current research, most of the flow field data for West Lake are derived from hydrodynamic numerical model results [17,44].
Delft3D is an integrated hydrodynamic water-quality modeling system developed by Delft University of Technology in the Netherlands. Capable of simulating both 2D and 3D processes, it comprehensively addresses water flow dynamics, wave propagation, water quality parameters, ecological interactions, sediment transport mechanisms and their complex interrelationships. The hydrodynamic module is fundamentally based on the mass conservation equation and three-dimensional momentum conservation equations (Navier-Stokes). With decades of successful global applications, the system has been extensively validated in various water bodies, including West Lake [45].
The computational grid and bathymetric distribution used in this study are shown in Figure 1. The model grid covers a water area of 6.1 km2, representing 93.9% of West Lake’s total watershed area. As this research does not focus on 3D flow structures, a single-layer vertical configuration was adopted. The bathymetric data were obtained from in situ data collected in May 2024; sampling locations and measured depths are illustrated in Figure 1b. The bottom friction was parameterized using the Manning scheme with a friction coefficient of 0.003.

2.4. Machine Learning Algorithms and Training Set Configuration Options

Water transparency serves as an integrated indicator reflecting the combined effects of regional hydrodynamics and aquatic environments on water quality, though the underlying mechanisms remain incompletely understood. In recent years, machine learning algorithms have become a prevalent approach for investigating the relative influence of various water quality parameters on transparency [20,36,37,46]. The RF algorithm is a bagging algorithm that uses decision trees as estimators. By combining multiple decision trees, it randomly selects subsets of the dataset and features as inputs for each tree, then averages their regression results as the final output. This approach effectively reduces the impact of noise in the training data on regression outcomes. Existing research has demonstrated that among various machine learning algorithms, the RF algorithm’s feature importance offers significant advantages over other methods in identifying key factors influencing water quality. This approach proves particularly effective when handling complex water systems with numerous water quality parameters, providing valuable guidance for water resource management [36,47,48].
Therefore, this study employs the RF algorithm to evaluate the influence of LWRT and other factors on the transparency of West Lake. To achieve this research objective, 4 distinct training datasets were designed, with specific configurations illustrated in Figure 4. Set 1 includes 17 water quality parameters and a set of random numbers as a control group, while Sets 2–4 incorporate flow velocity, grid cell-based water renewal time (CWRT), and LWRT, respectively. In the experiments, due to the limited dataset (n = 132), key parameters were set as follows: minimum leaf size = 5 (preventing overfitting, validated by 6-fold cross-validation), number of decision trees = 1000 (balancing stability and efficiency). All experiments were repeated 10 times for convergence verification. Replication results demonstrated a standard error of 0.2 cm in transparency predictions, indicating high convergence and stability.

2.5. Water Renewal Time

HRT reflects the duration of pollutant persistence within either the entire lake or specific sub-basins, serving as a comprehensive indicator that integrates both hydrodynamic and water quality conditions. Numerous studies have identified HRT as one of the most critical factors influencing water transparency [37,49]. Consequently, it is frequently employed to assess both the water-quality-improvement effects of ecological water replenishment in localized lake zones and the self-purification capacity of natural lakes [50,51,52,53]. However, this metric cannot independently reflect the water exchange capacity of localized lake zones while disregarding inlets/outlets and pollutant distribution patterns. To eliminate tracer-related biases, this study adapts the HRT concept by treating individual grid cells from the hydrodynamic model as discrete units. The grid cell-based water renewal time is calculated using the water volume within each cell and the water flux across its boundaries, thereby evaluating the local water exchange capacity for each specific grid area [50,54,55].
C W R T = V c e l l Q = ρ D h d s ρ L h v d n = h ¯ c e l l S c e l l e d g e = 1 m Q e d g e
In Equation (1), Scell represents the area of the grid cell, hcell denotes the average water depth within the grid cell, m is the number of grid edges (typically 3 or 4), and Qedge signifies the water flux across each boundary (considering only inflow or outflow).
To ensure comparability of water exchange capacity across grid cells unaffected by variations in sampling area or boundary length—particularly in shoreline areas with localized mesh refinement—the CWRT was adjusted through area-based normalization.
L W R T = k c ρ D h d s ρ L h v d n
k c = L c e l l h ¯ l a k e S c e l l
In Equation (3), Lcell represents the sum of the grid cell’s edge lengths, and hlake denotes the average water depth of West Lake.

3. Model Validation

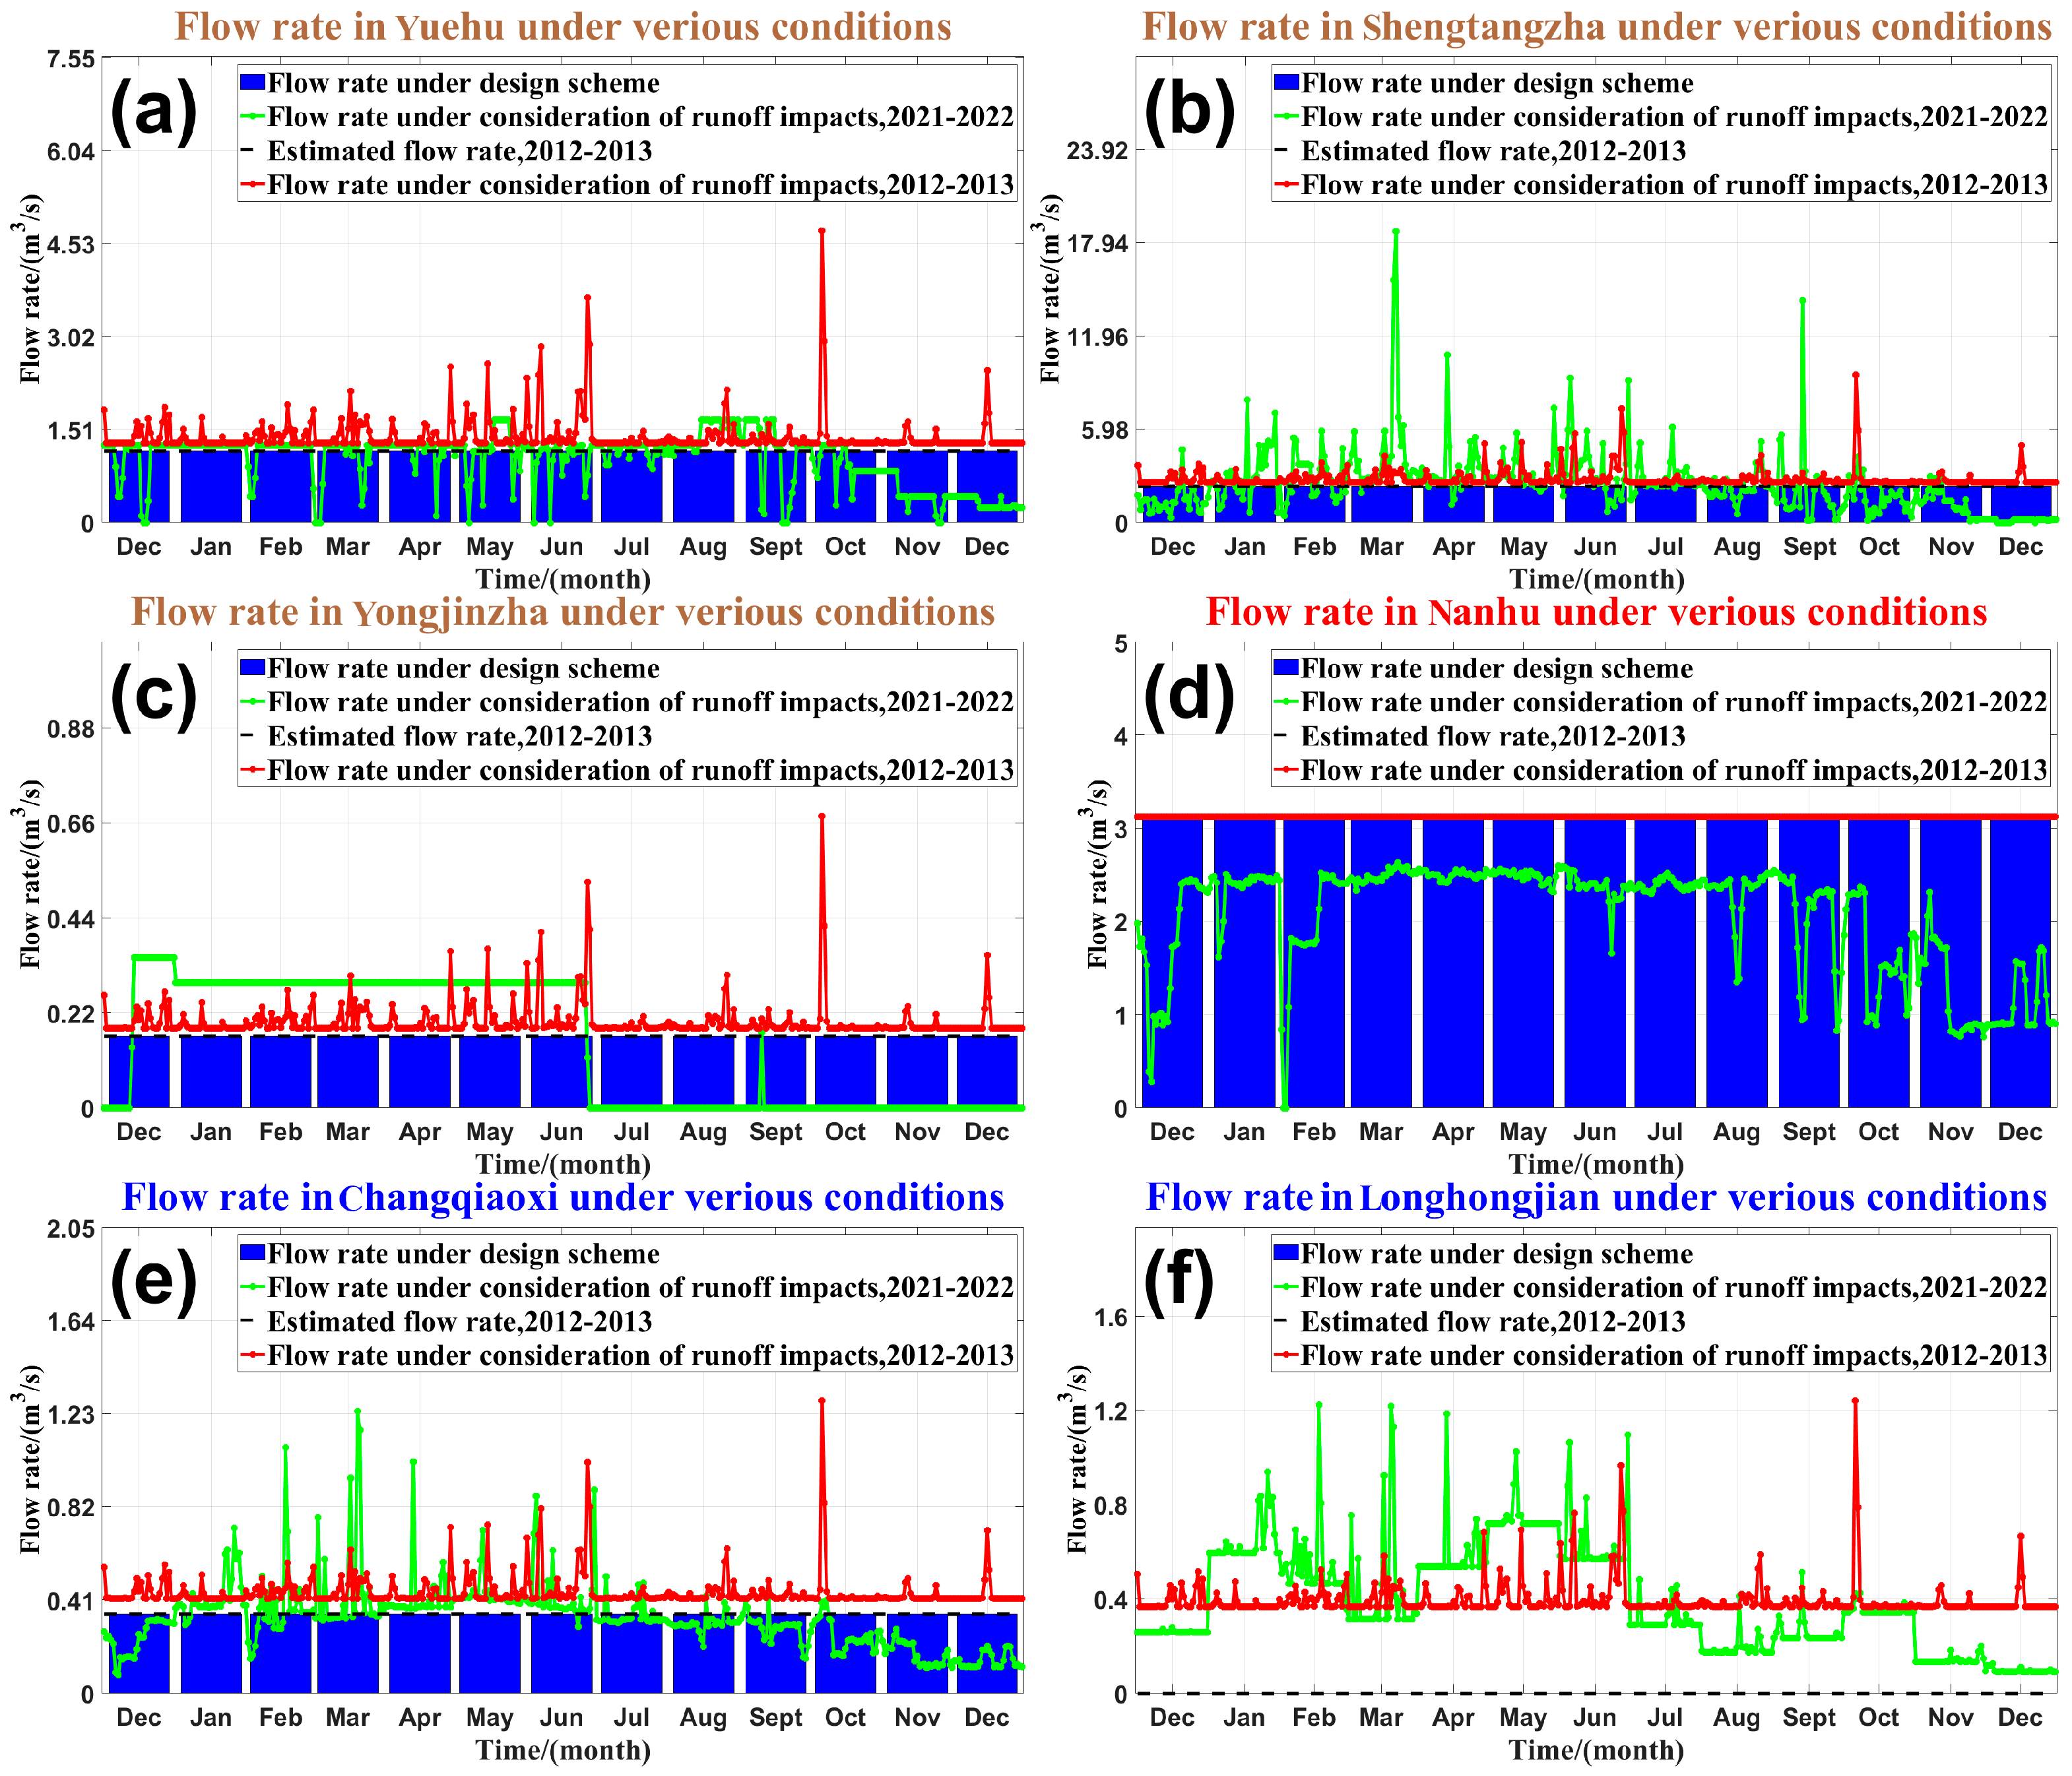
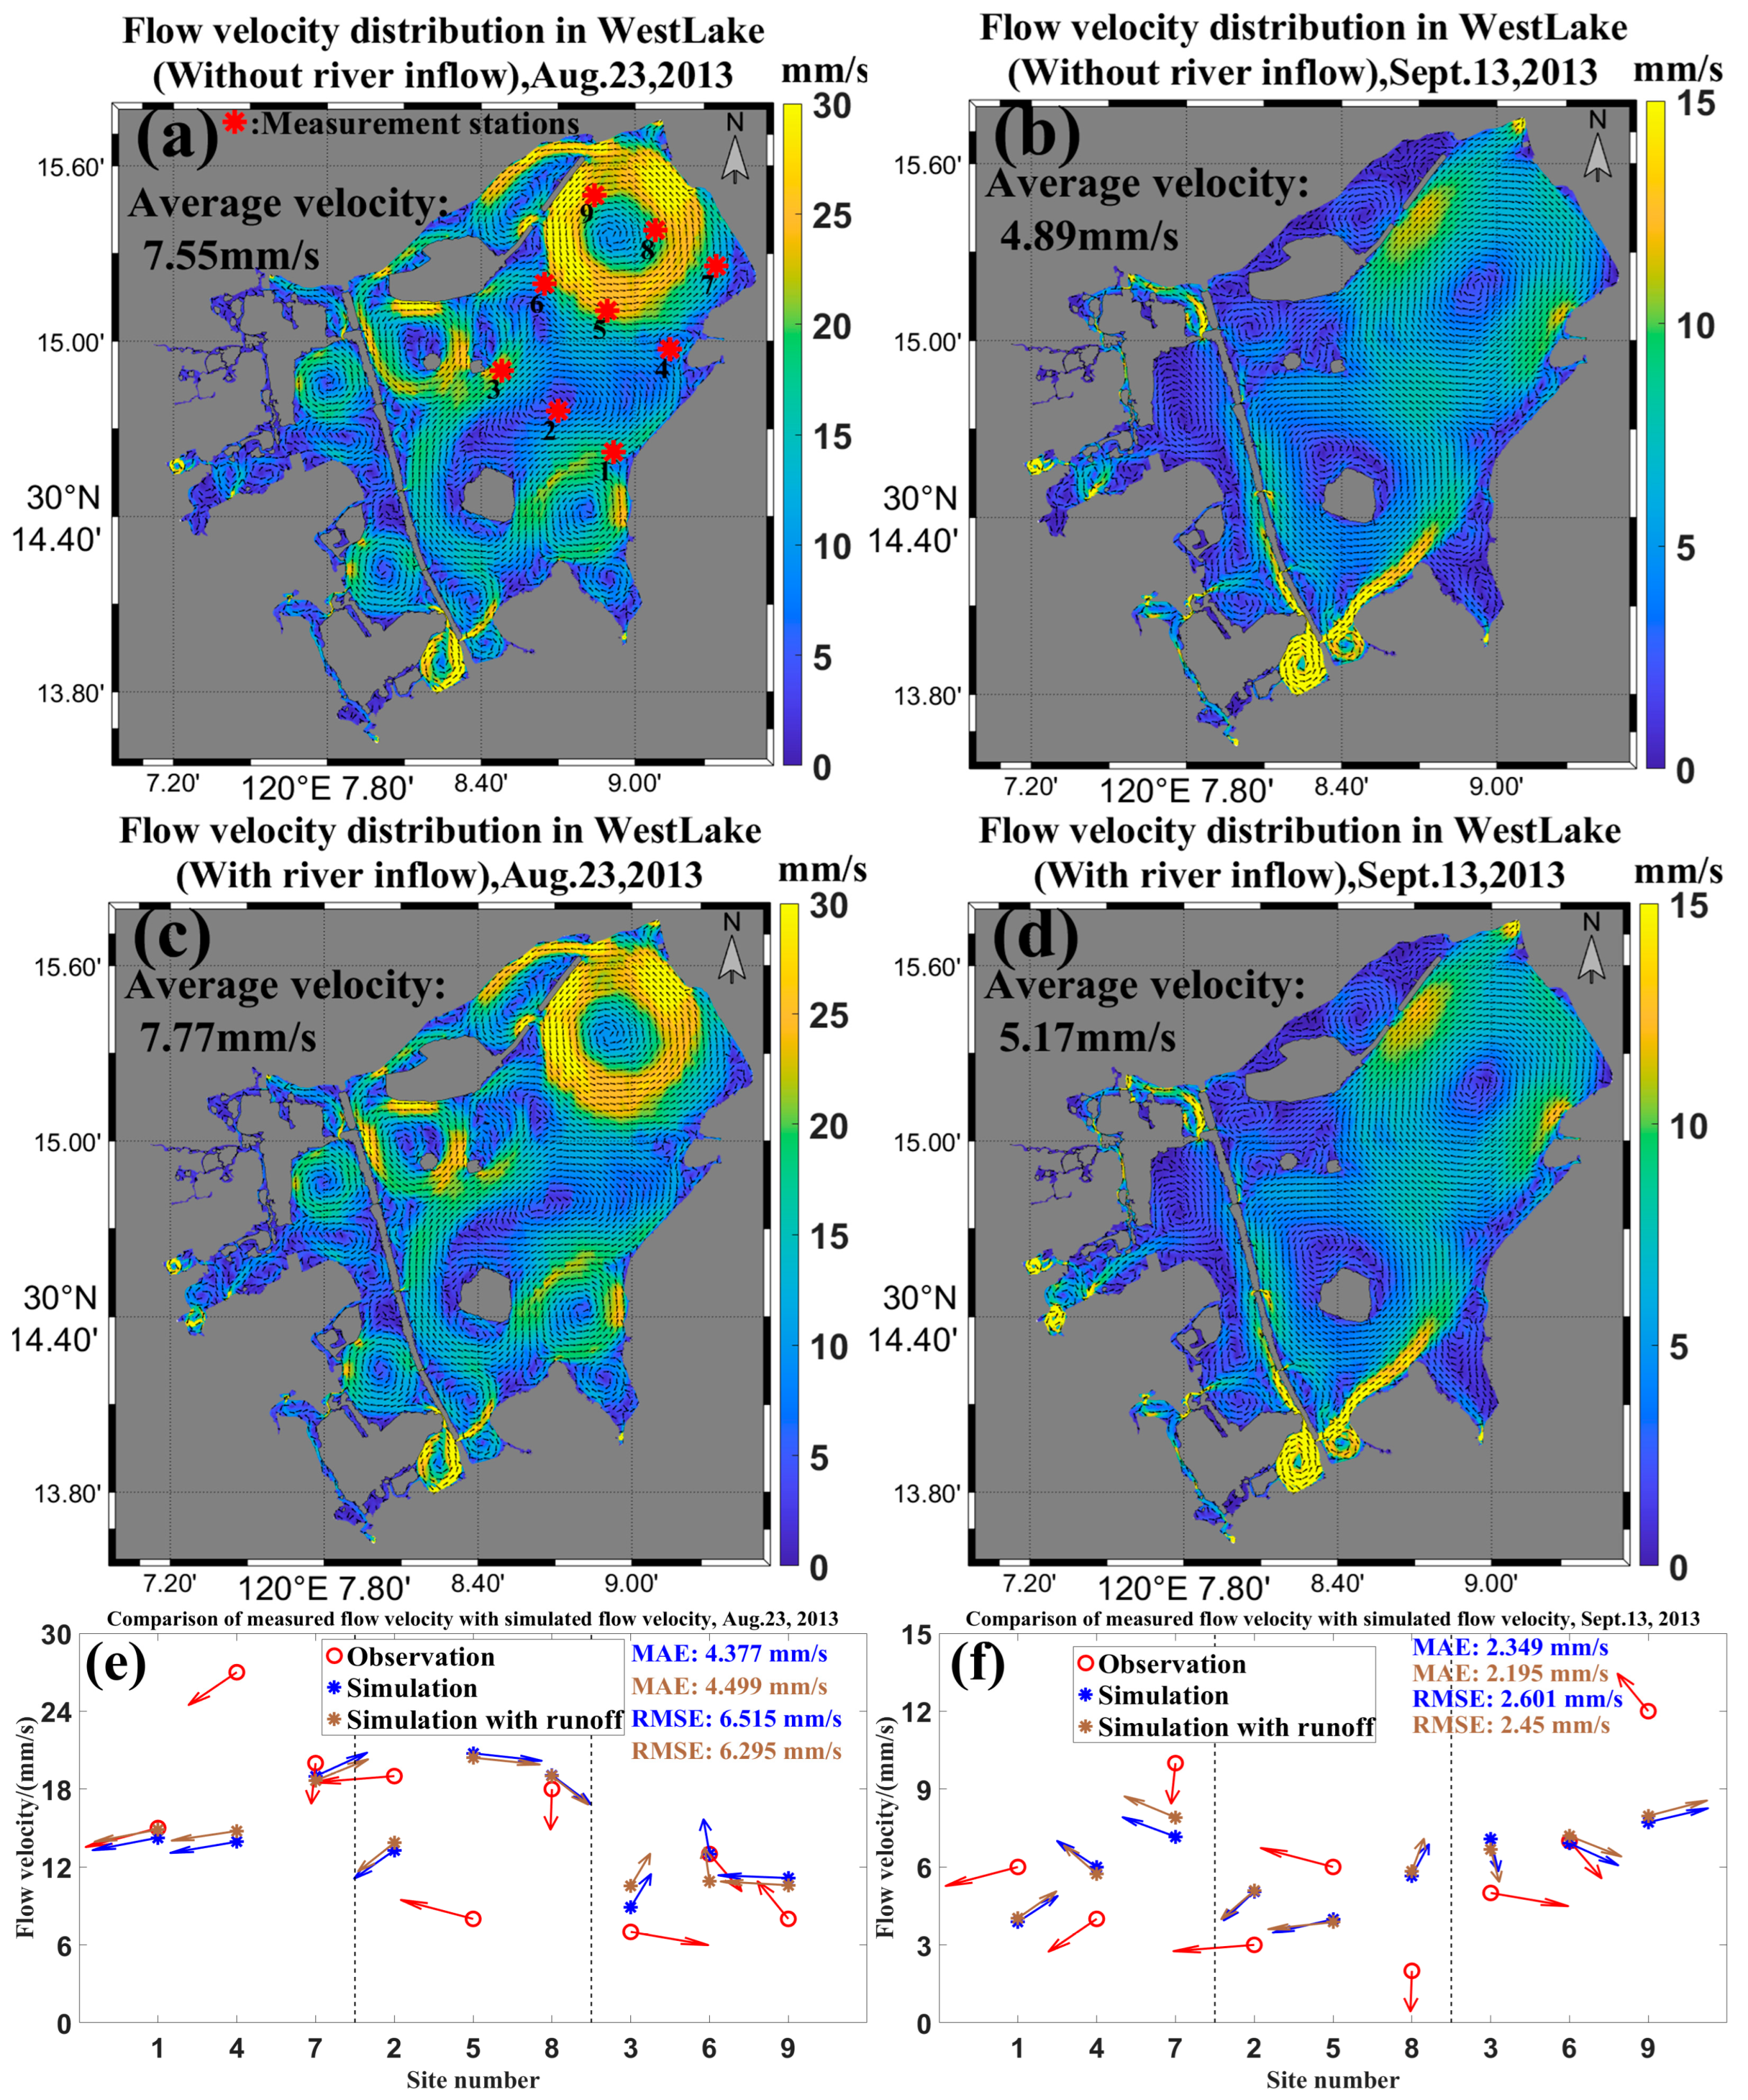
Most previous numerical simulations of West Lake’s hydrodynamic environment ignored the impacts of runoff and precipitation. Therefore, this study conducted three sets of simulations, beginning with Case 1 which simulated the August–September 2013 flow fields under idealized WR conditions while excluding river inflow and precipitation effects (black dashed line in Figure 5), followed by Case 2 which replicated the same replenishment scenario but incorporated river inflow and precipitation influences during the same period (red solid line in Figure 5). The results from these two experimental cases will be used for comparative validation against measured flow field data and for model parameter calibration, while also enabling discussion on how river inputs and precipitation influence the flow field simulation outcomes. The third experimental case (Case 3) simulated the 2022 annual flow fields under actual WR conditions, incorporating both river inflow and precipitation effects (green solid line in Figure 5). This case was designed to calculate LWRTs in West Lake and evaluate their influence on transparency. For validation, measured velocity data from nine stations (spatial distribution shown in Figure 1c) were used, sourced from vertical average-flow measurements conducted by You et al. on 23 August and 13 September 2013 [43].
The velocity and direction distributions output from Cases 1 and 2 on 23 August (wind speed: 1.5 m/s, south) and September 13 (wind speed: 0.6 m/s, north) are shown in Figure 6a–e. The results demonstrate that wind speed and direction significantly influence West Lake’s flow field structure. A comparison of the two cases reveals that on 23 August, the combined effect of rivers and precipitation increased the lake-wide average velocity by only 0.22 mm/s (approximately 2.91%), with negligible changes in flow direction. This indicates that under high wind conditions, the influence of precipitation and river inputs on the flow field structure is minimal, with wind and WR playing the dominant roles. At the nine monitoring stations, simulated velocities in both cases showed close agreement with measured values, with errors remaining within acceptable limits. Errors in water diversion and drainage data, as well as the insufficient temporal resolution of the currently used daily average wind speed data, are potential sources of inaccuracies. The mean absolute errors (MAEs) were 4.377 mm/s and 4.499 mm/s for the two cases, while the root mean square errors (RMSEs) were 6.515 mm/s and 6.295 mm/s, respectively.
On 13 September, the combined effect of river inflow and precipitation increased the whole region average flow velocity in West Lake by 0.28 mm/s (approximately 5.73%), with minimal changes in flow direction. While the velocity increase was slightly more pronounced compared to high-wind conditions (23 August), the simulated velocities at most of the nine monitoring stations still generally aligned with measured values, though with marginally greater deviations than observed on 23 August. This discrepancy may be attributed to the fact that under low wind speeds (0.6 m/s), the lake’s flow structure became more strongly influenced by the WR project. Since neither of the two simulation cases incorporated the actual 2013 water diversion/drainage operational data, this omission likely contributed to the larger errors observed. The MAEs for the two simulation cases were 2.349 mm/s and 2.195 mm/s, respectively, while the RMSEs were 2.601 mm/s and 2.450 mm/s. Incorporating precipitation and river inputs reduced both the RMSE and MAE, demonstrating the optimization effect of including these factors on the model’s simulation capability. Spatially, the model performed best in simulating flow velocities at stations 3, 6, and 9 near the western boundary, while its accuracy was weaker for station 5 in the central lake area and station 4 along the eastern boundary.

4. Results and Discussion

4.1. The Spatiotemporal Distribution of LWRT in West Lake

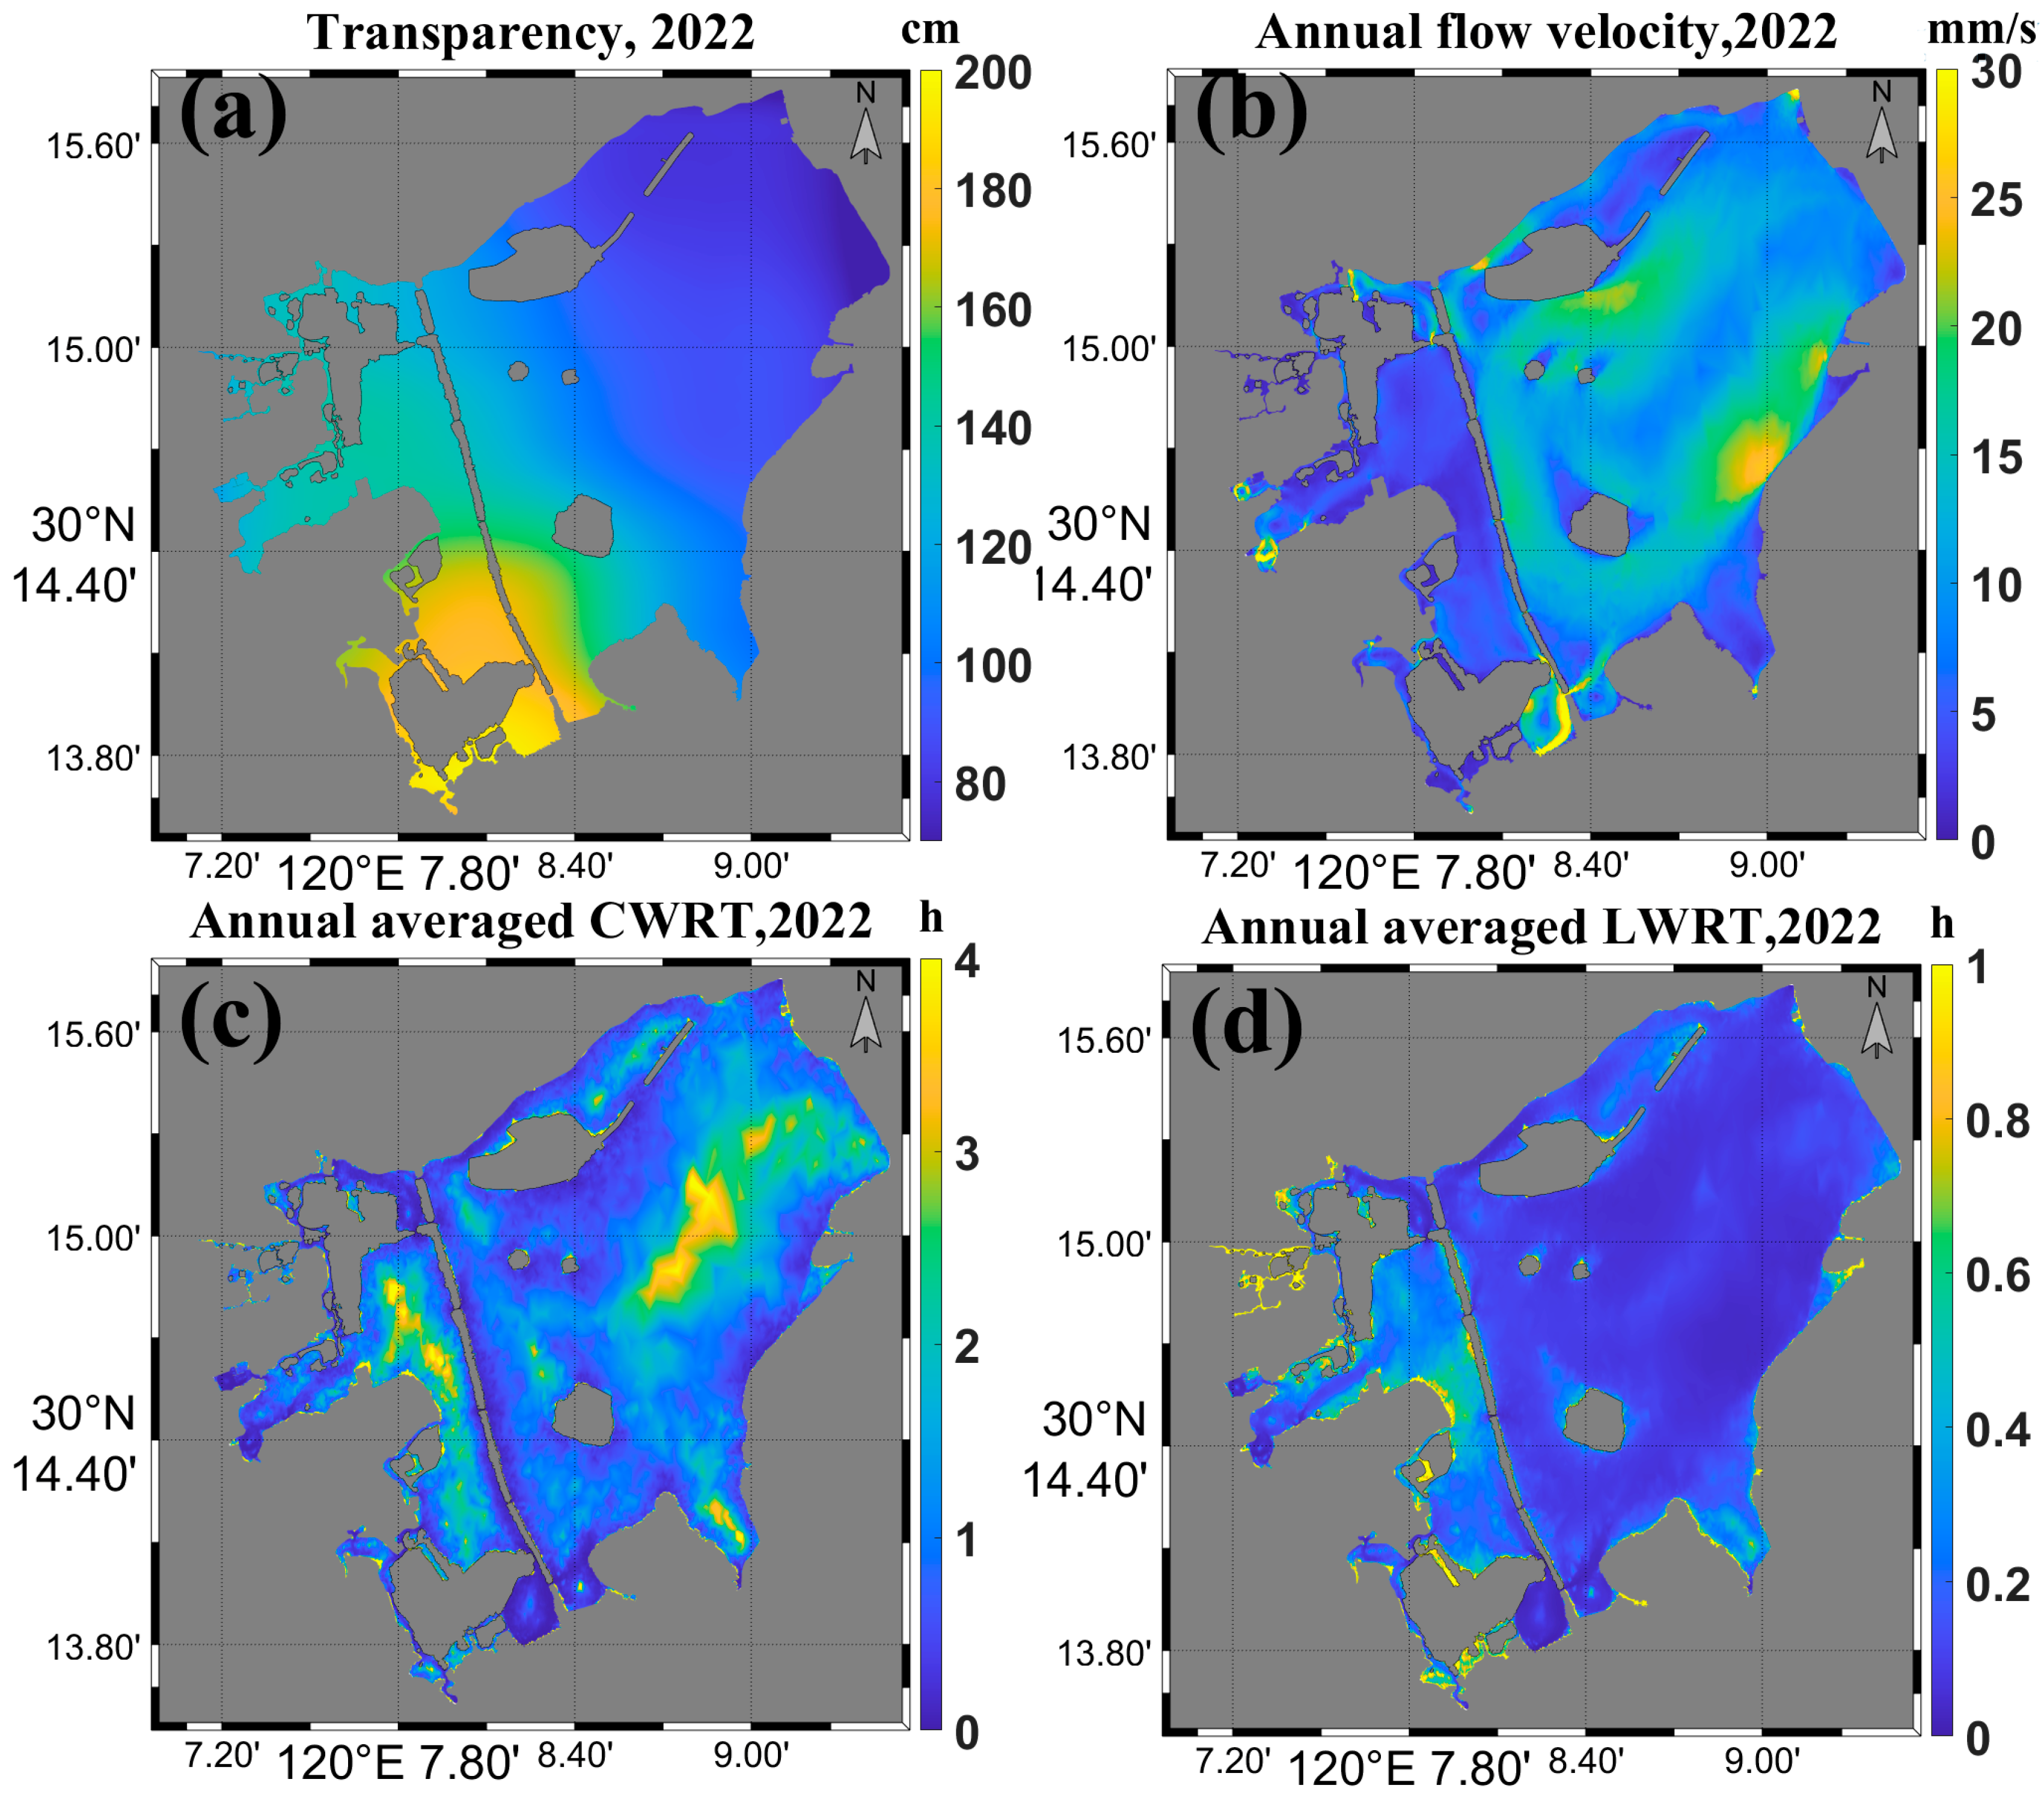
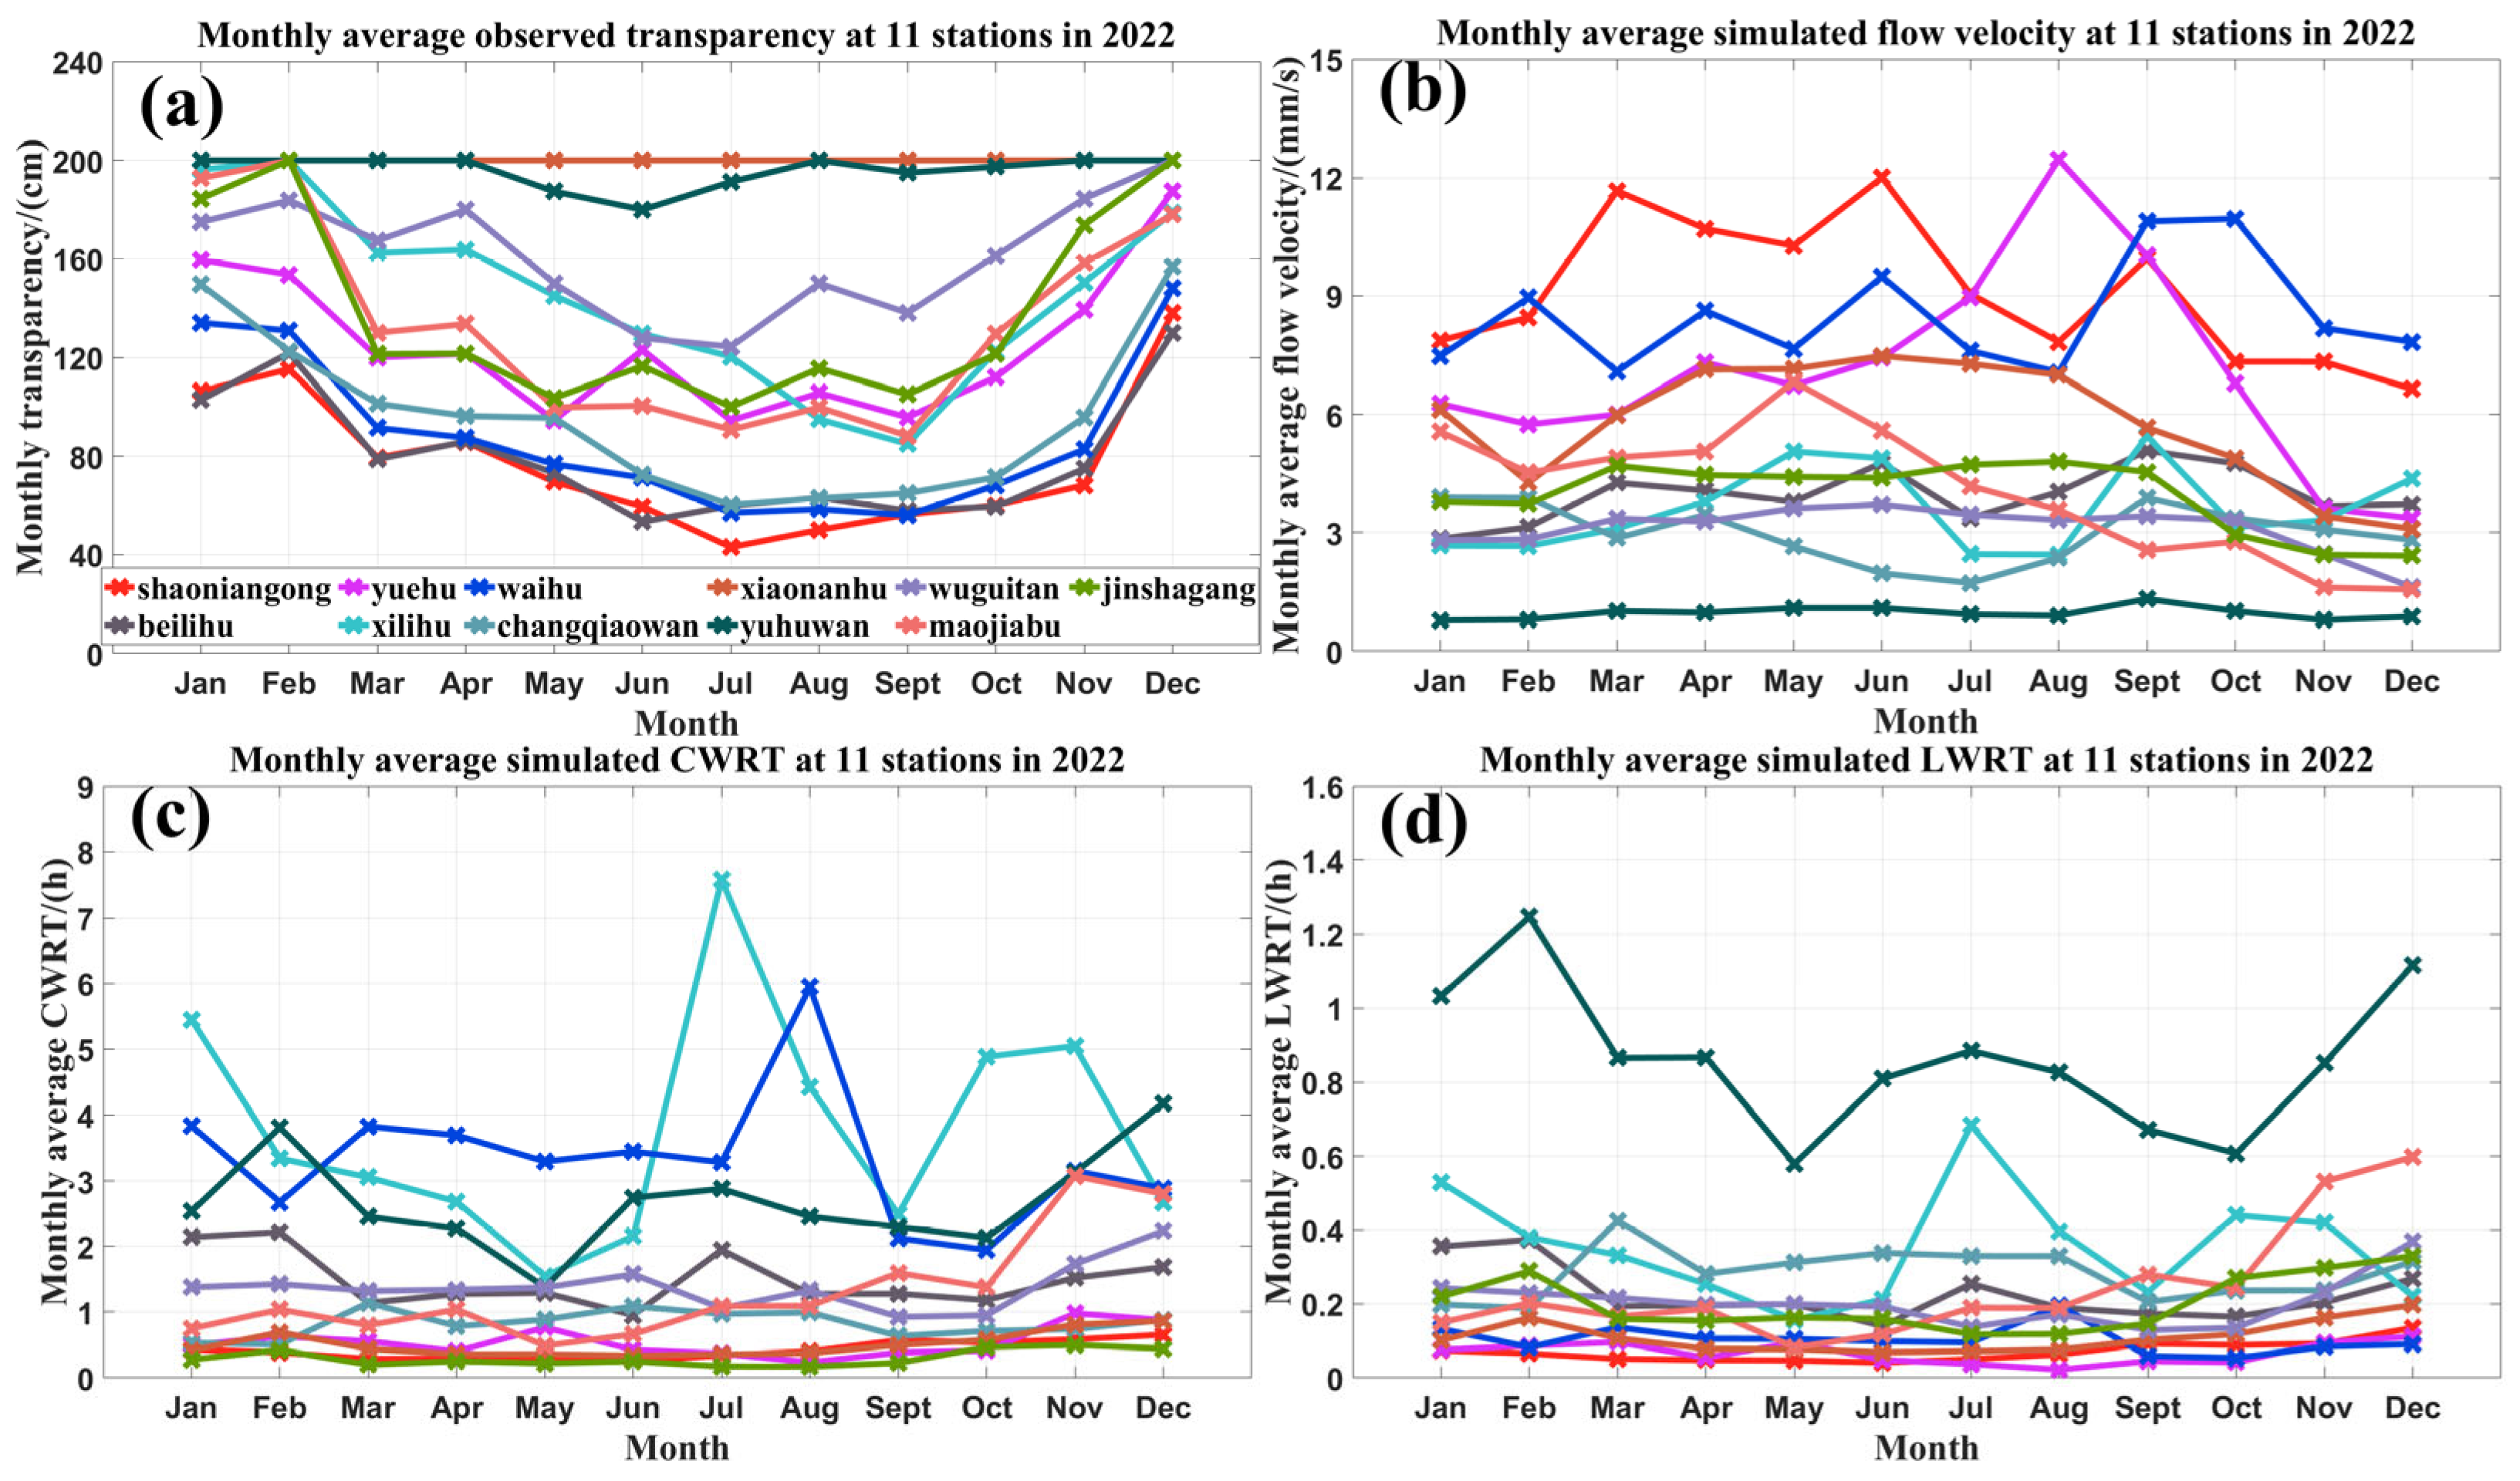
Figure 7a and Figure 8a present the spatial distribution of West Lake’s annual average transparency in 2022 and the monthly mean transparency data at 11 monitoring stations, respectively. Spatially, the western region near water inlets exhibited higher annual transparency compared to the eastern lake areas farther from inflows, with particularly good clarity observed at Wuguitan, Xiaonanhu, and Yuhuwan—consistent with the spatial patterns of Chla and SS concentrations discussed in Section 2.2. Temporally, transparency at most stations was lowest during summer and highest in winter. However, the peak Chla levels (August–September) and SS concentrations (September–October) did not fully align with the timing of minimum transparency, indicating that additional water quality parameters beyond Chla and SS significantly influence transparency variations.
Figure 7b and Figure 8b present the spatial distribution of the model-simulated annual average flow velocity in West Lake for 2022 and the monthly mean velocities at 11 monitoring stations, respectively. Spatially, the annual velocity distribution appears more uniform compared to transparency, with both high and low velocity zones distributed across the western and eastern lake regions. Notably elevated velocities occur within limited areas near water inlets and outlets, though their influence remains localized. Unlike stations adjacent to inlets/outlets, the offshore sites like Belihu, Xilihu, and Waihu do not exhibit significantly low velocities, while Yuhuwan (proximate to the Nanhu inlet) shows consistently low annual flow speeds. Temporally, most stations record peak velocities during summer or autumn. While velocity variations are generally modest across stations, Maojiabu stands out with significantly reduced winter velocities, likely due to its complex hydrodynamic setting near multiple artificial inlets and a natural river inlet.
Figure 7c and Figure 8c present the distribution of CWRT in West Lake for 2022—calculated from grid-cell water fluxes and volumes—and the monthly mean CWRT at 11 monitoring stations, respectively. Spatially, as anticipated, uneven grid-cell sizing caused anomalously prolonged CWRT in offshore areas. For instance, while the offshore Waihu station exhibited relatively high flow velocities, its CWRT significantly exceeded nearshore stations due to disproportionately large grid areas. This metric is therefore unsuitable for cross-station comparisons but remains valid for temporal analyses at individual stations. Temporally, offshore stations (Waihu, Xilihu, Beilihu) showed peak CWRT during summer (June–August), coinciding with transparency minima. In contrast, stations near inlets/outlets exhibited maximum CWRT in winter, likely due to reduced water diversion volumes compared to summer operations.
The area-normalized LWRT effectively addresses the limitation of CWRT in comparing water exchange efficiency across different stations. Figure 7d and Figure 8d present the spatial distribution of West Lake’s 2022 annual average LWRT and the monthly means at 11 stations, respectively. Spatially, LWRT exhibit an inverse relationship with flow velocities—stations with lower velocities like Yuhuwan and Changqiaowan show higher LWRTs, while higher velocity sites such as Waihu, Shaoniangong, and Yuehu display lower LWRTs. Among all stations, Yuhuwan, located near water inlets and river inflows, demonstrates the longest LWRT. This suggests that while Yuhuwan ranks among the top in water quality, this status may primarily result from its proximity to the Nanhu inlet. Once contaminated, pollutants may require extended periods to flush out, potentially explaining its marginally lower water quality compared to neighboring station Xiaonnahu. Conversely, Shaoniangong station, situated near an outlet and distant from all inlets, benefits from shorter LWRT, enhancing its resilience to accidental pollution. Temporally, LWRT follow trends similar to CWRT, with Yuhuwan, Xilihu, and Maojiabu showing significant seasonal fluctuations (peak months varying by location), while other stations remain relatively stable.

4.2. The Responsiveness of West Lake’s Transparency to LWRT and Other Parameters

Figure 9 presents the Spearman correlation coefficients (rs) and linear fitting results between water transparency and various water quality parameters in West Lake. Transparency showed significant negative correlations (p < 0.01) with T, pH, CODMn, SS concentration, TP, and Chla concentration. Notably, the absolute values of rs exceeded 0.7 for CODMn, Chla, and SS, consistent with findings from previous studies [34,36,37]. Transparency exhibited significant positive correlations (p < 0.01) with TN, AN, NO2, NO3, and SO42−. Notably, the absolute values of rs exceeded 0.6 for TN, NO2, NO3. West Lake is a phosphorus-limited eutrophic lake where phosphorus serves as the primary limiting factor for algal growth [56,57]. Nitrate indirectly regulates phytoplankton growth by influencing the sediment–water phosphate equilibrium: elevated concentrations may inhibit algal proliferation, thereby enhancing local transparency [56].
Transparency in West Lake showed a positive correlation with flow velocity and negative correlations with both CWRT and LWRT, though none of these relationships were statistically significant (p > 0.05, rs < 0.2). The lack of significant correlation between transparency and parameters like LWRT primarily stems from limited data availability, coupled with the dominant influence of water quality parameters—particularly CODMn, Chla and SS concentration—on transparency, which far exceeds that of LWRT. Moreover, the impact of LWRT on those water quality parameters varies under different water diversion conditions, lacking a consistent monotonic relationship. For instance, higher exchange rates do not necessarily reduce CODMn. In complex water bodies like West Lake, transparency is governed by multiple interacting factors, making it difficult to isolate the relationship between LWRT and transparency using Spearman correlation on limited samples while controlling for other variables. Therefore, machine learning approaches are required to further elucidate how transparency responds to LWRT under varying water quality conditions.
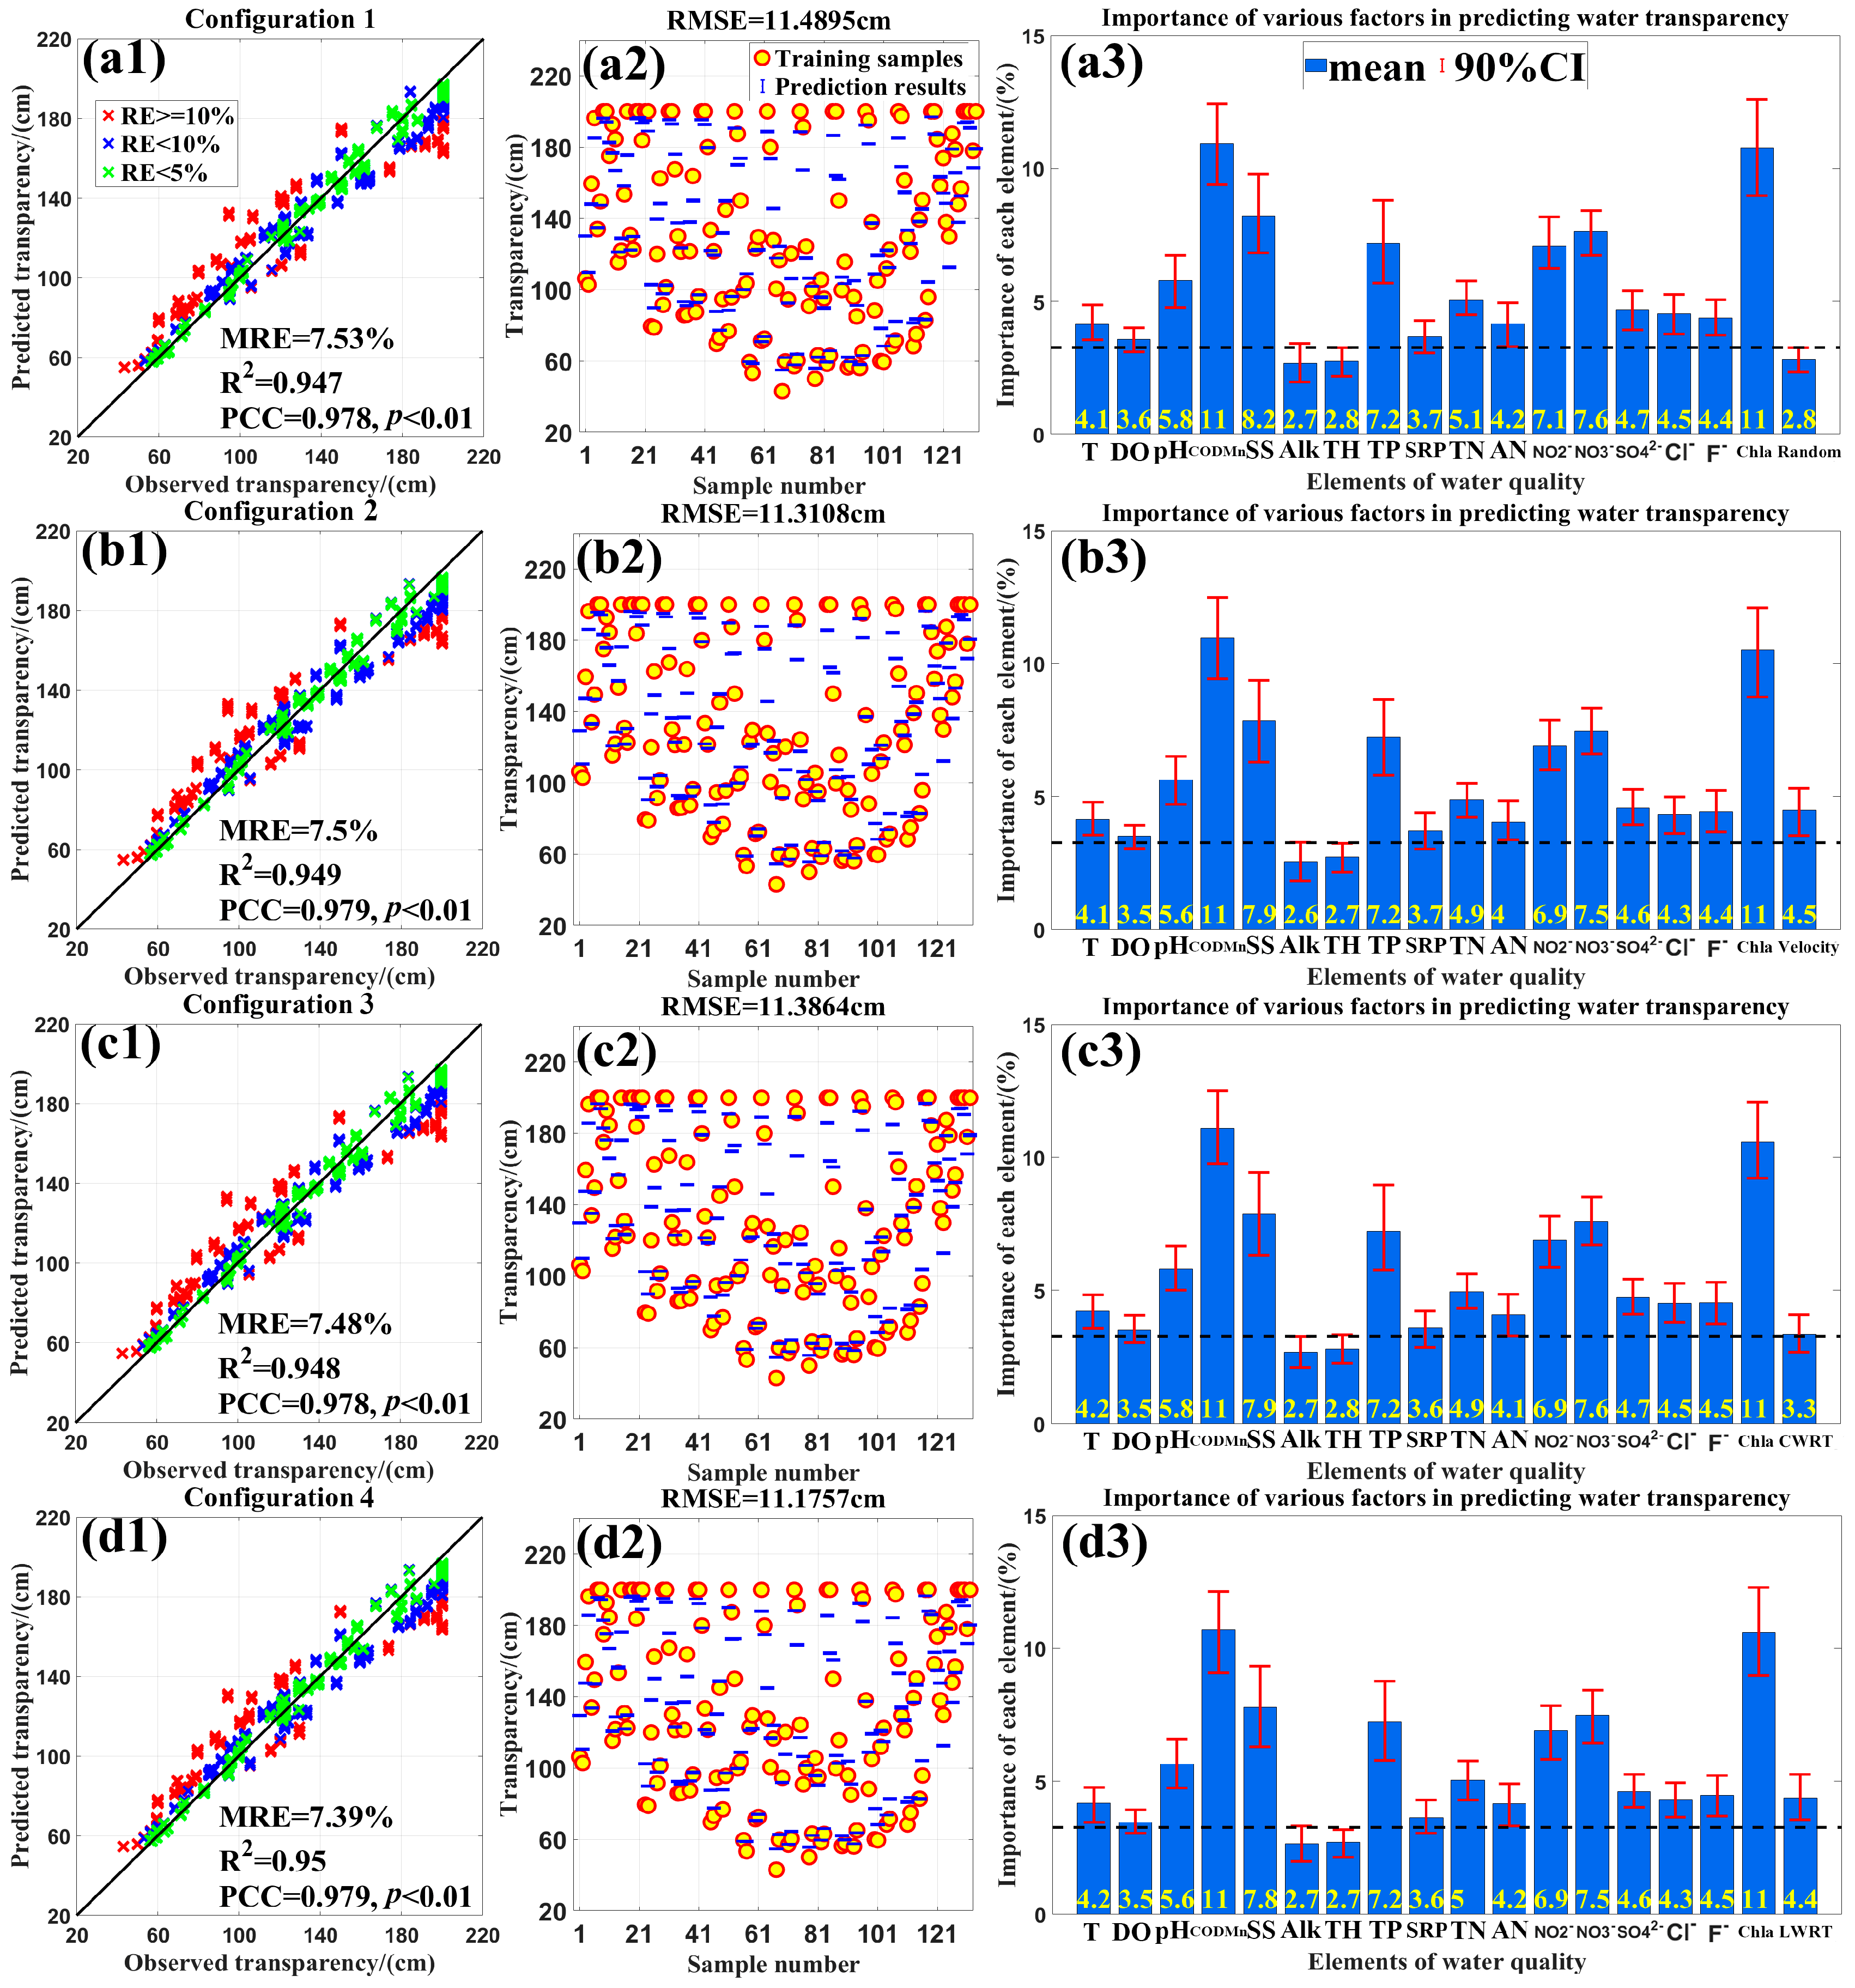
Figure 10 presents a comparison between measured and predicted transparency values using the RF algorithm trained on the four datasets (as configured in Figure 4), along with the feature importance of various water quality and hydrodynamic parameters. As shown in Figure 10(a3), among the water quality parameters, those exerting significant influence on transparency (the lower bound of the 90% CI for feature importance exceeds the upper bound of the 90% CI for the feature importance of random numbers) include the pH, CODMn, Chla concentration, SS concentration, NO3 concentration, NO2 concentration, AN, TN, SO42− concentration, Cl concentration, F concentration and TP. The mean feature importance of CODMn and Chla concentration is the highest, both exceeding 10%. In contrast, alkalinity and TH have negligible impact (the mean feature importance is lower than the lower bound of the 90% confidence interval for the feature importance of random numbers). This result aligns with the performance of the Spearman correlation coefficient. However, there are exceptions—for instance, although F and Cl concentration exhibit relatively high feature importance in the RF algorithm, their Spearman correlation with transparency shows weak significance. This indicates certain limitations of the Spearman correlation coefficient in characterizing the relationship between transparency and individual water quality parameters within complex aquatic environments. Based on transparency’s responsiveness to water quality parameters, West Lake most closely resembles the “lake with rainwater storage” category classified by Zhou et al. [36]. According to Zhou’s results, besides CODMn and Chla concentration, the key water quality parameters influencing such lakes also include DO, AN and SS concentration. In contrast, the feature importance contributed by TP is significantly lower than that of the aforementioned parameters [36]. However, significant differences exist in how its transparency responds to TP and DO compared to typical rainwater-storage lakes. These discrepancies may arise from the WR project altering West Lake’s natural flow field structure, shifting its transparency sensitivity toward patterns characteristic of “lakes supplemented primarily by surface water”—particularly for DO, TP, and SS concentrations. But the transparency of such lakes is almost unaffected by the CODMn, which also differs to some extent from West Lake. In summary, the sensitivity of West Lake’s transparency to water quality parameters combines characteristics of both aforementioned lake types and does not fall solely into any single category, reflecting its relatively complex ecological environment.
In comparison to the transparency predictions from the RF algorithm trained on configuration set 1 (excluding water exchange capacity information), where the MRE was 7.53% and the RMSE was 11.4895 cm, the other three configurations showed reduced prediction errors. Among them, set 4 (incorporating LWRT) performed best, achieving an MRE of 7.39% and an RMSE of 11.1757 cm. The mean feature importance of LWRT in set 4 was 4.38% (90%CI: (3.55%; 5.27%)), comparable to that of T (4.18%) and significantly higher than the randomized control variable in set 1 (90%CI: (2.33%; 3.27%)). Meanwhile, set 2 (incorporating flow velocity) and set 3 (incorporating CWRT) exhibited slightly higher errors (set 2: MRE = 7.5%, RMSE = 11.3108 cm; set 3: MRE = 7.48%, RMSE = 11.3864 cm) compared to set 4.
These findings demonstrate that modifying LWRT through internal hydrodynamic processes can influence transparency to some extent, though its impact is secondary compared to direct water quality improvements achieved through external WR. In West Lake’s current diversion project, the dilution and flushing effects of introducing clean water remain the primary driver of transparency enhancement, while increased lake-wide circulation and reduced water renewal times play a supplementary role.

4.3. The Influence of LWRT on Transparency Under Varying Water Quality Conditions

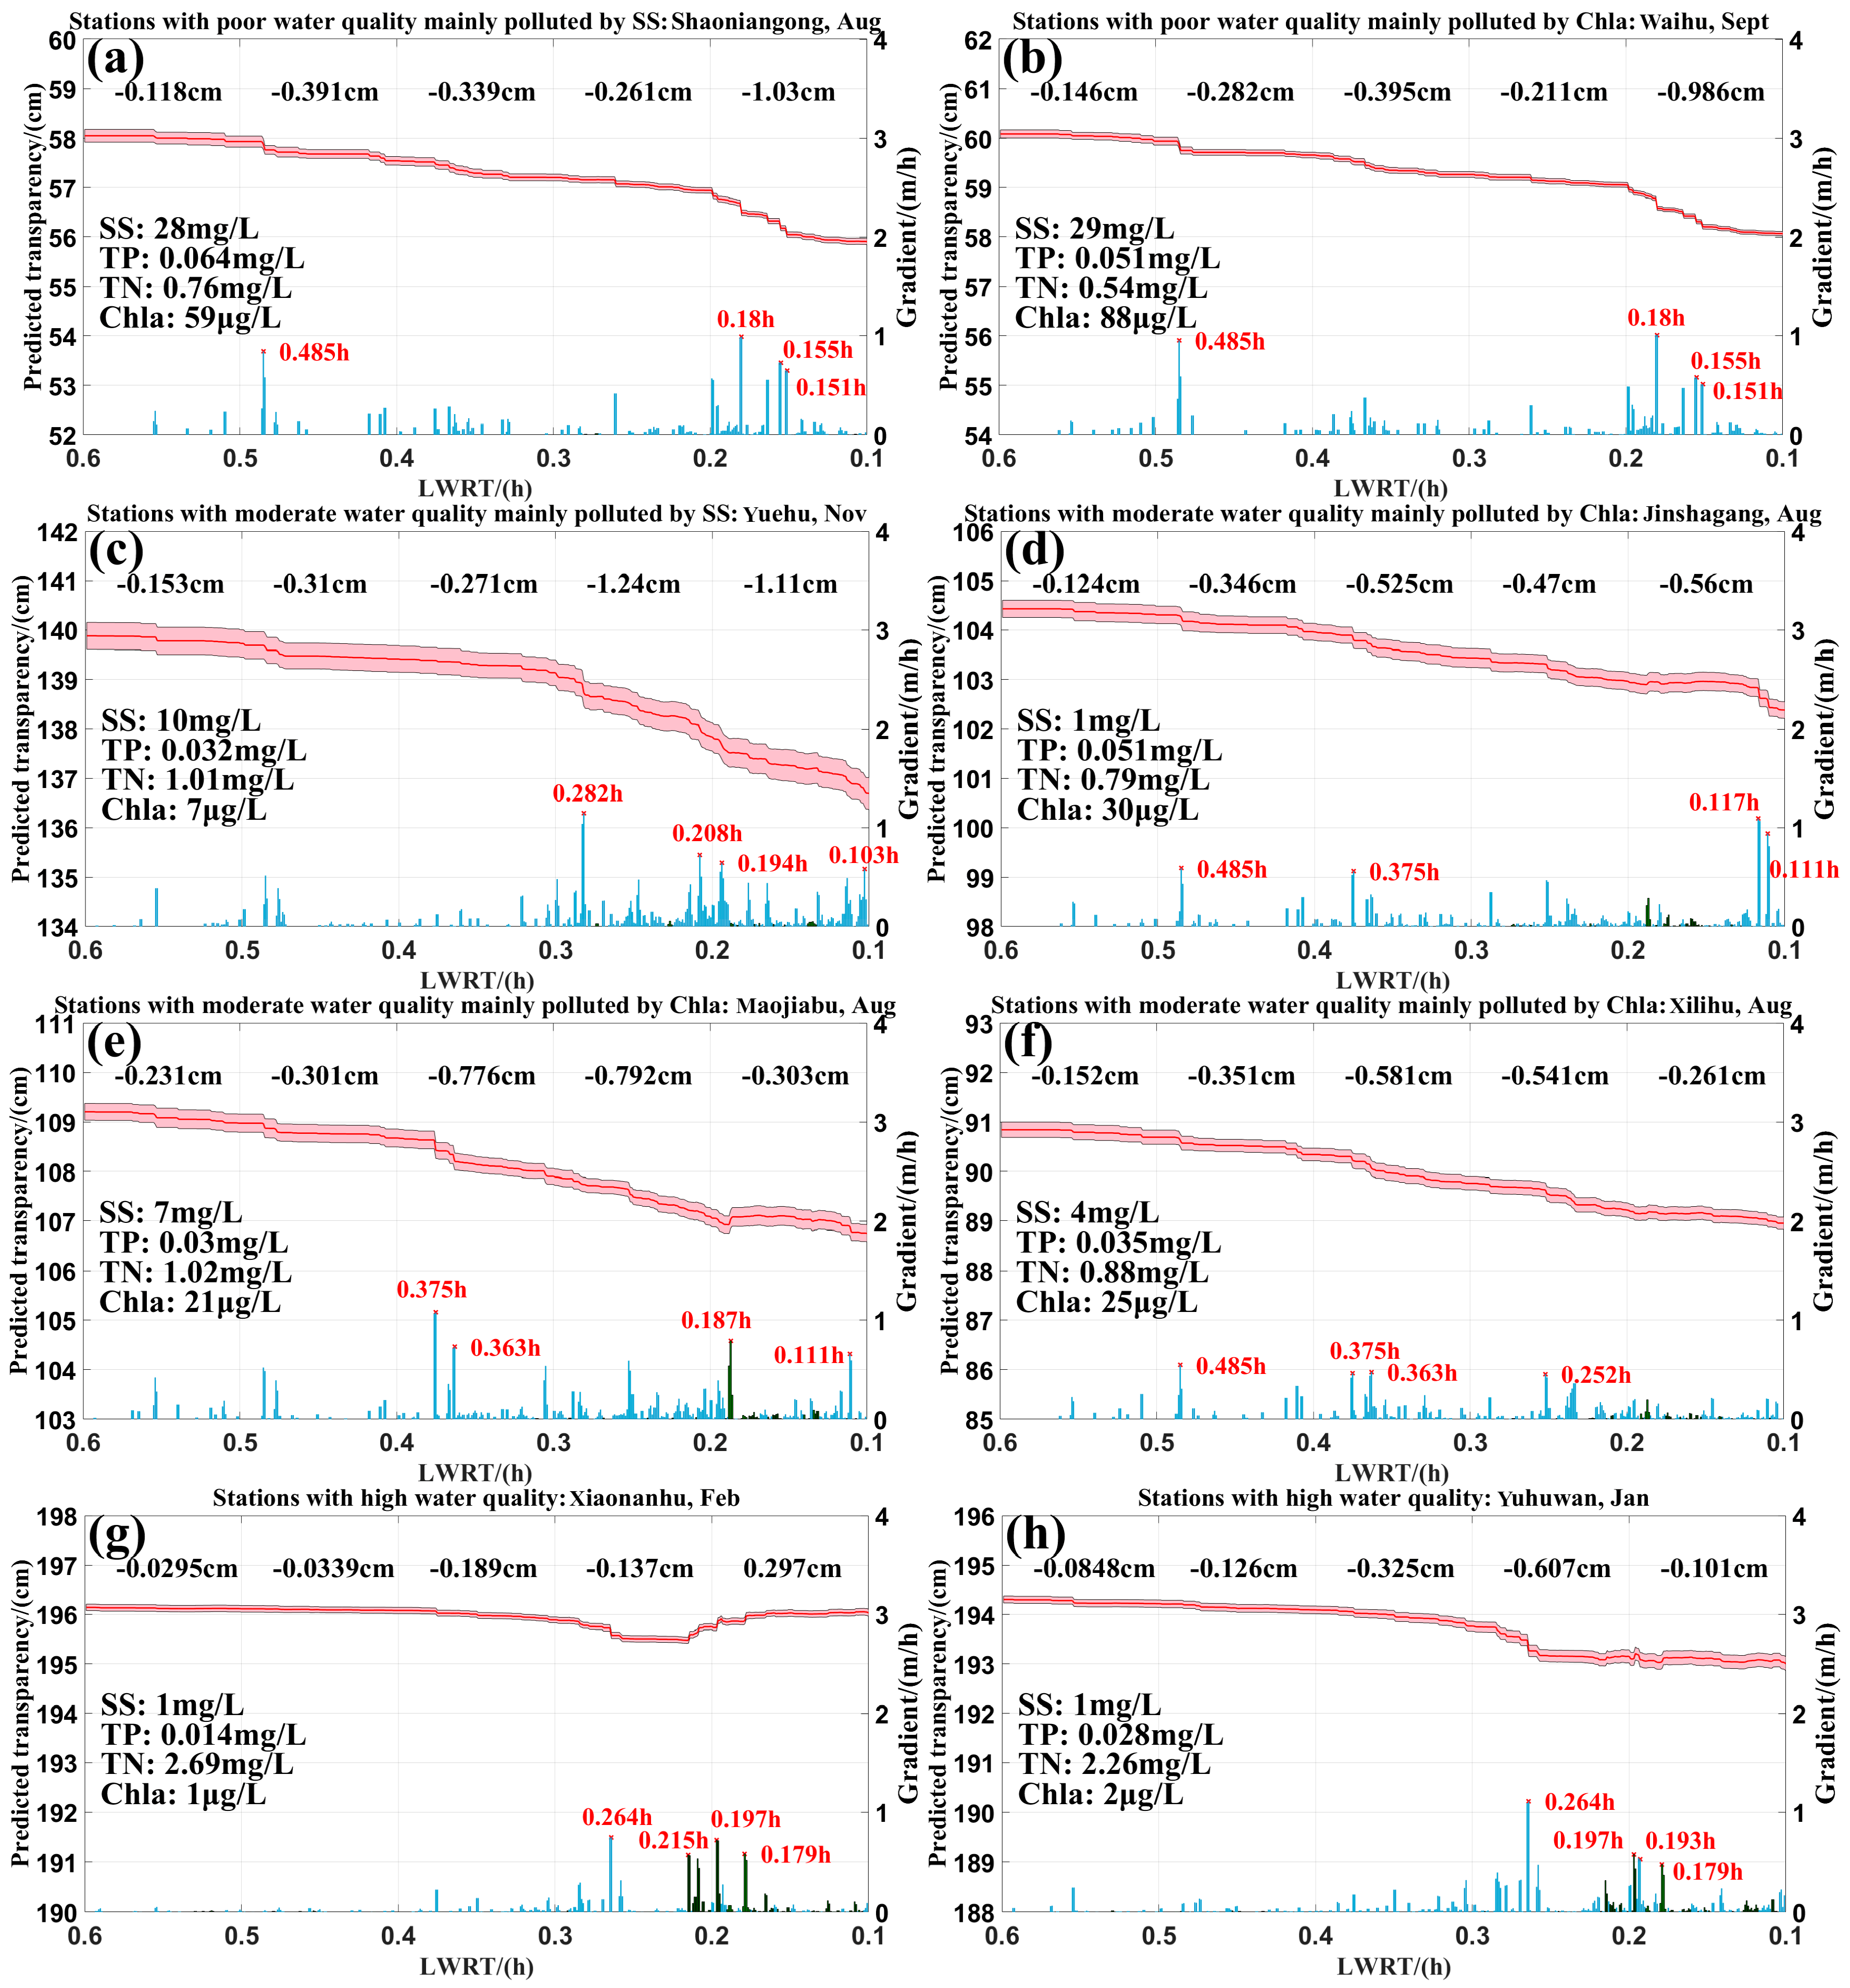
To further investigate the specific effects of reduced LWRT on transparency under varying water quality conditions across West Lake’s monitoring stations, this study employed the RF algorithm trained on configuration set 4. Without altering water quality parameters, the model predicted transparency changes under eight typical water quality scenarios as LWRT decreased (Figure 11). Overall, transparency exhibited a negative correlation with LWRT—a finding that contradicts the rs results. This discrepancy likely arises because the RF model isolated the independent effects of LWRT and other water quality parameters influenced by it.
These results indicate that the positive correlation between shortened LWRT and improved transparency, as revealed by Spearman analysis, largely stems from indirect effects—where changes in hydrodynamic conditions alter other water quality parameters, which in turn affect transparency [25]. When isolating the influence of LWRT alone, the direct hydrodynamic effects—such as increased flow velocity and enhanced circulation—do not inherently improve transparency. Instead, associated processes like bubble entrainment or sediment resuspension may even reduce clarity [18,20]. In the study of Suzhou River, when the flow velocity exceeded a certain threshold, the SVN model also predicted a significant decrease in water transparency, which aligns with the findings of this research. However, compared to West Lake, the impact of flow velocity changes on transparency was more pronounced in Suzhou River. This discrepancy may be attributed to the overall flow velocity in West Lake (in the order of mm/s) being much lower than that in Suzhou River (in the order of m/s) [20].
Thus, under different water quality and ecological conditions, the potential benefits of reducing LWRT for transparency—as well as the magnitude of its impact—vary significantly [58,59]. Figure 11a,b reveal that when water pollution is severe, shortening LWRT exerts a similar degree of negative effect on transparency, regardless of whether the primary pollutant is SS or algae (Chla). Under highly polluted conditions, the dominant pollutant type is not the key factor driving transparency changes in response to LWRT adjustments. Instead, transparency declines most sharply when LWRT ranges between 0.15 and 0.18 h, irrespective of pollutant composition.
Figure 11c–f demonstrate that under moderate water quality conditions, when SS are the primary pollutant, shortening the LWRT may lead to a rapid deterioration in transparency, particularly when LWRT approaches 0.28 h. This phenomenon is likely due to enhanced hydrodynamic activity disrupting the settling process of SSs [18,19]. In contrast, when algal blooms (Chla) dominate, the negative impact of reduced LWRT on transparency is much milder. In fact, near LWRT = 0.19 h, shortening LWRT can even improve transparency, possibly because increased flow inhibits excessive algal proliferation. However, once eutrophication is established, hydrodynamic effects on algal growth diminish [23,24,60]. This may explain why reducing LWRT to near 0.19 h improves transparency more significantly at the Maojiabu station (Chla = 21 μg/L, TP = 0.03 mg/L) compared to two other stations with similar conditions but higher nutrient levels (Chla = 30 μg/L, TP = 0.051 mg/L; Chla = 25 μg/L, TP = 0.351 mg/L).
The results from high water quality stations further support this conclusion. When the LWRT was reduced to approximately 0.2 h, transparency at the Xiaonanhu station (Chla = 1 μg/L, TP = 0.014 mg/L) improved more significantly compared to the Yuhuwan station (Chla = 2 μg/L, TP = 0.028 mg/L), which had slightly higher nutrient concentrations. Additionally, in contrast to other station types, shortening LWRT had a minimal negative impact on transparency at high water quality stations.
In summary, if the local nutrient concentrations in the lake cannot be effectively reduced, small-scale internal circulation projects aimed at increasing flow velocity and water exchange capacity will not improve lake transparency. Instead, they may exacerbate turbidity by resuspending sediments or generating bubble, further reducing water clarity.

5. Conclusions

This study employed the Delft3D hydrodynamic model to simulate the spatiotemporal variations in LWRT in West Lake during 2022, revealing a mismatch between renewal capacity and transparency in sub-basin areas. Specifically, it identified high transparency zones with unexpectedly low renewal capacity, regions previously overlooked due to their proximity to water diversion inlets. By integrating monthly Chla evolution, the analysis further highlighted the ecological vulnerability of these areas to stochastic disturbances.
Through RF algorithm analysis, the key determinants of West Lake’s transparency were quantitatively identified as CODMn, Chla concentration, SS, NO3 and TP, with LWRT demonstrating a substantially weaker influence. This finding conclusively establishes that in artificial WR projects, the ecological benefits primarily stem from the pollutant flushing and dilution effects of introducing clean water rather than hydrodynamic adjustments alone. Those results point out the critical importance of prioritizing external water quality in WR.
Sensitivity experiments demonstrate that localized water circulation projects, aimed at improving lake transparency, are only suitable for areas with relatively low eutrophication levels prior to large-scale algal blooms. In such areas, these projects can effectively reduce nutrient concentrations and prevent algal outbreaks. However, in other scenarios, internal water circulation may increase SS concentrations, leading to negative effects. These findings highlight that water quality and ecological conditions are critical factors determining how transparency responds to changes in LWRT. Additionally, this study provides practical guidance for selecting appropriate locations and timing for implementing internal water circulation projects in lakes.
Overall, this study combines hydrodynamic numerical modeling and machine learning algorithms to evaluate the ecological improvement capacity of two distinct processes in WR projects: pollutant dilution and enhanced hydrodynamic mobility. The findings provide a theoretical foundation for lake management authorities to further optimize ecological conditions following artificial WR initiatives. Our results clearly and specifically identify at-risk zones as well as spatially and temporally suitable areas for implementing internal water circulation projects. This research assists lake management agencies in avoiding the ecological risks associated with improper project siting while minimizing unnecessary long-term economic costs.
This study is currently in its preliminary stage and still has significant room for improvement. Neither the water quality monitoring nor the hydrodynamic model in this study accounted for the vertical differences in West Lake’s water quality. Although West Lake is a shallow lake with an average depth of less than 3 m and exhibits relatively uniform vertical mixing, the vertical heterogeneity during algal bloom periods should not be ignored. This limitation not only constrained the algorithm’s performance but may also introduce certain inaccuracies into the current conclusions of the study. In subsequent work, we will enhance the monitoring capacity across different water layers at various stations, build a three-dimensional hydrodynamic–water-quality coupled model, refine the calculation process of LWRT, and ultimately improve the vertical resolution of the research dataset. These efforts will yield data that more accurately reflect the true ecological conditions of West Lake and enhance lake management practices.

Author Contributions

Conceptualization, P.X., L.Z. and X.Z.; methodology, P.X., L.Z. and Z.M.; validation, P.X. and L.Z.; formal analysis, P.X.; investigation, L.R., J.Y. and Y.Z.; resources, L.R., J.Y. and Y.Z.; data curation, P.X., L.R., J.Y. and Y.Z.; writing—original draft preparation, P.X. and L.Z.; writing—review and editing, P.X. and L.Z.; visualization, P.X.; supervision, Z.M. and L.R.; project administration, L.Z., X.Z. and Z.M.; funding acquisition, Z.M. All authors have read and agreed to the published version of the manuscript.

Funding

This work was supported in part by the National Natural Science Foundation of China under Grant 61991454, in part by the National Key Research and Development Program of China under Grant 2023YFC3107605, in part by the Oceanic Interdisciplinary Program of Shanghai Jiao Tong University under Grant SL2022ZD206, and in part by the Scientific Research Fund of Second Institute of Oceanography, MNR under Grant SL2302.

Data Availability Statement

The data presented in this study are available on request from the corresponding author.

Acknowledgments

We are grateful to the anonymous reviewers for their constructive comments and helpful suggestions.

Conflicts of Interest

The authors declare no conflicts of interest.

References

  1. Dugener, N.M.; Stone, I.P.; Weinke, A.D.; Biddanda, B.A. Out of oxygen: Stratification and loading drove hypoxia during a warm, wet, and productive year in a Great Lakes estuary. J. Great Lakes Res. 2023, 49, 1015–1028. [Google Scholar] [CrossRef]
  2. Zhao, L.; Zhu, R.; Zhou, Q.C.; Jeppesen, E.; Yang, K. Trophic status and lake depth play important roles in determining the nutrient-chlorophyll a relationship: Evidence from thousands of lakes globally. Water Res. 2023, 242, 120182. [Google Scholar] [CrossRef] [PubMed]
  3. Sun, M.Y.; Zhang, L.; Yang, R.J.; Li, X.H.; Zhao, J.; Liu, Q.Q. Water resource dynamics and protection strategies for inland lakes: A case study of Hongjiannao Lake. J. Environ. Manag. 2024, 355, 120462. [Google Scholar] [CrossRef] [PubMed]
  4. Lin, X.; Li, S.; Sun, D.; Zhou, W.; Wei, J.; Fang, H.; Zhu, L.; Lu, Z.; Xu, J. Assessment and Comprehensive Evaluation of Large-Scale Reclaimed Water Reuse for Urban River Restoration and Water Resource Management: A Case Study in China. Water 2023, 15, 3909. [Google Scholar] [CrossRef]
  5. Pu, Z.; Bai, J.; Zhang, Q.; Tian, K.; Yang, W.; Zhao, Y.-W. Ecological water replenishment through optimal allocation of lake water in water-scarce areas based on channel selection and replenishment period: A case study of China’s Baiyangdian Lake. Sci. Total Environ. 2024, 956, 177340. [Google Scholar] [CrossRef]
  6. Liu, B.; Yang, L.; Cui, C.; Wan, W.; Liang, S. Is water replenishment an effective way to improve lake water quality? Case study in Lake Ulansuhai, China. Front. Environ. Sci. 2024, 12, 1392768. [Google Scholar] [CrossRef]
  7. Pan, X.; Liu, S.; Li, R.; Sun, H.; Feng, J.; Cheng, X.; Yao, J. Research on the purification enhancement of ecological ponds: Integrating water cycle optimization and plants layout. J. Environ. Manag. 2023, 344, 118487. [Google Scholar] [CrossRef]
  8. Deng, K.; Wu, Z.; Zhang, G.; Xu, J.; Yang, J.; Mao, Y.; Jiang, H. Benifits of the restoration projects on West Lake: Evidence of chlorophyll-a change (1998–2007). Hupo Kexue 2009, 21, 518–522. [Google Scholar] [CrossRef]
  9. You, A.; Wu, Z.; Han, Z.; Yang, J.; Hua, L. Spatial and temporal distributions and variations of nutrients in the West Lake, Hangzhou, after the implementation of integrated water management program (1985–2013). Hupo Kexue 2015, 27, 371–377. [Google Scholar] [CrossRef]
  10. Lin, F.; Ye, X.; Jiao, L.; Wu, Z.; Yang, J.; Xu, J. Effects of comprehensive protection project to the ecological environment of West Lake in Hangzhou. J. Water Resour. Water Eng. 2007, 18, 52–55. [Google Scholar] [CrossRef]
  11. Yu, H.; Shi, X.; Sun, B.; Zhao, S.; Wang, S.; Yang, Z.; Han, Y.; Kang, R.; Chen, L. Effects of water replenishment on lake water quality and trophic status: An 11-year study in cold and arid regions. Ecotoxicol. Environ. Saf. 2024, 281, 116621. [Google Scholar] [CrossRef]
  12. Shi, X.; Wang, L.; Chen, A.; Yu, W.; Liu, Y.; Huang, X.; Long, X.; Du, Y.; Qu, D. Enhancing water quality and ecosystems of reclaimed water-replenished river: A case study of Dongsha River, Beijing, China. Sci. Total Environ. 2024, 926, 172024. [Google Scholar] [CrossRef]
  13. Zhou, X.; Sun, B.; Chen, G.; Zhang, Y.; Wang, H.; Gao, X.; Han, Z.; Liu, X. Water quality evolution of water-receiving lakes under the impact of multi-source water replenishments. J. Hydrol.-Reg. Stud. 2024, 53, 101832. [Google Scholar] [CrossRef]
  14. Zheng, X.; Luo, N.; Pei, H. Assessment of Spatio-Temporal Changes of Water Quality in West Lake, Hangzhou Using SOFM Neural Network. J. Biomath. 2007, 22, 317–322. [Google Scholar] [CrossRef]
  15. Zhu, W.; Cheng, L.; Xue, Z.; Feng, G.; Wang, R.; Zhang, Y.; Zhao, S.; Hu, S. Changes of water exchange cycle in Lake Taihu (1986–2018) and its effect on the spatial pattern of water quality. Hupo Kexue 2021, 33, 1087–1099. [Google Scholar] [CrossRef]
  16. Yu, P. Internal Circulation Scheme based on MIKE21 Hydrodynamic Model in Pipa Lake. Water Purif. Technol. 2018, 37, 108–113. [Google Scholar] [CrossRef]
  17. Hua, L.; You, A.; Han, Z.; Teng, H.; Zhu, J. Total Phosphorus Model Construction and Analysis of Internal Circulation Water Transfer in West Lake. J. China Hydrol. 2015, 35, 27–32. [Google Scholar] [CrossRef]
  18. Zhang, Y.; Zhu, J.; Hu, W.; Chen, Q.; Peng, Z.; Qin, H.; Luo, J. Hydrodynamic effects and water environment improvement of topographic reconstruction in shallow lakes. J. Hydrol. 2024, 634, 131125. [Google Scholar] [CrossRef]
  19. Yan, B.; Liu, Z.; Wang, L.; Bei, C. Numerical simulation of water replenishment scheme in Lihu Lake based on EFDC model. Environ. Pollut. Control 2022, 44, 607. [Google Scholar] [CrossRef]
  20. Liao, Y.; Li, Y.; Shu, J.; Wan, Z.; Jia, B.; Fan, Z. Water Transparency Prediction of Plain Urban River Network: A Case Study of Yangtze River Delta in China. Sustainability 2021, 13, 7372. [Google Scholar] [CrossRef]
  21. Choi, Y.; Yang, K.; Lee, M.Y.; Youn, S.H.; Son, M.; Park, S.R.; Kim, T.-H. Factors controlling massive green tide blooms on the coasts of Jeju Island, Korea. Mar. Pollut. Bull. 2023, 186, 114446. [Google Scholar] [CrossRef]
  22. Zhang, H.; Qi, P. Numerical Optimization Study of the Nanfei River Ecological Water Replenishment Plan. Environ. Eng. Manag. J. 2024, 23, 1259–1269. [Google Scholar] [CrossRef]
  23. Huang, Y.; Chen, G.; Zhang, J.; Xu, P.; Pan, L.; Zhang, X.; Chen, X. Reducing the water residence time is inadequate to limit the algal proliferation in eutrophic lakes. J. Environ. Manag. 2023, 330, 117177. [Google Scholar] [CrossRef]
  24. Song, K.; Liu, Q.; Wang, Q.; Wu, Y.; Chen, Z.; Lu, Y.; Hu, H.-Y. Replenishment of landscape water with reclaimed water: Threshold of hydraulic retention time employing transparency as a control indicator. Water Reuse 2024, 14, 240–247. [Google Scholar] [CrossRef]
  25. Ao, D.; Wei, L.; Pei, L.; Liu, C.; Wang, L. Simulation Study on the Optimisation of Replenishment of Landscape Water with Reclaimed Water Based on Transparency. Int. J. Environ. Res. Public Health 2023, 20, 4141. [Google Scholar] [CrossRef]
  26. Zhou, Q.; Chen, H.; Cheng, B.; Cheng, Y.; Guo, B. A Study of the Effect of Lake Shape on Hydrodynamics and Eutrophication. Sustainability 2025, 17, 1720. [Google Scholar] [CrossRef]
  27. Zheng, W.; Li, R.; Qin, W.; Chen, B.; Wang, M.; Guan, W.; Zhang, X.; Yang, Q.; Zhao, M.; Ma, Z. Tidal water exchanges can shape the phytoplankton community structure and reduce the risk of harmful cyanobacterial blooms in a semi-closed lake. J. Oceanol. Limnol. 2022, 40, 1868–1880. [Google Scholar] [CrossRef]
  28. Komita, B.; Weaver, R.; McClain, N.; Fox, A. Natural and Engineered Ocean Inflow Projects to Improve Water Quality Through Increased Exchange. J. Mar. Sci. Eng. 2024, 12, 2047. [Google Scholar] [CrossRef]
  29. Zhang, X.; Duan, B.; He, S.; Lu, Y. Simulation study on the impact of ecological water replenishment on reservoir water environment based on Mike21--Taking Baiguishan reservoir as an example. Ecol. Indic. 2022, 138, 108802. [Google Scholar] [CrossRef]
  30. Wang, S.; Li, J.; Zhang, B.; Lee, Z.; Spyrakos, E.; Feng, L.; Liu, C.; Zhao, H.; Wu, Y.; Zhu, L.; et al. Changes of water clarity in large lakes and reservoirs across China observed from long-term MODIS. Remote Sens. Environ. 2020, 247, 111949. [Google Scholar] [CrossRef]
  31. Chang, N.; Zhang, Q.; Wang, Q.; Luo, L.; Wang, X.C.; Xiong, J.; Han, J. Current status and characteristics of urban landscape lakes in China. Sci. Total Environ. 2020, 712, 135669. [Google Scholar] [CrossRef]
  32. Cui, Y.; Yan, Z.; Wang, J.; Hao, S.; Liu, Y. Deep learning-based remote sensing estimation of water transparency in shallow lakes by combining Landsat 8 and Sentinel 2 images. Environ. Sci. Pollut. Res. 2022, 29, 4401–4413. [Google Scholar] [CrossRef]
  33. Wang, J.; Sun, D.; Wang, S.; Zhang, H.; Zhang, Y.; He, M. Long-term satellite records of water clarity suggest increasing human activity influence in an inland lake. Int. J. Digit. Earth 2025, 18, 2506491. [Google Scholar] [CrossRef]
  34. Chang, N.; Luo, L.; Wang, X.C.; Song, J.; Han, J.; Ao, D. A novel index for assessing the water quality of urban landscape lakes based on water transparency. Sci. Total Environ. 2020, 735, 139351. [Google Scholar] [CrossRef]
  35. Yin, Z.; Li, J.; Liu, Y.; Xie, Y.; Zhang, F.; Wang, S.; Sun, X.; Zhang, B. Water clarity changes in Lake Taihu over 36 years based on Landsat TM and OLI observations. Int. J. Appl. Earth Obs. Geoinf. 2021, 102, 102457. [Google Scholar] [CrossRef]
  36. Zhou, Y.; Lv, Y.; Dong, J.; Yuan, J.; Hui, X. Factors Influencing Transparency in Urban Landscape Water Bodies in Taiyuan City Based on Machine Learning Approaches. Sustainability 2025, 17, 3126. [Google Scholar] [CrossRef]
  37. Zhou, Y.; Lv, Y.; Dong, J.; Yuan, J.; Hui, X. Sensitivity Analysis of Urban Landscape Lake Transparency Based on Machine Learning in Taiyuan City. Sustainability 2024, 16, 7026. [Google Scholar] [CrossRef]
  38. Hua, L.; You, A.; Han, Z.; Xu, H. Simulation analysis of the influence of heavy rainfall on urban lake. In Proceedings of the 3rd International Conference on Energy Engineering and Environmental Protection (EEEP), Sanya, China, 19–21 November 2019. [Google Scholar]
  39. He, W.; Jin, J.; Shao, D.; Shao, Y. Application of Mathematical Modeling Method in Test Area of Hangzhou. China Water Wastewater 2013, 29, 148–150. [Google Scholar] [CrossRef]
  40. Yang, F.; Jiang, Y.-f.; Wang, C.-c.; Huang, X.-n.; Wu, Z.-y.; Chen, L. Characteristics of Nitrogen and Phosphorus Losses in Longhong Ravine Basin of Westlake in Rainstorm Runoff. Huanjing Kexue 2016, 37, 141–147. [Google Scholar] [CrossRef]
  41. Bengül, R.; Nicodemus, U.; Rössler, O. The influence of specific external factors on an ADCP measurement. Wasserwirtschaft 2023, 113, 78–82. [Google Scholar] [CrossRef]
  42. Dillenburger-Keenan, J.; Miller, C.; Sellar, B. On the Performance of a Horizontally Mounted ADCP in an Energetic Tidal Environment for Floating Tidal Turbine Applications. Sensors 2024, 24, 4462. [Google Scholar] [CrossRef]
  43. You, A.; Hua, L.; Han, Z.; Zhang, J. Field observation and simulation study of three-dimensional flows in West Lake, Hangzhou. J. Hydroelectr. Eng. 2017, 36, 111–120. [Google Scholar] [CrossRef]
  44. Zhu, J.; Han, Z. Response of Total Phosphorus Concentration to Water Diversion Allocation in West Lake. J. China Hydrol. 2013, 33, 34–38. [Google Scholar] [CrossRef]
  45. Xia, X.; Cao, F.; Lou, Z. A Study on the Numerical Simulation of Flow Field in West Lake in Response to Diversion Works. Shanghai Environ. Sci. 2008, 27, 99–103, 128. [Google Scholar]
  46. Hu, R.; Xu, W.; Yan, W.; Wu, T.; He, X.; Cheng, N. Comparison between Machine-Learning-Based Turbidity Models Developed for Different Lake Zones in a Large Shallow Lake. Water 2023, 15, 387. [Google Scholar] [CrossRef]
  47. Zhang, Y.; Shi, K.; Sun, X.; Zhang, Y.; Li, N.; Wang, W.; Zhou, Y.; Zhi, W.; Liu, M.; Li, Y.; et al. Improving remote sensing estimation of Secchi disk depth for global lakes and reservoirs using machine learning methods. Gisci. Remote Sens. 2022, 59, 1367–1383. [Google Scholar] [CrossRef]
  48. Sun, B.; Wang, G.; Chen, W.; Li, W.; Kong, F.; Li, N.; Liu, Y.; Gao, X. Integrated modeling framework to evaluate the impacts of multi-source water replenishment on lacustrine phytoplankton communities. J. Hydrol. 2022, 612, 128272. [Google Scholar] [CrossRef]
  49. Huang, A.; Liu, X.; Dong, F.; Peng, W.; Ma, B.; Han, Z.; Yang, X. Long-term variations in hydraulic residence time of floodplain lakes and their response to water conservancy projects. Ecol. Indic. 2024, 169, 112778. [Google Scholar] [CrossRef]
  50. Gilboa, Y.; Friedler, E.; Talhami, F.; Gal, G. A novel approach for accurate quantification of lake residence time—Lake Kinneret as a case study. Water Res. X 2022, 16, 100149. [Google Scholar] [CrossRef]
  51. Luo, Q.; Zhu, L.; Li, D.; Zu, Z.; Chen, K.; Wang, J.; Yi, Y. Role of hydraulic residence time in shaping phytoplankton community assembly in the upper yellow river cascade reservoirs. Front. Environ. Sci. 2025, 13, 1551988. [Google Scholar] [CrossRef]
  52. Wu, M.; Xu, G.; Zhang, Y.; Lin, L.; Sun, Q. Tracer movement and residence time distribution simulation: An initiative to improve the wetland water environment in the Helan Mountain impact plain. Ecol. Inform. 2024, 82, 102682. [Google Scholar] [CrossRef]
  53. Zhang, S.; He, H.; Zhang, B.; Zhang, L. Water exchange and pollutant diffusion law in Gangnan reservoir. Alex. Eng. J. 2022, 61, 12259–12269. [Google Scholar] [CrossRef]
  54. MacCready, P.; McCabe, R.M.; Siedlecki, S.A.; Lorenz, M.; Giddings, S.N.; Bos, J.; Albertson, S.; Banas, N.S.; Garnier, S. Estuarine Circulation, Mixing, and Residence Times in the Salish Sea. J. Geophys. Res.-Ocean. 2021, 126, e2020JC016738. [Google Scholar] [CrossRef]
  55. Tian, Z.; Shi, J.; Liu, Y.; Wang, W.; Liu, C.; Li, F.; Shao, Y. Response of Sea Water Exchange Processes to Monsoons in Jiaozhou Bay, China. Sustainability 2023, 15, 15198. [Google Scholar] [CrossRef]
  56. Qian, T.; Chen, C.; Cheng, Y. The inter relationship between the ecological environment parameters in the West Lake of Hangzhou. Environ. Monit. China 2002, 18, 41–44. [Google Scholar] [CrossRef]
  57. Mao, C.; Yu, X.; Shao, X. Study on the Annual variations of TN and TP and the Eutrophication in Hangzhou West Lake. J. Hydroecol. 2010, 4, 1–7. [Google Scholar]
  58. Serra, T.; Font, E.; Soler, M.; Barcelona, A.; Colomer, J. Mean residence time of lagoons in shallow vegetated floodplains. Hydrol. Process. 2021, 35, e14065. [Google Scholar] [CrossRef]
  59. Zhao, F.; Zhan, X.; Xu, H.; Zhu, G.; Zou, W.; Zhu, M.; Kang, L.; Guo, Y.; Zhao, X.; Wang, Z.; et al. New insights into eutrophication management: Importance of temperature and water residence time. J. Environ. Sci. 2022, 111, 229–239. [Google Scholar] [CrossRef]
  60. Kim, J.; Seo, D.; Jones, J.R. Harmful algal bloom dynamics in a tidal river influenced by hydraulic control structures. Ecol. Model. 2022, 467, 109931. [Google Scholar] [CrossRef]
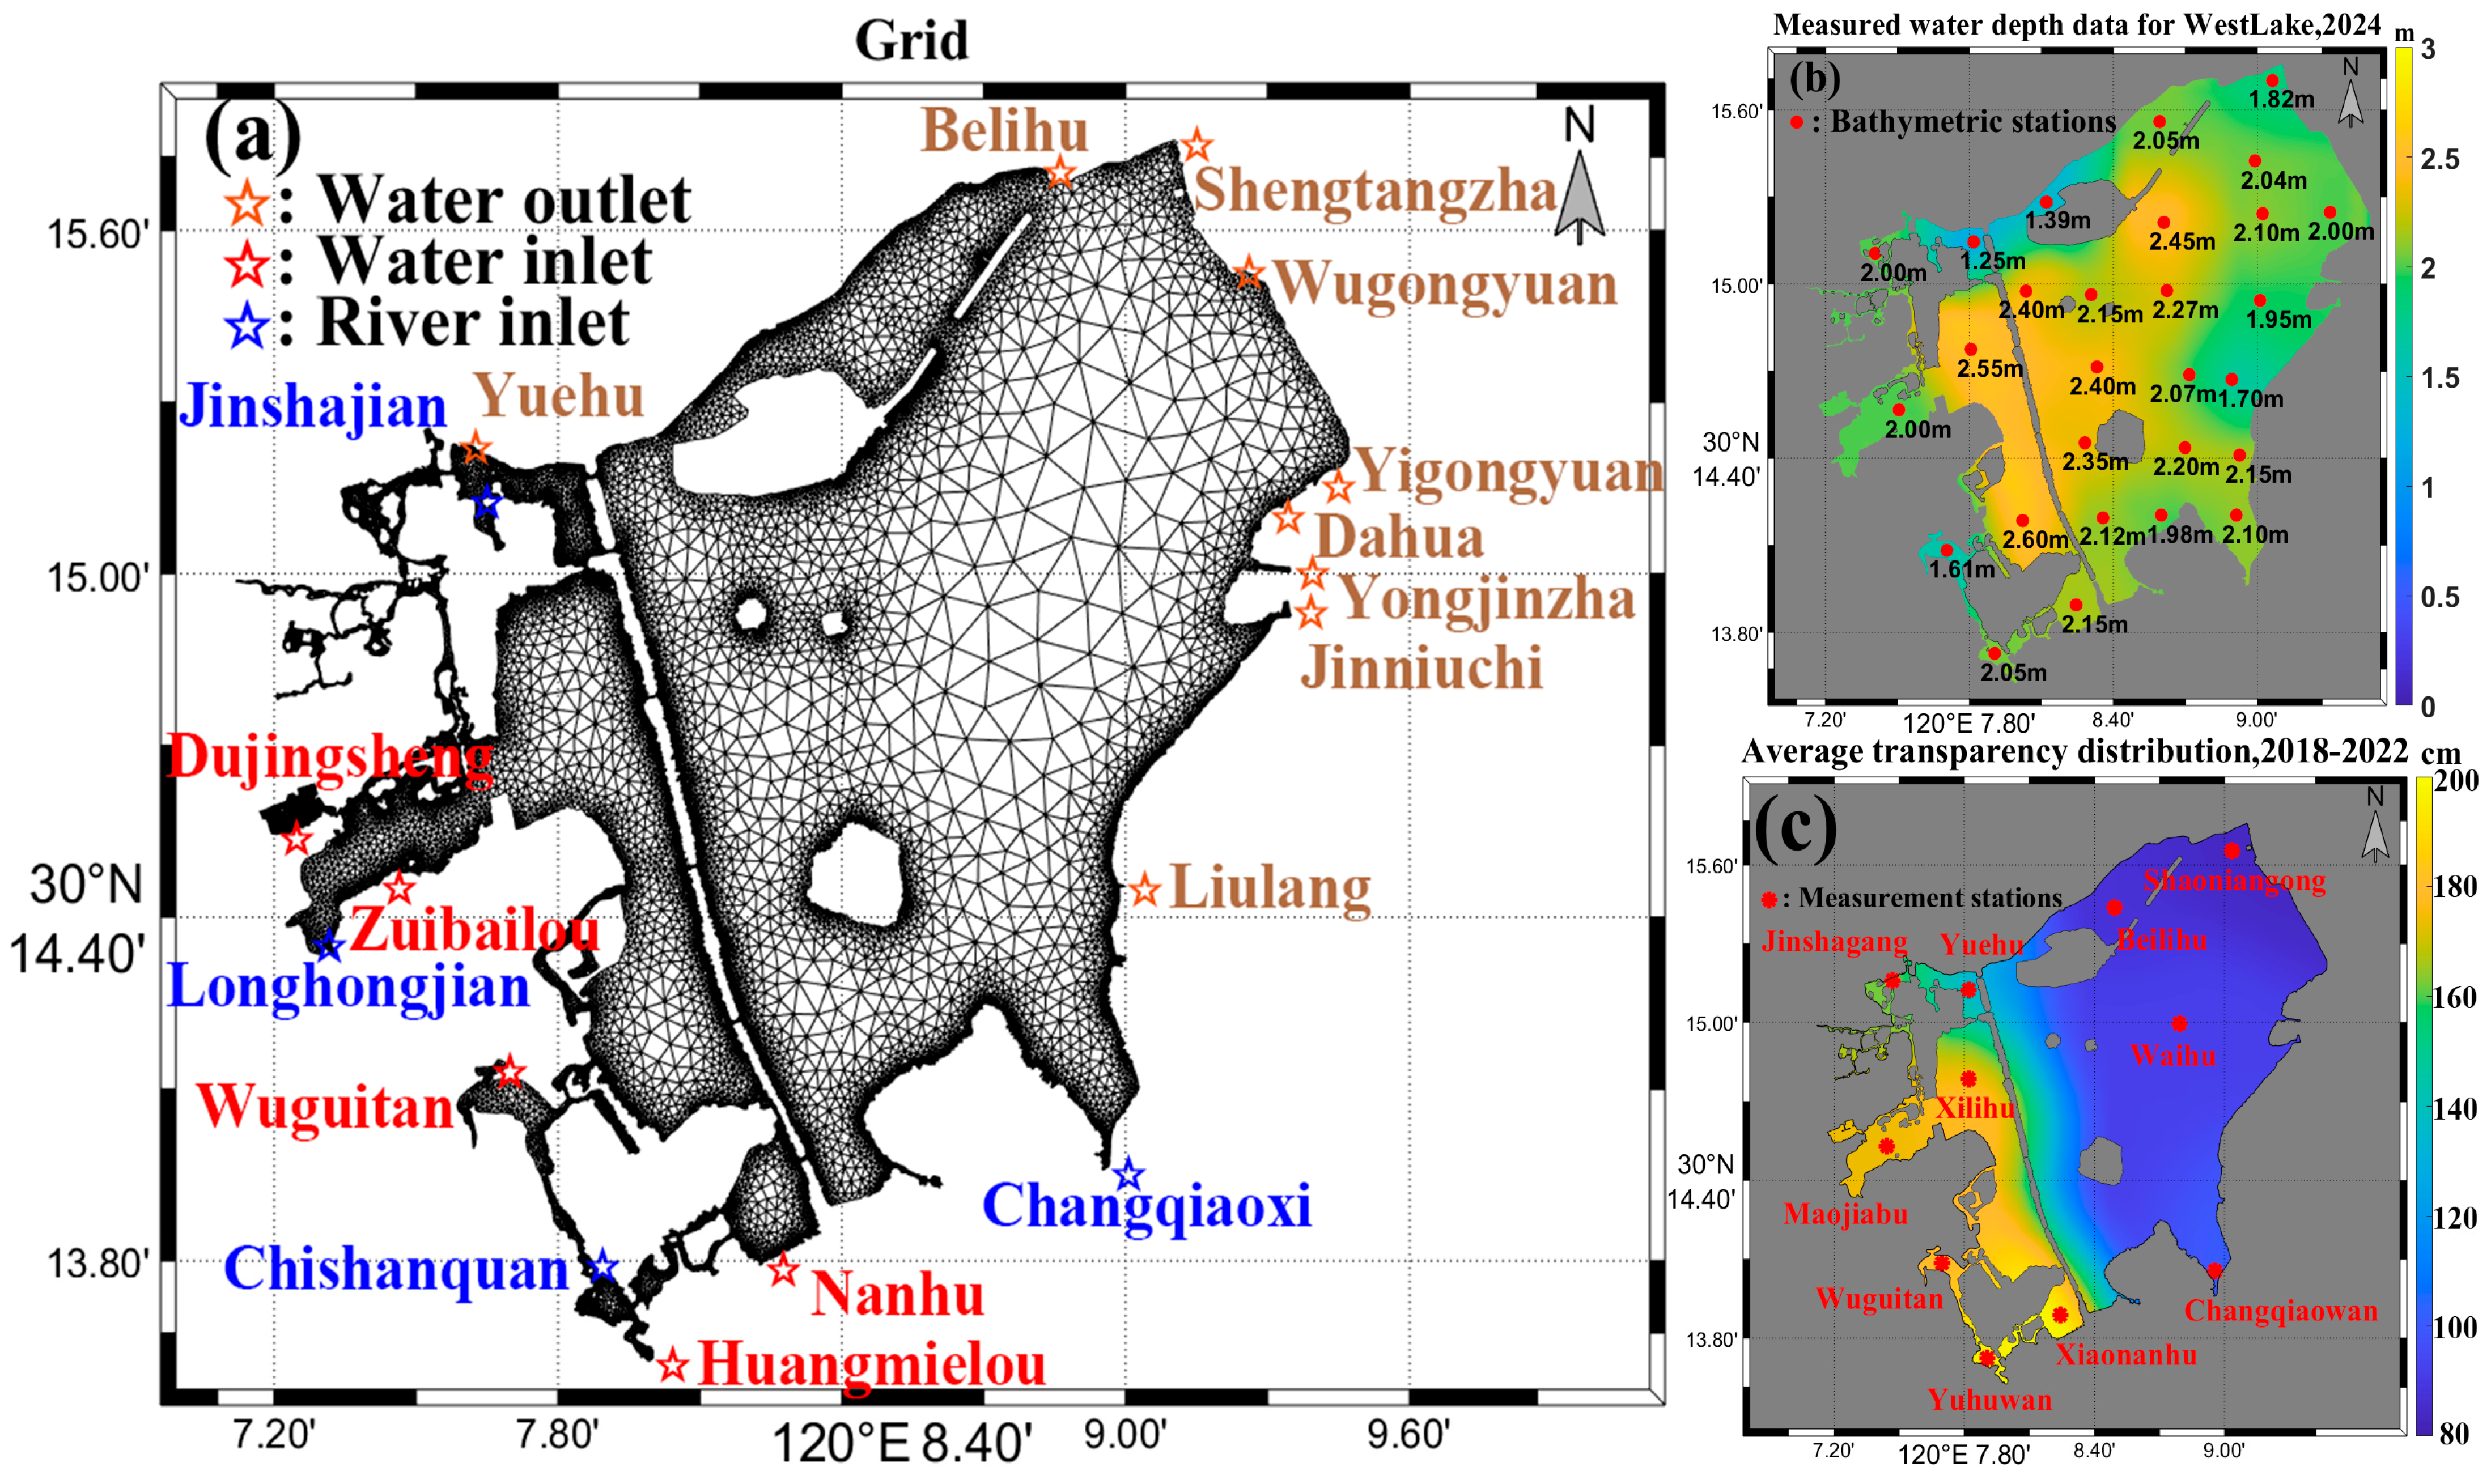
Figure 1. (a) Spatial relationship between drainage outlet, diversion inlet, river inputs and the model computational grid. (b) Field bathymetric stations in 2024, measured data, and interpolated depth data for hydrodynamic model. (c) Spatial distribution of average water transparency in West Lake from 2018 to 2022.
Water 17 02847 g001
Figure 2. (a) Monthly averaged water level measurements, derived water storage changes, statistically quantified net flux, and calculated uncounted inflow contributions for West Lake (January 2021–October 2024). (b) Daily averaged flow data (January 2021–October 2024) for West Lake’s water diversion inputs, drainage outputs, precipitation inputs, and estimated major runoff inflows. (cf) Average measured runoff across different precipitation ranges and precipitation-runoff linear regression results for West Lake’s four major influent rivers (Changqiaoxi, Chishanquan, Longhongjian, Jinshajian).
Water 17 02847 g002
Figure 3. (a) The 3-year average concentrations of Chla (x-axis) and SSs (y-axis) at 11 water quality monitoring stations. (b) The classification of 11 monitoring stations based on their geographical relationship to inlet and outlet channels. (c) Monthly variations in Chla and SS concentrations at poor water quality stations where SSs serve as the primary pollutant: Shaoniangong. (d) Monthly variations in Chla and SS concentrations at poor water quality stations where Chla serves as the primary pollutant: Beilihu, Waihu, and Changqiaowan. (e) Monthly variations in Chla and SS concentrations at moderate water quality stations where SSs serve as the primary pollutant: Yuehu. (f) Monthly variations in Chla and SS concentrations at moderate water quality stations where Chla serves as the primary pollutant: Xilihu, Maojiabu, and Jinshagang. (g) Monthly variations in Chla and SS concentrations at high water quality stations: Xiaonanhu, Yuhuwan and Wuguitan.
Water 17 02847 g003
Figure 4. The composition of water quality (hydrodynamic) elements in the 4 training datasets (yellow: element included in the training set, blue: element excluded from the training set).
Water 17 02847 g004
Figure 5. (ac) Time series of drainage flow rates at 3 typical outlets under 3 different simulation conditions. (d) Time series of diversion flow rates at Nanhu inlet under 3 simulation conditions. (e,f) Time series of runoff inflow from 2 typical rivers under 3 simulation conditions, where condition 1 (black dashed line) excludes runoff contributions. The blue bars represent flow rates at all inlet/outlet under the design scheme.
Water 17 02847 g005
Figure 6. The distribution of simulated flow velocity/direction results and the location of flow velocity monitoring stations in West Lake on (a) Case 1, 23 August 2013; (b) Case 1, 13 September 2013; (c) Case 2, 23 August 2013; (d) Case 2, 13 September 2013. Comparison of observed versus simulated flow velocity at 9 monitoring stations on (e) 23 August 2013; (f) 13 September 2013.
Water 17 02847 g006
Figure 7. The spatial distributions of West Lake’s 2022 annual average (a) water transparency, (b) flow velocity, (c) CWRT, and (d) LWRT. In panels (c,d), both the CWRT and LWRT indices show a negative correlation with the water flux at the boundary of study regions. Lower values indicate higher water exchange rates in the corresponding regions. Yellow areas in the figure represent the lowest flow velocity, while blue areas indicate the highest velocity.
Water 17 02847 g007
Figure 8. The monthly averaged data of (a) water transparency, (b) flow velocity, (c) CWRT, and (d) LWRT at 11 stations during 2022.
Water 17 02847 g008
Figure 9. The Spearman correlation coefficients and linear fitting results between water transparency and (a) T, (b) DO, (c) pH, (d) CODMn, (e) SS, (f) alkalinity, (g) TH, (h) TP, (i) SRP, (j) TN, (k) AN, (l) NO2, (m) NO3, (n) SO42−, (o) Cl, (p) F, (q) Chla, (r) flow velocity, (s) CWRT, and (t) LWRT for all samples. The black dashed line represents the linear fitting result between the element on the x-axis and transparency. The purple scatter points and text indicate a Spearman’s test significance of p < 0.01, the blue scatter points and text indicate a Spearman’s test significance of p < 0.05, and the red scatter points and text indicate a Spearman’s test significance of p > 0.05.
Water 17 02847 g009
Figure 10. A comparison between measured transparency values and predicted transparency results from the RF algorithm trained on (a1,a2) training set 1, (b1,b2) training set 2, (c1,c2) training set 3, (d1,d2) training set 4. The mean value and 90% confidence interval of each feature importance in the RF algorithm obtained using the bootstrap sampling method for (a3) training set 1, (b3) training set 2, (c3) training set 3, (d3) training set 4.
Water 17 02847 g010
Figure 11. The variation in water transparency with decreasing LWRT at (a) Shaoniangong station under August water quality conditions. (b) Waihu station under September water quality conditions. (c) Yuehu station under November water quality conditions. (d) Jinshagang station under August water quality conditions. (e) Maojiabu station under August water quality conditions. (f) Xilihu station under August water quality conditions. (g) Xiaonanhu station under February water quality conditions. (h) Yuhuwan station under January water quality conditions. The black numbers above the curve represent the transparency change values for the corresponding intervals. The red numbers below the curve represent the LWRT values corresponding to the top 4 transparency change gradients.
Water 17 02847 g011
Disclaimer/Publisher’s Note: The statements, opinions and data contained in all publications are solely those of the individual author(s) and contributor(s) and not of MDPI and/or the editor(s). MDPI and/or the editor(s) disclaim responsibility for any injury to people or property resulting from any ideas, methods, instructions or products referred to in the content.