Abstract
This study examined the habitat suitability of Kentucky bluegrass (Poa pratensis L.) in Iran’s Fars province, a region characterized by diverse climatic conditions and significant ecological challenges. Utilizing a multi-technique approach that included species distribution models (SDMs) based on machine learning algorithms, geographic information systems (GIS), and remote sensing, we analyzed environmental factors such as climate variables, soil properties, and water availability to understand their influence on habitat suitability. The results indicated that Kentucky bluegrass shows a strong preference for areas near water sources, and its distribution is significantly affected by soil salinity and texture. Among the models tested, Random Forest (RF) and Support Vector Machines (SVMs) demonstrated the highest predictive accuracy. Based on the RF model, the most suitable habitats were identified in the counties of Sepidan, Beyza, Bavanat, Pasargad, and Abadeh. At the same time, areas with lower suitability included Eqlid, Marvdasht, Zarghan, and Arsanjan. Although this study primarily focused on current distribution patterns, the findings provide important insights into the ecological preferences and adaptive capacities of Kentucky bluegrass. These insights are essential for the development of targeted conservation strategies in transitional climate zones. Future studies are recommended to explore the species’ response to future climate scenarios, enhancing its resilience against global climate change.
1. Introduction
Poa pratensis L. (Kentucky bluegrass) is a hardy, cool-season turfgrass species in the Poaceae family, valued for its durability, aesthetics, and forage quality. It is the most agriculturally significant species within its genus and plays a key role in turf management and livestock feed production [1,2,3,4,5].
Iran is a center of origin and diversity for many important plant species, encompassing about 5% of all Poaceae species, notably P. pratensis [6,7]. Natural genotypes of this species occur in riparian areas throughout the country. However, climate change and other environmental pressures threaten its habitat and genetic diversity [2].
Fars province marks the southernmost natural habitat of P. pratensis in Iran and is situated within an ecological transition zone (ecotone) between temperate and subtropical climates. The region experiences diverse climatic conditions—from cold semi-arid (e.g., Shiraz) to hot desert zones (e.g., Larestan)—making it highly vulnerable to climate change, especially rising temperatures and prolonged droughts [8,9,10].
Plant species, due to their sessile nature, are more susceptible to climate-induced changes than mobile organisms [11,12]. Previous studies have reported that climate change has already caused significant shifts in species ranges globally [13], and the structure of grassland ecosystems—including species like P. pratensis—is expected to be altered under future warming [14,15]. These changes emphasize the importance of understanding ecological preferences and environmental limits of key species through robust predictive models.
While several studies have utilized species distribution models (SDMs) to predict the habitat of grass species [16,17], limited research has been conducted in Iran, particularly in ecologically transitional zones like Fars province. Moreover, most previous modeling efforts have relied on traditional GIS-based multicriteria analysis, which lacks the predictive power and adaptability of modern machine learning approaches [18,19,20]. There is a clear gap in applying advanced SDMs combined with machine learning to evaluate the habitat suitability and adaptive capacity of P. pratensis under current environmental stressors.
Recent ecological modeling studies have shown that machine learning (ML) techniques are particularly successful for habitat suitability modeling (HSM) of plant species [21,22,23,24]. One important advantage of machine learning-based habitat suitability models is their capacity to represent detailed nonlinear interactions, resolve multicollinearity across variables, and give beneficial predictive accuracy in the context of complex ecological datasets [25]. This study included six machine learning algorithms: Boosted Regression Trees (BRT), Flexible Discriminant Analysis (FDA), Generalized Linear Models (GLM), Mixture Discriminant Analysis (MDA), Support Vector Machines (SVMs), and Random Forest (RF).
RF has been valued for its robustness against overfitting and capacity to handle high-dimensional, noisy ecological data, particularly in models like Ferula gummosa [26], and Salvia leriifolia [27]. SVM, a sophisticated kernel-based technique that creates ideal hyperplanes for classification, demonstrated good predictive accuracy in a habitat suitability study for Silybum marianum [28].
BRT, which integrates regression trees and boosting algorithms, has proven particularly beneficial in ecological research with nonlinear variable interactions. Its successful application is demonstrated by research on Teucrium polium and other endemic species in the arid zone [29]. GLM, a foundational statistical model, is frequently utilized for binary classification tasks in species presence–absence modeling. A comprehensive review by Austin (2007) emphasizes the suitability of logistic regression (a form of GLM) for presence–absence data and interpretability [30].
More specialized models, such as FDA, which expands linear discriminant analysis through nonlinear transformations, and MDA, which employs mixture models using the Expectation–Maximization (EM) method, have also been successfully used in plant habitat research. Their utility is proven in research such as Mohammady et al. (2021) [26], which utilized FDA and MDA to simulate the habitat suitability of Ferula gummosa across multiple ecological gradients.
Therefore, this study aims to address this knowledge gap by applying a set of advanced machine learning algorithms to model the current habitat suitability of P. pratensis in Fars province. This region serves as a critical ecological boundary and a valuable genetic reservoir for the species. The results will support conservation planning, germplasm management, and sustainable utilization of this species under current and future climate pressures.
The specific objectives of this study are to
- Identify key environmental variables influencing the habitat suitability of P. pratensis in Fars province.
- Compare the performance of six machine learning algorithms (RF, SVM, BRT, MDA, FDA, GLM) in modeling habitat suitability.
- Map the current distribution of suitable habitats and identify priority areas for conservation and management.
2. Materials and Methods
2.1. Study Area
The research area is in Iran’s southwest, in the province of Fars. The research region, which has a surface area of 32,180 km2, is situated between latitudes 30°12′53.81″ and 31°21′50.81″ N and longitudes 51°17′20.11″ and 54°52′51.72″ E. The study was conducted in Fars Province, located in the southwest of Iran. P. pratensis is exclusively present in the Fars Province’s northern areas, which include Shiraz, Kazerun, Sepidan, Bayza, Eqlid, Abadeh, Marvdasht, Saadat Shahr, Qaderabad, Safashahr, Pasargad, Kamfirouz, Arsanjan, and Bavanat (Figure 1).
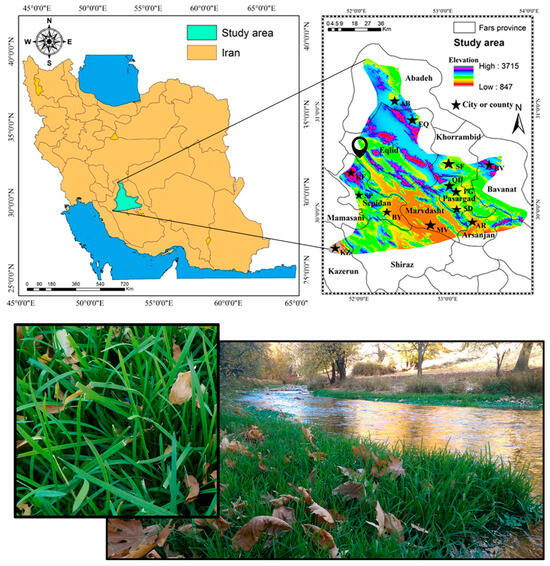
Figure 1.
The study area of suitability habitat modeling of P. pratensis L. in Fars province. The picture was taken in Behraghan, Sepidan (pinned on the map). The codes used are as follows: KZ (Kazerun), SP (Sepidan), BY (Bayza), EQ (Eqlid), AB (Abadeh), MV (Marvdasht), SD (Saadat Shahr), QD (Qaderabad), SF (Safashahr), PG (Pasargad), KF (Kamfirouz), AR (Arsanjan), and BV (Bavanat).
2.2. Kentucky Bluegrass Data
To model the habitat suitability of Kentucky bluegrass in the ecotone zones of Fars Province, a total of 140 presence points were used. These presence data were collected through field observations conducted during the active growing season. The sampling approach was random, and points were recorded only in locations where the presence of the species was confirmed visually. Each location was georeferenced using a GPS device with point format (latitude and longitude), providing spatial accuracy suitable for fine-scale ecological modeling. The sampling sites were primarily distributed near riverbanks, springs, and other moist habitats, reflecting the species’ natural ecological preferences within Fars Province. These areas span various climatic zones and elevations across the region.
All presence data were compiled in the WGS 1984 coordinate reference system and prepared for integration into Geographic Information System (GIS) software (Version: 10.5) for spatial analysis. The dataset formed the foundational input for species distribution modeling, and pseudo-absence points were later generated for modeling algorithms that require both presence and absence data [31]. A spatial representation of the collected occurrence records is provided in Supplementary S1.
2.3. Environmental Variables
To model the species distribution of P. pratensis in the ecotone zones of Fars Province, Iran, a set of 13 environmental variables was selected based on their ecological relevance and availability of reliable data (Supplementary S2). These variables include topographical, climatic, edaphic (soil-related), and anthropogenic factors, which are commonly used in species distribution modeling [32]. A summarized representation of the methodology and analytical workflow adopted in this study is provided in Figure 2.
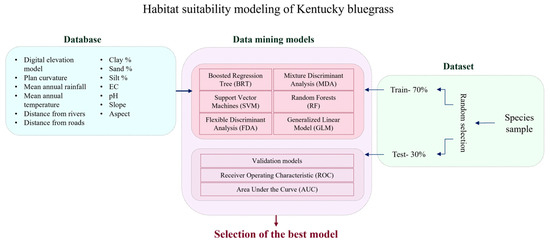
Figure 2.
Flowchart for the methodology used in the present study.
Topographic variables (Elevation, Slope, Aspect, and Plan Curvature) were derived from the Advanced Spaceborne Thermal Emission and Reflection Radiometer (ASTER) Digital Elevation Model (DEM) with a 30-m spatial resolution. The DEM was processed using ArcGIS 10.2.2 to generate slope and aspect maps. Plan curvature, a secondary terrain attribute that influences water accumulation and drainage, was also derived from the DEM using ArcGIS spatial analyst tools [21].
Soil samples were collected from the study region at each of the 140 occurrence sites. Soil Texture (Sand, Silt, Clay proportions), pH, and Electrical Conductivity (EC) were determined using the hydrometer method [33], while pH and EC were measured using standard pH meters and conductivity meters, respectively [34]. IDW was selected as a deterministic and transparent method suitable for irregular and sparse datasets, especially in mountainous areas. It has been effectively used in similar ecological and phytogeographic studies where probabilistic models were not feasible [35,36].
Climatic data (mean annual temperature and mean annual rainfall) were obtained from 25 meteorological synoptic stations in Fars Province, based on long-term weather records (5 years). Using IDW interpolation in ArcGIS, continuous maps of mean annual rainfall and temperature were produced for the study area. These variables are essential as they directly affect plant growth and survival [37].
Distance from rivers and distance from roads were calculated from a 1:50,000 topographic map using ArcGIS distance analysis tools. Proximity to water sources (rivers) is particularly important for P. pratensis due to its water-dependent nature, while distance from roads serves as a proxy for anthropogenic influence and potential habitat disturbance [21].
Thirteen environmental layers were resampled to a uniform resolution of 30 m and converted to raster format for integration into the modeling process (Supplementary S3). This harmonization ensured compatibility across variables and improved the reliability of spatial predictions.
2.4. Effective Variable Collinearity Test
To quantify the degrees of multicollinearity of the i-th independent factor with the other independent factors in a regression model, the variance inflation factor (VIF) and tolerance are both extensively employed. Tolerances of less than 0.20 or 0.10, and/or VIF of 5 or 10 and above generally suggest multicollinearity problems. Since VIF and tolerance are mathematical reciprocals of each other, these two indicators tend to flag multicollinearity simultaneously [38].
2.5. Models Used for the Habitat Suitability of Kentucky Bluegrass
To assess Poa pratensis habitat suitability, six renowned machine learning and statistical models were utilized, each chosen for their proven usefulness in plant species distribution modeling and habitat suitability analysis. These models use a combination of linear, nonlinear, ensemble, and kernel-based strategies to enhance prediction robustness and ecological interpretation.
2.5.1. BRT Model
Boosted Regression Tree (BRT) is an ensemble technique that sequentially fits decision trees to previous iteration residuals, increasing model accuracy through boosting. It successfully captures nonlinear connections, manages outliers and multicollinearity, and is particularly ideal for ecological data with complicated patterns [39].
2.5.2. FDA Model
Flexible Discriminant Analysis (FDA) expands linear discriminant analysis to allow for nonlinear interactions, strengthening classification accuracy in complex ecological conditions [40].
2.5.3. GLM
Generalized Linear Models (GLMs), particularly logistic regression, are essential in species distribution modeling because they estimate binary outcomes such as presence–absence. Their interpretability, statistical rigor, and ability to simulate linear species–environment relationships make them extremely useful [32].
2.5.4. MDA Model
Mixture Discriminant Analysis (MDA) improves on standard discriminant analysis by corresponding to each class as a mixture of Gaussian distributions. It uses the Expectation-Maximization technique for classification and works well in ecological environments with multi-modal or overlapping class distributions [41]. MDA can represent both linear and nonlinear patterns in habitat classifications.
2.5.5. SVM Model
Support Vector Machines (SVMs) are supervised learning models that build optimally separated hyperplanes in high-dimensional feature spaces, making them robust to overfitting via the margin maximization principle and adjustable via kernel changes [42].
2.5.6. RF Model
Random Forest (RF) is an ensemble classification method that builds numerous decision trees from bootstrap samples and random predictor subsets. It is resistant to overfitting, is capable of handling nonlinear and complex interactions, and ranks variable importance effectively [43]. Because of its great prediction accuracy, RF has been frequently used in ecological modeling for a variety of plant species.
2.6. Model Processing
A binary approach was utilized in the modeling process, meaning that “0” indicated species absence and “1” indicated species presence. Seventy percent of the data were used for model training, consisting of 70% presence records (1) from the observed sites and an equal proportion of absence data (0). These two datasets were then merged and used in the modeling process. Each of the above-mentioned six models was applied to produce a map of Kentucky bluegrass SDM. The R program version 3.5.3 was used, together with several specialized packages, to execute each of the models. BRT (https://cran.r-project.org/package=gbm), FDA (https://cran.r-project.org/package=mda), MDA (https://cran.r-project.org/package=mda), GLM (https://stat.ethz.ch/R-manual/R-devel/library/stats/html/glm.html), RF (https://cran.r-project.org/package=randomForest), and SVM (https://cran.r-project.org/package=e1071) packages were utilized, and the models were run by R version 3.5.3 (https://cran-archive.r-project.org/bin/windows/base/old/3.5.3/; all URLs accessed on 7 November 2024).
To facilitate an accurate interpretation of Kentucky bluegrass habitat suitability across the study area, the final habitat suitability maps generated by the predictive models were classified into four distinct categories: very low, low, moderate, and high suitability [44]. For this purpose, the Natural Breaks (Jenks) optimization method, implemented within the GIS software (version10.5) environment, was applied.
The Natural Breaks method is a statistically robust classification algorithm designed to minimize intra-class variance while maximizing inter-class variance [45]. Unlike arbitrary or equal-interval classifications, which may artificially distribute data ranges, the Natural Breaks algorithm identifies inherent patterns and natural groupings within the dataset. It works by iteratively optimizing class boundaries to reduce the sum of squared deviations within each class, ensuring that each category reflects meaningful ecological thresholds and spatial differentiation based on the distribution of habitat suitability (HS) values [46]. This approach is particularly suitable for environmental modeling outputs, where suitability scores are rarely uniformly distributed and often exhibit skewness or clustering around specific value ranges [47].
This methodological choice ensures ecological relevance, statistical integrity, and usability of the final outputs for stakeholders involved in habitat conservation and sustainable landscape planning.
2.7. Variable Importance Measures
Variable importance measurements were employed to identify and analyze the most influential environmental factors. The Partial Least Squares (PLS) algorithm was utilized to address multicollinearity issues among predictors, efficiently extracting latent variables that best explain variance. GLM offered a flexible approach to modeling the habitat data, accommodating various distributions of response variables. Learning Vector Quantization (LVQ) provided a robust classification technique, essential for categorizing SDM based on a set of prototype vectors. The eXtreme Gradient Boosting (XGBoost) method was particularly valuable for its high-performance implementation of gradient-boosted decision trees, renowned for predictive accuracy and efficiency in handling sparse data. Lastly, the Boruta algorithm, a wrapper built around the Random Forest classification method, was used to ascertain the importance and relevance of variables, ensuring a comprehensive understanding of the factors contributing to the habitat suitability of P. pratensis. These methods were used exclusively to assess variable importance and were not employed for species distribution modeling. These methods collectively offered a robust framework for analyzing the complex interplay of variables influencing habitat conditions, ensuring a thorough and reliable assessment.
2.8. Precision of Models
The effectiveness of the models was assessed using the receiver ROC curve, which evaluates model accuracy using 30% of the original assessed sites reserved for validation. The curve, which displays two rates, contrasts the true positive rate with the false positive rate [48]. The model’s accuracy is demonstrated by the AUC, which can be classified as a measure of quality (Table 1).

Table 1.
The categories are represented in the ROC curve.
3. Result
3.1. Habitat Suitability of Kentucky Bluegrass Based on Machine Learning Models
Determining the correlations between independent parameters is an essential first step in determining habitat suitability in a given region [49,50]. The test used correlation, which indicated that if the VIF is less than 5 and the value of the tolerance, T, is not less than 0.1, then there is no correlation between the components, and the model can then be operated at its best [51]. Based on Table 2, there was no correlation between the parameters employed in the present investigation.
Table 2.
Correlations between factors.
Seventy percent of the data sets were utilized for training during the investigation and evaluation of models that led to the creation of the ultimate map. The appropriate R software (version 3.5.3) packages for each of the six models were then used to produce the final result. Then, the final habitat suitability maps for Kentucky bluegrass were classified into four categories using the natural breaks algorithm in GIS software to enable the most effective interpretation of the species’ habitat suitability across the study area. Based on the RF model, the counties with the highest adaptability of Kentucky bluegrass are Sepidan, Beyza, Pasargad, Bavanat, and Abadeh. All these results for the counties of Sepidan, Beyza, Bavanat, and Pasargad are also duplicated by the five other models. The performance of the results for the habitat suitability of this plant in Abadeh County by SVM and MDA models was fairly similar to RF (Figure 3). The habitat suitability of Kentucky bluegrass for Abadeeh County was moderate to high by FDA, GLM, and BRT. The analyzed models indicated that low and medium habitat suitability for Kentucky bluegrass existed in parts of the counties of Zarghan, Eqlid, west of Arsanjan, and a significant part of Marvdasht. The Eqlid, Morvdasht, Zarghan, Arsanjan, and portions of Shiraz counties have the plant’s lowest distribution rate. According to all the models that were examined, the Shiraz region exhibited a variation in habitat suitability from low in the southwest to very high in the north (Figure 3).
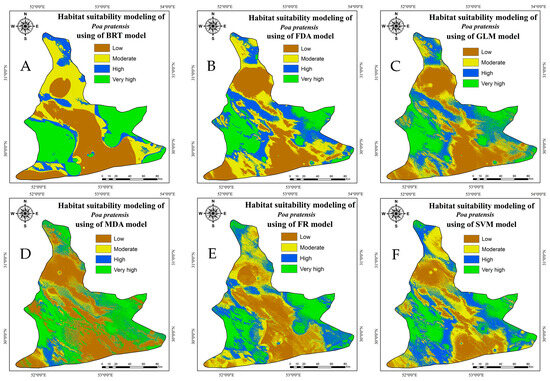
Figure 3.
Maps of Kentucky bluegrass habitat suitability using different models: BRT (A), FDA (B), GLM (C), MDA (D), RF (E), and SVM (F).
The results from the various models applied to assess the SDM of Kentucky bluegrass (P. pratensis) demonstrate distinct patterns in categorizing suitability levels. The GLM indicated a higher prevalence of low (32.54%) and very high (19.09%) suitability areas, suggesting its effectiveness in distinguishing extreme habitat conditions (Figure 3 & Table 3). The FDA and MDA showed a propensity towards categorizing areas having very high suitability, with MDA highlighting 28.22% of the area as such, underscoring its sensitivity to optimal habitat conditions. The BRT model depicted a balanced distribution across different suitability levels, with a notable focus on very high suitability areas (28.69%). In contrast, the SVM excelled in identifying high (29.46%) and moderate (29.71%) suitability areas, indicating its robustness in recognizing habitats with variable suitability levels. Lastly, the RF model presented a more uniform distribution across suitability levels, particularly identifying moderate (28.28%) and high (24.94%) suitability areas, showcasing its comprehensive assessment capability (Figure 3 & Table 3).
Table 3.
Comparative analysis of habitat suitability for Kentucky bluegrass (P. pratensis) using various models.
3.2. Variable Importance Analysis
The variable importance plots from the models show which factors most affect the SDM for P. pratensis. Proximity to rivers is consistently highlighted as highly important across algorithms like PLS, GLM, and LVQ, emphasizing the species’ preference for habitats near water sources (Figure 4). The PLS algorithm shows a balanced importance across several variables, with ‘river’ being the most significant, but with a lower overall importance score compared to other models, suggesting a more nuanced influence of the predictors. XGBoost assigns significant importance to ‘silt,’ highlighting the soil texture’s role. In the Boruta results (Figure 4), the plot shows ‘river’ and ‘EC’ as the two most important factors, significantly higher than ‘shadowMax’. This indicates that these variables are likely to have a real impact on the habitat suitability of P. pratensis, with river proximity being the most influential. Other variables like ‘road’ and ‘silt’ also surpass the ‘shadowMax’ threshold, suggesting their relevance in determining habitat quality.
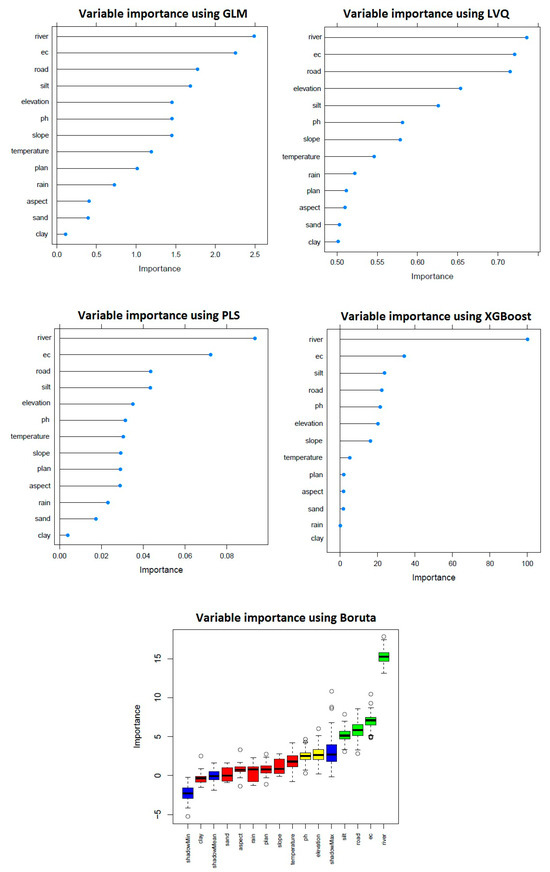
Figure 4.
Importance of different factors using the GLM, LVQ, PLS, XGBoost, and Boruta models for Kentucky bluegrass (P. pratensis).
3.3. Model Accuracy Assessment
The ROC curve depicts the performance of several models in classifying SDM for Kentucky bluegrass. Based on Figure 5 and Table 4, the AUC values indicate that the Random Forest (RF) model performs best with an AUC of 0.889, suggesting a high degree of accuracy. The SVM also shows strong performance, with an AUC of 0.822. Lower AUC values for MDA, GLM, FDA, and BRT indicate relatively lower performance but are still above the threshold of 0.5, meaning they are better than random chance. The confidence intervals provided by AUC for each model give a statistical range in which the true AUC value is likely to fall.
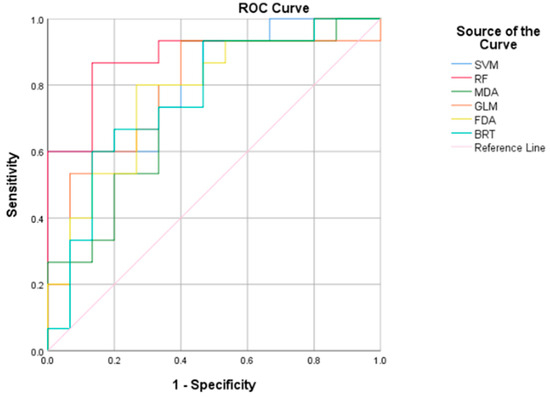
Figure 5.
ROC curves of habitat suitability models for Kentucky bluegrass (P. pratensis).
Table 4.
AUC Statistics for Habitat Suitability Models of P. pratensis.
4. Discussion
In our study, the habitat suitability of Kentucky bluegrass in Fars province, Iran, as a transitional ecotone, as derived from machine learning models, underscores the species’ environmental adaptability and preferences. The initial correlation tests confirm the absence of multicollinearity among the independent variables, paving the way for an accurate assessment of SDM. The models, using 70% of the data for training, reveal that Kentucky bluegrass exhibits high adaptability in specific regions like Sepidan, Beyza, Pasargad, Bavanat, and Abadeh. The consensus among various models, particularly RF, SVM, and MDA, affirms the robustness of these findings. However, the distribution of P. pratensis exhibits a gradient, with lower suitability noted in regions like Zarghan and Eqlid, contrasting with higher suitability in northern Shiraz.
While the RF model had the highest AUC (0.889), indicating strong predictive performance, its assessment of habitat suitability was quite consistent, which might mask subtle biological gradients. This tendency was also seen in modeling studies of Ferula gummosa and Salvia leriifolia, where RF generated strong general accuracy despite smoothing fine-scale spatial variability [26,27]. In comparison, the SVM model exhibited better habitat delineations, capturing distinct appropriate zones more precisely, although having a slightly lower AUC (0.822). This ability originates from its kernel-based architecture, which excels at modeling nonlinear interactions. Consistent with our findings, an earlier habitat suitability study of Juniperus species in the Zagros Mountains found that SVM (AUC = 0.735) presented more geographically refined suitability outputs than MaxEnt (AUC = 0.728) [20].
GLM, with a moderate AUC of 0.787, exhibited good interpretability, making it beneficial in finding major environmental variables of species occurrence. Its flexibility promotes ecological comprehension, as evidenced by Rahmanian et al.’s (2022) modeling of Teucrium polium [29]. However, GLM’s assumption of linear relationships may underperform in ecologically complex systems when compared to more adaptable techniques such as ensemble models.
The FDA and MDA classified almost 28% of the study region as ‘very high suitability’ compared to GLM’s ~19%. This significant disparity demonstrates an overclassification tendency, which could be caused by overfitting in areas with clustered species or high predictor collinearity. Similar concerns regarding the overfitting potential of complicated discriminant models have been noted in vegetation classification studies [52] and statistical analyses of modeling complexity.
BRT, with an AUC of 0.764 in our study, was especially effective at detecting complex interactions between predictors. Its capacity to describe nonlinear responses and threshold effects makes it especially beneficial in ecological landscapes where species-environment relationships might quickly shift. However, careful tuning is needed to prevent overfitting, particularly for parameters such as learning rate, tree complexity, and number of trees. Dastres et al. (2025) [25], used BRT to estimate the habitat suitability of Avena fatua (wild oat) in canola fields and achieved a high predictive accuracy (97%), demonstrating its potential when calibrated properly.
Overall, the model comparisons demonstrate the advantages of adopting a multi-algorithm ensemble strategy. While RF and SVM offered the highest predictive accuracy and spatial resolution, GLM improved ecological interpretability, while BRT identified significant predictor relationships. FDA and MDA, although more susceptible to sample and model assumptions, provided complementary classification perspectives. These model-specific strengths and limitations provide a better understanding of Poa pratensis distribution and practical suggestions for habitat management and conservation in changing environments.
The predictive models highlight the relevance of certain environmental factors, particularly the proximity to rivers, indicating the species’ preference for water-rich habitats. The PLS and XGBoost algorithms emphasize the relative importance of various variables and the role of soil texture, respectively. The Boruta results further reinforce the importance of ‘river’ and ‘EC’ in influencing habitat suitability.
Gilbert & Fraser (2013) explained that as salinity increased, there was a significant reduction in the dry biomass of P. pratensis, with greater effects observed at higher salinity levels [53]. This suggests that increased soil salinity could negatively impact the distribution and abundance of P. pratensis in natural habitats and agricultural settings [53]. Moreover, it is reported that salinity stress resulted in the loss of nitrogen and calcium in P. pratensis, with chloride and sodium accumulation in leaves. The stress reduced plant shoot and root weight, height, and the number of tillers [54]. Since electrical conductivity is a measure used to estimate the salinity of soil or water, it is known to limit the growth and spread of this species in this area. Also, the molecular response of Kentucky Bluegrass to drought stress indicates how the species responds to and potentially prefers environments with sufficient water availability to avoid stress conditions [55]. Our results strongly suggest that Kentucky bluegrass habitat tends to be limited around water sources like rivers.
While Kentucky bluegrass has been identified as an invasive species in parts of North America, particularly the Northern Great Plains, as a consequence of climate-induced changes, such as a 12-day extension in the growing season over the last 120 years [3], our findings point to a different ecological challenge in Fars Province. In this transitional arid and semi-arid region, the growth of P. pratensis appears to be creating ecological instability, potentially outcompeting native warm-season grasses like bermudagrass. In contrast to temperate prairies, the climatic stress and resource limits in Fars make the unrestrained development of Kentucky bluegrass a risk to native biodiversity and ecosystem function [56].
The ROC curve analysis, particularly the AUC values for RF and SVM, confirmed the model’s excellent performance. According to accepted standards, AUC values of 0.9–1 are excellent, 0.8–0.9 good, and 0.7–0.8 fair [57,58]. In the present study, RF (AUC = 0.889) had outstanding accuracy, while SVM and GLM also performed well. These findings verify the predictive reliability of our models for SDM applications. These findings collectively offer a detailed understanding of the ecological dynamics and environmental preferences of Kentucky bluegrass, as interpreted by advanced machine learning techniques. To establish breakpoints between classes, which led to the creation of new natural divisions, breakpoints between classes were determined using the principles of the natural break approach, which identifies particular variations in values [59].
In contrast to the traditional percentile or deviation methods, the approach of natural breaks relies heavily on variations in the set of data to create classes rather than on artificial criteria [19]. SDMs are frequently utilized to find optimal habitats for valuable, rare, and endangered plant species by integrating environmental predictors and spatial occurrence data. Their main use is in guiding conservation priorities and understanding species-environment interactions under changing ecological conditions [60,61]. It is also underlined that SDM delivers highly accurate forecasts concerning protected plants because climate change has highly detrimental consequences on plant growth and development [62]. Binary classification measurements, such as true positive rate, false positive rate, sensitivity, and specificity, are frequently utilized to evaluate model efficiency in SDMs. These thresholds translate continuous suitability data into discrete categories (for example, presence/absence), allowing for accurate model evaluation and performance comparison [63].
According to the natural break method, we divided the maps into four groups (low, moderate, high, and very high) to get a clear characterization of the habitat appropriateness for Kentucky bluegrass in the research region [64,65]. Finding the ideal location for Kentucky bluegrass is made easier with the aid of this categorization. Maps of SDM display the widespread distribution of Kentucky bluegrass in various regions.
Environmental variables play a crucial role in the modeling process. Machine learning techniques can be employed to sift through complex environmental data to identify key environmental factors shaping the distribution of endangered species [66]. Selecting the appropriate predictors is vital in assessing the habitat suitability for the species [67].
The benefits of predictive modeling encompass the identification of species distribution across different terrains to pinpoint areas suitable for species reintroduction or recovery, along with potential undiscovered locations for the research and management of rare species. Additionally, it facilitates the examination of environmental variables influencing plant distribution [26]. The native genotypes of Kentucky bluegrass should thus be protected by conservation measures. The formation of germplasm conservation initiatives, as well as the introduction of new species, may be guided by habitat distribution modeling [16].
Ecotones are particularly sensitive to climate change. In such areas, machine learning-based SDM approaches can pinpoint optimal conservation areas, ensuring the survival of valuable genotypes of Kentucky Bluegrass. This targeted strategy optimizes conservation efforts by maintaining the ecological balance and functionality of grassland ecosystems in the face of changing climatic conditions, thereby safeguarding the genetic diversity and adaptability of Kentucky bluegrass.
5. Conclusions
This study successfully applied advanced machine learning-based species distribution models (SDMs), including Random Forest (RF), Support Vector Machine (SVM), and Boosted Regression Trees (BRT), to evaluate the habitat suitability of P. pratensis (Kentucky bluegrass) in the ecologically diverse Fars Province of Iran. The results demonstrate that these algorithms—particularly ensemble and kernel-based methods—are highly effective in capturing complex, non-linear interactions between environmental variables such as soil properties, water availability, and topographical features. By integrating high-resolution spatial data with robust predictive techniques, the models revealed a clear preference of Kentucky bluegrass for areas near water sources and its vulnerability to elevated soil salinity levels. The strong performance of these models highlights their practical utility for ecological forecasting, biodiversity monitoring, and adaptive land-use planning, especially in ecotone regions facing climatic stress. Importantly, this study reinforces the value of machine learning approaches in ecological modeling by providing more accurate, scalable, and data-driven assessments compared to traditional statistical models. These insights are crucial for developing targeted conservation strategies and maximizing the sustainable use of this vital grass species in regions experiencing rapid environmental change. Future research should aim to (1) incorporate temporal climate projections to assess future habitat dynamics under climate change scenarios and (2) explore the interplay between anthropogenic land-use changes and Kentucky bluegrass distribution to better support conservation policies in transitional and vulnerable landscapes.
Supplementary Materials
The following supporting information can be downloaded at https://www.mdpi.com/article/10.3390/w17192849/s1. Data is available as Supplementary Files (needs GIS software to open). Supplementary Table S1: Poa pratensis points; Supplementary S2: Layers data; Supplementary S3 Figure: Assessed layers for the targeted region. (Part 1): (A) elevation; (B) slope degree; (C) aspect; (D) sand proportion; (E) silt proportion; (F) clay proportion. (Part 2, continued from Supplementary S3): (G) electrical conductivity (EC); (H) pH; (I) annual rainfall; (J) annual temperature; (K) distance from roadways; (L) distance from rivers; (M) plan curvature.
Author Contributions
M.A.G. and E.D. contributed to the investigation, data gathering, computational analysis, and visualization. H.S., M.E., and T.P. contributed to the experimental design and reviewed the work. All authors have read and agreed to the published version of the manuscript.
Funding
This research received no external funding.
Data Availability Statement
All data supporting the reported results are provided in the Supplementary Materials.
Conflicts of Interest
The authors declare that they have no conflicts of interest.
References
- Bushman, B.S.; Joshi, A.; Johnson, P.G. Molecular Markers Improve Breeding Efficiency in Apomictic Poa Pratensis L. Agronomy 2018, 8, 17. [Google Scholar] [CrossRef]
- Ghanbari, M.A.; Salehi, H.; Moghadam, A. Genetic diversity assessment of Iranian Kentucky bluegrass accessions: I. ISSR markers and their association with habitat suitability within and between different ecoregions. Mol. Biotechnol. 2022, 64, 1244–1258. [Google Scholar] [CrossRef] [PubMed]
- Palit, R.; Gramig, G.; DeKeyser, E.S. Kentucky bluegrass invasion in the northern Great Plains and prospective management approaches to mitigate its spread. Plants 2021, 10, 817. [Google Scholar] [CrossRef] [PubMed]
- Phillips, A.R.; Seetharam, A.S.; Albert, P.S.; AuBuchon-Elder, T.; Birchler, J.A.; Buckler, E.S.; Gillespie, L.J.; Hufford, M.B.; Llaca, V.; Romay, M.C. A happy accident: A novel turfgrass reference genome. G3 Genes Genom. Genet. 2023, 13, jkad073. [Google Scholar] [CrossRef]
- Raggi, L.; Bitocchi, E.; Russi, L.; Marconi, G.; Sharbel, T.F.; Veronesi, F.; Albertini, E. Understanding genetic diversity and population structure of a Poa pratensis worldwide collection through morphological, nuclear and chloroplast diversity analysis. PLoS ONE 2015, 10, e0124709. [Google Scholar] [CrossRef]
- Ghanbari, M.A.; Salehi, H.; Jowkar, A. Genetic Diversity Assessment of Iranian Kentucky Bluegrass Accessions: II. Nuclear DNA Content and Its Association with Morphological and Geographical Features. Mol. Biotechnol. 2023, 65, 84–96. [Google Scholar] [CrossRef] [PubMed]
- Noroozi, J.; Talebi, A.; Doostmohammadi, M.; Manafzadeh, S.; Asgarpour, Z.; Schneeweiss, G.M. Endemic diversity and distribution of the Iranian vascular flora across phytogeographical regions, biodiversity hotspots and areas of endemism. Sci. Rep. 2019, 9, 12991. [Google Scholar] [CrossRef] [PubMed]
- Azizi, K.; Soltani, Z.; Aliakbarpour, M.; Rezanezhad, H.; Kalantari, M. Bionomics of phlebotomine sand flies in different climates of Lleishmaniasis in Fars Province, Southern Iran. J. Arthropod. Borne Dis. 2022, 16, 148. [Google Scholar]
- Naderi, M. Extreme climate events under global warming in northern Fars Province, southern Iran. Theor. Appl. Climatol. 2020, 142, 1221–1243. [Google Scholar] [CrossRef]
- Rahimi, J.; Laux, P.; Khalili, A. Assessment of climate change over Iran: CMIP5 results and their presentation in terms of Köppen–Geiger climate zones. Theor. Appl. Climatol. 2020, 141, 183–199. [Google Scholar] [CrossRef]
- Cunze, S.; Heydel, F.; Tackenberg, O. Are plant species able to keep pace with the rapidly changing climate? PLoS ONE 2013, 8, e67909. [Google Scholar] [CrossRef]
- Yousefi, M.; Kafash, A.; Valizadegan, N.; Ilanloo, S.S.; Rajabizadeh, M.; Malekoutikhah, S.; Yousefkhani, S.S.H.; Ashrafi, S. Climate change is a major problem for biodiversity conservation: A systematic review of recent studies in Iran. Contemp. Probl. Ecol. 2019, 12, 394–403. [Google Scholar] [CrossRef]
- Parmesan, C.; Hanley, M.E. Plants and climate change: Complexities and surprises. Ann. Bot. 2015, 116, 849–864. [Google Scholar] [CrossRef]
- Hatfield, J. Turfgrass and climate change. Agr. J. 2017, 109, 1708–1718. [Google Scholar] [CrossRef]
- Wellstein, C.; Chelli, S.; Campetella, G.; Bartha, S.; Galiè, M.; Spada, F.; Canullo, R. Intraspecific phenotypic variability of plant functional traits in contrasting mountain grassland habitats. Biodivers. Conserv. 2013, 22, 2353–2374. [Google Scholar] [CrossRef]
- Peterson, A.T.; Soberón, J.; Pearson, R.G.; Anderson, R.P.; Martínez-Meyer, E.; Nakamura, M.; Araújo, M.B. Ecological niches and geographic distributions. In Ecological Niches and Geographic Distributions; Princeton University Press: Princeton, NJ, USA, 2011. [Google Scholar]
- Sánchez-Mercado, A.; Ferrer-Paris, J.; Franklin, J. Mapping species distributions: Spatial inference and prediction. Oryx 2010, 44, 615. [Google Scholar] [CrossRef]
- Taghizadeh-Mehrjardi, R.; Nabiollahi, K.; Rasoli, L.; Kerry, R.; Scholten, T. Land suitability assessment and agricultural production sustainability using machine learning models. Agronomy 2020, 10, 573. [Google Scholar] [CrossRef]
- Esmaeili, H.; Karami, A.; Hadian, J.; Saharkhiz, M.J.; Ebrahimi, S.N. Variation in the phytochemical contents and antioxidant activity of Glycyrrhiza glabra populations collected in Iran. Ind. Crop. Prod. 2019, 137, 248–259. [Google Scholar] [CrossRef]
- Rahimian Boogar, A.; Salehi, H.; Pourghasemi, H.R.; Blaschke, T. Predicting habitat suitability and conserving Juniperus spp. habitat using SVM and maximum entropy machine learning techniques. Water 2019, 11, 2049. [Google Scholar] [CrossRef]
- Dastres, E.; Rabiei-Dastjerdi, H.; Esmaeili, H.; Amiri, M.; Karami, A.; Gheisari, M. Harnessing machine learning to predict habitat suitability of medicinal plants: Insights from Oliveria decumbens under environmental change. Spat. Inf. Res. 2025, 33, 1–19. [Google Scholar] [CrossRef]
- Jurišić, M.; Radočaj, D.; Plaščak, I.; Rapčan, I. A UAS and machine learning classification approach to suitability prediction of expanding natural habitats for endangered flora species. Remote Sens. 2022, 14, 3054. [Google Scholar] [CrossRef]
- Rahmanian, S.; Pourghasemi, H.R.; Pouyan, S.; Karami, S. Habitat potential modelling and mapping of Teucrium polium using machine learning techniques. Environ. Monit. Assess. 2021, 193, 759. [Google Scholar] [CrossRef]
- Sittaro, F.; Hutengs, C.; Vohland, M. Which factors determine the invasion of plant species? Machine learning based habitat modelling integrating environmental factors and climate scenarios. Int. J. Appl. Earth Obs. Geoinf. 2023, 116, 103158. [Google Scholar] [CrossRef]
- Dastres, E.; Sarvestani, G.S.; Edalat, M.; Pourghasemi, H.R. Habitat suitability modeling of dominant weed in canola (Brassica napus) fields using machine learning techniques. Weed Sci. 2025, 73, e35. [Google Scholar] [CrossRef]
- Mohammady, M.; Pourghasemi, H.R.; Yousefi, S.; Dastres, E.; Edalat, M.; Pouyan, S.; Eskandari, S. Modeling and prediction of habitat suitability for Ferula gummosa medicinal plant in a mountainous area. Nat. Res. Res. 2021, 30, 4861–4884. [Google Scholar] [CrossRef]
- Dastres, E.; Rabiei-Dastjerdi, H.; Esmaeili, H.; Amiri, M.; Sonboli, A.; Mirjalili, M.H. Modeling habitat suitability for endangered herb (Salvia leriifolia Benth) using innovative hybrid machine learning algorithms. Environ. Sustain. Indic. 2025, 26, 100694. [Google Scholar] [CrossRef]
- Hojati, M.; Naderi, R.; Edalat, M.; Pourghasemi, H.R. Modelling key ecological factors influencing the distribution and content of silymarin antioxidant in Silybum marianum L. PLoS ONE 2025, 20, e0322442. [Google Scholar] [CrossRef] [PubMed]
- Rahmanian, S.; Pouyan, S.; Karami, S.; Pourghasemi, H.R. Predictive habitat suitability models for Teucrium polium L. using boosted regression trees. In Computers in Earth and Environmental Sciences; Elsevier: Amsterdam, The Netherlands, 2022; pp. 245–254. [Google Scholar]
- Austin, M. Species distribution models and ecological theory: A critical assessment and some possible new approaches. Ecol. Model. 2007, 200, 1–19. [Google Scholar] [CrossRef]
- Rodríguez de Rivera, O.; López-Quílez, A. Development and comparison of species distribution models for forest inventories. ISPRS Int. J. Geo-Inf. 2017, 6, 176. [Google Scholar] [CrossRef]
- Guisan, A.; Zimmermann, N.E. Predictive habitat distribution models in ecology. Ecol. Model. 2000, 135, 147–186. [Google Scholar] [CrossRef]
- Wang, J.-J.; Huang, Y.-F.; Long, H.-Y. Water and salt movement in different soil textures under various negative irrigating pressures. J. Integr. Agric. 2016, 15, 1874–1882. [Google Scholar] [CrossRef]
- Husson, O.; Brunet, A.; Babre, D.; Charpentier, H.; Durand, M.; Sarthou, J.-P. Conservation agriculture systems alter the electrical characteristics (Eh, pH, and EC) of four soil types in France. Soil Till. Res. 2018, 176, 57–68. [Google Scholar] [CrossRef]
- Kearney, K.M.; Harley, J.B.; Nichols, J.A. Inverse distance weighting to rapidly generate large simulation datasets. J. Biomech. 2023, 158, 111764. [Google Scholar] [CrossRef] [PubMed]
- Masoumi, Z.; Rezaei, A.; Maleki, J. Improvement of water table interpolation and groundwater storage volume using fuzzy computations. Environ. Monit. Assess. 2019, 191, 401. [Google Scholar] [CrossRef] [PubMed]
- Elith, J.; Leathwick, J.R. Species distribution models: Ecological explanation and prediction across space and time. Annu. Rev. Ecol. Evol. Syst. 2009, 40, 677–697. [Google Scholar] [CrossRef]
- Edalat, M.; Jahangiri, E.; Dastras, E.; Pourghasemi, H.R. Prioritization of effective factors on Zataria multiflora habitat suitability and its spatial modeling. In Spatial Modeling in GIS and R for Earth and Environmental Sciences; Elsevier: Amsterdam, The Netherlands, 2019; pp. 411–427. [Google Scholar]
- Froeschke, B.F.; Roux-Osovitz, M.; Baker, M.L.; Hampson, E.G.; Nau, S.L.; Thomas, A. The use of Boosted Regression Trees to predict the occurrence and quantity of Staphylococcus aureus in recreational marine waterways. Water 2024, 16, 1283. [Google Scholar] [CrossRef]
- Hastie, T.; Tibshirani, R.; Buja, A. Flexible discriminant analysis by optimal scoring. J. Am. Stat. Assoc. 1994, 89, 1255–1270. [Google Scholar] [CrossRef]
- Hastie, T.; Tibshirani, R. Discriminant analysis by Gaussian mixtures. J. R. Stat. Soc. Ser. B Stat. Methodol. 1996, 58, 155–176. [Google Scholar] [CrossRef]
- Vapnik, V.N. An overview of statistical learning theory. IEEE Trans. Neural Netw. 1999, 10, 988–999. [Google Scholar] [CrossRef]
- Breiman, L. Random forests. Mach. Learn. 2001, 45, 5–32. [Google Scholar] [CrossRef]
- Hosseini, N.; Mehrabian, A.; Nasab, F.K.; Mostafavi, H.; Ghorbanpour, M. Forecasting climate change effects on the potential distribution of Zhumeria majdae as an endangered monotypic endemic species: A Maxent modeling approach. BMC Ecol. Evol. 2025, 25, 85. [Google Scholar] [CrossRef]
- Hou, C.; Xie, Y.; Zhang, Z. An improved convolutional neural network-based indoor localization by using Jenks natural breaks algorithm. China Commun. 2022, 19, 291–301. [Google Scholar] [CrossRef]
- Juang, S.-R.; Chen, S.-H.; Wu, C.-F. An Expert-based assessment model for evaluating habitat suitability of pond-breeding amphibians. Sustainability 2017, 9, 278. [Google Scholar] [CrossRef]
- Yuan, H.-S.; Wei, Y.-L.; Wang, X.-G. Maxent modeling for predicting the potential distribution of Sanghuang, an important group of medicinal fungi in China. Fungal Ecol. 2015, 17, 140–145. [Google Scholar] [CrossRef]
- Feng, L.; Tian, X.; El-Kassaby, Y.A.; Qiu, J.; Feng, Z.; Sun, J.; Wang, G.; Wang, T. Predicting suitable habitats of Melia azedarach L. in China using data mining. Sci. Rep. 2022, 12, 12617. [Google Scholar] [CrossRef]
- Bektas, V.; Bettinger, P.; Nibbelink, N.; Siry, J.; Merry, K.; Henn, K.A.; Stober, J. Habitat suitability modeling of rare Turkeybeard (Xerophyllum asphodeloides) species in the Talladega National Forest, Alabama, USA. Forests 2022, 13, 490. [Google Scholar] [CrossRef]
- Gilani, H.; Goheer, M.A.; Ahmad, H.; Hussain, K. Under predicted climate change: Distribution and ecological niche modelling of six native tree species in Gilgit-Baltistan, Pakistan. Ecol. Indic. 2020, 111, 106049. [Google Scholar] [CrossRef]
- Miles, J. Tolerance and variance inflation factor. In Wiley Statsref: Statistics Reference Online; Wiley: Hoboken, NJ, USA, 2014. [Google Scholar]
- Aldiansyah, S.; Risna, R. Modeling the bioclimatic range of Musa ingens (giant highland banana) under conditions of climate change scenarios. Environ. Nat. Res. J. 2024, 22, 394–407. [Google Scholar] [CrossRef]
- Gilbert, A.A.; Fraser, L.H. Effects of salinity and clipping on biomass and competition between a halophyte and a glycophyte. Plant Ecol. 2013, 214, 433–442. [Google Scholar] [CrossRef]
- Sabzmeydani, E.; Sedaghathoor, S.; Hashemabadi, D. Progesterone and salicylic acid elevate tolerance of Poa pratensis to salinity stress. Russ. J. Plant Physiol. 2020, 67, 285–293. [Google Scholar] [CrossRef]
- Chen, Y.; Chen, Y.; Shi, Z.; Jin, Y.; Sun, H.; Xie, F.; Zhang, L. Biosynthesis and signal transduction of ABA, JA, and BRs in response to drought stress of Kentucky bluegrass. Int. J. Mol. Sci. 2019, 20, 1289. [Google Scholar] [CrossRef]
- Schiavon, M.; Serena, M.; Leinauer, B.; Sallenave, R.; Baird, J.H. Seeding date and irrigation system effects on establishment of warm-season turfgrasses. Agron. J. 2015, 107, 880–886. [Google Scholar] [CrossRef]
- Alves, J.; Innes, J.F. Minimal clinically-important differences for the “Liverpool Osteoarthritis in Dogs”(LOAD) and the “Canine Orthopedic Index”(COI) in dogs with osteoarthritis. PLoS ONE 2023, 18, e0291881. [Google Scholar] [CrossRef]
- White, N.; Parsons, R.; Collins, G.; Barnett, A. Evidence of questionable research practices in clinical prediction models. BMC Med. 2023, 21, 339. [Google Scholar] [CrossRef]
- Jin, J.; Yan, H.; Bie, Q.; Wang, G.; Su, G. A method of calculating the spatial difference of human settlements in urban blocks based on floor area ratio. Proc. IOP Conf. Ser. Earth Environ. Sci. 2021, 825, 012034. [Google Scholar] [CrossRef]
- Barbet-Massin, M.; Jiguet, F.; Albert, C.H.; Thuiller, W. Selecting pseudo-absences for species distribution models: How, where and how many? Methods Ecol. Evol. 2012, 3, 327–338. [Google Scholar] [CrossRef]
- Zhang, H.T.; Guo, W.Y.; Wang, W.T. The dimensionality reductions of environmental variables have a significant effect on the performance of species distribution models. Ecol. Evol. 2023, 13, e10747. [Google Scholar] [CrossRef]
- Chauvier-Mendes, Y.; Pollock, L.J.; Verburg, P.H.; Karger, D.N.; Pellissier, L.; Lavergne, S.; Zimmermann, N.E.; Thuiller, W. Transnational conservation to anticipate future plant shifts in Europe. Nat. Ecol. Evol. 2024, 8, 454–466. [Google Scholar] [CrossRef] [PubMed]
- Albajes-Eizagirre, A.; Solanes, A.; Fullana, M.A.; Ioannidis, J.P.; Fusar-Poli, P.; Torrent, C.; Sole, B.; Bonnín, C.M.; Vieta, E.; Mataix-Cols, D. Meta-analysis of voxel-based neuroimaging studies using seed-based d mapping with permutation of subject images (SDM-PSI). J. Vis. Exp. 2019, 153, e59841. [Google Scholar]
- Lai, W.; Khan, A.A. Modeling dam-break flood over natural rivers using discontinuous Galerkin method. J. Hydrodyn. 2012, 24, 467–478. [Google Scholar] [CrossRef]
- Wang, G.; Zhong, L.; Zhou, S.; Liu, Q.; Li, Q.; Fu, Q.; Wang, L.; Huang, R.; Wang, G.; Li, X. Jet breaking tools for natural gas hydrate exploitation and their support technologies. Nat. Gas. Ind. B 2018, 5, 312–318. [Google Scholar] [CrossRef]
- Niazian, M.; Niedbała, G. Machine learning for plant breeding and biotechnology. Agriculture 2020, 10, 436. [Google Scholar] [CrossRef]
- Crawford, B.A.; Maerz, J.C.; Moore, C.T. Expert-informed habitat suitability analysis for at-risk species assessment and conservation planning. J. Fish. Wildl. Manag. 2020, 11, 130–150. [Google Scholar] [CrossRef]
Disclaimer/Publisher’s Note: The statements, opinions and data contained in all publications are solely those of the individual author(s) and contributor(s) and not of MDPI and/or the editor(s). MDPI and/or the editor(s) disclaim responsibility for any injury to people or property resulting from any ideas, methods, instructions or products referred to in the content. |
© 2025 by the authors. Licensee MDPI, Basel, Switzerland. This article is an open access article distributed under the terms and conditions of the Creative Commons Attribution (CC BY) license (https://creativecommons.org/licenses/by/4.0/).