Water Demand and Conservation in Arid Urban Environments: Numerical Analysis of Evapotranspiration in Arizona
Abstract
1. Introduction
Problem Statement
2. Materials and Methods
2.1. Finite Element Analysis
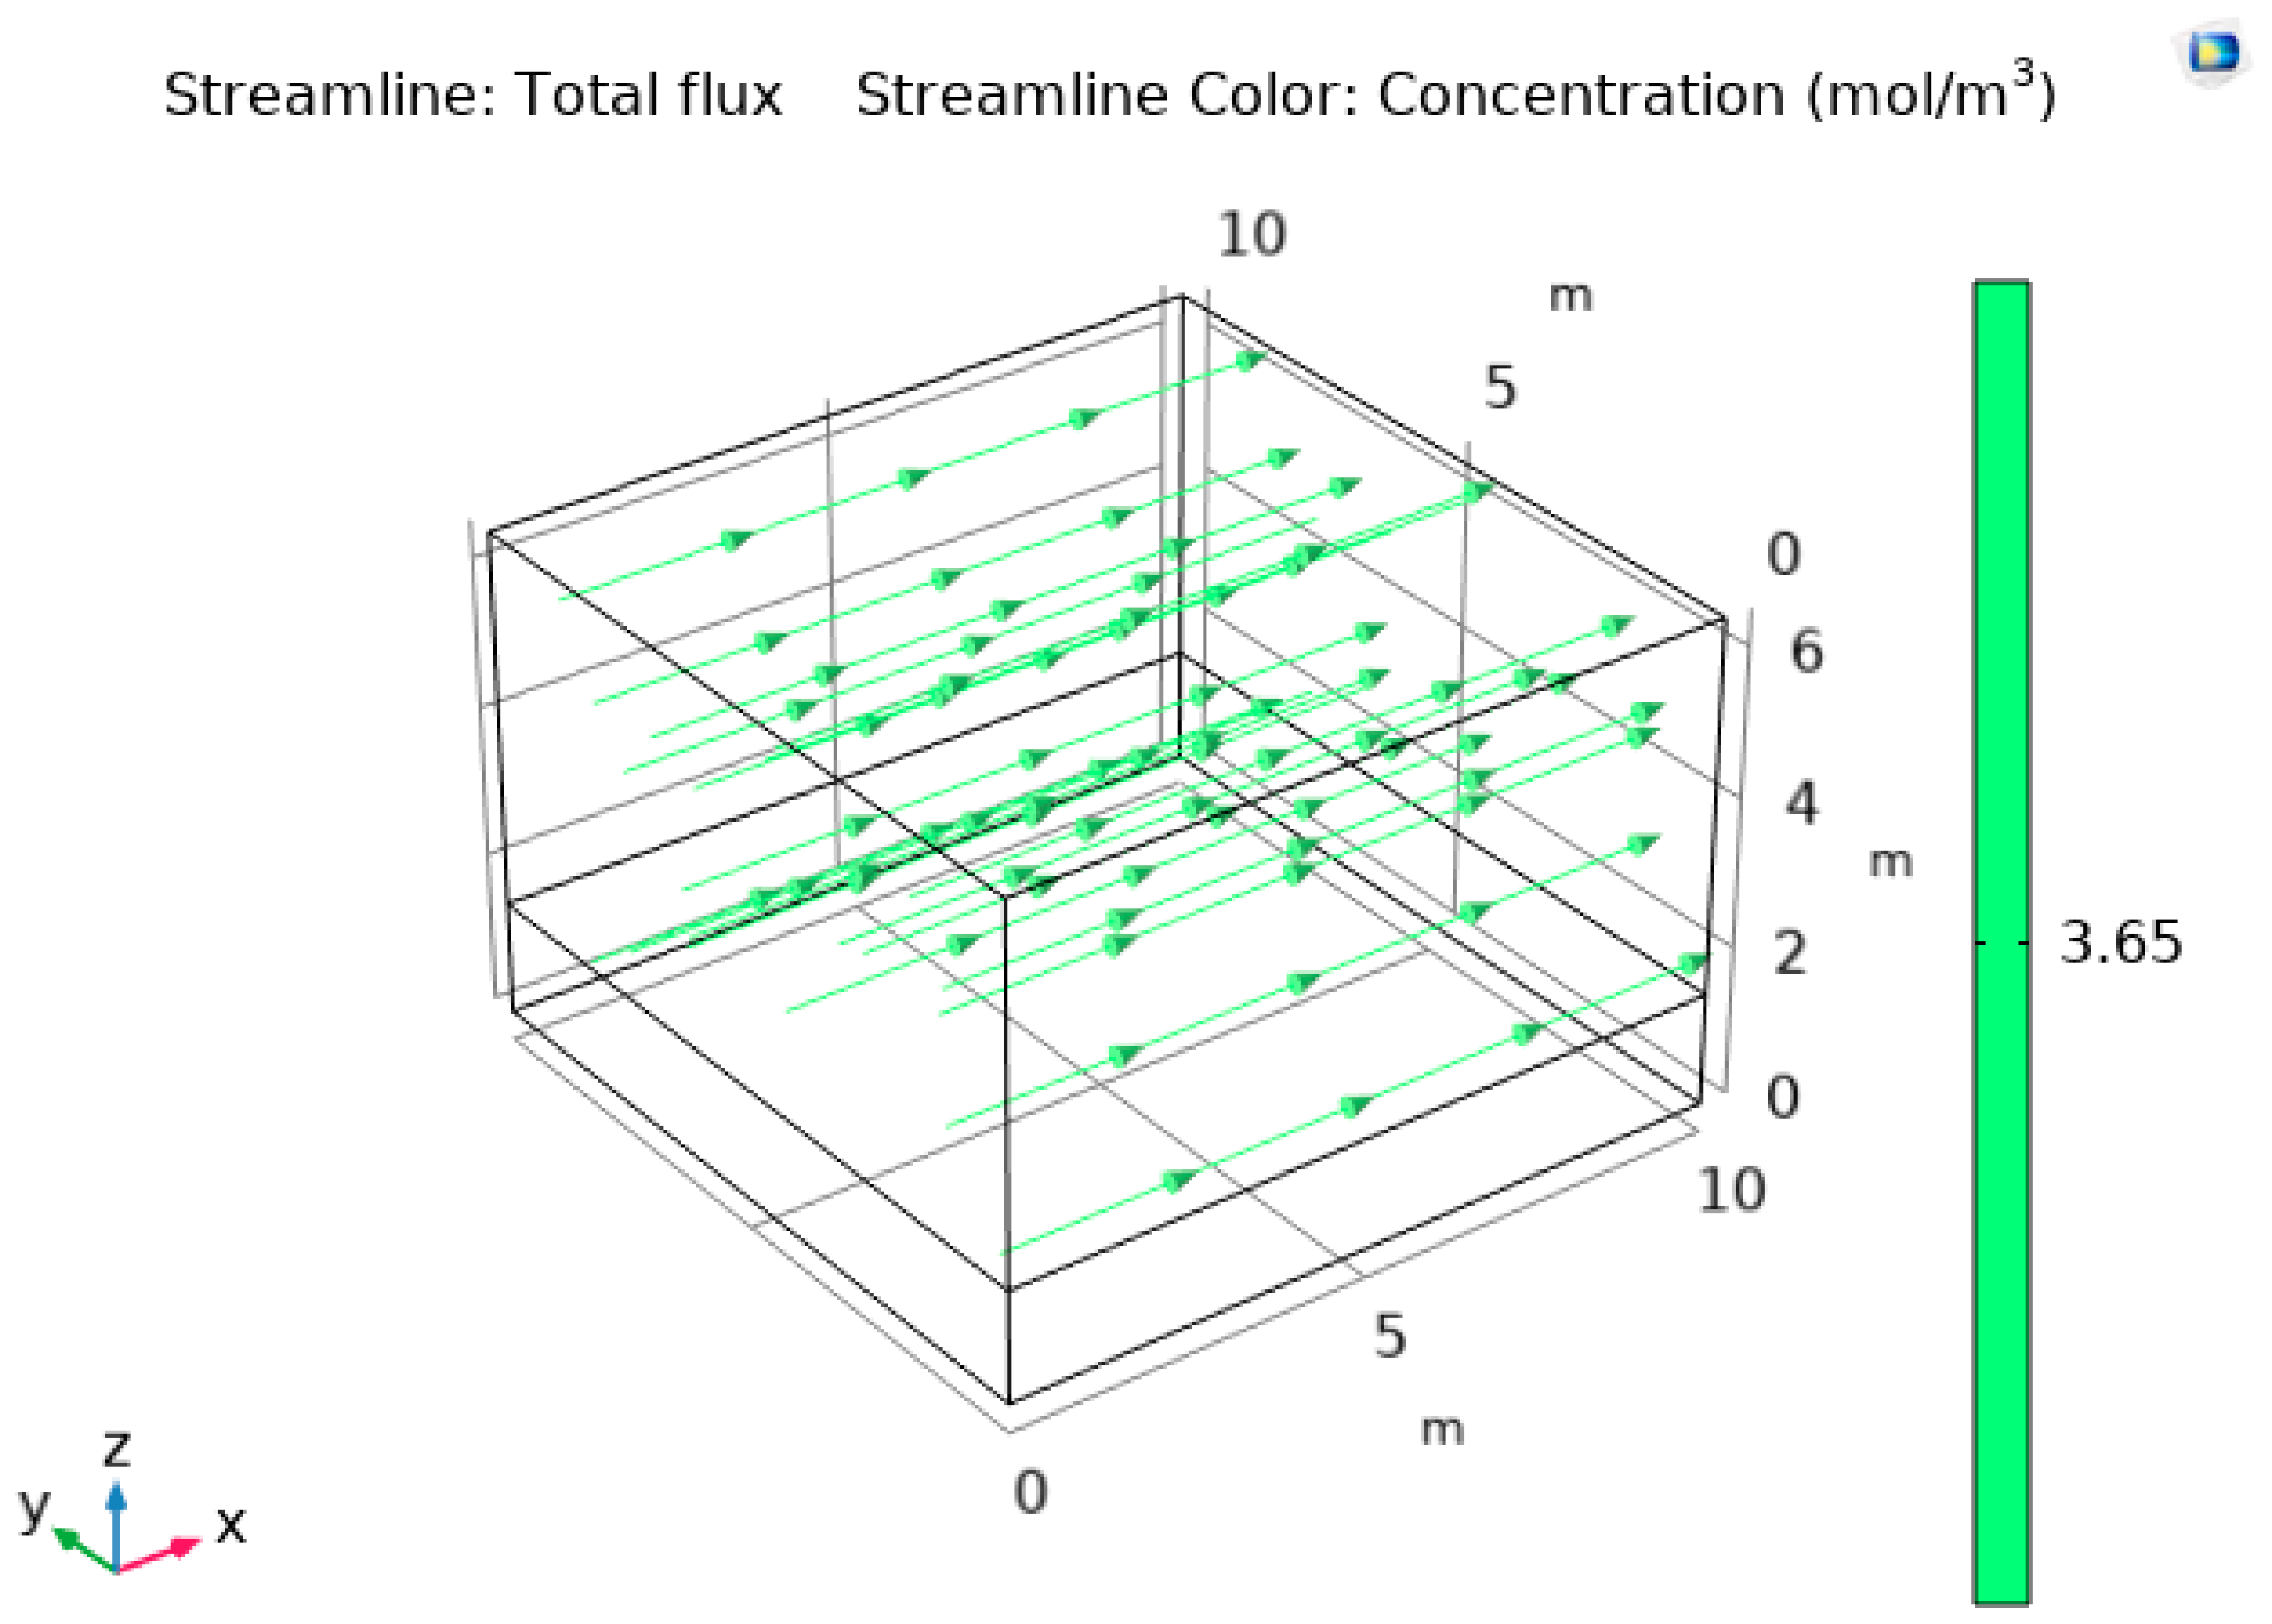
2.2. Model Setup
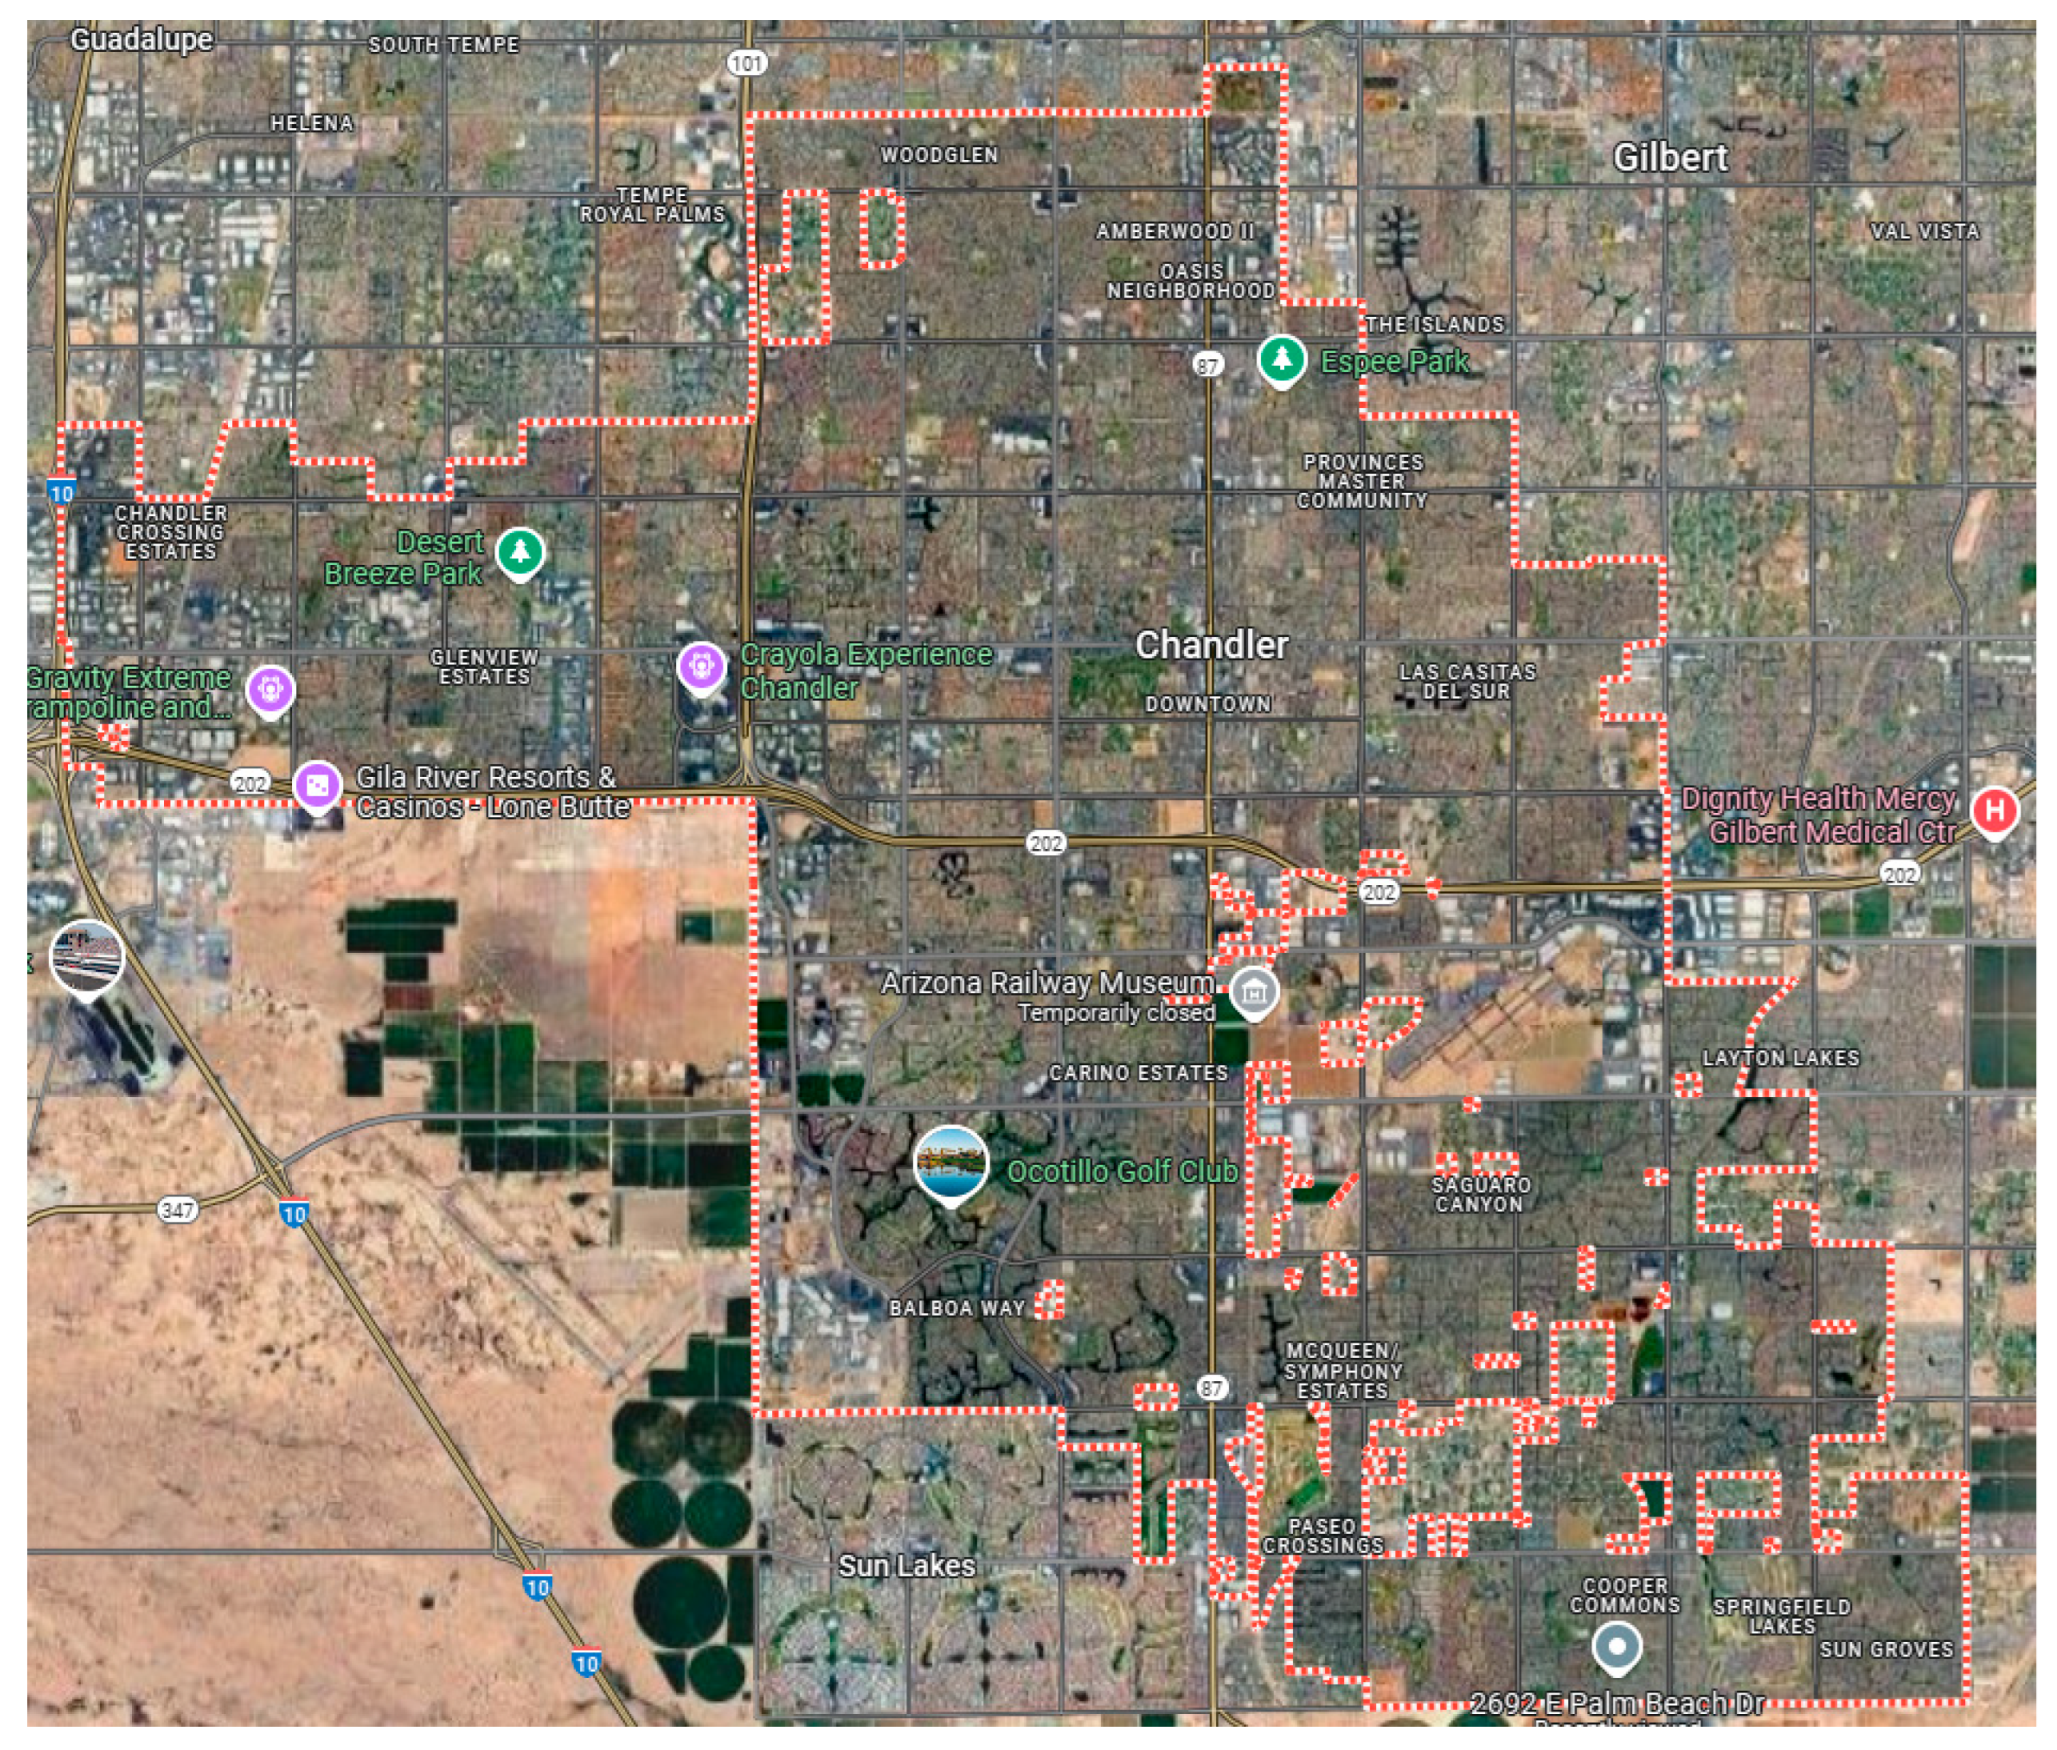
2.3. Geometry
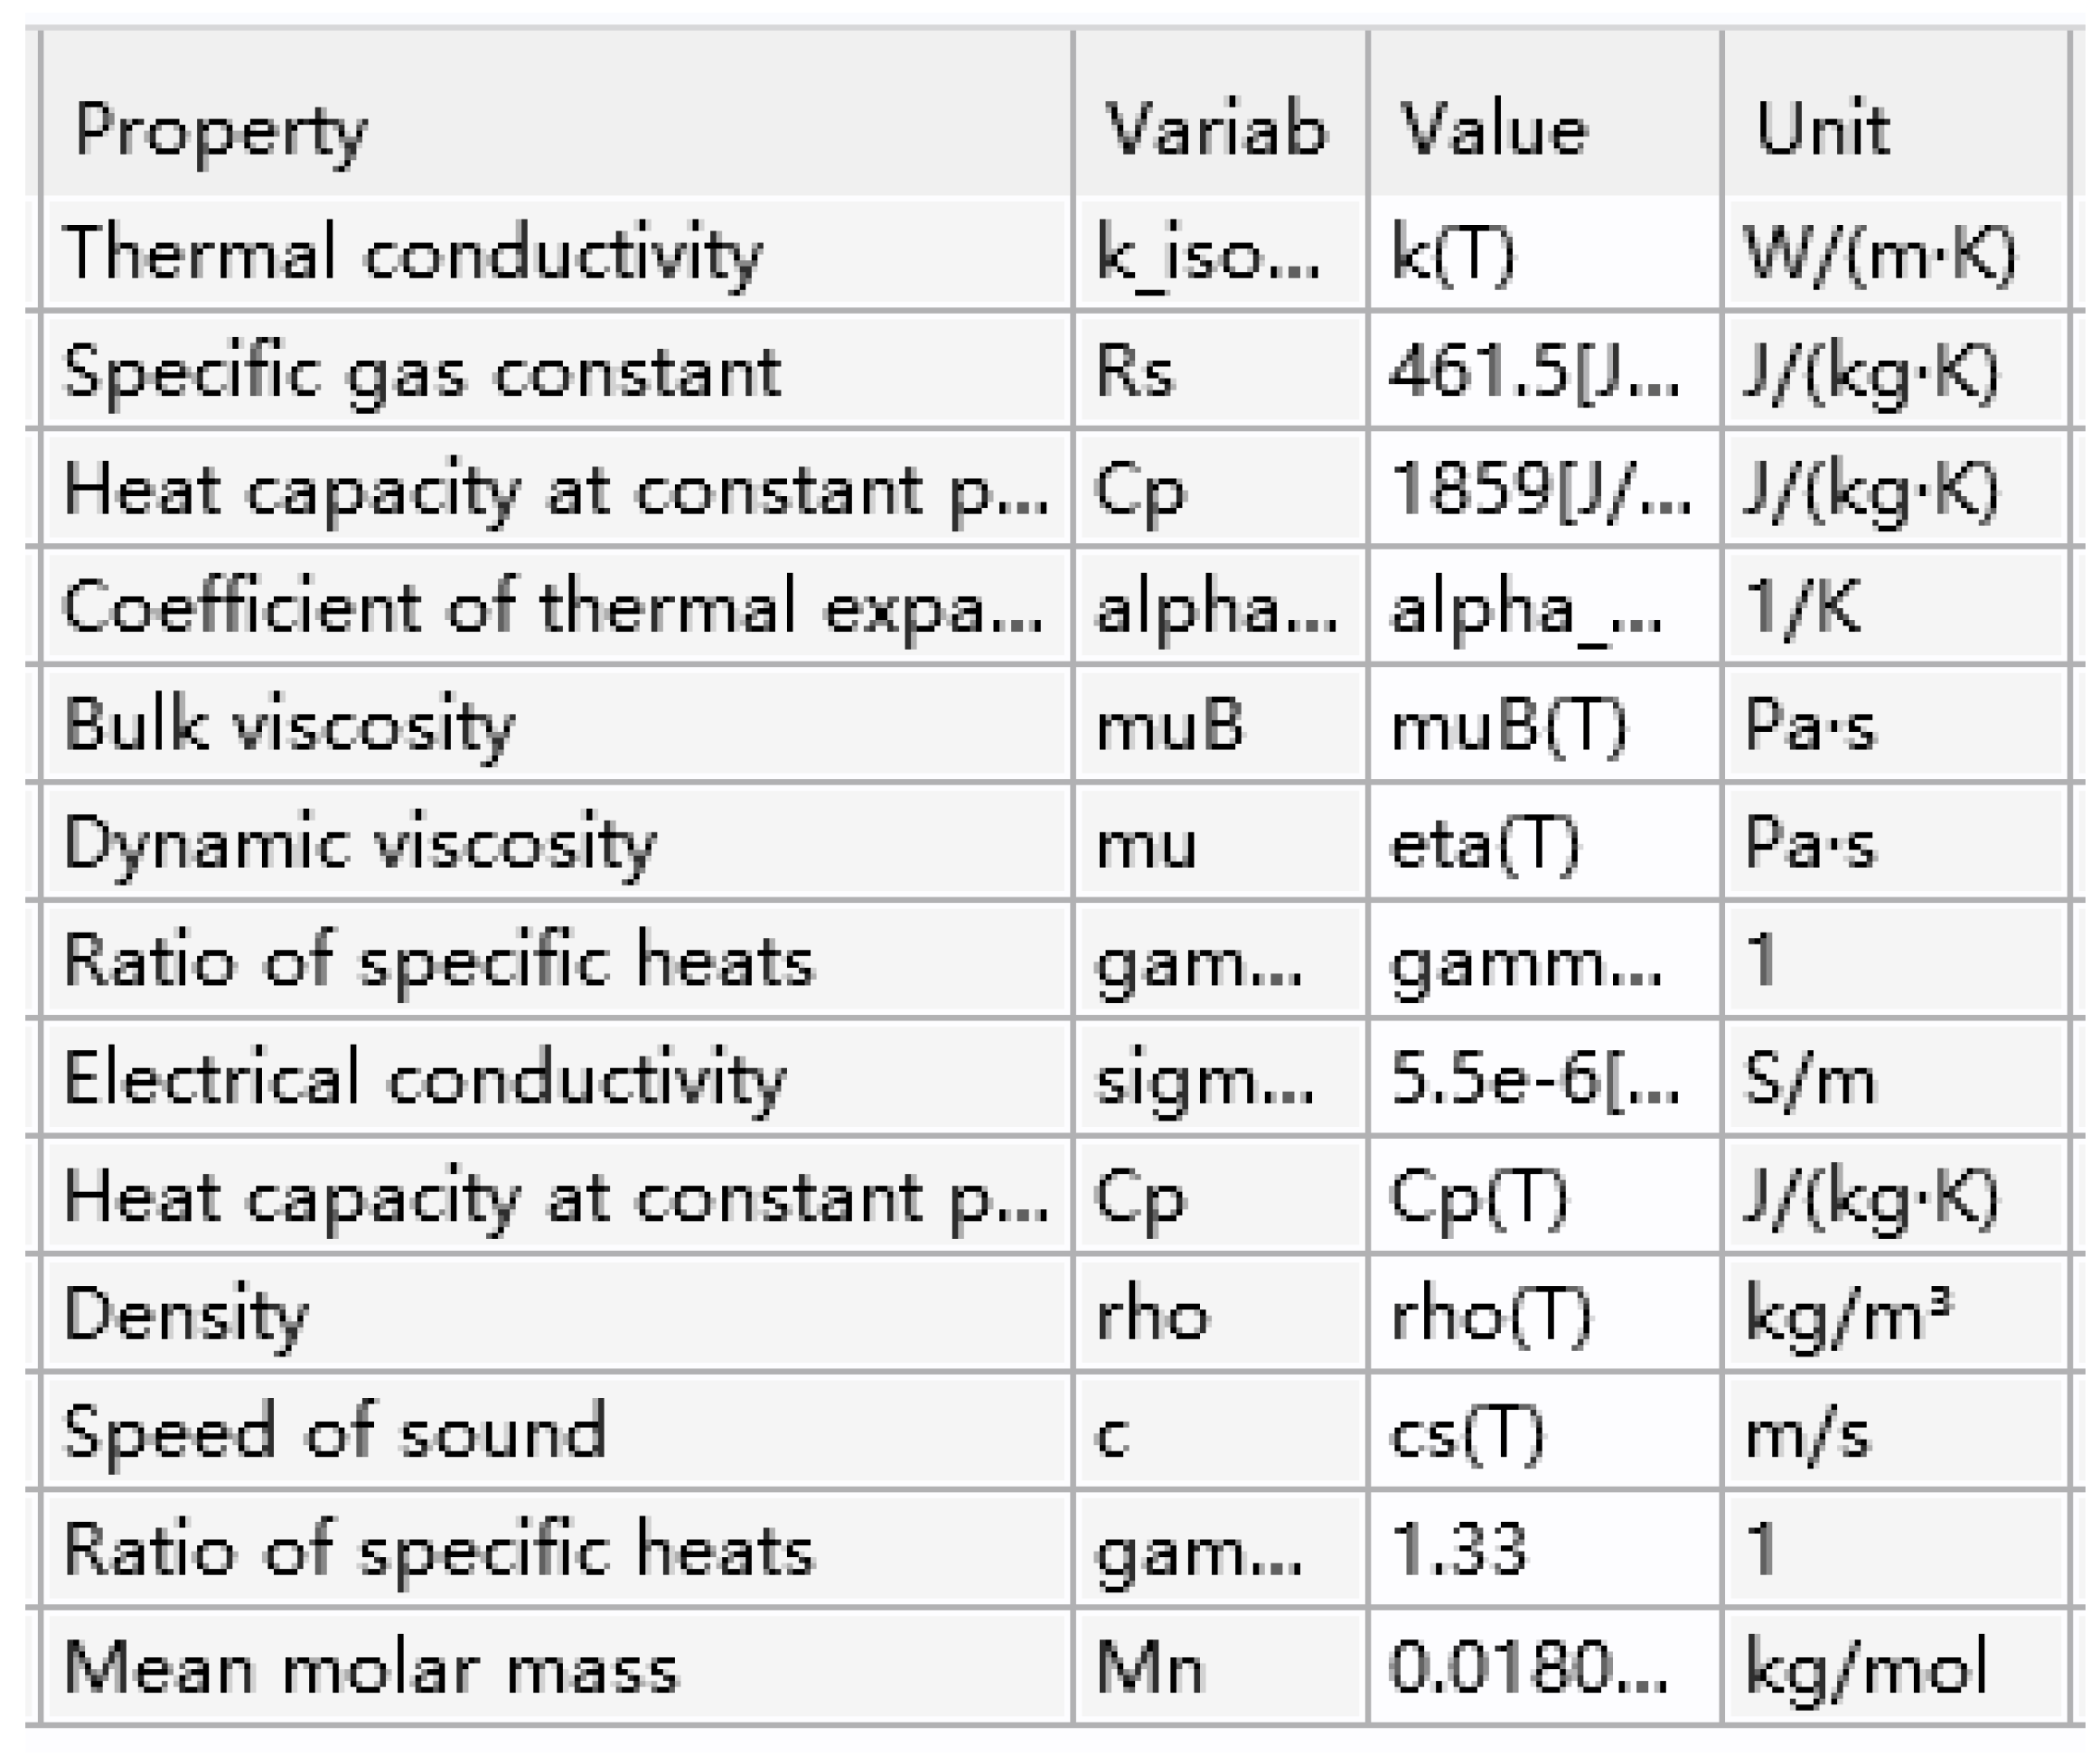
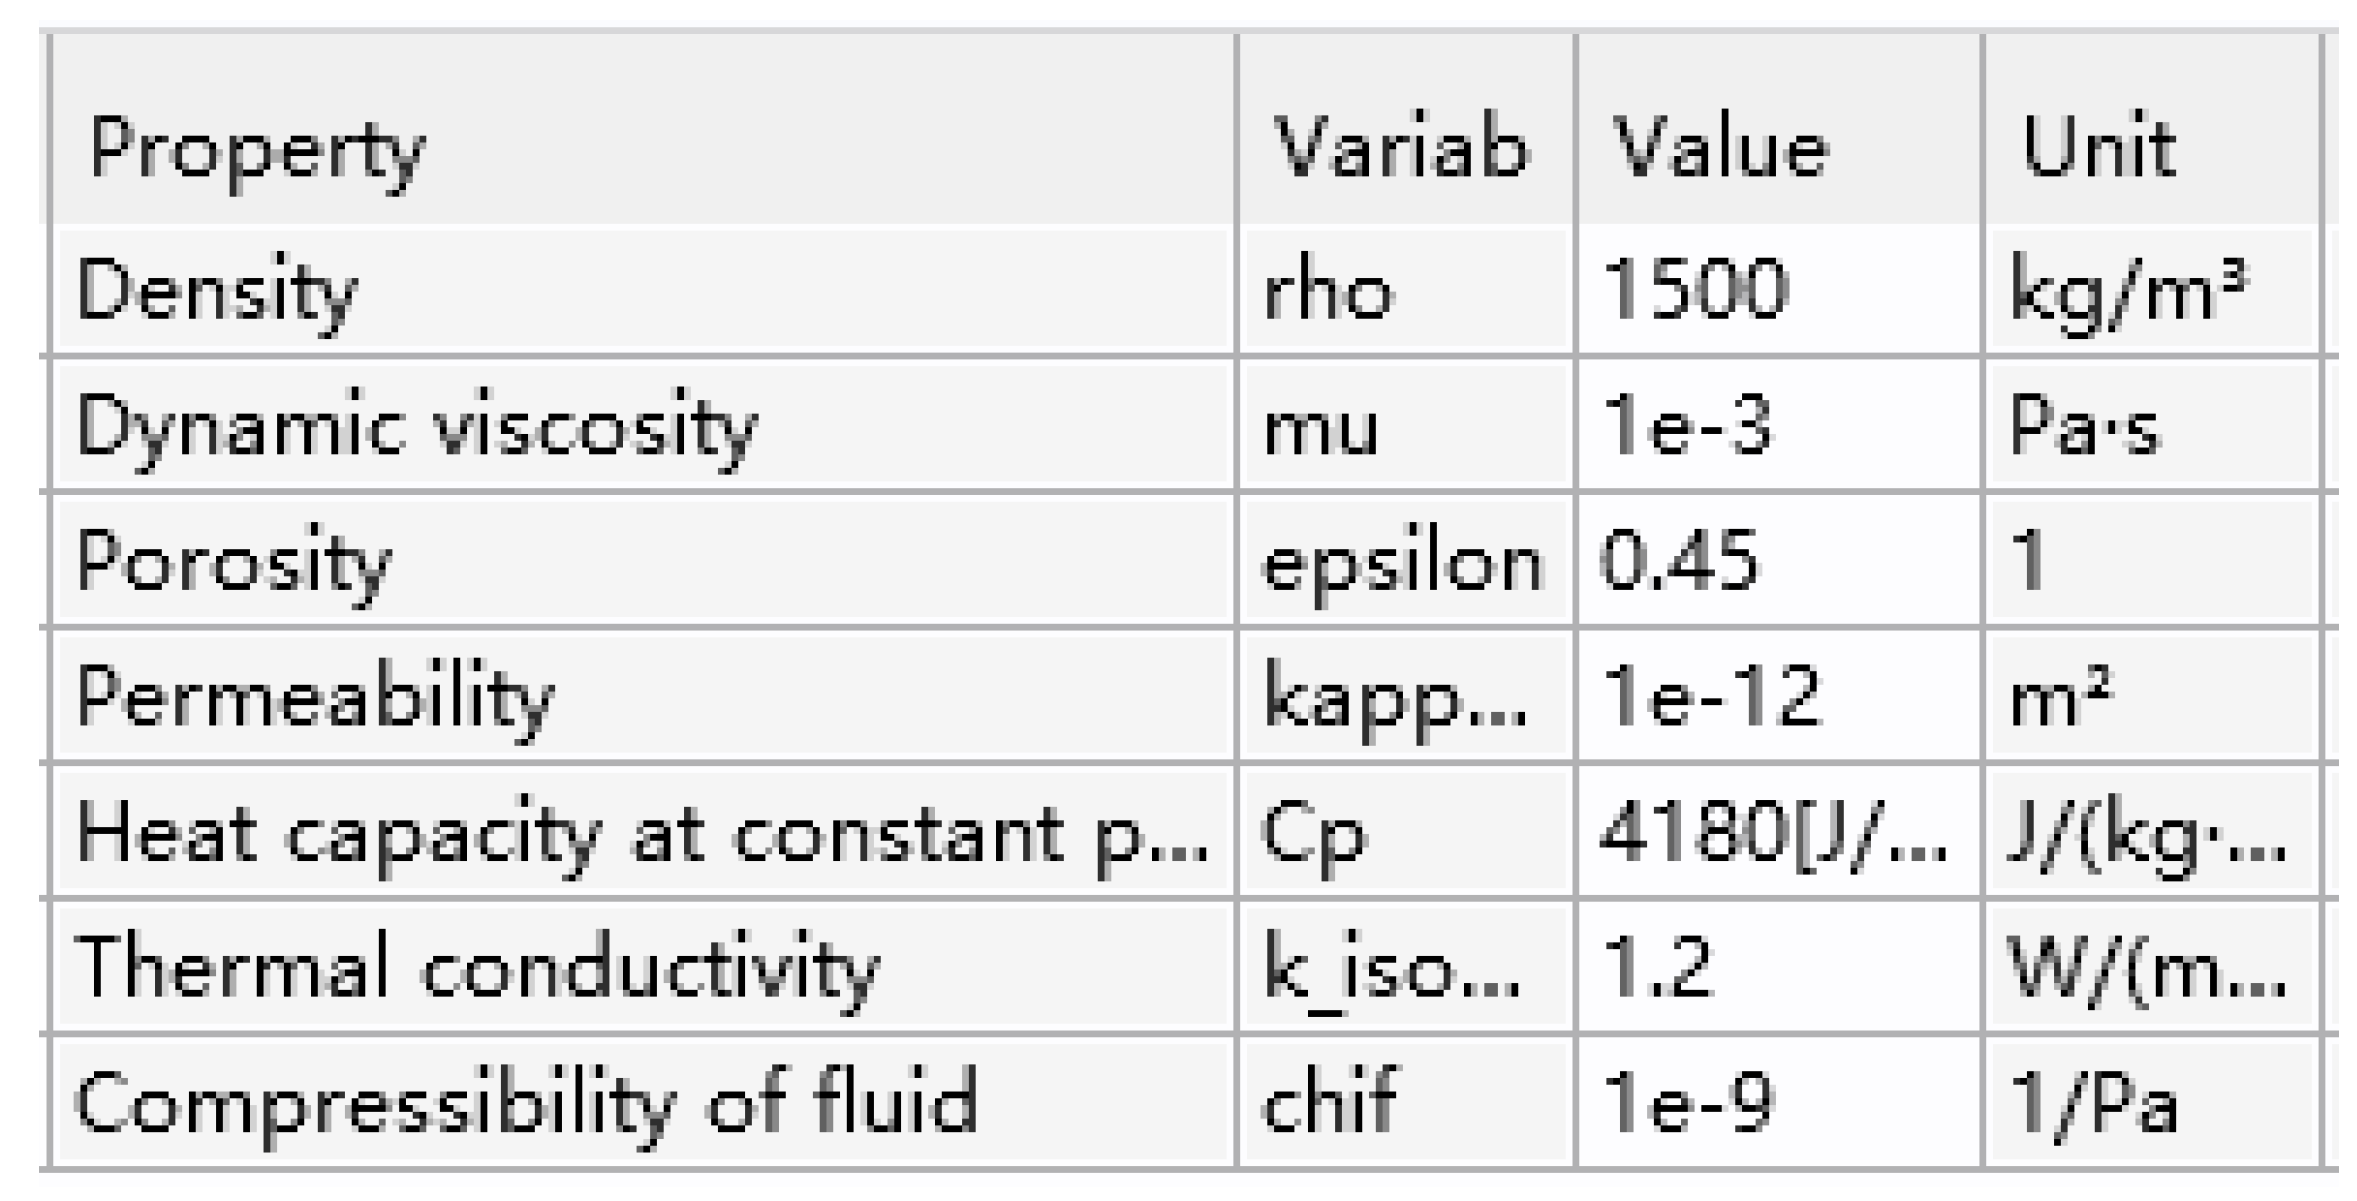
2.4. Material Properties
2.5. Data Collection
3. Results
3.1. Pool Water Evaporation
3.1.1. Temperature Impact
3.1.2. Wind Speed Impact
3.1.3. Humidity Impact
3.2. Annual Water Loss Due to Evaporation
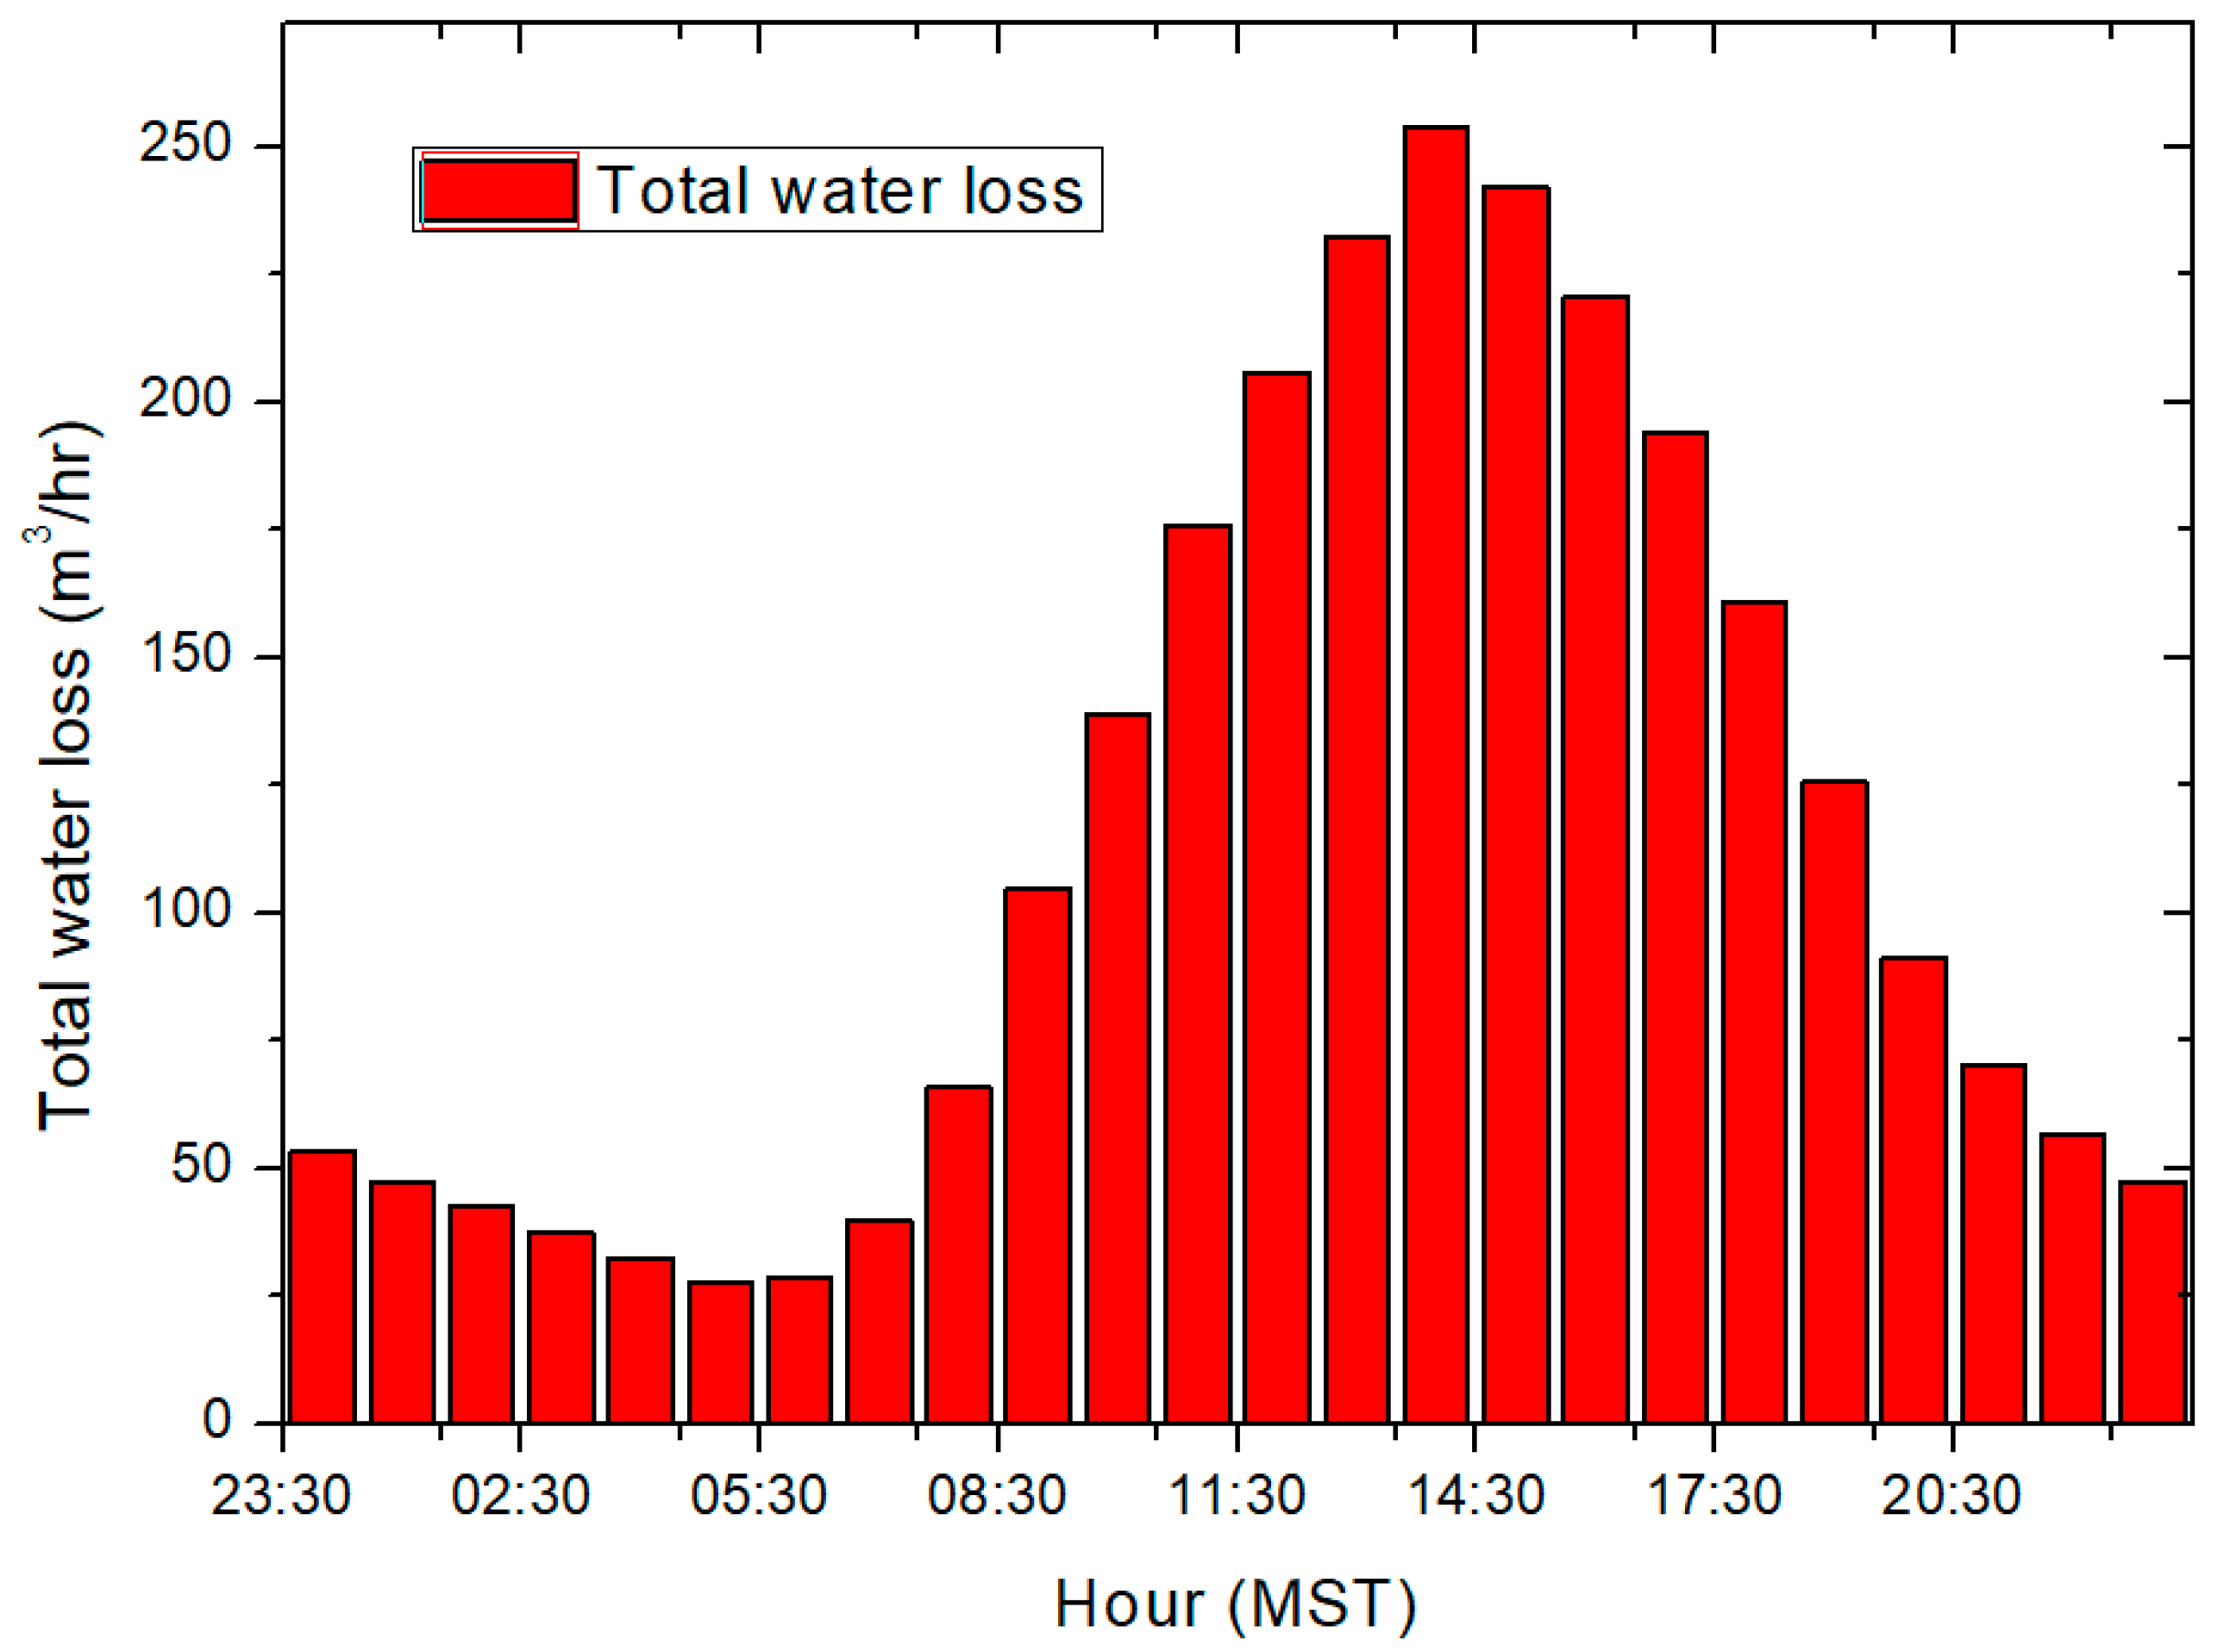
3.2.1. Hourly Water Loss
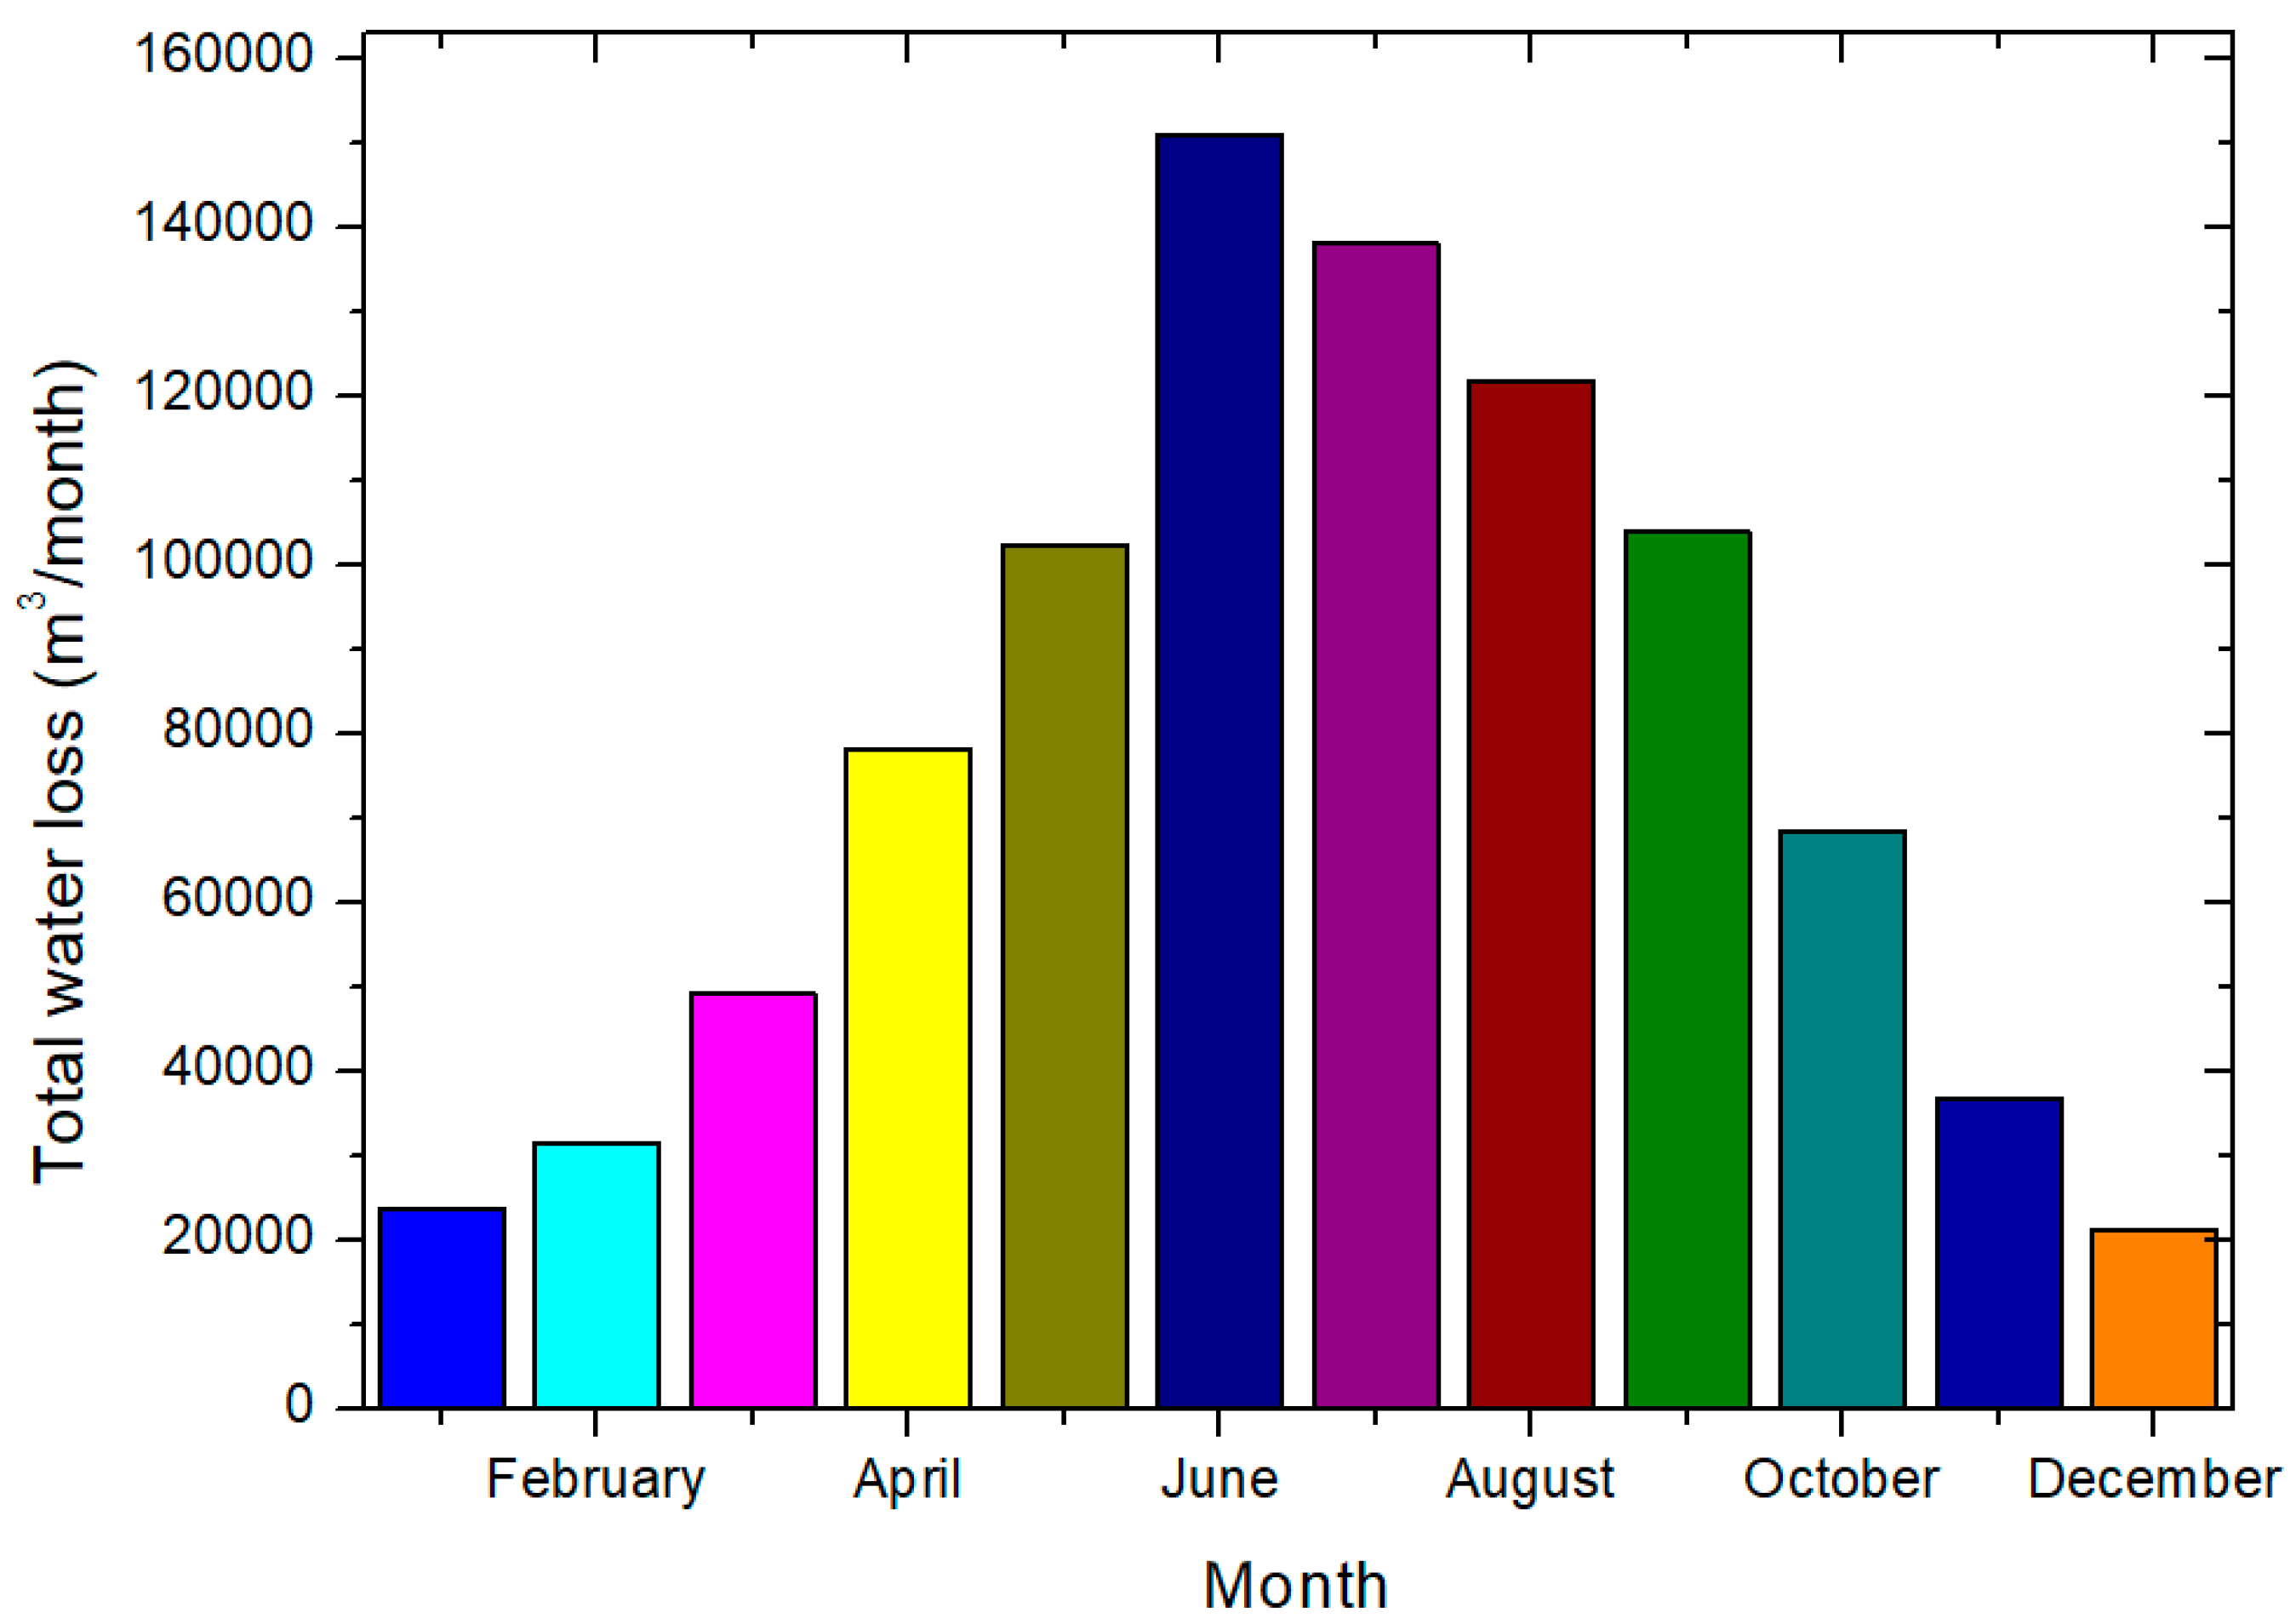
3.2.2. Monthly Water Loss (2024)
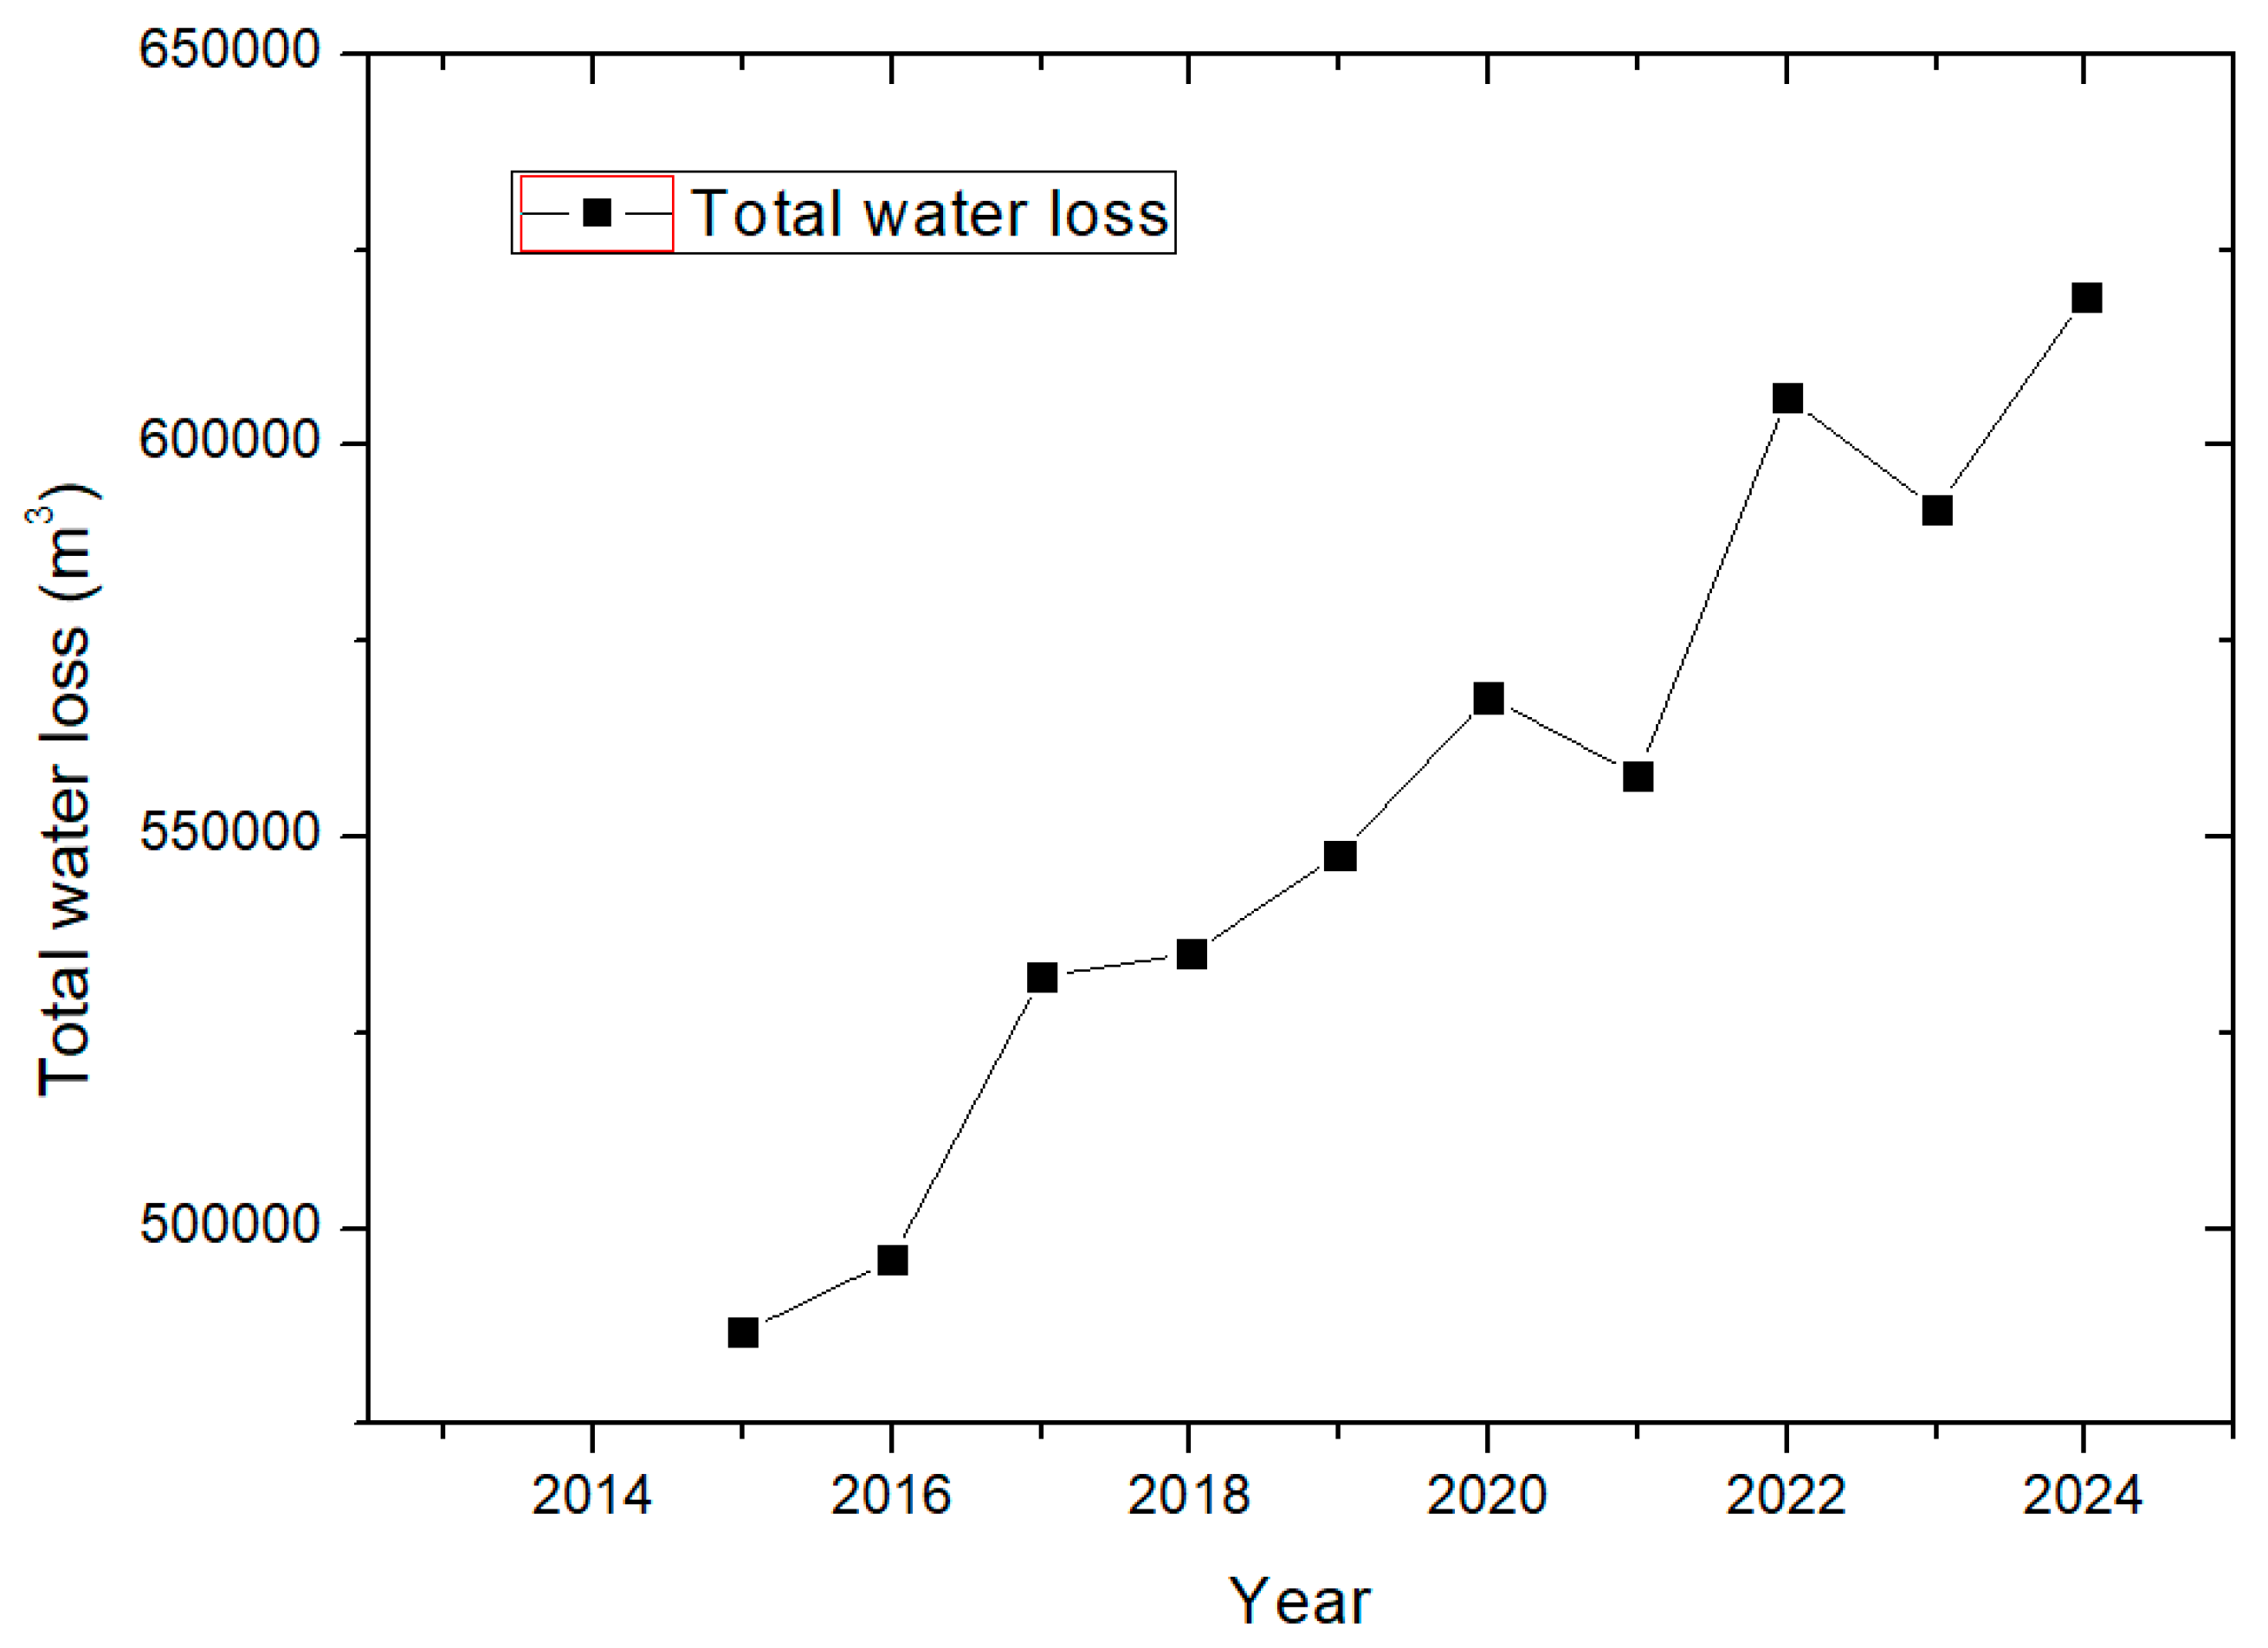
3.2.3. Annual Water Loss (2014–2024)
3.3. Vegetation Water Demand
3.3.1. Hourly Water Demand
3.3.2. Monthly Irrigation Water Demand (2024)
3.3.3. Arizona Vegetation Water Consumption Comparison
3.4. Total Water Demand
3.5. Validation of Simulation Data by Real-Time Experiment Data
4. Water Conservation Strategies
4.1. Pool Water Conservation
4.1.1. Solar Covers
4.1.2. Fences
4.1.3. Liquid Solar Cover on the Water Surface
4.2. Irrigation Optimization
4.2.1. Minimum Water Requirements
4.2.2. Dynamic Irrigation on/off Timing
4.2.3. Optimal Irrigation Duration
4.2.4. Dynamic Irrigation Frequency
4.3. Simulation Convergence Analysis
5. Discussion
6. Conclusions
7. Future Work
Supplementary Materials
Author Contributions
Funding
Data Availability Statement
Acknowledgments
Conflicts of Interest
References
- Hunt, A.G.; Sahimi, M.; Faybishenko, B.; Egli, M.; Kabala, Z.J.; Ghanbarian, B.; Yu, F. Gaia: Complex systems prediction for time to adapt to climate shocks. Vadose Zone J. 2025, 24, e70016. [Google Scholar] [CrossRef]
- Kumari, M.; Singh, J. Water conservation: Strategies and solutions. Int. J. Adv. Res. Rev. 2016, 1, 75–79. [Google Scholar]
- Mashaly, A.F.; Fernald, A.G.; Geli, H.M.; Bawazir, A.S.; Steiner, R.L. Dynamic simulation modeling for sustainable water management with climate change in a semi-arid environment. J. Hydrol. 2024, 644, 132126. [Google Scholar] [CrossRef]
- Pérez Blanco, C.; Hrast Essenfelder, A.; Perry, C.J. Irrigation technology and water conservation: A review of the theory and evidence. Rev. Environ. Econ. Policy 2020, 14, 216–239. [Google Scholar] [CrossRef]
- Gao, X.; Huo, Z.; Qu, Z.; Xu, X.; Huang, G.; Steenhuis, T.S. Modeling contribution of shallow groundwater to evapotranspiration and yield of maize in an arid area. Sci. Rep. 2017, 7, 43122. [Google Scholar] [CrossRef]
- Chen, H.; Huo, Z.; Dai, X.; Ma, S.; Xu, X.; Huang, G. Impact of agricultural water-saving practices on regional evapotranspiration: The role of groundwater in sustainable agriculture in arid and semi-arid areas. Agric. For. Meteorol. 2018, 263, 156–168. [Google Scholar] [CrossRef]
- Di Stefano, C.; Ferro, V. Estimation of evapotranspiration by Hargreaves formula and remotely sensed data in semi-arid Mediterranean areas. J. Agric. Eng. Res. 1997, 68, 189–199. [Google Scholar] [CrossRef]
- Zhang, Z.; Li, X.; Liu, L.; Wang, Y.; Li, Y. Influence of mulched drip irrigation on landscape scale evapotranspiration from farmland in an arid area. Agric. Water Manag. 2020, 230, 105953. [Google Scholar] [CrossRef]
- Huo, Z.; Feng, S.; Kang, S.; Dai, X. Artificial neural network models for reference evapotranspiration in an arid area of northwest China. J. Arid Environ. 2012, 82, 81–90. [Google Scholar] [CrossRef]
- Seifi, A.; Riahi, H. Estimating daily reference evapotranspiration using hybrid gamma test–least square support vector machine, gamma test–ANN, and gamma test–ANFIS models in an arid area of Iran. J. Water Clim. Change 2020, 11, 217–240. [Google Scholar] [CrossRef]
- Yin, Z.; Wen, X.; Feng, Q.; He, Z.; Zou, S.; Yang, L. Integrating genetic algorithm and support vector machine for modeling daily reference evapotranspiration in a semi-arid mountain area. Hydrol. Res. 2017, 48, 1177–1191. [Google Scholar] [CrossRef]
- Wohlfahrt, G.; Irschick, C.; Thalinger, B.; Hörtnagl, L.; Obojes, N.; Hammerle, A. Insights from independent evapotranspiration estimates for closing the energy balance: A grassland case study. Vadose Zone J. 2010, 9, 1025–1033. [Google Scholar] [CrossRef]
- Rahmati, M.; Groh, J.; Graf, A.; Pütz, T.; Vanderborght, J.; Vereecken, H. On the impact of increasing drought on the relationship between soil water content and evapotranspiration of a grassland. Vadose Zone J. 2020, 19, e20029. [Google Scholar] [CrossRef]
- Anderson, R.G.; Zhang, X.; Skaggs, T.H. Measurement and partitioning of evapotranspiration for application to vadose zone studies. Vadose Zone J. 2017, 16, 1–9. [Google Scholar] [CrossRef]
- Hou, X.P.; Fan, H.H. Study on rainfall infiltration characteristics of unsaturated fractured soil based on COMSOL Multiphysics. Rock Soil Mech. 2022, 43, 9. [Google Scholar] [CrossRef]
- Ciutureanu, C.A. COMSOL modelling for a water infiltration problem in an unsaturated medium. Ovidius Univ. Ann. Ser. Chem. 2009, 17, 87–98. [Google Scholar]
- Scanlon, T.M.; Kustas, W.P. Partitioning evapotranspiration using an eddy covariance-based technique: Improved assessment of soil moisture and land—Atmosphere exchange dynamics. Vadose Zone J. 2012, 11, vzj2012-0025. [Google Scholar] [CrossRef]
- Stathi, E.; Kastridis, A.; Myronidis, D. Analysis of Hydrometeorological Characteristics and Water Demand in Semi-Arid Mediterranean Catchments under Water Deficit Conditions. Climate 2023, 11, 137. [Google Scholar] [CrossRef]
- Elkatoury, A.; Alazba, A.A. Irrigation Water Demand Management-Based Innovative Strategy: Model Application on the Green Riyadh Initiative, Saudi Arabia. Water 2024, 16, 3559. [Google Scholar] [CrossRef]
- Huang, Y.; Hendricks Franssen, H.J.; Herbst, M.; Hirschi, M.; Michel, D.; Seneviratne, S.I.; Vereecken, H.; Teuling, A.J.; Vogt, R.; Detlef, S.; et al. Evaluation of different methods for gap filling of long-term actual evapotranspiration time series measured by lysimeters. Vadose Zone J. 2020, 19, e20020. [Google Scholar] [CrossRef]
- Šimůnek, J.; Van Genuchten, M.T.; Šejna, M. Recent developments and applications of the HYDRUS computer software packages. Vadose Zone J. 2016, 15, vzj2016-04. [Google Scholar] [CrossRef]
- Zhao, S.; Huang, Y.; Liu, Z.; Liu, T.; Tang, X. Estimation of Actual Evapotranspiration and Water Stress in Typical Irrigation Areas in Xinjiang, Northwest China. Remote Sens. 2024, 16, 2676. [Google Scholar] [CrossRef]
- Arizona Department of Water Resources. ADWR 2024 Annual Report. 2024. Available online: https://www.azwater.gov (accessed on 15 July 2025).
- Hirt, P.; Snyder, R.; Hester, C.; Larson, K. Water consumption and sustainability in Arizona: A tale of two desert cities. J. Southwest 2017, 59, 264–301. Available online: https://muse.jhu.edu/article/664851 (accessed on 17 July 2025). [CrossRef]
- U.S. Geological Survey. Water Use Data for Arizona. 2019. Available online: https://water.usgs.gov (accessed on 15 July 2025).
- Galloway, D.L.; Burbey, T.J. Regional land subsidence accompanying groundwater extraction. Hydrogeol. J. 2011, 19, 1459–1486. [Google Scholar] [CrossRef]
- Winter, T.C. Ground Water and Surface Water: A Single Resource; Diane Publishing: Collingdale, PA, USA, 2000. [Google Scholar]
- Arizona Department of Water Resources. 1980 Groundwater Management Act. 1980. Available online: https://www.azwater.gov (accessed on 17 July 2025).
- Gleick, P.H. Water in crisis: Paths to sustainable water use. Ecol. Appl. 1998, 8, 571–579. [Google Scholar] [CrossRef]
- Barnett, T.P.; Pierce, D.W.; Hidalgo, H.G.; Bonfils, C.; Santer, B.D.; Das, T.; Bala, G.; Wood, A.W.; Nozawa, T.; Mirin, A.A.; et al. Human-induced changes in the hydrology of the western United States. Science 2008, 319, 1080–1083. Available online: https://www.science.org/doi/full/10.1126/science.1152538 (accessed on 15 July 2025). [CrossRef]
- Udall, B.; Overpeck, J. The twenty-first century Colorado River hot drought and implications for the future. Water Resour. Res. 2017, 53, 2404–2418. [Google Scholar] [CrossRef]
- Water Resources Research Center. ARIZONA WATER FACTSHEET. 2021. Available online: https://wrrc.arizona.edu (accessed on 17 July 2025).
- Arizona Department of Water Resources. ADWR Data Dashboards. 2021. Available online: https://www.azwater.gov (accessed on 15 July 2025).
- Allen, R.G. Crop Evapotranspiration; FAO Irrigation and Drainage Paper 56; Food and Agriculture Organization of the United Nations: Rome, Italy, 1998; pp. 60–64. [Google Scholar]
- Monteith, J.L. Evaporation and environment. In Symposia of the Society for Experimental Biology; Cambridge University Press: Cambridge, UK, 1965; Volume 19, pp. 205–234. [Google Scholar]
- Williams, A.E.; Johnson, J.A.; Lund, L.J.; Kabala, Z.J. Spatial and temporal variations in nitrate contamination of a rural aquifer, California. J. Environ. Qual. 1998, 27, 1147–1157. [Google Scholar] [CrossRef]
- Hanssen, S.O.; Mathisen, H.M. Evaporation from Swimming Pools. 1990. [Online]. Available online: https://www.aivc.org/sites/default/files/airbase_4058.pdf (accessed on 17 July 2025).
- COMSOL. Introduction to COMSOL Multiphysics. 2019. Available online: https://www.comsol.com (accessed on 17 July 2025).
- Vajdi, M.; Moghanlou, F.S.; Sharifianjazi, F.; Asl, M.S.; Shokouhimehr, M. A review on the Comsol Multiphysics studies of heat transfer in advanced ceramics. J. Compos. Compd. 2020, 2, 35–43. [Google Scholar] [CrossRef]
- Shi, Y.; Rui, S.; Xu, S.; Wang, N.; Wang, Y. COMSOL modeling of heat transfer in SVE process. Environments 2022, 9, 58. [Google Scholar] [CrossRef]
- Al-Mufti, M.W.; Hashim, U.; Adam, T. Current trend in simulation: Review nanostructures using Comsol Multiphysics. J. Appl. Sci. Res. 2012, 8, 5579–5582. [Google Scholar]
- Chui, T.F.M.; Freyberg, D.L. Implementing hydrologic boundary conditions in a multiphysics model. J. Hydrol. Eng. 2009, 14, 1374–1377. [Google Scholar] [CrossRef]
- Gallero, F.J.G.; Maestre, I.R.; Foncubierta Blázquez, J.L.; Mena Baladés, J.D. Enhanced CFD-based approach to calculate the evaporation rate in swimming pools. Sci. Technol. Built Environ. 2020, 27, 524–532. [Google Scholar] [CrossRef]
- Vrugt, J.A.; Stauffer, P.H.; Wöhling, T.; Robinson, B.A.; Vesselinov, V.V. Inverse modeling of subsurface flow and transport properties: A review with new developments. Vadose Zone J. 2008, 7, 843–864. [Google Scholar] [CrossRef]
- Feddes, R.A.; Hoff, H.; Bruen, M.; Dawson, T.; De Rosnay, P.; Dirmeyer, P.; Pitman, A.J.; Lilly, A.; Kleidon, A.; Kabat, P.; et al. Modeling root water uptake in hydrological and climate models. Bull. Am. Meteorol. Soc. 2001, 82, 2797–2810. [Google Scholar] [CrossRef]
- Shen, Y.; Chen, Y. Global perspective on hydrology, water balance, and water resources management in arid basins. Hydrol. Process. 2010, 24, 129–135. [Google Scholar] [CrossRef]
- Varaksin, A.Y.; Ryzhkov, S.V. Mathematical modeling of gas–solid two-phase flows: Problems, achievements and perspectives (a review). Mathematics 2023, 11, 3290. [Google Scholar] [CrossRef]
- Incropera, F.P.; DeWitt, D.P. Fundamentals of Heat and Mass Transfer, 6th ed.; John Wiley & Sons: New York, NY, USA, 1996. [Google Scholar]
- Knowles-Yánez, K.; Moritz, C.; Fry, J.; Redman, C.L.; Bucchin, M.; McCartney, P.H. Historic Land Use Team: Phase I Report on Generalized Land Use; Central Arizona–Phoenix LTER: Phoenix, AZ, USA, 1999. [Google Scholar]
- Climate Data. Weather Chandler & Temperature by Month. 2024. Available online: https://en.climate-data.org/ (accessed on 17 July 2025).
- Kareem, H.H.; Nassrullah, S.A. Impact of climate changes on Arizona State precipitation patterns using high-resolution climatic gridded datasets. J. Groundw. Sci. Eng. 2025, 13, 46. [Google Scholar] [CrossRef]
- Hillel, D. Introduction to Soil Physics, 2nd ed.; Academic Press: Waltham, MA, USA, 2013. [Google Scholar]
- Philip, J.R. Evaporation, and moisture and heat fields in the soil. J. Atmos. Sci. 1957, 14, 354–366. [Google Scholar] [CrossRef]
- Kirkham, M.B. Principles of Soil and Plant Water Relations, 3rd ed.; Elsevier: Amsterdam, The Netherlands, 2023. [Google Scholar]
- City of Chandler. Housing in Chandler. 2025. Available online: https://www.chandleraz.gov (accessed on 22 July 2025).
- Linacre, E.T. A simple formula for estimating evaporation rates in various climates, using temperature data alone. Agric. Meteorol. 1977, 18, 409–424. [Google Scholar] [CrossRef]
- Davarzani, H.; Smits, K.; Tolene, R.M.; Illangasekare, T. Study of the effect of wind speed on evaporation from soil through integrated modeling of the atmospheric boundary layer and shallow subsurface. Water Resour. Res. 2014, 50, 661–680. [Google Scholar] [CrossRef]
- Farhat, N. Effect of relative humidity on evaporation rates in Nabatieh region. Leban. Sci. J. 2018, 19, 59–66. [Google Scholar] [CrossRef]
- Katsaros, K.; Steele, J.H. Evaporation and humidity. In Encyclopedia of Ocean Sciences; Academic Press: London, UK, 2001; pp. 870–877. [Google Scholar] [CrossRef]
- Youssef, Y.W.; Khodzinskaya, A. A review of evaporation reduction methods from water surfaces. In Proceedings of the E3S Web of Conferences; EDP Sciences: Les Ulis, France, 2019; Volume 97, p. 05044. [Google Scholar] [CrossRef]
- Wikipedia Contributors. Chandler, Arizona. Wikipedia, The Free Encyclopedia. Web. 1 August 2025. Available online: https://en.wikipedia.org/wiki/Chandler,_Arizona (accessed on 30 June 2025).
- Boundaries US. Chandler, AZ Boundary Lines. 2016. Available online: https://boundaries.us/place/az/chandler-city/ (accessed on 19 July 2025).
- Holle, R.L.; Selover, N.; Cerveny, R.; Mogil, H.M. The weather and climate of Arizona. Weatherwise 2015, 68, 12–19. [Google Scholar] [CrossRef]
- Al-Washali, T.; Sharma, S.; Kennedy, M. Methods of assessment of water losses in water supply systems: A review. Water Resour. Manag. 2016, 30, 4985–5001. [Google Scholar] [CrossRef]
- Condie, S.A.; Webster, I.T. The influence of wind stress, temperature, and humidity gradients on evaporation from reservoirs. Water Resour. Res. 1997, 33, 2813–2822. [Google Scholar] [CrossRef]
- Borodulin, V.Y.; Letushko, V.N.; Nizovtsev, M.I.; Sterlyagov, A.N. Influence of relative air humidity on evaporation of water—Ethanol solution droplets. Colloid J. 2021, 83, 277–283. [Google Scholar] [CrossRef]
- Golden, J.S.; Brazel, A.; Salmond, J.; Laws, D. Energy and water sustainability: The role of urban climate change from metropolitan infrastructure. J. Green Build. 2006, 1, 124–138. [Google Scholar] [CrossRef]
- Weather Spark. Climate and Average Weather Year Round in Chandler. 2024. Available online: https://weatherspark.com/y/2604/Average-Weather-in-Chandler-Arizona-United-States-Year-Round#google_vignette (accessed on 19 July 2025).
- Weather Underground. Chandler, AZ Weather History. 2024. Available online: https://weatherspark.com/y/2604/Average-Weather-in-Chandler-Arizona-United-States-Year-Round#google_vignette (accessed on 19 July 2025).
- Beuhler, M. Potential impacts of global warming on water resources in southern California. Water Sci. Technol. 2003, 47, 165–168. [Google Scholar] [CrossRef]
- City of Chandler. Land Use Concept. 2025. Available online: https://www.chandleraz.gov (accessed on 25 July 2025).
- City of Chandler. Future Land Use Plan Map. 2025. Available online: https://www.chandleraz.gov (accessed on 25 July 2025).
- Tardieu, F. Plant response to environmental conditions: Assessing potential production, water demand, and negative effects of water deficit. Front. Physiol. 2013, 4, 17. [Google Scholar] [CrossRef] [PubMed]
- Tietjen, B.; Jeltsch, F.; Zehe, E.; Classen, N.; Groengroeft, A.; Schiffers, K.; Oldeland, J. Effects of climate change on the coupled dynamics of water and vegetation in drylands. Ecohydrology 2010, 3, 226–237. [Google Scholar] [CrossRef]
- Ni, J.; Cheng, Y.; Wang, Q.; Ng, C.W.W.; Garg, A. Effects of vegetation on soil temperature and water content: Field monitoring and numerical modelling. J. Hydrol. 2019, 571, 494–502. [Google Scholar] [CrossRef]
- Rehana, S.; Mujumdar, P.P. Regional impacts of climate change on irrigation water demands. Hydrol. Process. 2013, 27, 2918–2933. [Google Scholar] [CrossRef]
- Makar, R.S.; Shahin, S.A.; El-Nazer, M.; Wheida, A.; Abd El-Hady, M. Evaluating the impacts of climate change on irrigation water requirements. Sustainability 2022, 14, 14833. [Google Scholar] [CrossRef]
- McClaran, M.P.; Brady, W.W. Arizona’s diverse vegetation and contributions to plant ecology. Rangelands 1994, 16, 208–217. Available online: https://repository.arizona.edu/bitstream/handle/10150/639014/11222-10764-1-PB.pdf?sequence=1 (accessed on 15 July 2025).
- Turner, R.M.; Bowers, J.E.; Burgess, T.L. Sonoran Desert Plants: An Ecological Atlas; University of Arizona Press: Tucson, AZ, USA, 2005. [Google Scholar]
- Huxman, T.E.; Smith, M.D.; Fay, P.A.; Knapp, A.K.; Shaw, M.R.; Loik, M.E.; Smith, S.D.; Tissue, D.T.; Zak, J.C.; Weltzin, J.F.; et al. Convergence across biomes to a common rain-use efficiency. Nature 2004, 429, 651–654. [Google Scholar] [CrossRef]
- Ward, J.P.; Smith, S.E.; McClaran, M.P. Water requirements for emergence of buffelgrass (Pennisetum ciliare). Weed Sci. 2006, 54, 720–725. [Google Scholar] [CrossRef]
- Sharifi, M.R.; Meinzer, F.C.; Nilsen, E.T.; Rundel, P.W.; Virginia, R.A.; Jarrell, W.M.; Herman, D.J.; Clark, P.C. Effect of manipulation of water and nitrogen supplies on the quantitative phenology of Larrea tridentata (creosote bush) in the Sonoran Desert of California. Am. J. Bot. 1988, 75, 1163–1174. [Google Scholar] [CrossRef]
- Allen, R.G.; Dukes, M.D.; Snyder, R.L.; Kjelgren, R.; Kilic, A. A review of landscape water requirements using a multicomponent landscape coefficient. Trans. ASABE 2020, 63, 2039–2058. [Google Scholar] [CrossRef]
- Romero, C.C.; Dukes, M.D. Review of turfgrass evapotranspiration and crop coefficients. Trans. ASABE 2016, 59, 207–223. [Google Scholar] [CrossRef]
- Li, J.; Fei, L.; Li, S.; Xue, C.; Shi, Z.; Hinkelmann, R. Development of “water-suitable” agriculture based on a statistical analysis of factors affecting irrigation water demand. Sci. Total Environ. 2020, 744, 140986. [Google Scholar] [CrossRef] [PubMed]
- Fischer, G.; Tubiello, F.N.; Van Velthuizen, H.; Wiberg, D.A. Climate change impacts on irrigation water requirements: Effects of mitigation, 1990–2080. Technol. Forecast. Soc. Change 2007, 74, 1083–1107. [Google Scholar] [CrossRef]
- Kanzler, M.; Böhm, C.; Mirck, J.; Schmitt, D.; Veste, M. Microclimate effects on evaporation and winter wheat (Triticum aestivum L.) yield within a temperate agroforestry system. Agrofor. Syst. 2019, 93, 1821–1841. [Google Scholar] [CrossRef]
- Arkebauer, T.J. Physicochemical and Environmental Plant Physiology. Crop Sci. 2000, 40, 847. [Google Scholar] [CrossRef]
- Zhao, H.; Di, L.; Guo, L.; Zhang, C.; Lin, L. An automated data-driven irrigation scheduling approach using model simulated soil moisture and evapotranspiration. Sustainability 2023, 15, 12908. [Google Scholar] [CrossRef]
- Farnham, C.; Nakao, M.; Nabeshima, M.; Mizuno, T. Effect of water temperature on evaporation of mist sprayed from a nozzle. Climate 2015, 3, 1–10. Available online: https://heat-island.jp/web_journal/download/15A004.pdf (accessed on 15 July 2025).
- Khan, J.; Arsalan, M.H. Solar power technologies for sustainable electricity generation—A review. Renew. Sustain. Energy Rev. 2016, 55, 414–425. [Google Scholar] [CrossRef]
- Hong, S.W.; Lee, I.B.; Seo, I.H. Modelling and predicting wind velocity patterns for windbreak fence design. J. Wind Eng. Ind. Aerodyn. 2015, 142, 53–64. [Google Scholar] [CrossRef]
- Seginer, I. Wind effect on the evaporation rate. J. Appl. Meteorol. 1971, 10, 215–220. Available online: https://www.jstor.org/stable/26174903 (accessed on 15 July 2025). [CrossRef]
- Idowu, O.M.; Junaid, S.M.; Humphrey, S. Effect of fence design on natural ventilation in residential spaces: An experimental study. Arid Zone J. Eng. Technol. Environ. 2017, 13, 469–477. [Google Scholar]
- Ephrath, J.E.; Goudriaan, J.; Marani, A. Modelling diurnal patterns of air temperature, radiation, wind speed and relative humidity by equations from daily characteristics. Agric. Syst. 1996, 51, 377–393. [Google Scholar] [CrossRef]
- Pereira, L.S.; Oweis, T.; Zairi, A. Irrigation management under water scarcity. Agric. Water Manag. 2002, 57, 175–206. [Google Scholar] [CrossRef]
- Garg, A.; Hazra, B.; Zhu, H.; Wen, Y. A simplified probabilistic analysis of water content and wilting in soil vegetated with non-crop species. Catena 2019, 175, 123–131. [Google Scholar] [CrossRef]
- Sahu, C.K.; Behera, P. A low cost smart irrigation control system. In Proceedings of the 2015 2nd International Conference on Electronics and Communication Systems (ICECS), Coimbatore, India, 26–27 February 2015; IEEE: Piscataway, NJ, USA, 2015; pp. 1146–1152. [Google Scholar] [CrossRef]
- Lunstad, N.T.; Sowby, R.B. Smart irrigation controllers in residential applications and the potential of integrated water distribution systems. J. Water Resour. Plan. Manag. 2024, 150, 03123002. [Google Scholar] [CrossRef]
- Davis, S.L.; Dukes, M.D. Irrigation scheduling performance by evapotranspiration-based controllers. Agric. Water Manag. 2010, 98, 19–28. [Google Scholar] [CrossRef]
- Oikonomou, K.; Parvania, M.; Khatami, R. Optimal demand response scheduling for water distribution systems. IEEE Trans. Ind. Inform. 2018, 14, 5112–5122. [Google Scholar] [CrossRef]
- Koech, R.; Langat, P. Improving irrigation water use efficiency: A review of advances, challenges and opportunities in the Australian context. Water 2018, 10, 1771. [Google Scholar] [CrossRef]
- Romano, M.; Kapelan, Z. Adaptive water demand forecasting for near real-time management of smart water distribution systems. Environ. Model. Softw. 2014, 60, 265–276. [Google Scholar] [CrossRef]
- Mahpeykar, O.; Khalilabadi, M.R. Numerical modelling the effect of wind on water level and evaporation rate in the Persian Gulf. Int. J. Coast. Offshore Environ. Eng. 2021, 6, 47–53. [Google Scholar]
- Wickert, D.; Prokop, G. Simulation of water evaporation under natural conditions—A state-of-the-art overview. Exp. Comput. Multiph. Flow 2021, 3, 242–249. [Google Scholar] [CrossRef]
- Bertram, J.; Dewar, R.C. Statistical patterns in tropical tree cover explained by the different water demand of individual trees and grasses. Ecology 2013, 94, 2138–2144. [Google Scholar] [CrossRef]
- Gao, F.; Zhang, X. Mapping crop phenology in near real-time using satellite remote sensing: Challenges and opportunities. J. Remote Sens. 2021, 8379391. [Google Scholar] [CrossRef]
- Hanjra, M.A.; Qureshi, M.E. Global water crisis and future food security in an era of climate change. Food Policy 2010, 35, 365–377. [Google Scholar] [CrossRef]

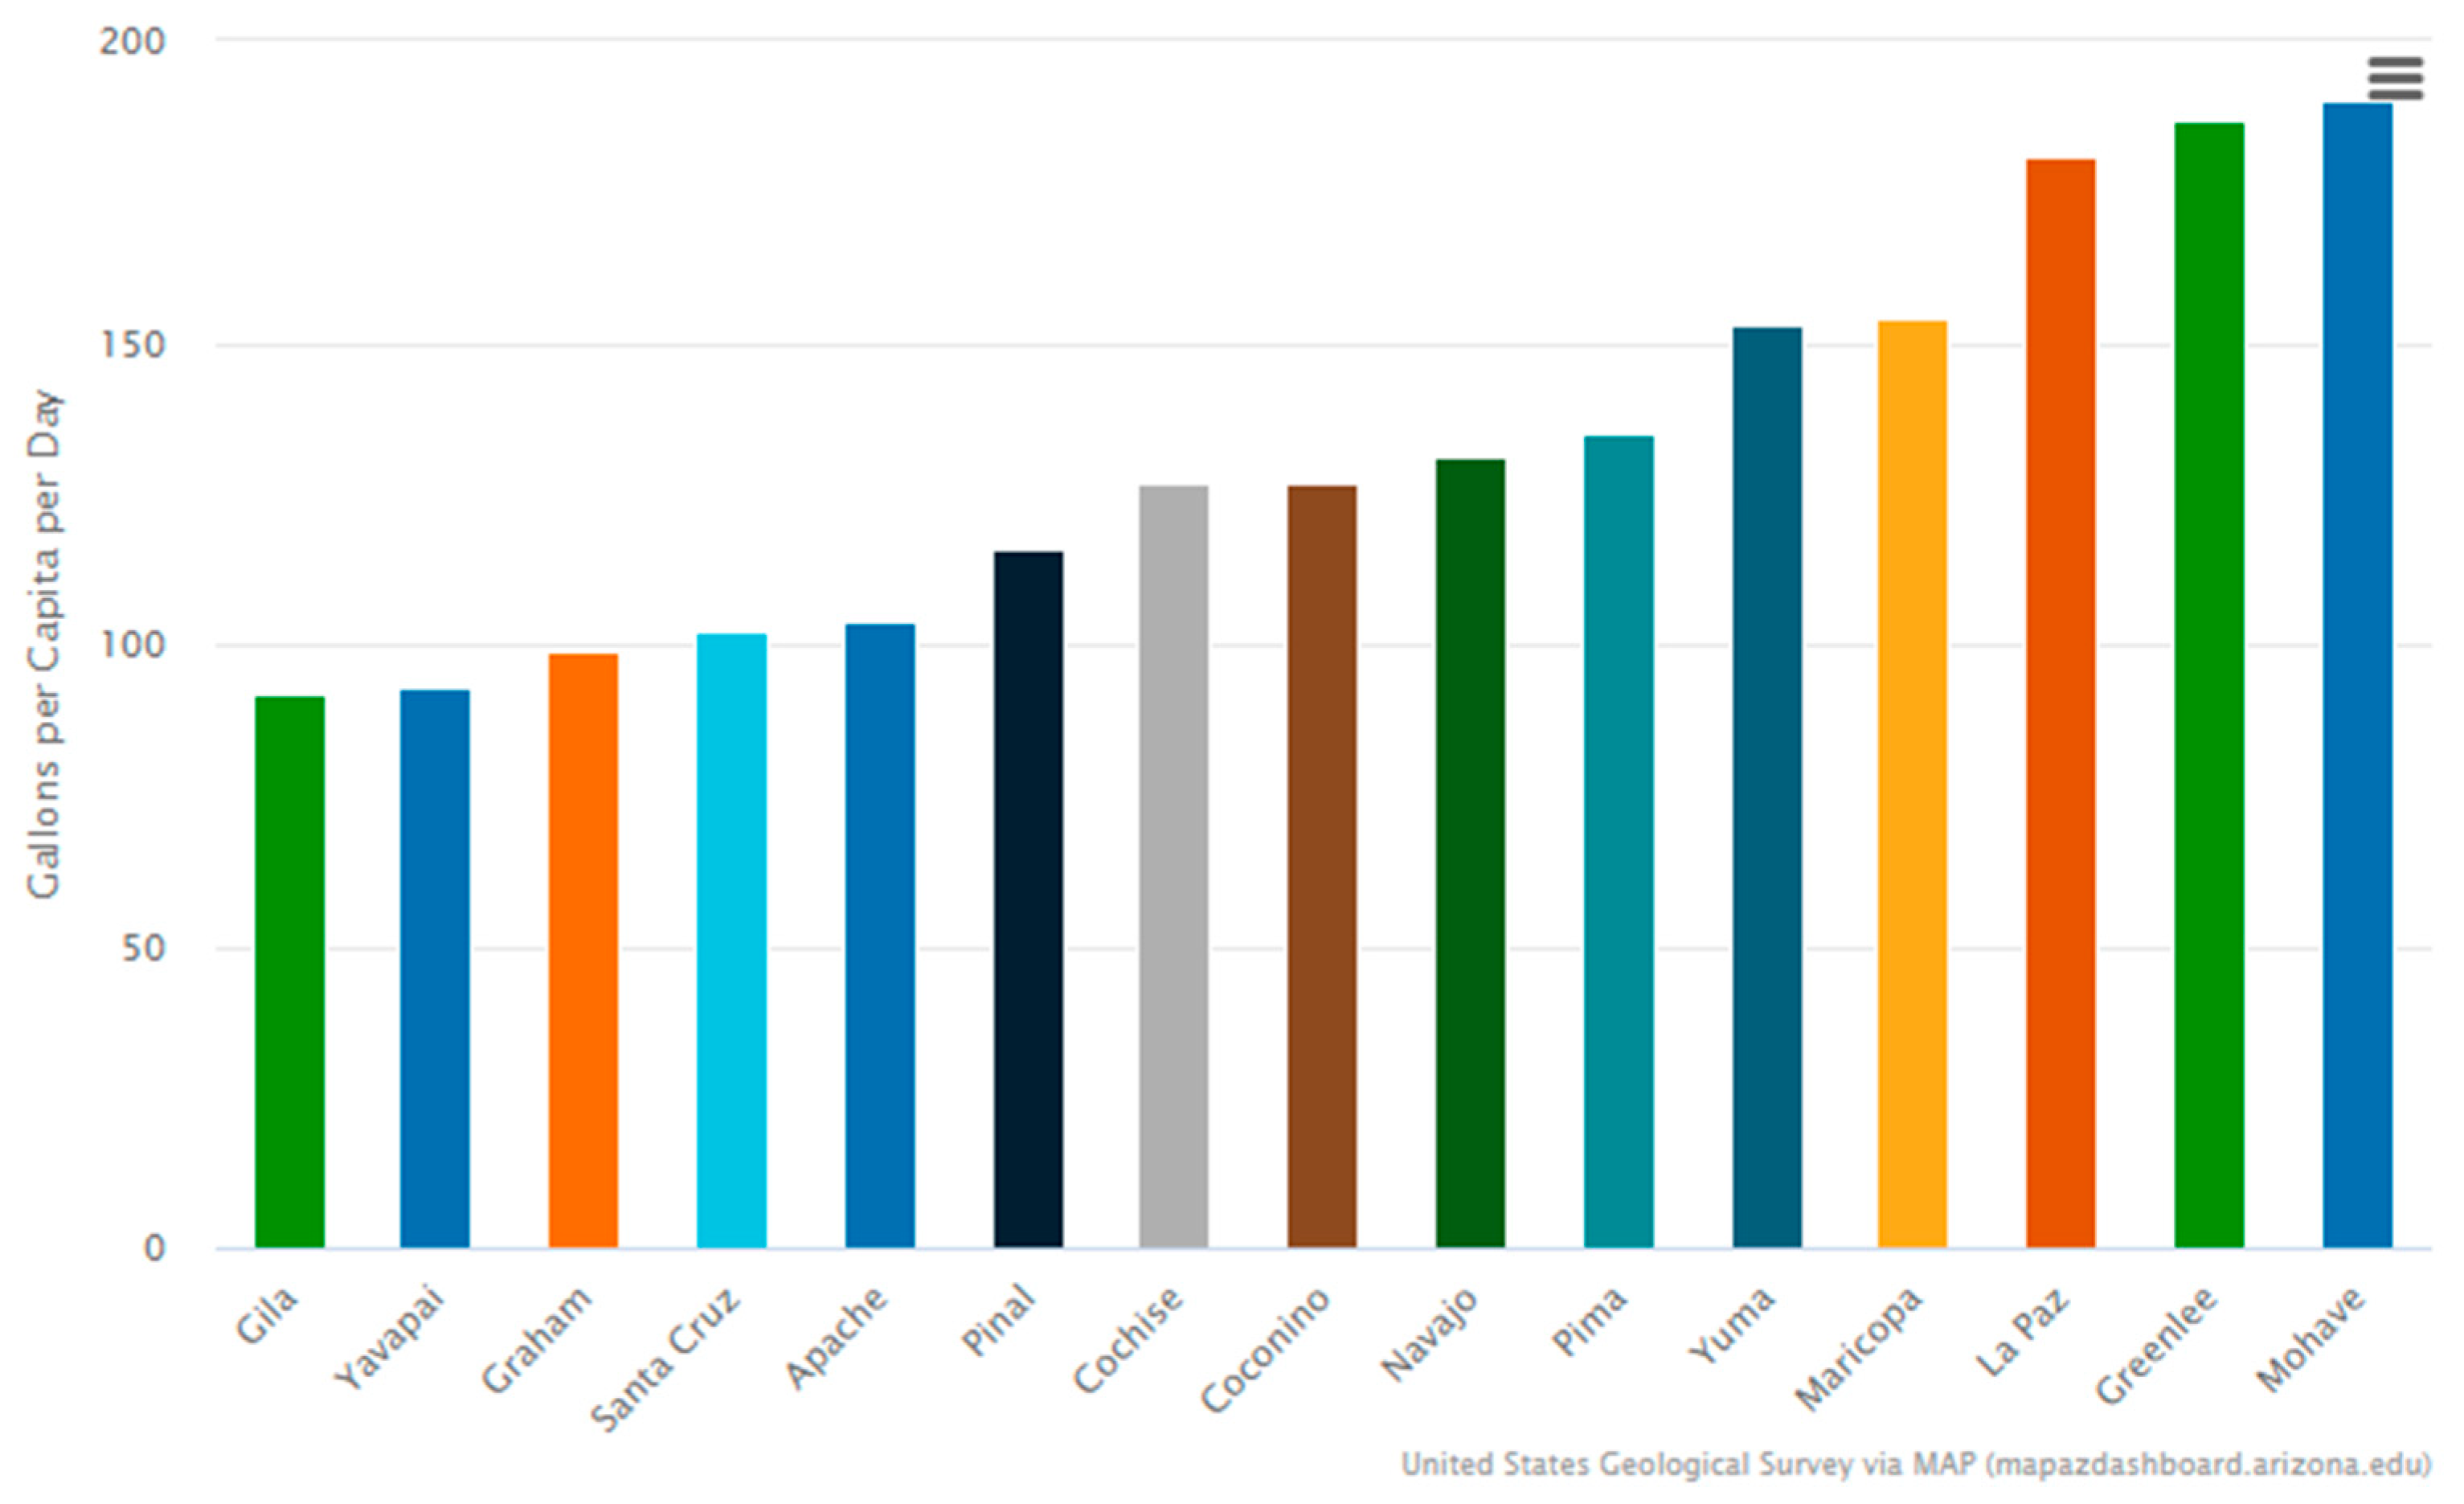
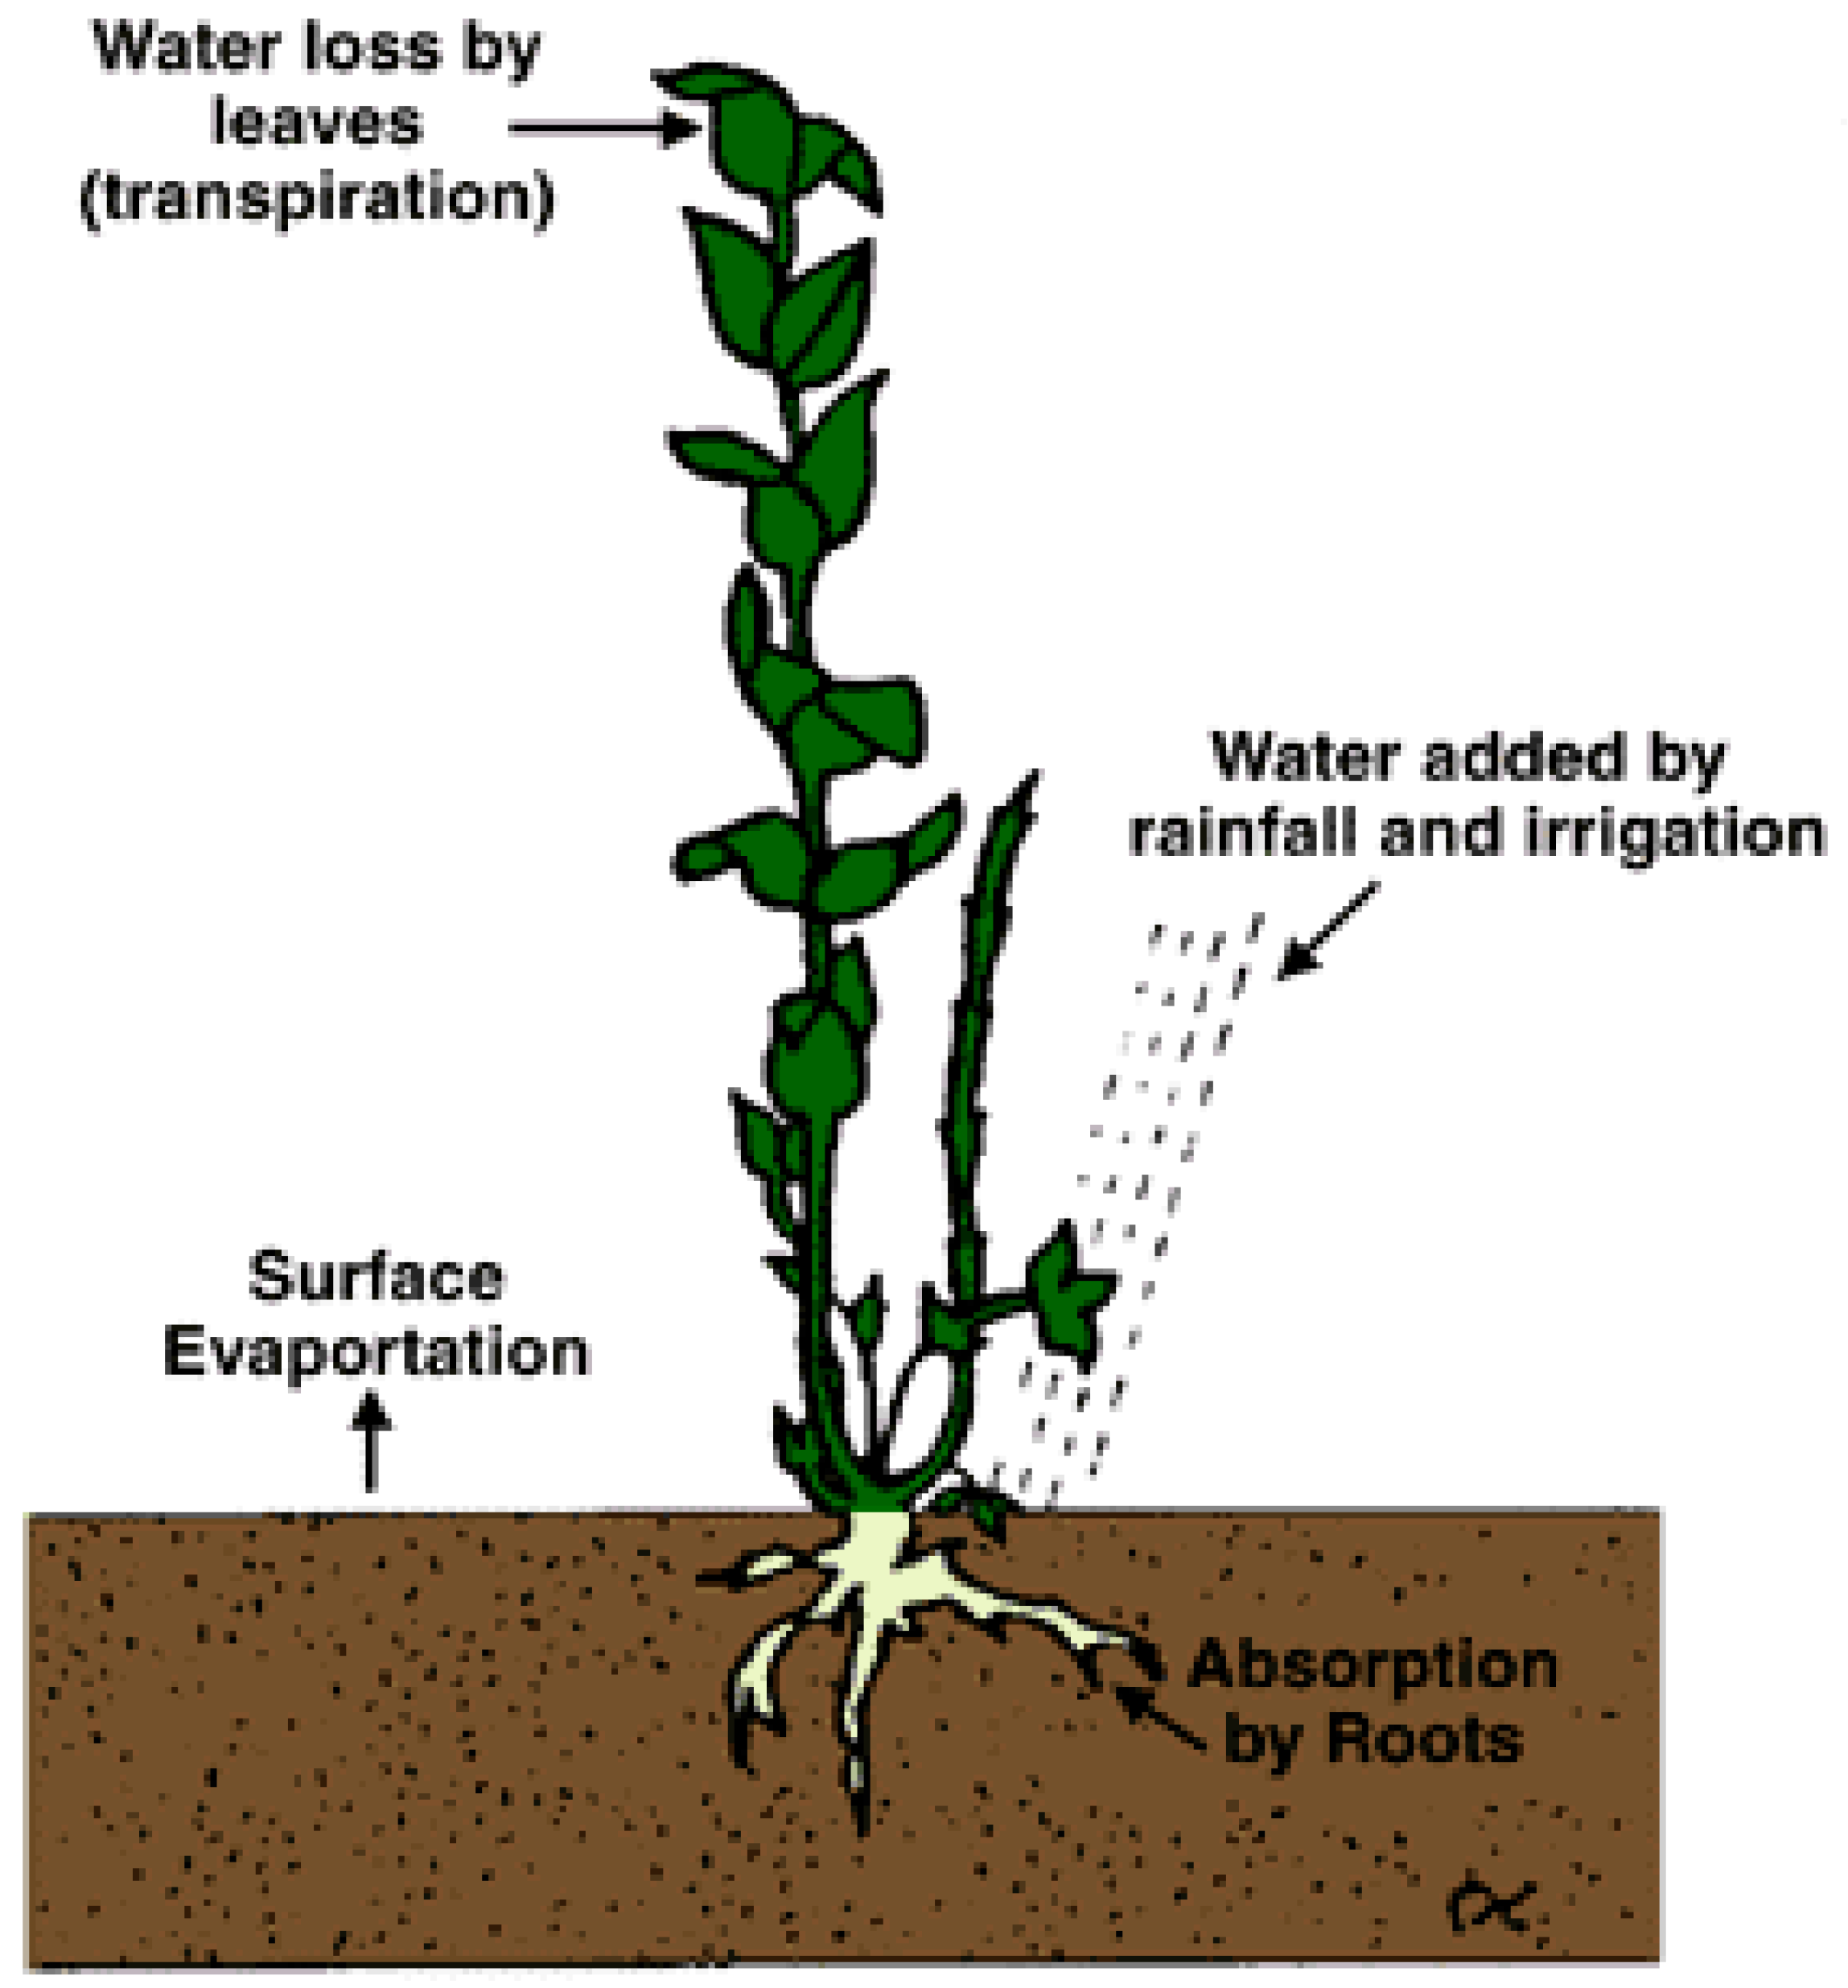
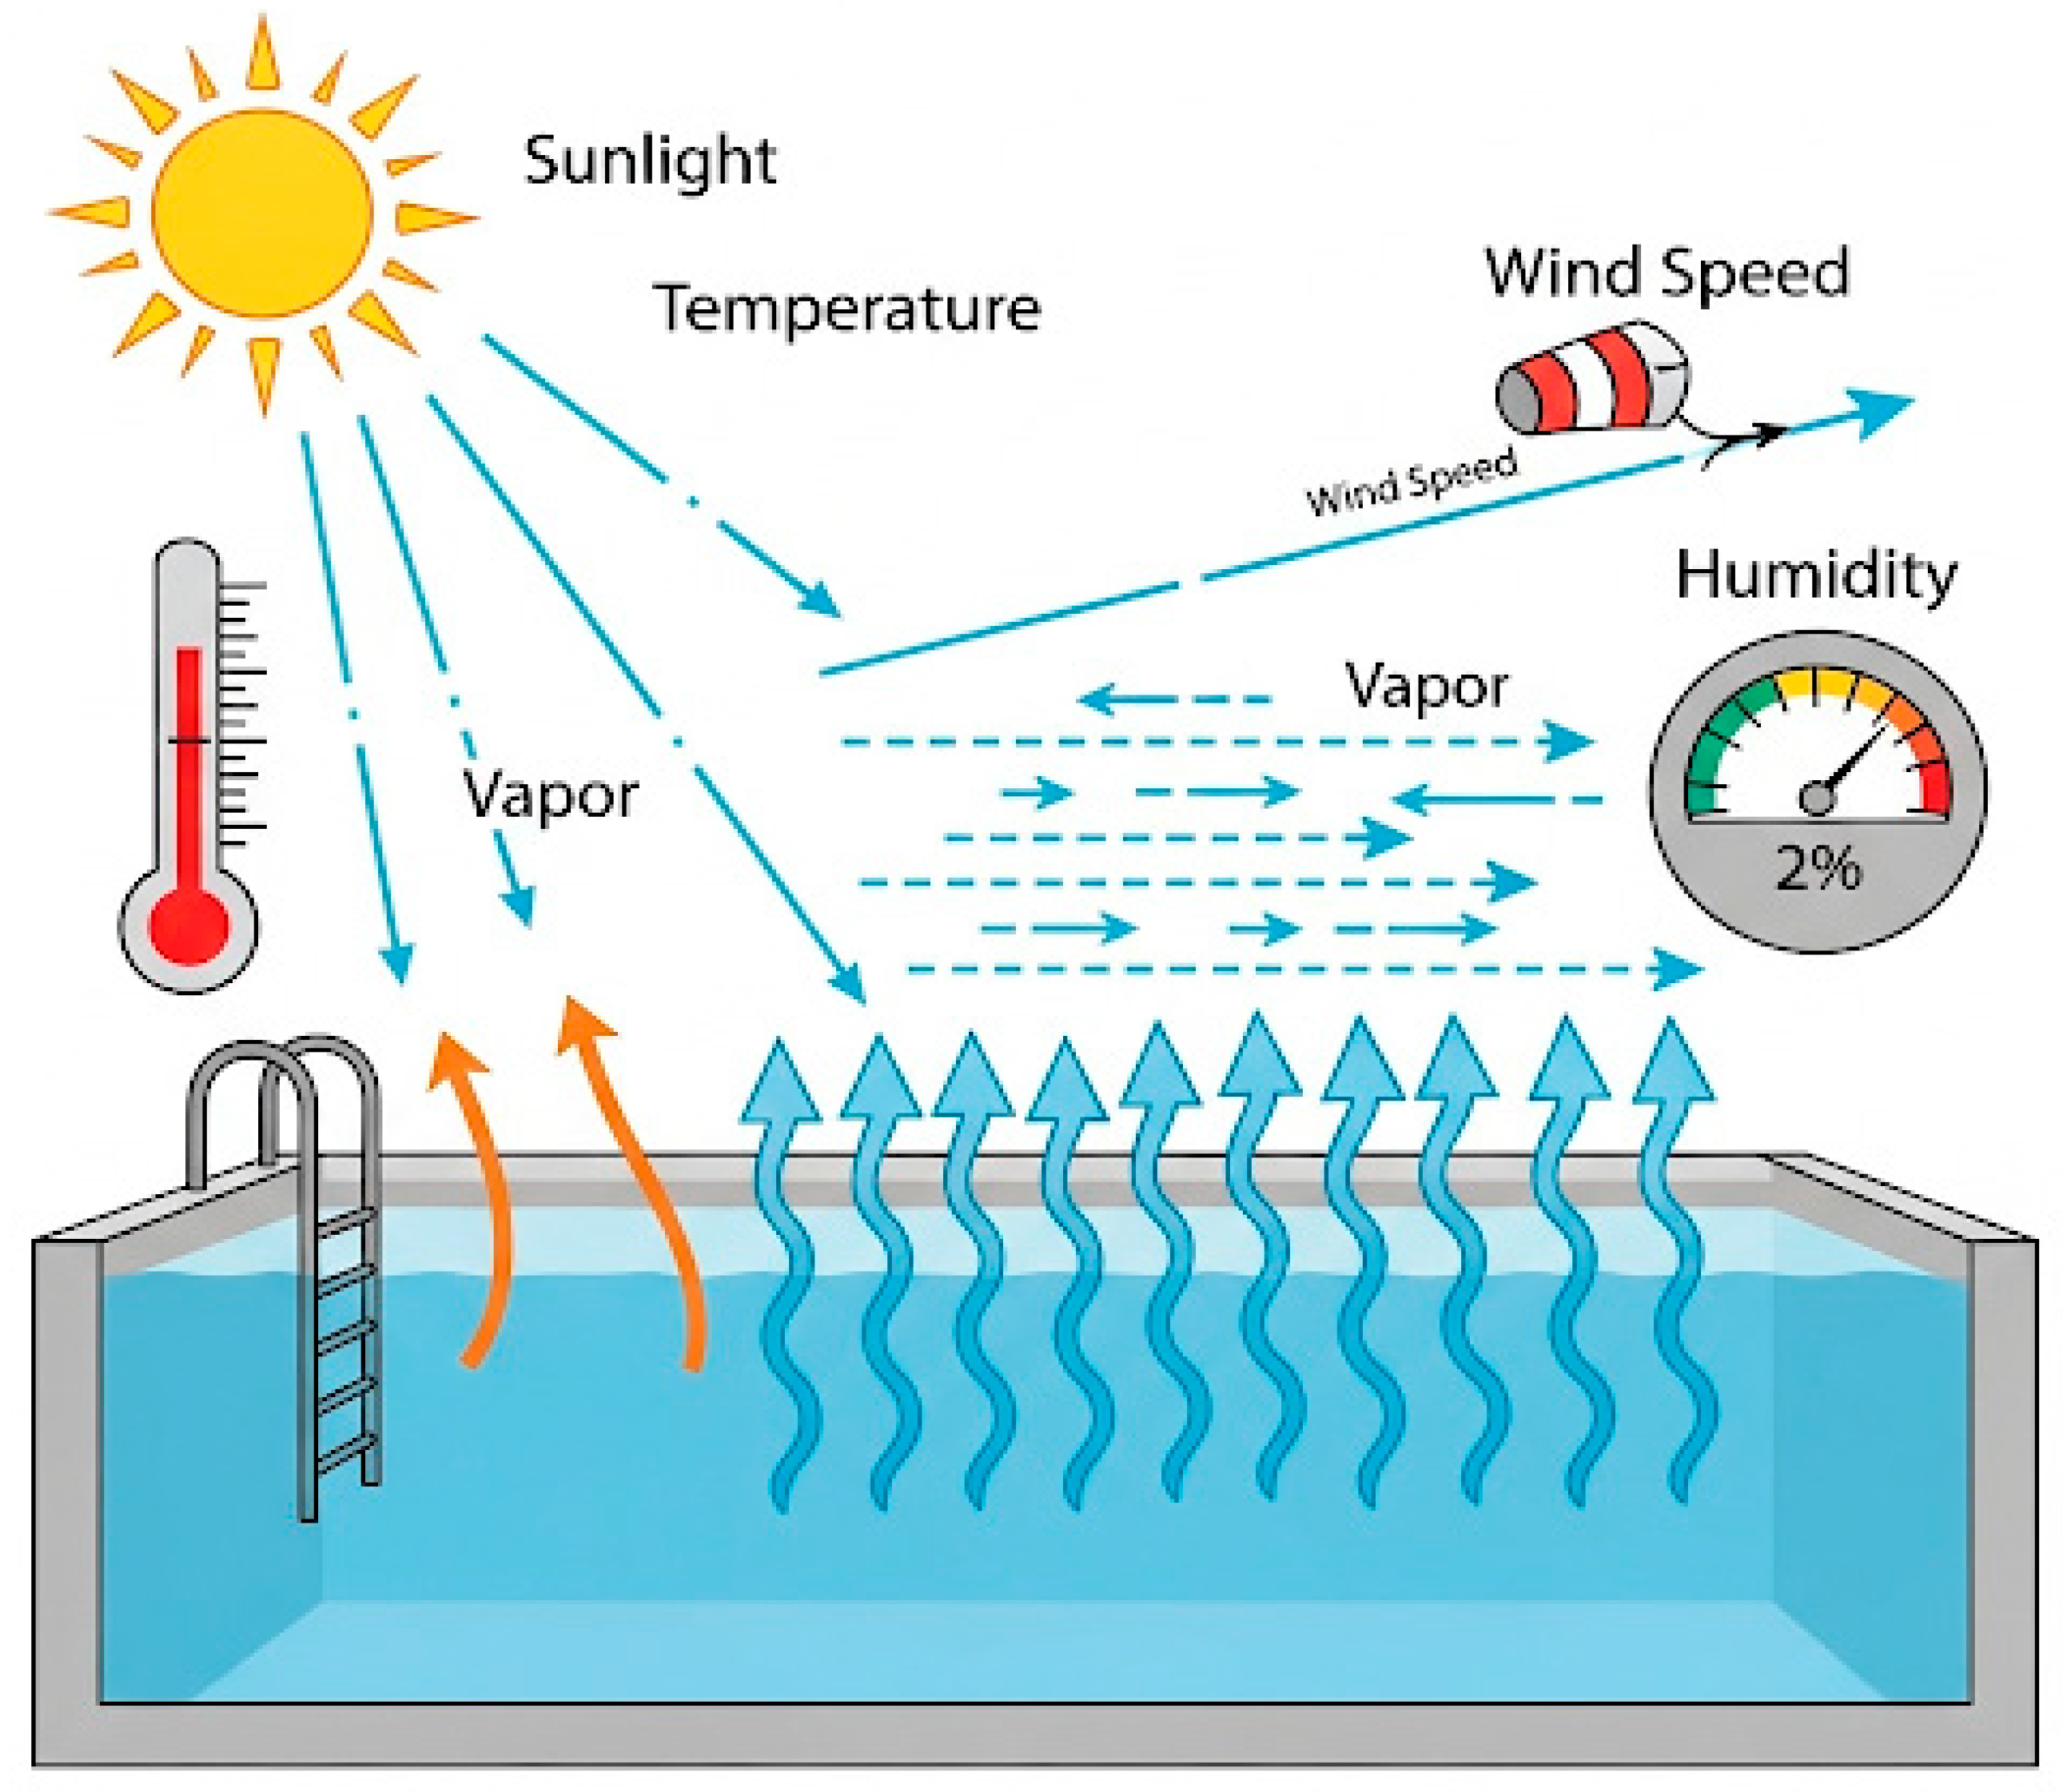

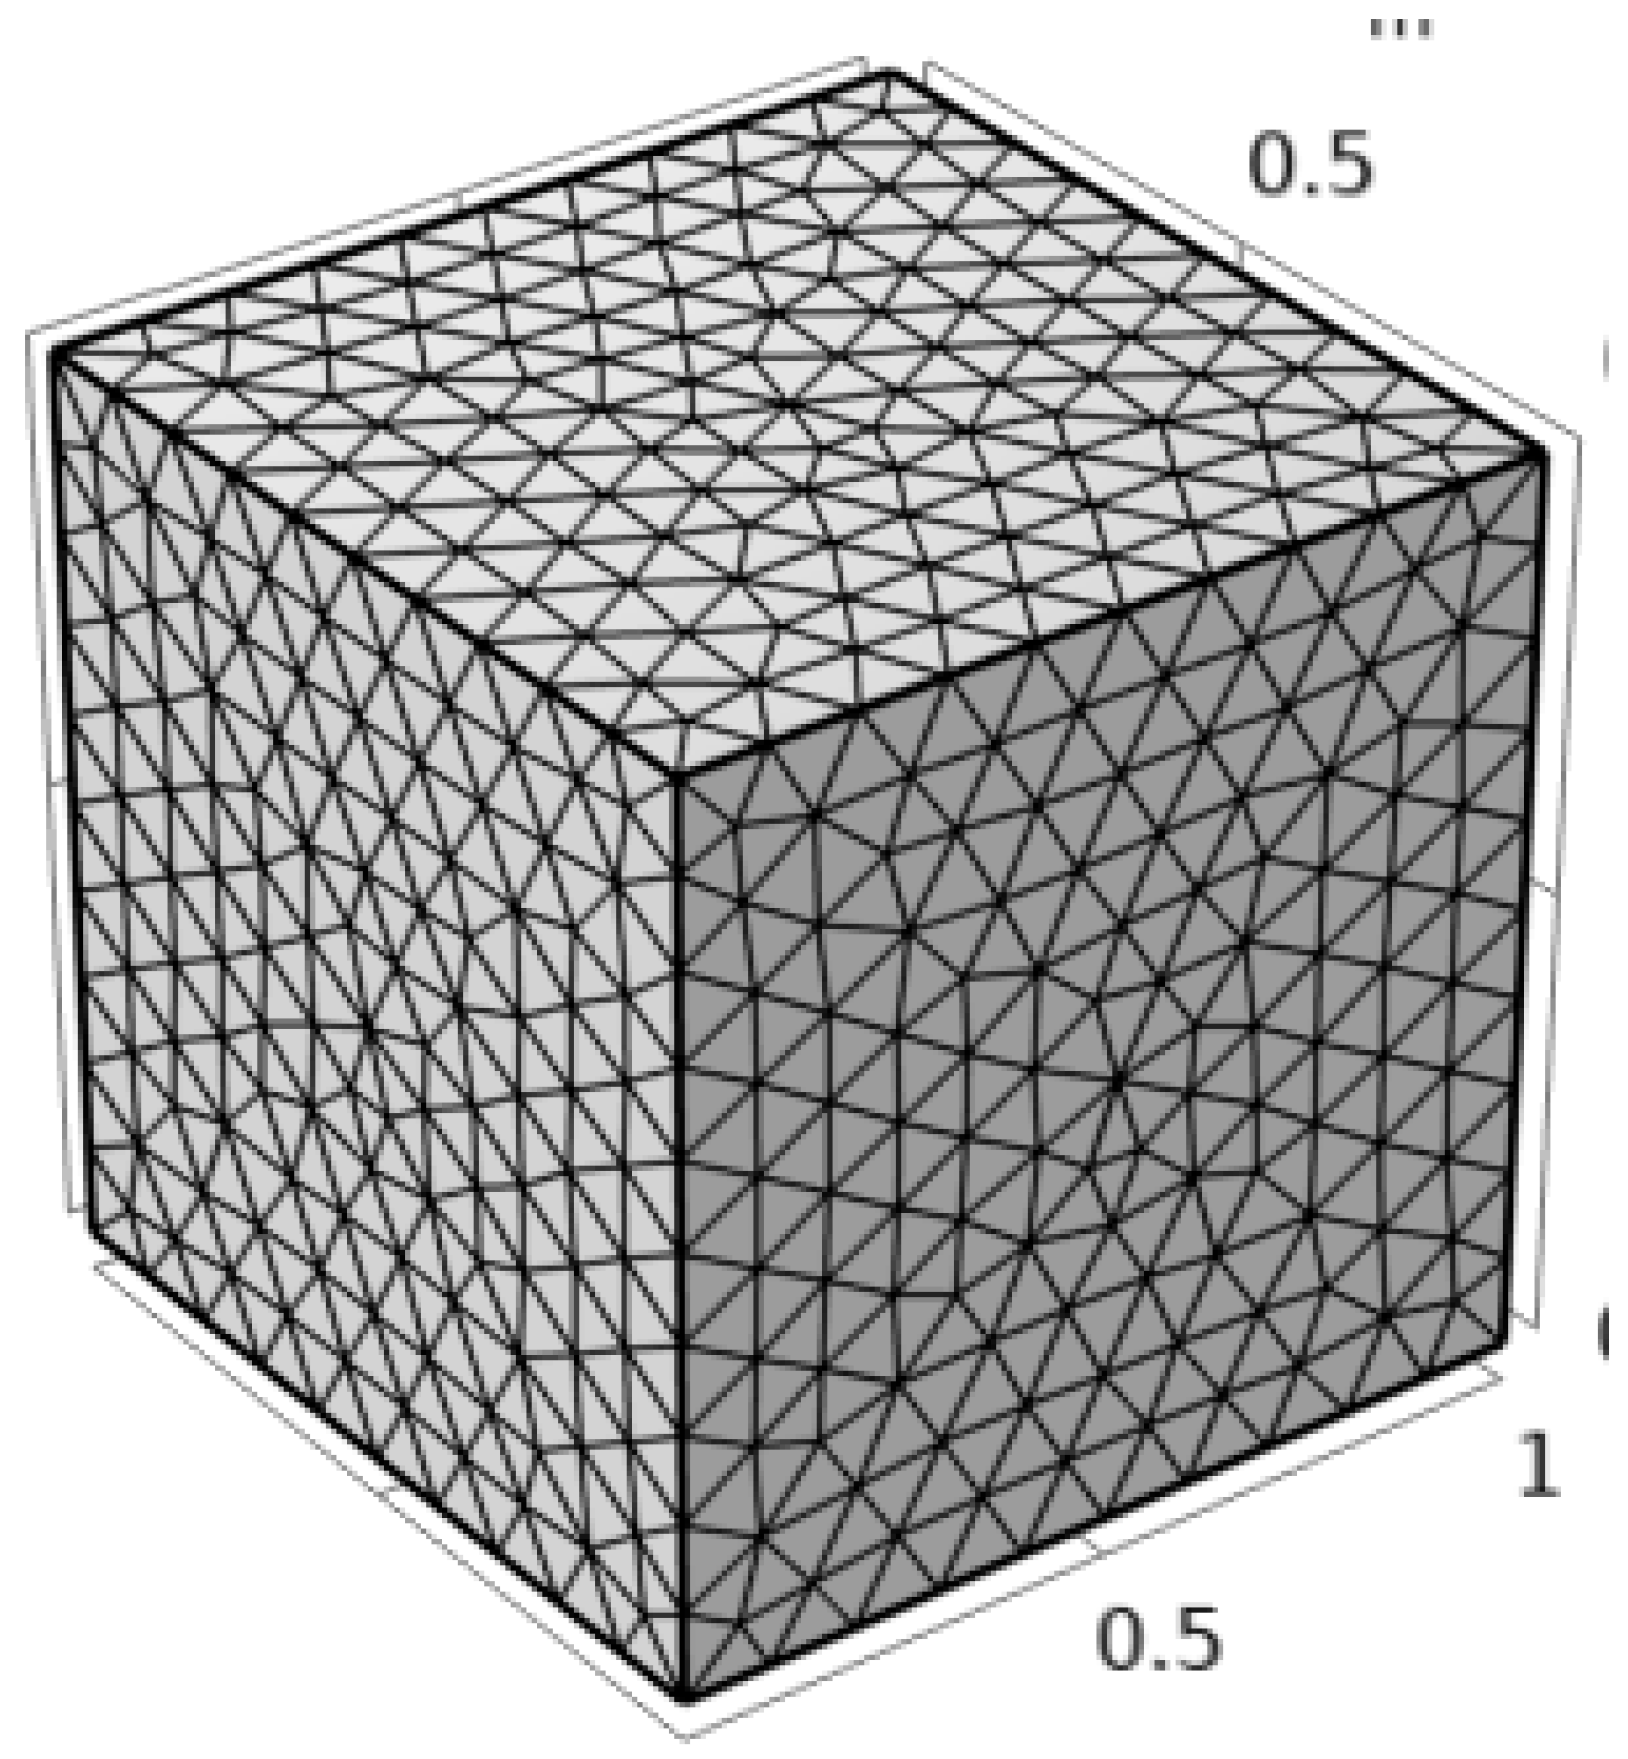

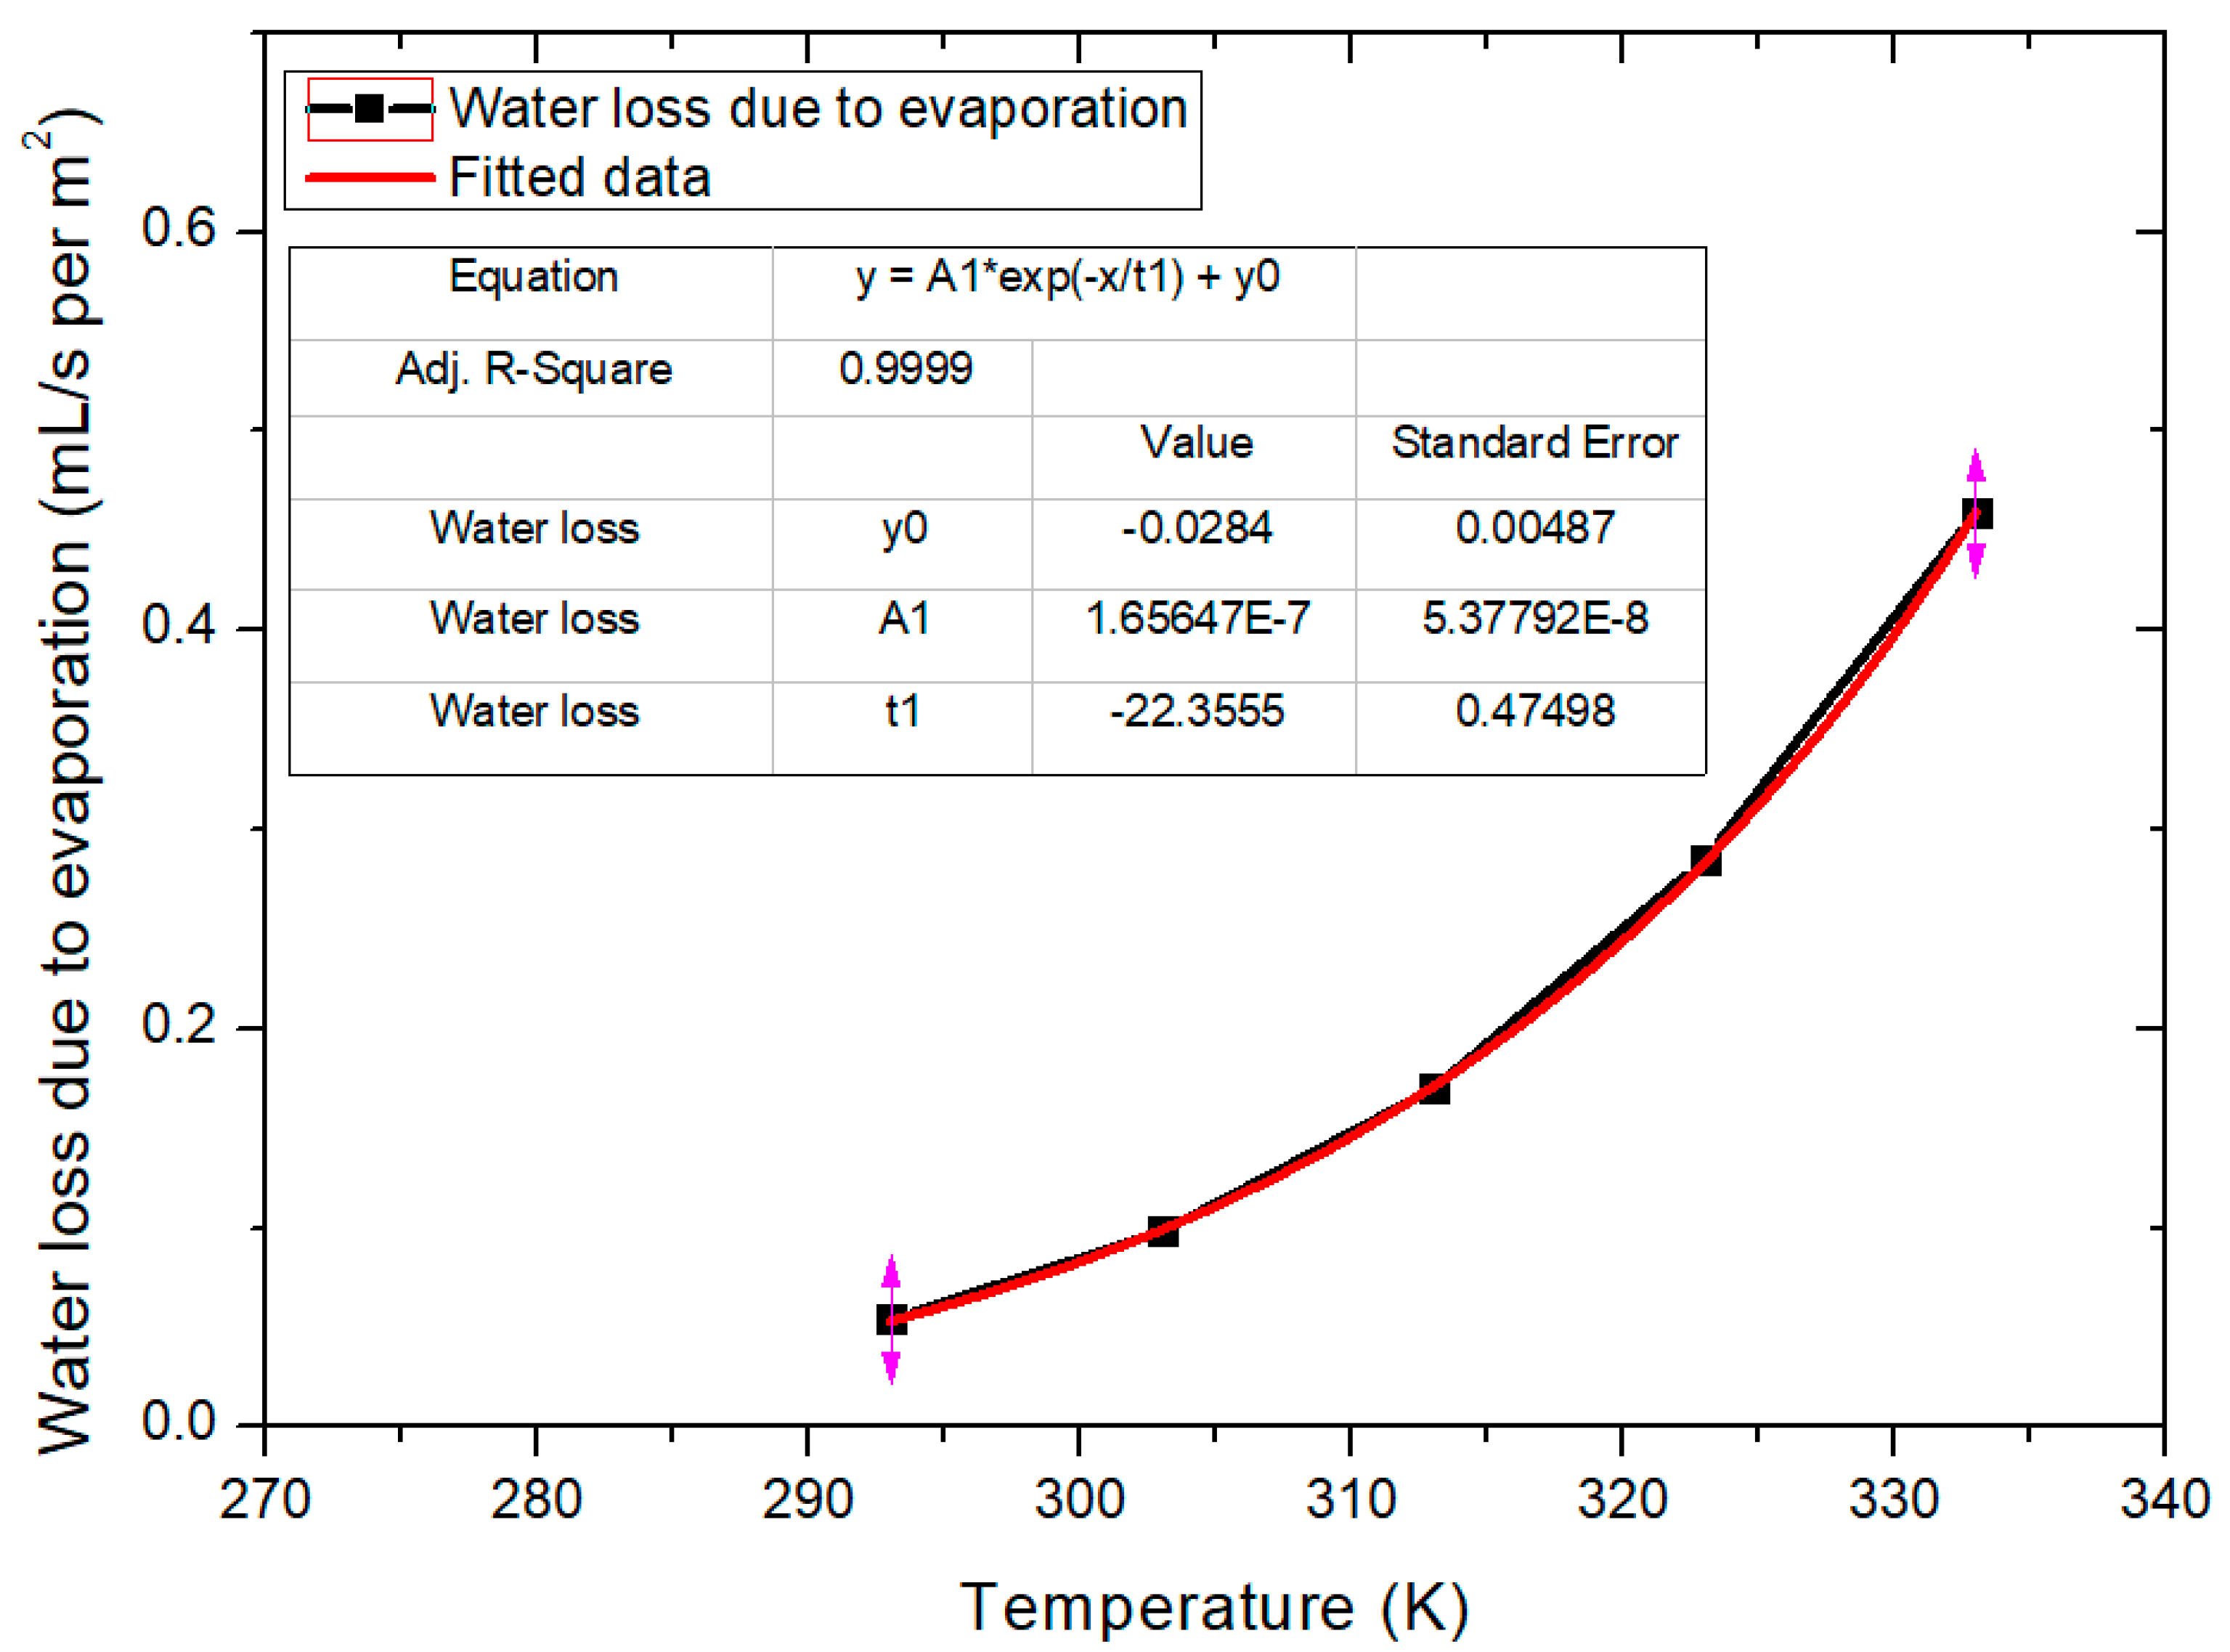


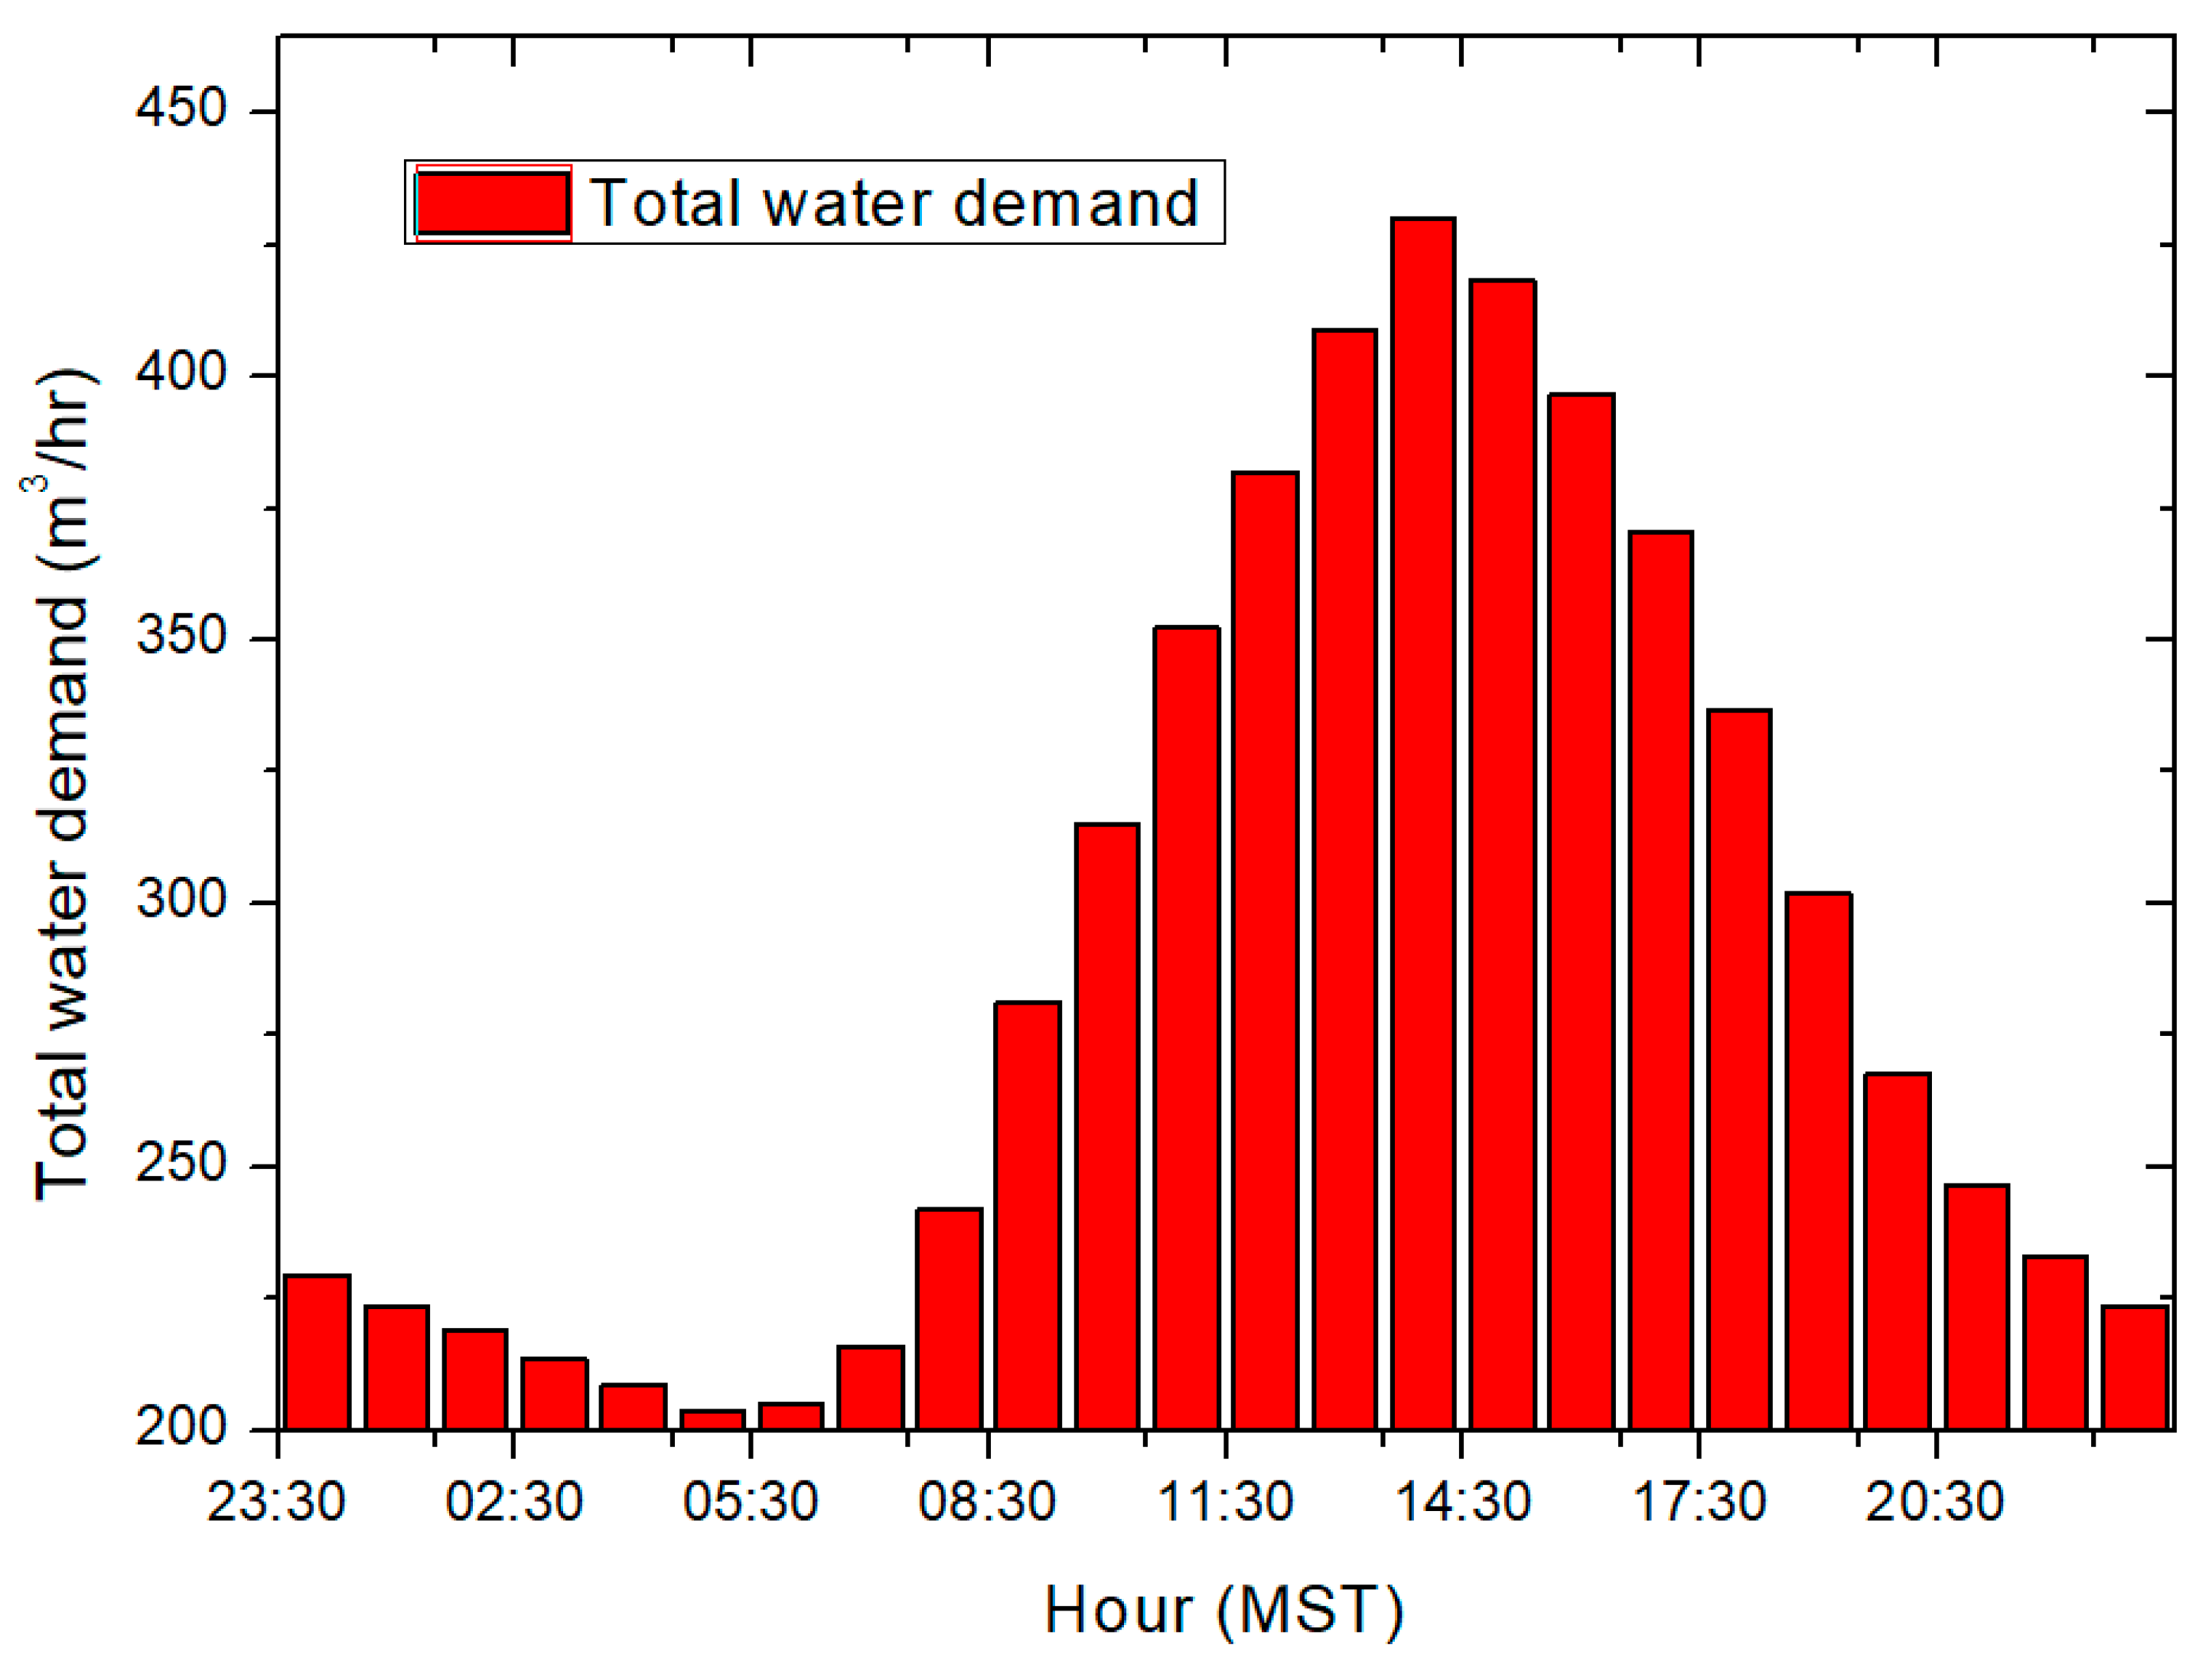
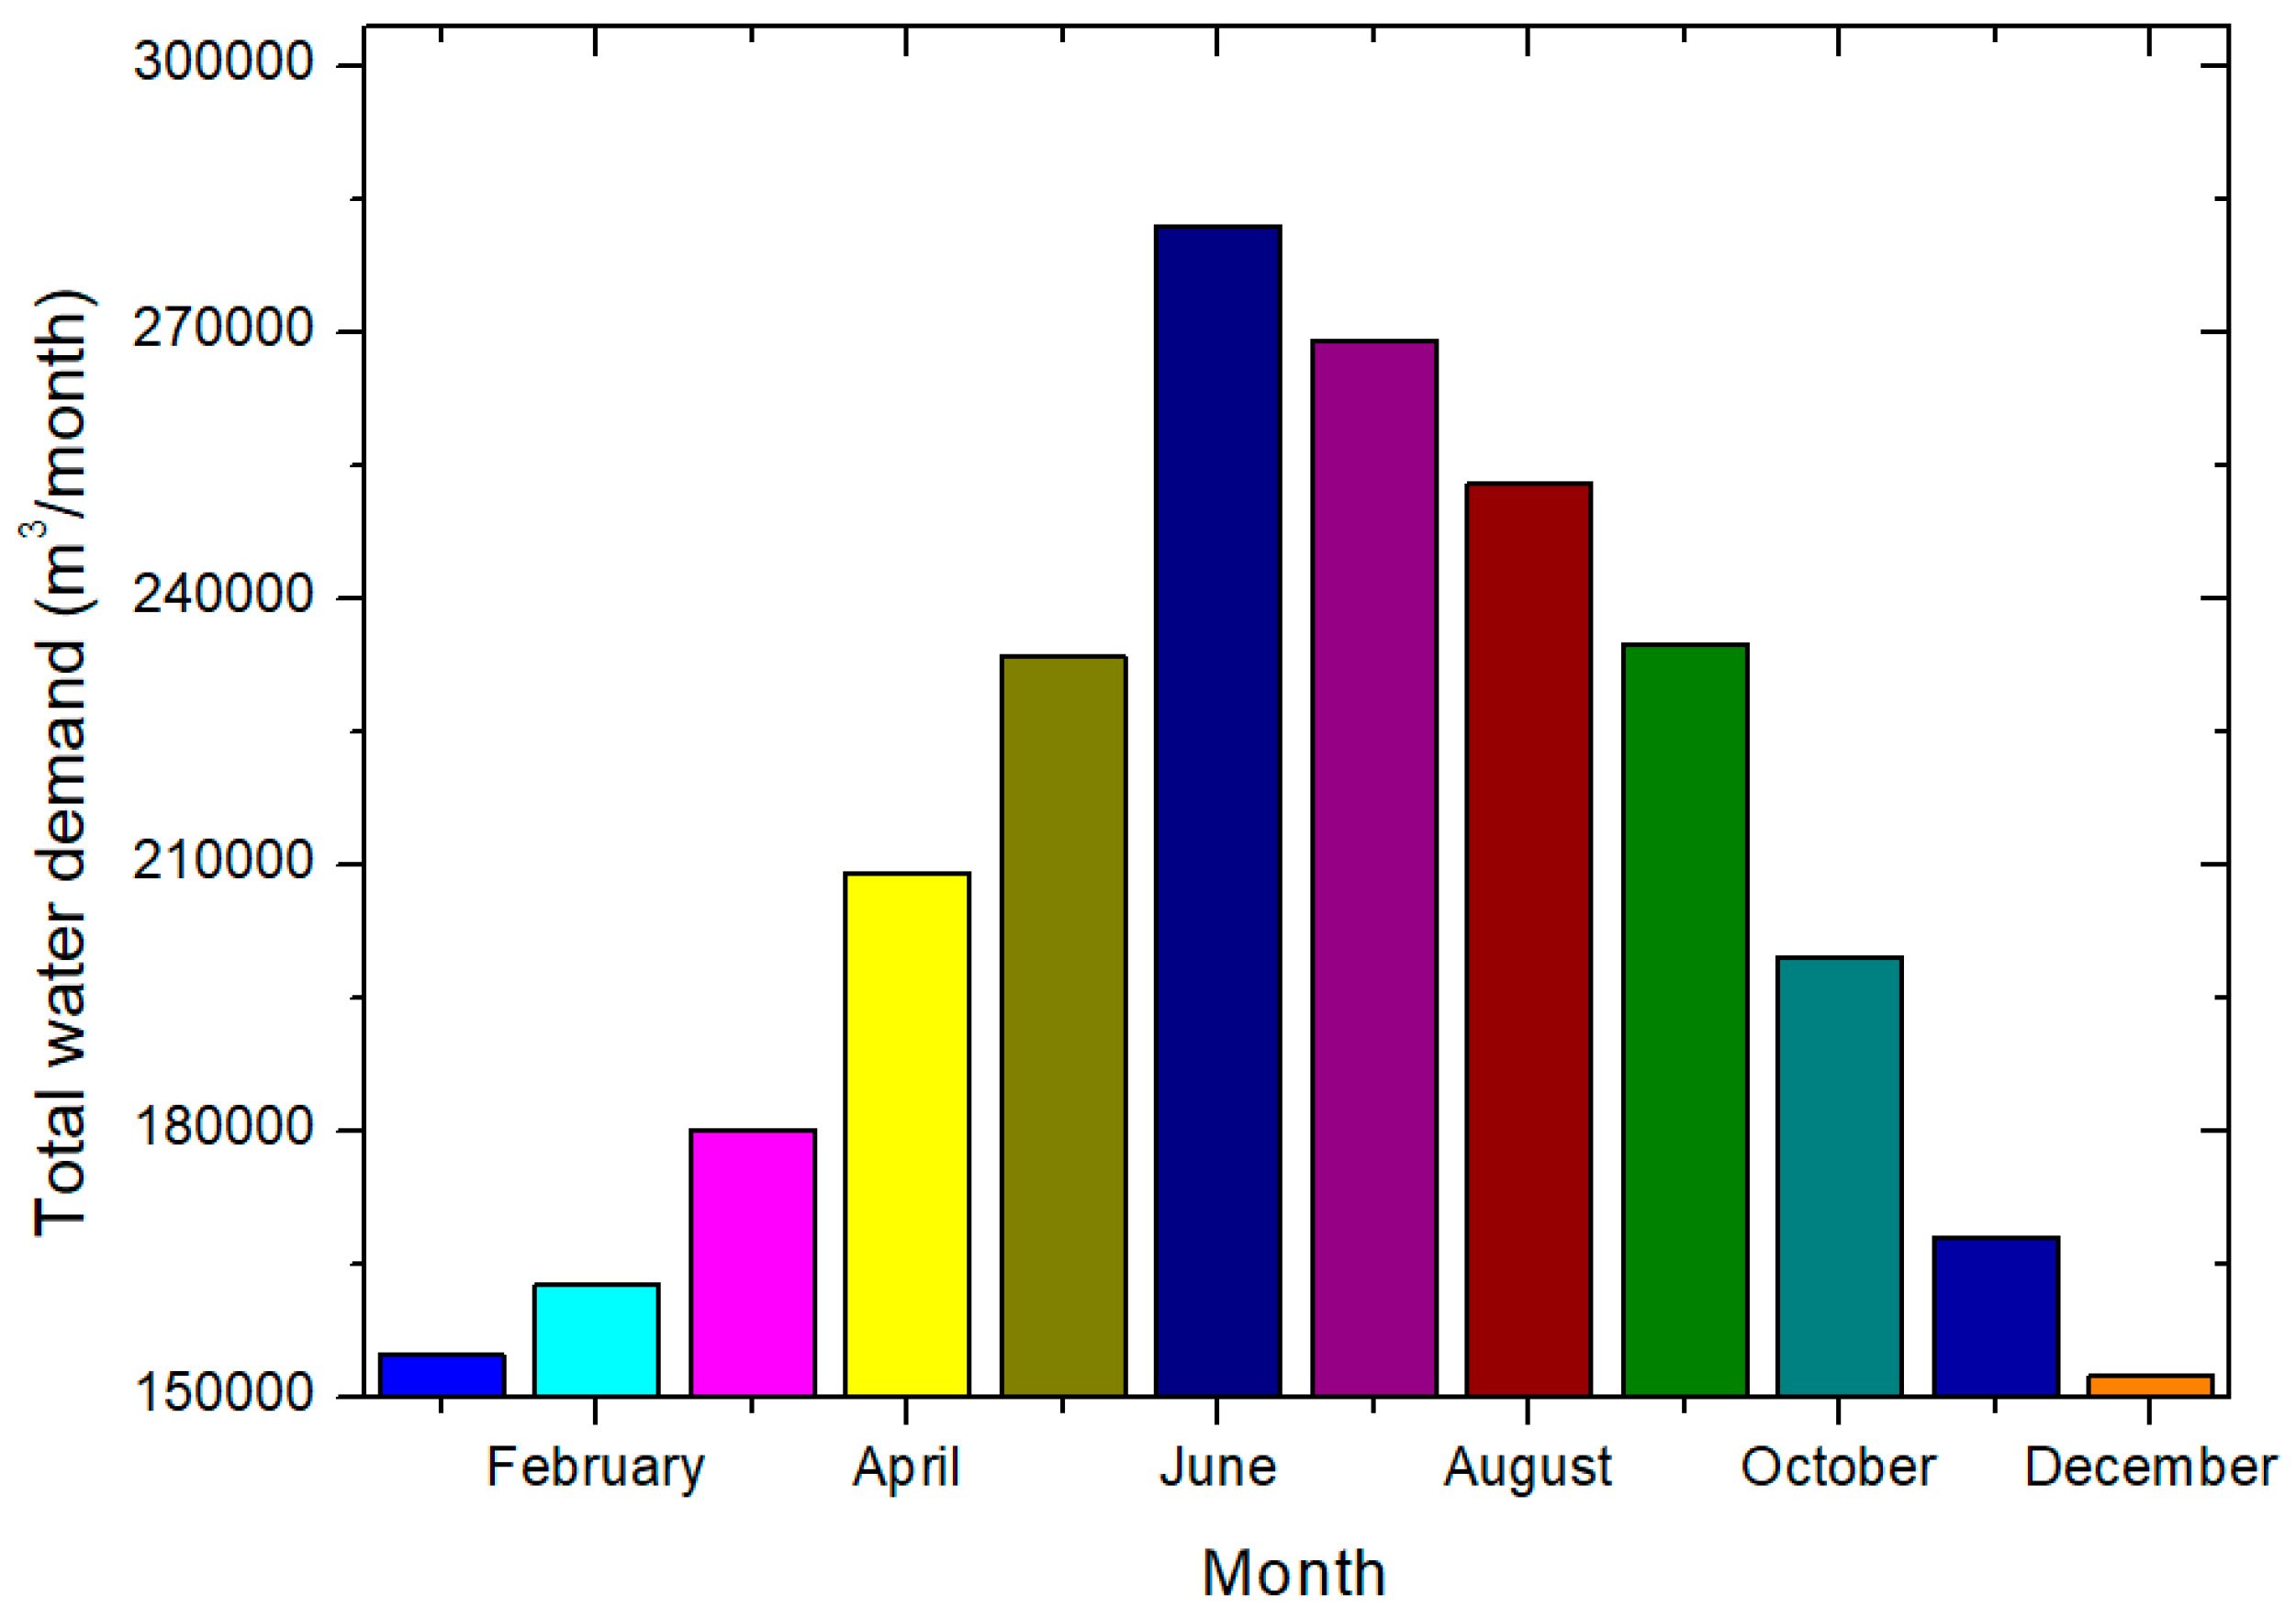
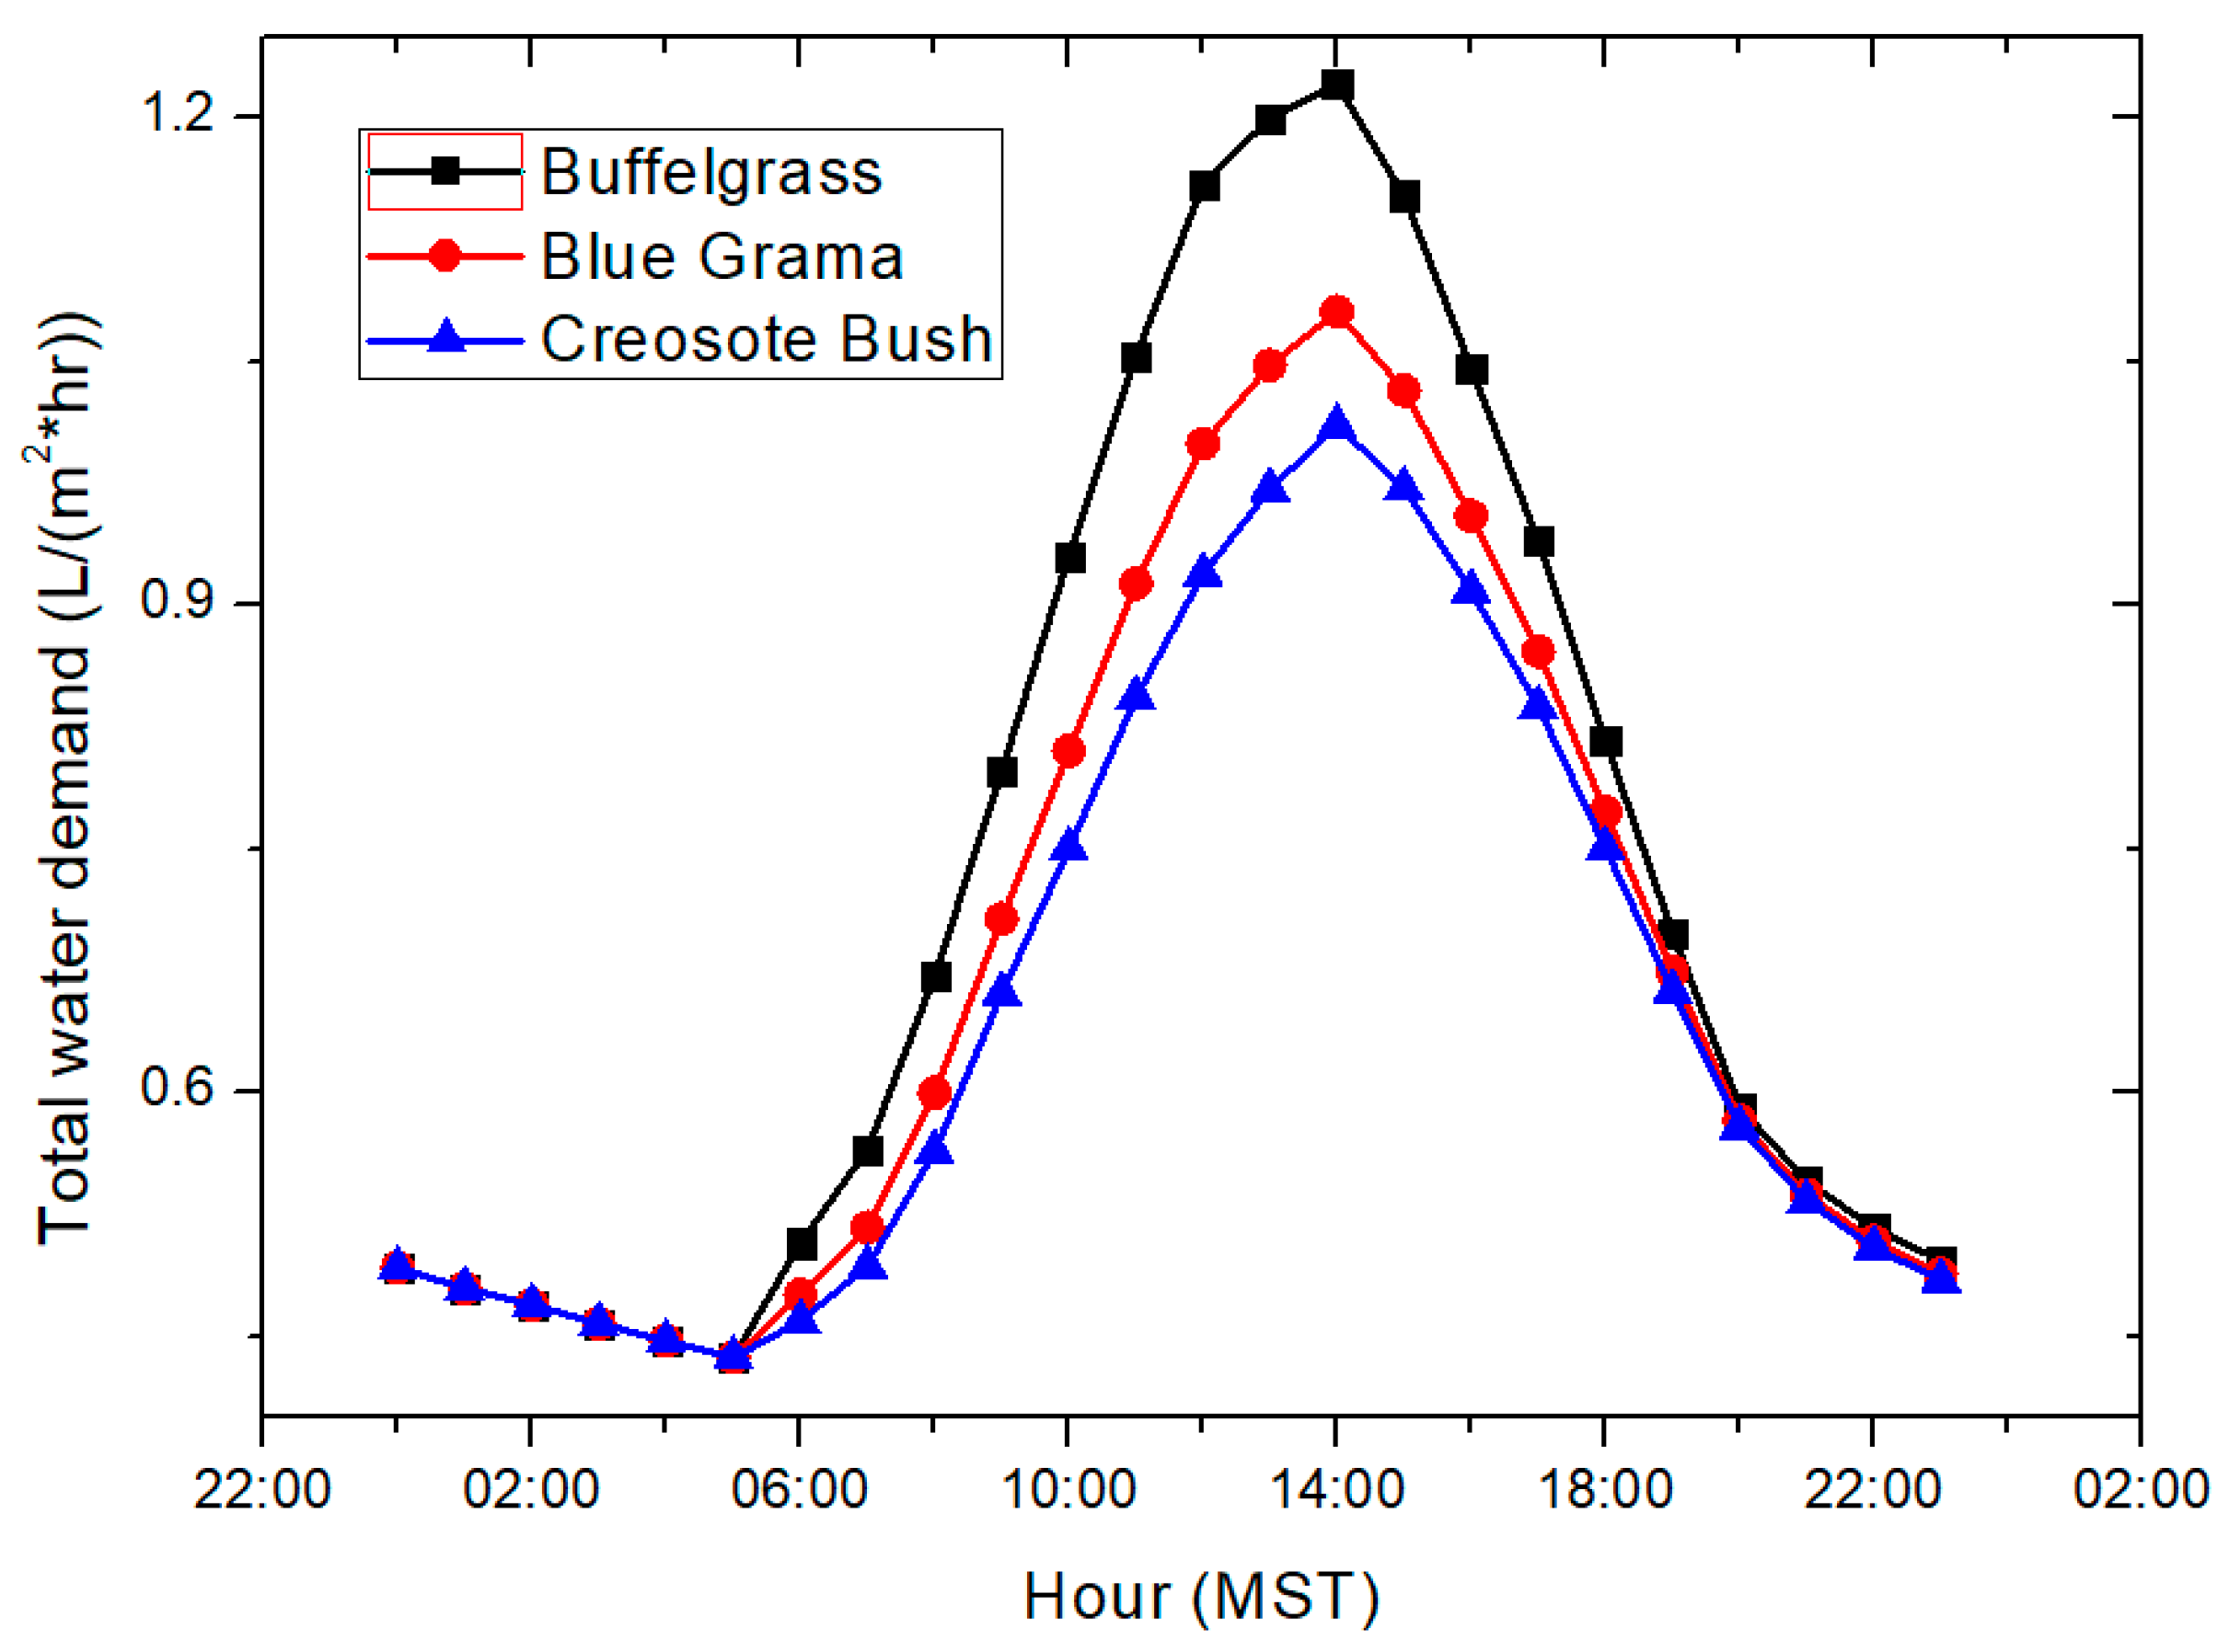
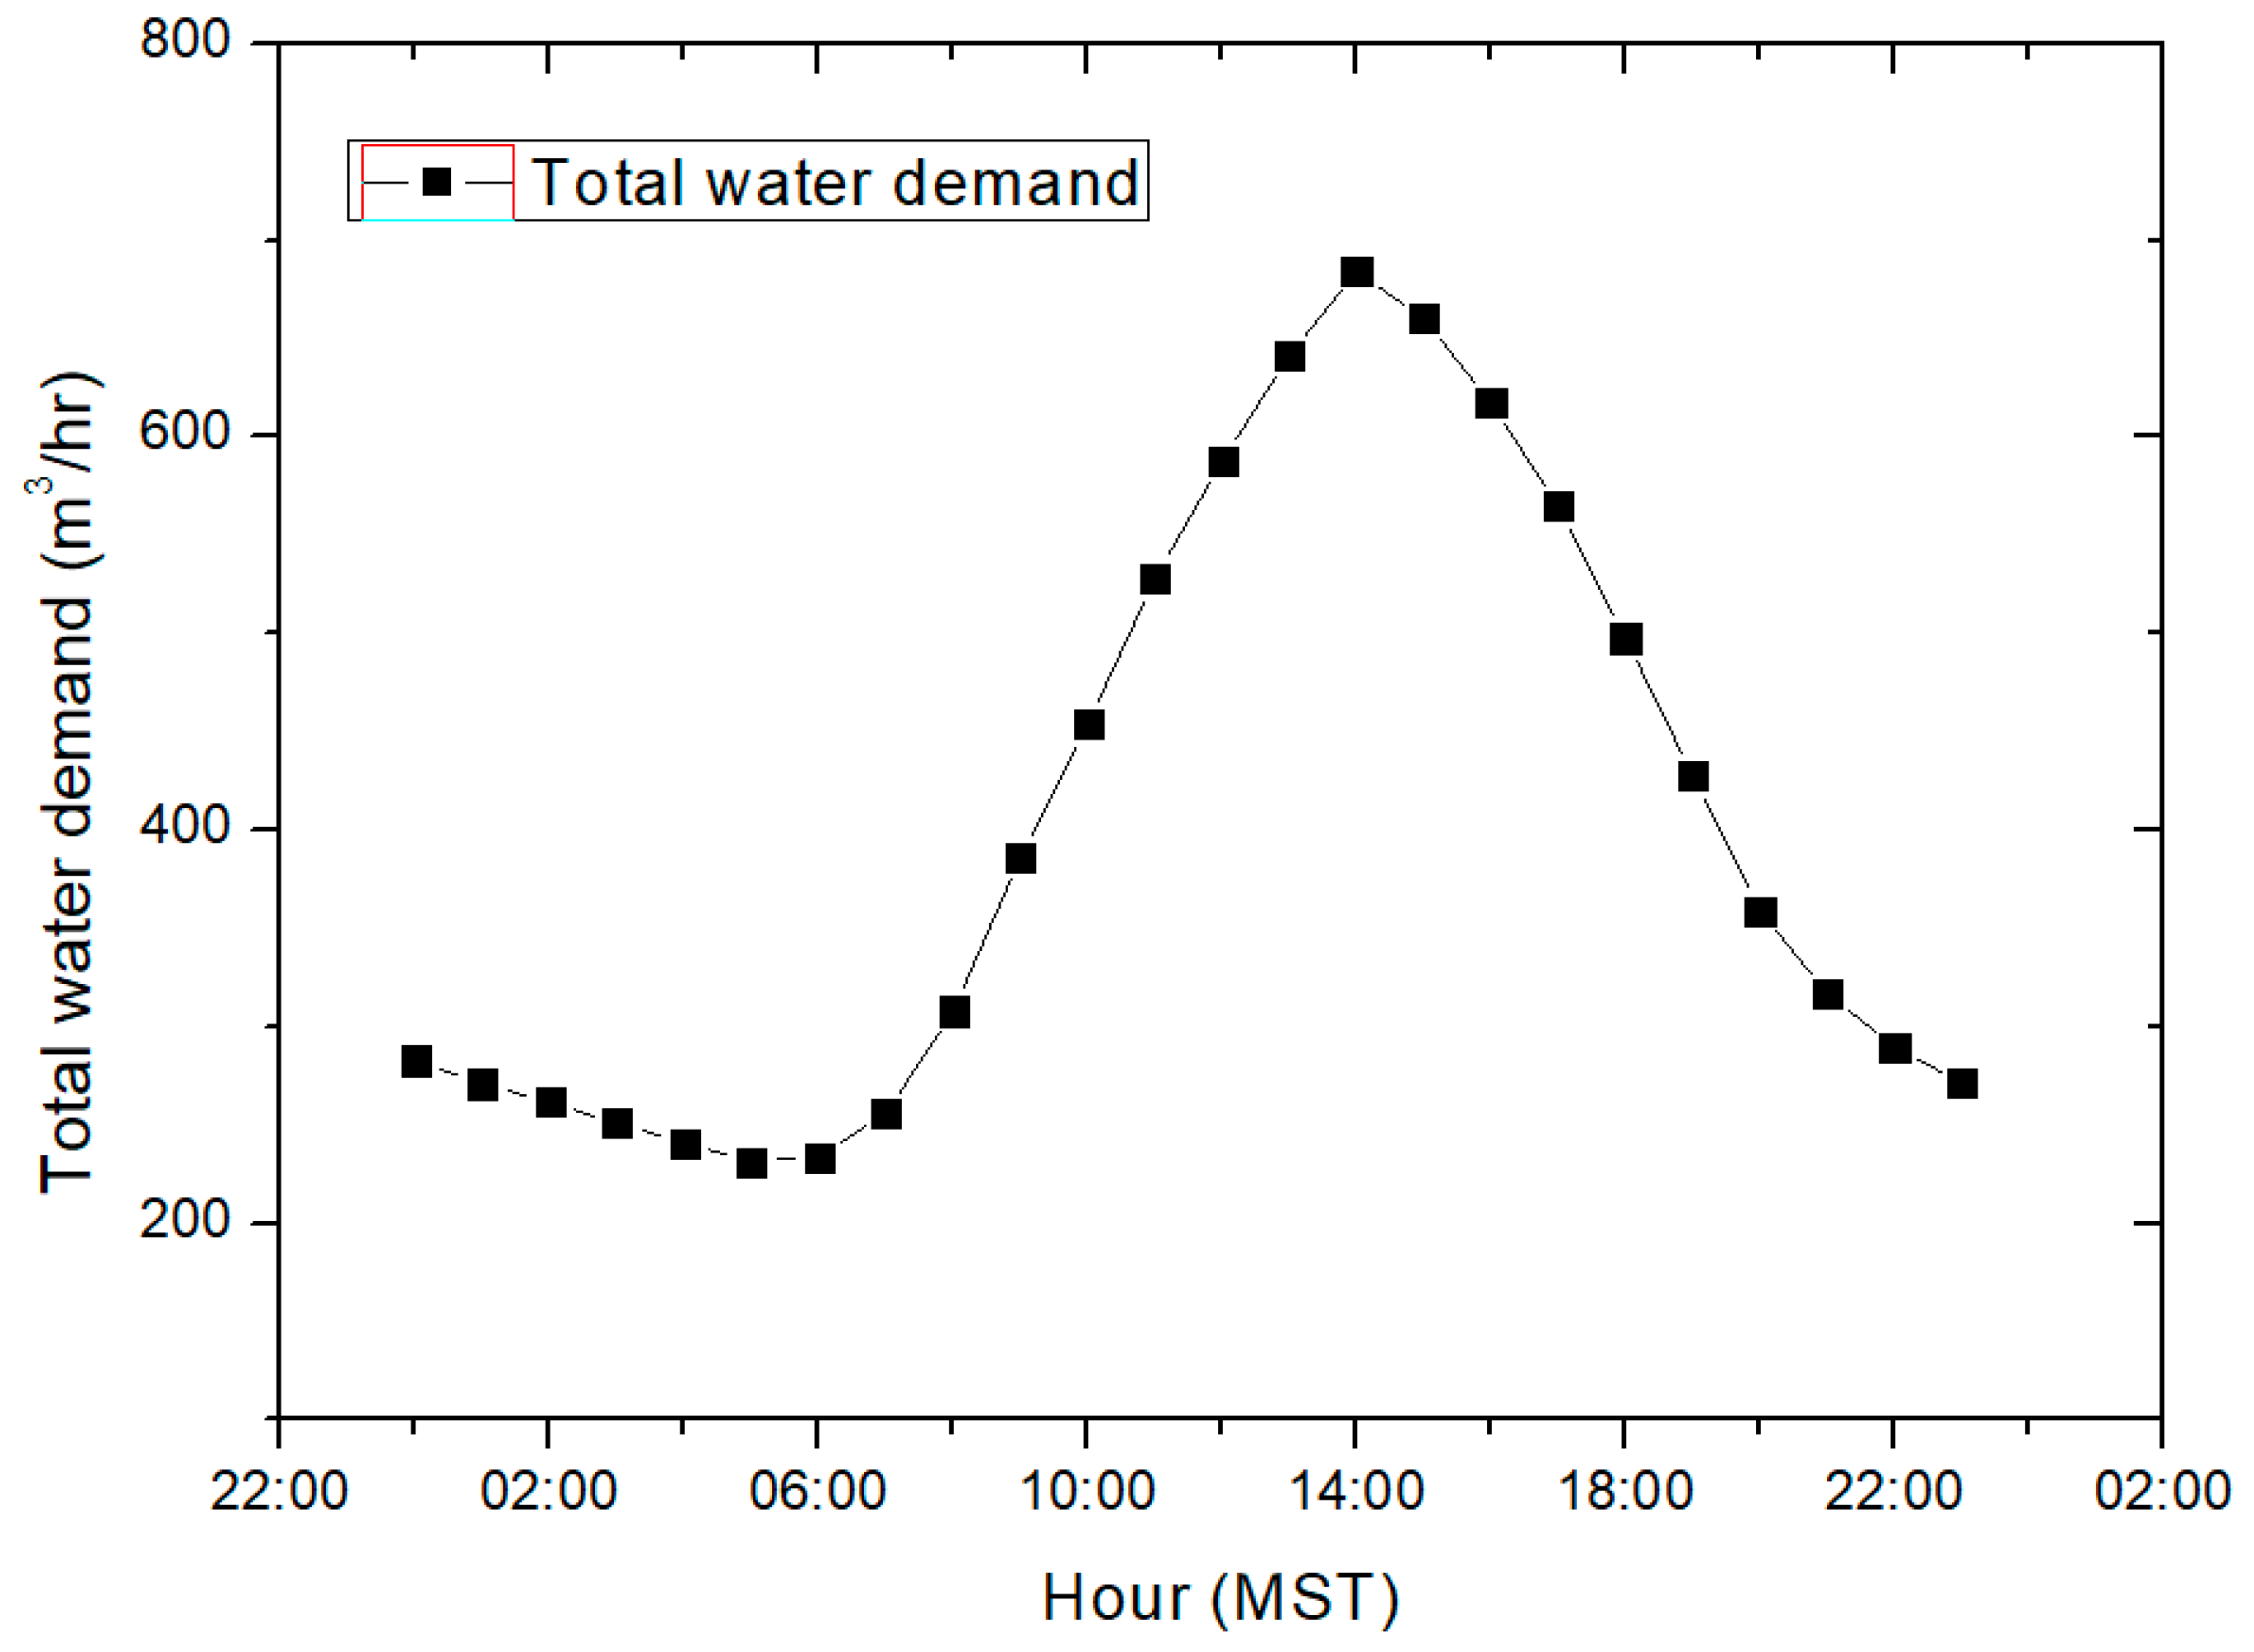
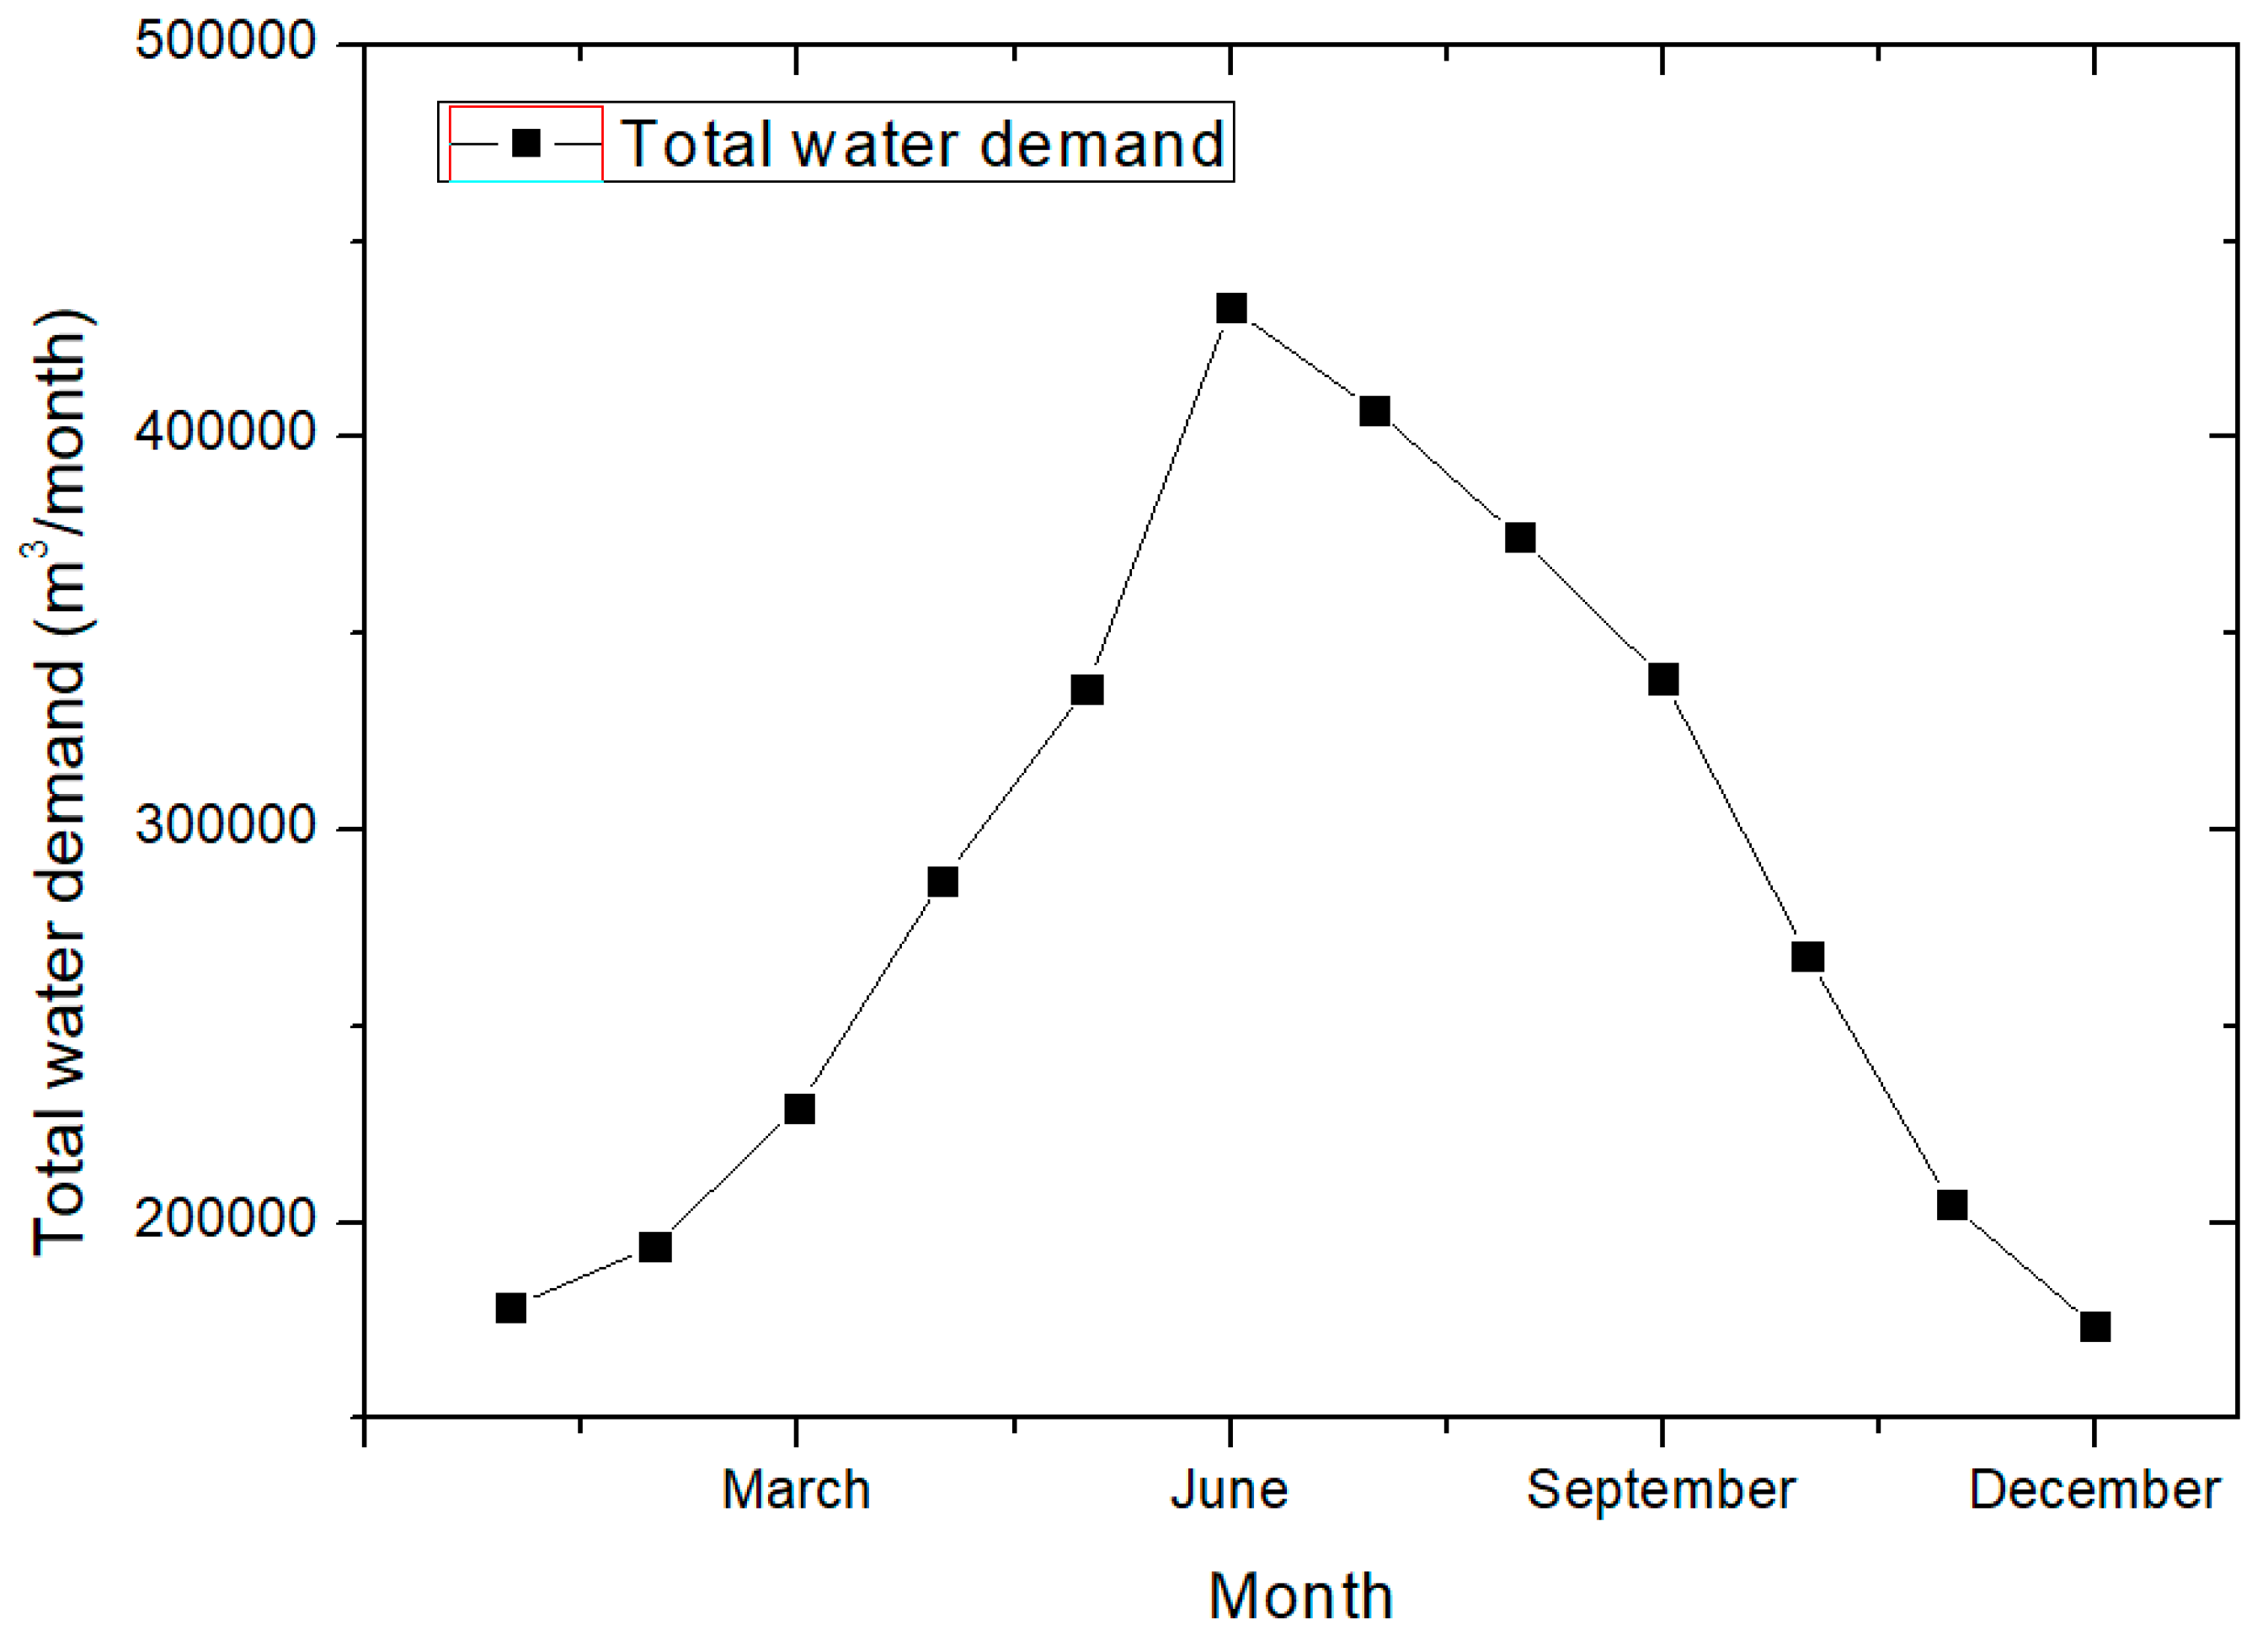
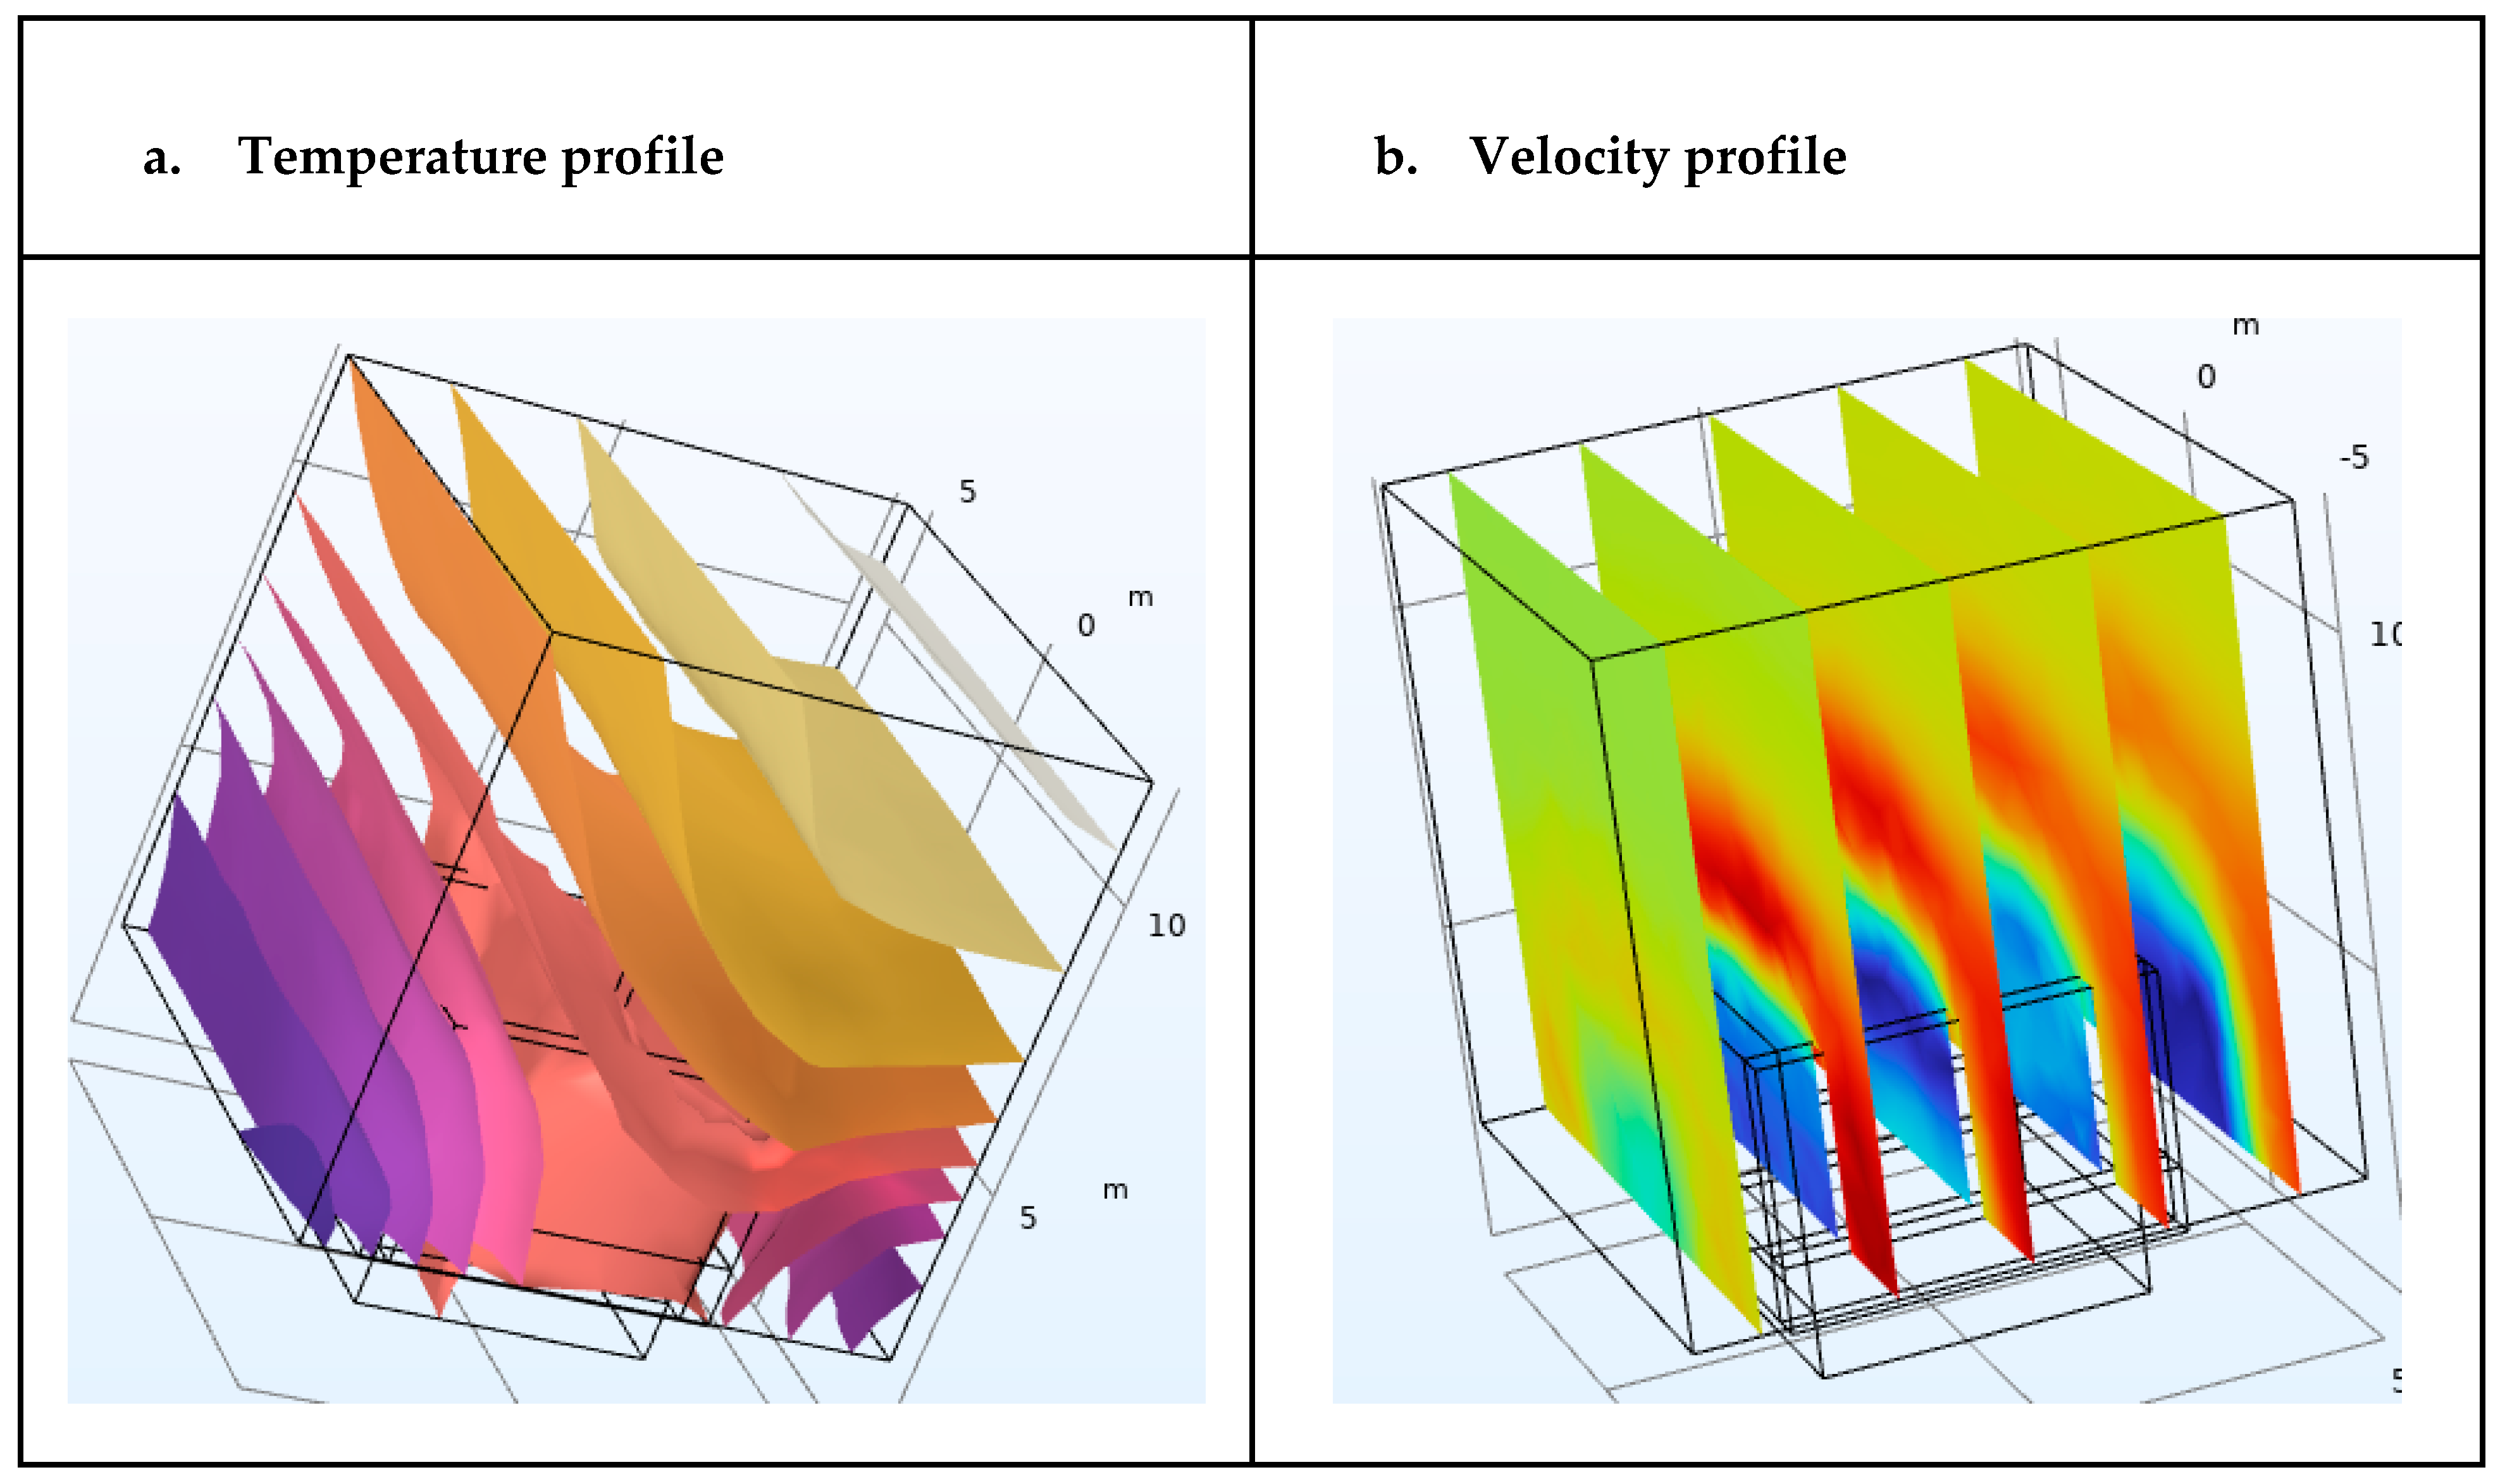

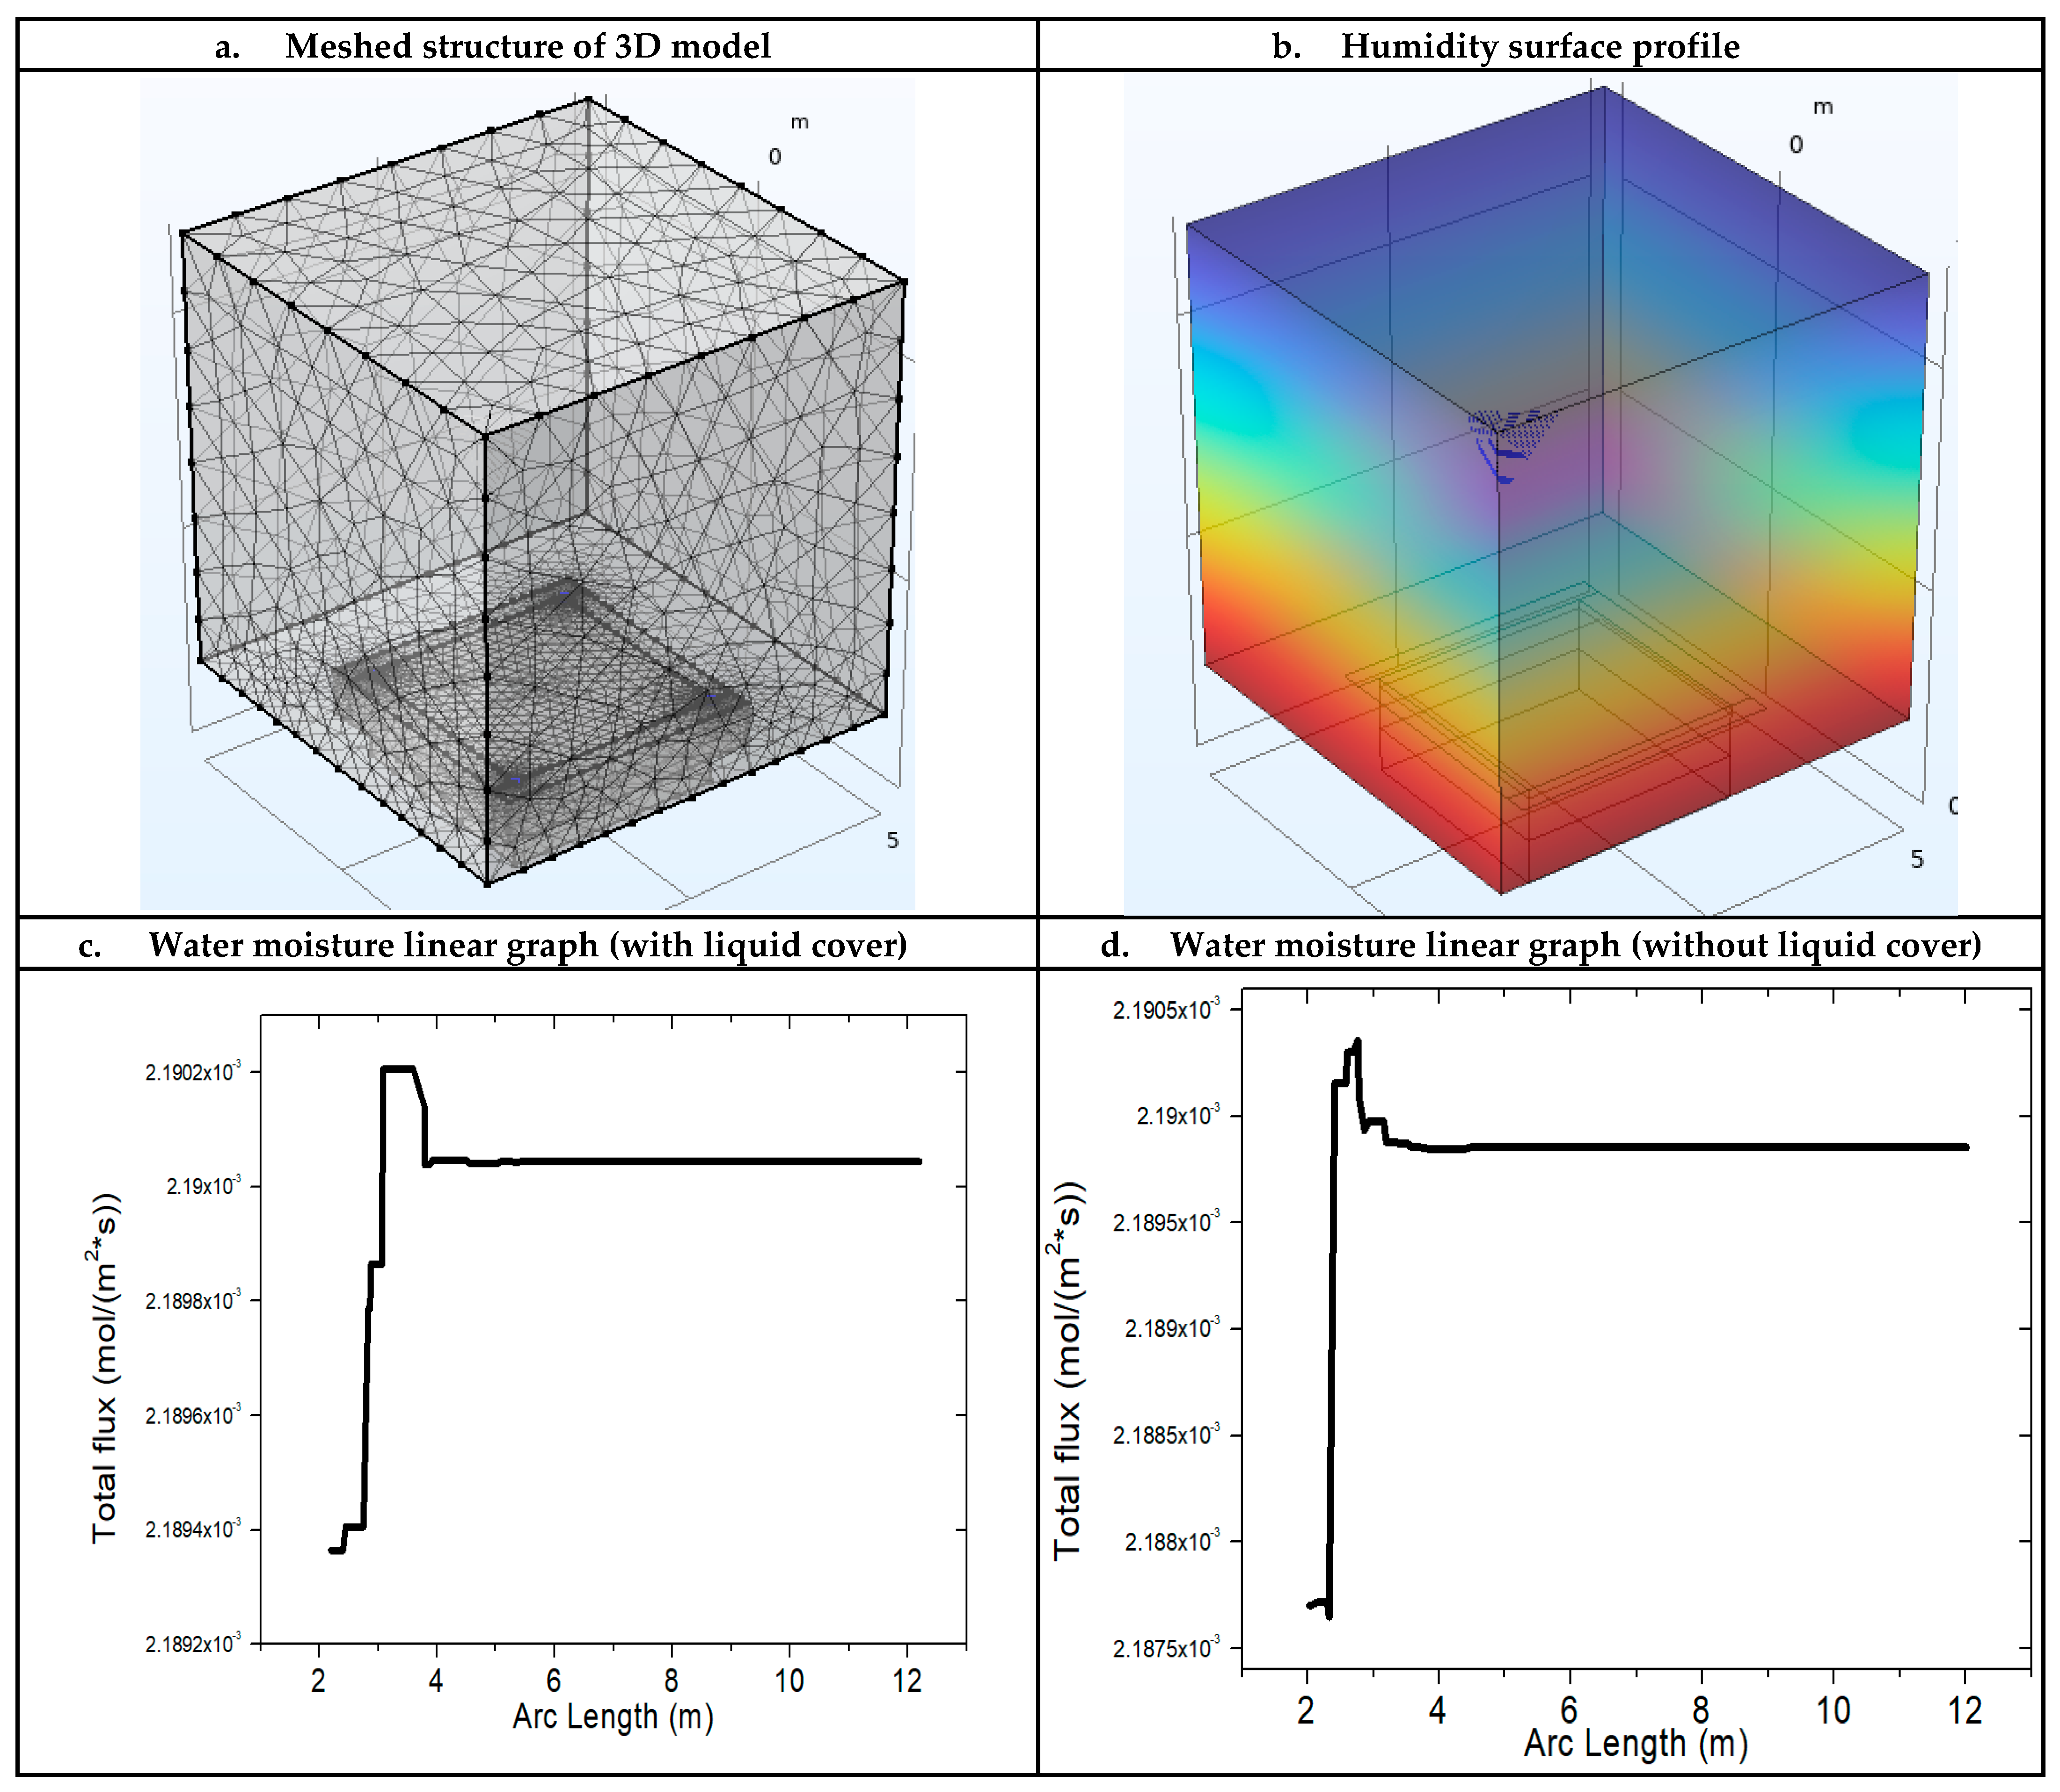

| Test | Pool Size (L × W × H) | Air Size (L × W × H) | Temperature (K) | Wind Speed (m/s) | Relative Humidity | Water Loss Due to Evaporation (mL/s per m2) |
|---|---|---|---|---|---|---|
| D01 | 10 m × 10 m × 1.5 m | 10 m × 10 m × 10 m | 293 | 10 | 0.1 | 0.054 |
| D02 | 10 m × 10 m × 1.5 m | 10 m × 10 m × 10 m | 303 | 10 | 0.1 | 0.098165 |
| D03 | 10 m × 10 m × 1.5 m | 10 m × 10 m × 10 m | 313 | 10 | 0.1 | 0.17 |
| D04 | 10 m × 10 m × 1.5 m | 10 m × 10 m × 10 m | 323 | 10 | 0.1 | 0.285 |
| D05 | 10 m × 10 m × 1.5 m | 10 m × 10 m × 10 m | 333 | 10 | 0.1 | 0.459 |
| D06 | 10 m × 10 m × 1.5 m | 10 m × 10 m × 10 m | 323 | 1 | 0.1 | 0.09 |
| D07 | 10 m × 10 m × 1.5 m | 10 m × 10 m × 10 m | 323 | 2 | 0.1 | 0.127 |
| D08 | 10 m × 10 m × 1.5 m | 10 m × 10 m × 10 m | 323 | 5 | 0.1 | 0.2 |
| D09 | 10 m × 10 m × 1.5 m | 10 m × 10 m × 10 m | 323 | 10 | 0.1 | 0.285 |
| D10 | 10 m × 10 m × 1.5 m | 10 m × 10 m × 10 m | 323 | 10 | 0.1 | 0.285 |
| D11 | 10 m × 10 m × 1.5 m | 10 m × 10 m × 10 m | 323 | 10 | 0.2 | 0.253 |
| D12 | 10 m × 10 m × 1.5 m | 10 m × 10 m × 10 m | 323 | 10 | 0.5 | 0.158 |
| D13 | 10 m × 10 m × 1.5 m | 10 m × 10 m × 10 m | 323 | 10 | 0.8 | 0.063 |
| Water Resources (Lake, River) | Pools | |
|---|---|---|
| Water surface area | 0.07 square miles | 0.11 square miles |
| Hour | Average Temperature (K) | Wind Speed (m/s) | Humidity (%) | Water Loss (L/(m2·h)) | Hour | Average Temperature (K) | Wind Speed (m/s) | Humidity (%) | Water Loss (L/(m2·h)) |
|---|---|---|---|---|---|---|---|---|---|
| 0:00 | 302.04 | 2.24 | 35 | 0.11429 | 12:00 | 316.48 | 4.02 | 15 | 0.44143 |
| 1:00 | 301.48 | 2.01 | 37 | 0.10158 | 13:00 | 317.59 | 4.47 | 14 | 0.49873 |
| 2:00 | 300.93 | 1.79 | 38 | 0.09136 | 14:00 | 318.15 | 4.92 | 13 | 0.54474 |
| 3:00 | 300.37 | 1.56 | 40 | 0.07988 | 15:00 | 318.15 | 4.47 | 13 | 0.51923 |
| 4:00 | 299.82 | 1.34 | 42 | 0.06929 | 16:00 | 317.59 | 4.02 | 14 | 0.47296 |
| 5:00 | 299.26 | 1.12 | 44 | 0.05917 | 17:00 | 316.48 | 3.58 | 15 | 0.41658 |
| 6:00 | 298.71 | 1.34 | 45 | 0.06153 | 18:00 | 314.82 | 3.13 | 18 | 0.34461 |
| 7:00 | 301.48 | 1.56 | 40 | 0.08523 | 19:00 | 312.59 | 2.68 | 22 | 0.26957 |
| 8:00 | 305.37 | 2.01 | 30 | 0.14101 | 20:00 | 309.82 | 2.24 | 28 | 0.19594 |
| 9:00 | 309.26 | 2.68 | 22 | 0.22519 | 21:00 | 307.04 | 2.01 | 32 | 0.15041 |
| 10:00 | 312.04 | 3.13 | 18 | 0.29739 | 22:00 | 304.82 | 1.79 | 34 | 0.12163 |
| 11:00 | 314.82 | 3.58 | 16 | 0.37754 | 23:00 | 303.15 | 1.56 | 35 | 0.10167 |
| Month | Average Temperature (K) | Wind Speed (m/s) | Humidity (%) | Water Loss (L/(m2·month)) |
|---|---|---|---|---|
| January | 292.59 | 3.58 | 46 | 50.6213 |
| February | 294.26 | 4.47 | 42 | 67.3787 |
| March | 298.71 | 4.92 | 34 | 105.2724 |
| April | 302.59 | 5.81 | 23 | 167.466 |
| May | 306.48 | 5.81 | 19 | 219.6725 |
| June | 313.15 | 5.81 | 17 | 323.7458 |
| July | 313.7 | 6.26 | 29 | 295.9689 |
| August | 313.15 | 5.81 | 33 | 261.3369 |
| September | 310.37 | 5.36 | 31 | 222.6675 |
| October | 304.26 | 4.47 | 30 | 146.9284 |
| November | 297.04 | 3.58 | 36 | 78.8037 |
| December | 291.48 | 3.58 | 48 | 45.4706 |
| Year | Average Temperature (K) | Wind Speed (m/s) | Humidity (%) | Water Loss (L/(m2·Year)) |
|---|---|---|---|---|
| 2015 | 296.7 | 3.8 | 30 | 1043.9916 |
| 2016 | 297 | 3.7 | 29 | 1063.9472 |
| 2017 | 297.5 | 3.9 | 28 | 1141.4933 |
| 2018 | 297.8 | 3.7 | 27 | 1147.7199 |
| 2019 | 298.2 | 3.8 | 28 | 1174.931 |
| 2020 | 298.8 | 3.6 | 26 | 1218.0722 |
| 2021 | 298.5 | 3.7 | 27 | 1196.6635 |
| 2022 | 299 | 3.9 | 25 | 1300.273 |
| 2023 | 299.5 | 3.6 | 26 | 1269.5961 |
| 2024 | 299.8 | 3.7 | 25 | 1327.7776 |
| Hour | Average Temperature (K) | Wind Speed (m/s) | Humidity (%) | Water Demand (L/(m2·h)) | Hour | Average Temperature (K) | Wind Speed (m/s) | Humidity (%) | Water Demand (L/(m2·h)) |
|---|---|---|---|---|---|---|---|---|---|
| 0:00 | 302.04 | 2.24 | 35 | 0.49229 | 12:00 | 316.48 | 4.02 | 15 | 0.81943 |
| 1:00 | 301.48 | 2.01 | 37 | 0.47958 | 13:00 | 317.59 | 4.47 | 14 | 0.87673 |
| 2:00 | 300.93 | 1.79 | 38 | 0.46936 | 14:00 | 318.15 | 4.92 | 13 | 0.92274 |
| 3:00 | 300.37 | 1.56 | 40 | 0.45788 | 15:00 | 318.15 | 4.47 | 13 | 0.89723 |
| 4:00 | 299.82 | 1.34 | 42 | 0.44729 | 16:00 | 317.59 | 4.02 | 14 | 0.85096 |
| 5:00 | 299.26 | 1.12 | 44 | 0.43717 | 17:00 | 316.48 | 3.58 | 15 | 0.79458 |
| 6:00 | 298.71 | 1.34 | 45 | 0.43953 | 18:00 | 314.82 | 3.13 | 18 | 0.72261 |
| 7:00 | 301.48 | 1.56 | 40 | 0.46323 | 19:00 | 312.59 | 2.68 | 22 | 0.64757 |
| 8:00 | 305.37 | 2.01 | 30 | 0.51901 | 20:00 | 309.82 | 2.24 | 28 | 0.57394 |
| 9:00 | 309.26 | 2.68 | 22 | 0.60319 | 21:00 | 307.04 | 2.01 | 32 | 0.52841 |
| 10:00 | 312.04 | 3.13 | 18 | 0.67539 | 22:00 | 304.82 | 1.79 | 34 | 0.49963 |
| 11:00 | 314.82 | 3.58 | 16 | 0.75554 | 23:00 | 303.15 | 1.56 | 35 | 0.47967 |
| Month | Average Temperature (K) | Wind Speed (m/s) | Humidity (%) | Water Loss (L/(m2·Month)) |
|---|---|---|---|---|
| January | 292.59 | 3.58 | 46 | 331.85336 |
| February | 294.26 | 4.47 | 42 | 348.61079 |
| March | 298.71 | 4.92 | 34 | 386.50444 |
| April | 302.59 | 5.81 | 23 | 448.69802 |
| May | 306.48 | 5.81 | 19 | 500.90450 |
| June | 313.15 | 5.81 | 17 | 604.97781 |
| July | 313.7 | 6.26 | 29 | 577.2008 |
| August | 313.15 | 5.81 | 33 | 542.56898 |
| September | 310.37 | 5.36 | 31 | 503.89951 |
| October | 304.26 | 4.47 | 30 | 428.16043 |
| November | 297.04 | 3.58 | 36 | 360.03574 |
| December | 291.48 | 3.58 | 48 | 326.70268 |
| Date | Time (MST) | Temperature (K) | Wind Speed (m/s) | Humidity (%) | Date | Time (MST) | Temperature (K) | Wind Speed (m/s) | Humidity (%) |
|---|---|---|---|---|---|---|---|---|---|
| 16/6/2025 | 12:00 AM | 303.7 | 0 | 16 | 17/6/2025 | 12:00 AM | 303.7 | 3.1 | 14 |
| 16/6/2025 | 1:00 AM | 302 | 2.2 | 16 | 17/6/2025 | 1:00 AM | 302 | 2.2 | 13 |
| 16/6/2025 | 2:00 AM | 299.8 | 2.2 | 23 | 17/6/2025 | 2:00 AM | 300.9 | 1.3 | 14 |
| 16/6/2025 | 3:00 AM | 299.3 | 2.2 | 21 | 17/6/2025 | 3:00 AM | 299.3 | 0.9 | 15 |
| 16/6/2025 | 4:00 AM | 298.7 | 2.2 | 20 | 17/6/2025 | 4:00 AM | 298.7 | 0.9 | 17 |
| 16/6/2025 | 5:00 AM | 297 | 2.2 | 25 | 17/6/2025 | 5:00 AM | 298.7 | 0.9 | 18 |
| 16/6/2025 | 6:00 AM | 298.7 | 2.2 | 26 | 17/6/2025 | 6:00 AM | 299.8 | 1.3 | 17 |
| 16/6/2025 | 7:00 AM | 302 | 1.3 | 25 | 17/6/2025 | 7:00 AM | 302.6 | 1.8 | 15 |
| 16/6/2025 | 8:00 AM | 306.9 | 0 | 12 | 17/6/2025 | 8:00 AM | 305.4 | 2.2 | 13 |
| 16/6/2025 | 9:00 AM | 309.7 | 1.3 | 10 | 17/6/2025 | 9:00 AM | 308.2 | 2.2 | 11 |
| 16/6/2025 | 10:00 AM | 311.5 | 0 | 9 | 17/6/2025 | 10:00 AM | 310.4 | 2.7 | 10 |
| 16/6/2025 | 11:00 AM | 315.9 | 3.1 | 10 | 17/6/2025 | 11:00 AM | 312.6 | 3.6 | 9 |
| 16/6/2025 | 12:00 PM | 314.8 | 3.6 | 8 | 17/6/2025 | 12:00 PM | 313.7 | 3.6 | 8 |
| 16/6/2025 | 1:00 PM | 317.6 | 3.6 | 6 | 17/6/2025 | 1:00 PM | 315.4 | 4 | 7 |
| 16/6/2025 | 2:00 PM | 318.2 | 4 | 6 | 17/6/2025 | 2:00 PM | 316.5 | 4.9 | 6 |
| 16/6/2025 | 3:00 PM | 318.2 | 4.5 | 6 | 17/6/2025 | 3:00 PM | 317 | 5.8 | 6 |
| 16/6/2025 | 4:00 PM | 317 | 5.8 | 6 | 17/6/2025 | 4:00 PM | 317.6 | 6.3 | 6 |
| 16/6/2025 | 5:00 PM | 317 | 5.8 | 6 | 17/6/2025 | 5:00 PM | 317 | 7.2 | 6 |
| 16/6/2025 | 6:00 PM | 315.9 | 3.6 | 6 | 17/6/2025 | 6:00 PM | 315.9 | 6.7 | 6 |
| 16/6/2025 | 7:00 PM | 314.2 | 3.6 | 7 | 17/6/2025 | 7:00 PM | 314.2 | 5.8 | 7 |
| 16/6/2025 | 8:00 PM | 313.1 | 2.7 | 9 | 17/6/2025 | 8:00 PM | 313.1 | 5.4 | 8 |
| 16/6/2025 | 9:00 PM | 310.4 | 2.7 | 9 | 17/6/2025 | 9:00 PM | 310.4 | 5.4 | 9 |
| 16/6/2025 | 10:00 PM | 308.7 | 2.2 | 12 | 17/6/2025 | 10:00 PM | 308.7 | 4.9 | 10 |
| 16/6/2025 | 11:00 PM | 307.6 | 1.3 | 10 | 17/6/2025 | 11:00 PM | 307.6 | 4.9 | 11 |
Disclaimer/Publisher’s Note: The statements, opinions and data contained in all publications are solely those of the individual author(s) and contributor(s) and not of MDPI and/or the editor(s). MDPI and/or the editor(s) disclaim responsibility for any injury to people or property resulting from any ideas, methods, instructions or products referred to in the content. |
© 2025 by the authors. Licensee MDPI, Basel, Switzerland. This article is an open access article distributed under the terms and conditions of the Creative Commons Attribution (CC BY) license (https://creativecommons.org/licenses/by/4.0/).
Share and Cite
Lu, J.; Kabala, Z.J. Water Demand and Conservation in Arid Urban Environments: Numerical Analysis of Evapotranspiration in Arizona. Water 2025, 17, 2835. https://doi.org/10.3390/w17192835
Lu J, Kabala ZJ. Water Demand and Conservation in Arid Urban Environments: Numerical Analysis of Evapotranspiration in Arizona. Water. 2025; 17(19):2835. https://doi.org/10.3390/w17192835
Chicago/Turabian StyleLu, Jaden, and Zbigniew J. Kabala. 2025. "Water Demand and Conservation in Arid Urban Environments: Numerical Analysis of Evapotranspiration in Arizona" Water 17, no. 19: 2835. https://doi.org/10.3390/w17192835
APA StyleLu, J., & Kabala, Z. J. (2025). Water Demand and Conservation in Arid Urban Environments: Numerical Analysis of Evapotranspiration in Arizona. Water, 17(19), 2835. https://doi.org/10.3390/w17192835


