Abstract
Water treatment systems in swimming ponds support the natural self-cleaning capabilities of water based on the functions of repository macrophytes in their regeneration zone and the regulation of the internal metabolism of the reservoirs. As part of the project, a functional modular filtration chamber with system multiplication capabilities was designed and created. This element is dedicated to water treatment systems in natural swimming ponds. The prototype system consisted of modular filtration chambers and pump sections, as well as equipment adapted to the conditions prevailing in the eco-pool. An innovative solution for selective shutdown of the filtration chamber without closing the circulation circuit was also used, which forms the basis of a patent application. A verified high-performance adsorbent, Rockfos® modified limestone, was used in the filtration chamber. In order to determine the effective filtration rate for three small test ponds with different flow rates (5 m/h, 10 m/h and 15 m/h), the selected physicochemical parameters of water (temperature, pH, electrolytical conductivity, oxygen saturation, total hardness, nitrites, nitrates, and total phosphorus, including adsorption efficiency and bed absorption capacity) were researched before and after filtration. Tests were also carried out on the composition of fecal bacteria and phyto- and zooplankton. Based on high effective phosphorus filtration efficiency of 32.65% during the operation of the bed, the following were determined: no exceedances of the standards for the tested parameters in relation to the German standards for eco-pools (FLL—Forschungsgesellschaft Landschaftsentwicklung Landschaftsbau e. V., 2011); lower number of fecal pathogens (on average 393—coliform bacteria; 74—Escherichia coli; 34—fecal enterococci, most probably number/100 mL); the lowest share of problematic cyanobacteria in phytoplankton (<250,000 individuals/dm3 in number and <0.05 µg/dm3—biomass); low chlorophyll a content (2.2 µg/dm3—oligotrophy) and the presence of more favorable smaller forms of zooplankton, an effective filtration speed of 5 m/h. This velocity was recommended in the FLL standards for swimming ponds, which were adopted in this study as a reference for rapid filters. In testing the functional efficiency of a dedicated filtration system for a Type II test pond (50 m2—area and 33 m3—capacity), at a filtration rate of 5 m/h, an average effective phosphorus adsorption efficiency of 18.28–53.98% was observed under the bed work-in-progress conditions. Analyses of other physicochemical water parameters, with appropriate calculations and statistical tests, indicated progressive functional efficiency of the system under bathing conditions.
1. Introduction
The filtration efficiency of water treatment systems is usually the basis for the safe use of most natural swimming ponds, also known as natural pools. In their simplest form, such reservoirs consist of a pond basin lined with a highly durable, waterproof, separating liner (e.g., polyvinylchloride—PVC; ethylene propylene diene monomer—EPDM; bentomat), which is then covered with stone slabs, pool tiles, or smooth aggregate according to the design and filled with water [1,2]. A functional feature of natural pools is their division into zones: a regeneration zone and a recreation zone. The first zone is shallow and planted with aquatic vegetation that serves a repository function (bioaccumulation filtration and natural sanitation of water and bottom sediments); the second zone is deeper, exposed, and used for bathing [2,3,4,5].
The physical and chemical parameters of the water in the reservoir are the result of natural processes occurring in the living ecosystem of the pond and the efficiency of the water treatment system used. They must therefore be monitored by the user.
Natural water treatment processes in natural pools are based on the physical and biochemical phenomenon of water self-purification. This occurs at different rates and is based on the sedimentation of suspended solids, the mineralization of organic compounds, and their phyto-bioaccumulation. They are also accompanied by the filtration of pollutants in the root zone of plants with the participation of a microbiological biofilm [2,6,7]. In the process of water self-purification, physical, chemical, and biological factors are interdependent [6,8,9], which is why water quality control is difficult in these circumstances. Fluctuations in interactions in the biological world can affect the temporary deterioration of important biophysical and chemical parameters of water [6], including those beyond the standards for swimming ponds specified by the norms for bathing ponds set by the German/Austrian FLL standard [10].
Based on these values, the acceptable ranges for key water quality parameters in bathing ponds can be determined as follows: oxygen content—4–12 mg/dm3; oxygen saturation—80–120%; electrolytical conductivity—200–1000 µS/cm; pH—6.9–9.0; magnesium concentration—5–10 mg/dm3; calcium—30–50 mg/dm3; ammonium ions—0–4 mg/dm3; nitrates—10–30 mg/dm3; nitrites—0.0–0.001 mg/dm3; total phosphorus—0.03 mg/dm3; sulfates—0.40 mg/dm3. It is worth noting that no legal regulations concerning the quality of bathing water in natural pools have been established in Poland [2].
Slightly greater control over bathing water quality can be achieved by using additional water treatment systems. The possibility of adapting technical solutions, selecting the number of filter modules and their combinations, appropriate mineral material, and auxiliary equipment enable a permanent and adaptive response to changes in the quality of water in the pond.
However, in the case of natural swimming ponds, there is a lack of dedicated water treatment technologies. These are usually only modified and improved tiny pond cleaning technologies. Regardless of the nature of the solutions used, they are mainly based on several basic types of filters including mechanical (sponge and drum), gravity- and pressure-operated (circulation pumps), various natural or artificial filter materials, and the possibility of biological processes and hybrid filters in various combinations and with auxiliary equipment [2].
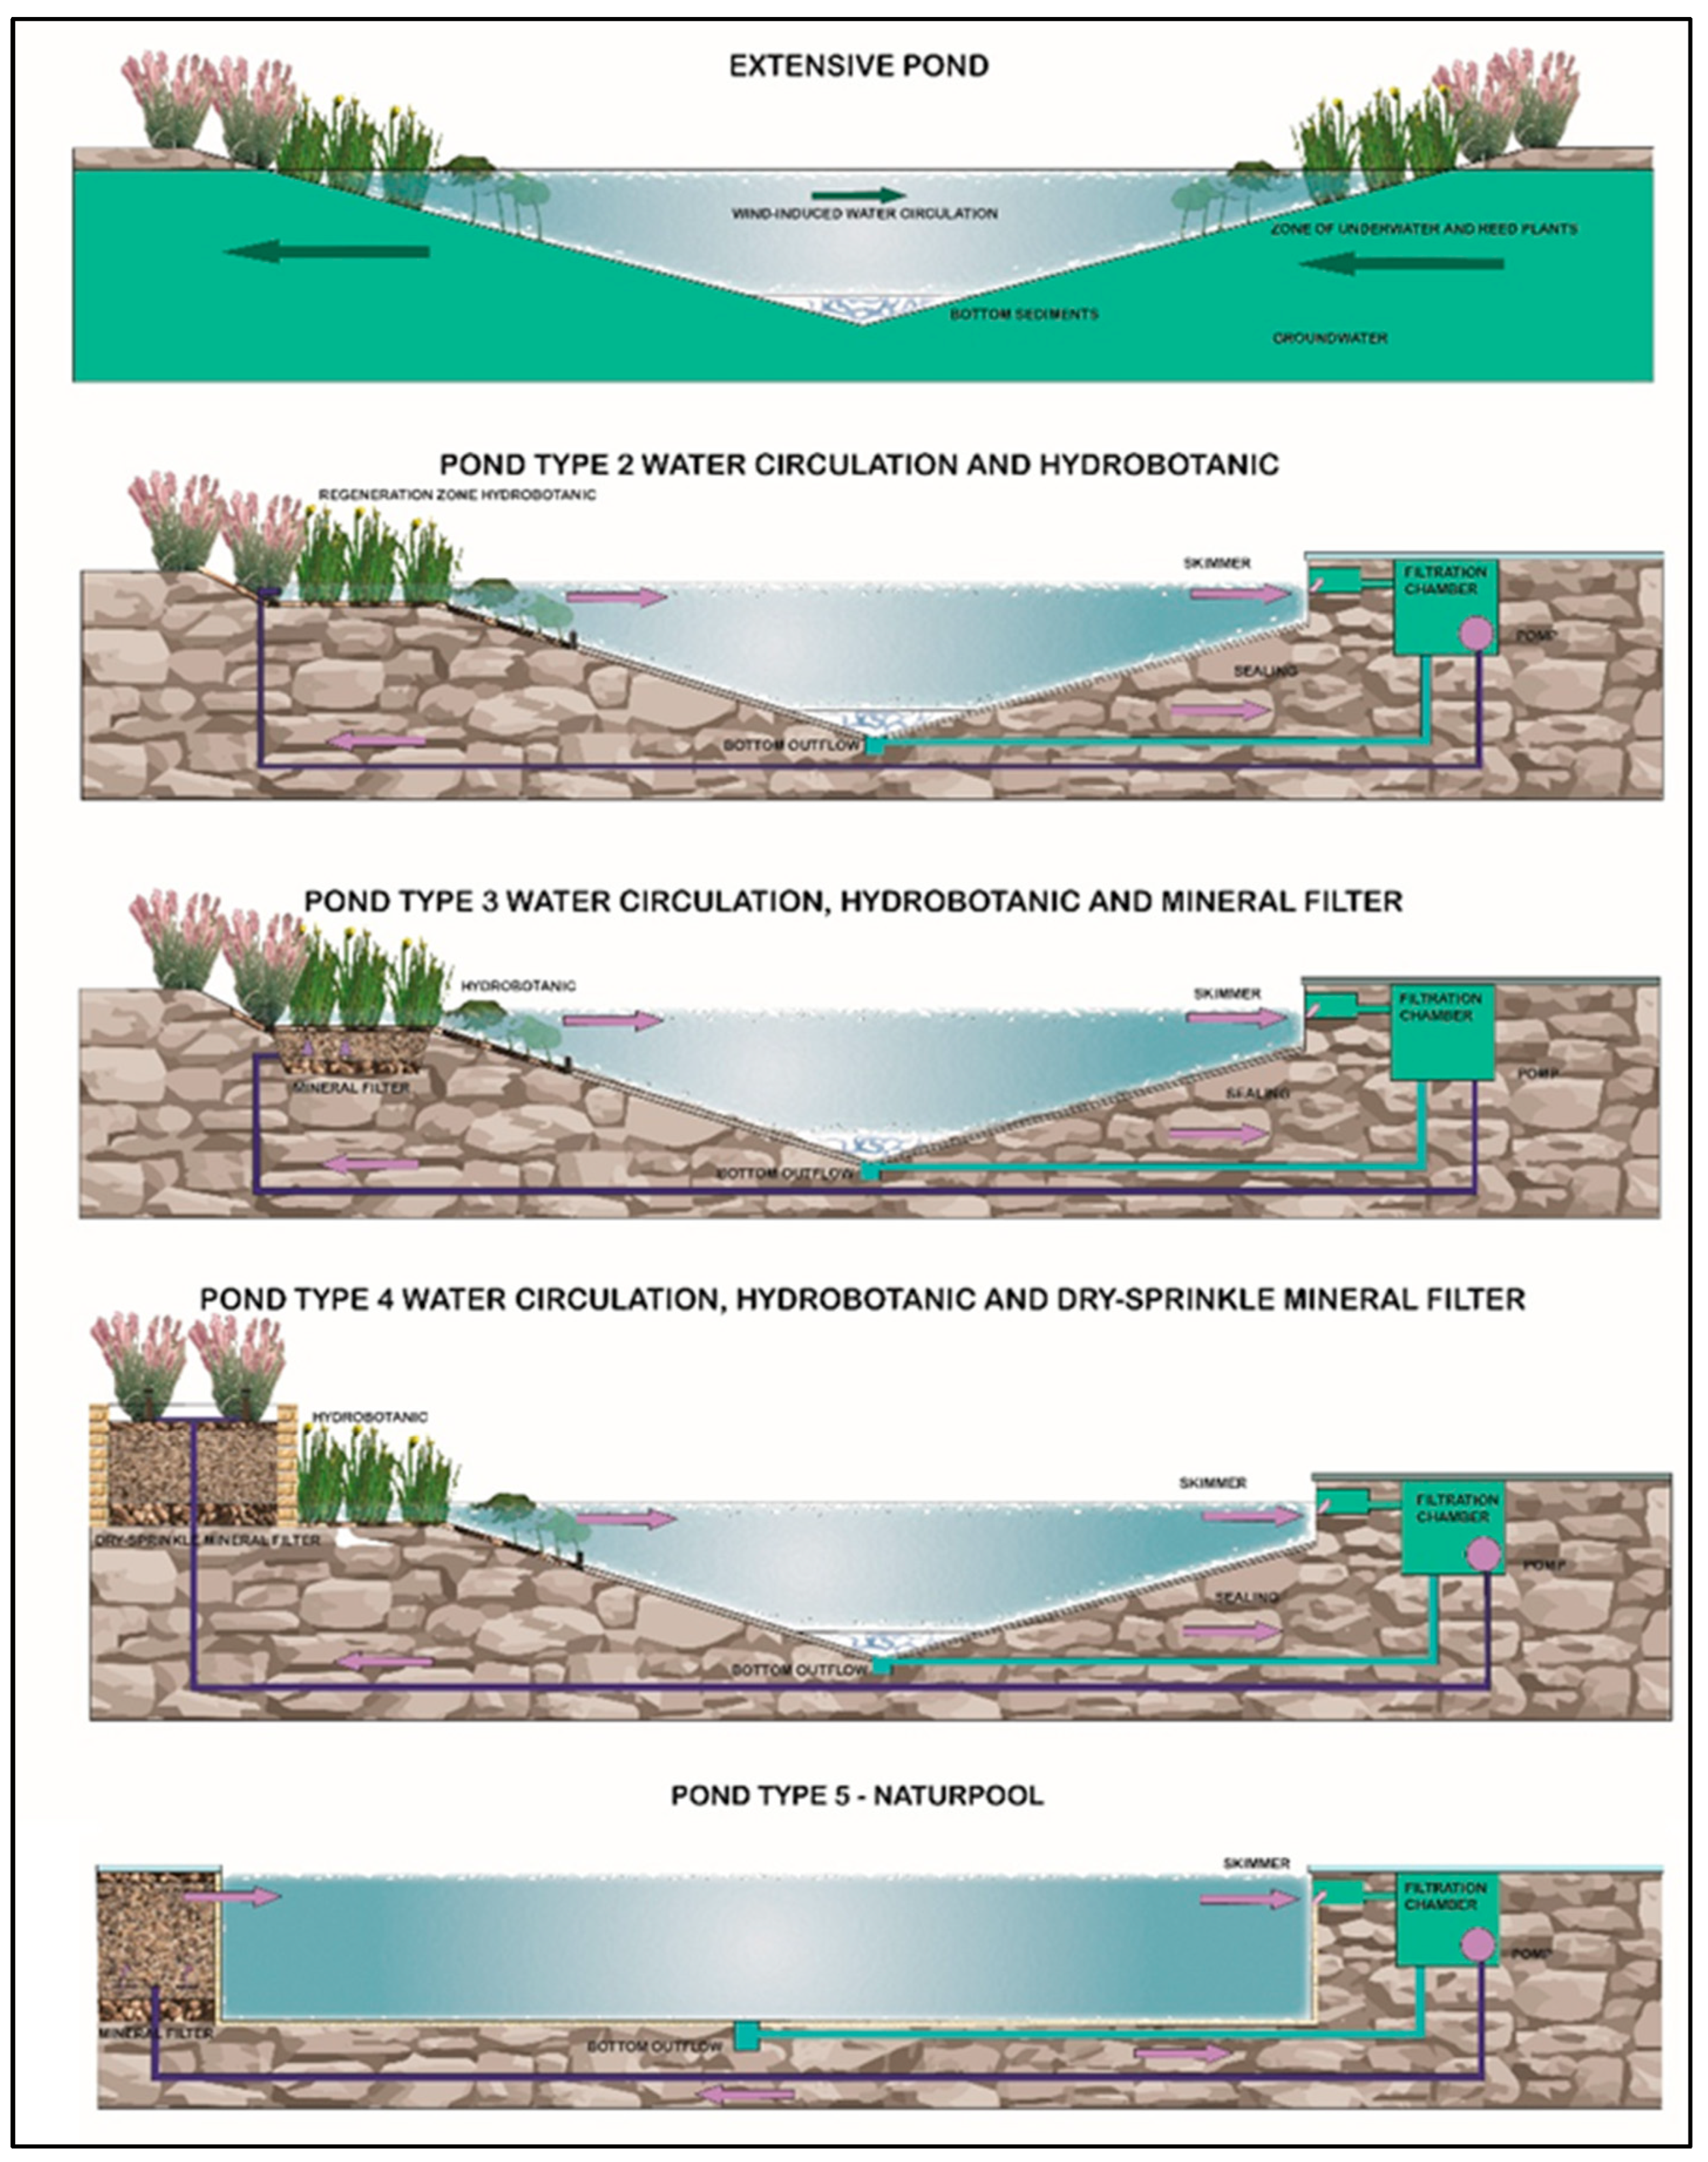
Due to the nature of the technologies used, natural swimming ponds are classified into five technological types: from natural–extensive, without technical solutions (type I) to advanced–intensive, highly technological, resembling modern swimming pools (type V) [2]—Figure 1.
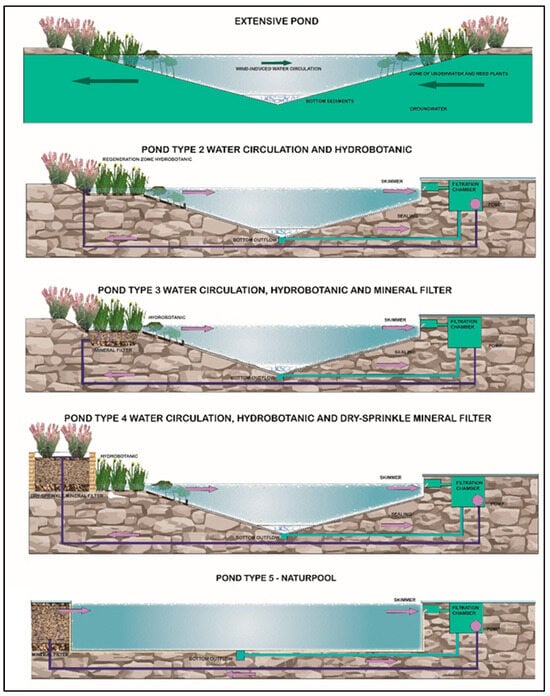
Figure 1.
Typology of natural swimming ponds according to the criteria of water treatment technology used [2].
Type II reservoirs are characterized by hydro-botanical filtration without the use of filter beds. They therefore require the use of water treatment systems using mineral materials, induced biological processes (biological chamber), and auxiliary equipment, i.e., circulation pumps, filter mats, surface skimmers, or bottom drains. Their size usually ranges from 50 m2 to 300 m2, and the ratio of the regeneration zone to the recreational zone is 55% to 45%. In subsequent types of swimming ponds (III–V), technological processes progressively begin to prevail over natural self-cleaning processes, so the contribution of the living ecosystem to water treatment gradually decreases [2,11]—Figure 1.
The aim of this study was to analyze the adsorption efficiency of a water filtration system based on prototype technological solutions in relation to an experimental type II natural pool under typical conditions of use. The paper presents the functional assumptions, design, construction features, and efficiency analysis of a modular filter chamber dedicated to natural pools (biological, physical, and chemical characteristics of water) with an innovative system of sequential unloading of mineral cartridges under field test conditions. The analyses were preceded by research on the appropriate and effective filtration flow rate conditions and supplemented by microbiological and biocenosis analyses of the bathing pond system.
The research was funded by the Ministry of Education and Science (Poland) as part of the implementation doctoral project No. DWD/5/0334/2021, titled “Development and implementation of a modular water filtration system for natural swimming ponds.”
2. Materials and Methods
2.1. Materials
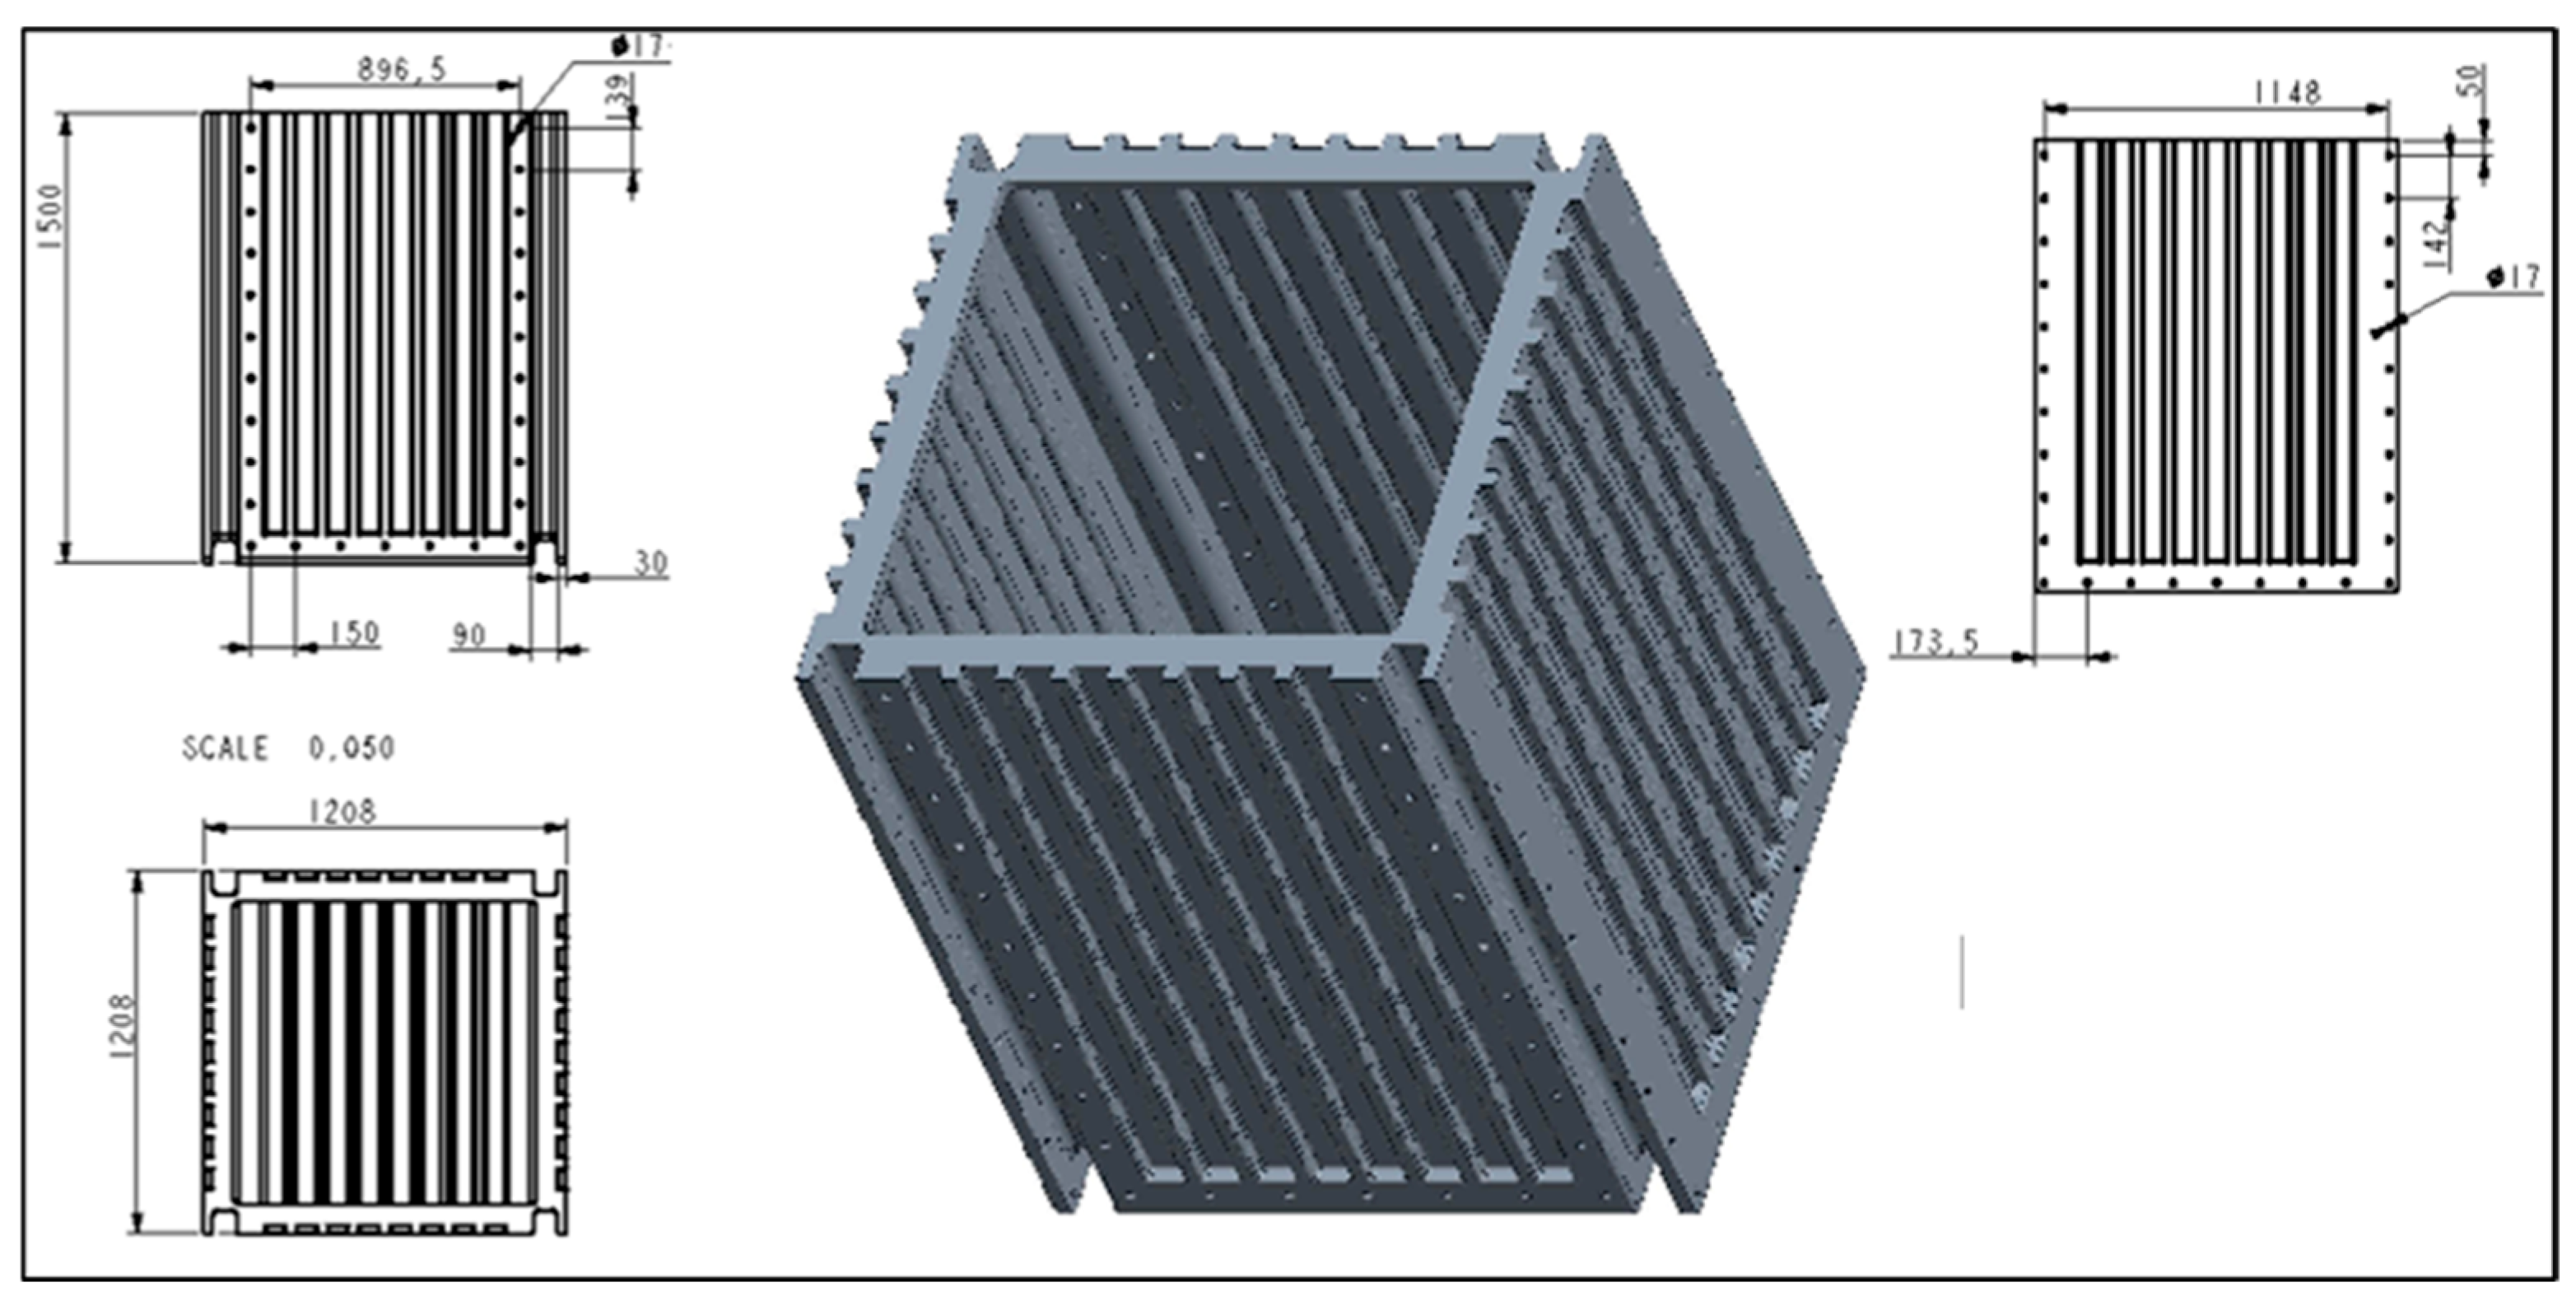
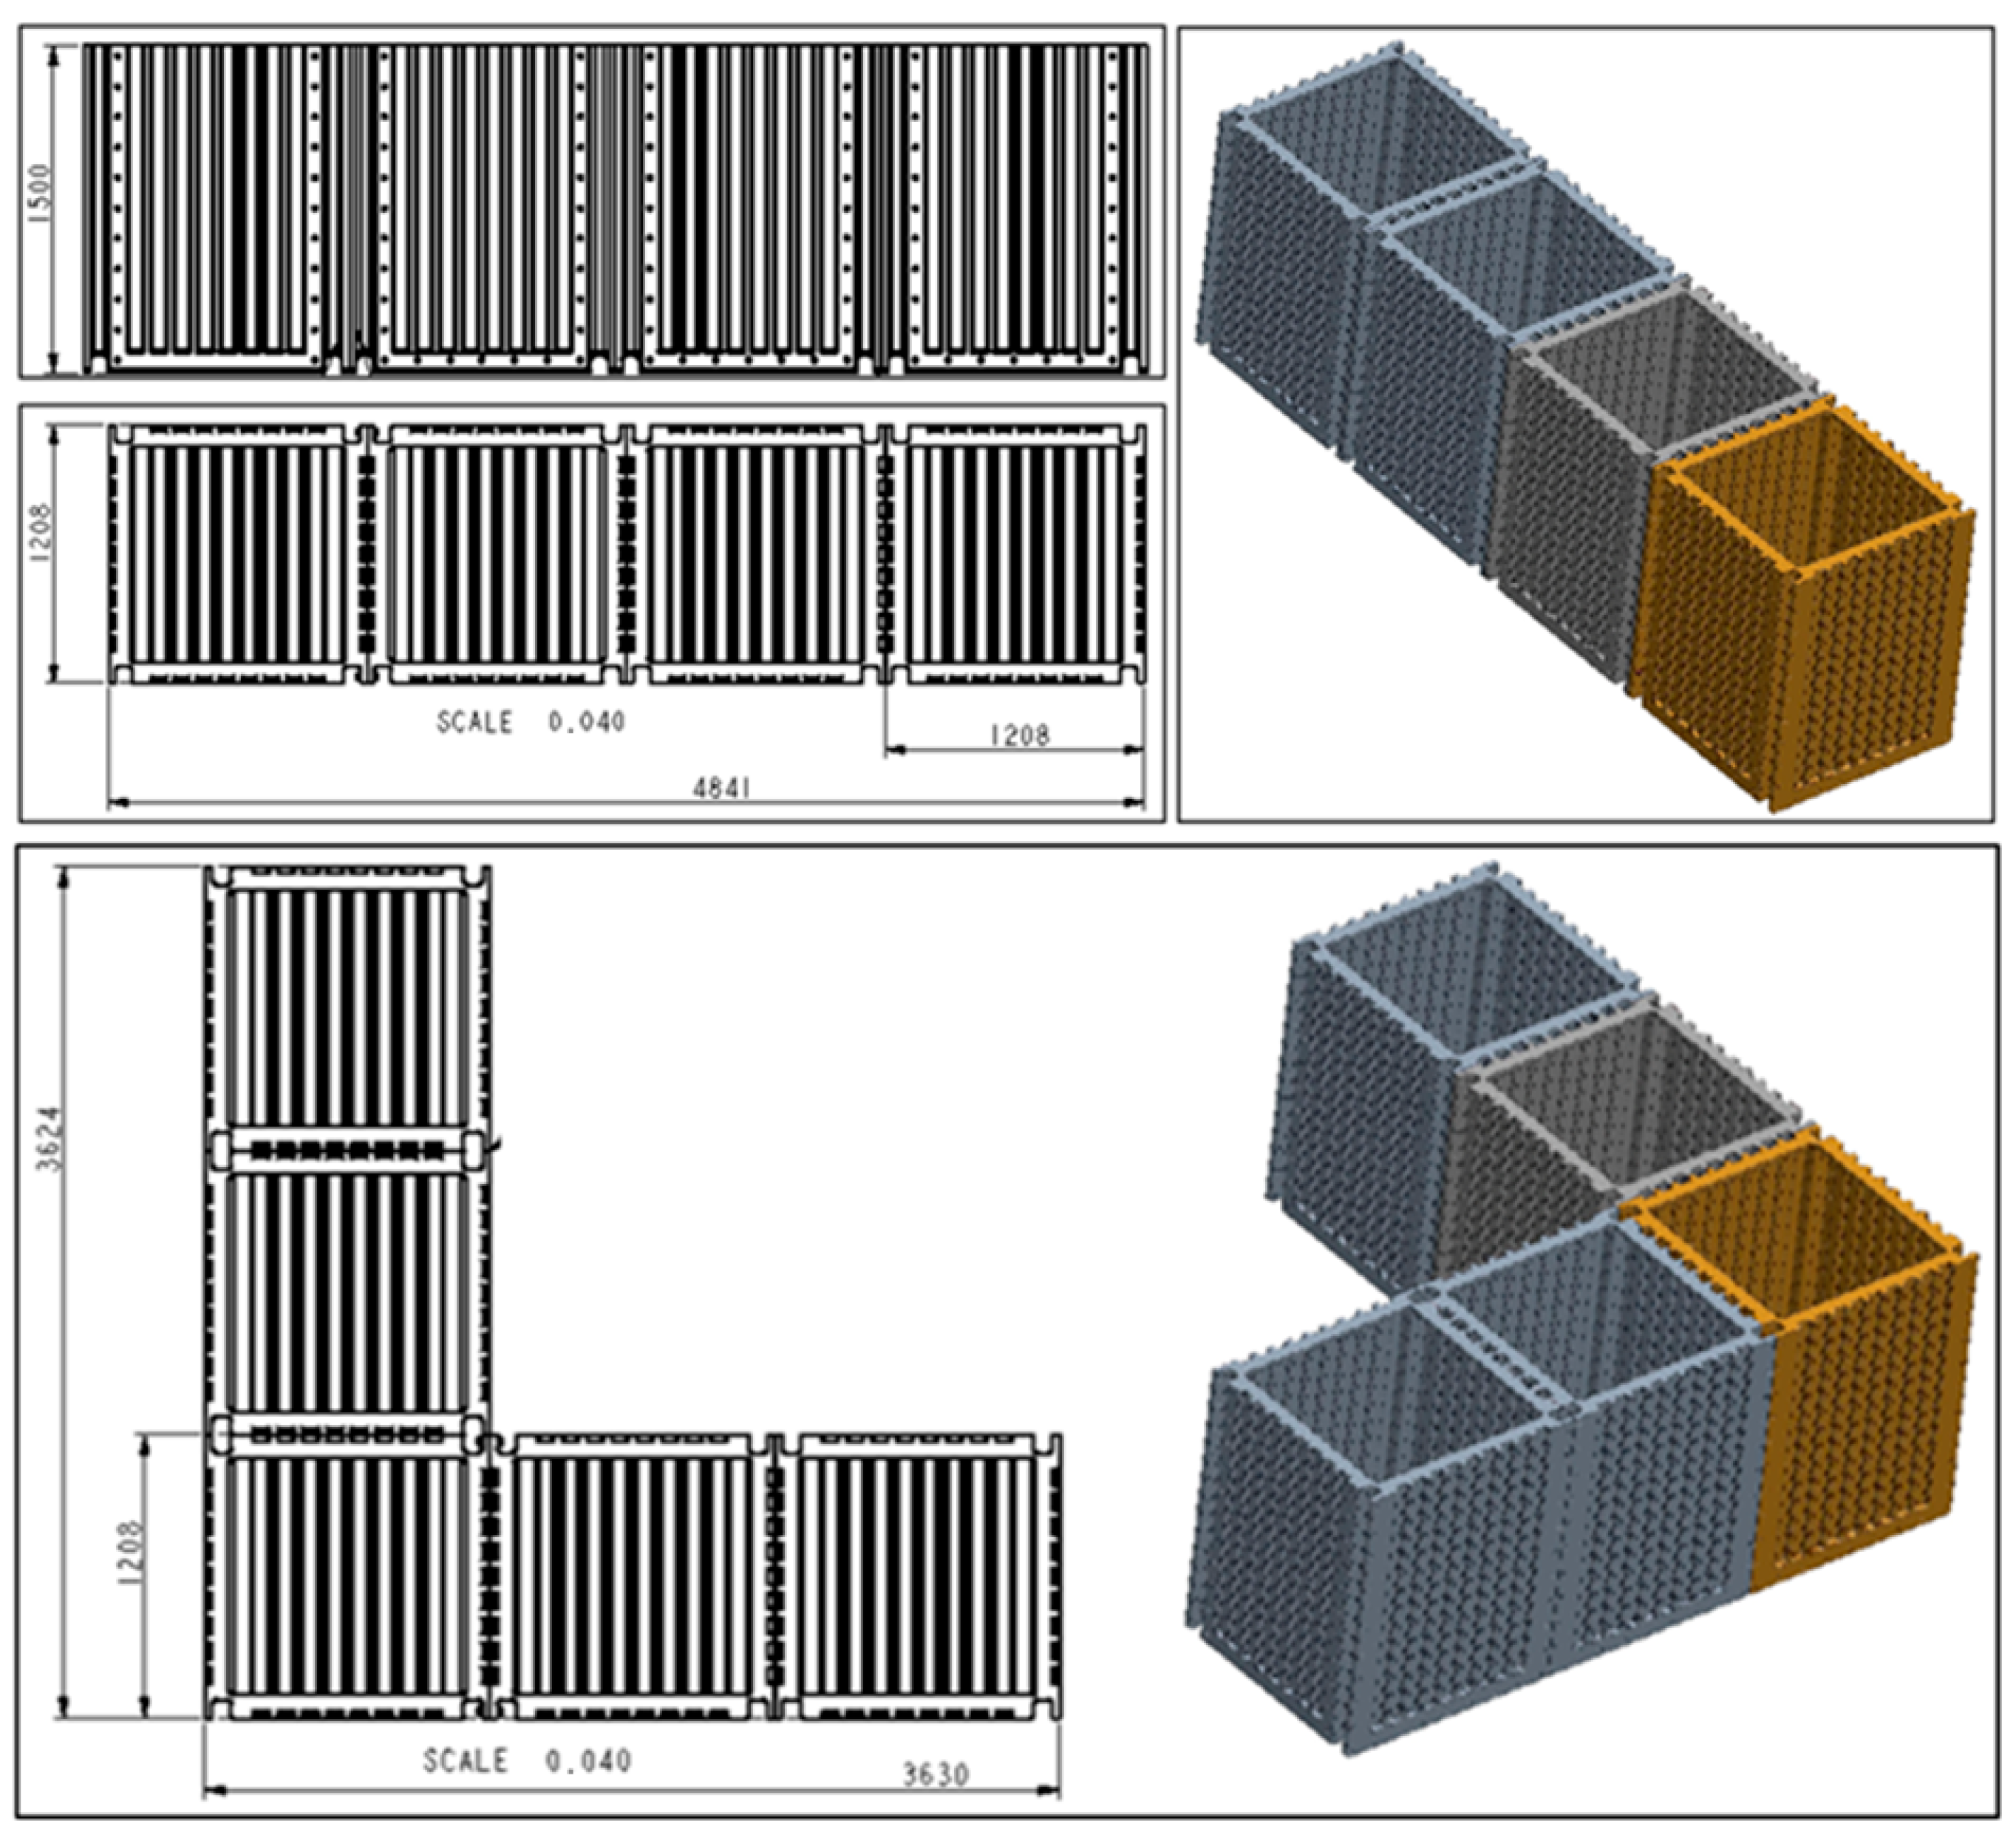
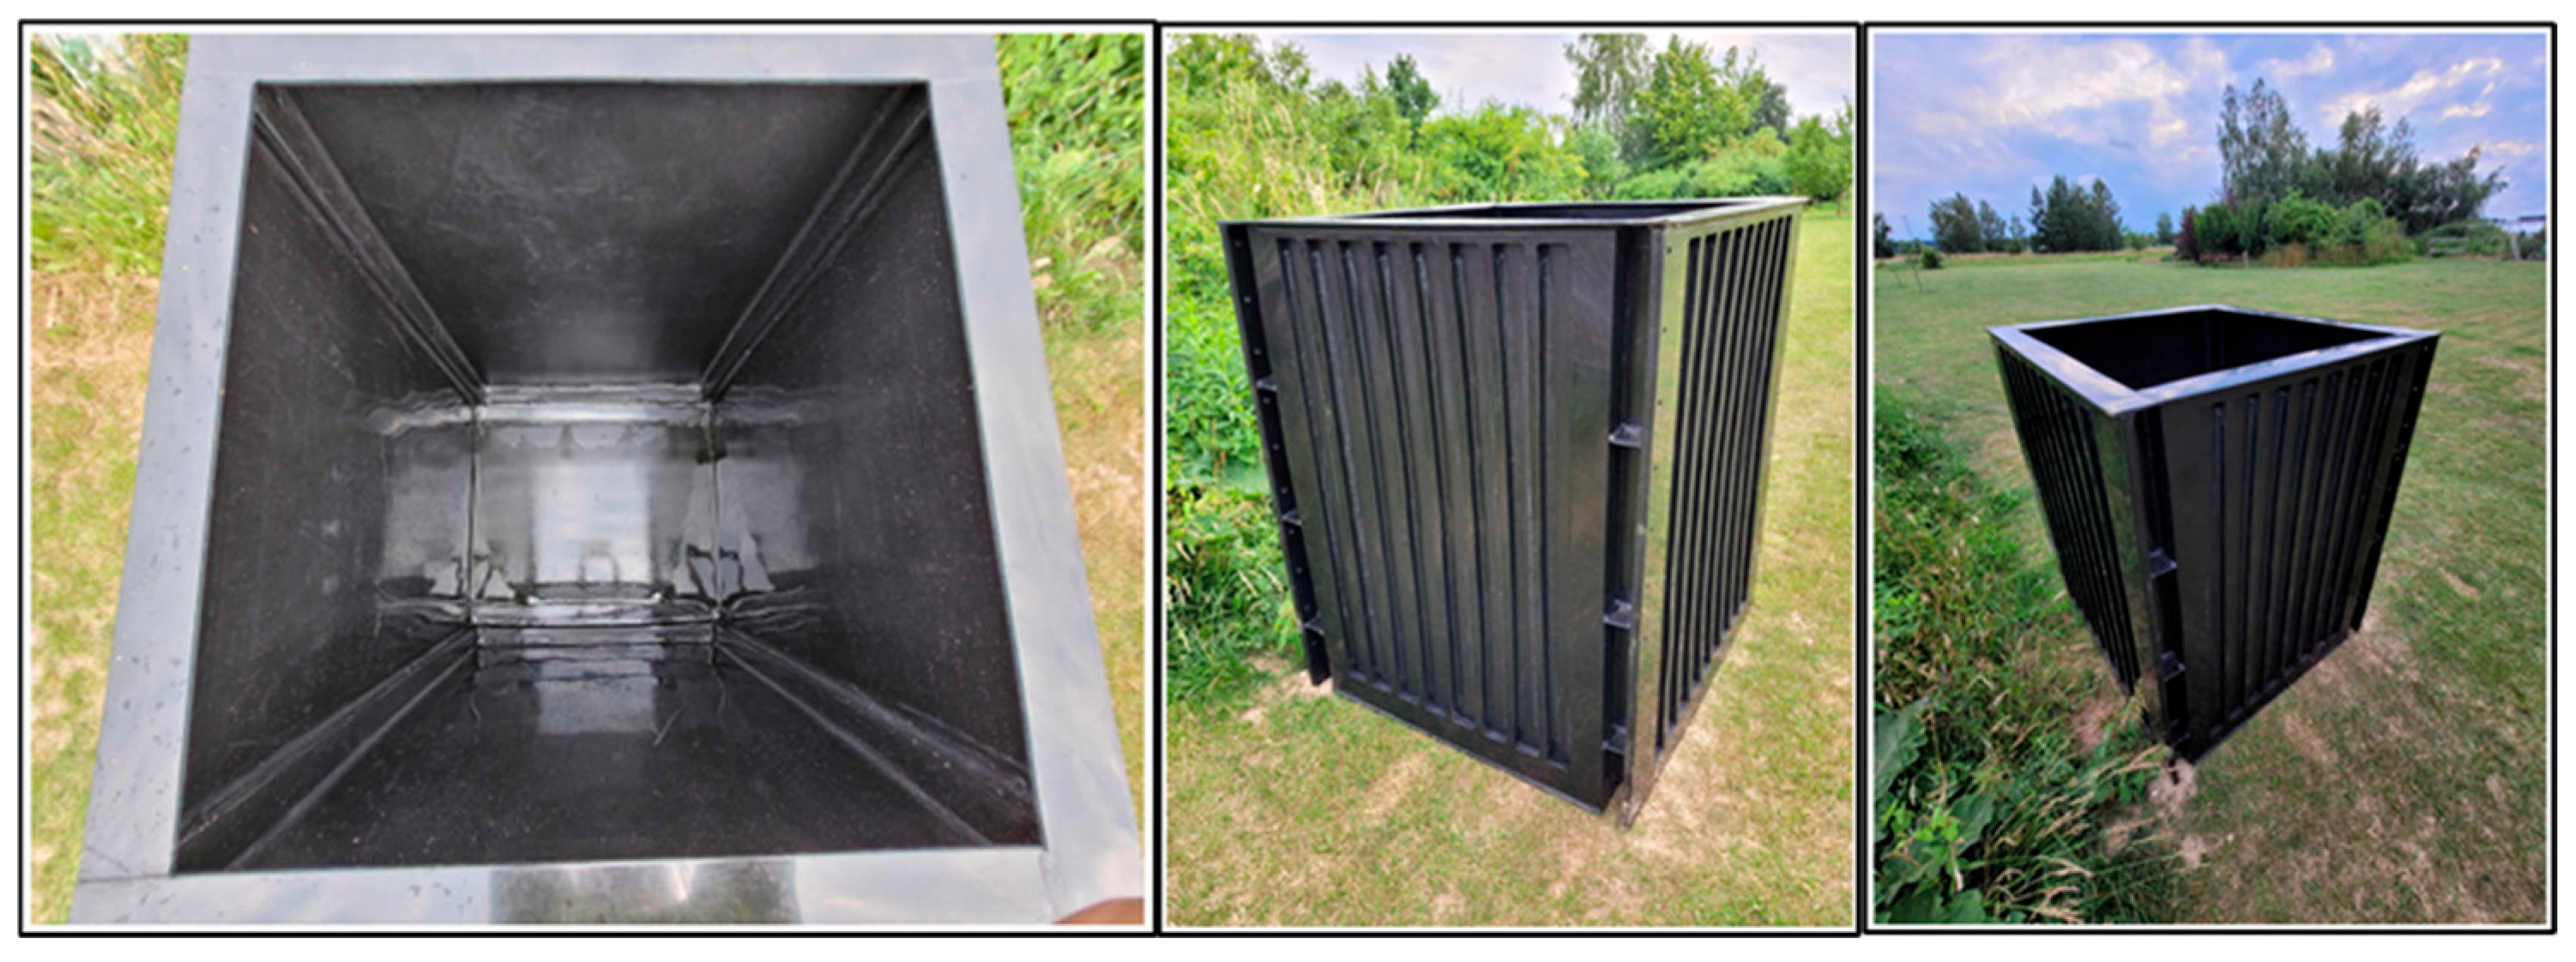
The experiment used an innovative prototype of a compact filter chamber (Figure 2, Figure 3 and Figure 4) with replaceable filter modules, which met the basic functional requirements for a water treatment system in natural pools, according to [2]:
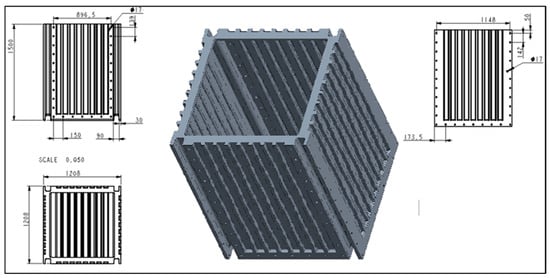
Figure 2.
Specification of the designed modular filter chamber [dimensions—cm].
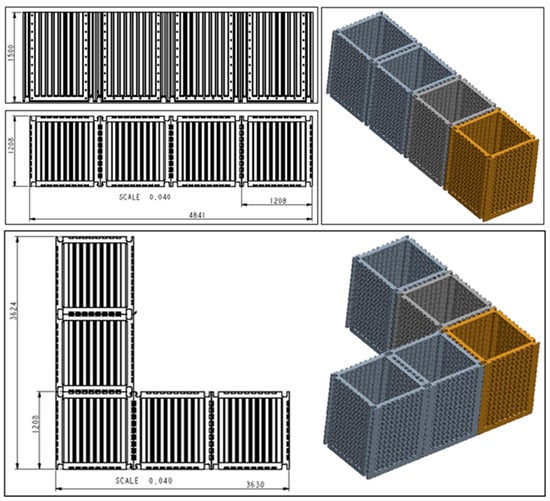
Figure 3.
Connection options for the modular filter chamber in the system [dimensions—cm].
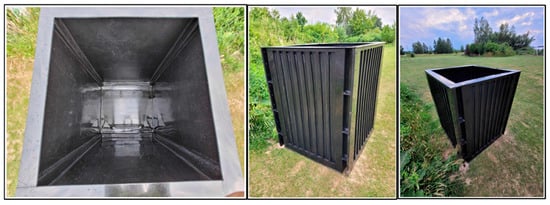
Figure 4.
Prototype of a modular filter chamber on a usable scale dedicated to water treatment systems in natural pools (photo: W. Walczak).
- Low system weight: Lightweight polymer components were used—HDPE (High-Density Polyethylene) materials adapted to aluminum frame structures.
- System modularity: Solutions were designed to enable trouble-free serial, parallel or Hybrid multiplication of the filter chamber in water treatment systems, using rubber seals, screws, connections and valves.
- Modularity of individual sections of the filter chamber itself: Freedom of two-way sequencing of successive sections and pumping stations with instrumentation adapted to the parameters of the quality of the water to be treated.
- Selective filtration options during functional rest of any of the filter cartridges: Based on solutions included in the patent application, technology has been used to enable the shutdown of some filter modules without closing the water circulation in the pond.
- Use of a filter with a mineral bed with proven high adsorption efficiency for phosphorus: A laboratory-tested, high-efficiency filter mineral-modified rock (Rockfos®, Ceramika KUFEL, Kraśnik, Poland) was used.
The prototype of the modular filter chamber was designed by a specialist company in accordance with the authors’ guidelines and functional requirements (lightweight, durability, modularity, resistance to weather conditions, resistance to ground loads, water, and resistance of the construction of the module-based platform) using Pro Engineer Creo 3.0 software.
The module design was then checked for compliance with the specified conditions in Ansys Workbench using the finite element method (MES in Polish) (an advanced method for solving systems of differential equations). The analysis was carried out for a module made of polyethylene using rotational molding, with a wall thickness of 10 mm and after simulation of the total load from the ground and surface water pressure.
The results confirmed the correctness of the design, the absence of structural defects, and strength significantly above the minimum, with a high safety factor, which gives the product a long service life.
Based on the designed solutions, a prototype filter chamber was manufactured in accordance with the developed specifications (Figure 4), which was used to test the efficiency of the water treatment system in an experimental natural swimming pond.
The possibility of selectively switching off the filter chamber module without having to shut down the water circulation in the entire multi-module system was achieved by using an innovative technological solution, which is the subject of patent application No. P.452443 (WIPO ST 10/C PL452443) filed with the Patent Office of the Republic of Poland (Poland).
The invention relates to a modular filtration system for low-pollution water, designed for water treatment in natural and municipal swimming ponds, typical swimming pools, as well as for rainwater treatment.
The aim of the invention is to propose a modular water filtration system solution that will ensure its uninterrupted and stable operation. As a result, the system should be more durable and efficient, which will translate into lower operating costs.
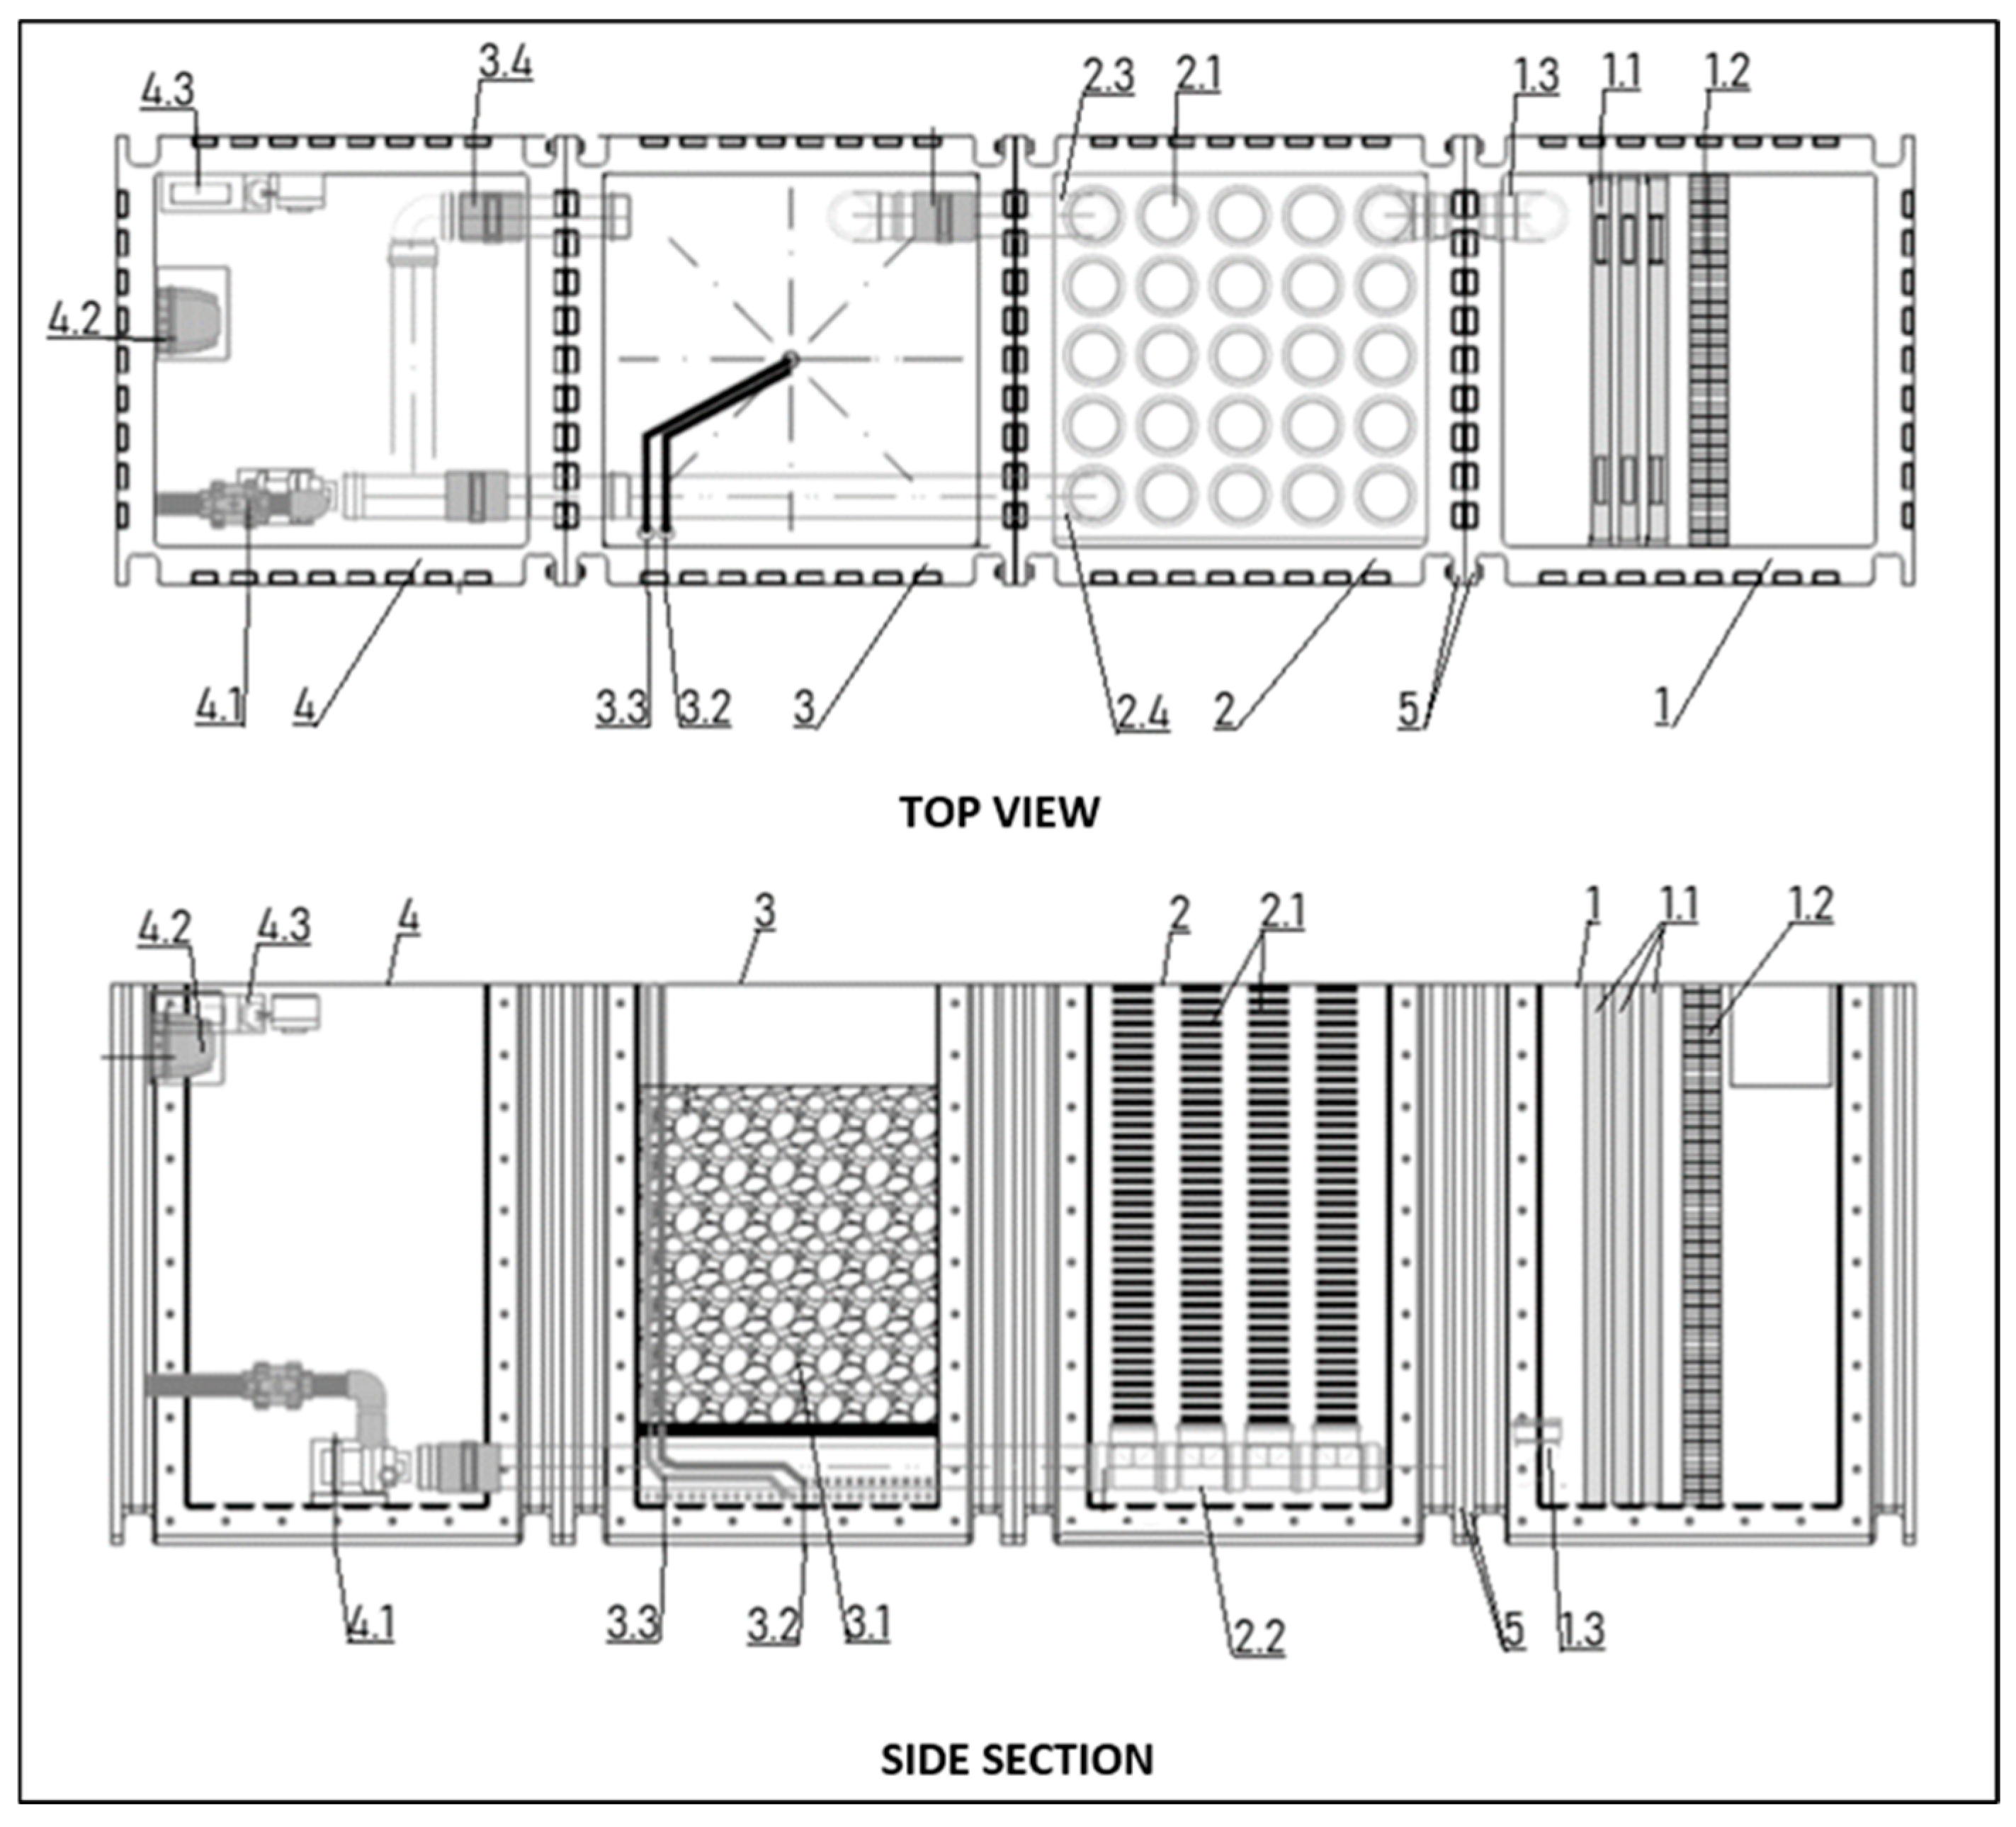
The proposed water treatment system consists of separate filtration modules: a pre-filter, a filter with a mineral bed, a filter with a biological membrane-covered bed, and a pump module.
The pre-filter module is a settling chamber with filter mats, and the mineral bed filter module is a chamber with an adsorbent material and an air or CO2 supply pipe. The biological bed filter module, on the other hand, is a place for the development of a microbiological biofilm, phytoplankton, and zooplankton, and consists of a chamber with a filter made of mesh tubes braided with a filter fabric that separates zooplankton, and the mesh tubes are embedded in a collector (Figure 5).
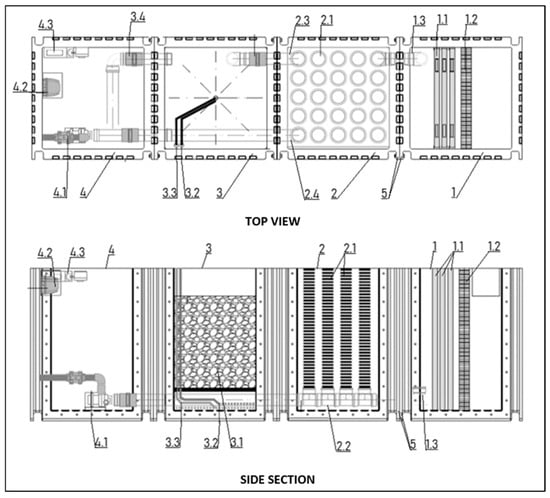
Figure 5.
Innovative modular water treatment system with filter control: 1—pre-filter module, 1.1—filter mats, 1.2—mesh filter, 1.3—drain, 2—filter module with biological bed, 2.1—mesh tube filter, 2.2—collector, 2.3—pipe with valve to mineral filtration module, 2.4—pipe with valve to pump module, 3—filter module with mineral bed, 3.1—adsorbent material, 3.2—air or CO2 supply pipe, 3.3—clean water inlet pipe, 3.4—pipe with valve to pump module, 4—pump module, 4.1—continuous operation pump, 4.2—air compressor, 4.3—CO2 and coagulant dosing pumps, 5—connecting flange with holes for screwing the modules together.
The essence of the modular filter system is that the modules are universal, functionally interconnected (their adjacent side walls have flanges with holes for screwing them together along the vertical edges), and their number can be multiplied as required according to the volume of water to be treated (Figure 2, Figure 3, Figure 4 and Figure 5).
Selective module shutdown according to the invention is possible thanks to a system of pipes and valves, which allows for the continuous and effective operation of the system and regeneration of the mineral bed without causing the disappearance of bacterial flora and zooplankton in the chamber with the biological bed.
The filter module with a biological membrane-covered bed (2) uses two pipes with valves. The first (2.3) connects to the filter module with a mineral bed, and the second (2.4) connects directly to the pump module. The pump module also has a pipe with a valve (3.4) connecting to the mineral module. In this design, the filter module can be temporarily shut down by closing the valves on pipes (2.3) and (3.4) and opening the valve on pipe (2.4)—Figure 5.
This allows for easy regeneration of the adsorbent material by rinsing it and, above all, by drying the biofilm on its surface. The design, therefore, allows for relatively easy and effective regeneration of the bed and effective improvement in its sorption parameters, in accordance with the guidelines from experimental studies, according to [12].
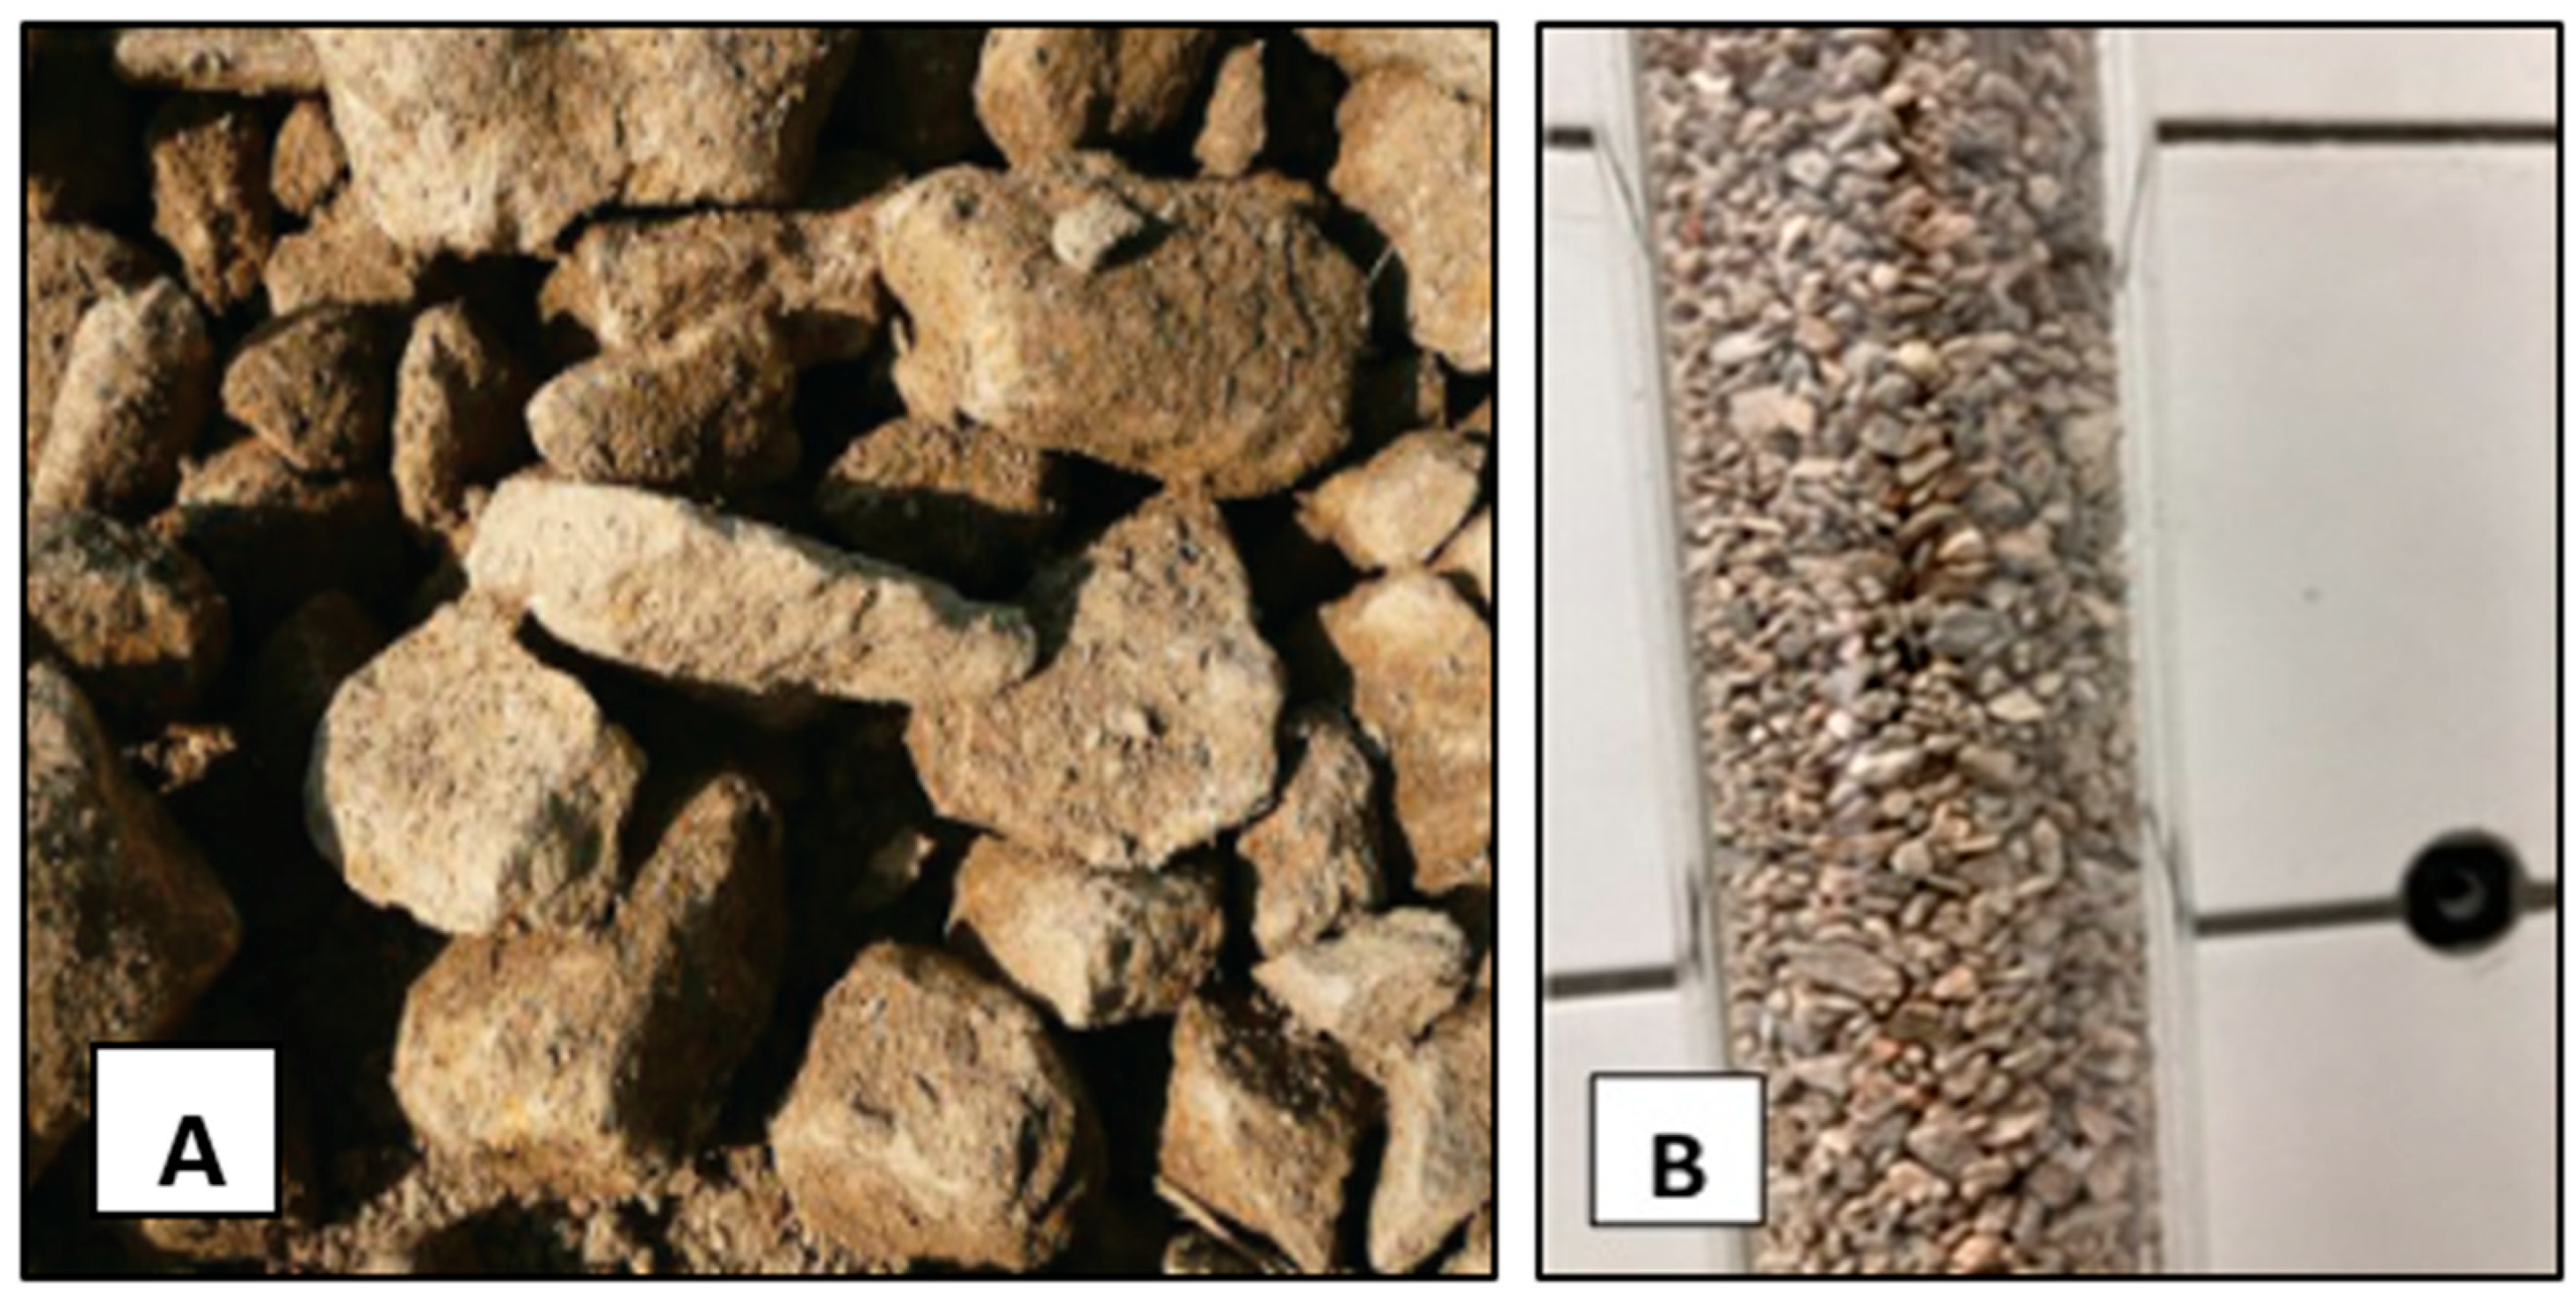
In field tests, the filter module with mineral was filled with a material highly effective in phosphorus sorption, which was previously verified in laboratory column experiments [13]. The material selected was Rockfos®, produced by Ceramika KUFEL in a process of high-temperature decarbonization of natural carbonate–silicate rock—opoka (Figure 6).
The mineral contains significant amounts of elements that are potentially reactive with phosphorus, i.e., calcium, silicon, aluminum, iron, magnesium, and manganese [13]. However, the natural character of this rock, associated with the presence of fine organic debris, its non-homogeneous structure [14], and nuances of technological modification, mean that successive batches of material may have different adsorption efficiencies [5,15].
Therefore, the material used in laboratory and field tests was from the same batch and had a sorption efficiency of 90–99.7%, depending on the total phosphorus (Ptotal) in the initial experimental solution. The total sorption capacity of this material also indicated the highest amount of progressively accumulated P in the bed, compared to other tested materials (Sulfur iron material, limestone grit), for the entire test cycle. The mineral also showed minimal ion release processes or changes in water quality parameters without exceeding the FLL [10] standards for natural swimming ponds, confirming its high filtration efficiency [13]. Due to the practical research focusing on phosphorus-removal efficiency without strictly sorption (isotherms, kinetics and thermodynamic parameters of sorption), the mineralogical features of the material used, e.g., surface area, micropore and mesopore size, XRF/XRD, etc., were not analyzed. The basic chemical characteristics of this batch of Rockfos® material are given in publication [13].
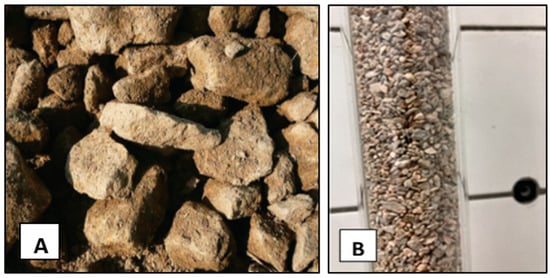
Figure 6.
Calcium–silicate rock—opoka. (A) natural material [15], (B) Rockfos® material (photo: W. Walczak).
Figure 6.
Calcium–silicate rock—opoka. (A) natural material [15], (B) Rockfos® material (photo: W. Walczak).
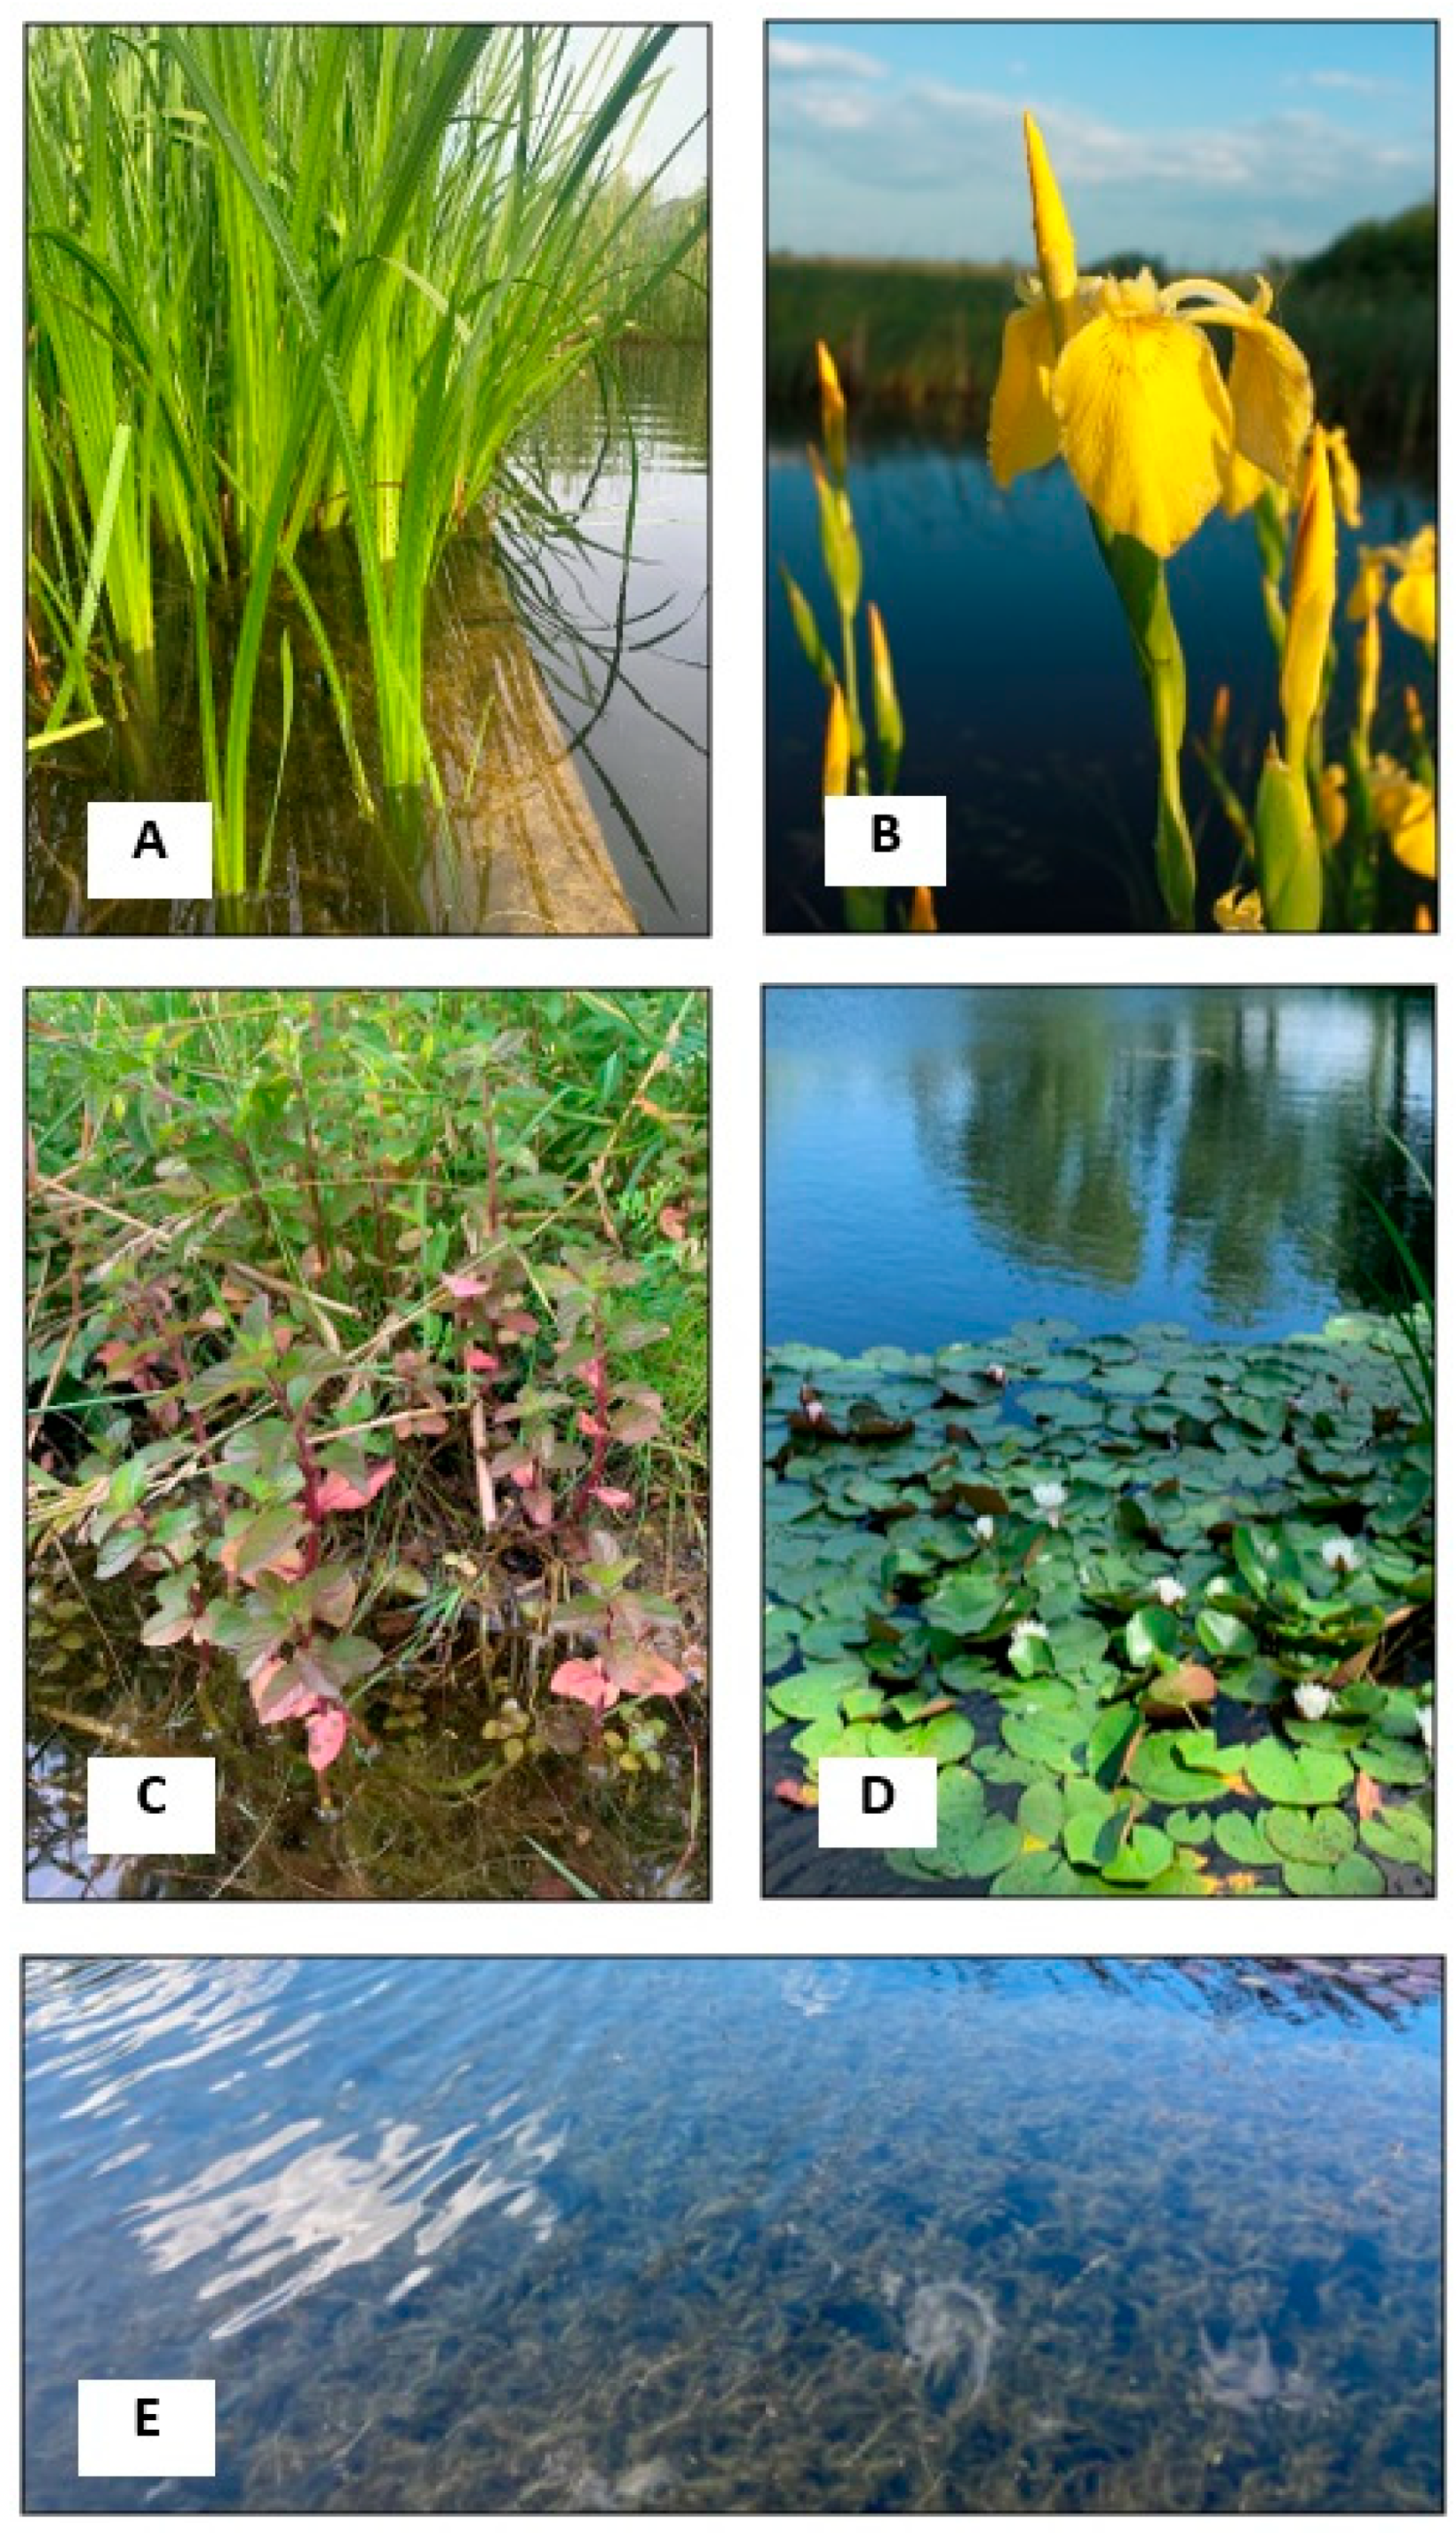
In connection with the formation of the regeneration zone of the experimental natural swimming pond of type II, plant material with re-growth functions was used. In accordance with the recommendations for swimming ponds, native or naturalized macrophyte species that meet moderate habitat requirements, have high decorative value, are resistant to pests and diseases, and improve water quality were used [8]. These species included the following:
- Acorus calamus L.—f. Acoraceae, Cl. Lilliopsida: A species that forms the Acoretum calami rush community in nature, a helophyte, a marsh geophyte, frost-resistant, due to its outstanding nitrophilic properties (ability to absorb significant amounts of nitrogen and phosphorus from the environment) recommended for use in biological wastewater treatment plants [16]—Figure 7A.
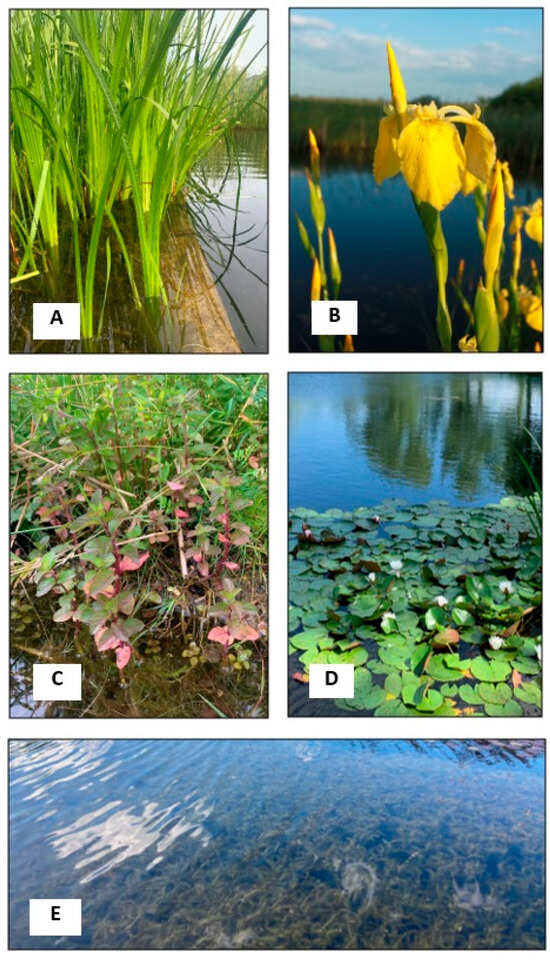 Figure 7. Plants of the regeneration zone of experimental ponds (photo: W. Walczak). (A)—Acorus calamus, (B)—Iris pseudoacorus, (C)—Mentha aquatica, (D)—Nymphaea alba, (E)—Myriophyllum spicatum.
 - Iris pseudoacorus L.—f. Iridaceae, Cl. Liliopsida: A species characteristic of the Magnocaricion association and the iris-sedge community Iridetum pseudacori, hygrophytic, frost-resistant [17], with unique rhizofiltration properties, used in biological water treatment systems [8]—Figure 7B.
- Mentha aquatica L.—f. Lamiaceae, Cl. Magnoliopsida: A species typical of many meadows, rush and peat bog phytocenoses, e.g., Phragmitetea [17], a perennial, aromatic plant with phytosanitary (essential oils), bioaccumulative and rhizofiltration properties, used in ponds and for biological water treatment in ponds [8]—Figure 7C.
- Nymphaea alba L.—f. Nymphaeaceae, Cl. Magnoliopsida: Water lily, a perennial species characteristic of the Nupharo-Nymphaeetum albae vegetation complex and the Nymphaeion association, hydrophytic, nymphaeid growing in meso- and eutrophic conditions; in nature, in Poland, it is partially protected; due to its impressive large flowers floating on the water surface, this species has unique decorative qualities, especially in hybrid varieties [18]—Figure 7D.
- Myriophyllum spicatum L.—f. Haloragaceae, Cl. Magnoliopsida: A species of aquatic plant that floats freely or anchors itself to the bottom with creeping shoots and adventitious roots, a typical macrophyte, hydrophyte, and elodeid, characteristic of the Myriophylletum spicati community and the Potametea class of communities; frost-resistant, used for planting water gardens [19]—Figure 7E.
2.2. Research Object
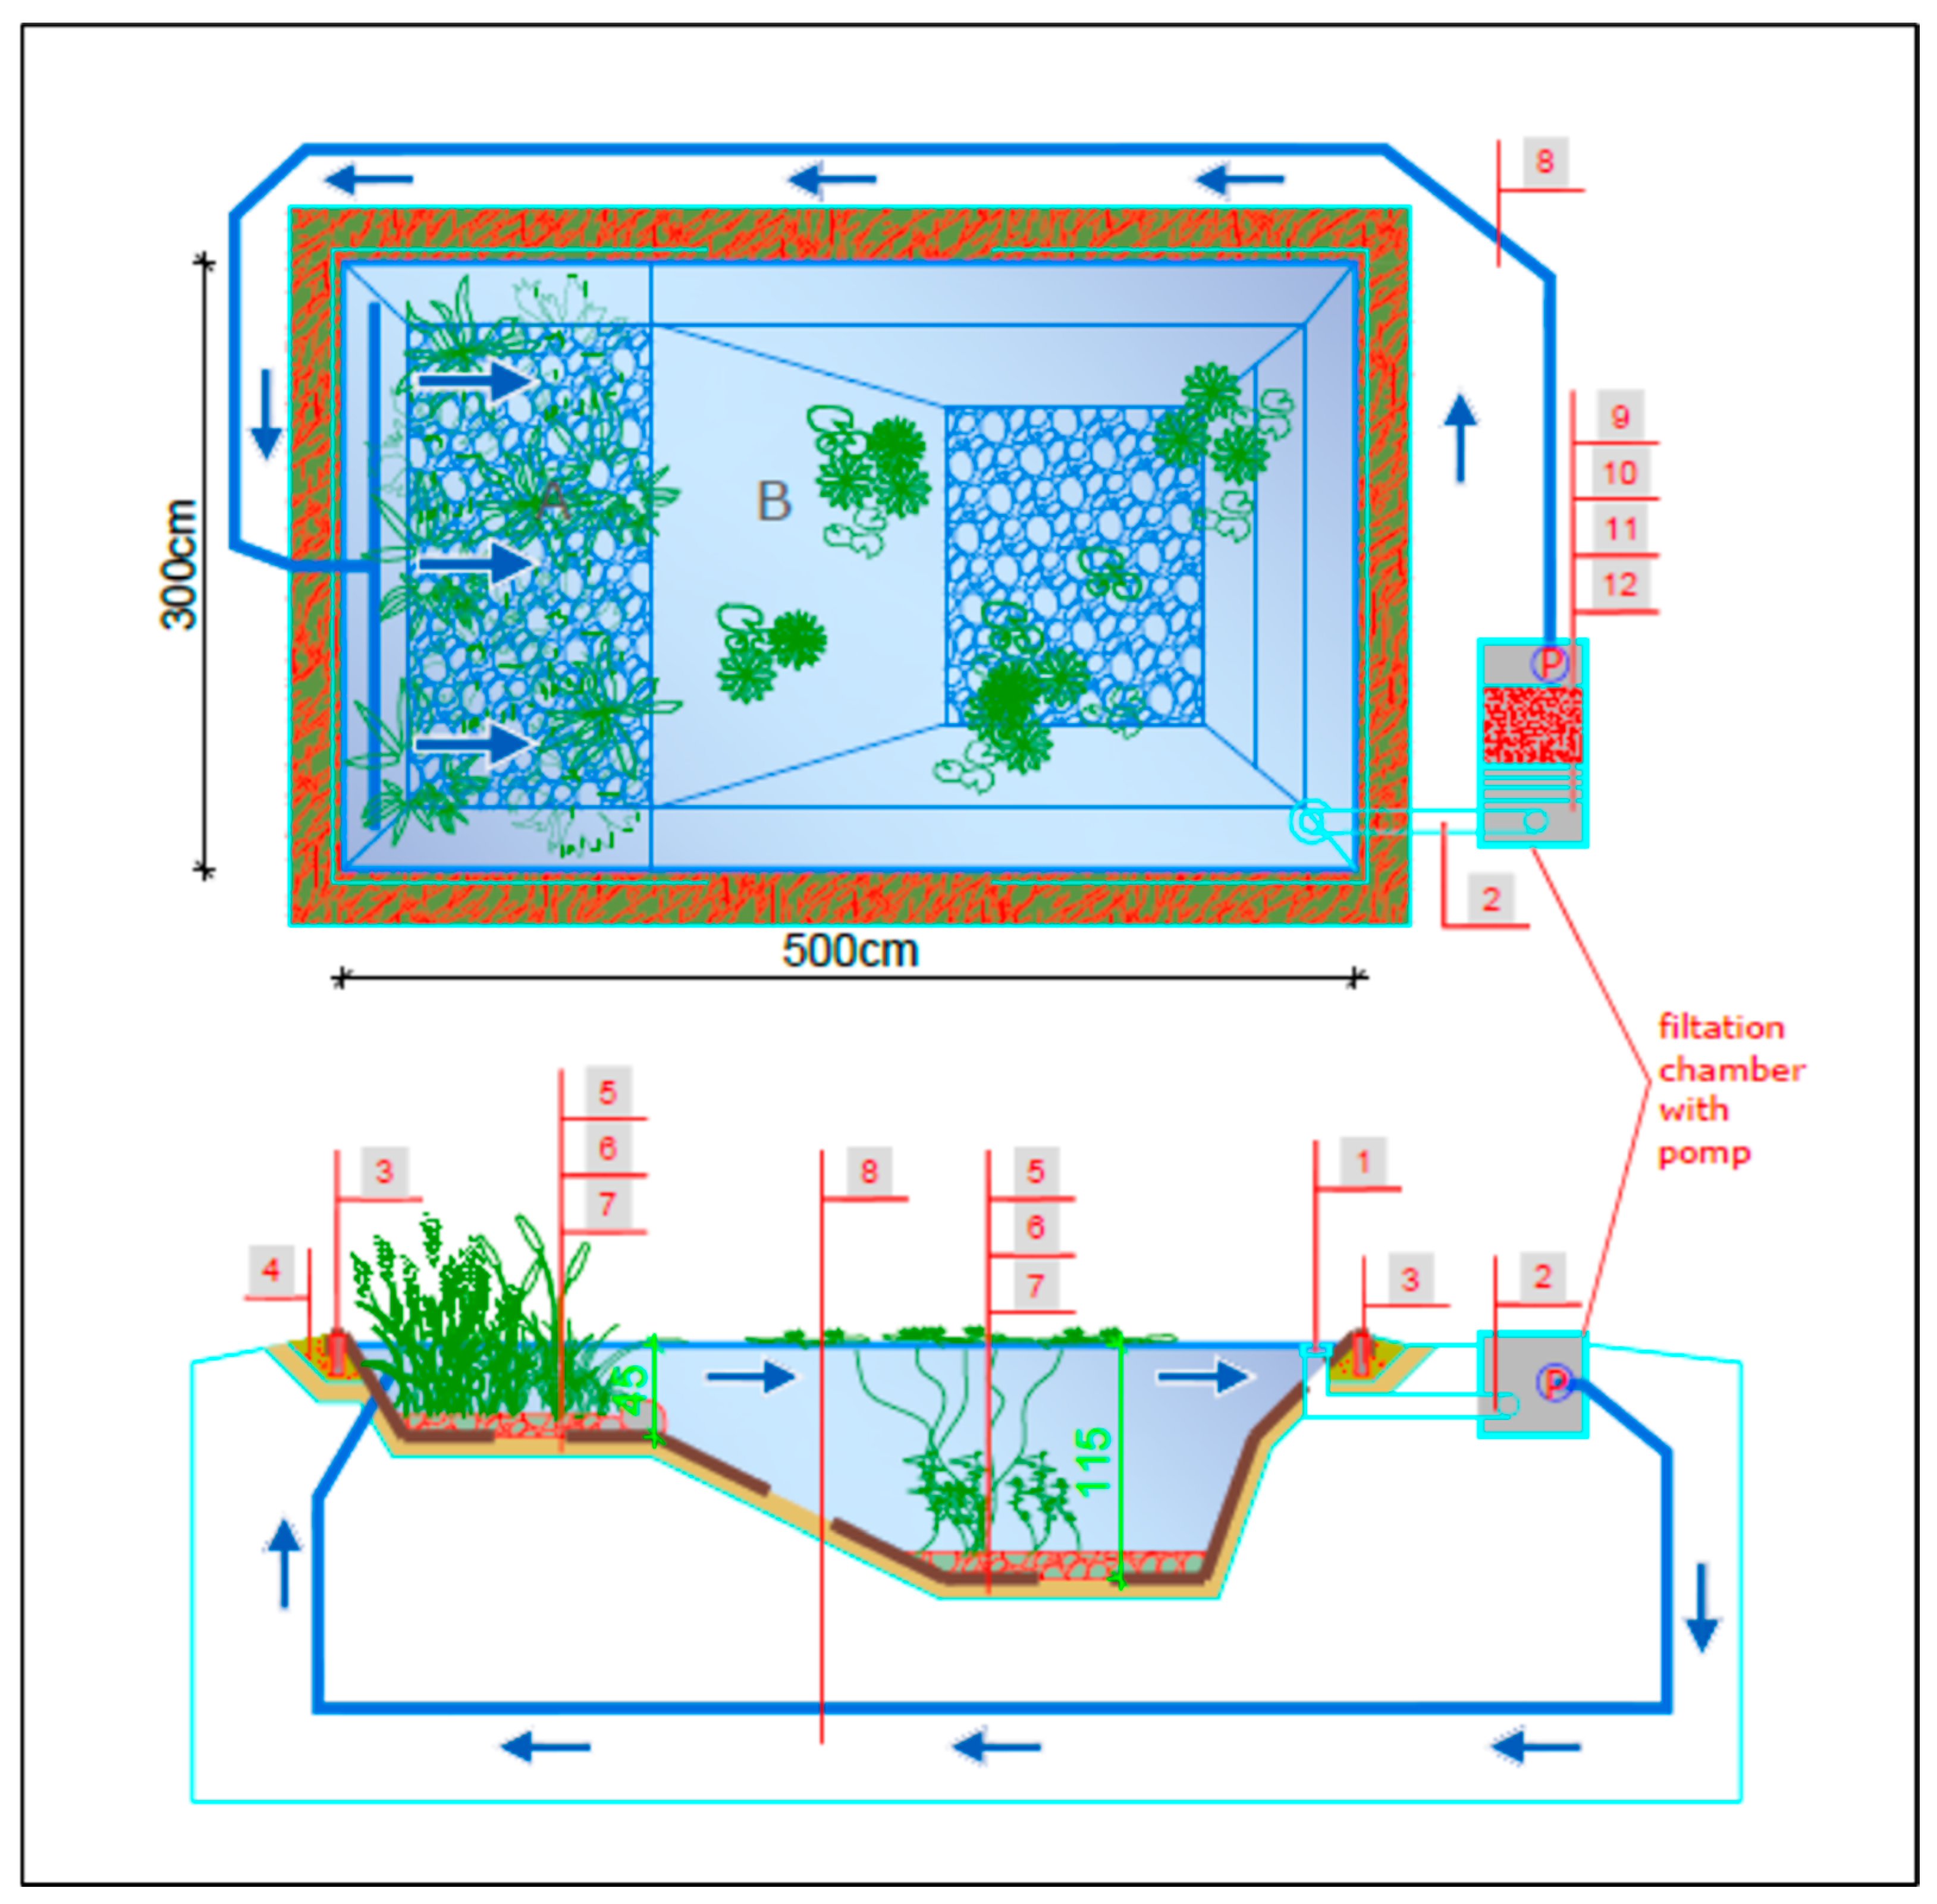
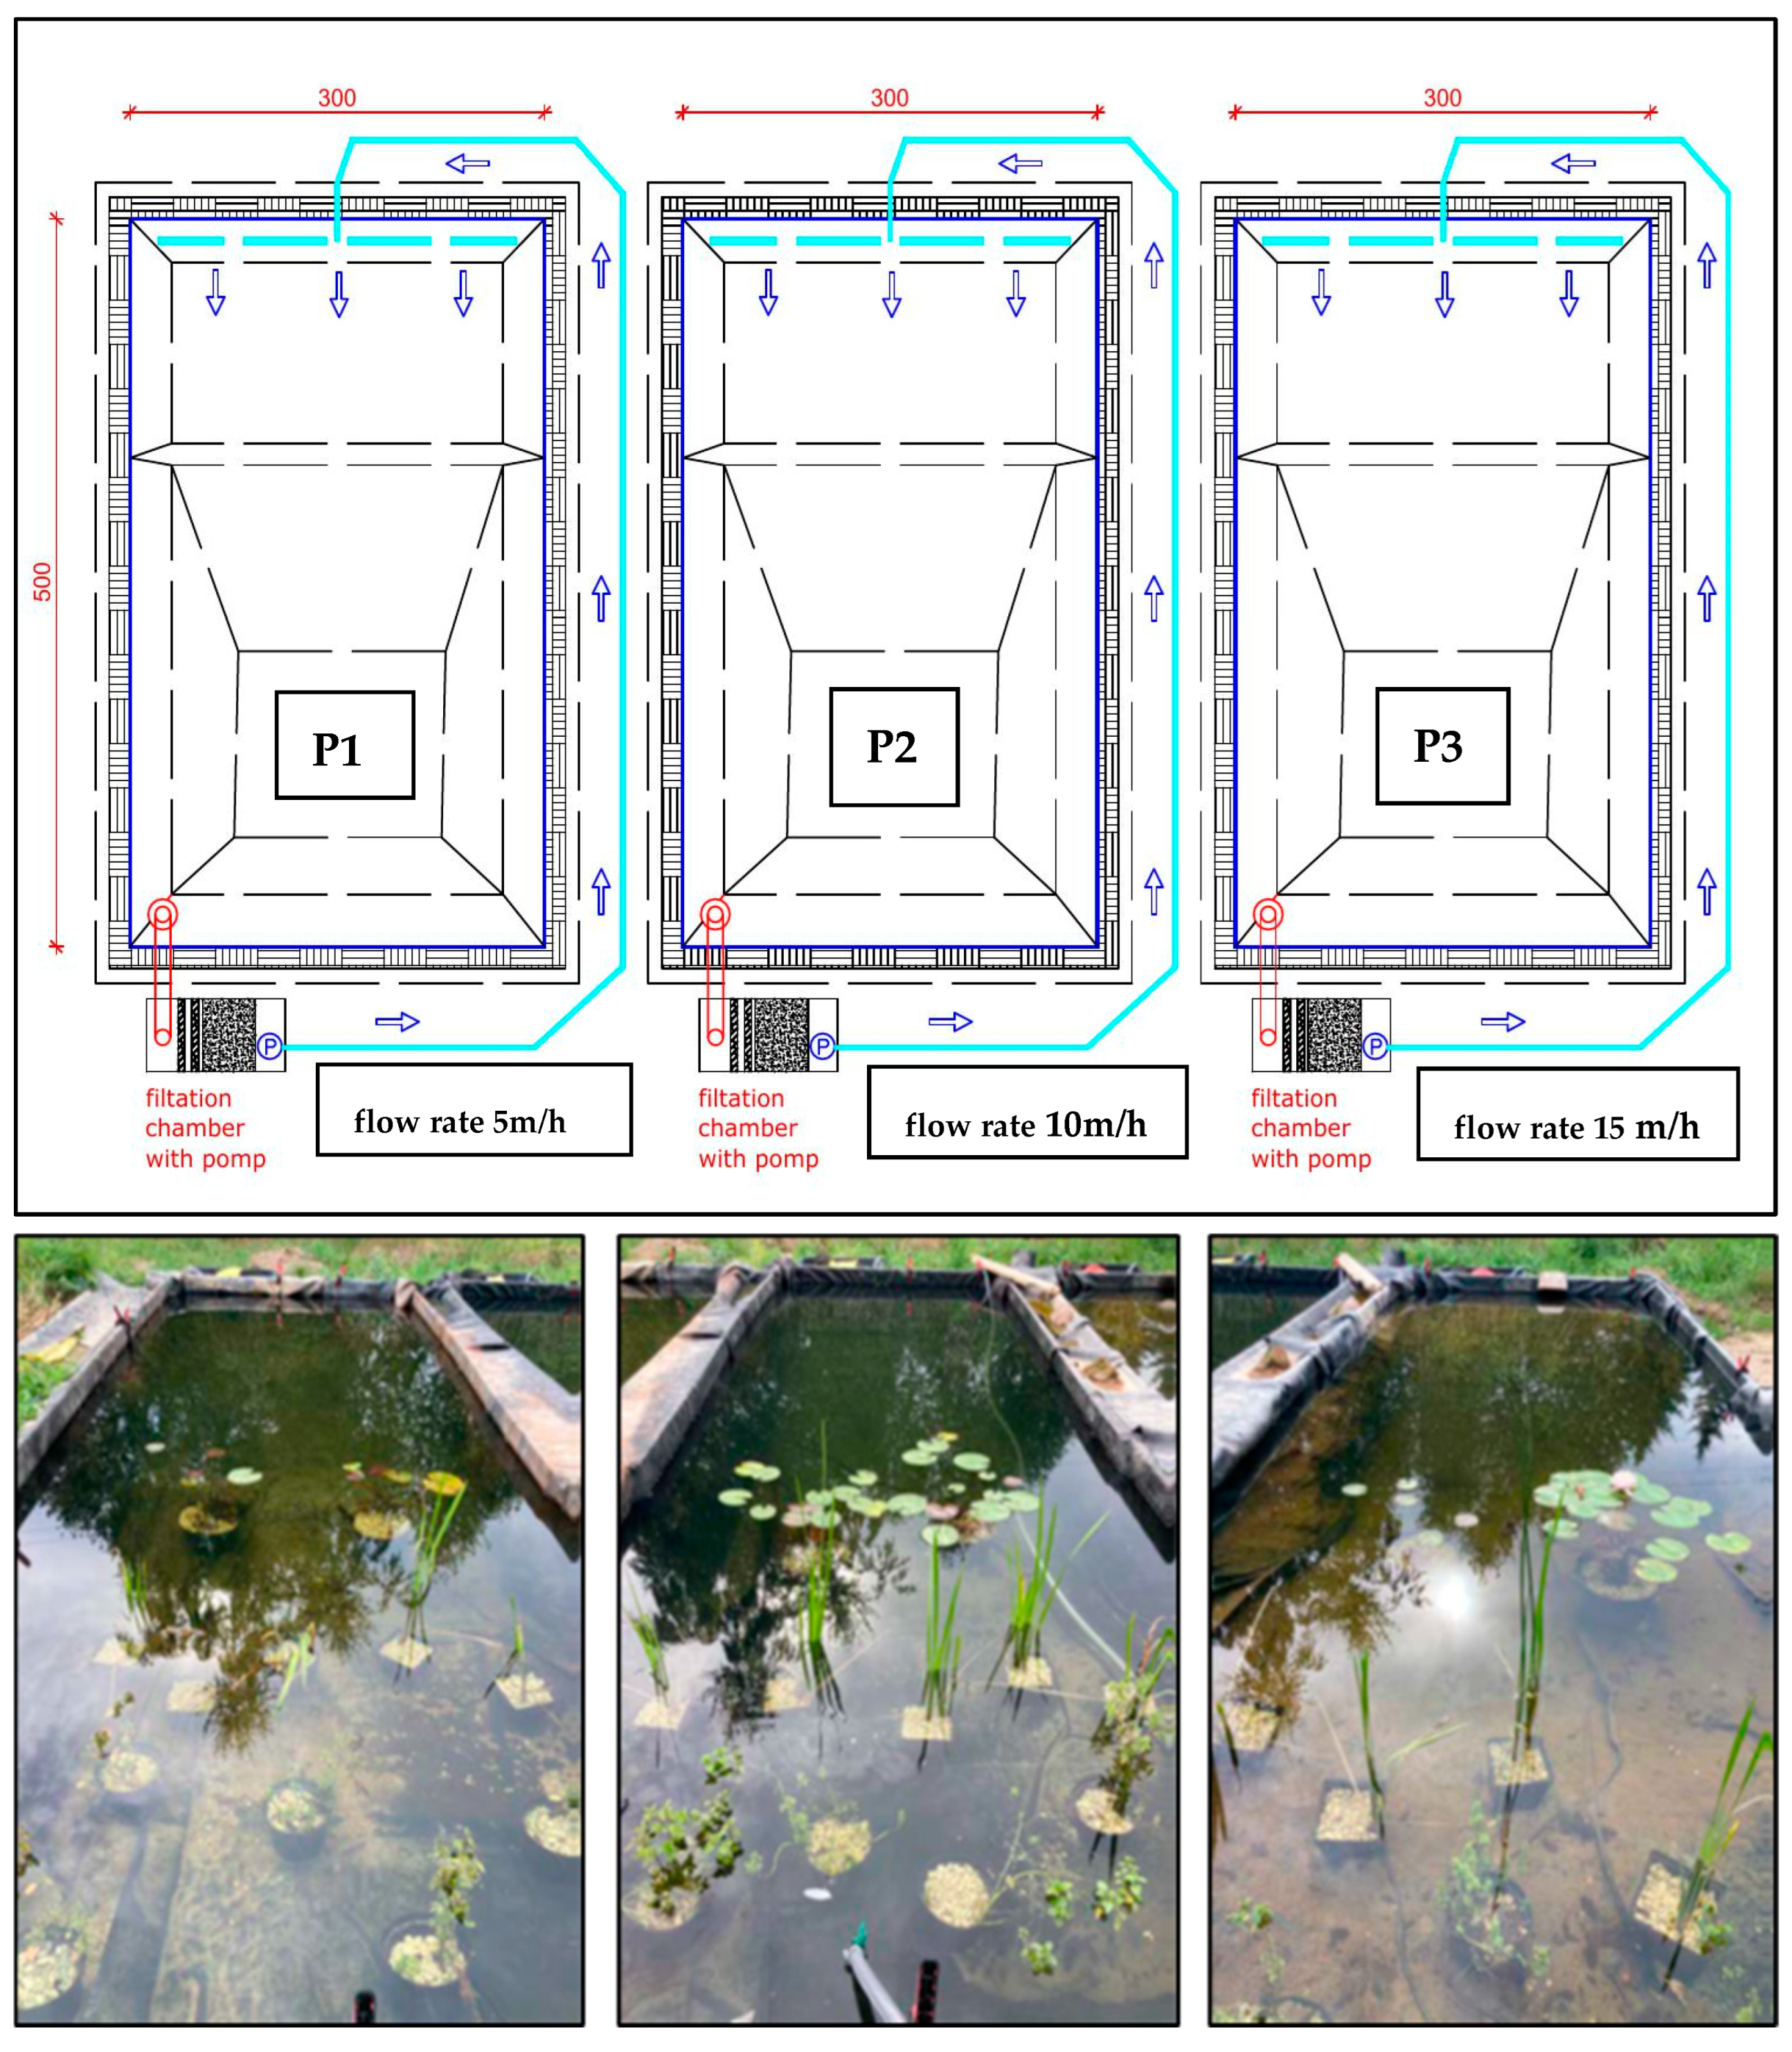
For practical experiments, three water reservoirs were initially built on a private property (in Radzymin near Warsaw, Poland) on a scale of 1:10 in relation to the average size of a natural swimming pond (according to European standards, this is 150 m2). Each of them had an area of 15 m2, dimensions of 3 m × 5 m, a water capacity of approx. 10.5 m3, and was sealed from the ground with 1.02 mm thick EPDM waterproofing foil. A regeneration zone (depth 0–45 cm) with an area of approx. 4 m2 was separated and planted with rushes with an average density of 5 seedlings/m2. The following species were used: Acorus calamus—5 pcs, Iris pseudoacorus—5 plants and Mentha aquatica—10 plants. The deep recreational zone (45–115 cm) of each reservoir, with an area of approx. 8 m2, was planted with ornamental species: Nymphaea alba—3 plants and Myriophyllum spicatum—5 plants, with an average density of 1 seedling/m2 (Figure 8, Figure 9 and Figure 10). The aquatic plants were planted in openwork containers (for stabilization), filled with washed gravel with a diameter of 16–32 mm and covered with unfractionated gravel with a thickness of 10 cm.
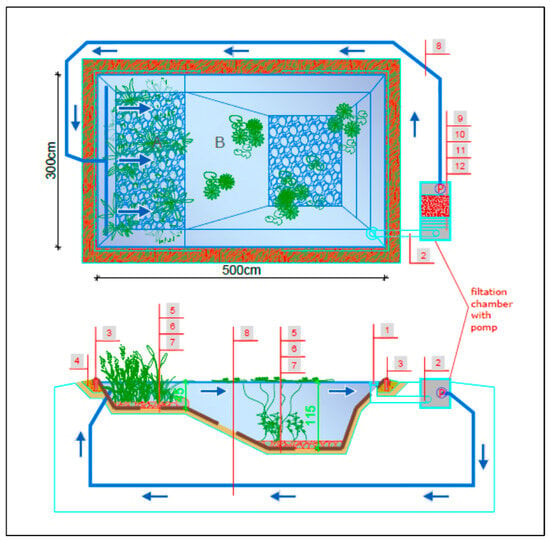
Figure 8.
Specification of a single experimental pond with the tested effective filtration rate: A—regeneration zone, B—recreation zone, 1—skimmer, 2—suction pipe, 3—capillary barrier, 4—sand bed, 5—gravel (16–32 mm), 6—EPDM waterproofing membrane, 7—protective geotextile 300 g/m2, 8—discharge pipe, 9—pump chamber, 10—chamber with mineral bed filter, 11—sedimentation chamber with pre-filter, blue arrow—direction of water circulation.
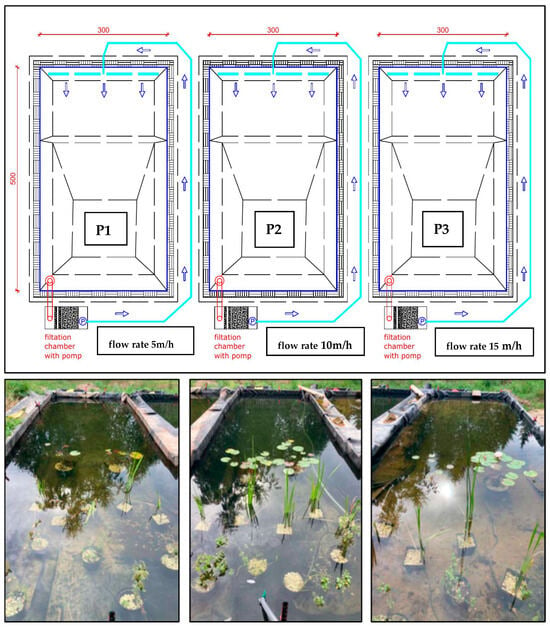
Figure 9.
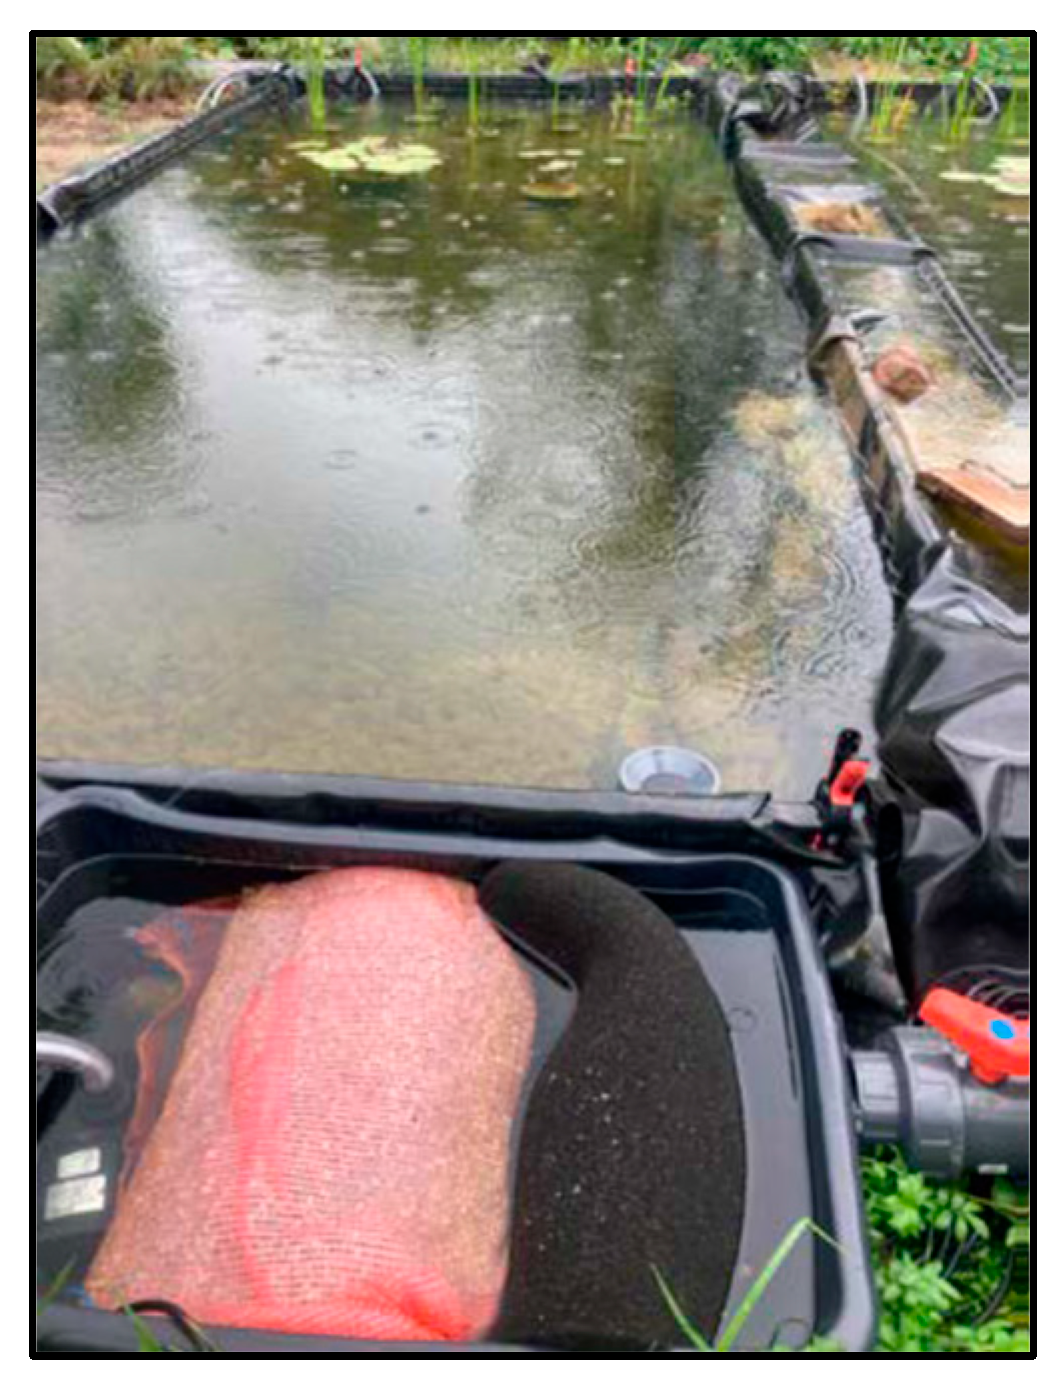
Experimental tank system for testing the effective filtration rate of the system: P1—5 m/h; P2—10 m/h, P3—15 m/h (photo: W. Walczak), blue arrow—direction of water circulation.
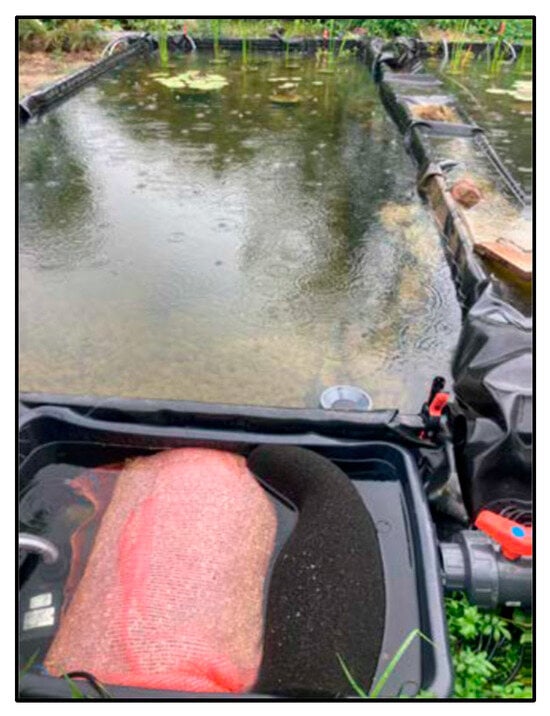
Figure 10.
View from the filtration system side of a single pond—P2 (photo: W. Walczak).
The water tanks prepared in this way imitated natural bathing ponds and were used to analyze the filtration efficiency of the selected mineral material for different water flow rates in the tanks. For this purpose, each tank was equipped with a filtration set in the form of a chamber measuring 100 cm × 50 cm × 50 cm, which included the following:
- A 2-layer sponge pre-filter made of 50 cm × 50 cm filter sponge: first layer 20 PPI (20 channels/inch) and the second layer 30 PPI (30 channels/inch), each 3 cm thick.
- Mineral bed filter made of thermally modified Rockfos® filter media in filter bags with a total volume of 100 L (50 cm × 50 cm × 40 cm, which is 0.1 m3).
- A circulation pump in the first pond with a flow rate of 5 m3/(h·m2) (5 m/h)—P1; in the second pond 10 m3/(h·m2) (10 m/h)—P2; and in the third at 15 m3/(h·m2) (15 m/h)—P3 (see Figure 8).
The water circulation system in the ponds was equipped with a skimmer, which is a device that catches mechanical surface impurities, a pipeline, and a drainage system that distributes filtered water from the filter chamber to the regeneration zone of each tank (Figure 8, Figure 9 and Figure 10). The tests of filters for water treatment in a closed circuit consisted of taking water from the pool basin with a pump, passing it through a filter and pumping it back into the pool. In order to ensure water exchange in the pool, water was taken from one designated point and pumped back in at the opposite side of the pool (see Figure 8).
After completing research on effective filtration speed, the three test tanks were converted into a single experimental natural pool of the second type, called full-scale pond (FSP) with specifications meeting European standards for the design and construction of swimming ponds in accordance with the FLL standard—Figure 11 and Figure 12.
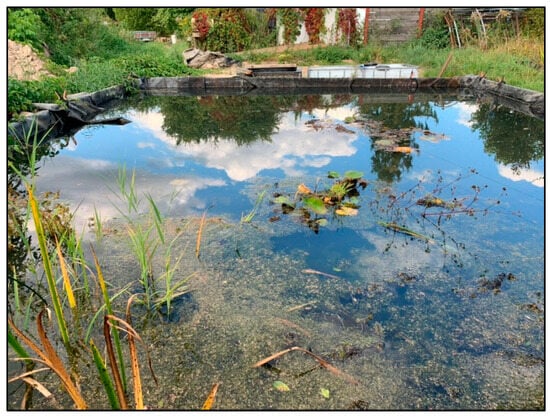
Figure 11.
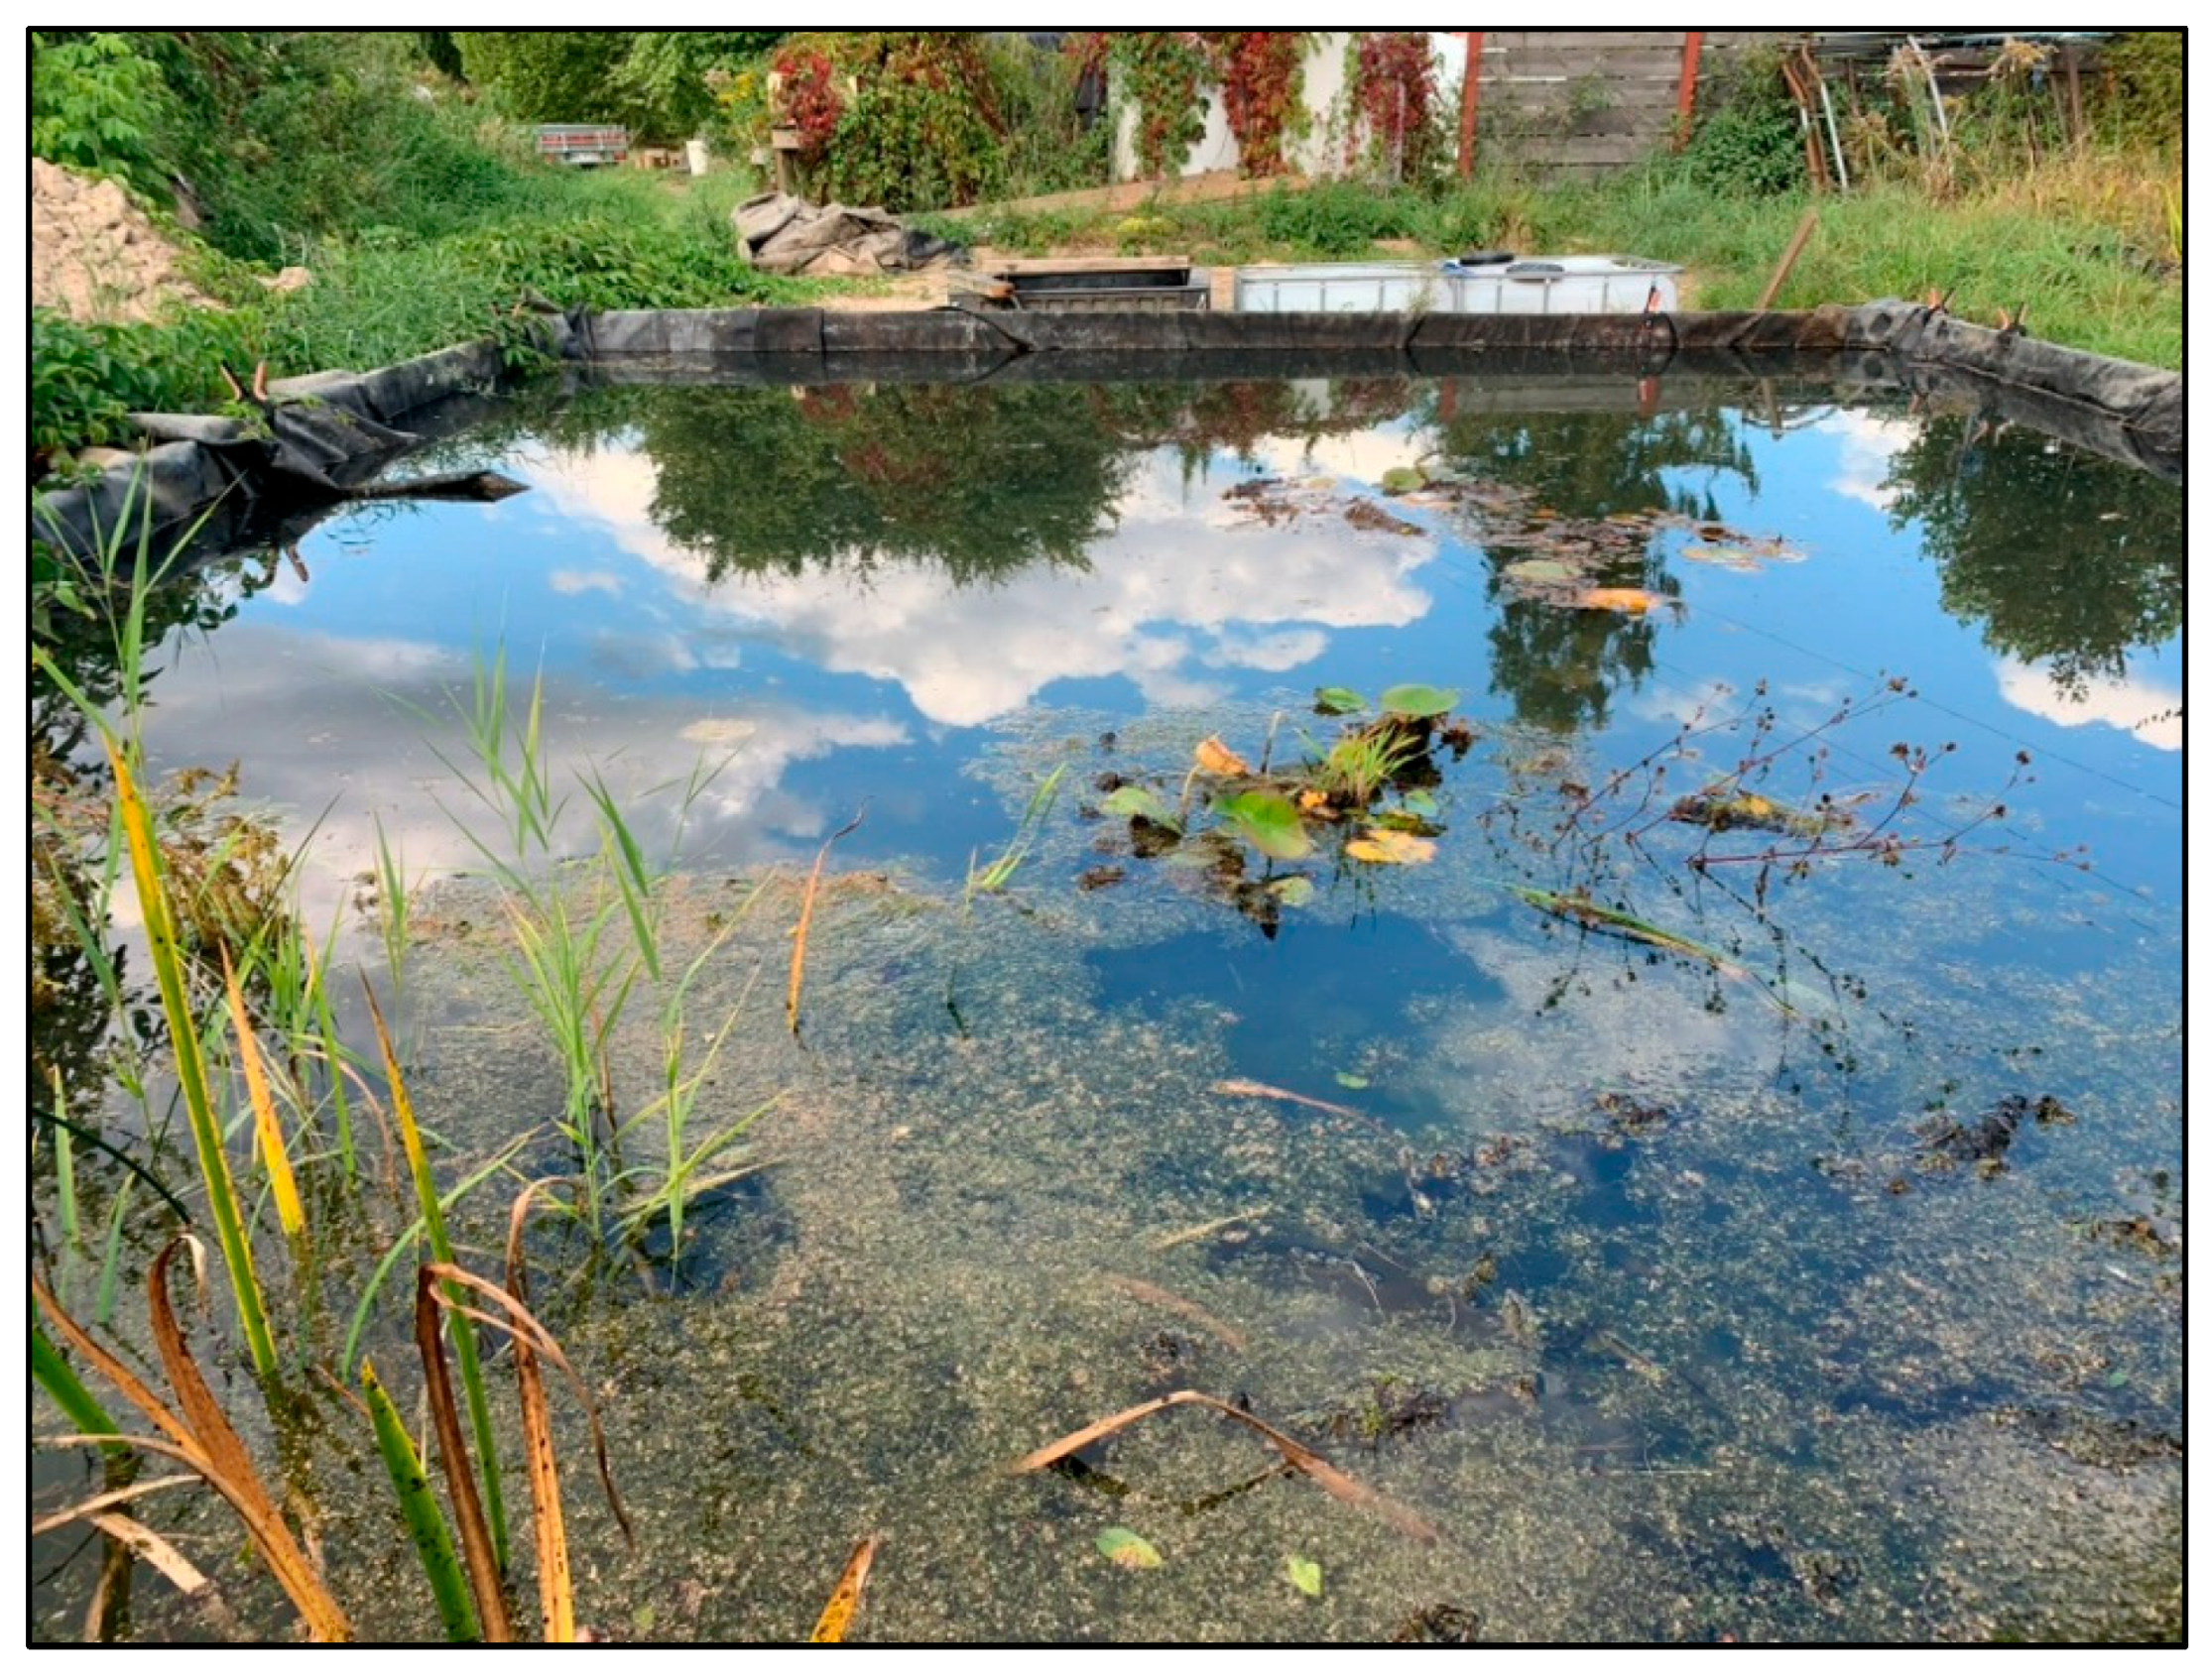
View of the regeneration zone of the full-scale experimental natural swimming pond of type II—FSP (photo: W. Walczak).
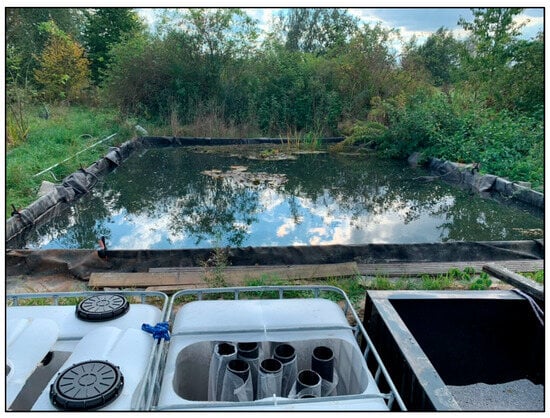
Figure 12.
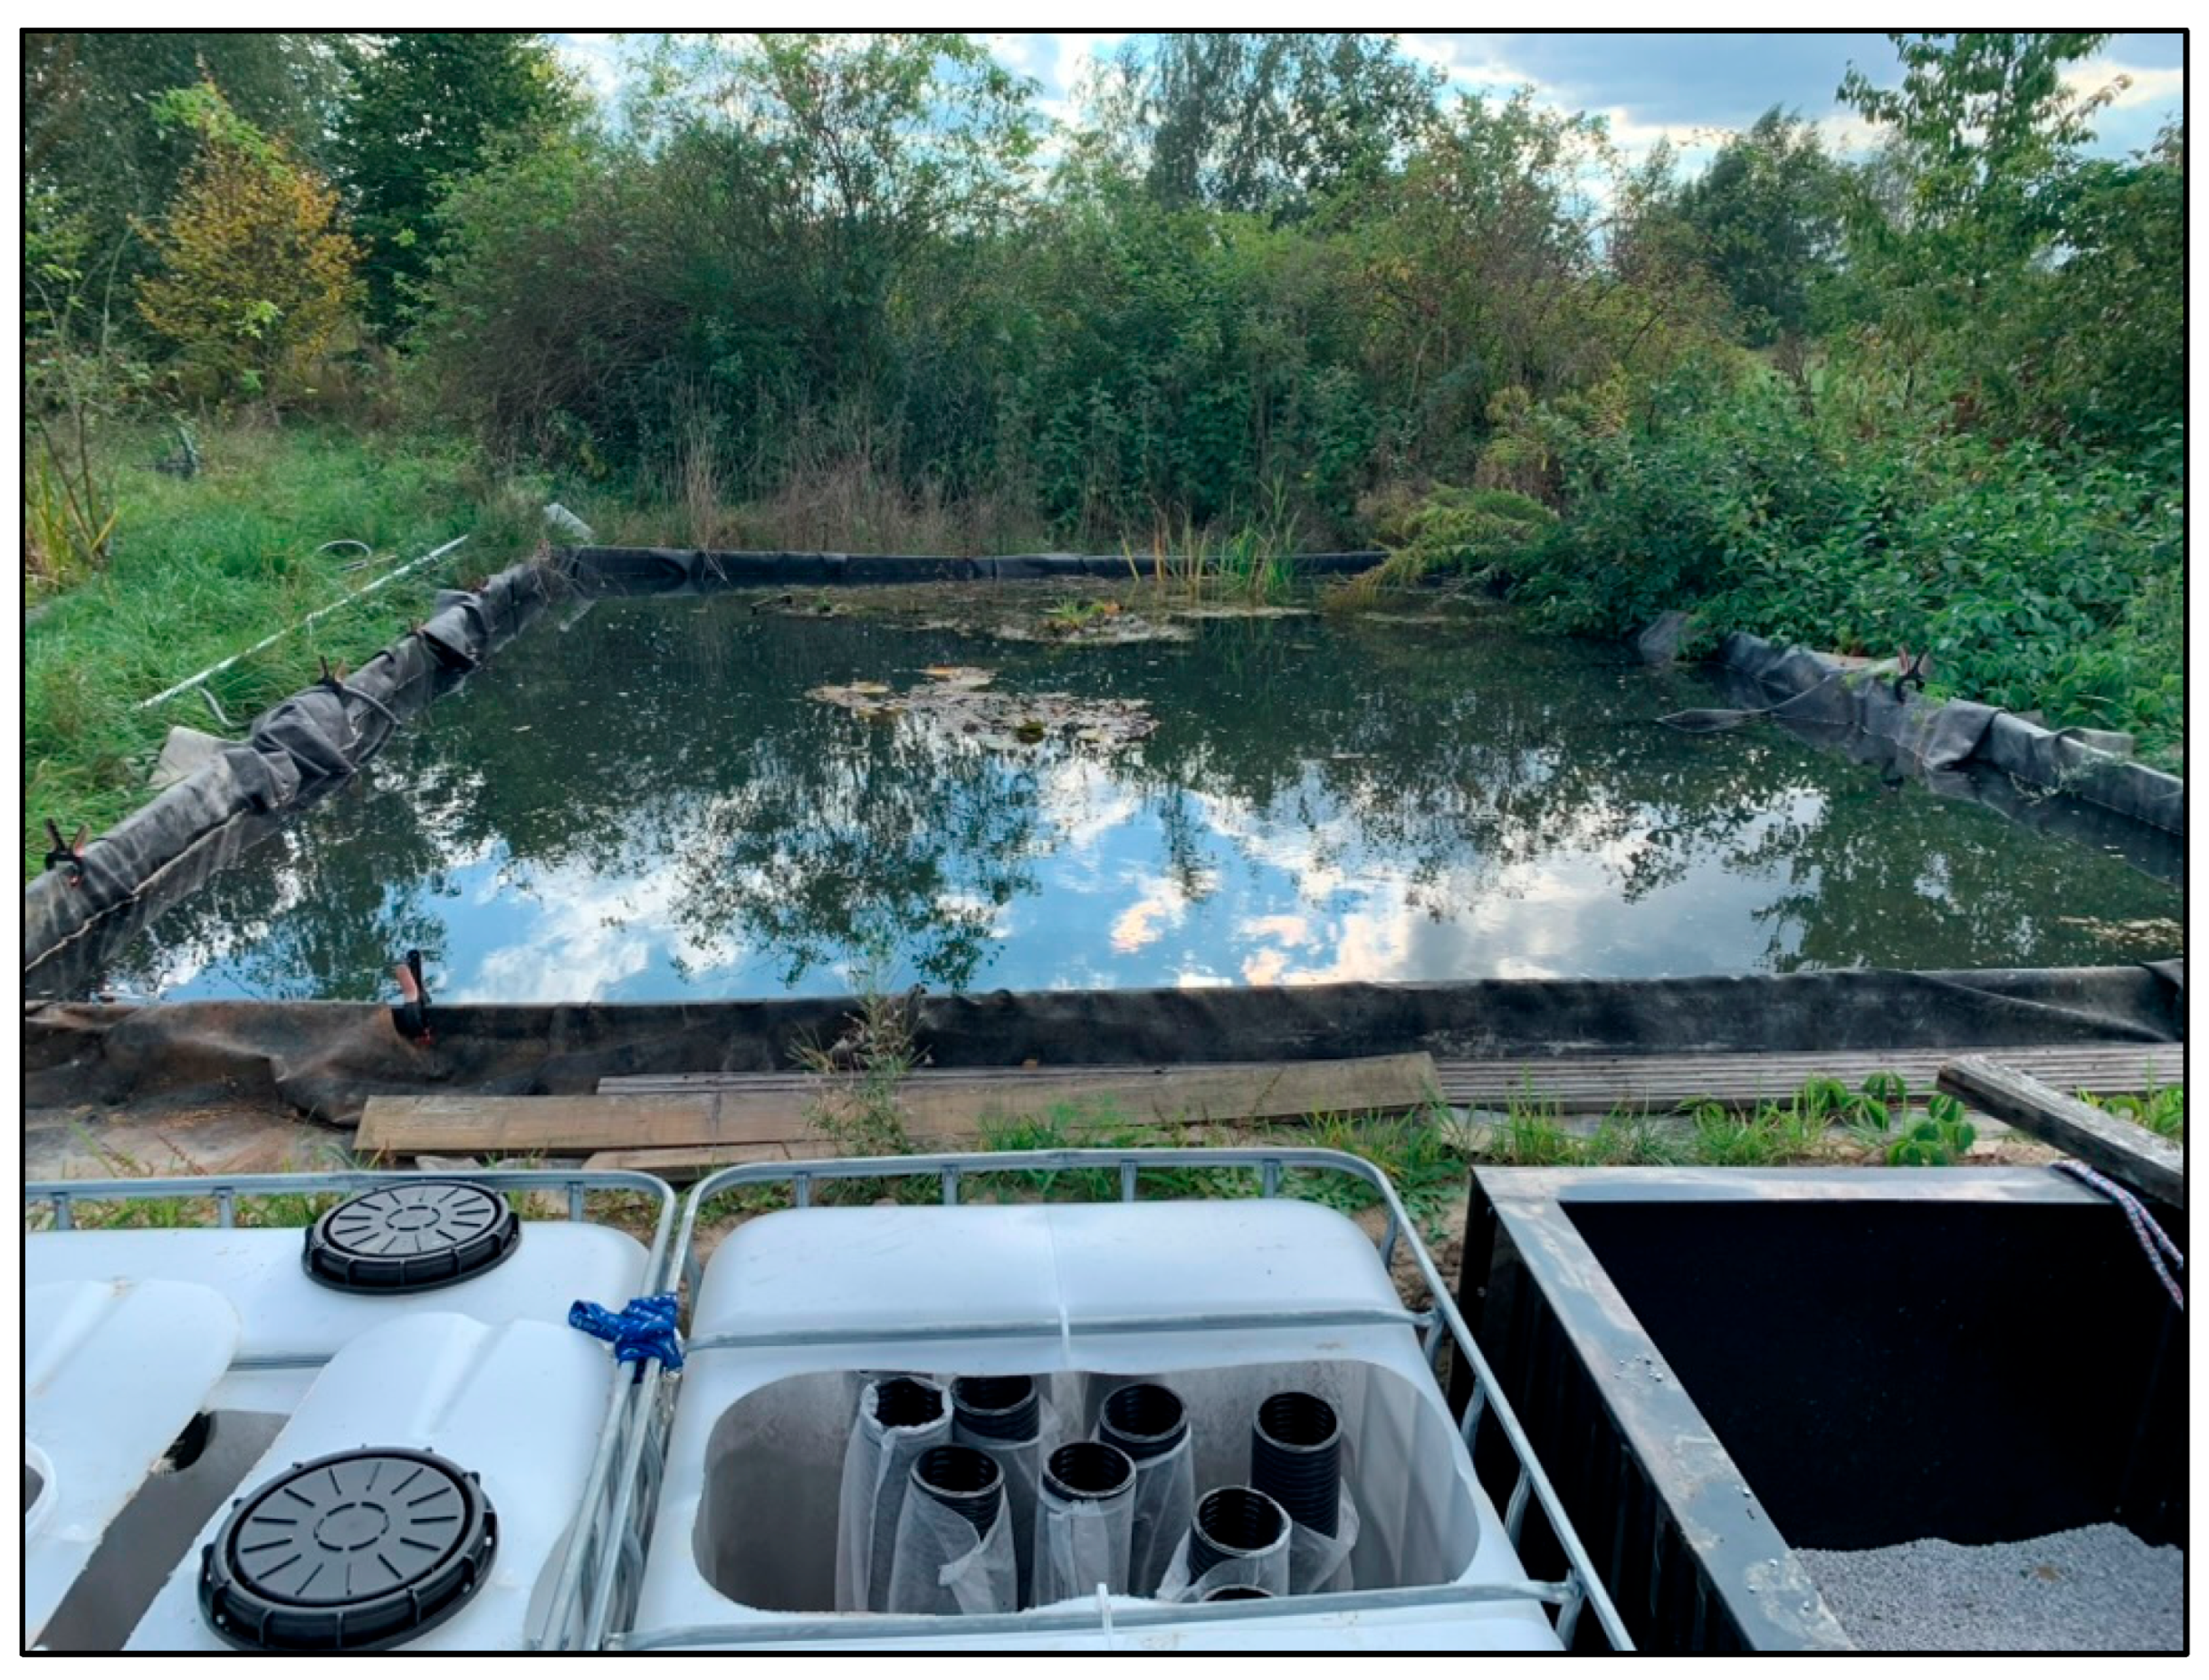
View from the filtration system of the experimental natural swimming pond of type II (FSP) (photo: W. Walczak).
The tank had an area of 50 m2 (minimum recommended natural pool area according to FLL standards [10], dimensions of 5 m × 10 m, a capacity of approx. 33 m3, with a separate reed bed regeneration zone (0–45 cm deep) with an area of 13.5 m2, and a deep-water recreational zone (45–115 cm deep) with an area of approx. 29 m2. The reed bed zone was planted with plants at a density of approx. 5 seedlings/m2. The same species were used as in previous studies: Acorus calamus—21 pcs, Iris pseudoacorus—21 pcs, Mentha aquatica—26 plants. The deep zone, with an average density of 1 seedling/m2, was planted with the following species: Nymphaea alba—10 plants and Myriophyllum spicatum—20 plants. To stabilize the plants, they were planted in the same way as in the previous experiment (Figure 11 and Figure 12).
The newly created research facility (FSP) was equipped with a modular filtration system consisting of three filter chambers and one pump chamber.
The first chamber was a Mauser-type container equipped with a sponge pre-filter consisting of a filter sponge measuring 120 cm × 150 cm × 5 cm (20 PPI) placed vertically on grates and, at a distance of 10 cm from the previous one, a sponge measuring 120 cm × 150 cm × 5 cm (30 PPI). The second element of the system was a chamber where biological processes played the main role in water purification—a Mauser-type container equipped with pipe filters with a diameter of 10 cm and an active height of 125 cm, with 20 pieces of filter geotextile with a weight of 100 g/m2. The third element was a prototype modular filter chamber with a mineral measuring 120 cm × 120 cm × 150 cm filled with thermally modified opoka (Rockfos® material) in filter bags with a total volume of 1008 L (dimensions 120 cm × 120 cm × 70 cm, 1.008 m3). The set was completed by a segment with a circulation pump with a flow rate of 5 m3/(h·m2) of the bed (5 m/h), equipment (skimmer, piping, drainage leading filtered water to the regeneration zone), and a system of pipes and valves in accordance with the patent application (Figure 11 and Figure 12). The functional diagram of the experimental pond with the new dimensions is identical to Figure 8.
During the operation of the system, the possibility of switching off the module with the mineral bed without closing the water circulation circuit was tested several times and proved successful.
The pond was used for swimming (1–4 people) depending on weather conditions and user preferences, in particular, from the end of May to the end of September 2024 and from the end of May to July 2025, meeting the assumption of variable habitat conditions—weather and intensity of use.
2.3. Methods
In the context of two experimental tasks, selected physical, chemical, and microbiological parameters of water were examined, which, after appropriate calculations and statistical analysis, allowed for general conclusions to be drawn.
2.3.1. Analysis of the Filtration Efficiency of the System
The first task involved analyzing the filtration efficiency of Rockfos® (phosphorus removal) at different water circulation speeds in a water treatment system (3 experimental ponds, shallow, designated as P1, P2, and P3). The aim of this experiment was to determine which flow rate would be most suitable for the proper operation of the filter with a mineral bed (phosphorus adsorption efficiency and phosphorus absorption capacity of the bed): 5 m/h, 10 m/h, or 15 m/h. These values were selected based on the typical filtration speed range for rapid filters.
For this purpose, on 21 March 2023, the three experimental tanks were filled with well water, which had been previously tested for selected physical and chemical parameters: temperature (Temp.) [°C], oxygen saturation (OS) [%], electrolytical conductivity (EC) [µS/cm], pH, total hardness (TH) [°dH], calcium (Ca), magnesium (Mg), manganese (Mn), iron (Fe), potassium (K), sulfate (SO4), ammonium nitrogen (N-NH4), nitrate nitrogen (N-NO3), nitrite nitrogen (N-NO2), total nitrogen (Ntotal), total phosphorus (Ptotal), chlorides, silica, and suspended solids [mg/dm3].
The measurements were taken once in three repetitions at the time of filling the ponds, presented as an arithmetic mean and referenced to the standards for bathing ponds FLL [10].
Next, from each of the three experimental ponds with different water flow rate, parameters through the filter (5 m/h bed—P1, 10 m/h—P2, and 15 m/h bed—P3) were taken from the water surface of the tanks at the pump inlet and from the water after filter operation—from the pipeline feeding the treated water into the pond at monthly intervals from April to November 2023 (8 dates, once a month between the 15th and 20th of each month). The following factors were analyzed: temperature (Temp.), oxygen saturation (OS), EC, pH, TH, N-NO3, N-NO2, and Ptotal.
Phosphorus was a key parameter that allowed the selection of filtration rates for field tests under natural conditions; hence, the tests were supplemented with an analysis of the filtration efficiency and P absorption capacity of the bed.
In order to control the biological processes occurring in the newly forming ecosystems of experimental ponds, supplementary studies were carried out on the composition of microorganisms and biocenotic characteristics. In order to analyze the sanitary conditions during the formation of the natural biocenosis of reservoirs P1–P3, in the presence of re-seeding plants with phytosanitary properties (regeneration zone), in the summer–autumn season of 2023, water tests were carried out twice to identify and quantify the number of Escherichia coli (PN-EN ISO 9308-2 214-06 A) 20], coliform bacteria (PN-EN ISO 9308-2 214-06 A) [20], and fecal enterococci (PN-EN ISO 7899-2-2004 A) [20]. These are indicators of potential water contamination, especially fecal contamination.
The most probable number (MPN) method was used, a statistical method that allows the number of bacteria in a test sample to be estimated based on the results of several dilutions. The analyses were performed according to the procedure adopted by the Laboratory Department of the County Sanitary and Epidemiological Station in Lublin.
In order to determine the correctness of the natural ecological succession of the developing biocenosis in the experimental reservoirs, biocenotic analyses of phytoplankton and zooplankton were carried out. In the first stage, these included microscopic analysis of the qualitative and quantitative structure of pro- and eukaryotic phytoplankton algae, and in the second stage, qualitative analyses of zooplankton. Samples for qualitative analysis were collected in accordance with the relevant procedure using a plankton net with a mesh size of 10 µm.
Water samples were taken from each tank for in vivo taxonomic analysis. Some of the qualitative samples were preserved in Lugol’s solution (aqueous solution of iodine and potassium iodide) for further analysis. For quantitative phytoplankton studies, water samples of a specified volume were collected. Phytoplankton abundance analyses were performed under an inverted microscope, according to [21], and taxonomic determinations were made under a light microscope at the Department of Botany and Plant Physiology, University of Life Sciences in Lublin, Poland.
Taxonomic classification was based on the system provided by van den Hoek et al. [22]. Samples were collected twice in the summer and autumn of 2023 in each of the three experimental ponds (P1–P3), and the results were averaged for the entire study period and presented in the form of summary graphs.
The taxonomic composition of the developing phytoplankton structure was compared in each of the experimental ponds using the Jaccard coefficient [23]:
where a is the number of species common (shared) to both compared sites, b is the number of species occurring only in the first site, and c is the number of species occurring only in the second site.
S = a/(a + b + c),
The biocenotic studies were supplemented by analyses of chlorophyll a concentration as the most important pigment responsible for photosynthesis in autotrophic algae, indirectly indicating the primary productivity of phytoplankton communities [24], which was determined using the Nusch spectrophotometric method [25].
During microscopic qualitative analyses of phytoplankton, a preliminary analysis of the presence of zooplankton was attempted. A key for the identification of freshwater planktonic crustaceans [26] was used, and the taxonomic nomenclature was adopted from Martin and Davis [27].
2.3.2. Analysis of the Efficiency of the Prototype Filtration System
After selecting the appropriate filtration speed, the second experimental task was undertaken. This involved verifying the effective performance of the prototype water treatment system in a swimming pond (on a full scale—FSP) using the designed modular filter chamber and a control valve system for shutting down a selected chamber without having to shut down the entire water circulation (patent application).
The adsorption efficiency with respect to phosphorus, the absorption capacity of the bed, and the basic physical and chemical parameters of the water were analyzed.
The newly built type II swimming pond was filled with well water from the same source as in the first task (27 February 2024) and analyzed in the same way.
For the analysis of the treatment efficiency of the system, samples were taken at two-week intervals from March to July 2024 (17 dates) and weekly from March to July 2025 (13 dates—until the end of the research project). As before, samples were taken at the pump inlet and filter outlet. During the winter of 2024/2025, the circulation was switched off (11 October 2024–17 March 2025).
The mineral filter was emptied of water, and its filter material was dried out during the winter. In the spring of 2025, one day before the filtration was started, the mineral bed was rinsed, the water losses in the pool were replenished with water from the well, and the circulation was resumed. The following parameters were tested: water temperature, OS, EC, pH, TH, N-NO2, N-NO3, and Ptotal. For all laboratory analyses, measurements were taken in triplicate, and the results for each date are presented as their arithmetic mean.
2.3.3. Laboratory Measurements, Conversion, and Statistical Methods
Water samples for both experimental tasks were collected in accordance with PN-EN ISO 5667-6:2016-12 [20] on sampling from rivers and streams and PN-EN ISO 19458:2007 [20] on water quality.
Laboratory tests of water samples were carried out in the laboratory of the Department of Environmental Engineering at the University of Life Sciences in Lublin using certified methods, in accordance with standard procedures. Depending on the experimental task, 19 physical and chemical factors relevant to the use of natural pools (according to FLL standards) were examined in the samples: temperature—direct measurement with a multi-parameter meter ORION Star A329 Set by Thermo Scientific (PN-77/C-04584) [20], pH—potentiometric method (PN-EN ISO 10523) [20]; EC—conductometric method (PN-EN ISO 27888) [20]; water hardness—EDTA titration method (PN-ISO 6059:1999) [20]; N-NH4 (PN-ISO 7150-1:2002) [20], N-NO3 (PN-82/C-04576/08) [20], N-NO2 (PN-EN 26777:1999) [20] and Ntotal (PN-73/C-04576/14) [20] by spectrophotometric method; Ptotal (PN-EN ISO 6878:2006) [20]; and Fe by spectrophotometric method with 1,10-phenanthroline (PN-ISO 6332:2001) [20] and Mn—by permanganate method (PN-C-04590/02:1992) [20], K (PN-EN ISO 8467-2001) [20] —by spectrophotometry, chlorides (PN-ISO 9297:1994) [20] —by titration, SO4 (PB/DL-16) [20]—spectrophotometric method, suspension (PB/DL-08) [20]—gravimetric method, Ca (PN-81/C-04551-01) [20]—versine method, Mg (PN-C-04554-4:1999) [20]—by calculation, oxygen saturation—by the membrane method—direct measurement with the CO411 device by ELMETRON (reading verified as a function of temperature), silica (PN-EN ISO 3696:1999) [20]—by spectrophotometry. A NANOCOLOR UV/VIS spectrophotometer from Macherey-Nagel was used for spectrophotometric analyses.
The formula, according to [28] was used to analyze the efficiency of phosphorus removal by the filtration system:
where Co is the concentration of the pollutant in the effluent and Cd is the concentration of the pollutant in the influent.
η = 100 ∙ (1 − Co/Cd),
The adsorption capacity of the bed, understood as the phosphorus load retained by a given filter material, was also calculated using the formula [13]:
where Cd is the concentration of the pollutant in the influent water, Ct is the concentration of the pollutant in the effluent, and Vt is the volume of filtered water in a given time, calculated as the product of the flow rate and the measurement time.
L = (Cd − Ct) ∙ Vt,
The results of the physical and chemical analysis of the water were subjected to basic statistical analysis (mean, median, standard deviation) and correlation analysis of technologically relevant parameters: the effect of temperature on OS, pH, EC, N-NO3, and Ptotal, the effect of OS on N-NO3 and Ptotal, and the effect of pH on Ptotal. In order to assess the impact of filtration on water quality in ponds, a statistical comparative analysis of selected physical and chemical parameters was carried out.
The data included measurements taken before and after filtration for the same water bodies, which justified the use of tests for dependent samples. Before the actual comparative analysis, the distribution of variables was checked using the Shapiro–Wilk test.
Based on the test results, the parameters that meet the assumption of normal distribution were determined. For normally distributed variables, the t-test for dependent samples was used, while for parameters that did not meet this assumption, the non-parametric Wilcoxon rank test was used. The analyses were performed separately for data from three experimental ponds with different filtration flow rates and for data from one experimental pond (testing the efficiency of the prototype system).
Differences were considered statistically significant at a significance level of 0.05.
As part of a more complete statistical analysis of the values of the studied water quality factors for the three experimental ponds, a principal component analysis (PCA) model was used, for which the initial assumptions were checked (Bartlett’s test and the Kaiser–Meyer–Olkin criterion—KMO).
The calculations were performed using Statistica ver. 13.3, while data visualizations, including box plots and correlation plots, were performed in the R environment.
3. Results
3.1. Analysis of the Filtration Rate Efficiency of the System
With regard to the experimental studies on the filtration efficiency of Rockfos® material at different water circulation speeds in the treatment system, three experimental ponds were filled with water with the physical and chemical specifications presented in Table 1.

Table 1.
Physical and chemical parameters of the well water used to fill P1–P3. Red color—data above FLL norm.
The values of the physical and chemical parameters of well water tested for most parameters did not exceed the FLL standards [10] for natural bathing ponds (see Table 1), so it could be used to replenish ponds due to evaporation and for further stages of the experiment.
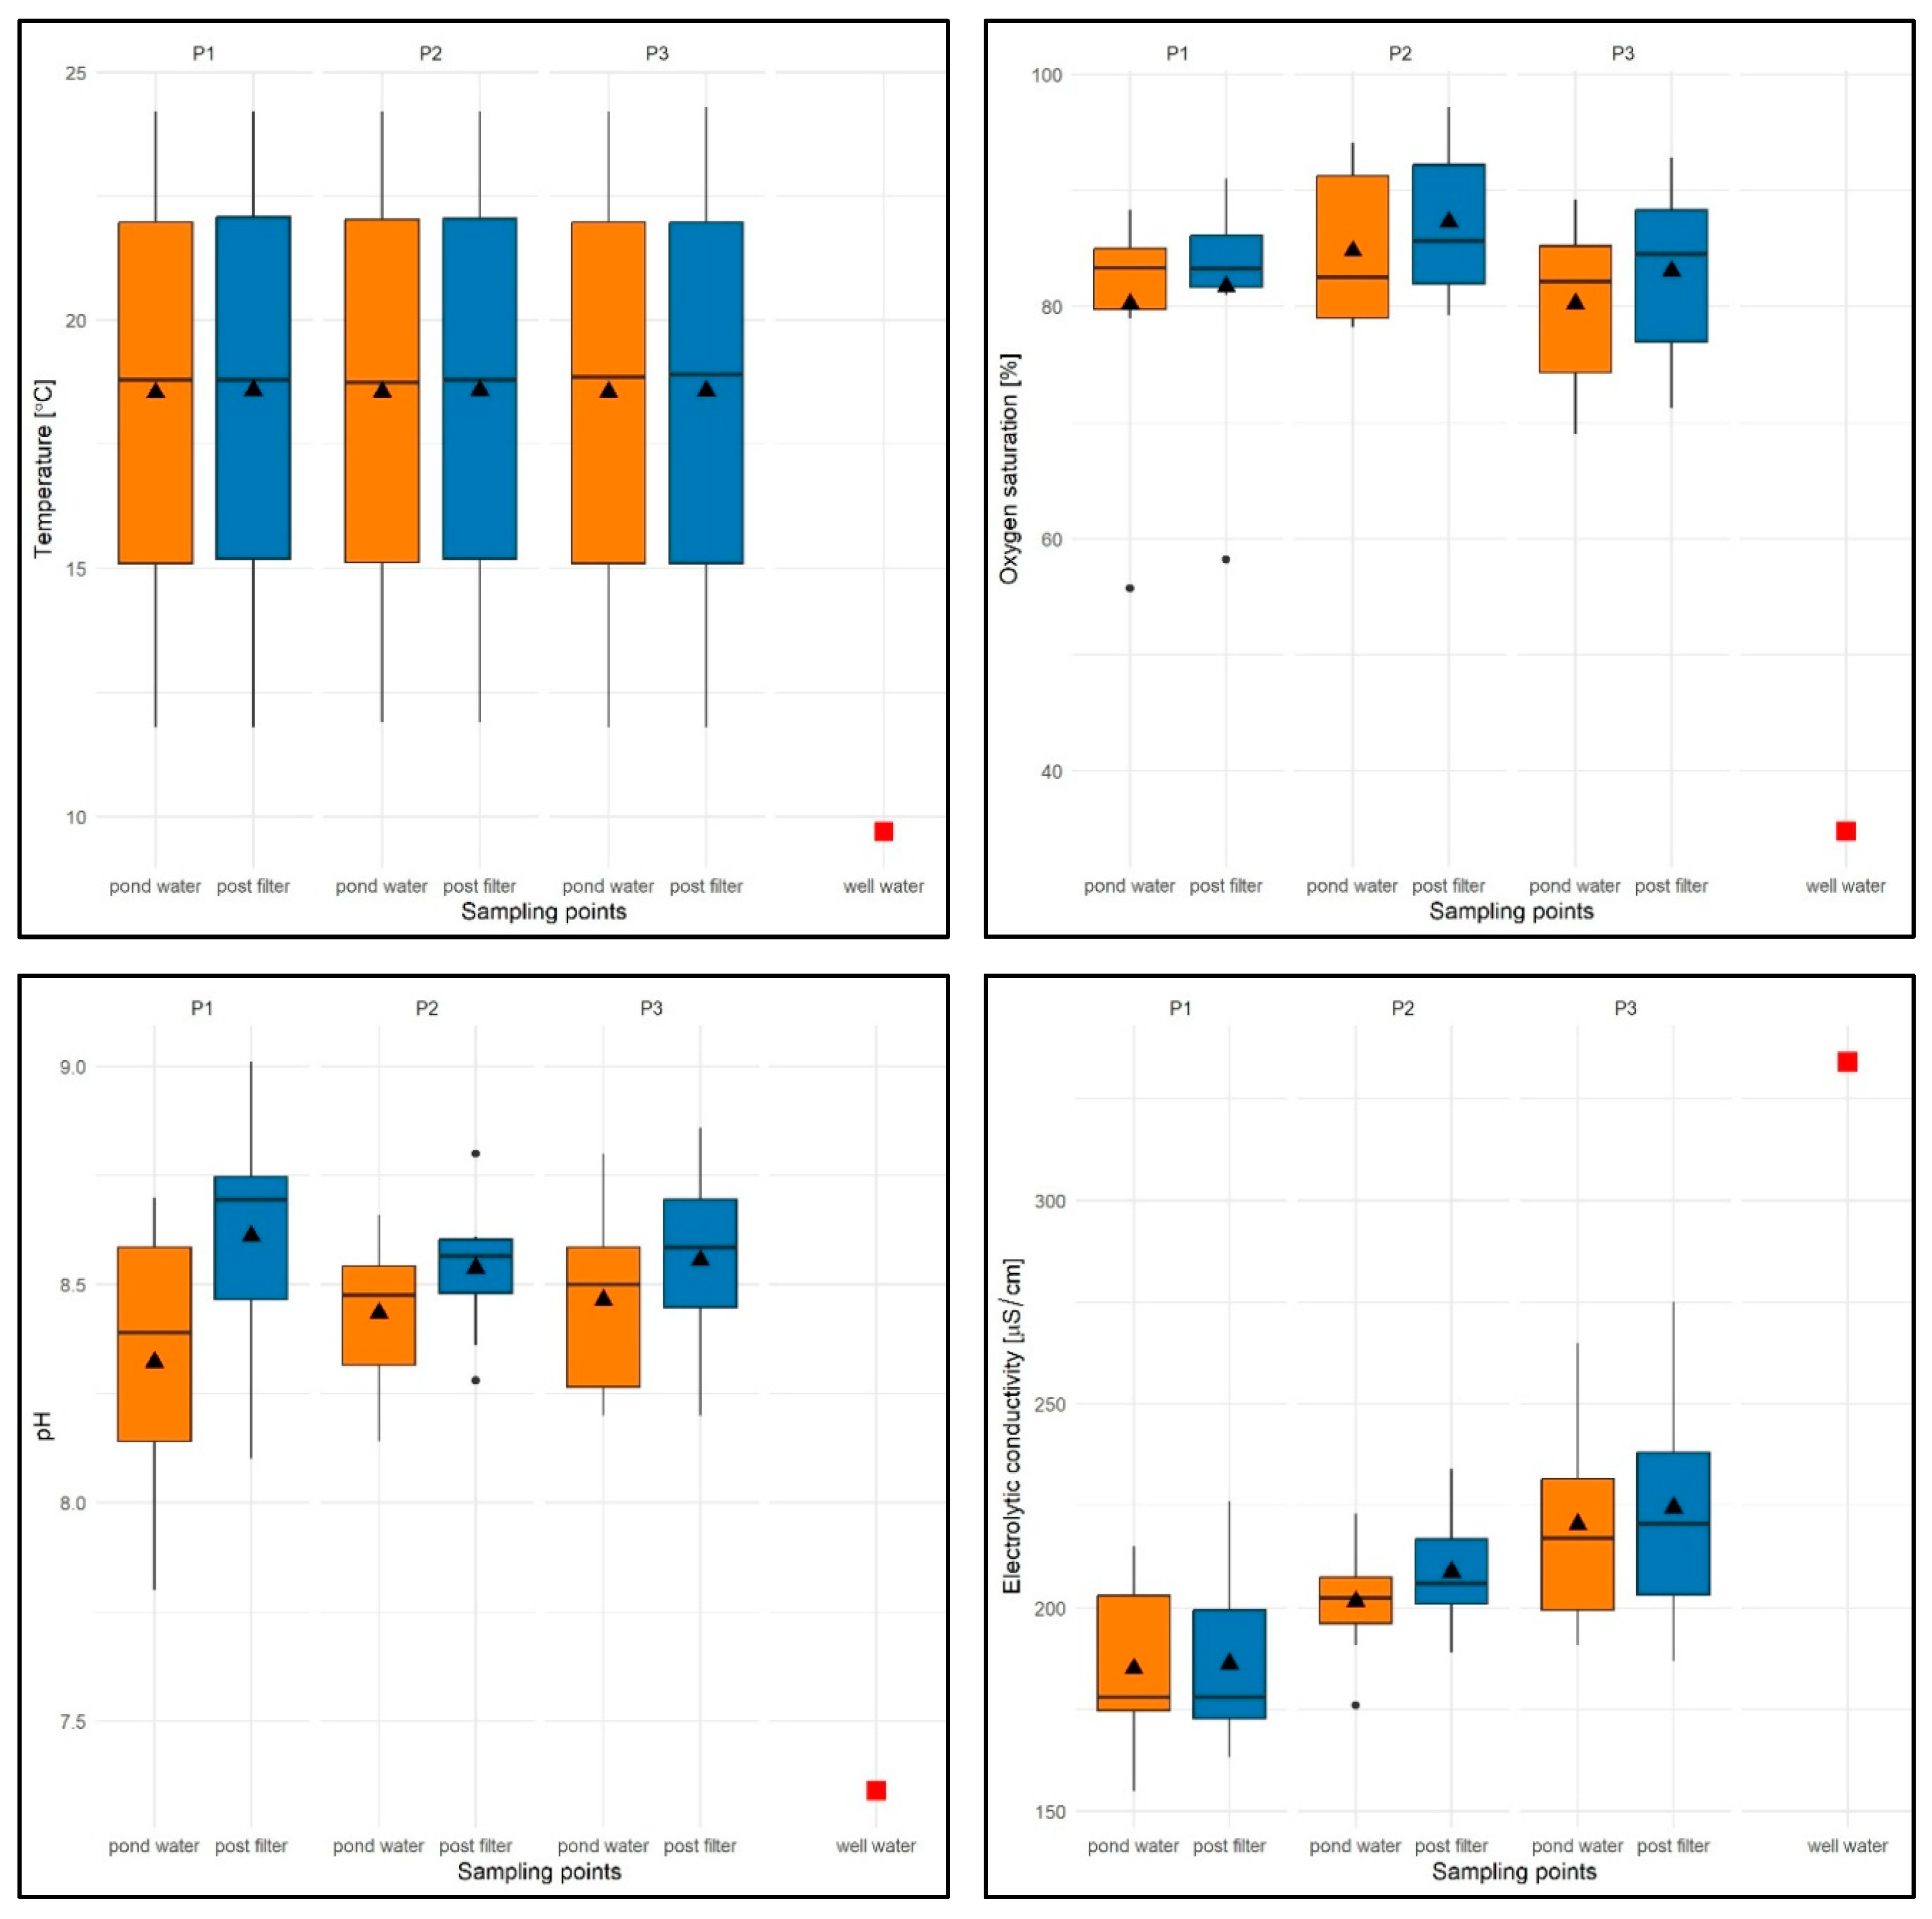
With regard to the physical and chemical factors of water in the test tanks (P1–P3), it was found that the water temperature varied between 14.2 and 24.3 °C, with an average of 18.56 °C for the test period (average from the water column is 18.04 °C, average from filtered water is 18.58 °C) and was expectedly higher than that in well water (9.8 °C). The minimum value was found in P1 and P3, while the maximum (24.3 °C) was recorded only in P3.
It should be added that the values of this parameter were similar regardless of the water flow rate through the filter. It was found that when measuring the temperature of the water after filtration, the values of this parameter were equal to or sometimes 0.1 °C higher than the temperature of the water taken directly from the pond (Figure 13).
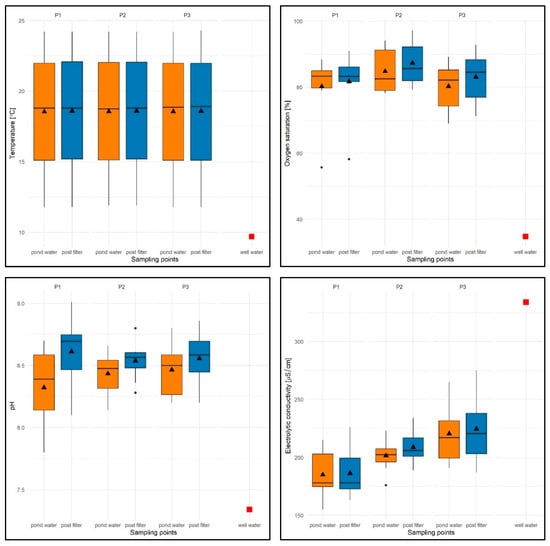
Figure 13.
Values of selected physical and chemical parameters of water: temperature [°C], OS [%], pH, and EC [µS/cm] for reservoirs P1–P3 and two sampling sites against the chemical specification of well water used to replenish them. The box-and-whisker plots show the distribution of the observations. In particular, the box represents the first and third quartiles. The horizontal line across the central region of the box represents the median. The mean value of the data is marked by a filled triangle. The whiskers are drawn to the most extreme observations located no more than 1.5 times the inter-quartile range away from the box. Any observation not included between the whiskers is considered an outlier and is plotted with a filled circle. When there are no outliers, the whiskers indicate the minimum and maximum values. The value of well water is marked by a red-filled square.
Oxygen saturation (OS%) ranged from 55.7% (P1) to 97.2% (P2), with an average of 82.89% for the study period (average from water column is 79.16%, average from filtered water is 84.01%) and was higher than in well water (OS = 34.8%)—Figure 13. Slightly higher values of approx. 4–5% were recorded for P2 with a filtration flow rate of 10 m/h, which was associated with an even distribution of higher values for subsequent test dates and both sampling sites (see Figure 13).
Lower oxygen saturation values were found either in early spring (P1, range: OS = 55.7–81%) or in late autumn (P3, range: OS = 66–76%), while higher values, regardless of the flow rate through the filter and the sampling site, were found in the summer months (June–September) within the range of 82.2–97.2%. For most of the test dates in the three reservoirs with different filtration flow rates, higher values of this parameter were observed in the filtered water (see Figure 13).
The pH values were found to be within the following ranges: 7.8 (P1, filtration speed 5 m/h)—9.01 (P1), with an average pH of 8.48 for the entire test period (average pH of the water column = 8.34, average pH of the filtered water = 8.56), which were significantly higher than in well water (pH = 7.34).
The values of this parameter were similar and not very different regardless of the filtration speed and the date of the study. However, higher values were recorded for the filtrate. For both sampling sites, a slightly lower average pH value was recorded for P1 (pH = 8.46) and a slightly higher value for P3, at a filtration rate of 15 m/h (pH = 8.51)—Figure 13.
With regard to electrolytic conductivity (EC), the values ranged from 155 (P1) to 275 µS/cm (P3), with an average of 204.46 µS/cm for the entire study period (average from water EC = 209.72 µS/cm, average from filtered water EC = 206.51 µS/cm) and were significantly lower than in well water (EC = 334 µS/cm)—see Figure 13.
The lowest average value of this parameter was recorded for P1 (EC = 185.7 µS/cm), and the highest for P3 (EC = 222.5 µS/cm). Despite the differences between the average values, no regularities in the distribution of EC values were observed in relation to the sampling locations of all reservoirs. Different EC values were recorded both in the water column and in the filter—see Figure 13.
With regard to seasonal variations, the lowest EC values, regardless of the filtration flow rate and sampling location, were recorded in the spring months (April and May), while the highest values were recorded in the autumn season (September–November).
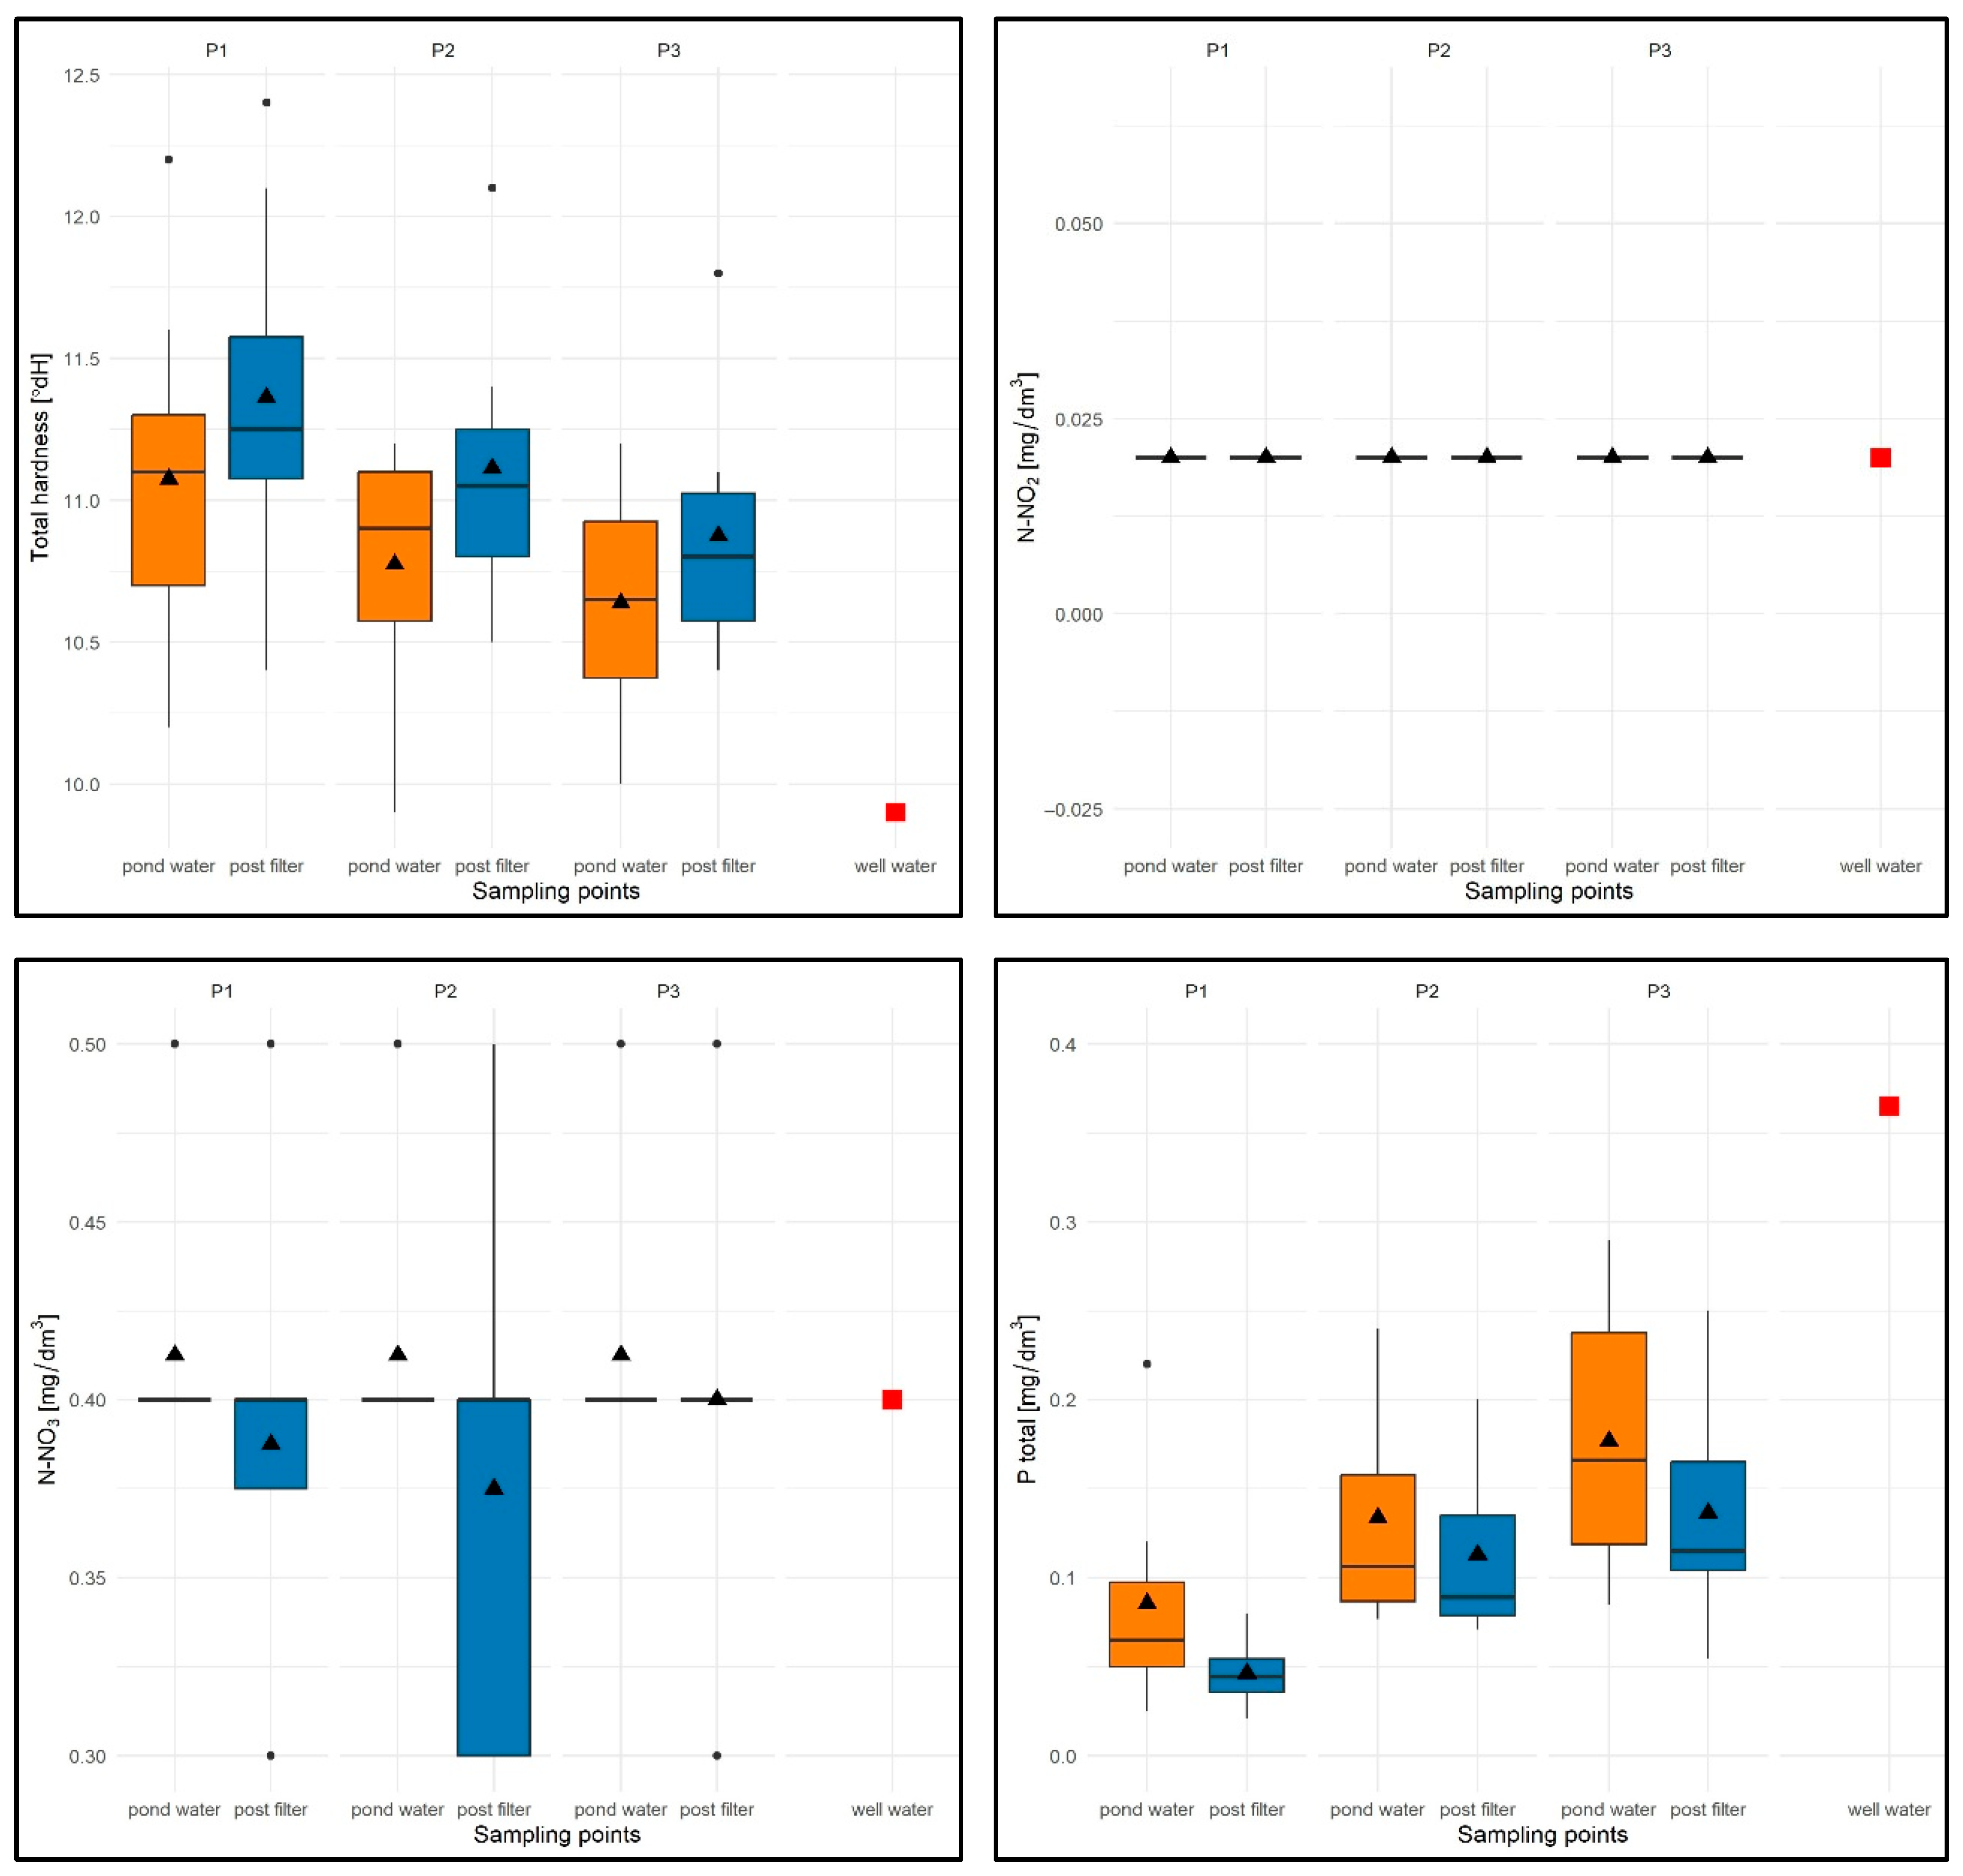
In the case of total water hardness (TH), the values ranged from 9.9 °dH (P1) to 12.4 °dH (P1), with an average of 10.97 °dH for the entire study period (average from pond water TH = 10.77 °dH, average from filtered water TH = 11.11 °dH) and were higher than for well water (9.9 °dH). The lowest average TH values were found for P3 (10.7 °dH) and the highest for P1 (11.14 °dH)—Figure 14.
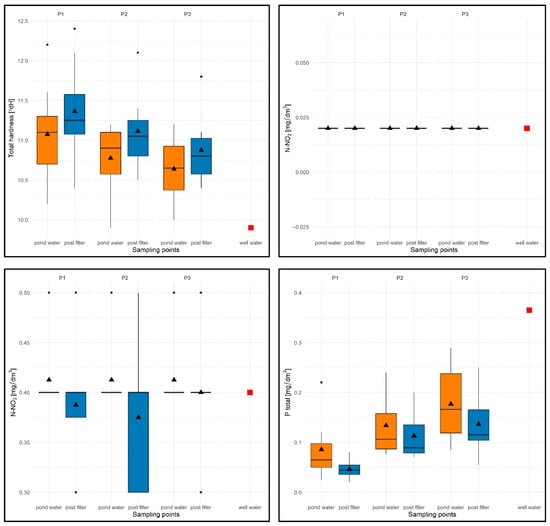
Figure 14.
Values of selected physical and chemical parameters of water: TH [°dH], N-NO2 [mg/dm3], N-NO3 [mg/dm3], Ptotal [mg/dm3] for P1–P3 and two sampling points against the chemical specifications of the well water used to replenish them. Description as in Figure 12.
For all test sites, slightly higher values of the tested parameter were observed in filtered water (Figure 14). In terms of seasonality, elevated values of this parameter were recorded for the summer months (range: 10.8–12.4 °dH), while in spring and autumn, TH values for all sites varied, both for the sites themselves and for the sampling locations.
The N-NO2 parameter was constant and took identical values for well water, water from the pond, and in the filtrate: 0.02 mg/dm3—Figure 14.
For the N-NO3 parameter, the values ranged from 0.3 to 0.5 mg/dm3 for all experimental tanks and sampling stations, with an average of 0.38 mg/dm3 for the entire study period (average from water column N-NO3 = 0.4 mg/dm3 and average from filtrate N-NO3 = 0.37 mg/dm3) and comparable to the value in well water (N-NO3 = 0.4 mg/dm3)—see Figure 14.
Despite differences in the average values for the sampling sites, no consistent patterns were found in the distribution of this parameter in subsequent tests. In the seasonal distribution, lower N-NO3 values were recorded in summer for P1 and in spring for P2 and P3, while higher values were recorded for P1 in the summer months and for P2 and P3 in the autumn months.
With regard to the Ptotal parameter, the values were limited to 0.021 (P1)—0.260 mg/dm3 (P3), with an average of 0.118 mg/dm3 for the entire test period (average from pond water Ptotal = 0.14 mg/dm3 and average from filtrate Ptotal = 0.098 mg/dm3) and were lower than in well water (0.365 mg/dm3).
The lowest values were recorded for P1 with a flow rate of 5 m/h (average 0.08 mg/dm3), and the highest for P3 (flow rate 15 m/h, average 0.17 mg/dm3)—Figure 14.
For all experimental ponds, lower Ptotal values were found in the filtrate (Figure 14). In terms of seasonal variation, higher values of this parameter for P1–P3 were expectedly noted in the spring months (higher Ptotal value of the water used to fill the wells) and lower values in the summer months. In the autumn season, lower values were recorded only for P1.
In order to carry out extended tests over a longer period of time covering a full-size natural bathing water body of type II (FSP), it was necessary to determine the appropriate filtration rate. The choice of the rate was based on phosphorus removal efficiency.
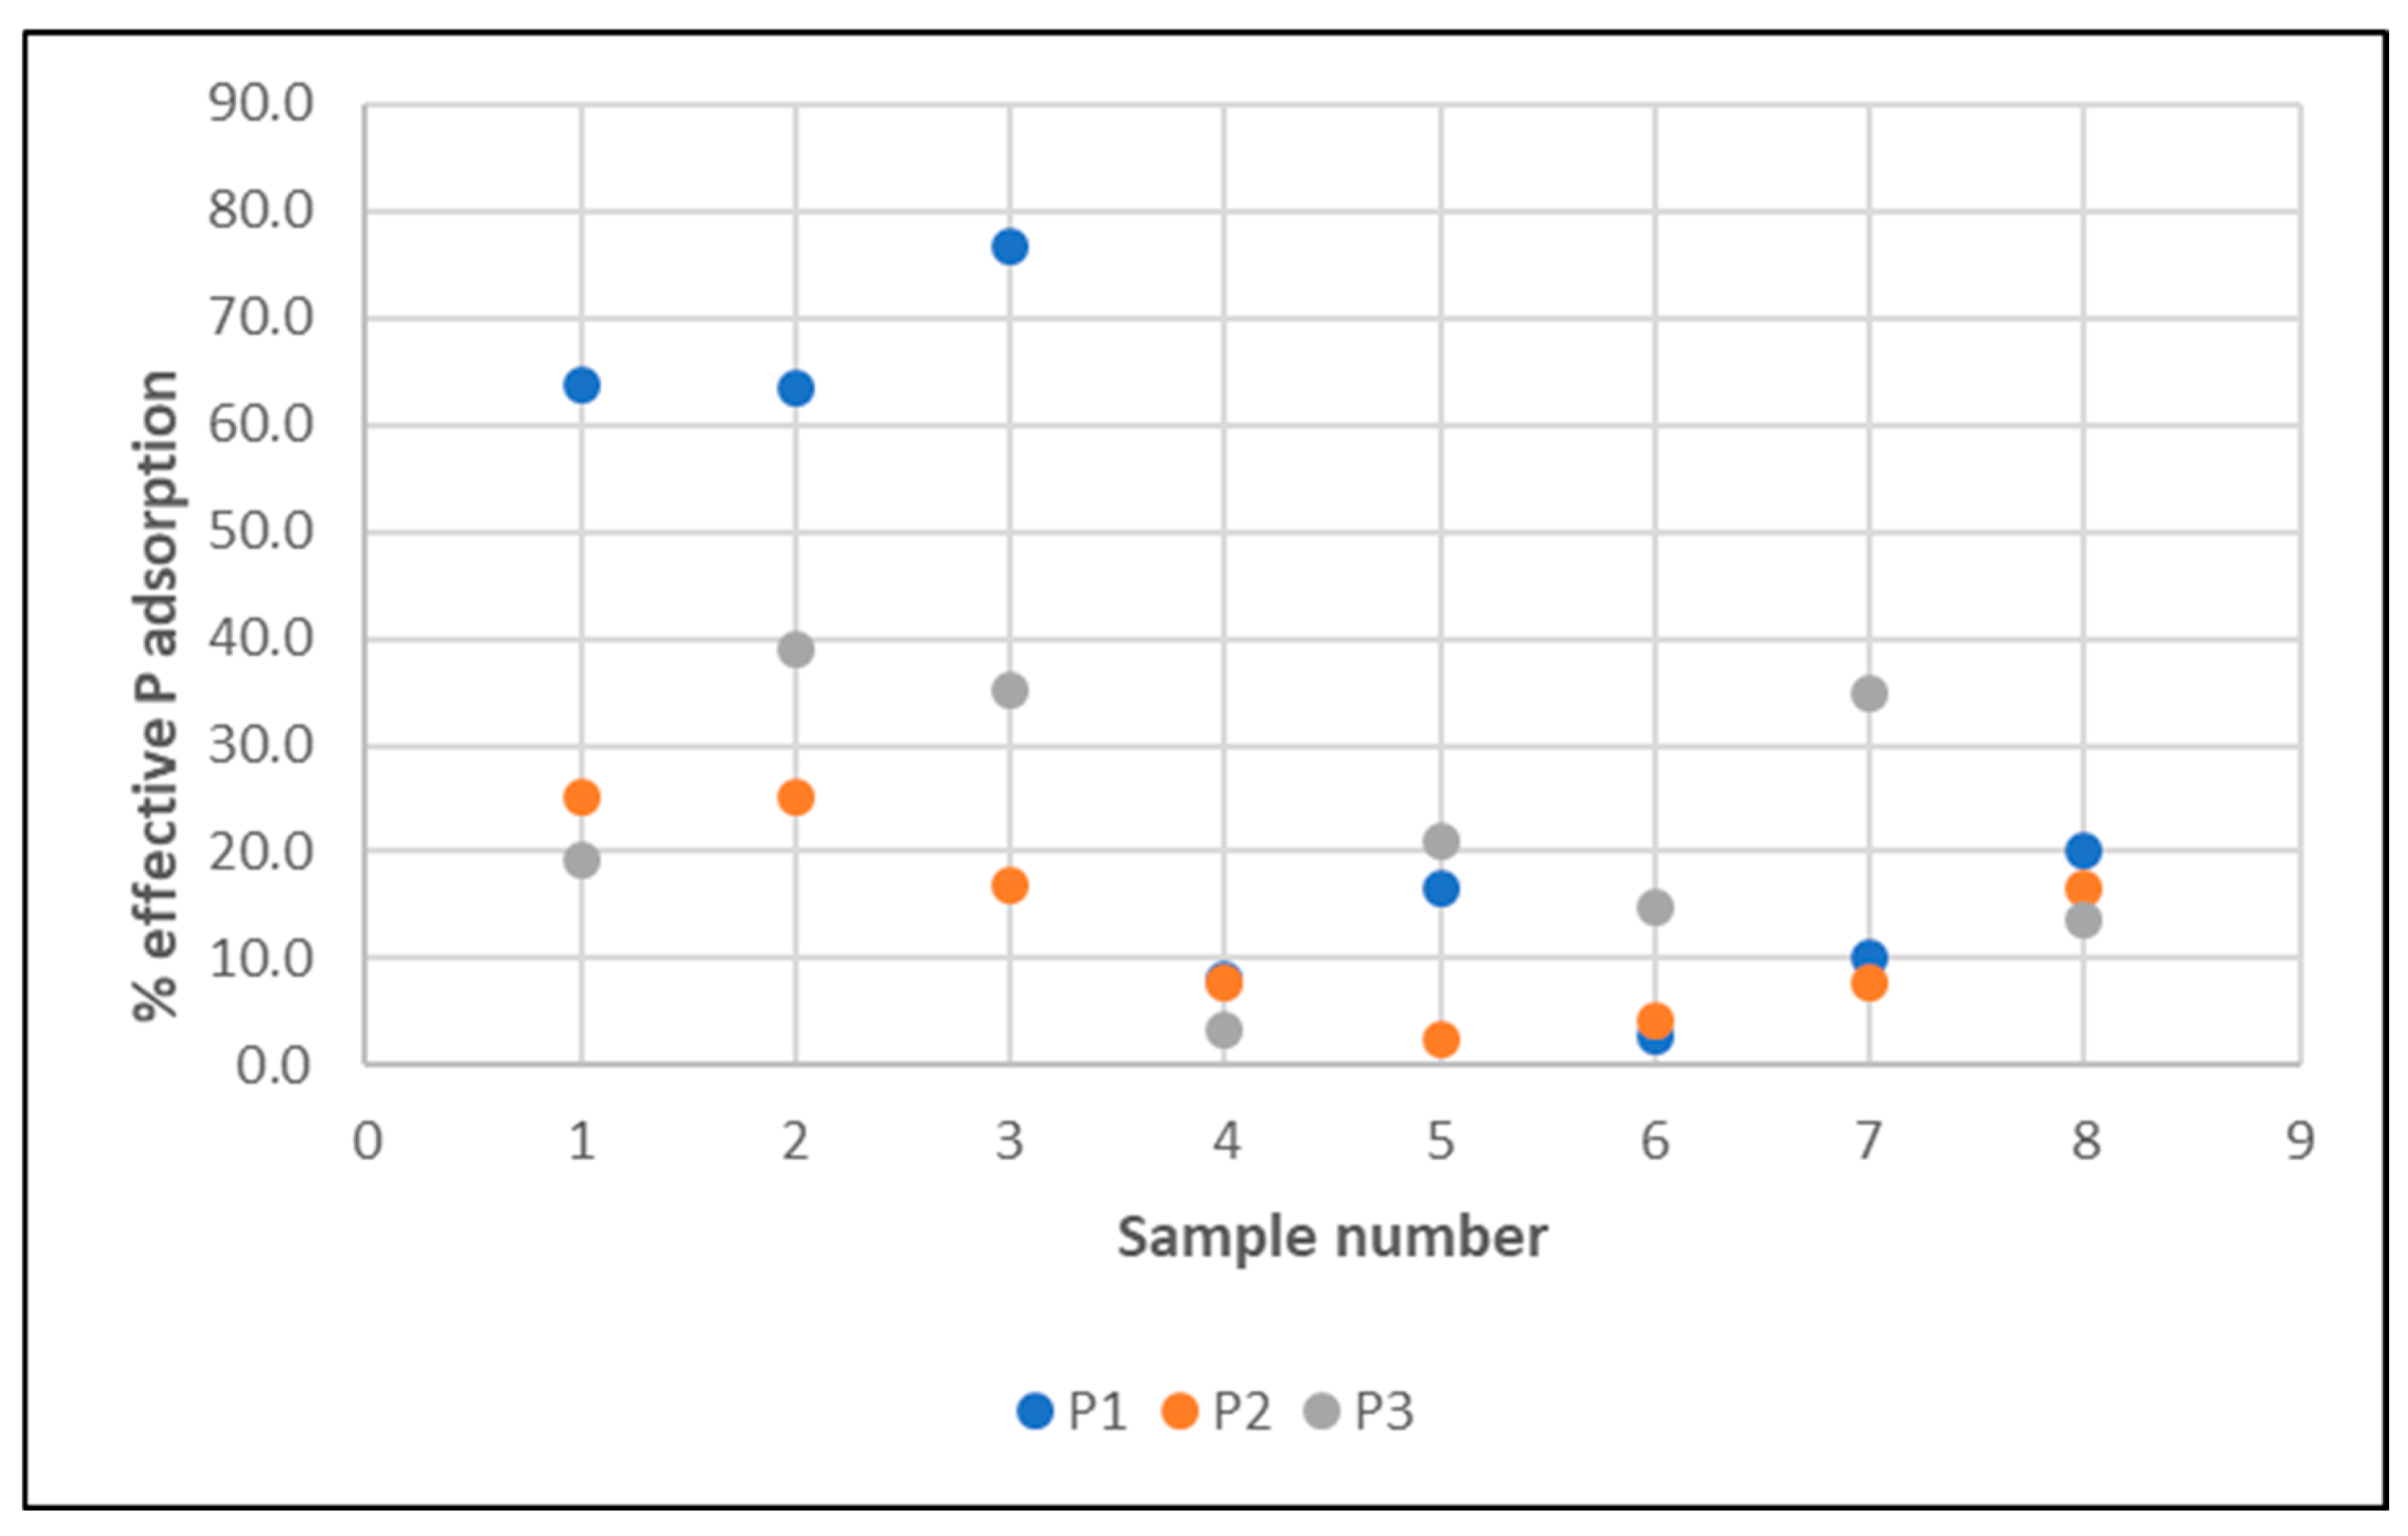
The calculations of the relevant statistical measures of phosphorus removal efficiency are shown in Table 2 and time intervals of phosphorus filtration at the tested velocities in Figure 15.

Table 2.
Phosphorus removal efficiency values [%] with statistical measures for three filtration velocities in experimental ponds (P1–P3).
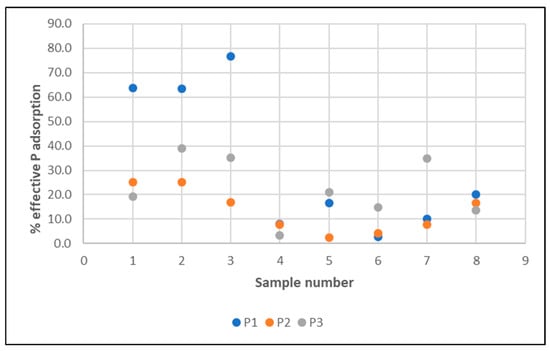
Figure 15.
Time intervals of effective phosphorus filtration at the tested water flow rates through the filter (P1–P3).
The highest average phosphorus retention efficiency was recorded during filtration at a speed of 5 m/h (P1), which was the reason for choosing this speed for extended testing (see Table 2).
Low phosphorus concentrations in both pond water and filtered water, as well as natural inaccuracies in analytical tests, contributed to high standard deviations, while higher values of the mean compared to the median suggest a right-skewed distribution, i.e., a dominance of high values, which is also confirmed by further analyses of the bed’s adsorption capacity (below).
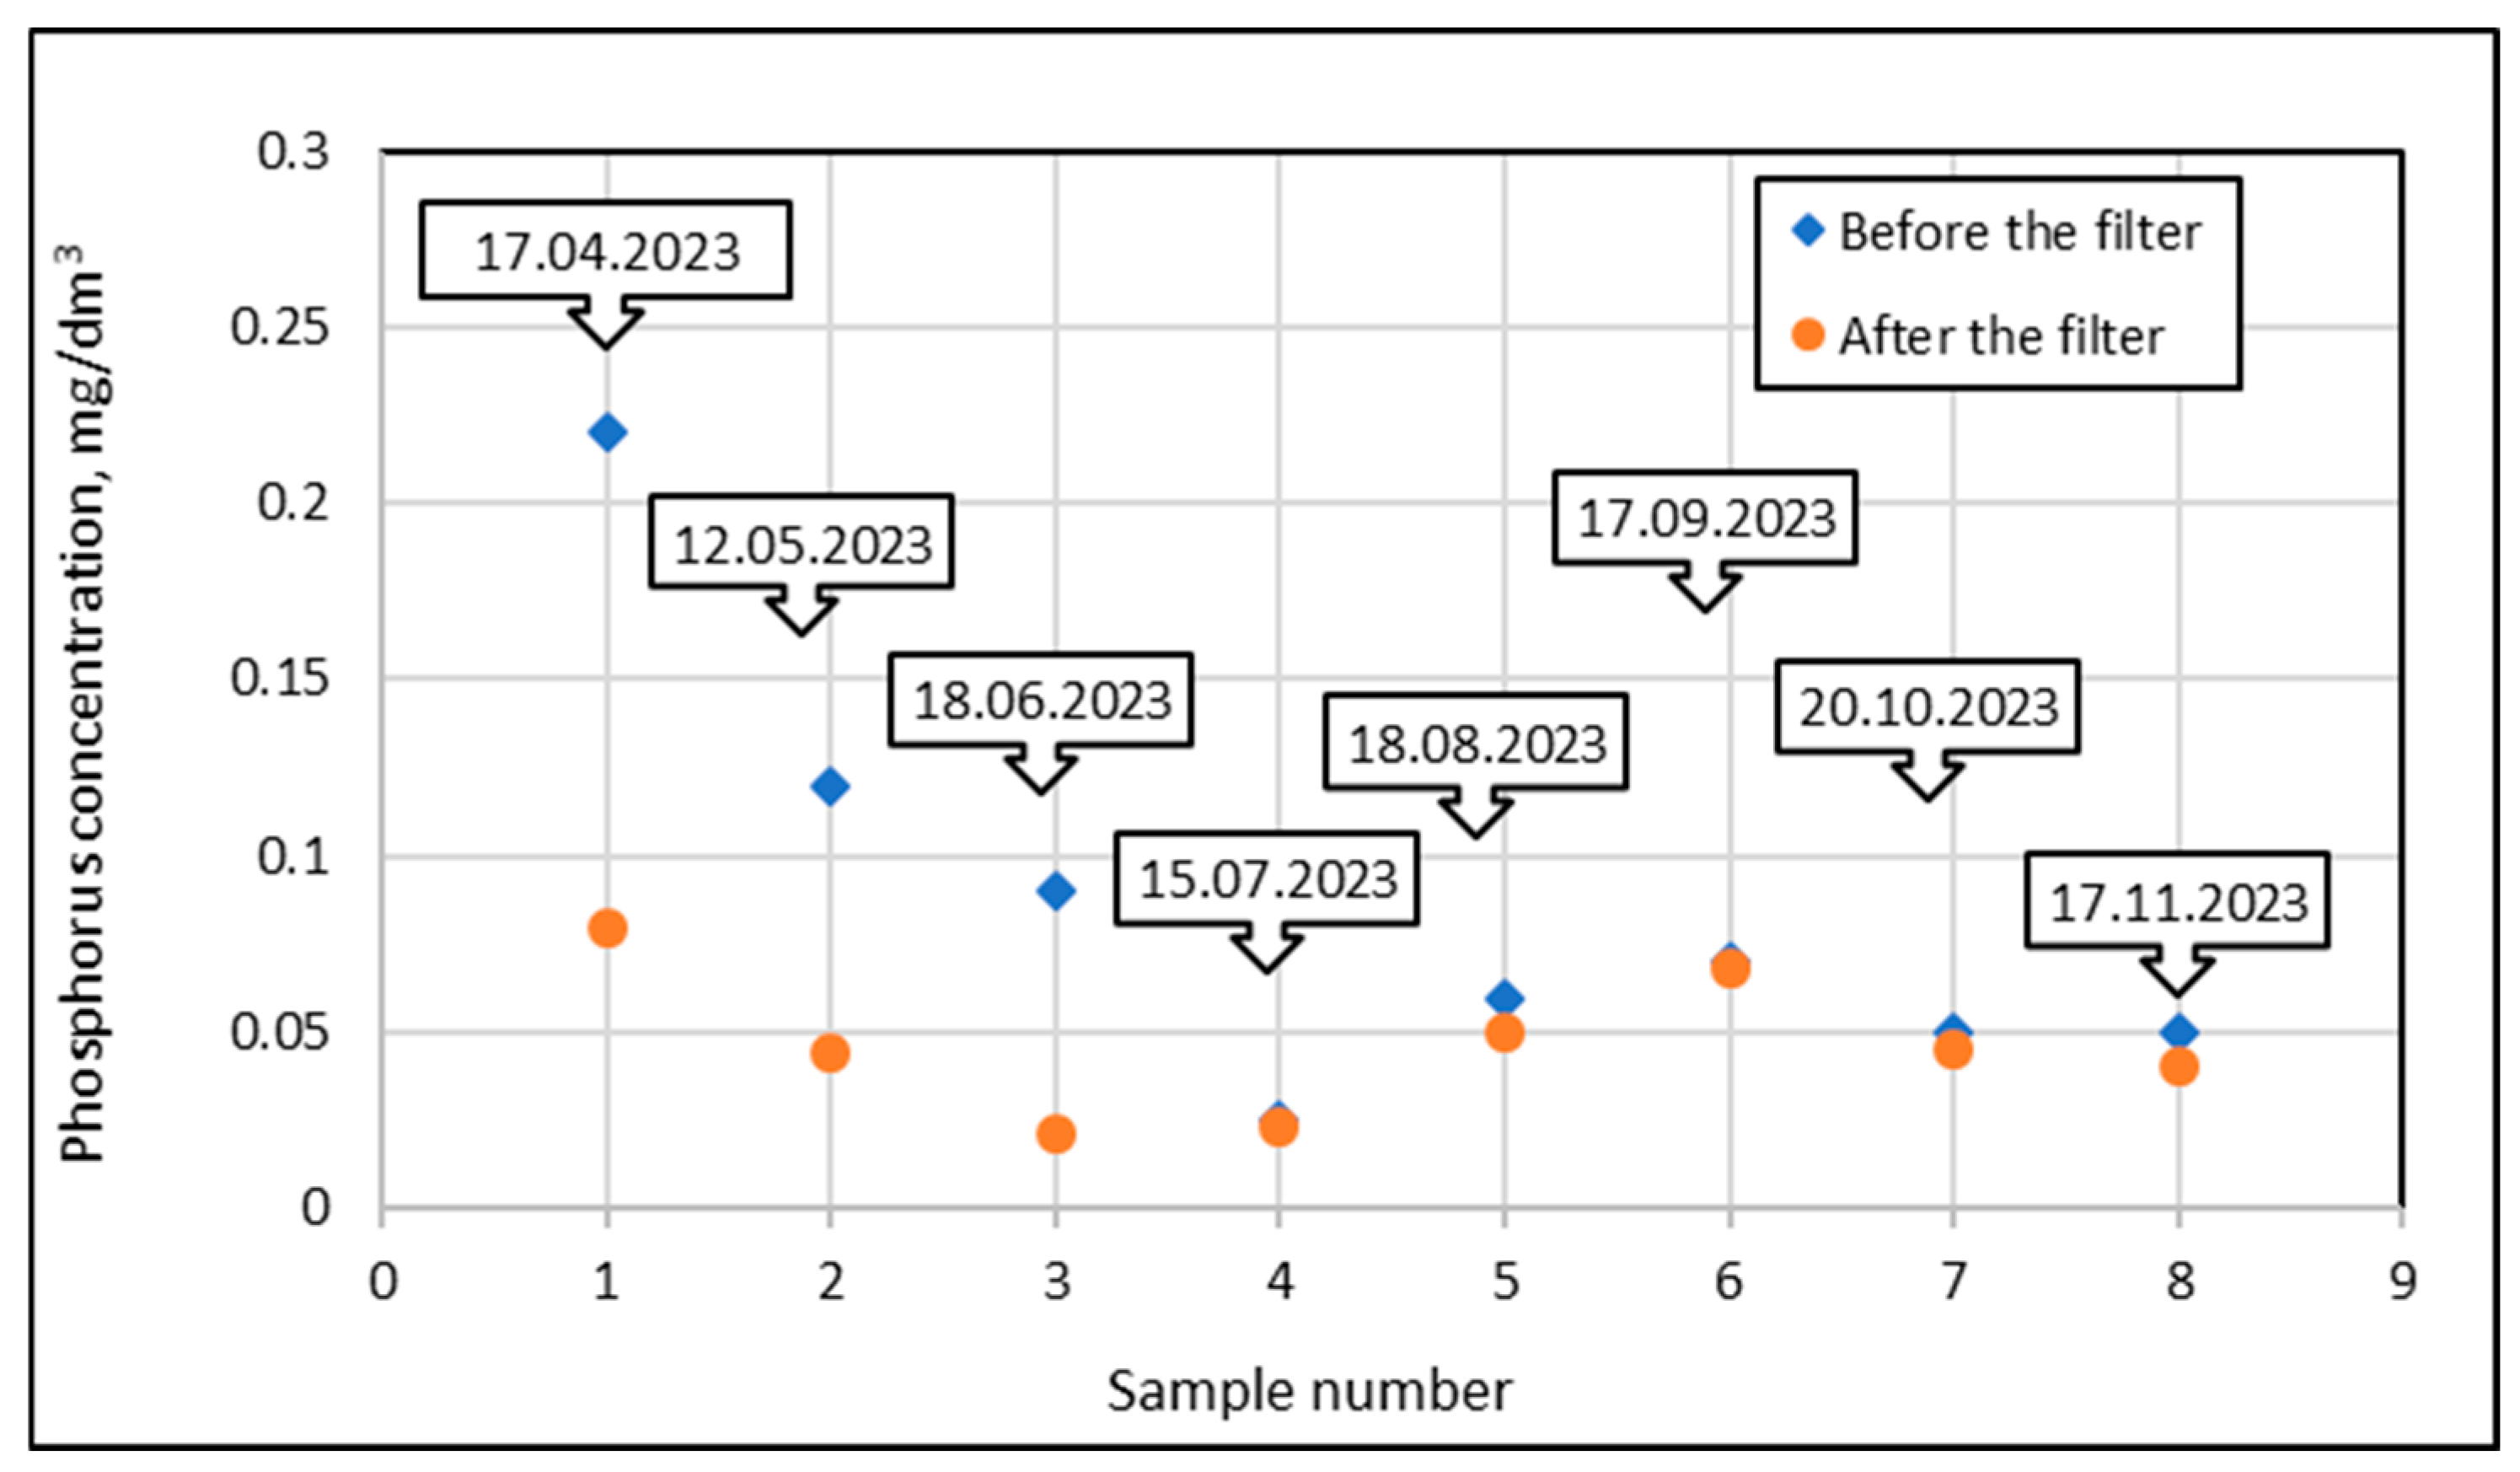
In order to calculate the phosphorus mass retained by the bed under specific experimental conditions, additional calculations were used, as illustrated in the example below. The results of phosphorus adsorption tests for a mineral filter at a filtration rate of 5 m/h are shown in Figure 16. The points marked with blue diamond show the phosphorus concentrations in the water taken from the pond, i.e., before the filter, while the orange circles show the concentrations in the water treated by the filter, i.e., fed into the pool. The first component of the calculated total phosphorus mass retained on the filter (Figure 16) was represented by a triangle with one vertex at point 0.0, one vertex at right angle 1.0, and the third vertex at the ordinate of point 1.
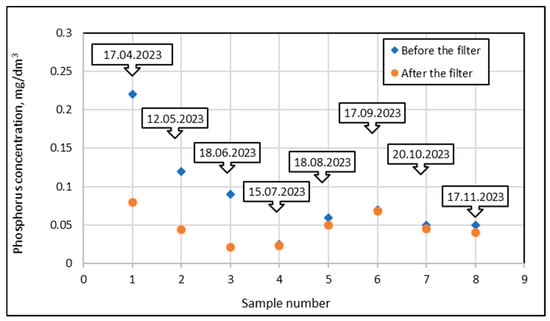
Figure 16.
Phosphorus concentrations in the inlet and outlet streams from the filter at a filtration rate of 5 m/h (P1) for subsequent test dates in the 2023 season.
Using the formula for the area of a triangle, the total mass was calculated using the base of a right-angled triangle from 0.0 to 1.0, which represented one day (24 h), and the height of the triangle was 0.22 g P/m3. Since in the first case the filtration speed was 5 m/h for one day, 30 m3 of water was filtered through the filter with a surface area of 0.25 m2. Using these values, the total mass introduced to the filter was 3.30 g P.
Since the phosphorus concentration in the outlet stream was 0.08 g P/m3, using similar reasoning, 1.20 g P flowed out of the filter for one day. It follows that 2.10 g P was retained in the bed.
Analyzing the next interval between point 1 (17 April 2023) and point 2 (12 May 2025), which lasted 25 days, similar calculations were performed but using the formula for the area of a trapezoid. The lengths of the bases of the trapezoid in relation to the outlet stream were 0.22 g P/m3 and 0.12 g P/m3, and in relation to the outlet stream, 0.08 g P/m3 and 0.044 g P/m3. The height of the trapezoid was referenced to 25 days.
The calculations showed that 127.5 g of P entered the bed at that time, 46.5 g of P flowed out, which means that 81 g of P was retained in the bed.
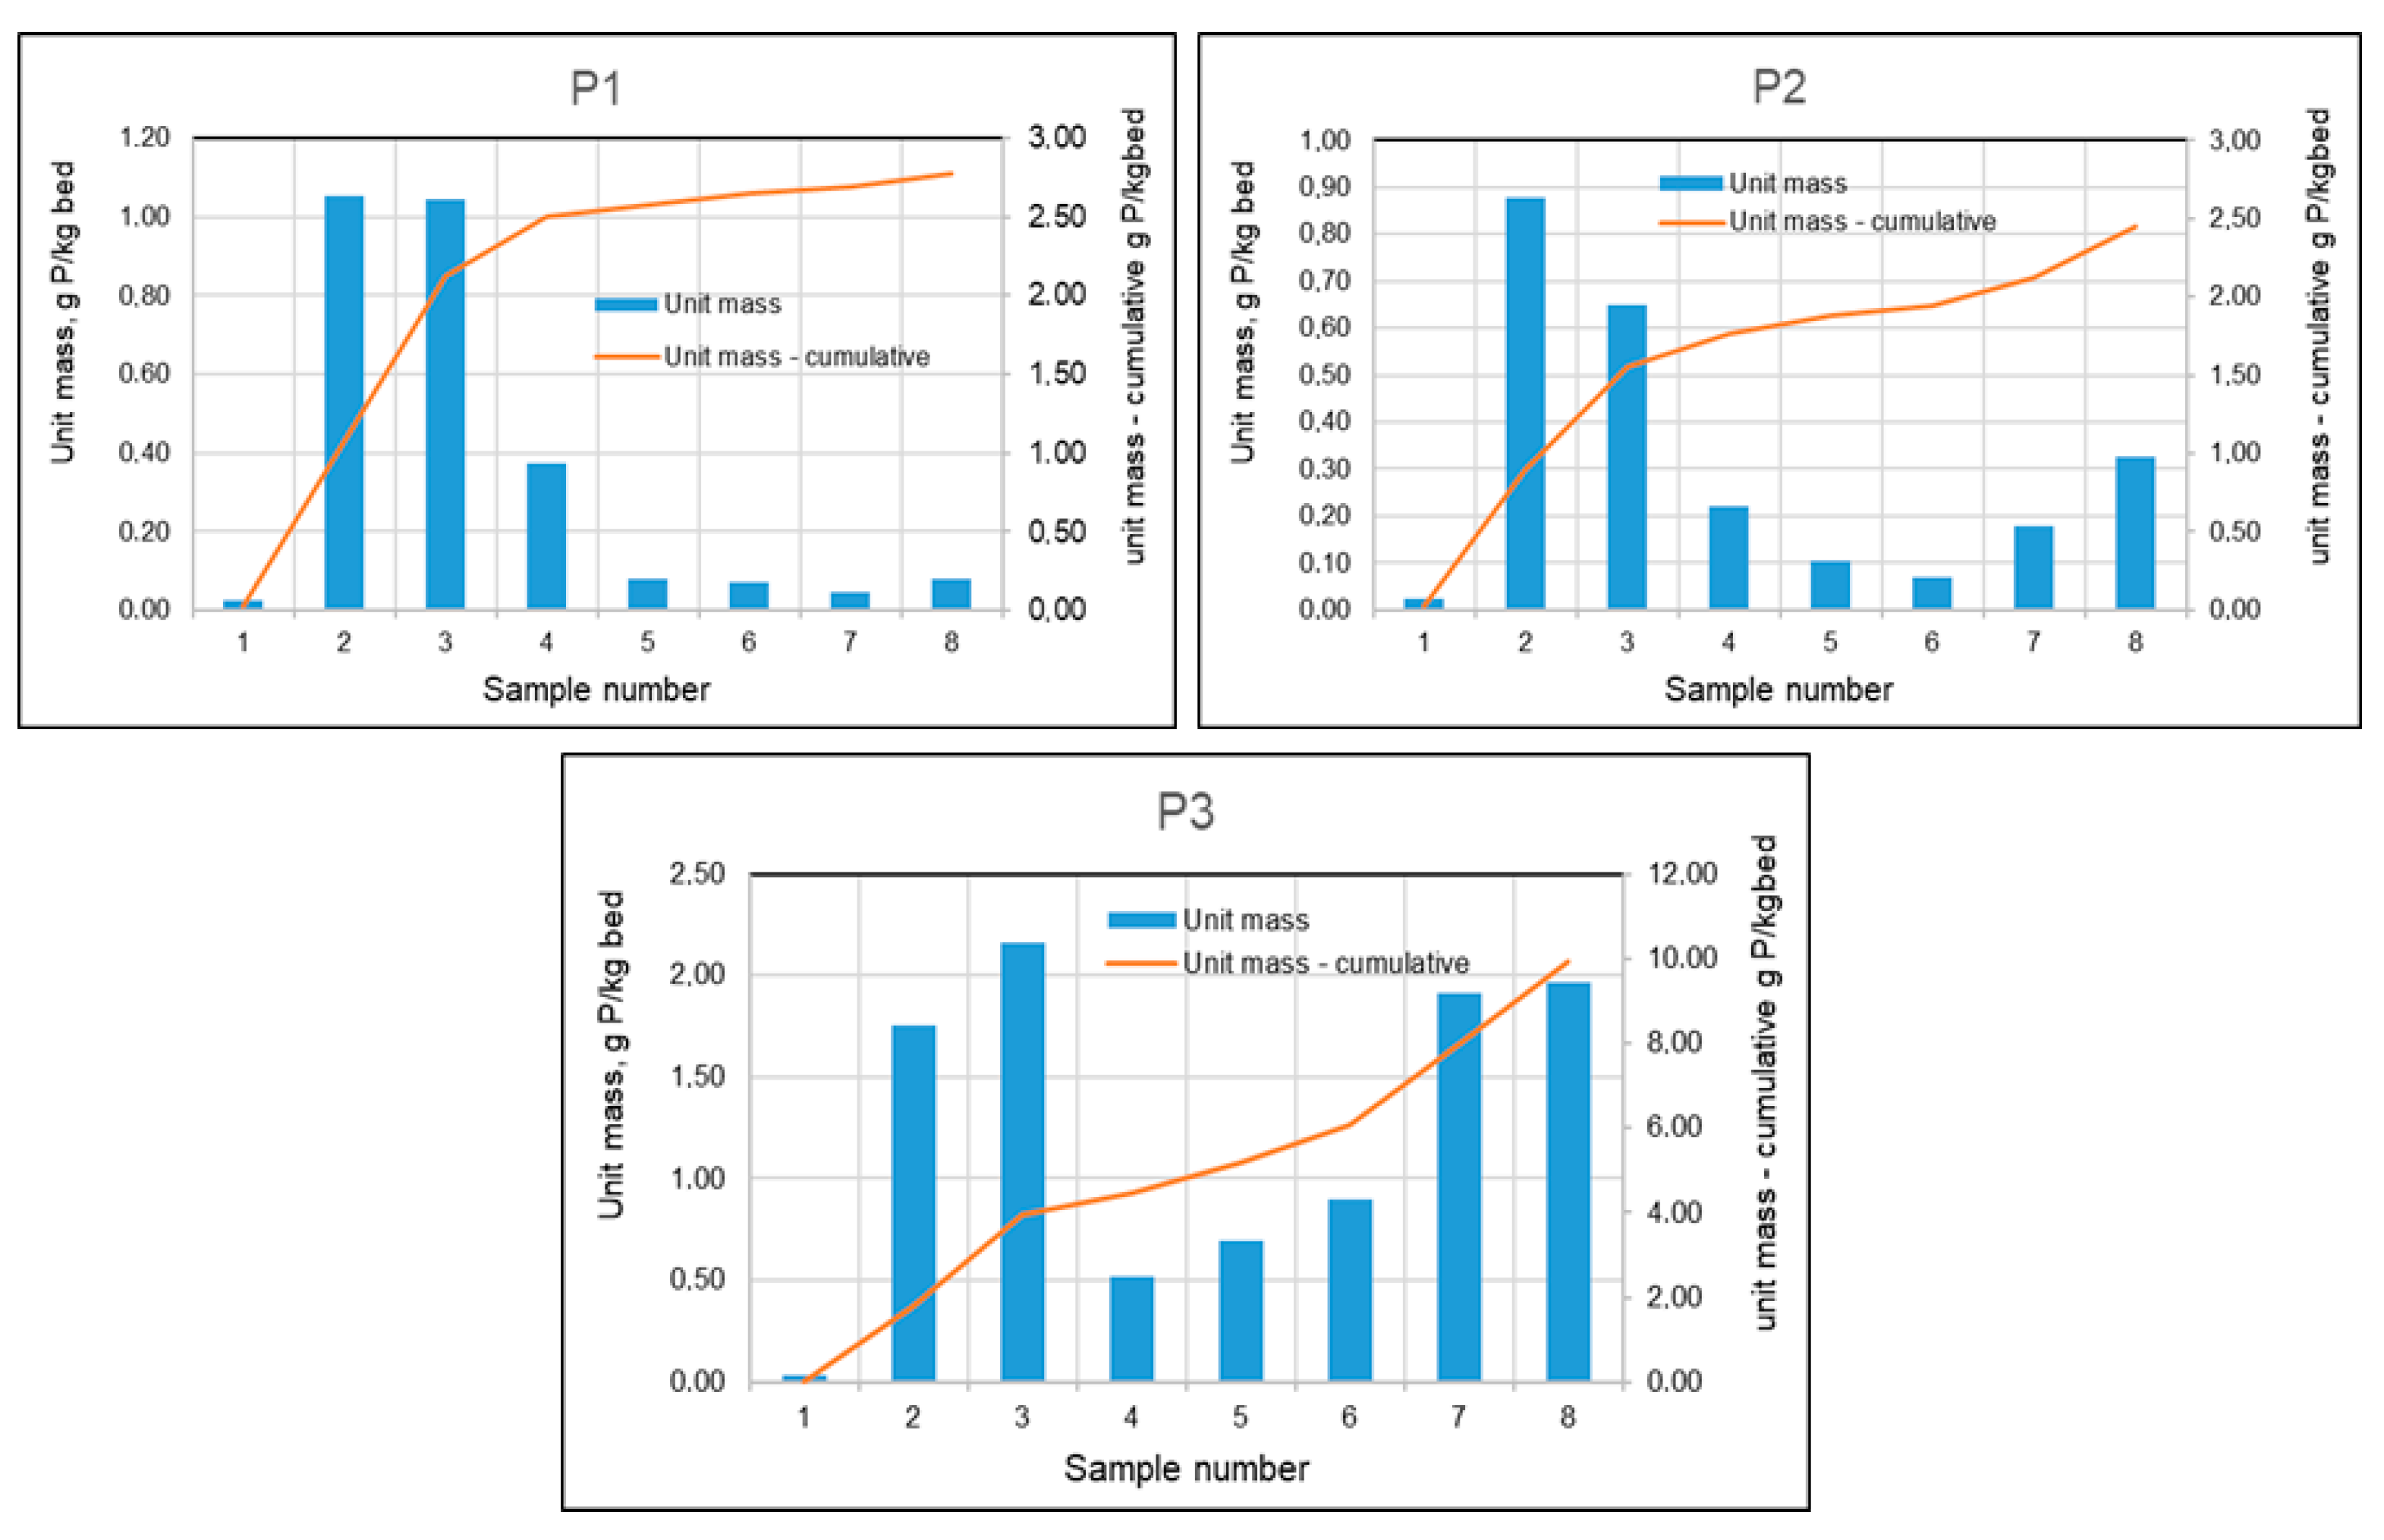
Using the same reasoning for subsequent intervals, the corresponding values of phosphorus retained on the filter were calculated. In order to obtain comparable results (unit masses), the phosphorus masses obtained were divided by the mass of the Rockfos bed®, which has a volume of 0.5 m × 0.5 m × 0.4 m = 0.1 m3 and volume density of 770 kg/m3. Hence, the total mass of the bed was 77 kg.
The unit masses in individual test periods and cumulatively are presented in Figure 17. Using these calculations for all three filtration speeds, graphs were constructed (Figure 17) showing the masses of phosphorus absorbed by the beds between individual tests and the cumulative masses over the entire test period.
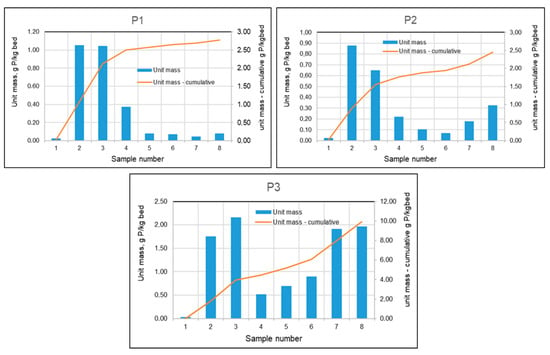
Figure 17.
Phosphorus masses absorbed by mineral beds between sampling points and cumulative masses during the study period for tanks P1–P3.
As can be seen in Figure 17, initially, as a result of the formation of chemical bonds, larger amounts of phosphorus were retained on each of the beds. During the summer months, with increased biological activity, phosphorus concentrations in the basin were significantly lower, which translated into lower phosphorus concentrations in the effluent stream from the filters, and this in turn resulted in a lower mass of retained phosphorus. At low filtration rates (Figure 17–P1), this condition persisted until the filter was shut down in the fall. Filters with higher rates (10 m/h and 15 m/h) showed an increase in the amount of phosphorus retained during the fall.
The results of the parameter tests in the three experimental ponds were also subjected to statistical analysis, including correlations between the tested factors. It was also analyzed whether the filter’s impact is statistically significant for the quality of the filtrate.
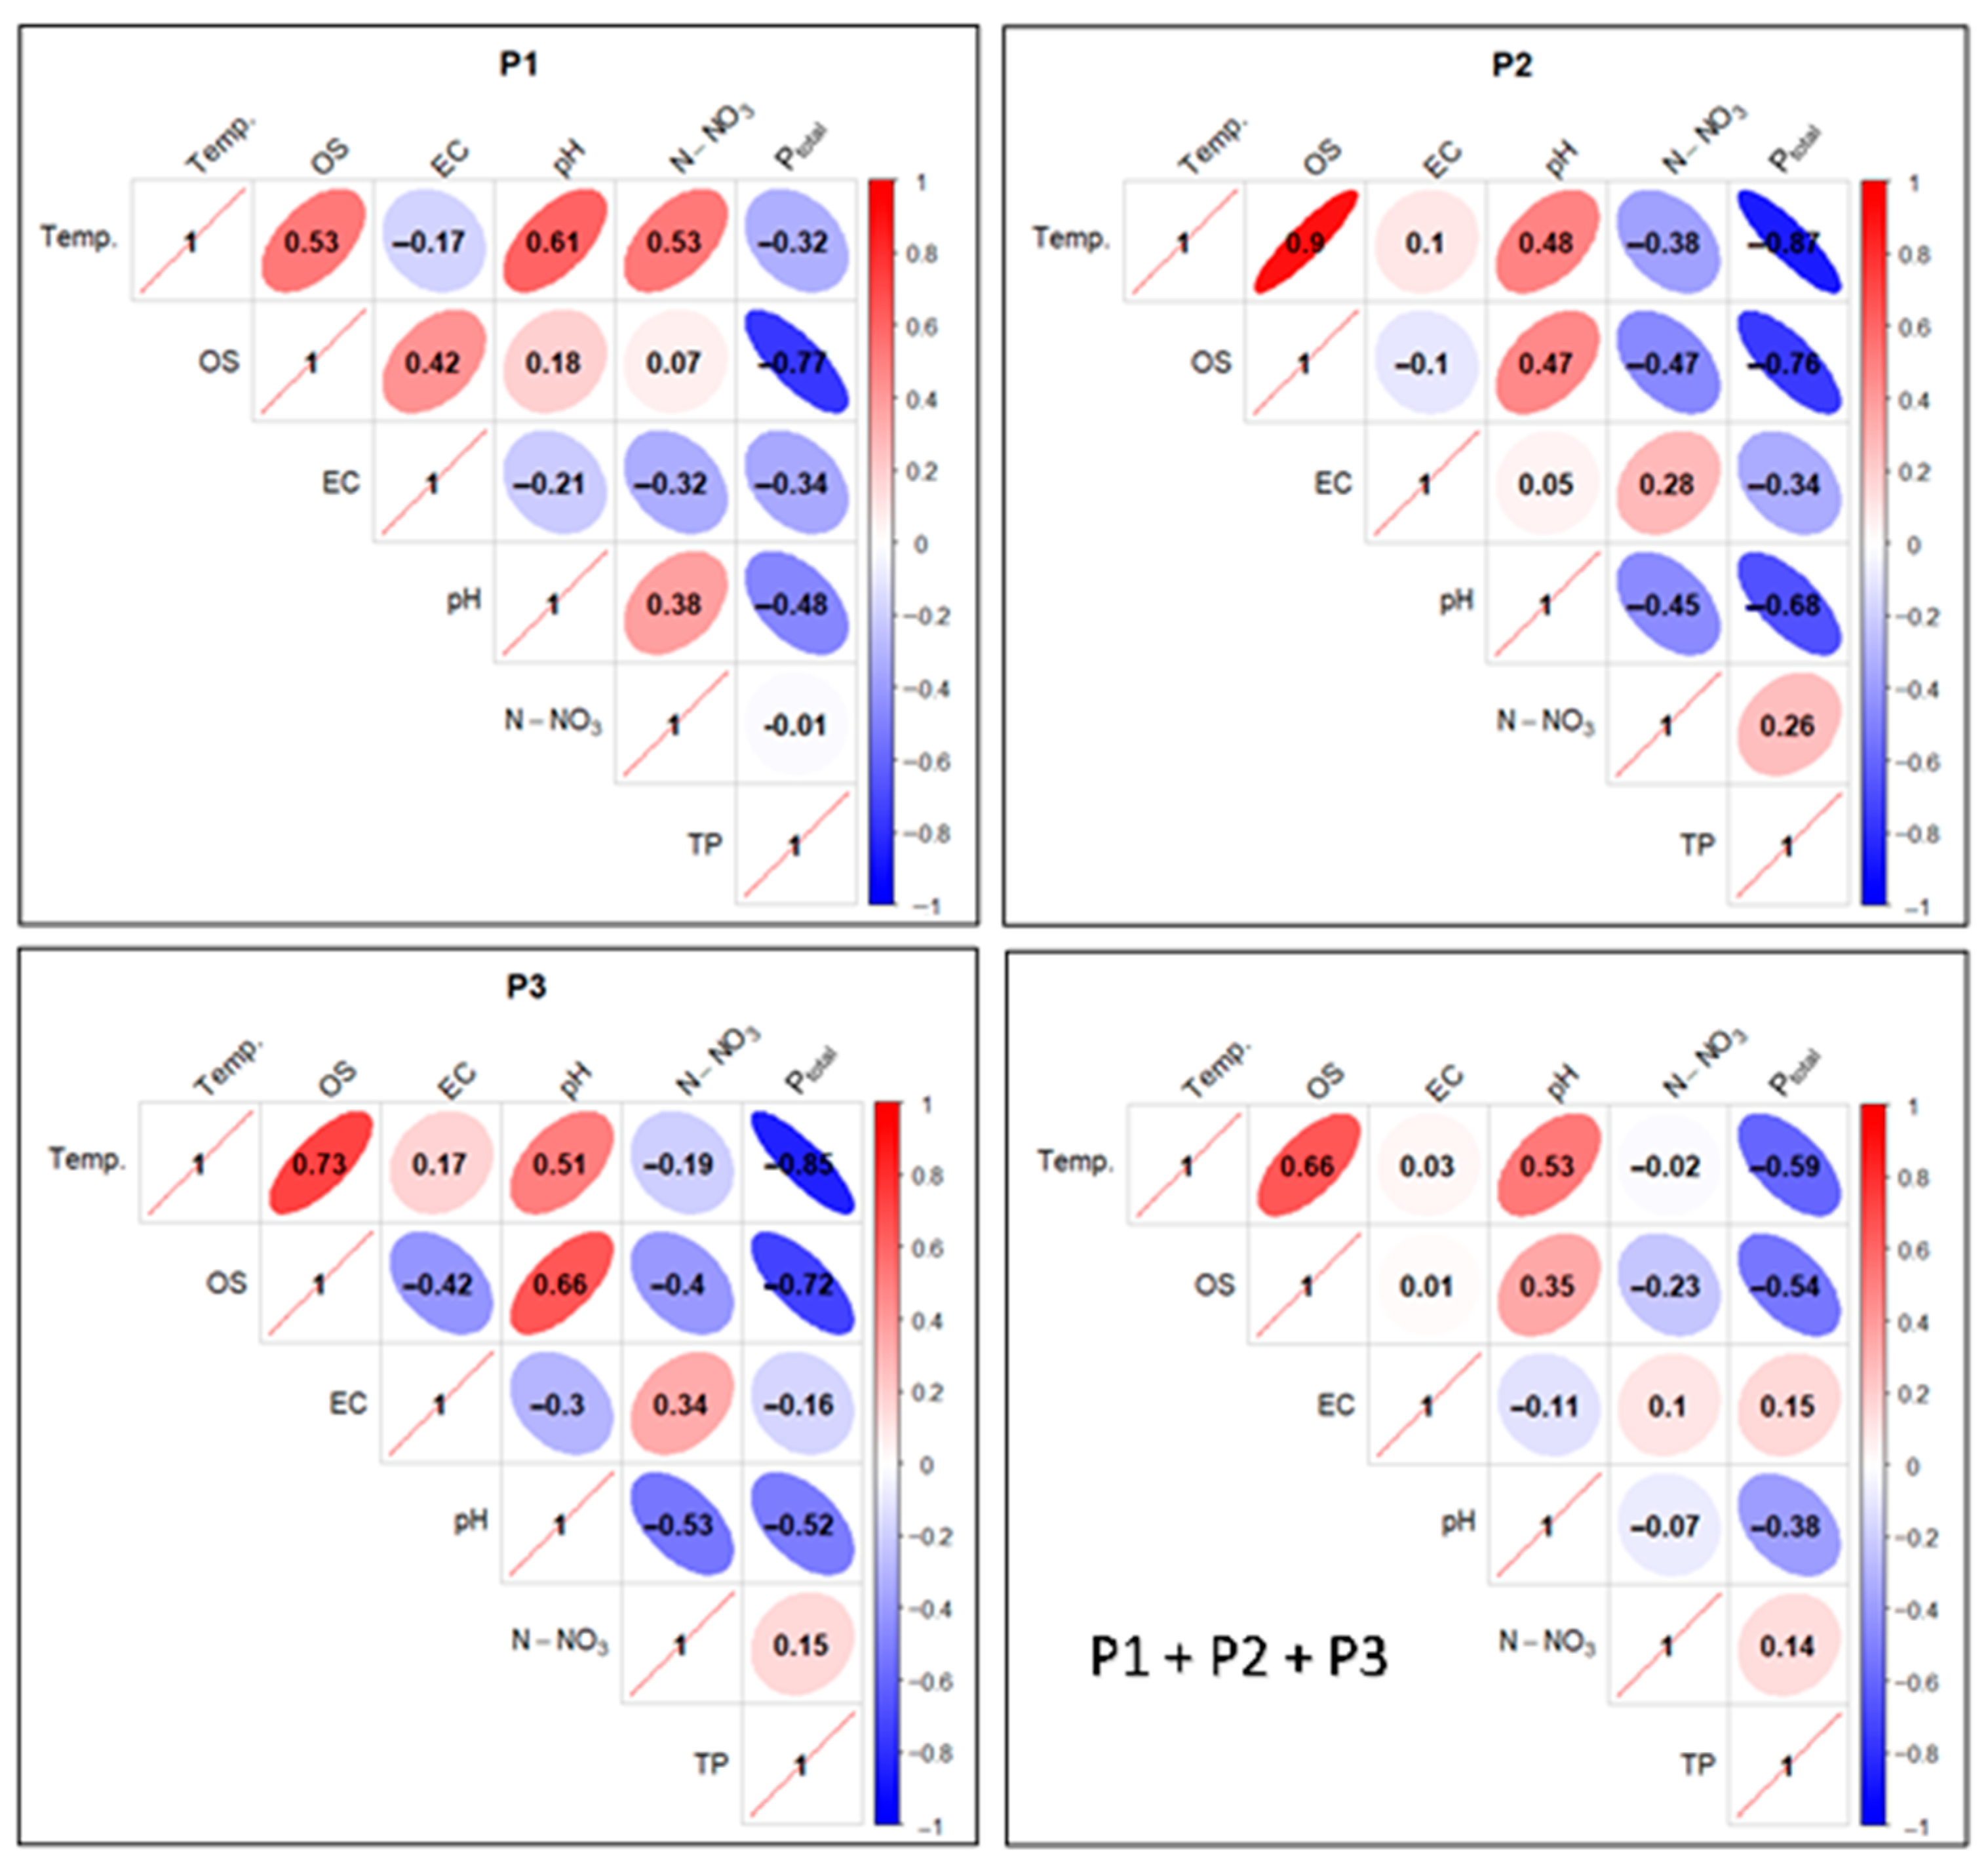
Due to the lack of data variability, the N-NO2 and TH factors were not analyzed as they were not technologically justified. The results of the correlation analysis for these parameters of the experimental task are presented in Figure 18.
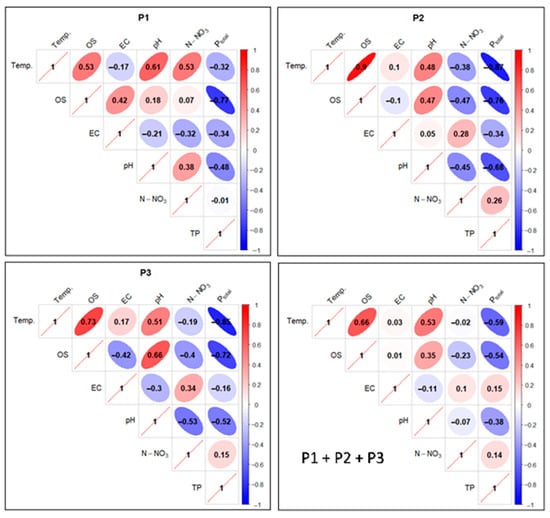
Figure 18.
Correlations between physicochemical factors of experimental pond water as pooled data (separately and in total). Ellipse angulation and color intensity are proportional to the Pearson correlation coefficient: positive correlations are shown in red and negative correlations in blue.
A threshold value of ≥0.5 was adopted as a high positive correlation and ≤−0.5 as a high negative correlation. Since the properties of the correlation matrix in the R environment do not allow for any other graphical presentation of the results than that presented in Figure 18, attention was focused only on the results of the correlation of technologically relevant parameters mentioned in the research methods.
In the case of P1, a high positive correlation was calculated for the Temp. factor in relation to: OS, pH, and N-NO3. A low negative correlation (−0.17) was found between Temp. and EC, and an elevated negative correlation (−0.32) between Temp. and Ptotal. In turn, an elevated negative correlation (−0.48) was noted between pH and Ptotal. A high negative correlation was noted for the relationship between OS and Ptotal (−0.77), while between the values of the OS and N-NO3 factors, a very low positive correlation of 0.07 was found (Figure 18).
For P2, in turn, a very high positive correlation was found between the Temp. factor and OS (0.9). A low positive correlation (0.1) was found between Temp. and EC, and an elevated negative correlation (−0.38) between Temp. and N-NO3. A very high negative correlation (−0.87) was observed between Temp. and Ptotal. For OS in relation to N-NO3, the correlation value was negative and elevated (−0.47), and in relation to Ptotal, it was a high negative (−0.76). In the case of the pH and Ptotal relationship, a high negative correlation (−0.68) was determined—Figure 18.
In P3 analyses, a high positive correlation was found for the Temp. parameter and the factors OS (0.73) and pH (0.51). For the pair Temp. and EC, a low positive correlation (0.17) was found, and for Temp. in relation to N-NO3 a low negative correlation (−0.19) was found. In the relationship between Temp. and Ptotal, a high negative correlation (−0.85) was determined. In the case of OS and N-NO3 analyses, there was an increased negative correlation (−0.4), while for the OS and Ptotal pair, there was a high negative correlation (−0.72). A similarly high negative correlation (−0.68) was found for the pH and Ptotal relationship—Figure 18.
Collectively (P1 + P2 + P3), a high positive correlation was found for Temp. in relation to OS (0.66) and pH (0.53). For the pair Temp. and EC, the correlation was a low positive (0.03), and for Temp. in relation to N-NO3 a low negative (−0.02). Temp. and Ptotal, in turn, had a high negative correlation (−0.59). OS in relation to N-NO3 had a reduced negative correlation (−0.23), and OS in comparison with Ptotal had a high negative correlation (−0.54). For the pH and Ptotal pair, an elevated negative correlation (−0.38) was found—Figure 18.
Before proceeding to the statistical comparative analysis of data before and after pond water filtration, the normality of data distribution was checked for each parameter separately using the Shapiro–Wilk test (with p-values adjusted for multiple comparisons using the Benjamini–Hochberg procedure). The results, including test statistics and adjusted p-values for each sampling point, are summarized in Table 3.

Table 3.
Results of the Shapiro–Wilk normality test for each parameter and sampling point across three ponds.
The hypothesis of normality was rejected only for the OS and N-NO3 parameters, indicating a lack of normal distribution in these cases. The remaining variables met the normality assumption.
For normally distributed parameters, a t-test for dependent samples was used, comparing the values of pond water before and after filtration for the three experimental ponds.
For parameters that did not meet the normality assumptions, a non-parametric Wilcoxon rank test for dependent samples was performed. Differences were considered statistically significant at a significance level of 0.05.
Based on the analysis, it was found that statistically significant differences in pond water before and after filtration were found for P1 in the case of the factors: Temp. and TH; and for P2 and P3: EC, Ptotal, and OS (see Table 4).

Table 4.
p-values for the t-test and Wilcoxon rank test for parameter data in water before and after filtration for P1–P3. Bolded data mean statistically significant differences.
In the case of principal component analysis (PCA) of water quality factors, initial assumptions were checked. The overall Kaiser–Meyer–Olkin (KMO) measure of sampling adequacy was 0.71, indicating a moderate level of appropriateness for factor analysis. Individual MSA values were satisfactory for most variables (Temp. = 0.71; pH = 0.78; TH = 0.82; Ptotal = 0.83), while EC (0.31) and N-NO3 (0.41) exhibited low adequacy, suggesting limited usefulness in the PCA model. The variable N-NO2 was excluded from the analysis due to its lack of variability across samples, as all observations contained a constant value (0.02 mg/dm3), rendering it non-informative for PCA. Bartlett’s test of sphericity was statistically significant (χ2 = 115.01; df = 21; p < 0.001), confirming that the correlation matrix is sufficiently different from the identity matrix and justifying the application of PCA.
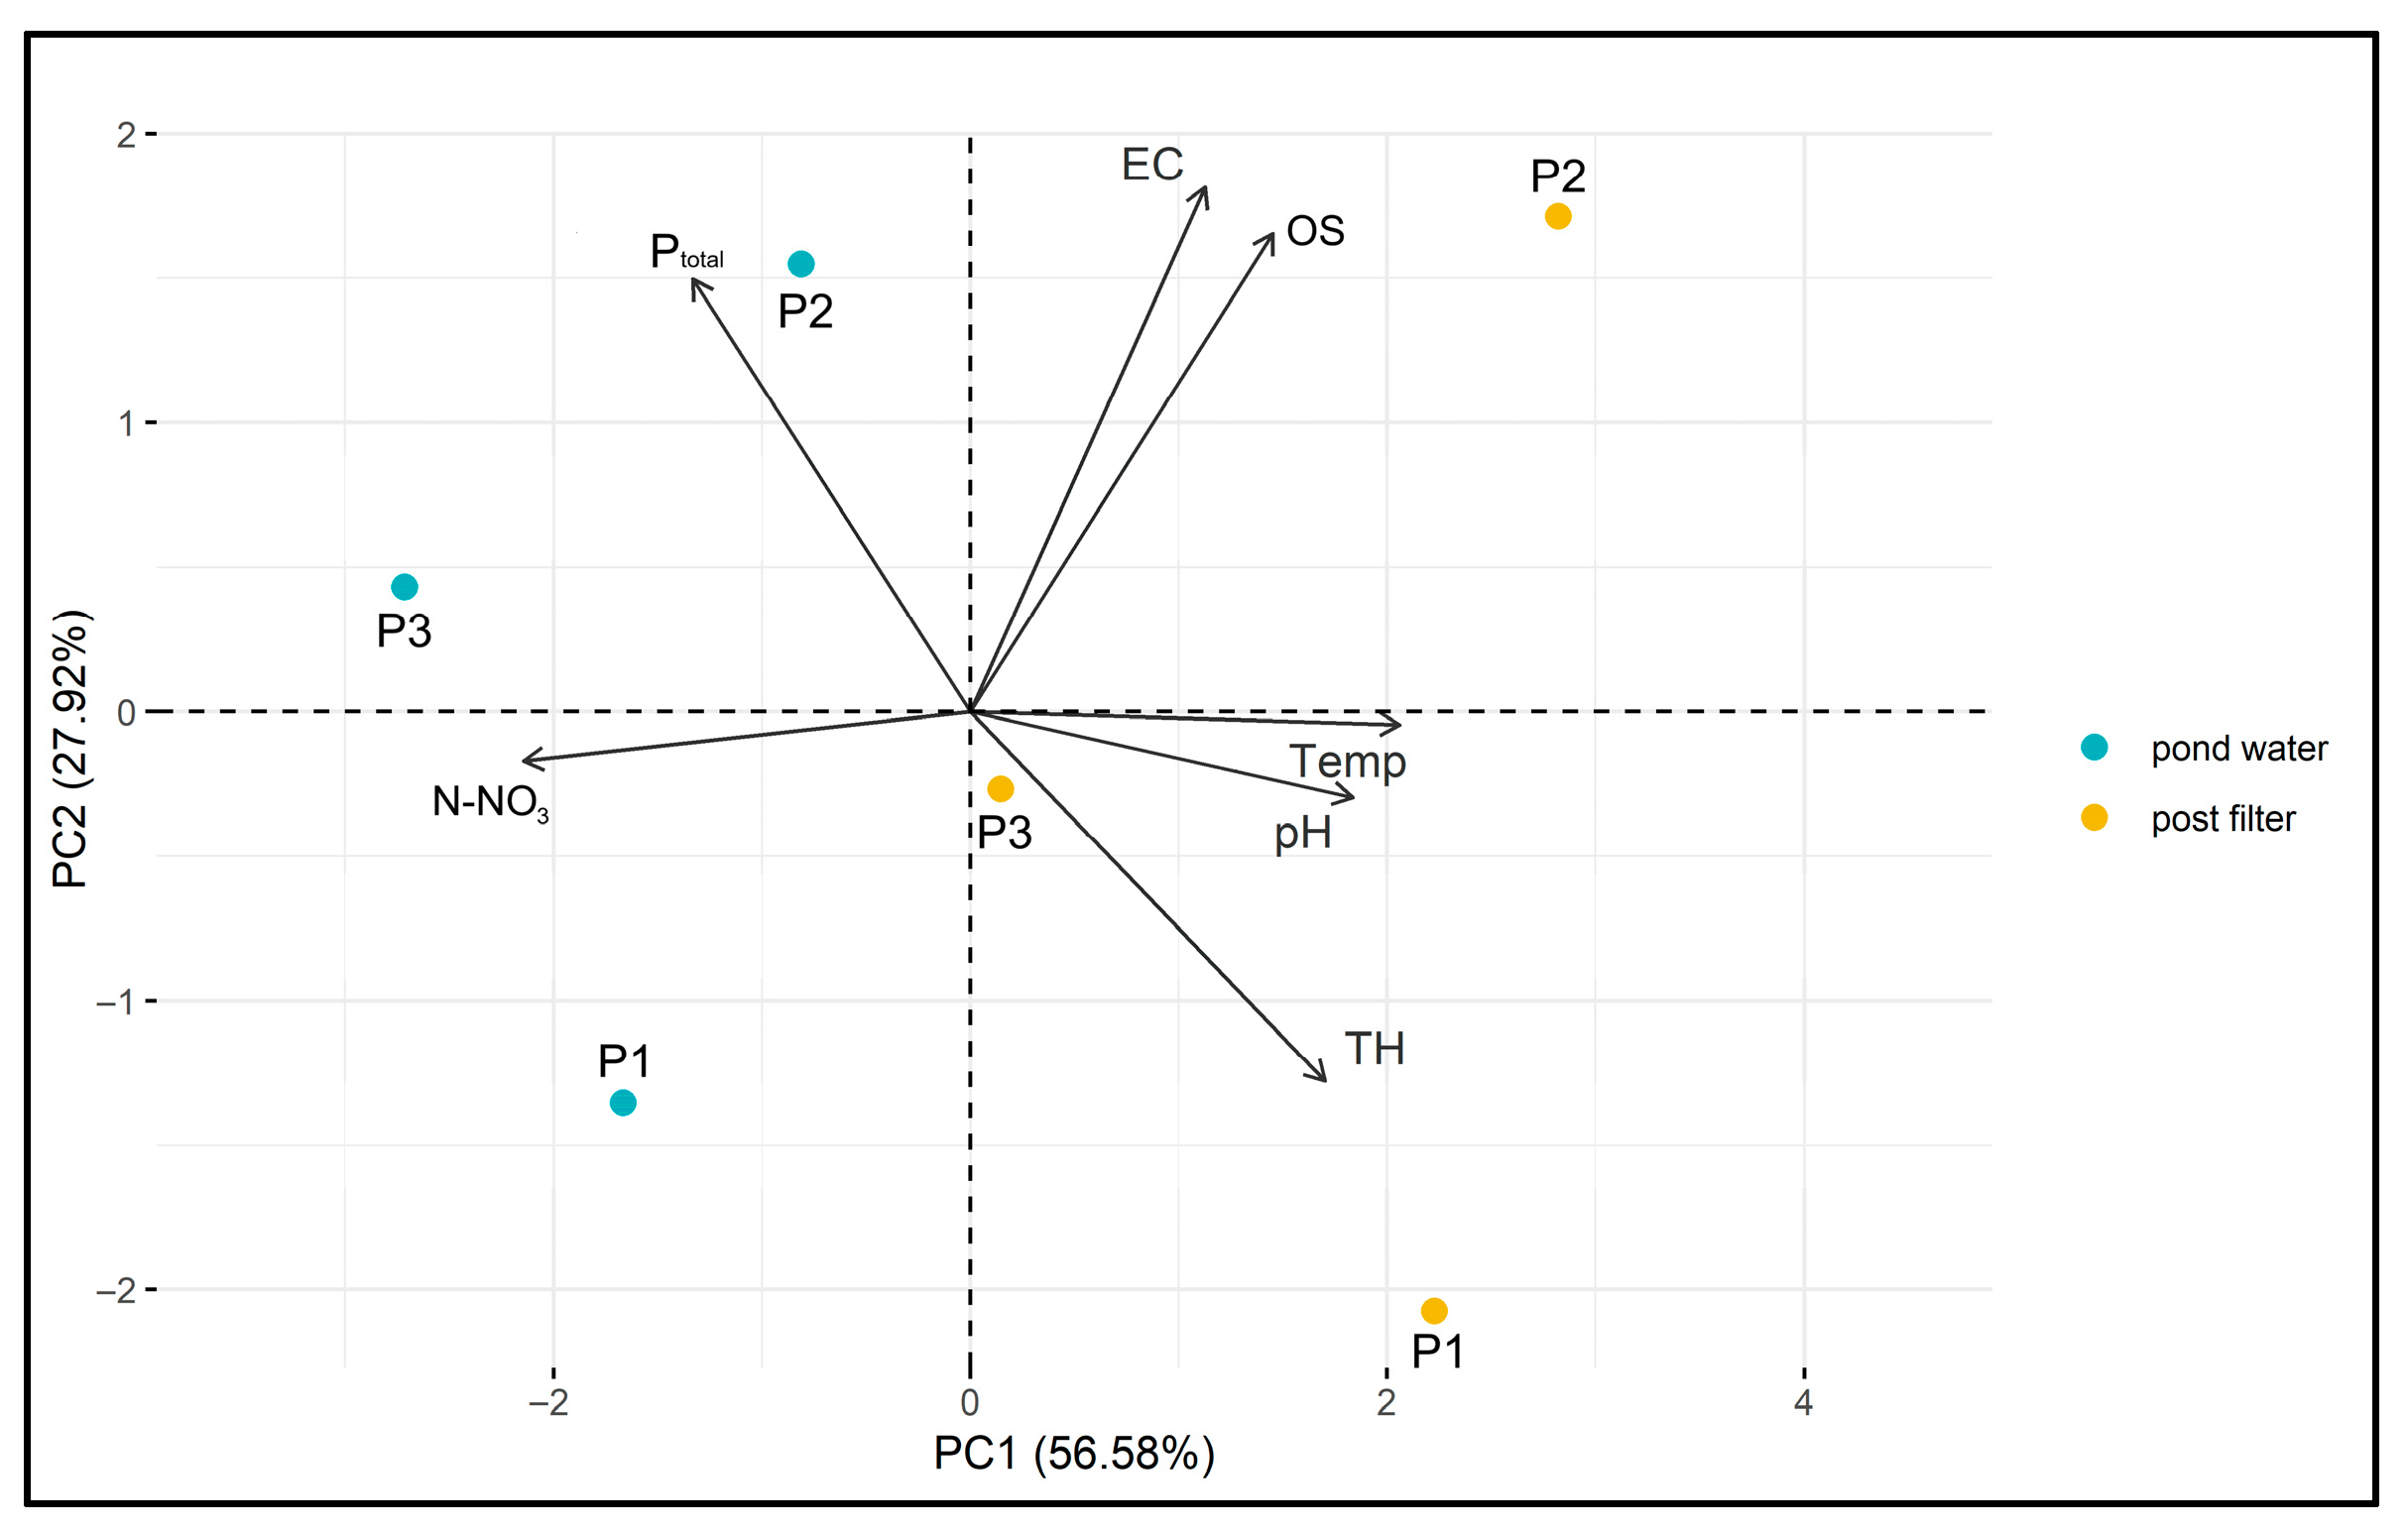
The results of the PCA are presented in the biplot (Figure 19). The two principal components—PC1 (50.58%) and PC2 (27.92%)—together explain 78.50% of the total data variability, indicating a good representation of the original variables.
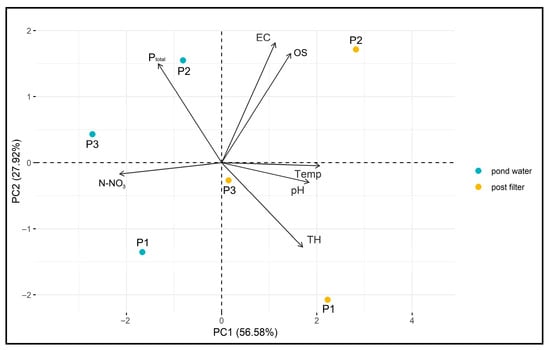
Figure 19.
PCA biplot of P1–P3 and filtered water samples.
The vectors of the variables (Ptotal, N-NO3, EC, OS, Temp., pH, TH) indicate the direction and strength of their correlation with the principal components. Longer vectors represent a greater influence of a given variable on sample differentiation, and their orientation relative to the PCA axes helps identify which component they are more strongly associated with (Figure 19).
Samples are grouped according to location (P1–P3) and filtration stage, allowing for the assessment of similarities and differences between them. Post-filtration samples (marked in yellow) are clearly separated from pond water samples (marked in blue), suggesting that the filtration process significantly affects the physicochemical properties of the water. Separation along PC1 indicates that the main differences between samples arise from parameters strongly associated with this component, such as pH, N-NO3, TH, and temperature. Additionally, differences between samples from individual ponds are observed, which may reflect local environmental conditions (Figure 19).
As part of the sanitary analysis of experimental bathing ponds with different filtration rates, microbiological tests were carried out twice during the 2023 season—microscopic tests according to the adopted procedure—which are presented in Table 5.

Table 5.
Results of bacteriological analyses of water from P1–P3 in the 2023 research season (average from two research terms: 18 August 2023 and 28 September 2023).
Based on the biocenotic analysis of water in experimental ponds P1–P3, with regard to their qualitative aspect, the presence of 40 taxonomic units of pro- and eukaryotic planktonic algae belonging to seven systematic groups was found: Cyanoprokaryota (cyanobacteria), Chrysophyceae (golden algae), Bacillariophyceae (diatoms), Cryptophyceae (cryptoflagellates), Dinophyceae (dinoflagellates), Euglenophyceae (euglenoids), and Chlorophyta (green algae)—Table 6.

Table 6.
Qualitative and quantitative structure of pro- and eukaryotic algae for P1–P3: N—abundance, individual/dm3; B—biomass, mg/dm3.
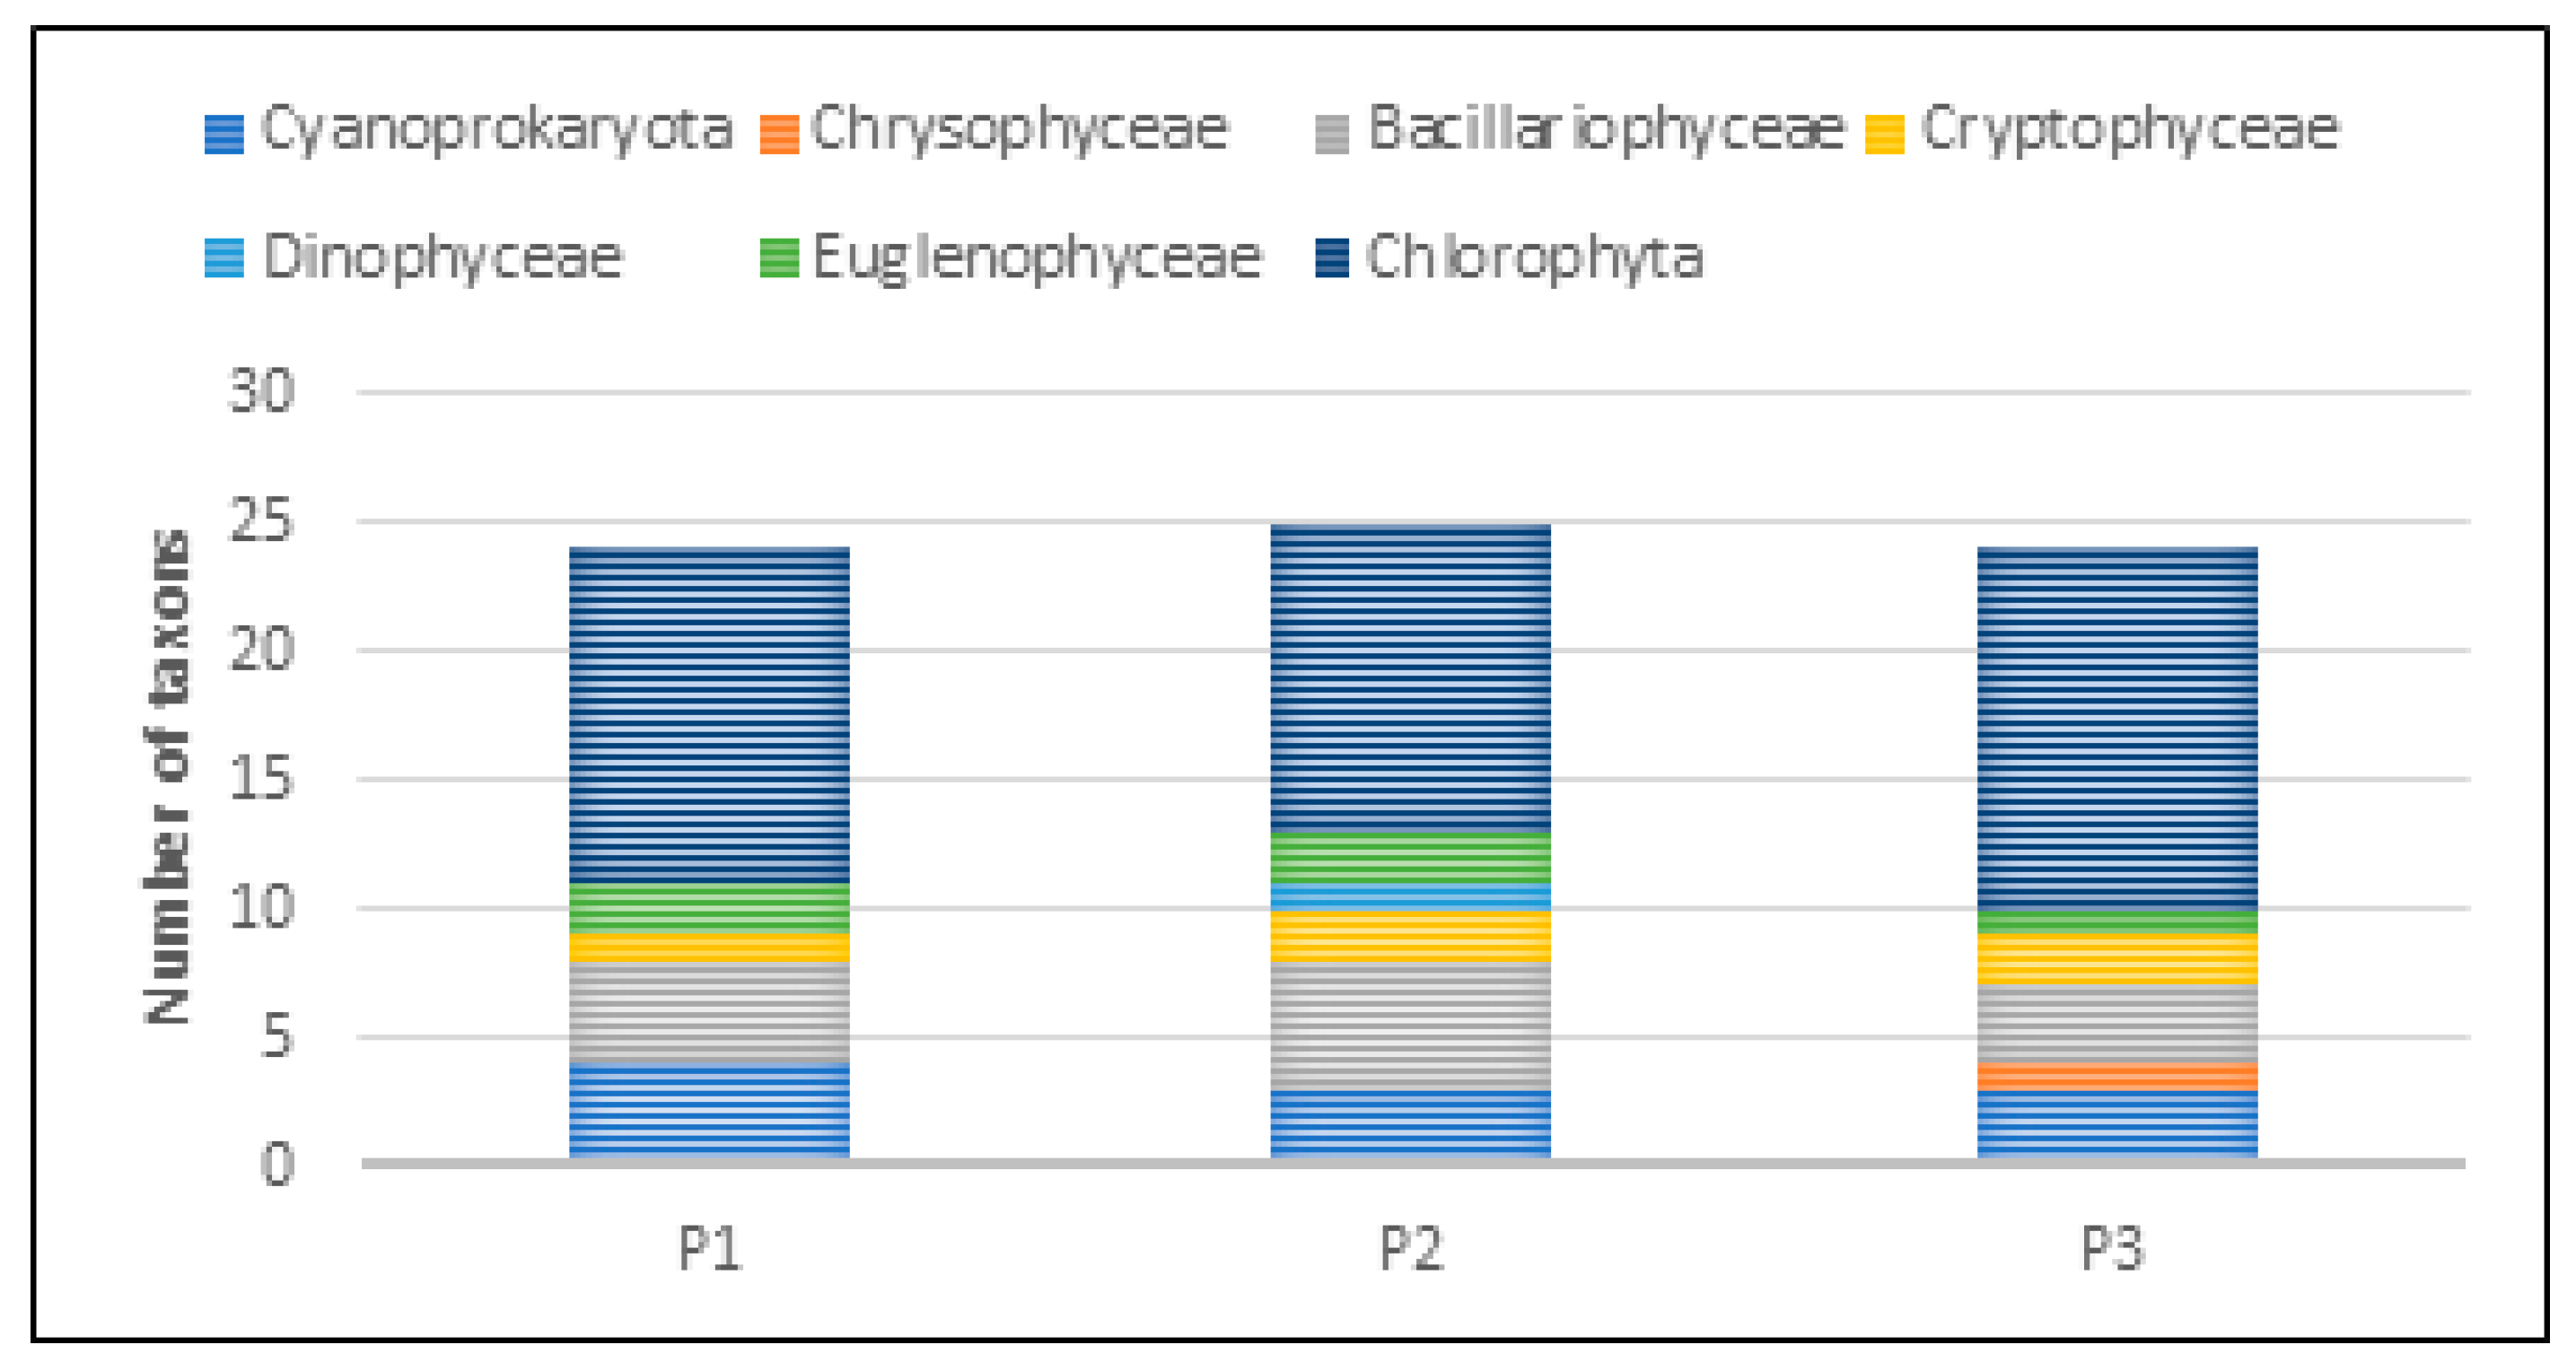
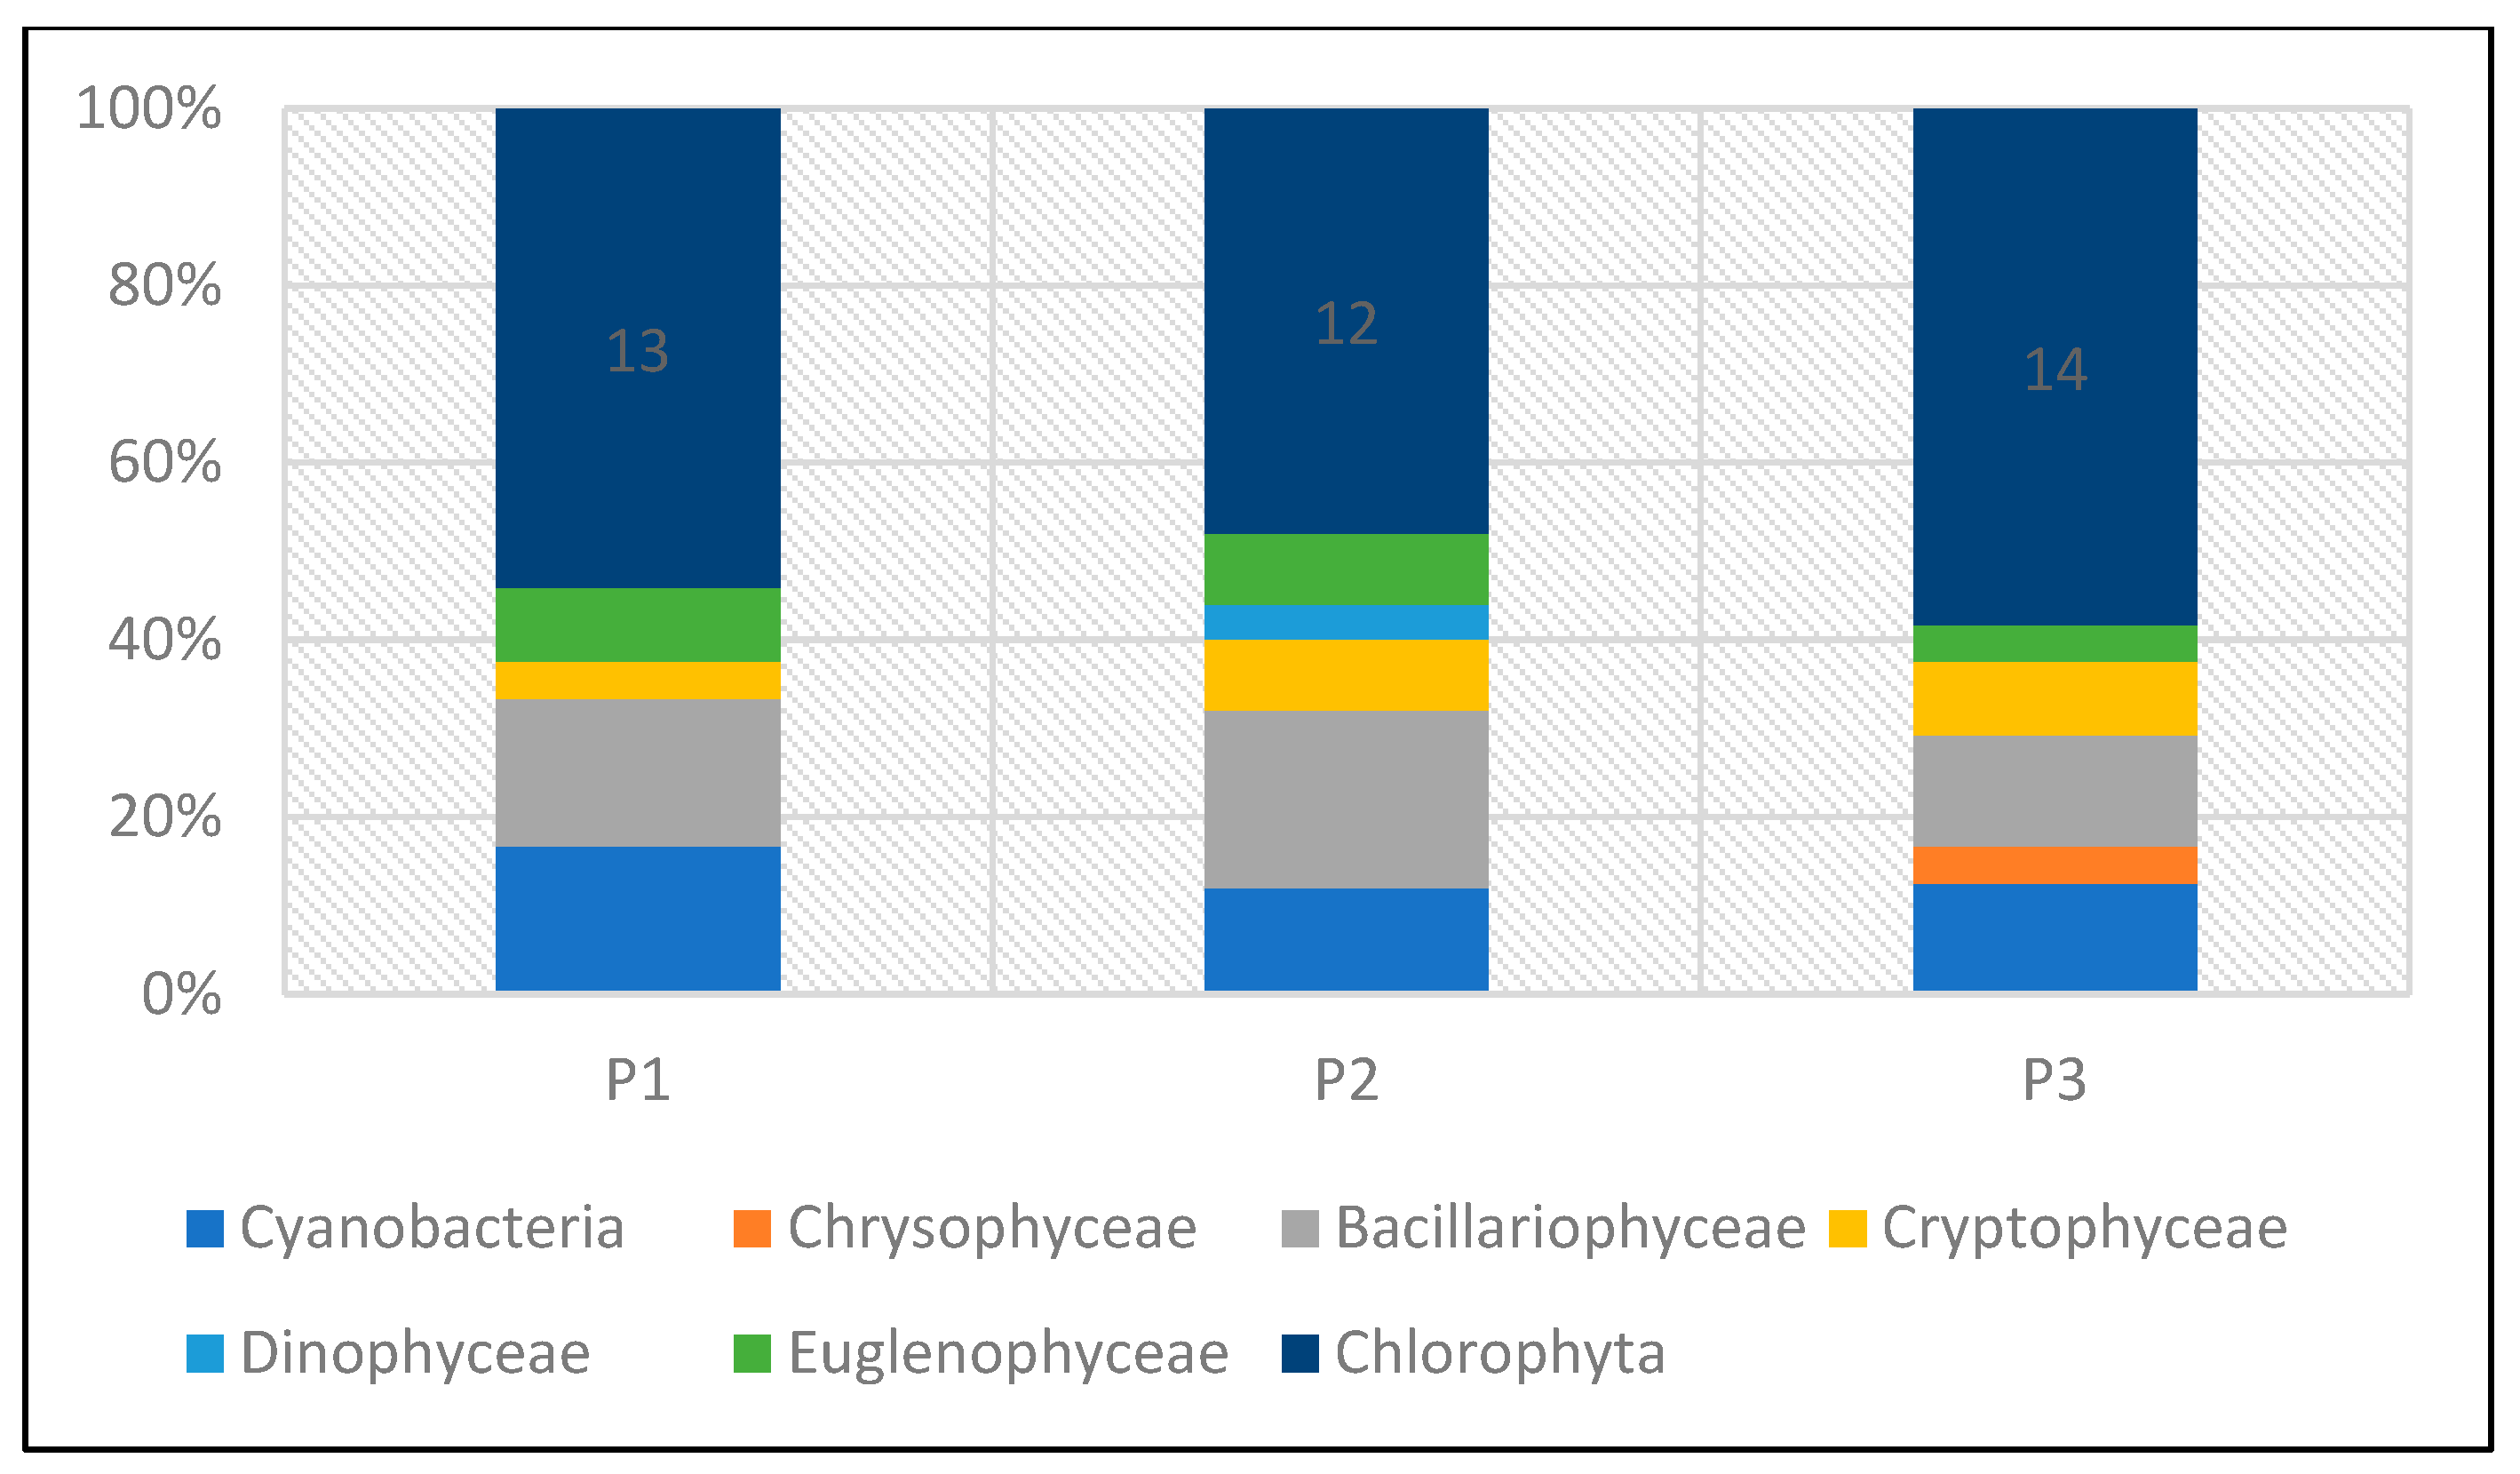
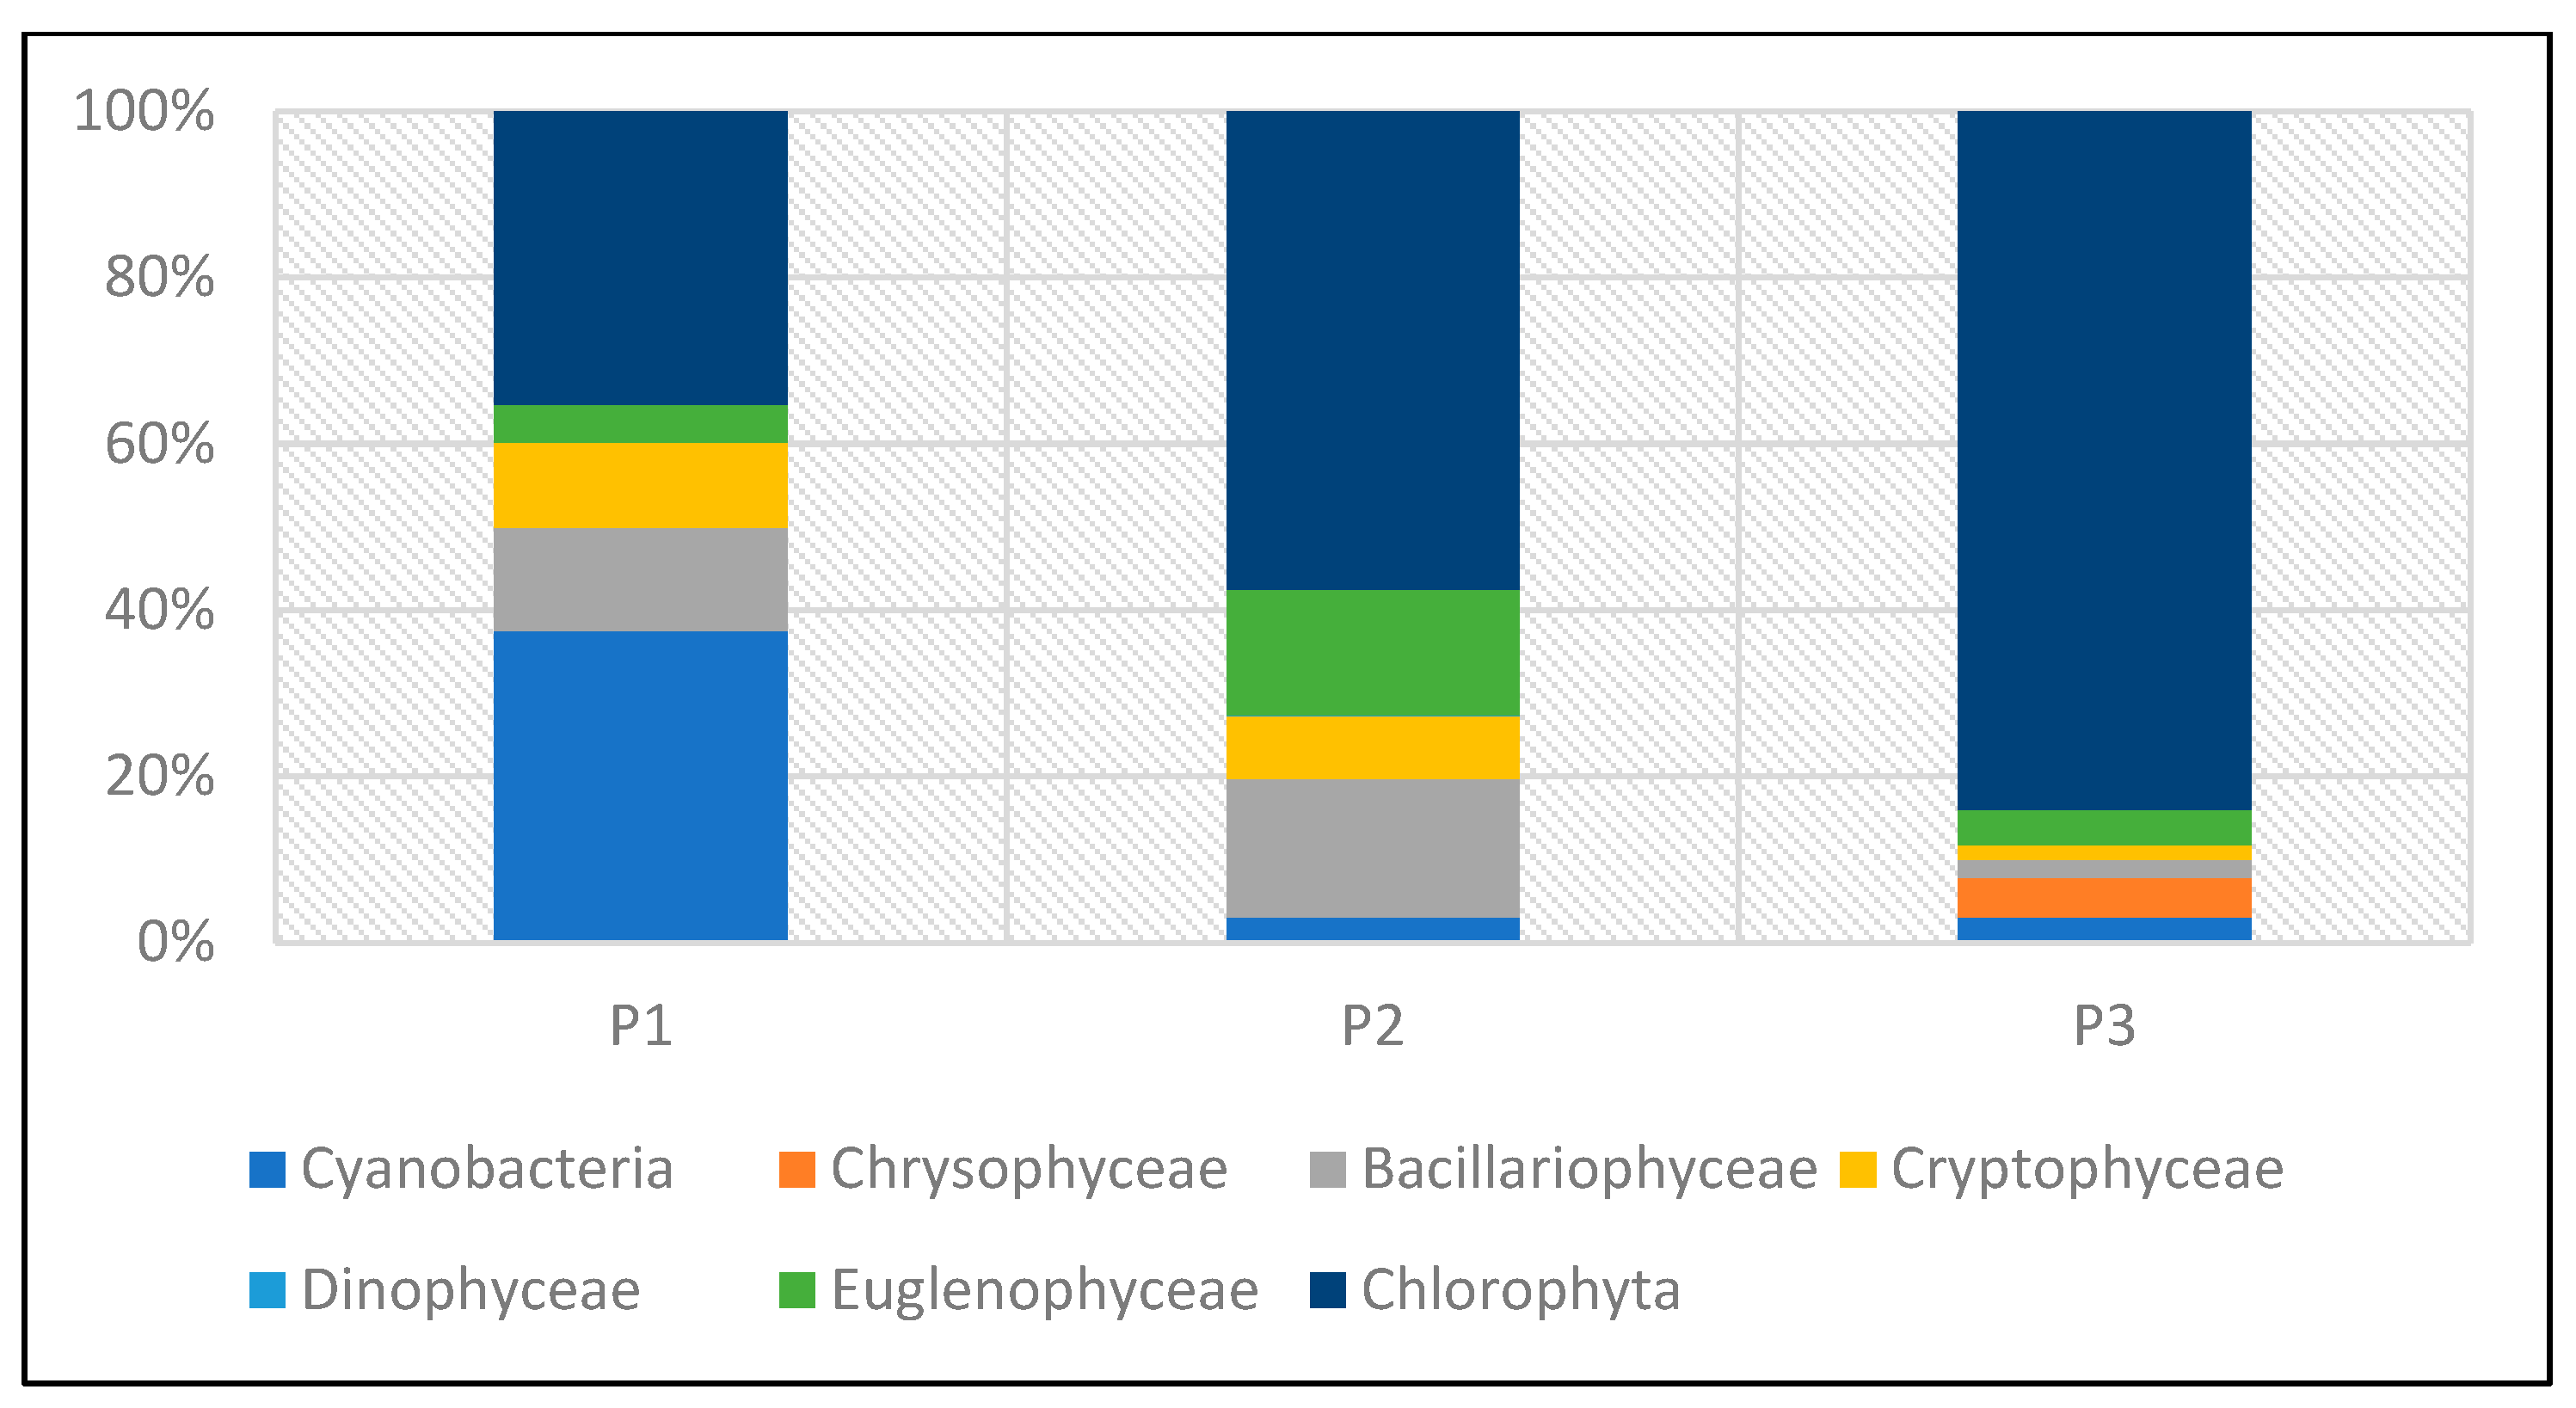
The taxonomic structure of pro- and eukaryotic algae in individual reservoirs was similar. In the three studied reservoirs (P1–P3), a similar number of taxa was recorded—24 taxa in P1 and P3, and 25 in P2 (Figure 20). In all reservoirs, green algae dominated, with a predominance of species from the genera Chlamydomonas, Monoraphidium, and Scenedesmus. In reservoir P1, they accounted for 54%, and in P2 and P3, 48% and 58%, respectively (Figure 21). The share of taxa from the Cyanoprokaryota group, with a predominance of species from the genus Chroococcus, was similar in all reservoirs. Bacillariopyceae, with a predominance of species from the genera Cyclotella and Navicula, and Euglenophyceae, represented mainly by the genus Euglena. Single taxa occurred from the groups Chrysophyceae, Cryptophyceae, and Dinophyceae (see Table 5 and Figure 20 and Figure 21).
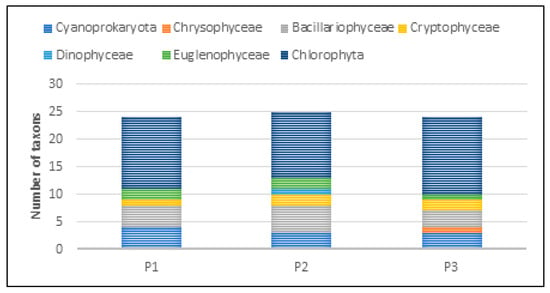
Figure 20.
Taxonomic structure of pro- and eukaryotic algae recorded in the P1–P3 reservoirs for the 2023 sampling season.
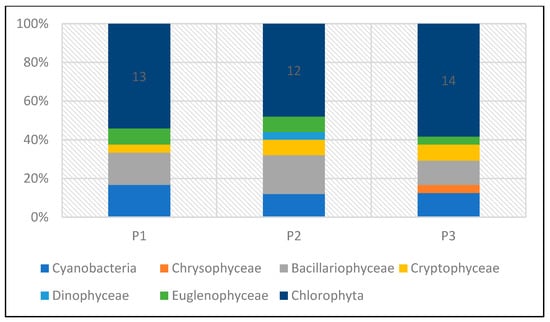
Figure 21.
Taxonomic structure of pro- and eukaryotic algae in percentage terms recorded in reservoirs P1–P3 for the 2023 sampling season.
In terms of phytoplankton quality structure, the studied reservoirs showed very low species similarity (Table 6). The Jaccard similarity coefficient calculated for all reservoirs ranged from S = 0.20 to 0.23, indicating a low species similarity of communities forming in ponds with different filtration circulation speeds of the water treatment system (Table 7). The lowest similarity was recorded between P1 and P3, and the highest between P1 and P2.

Table 7.
Species similarity coefficient for P1–P3 calculated according to Jaccard.
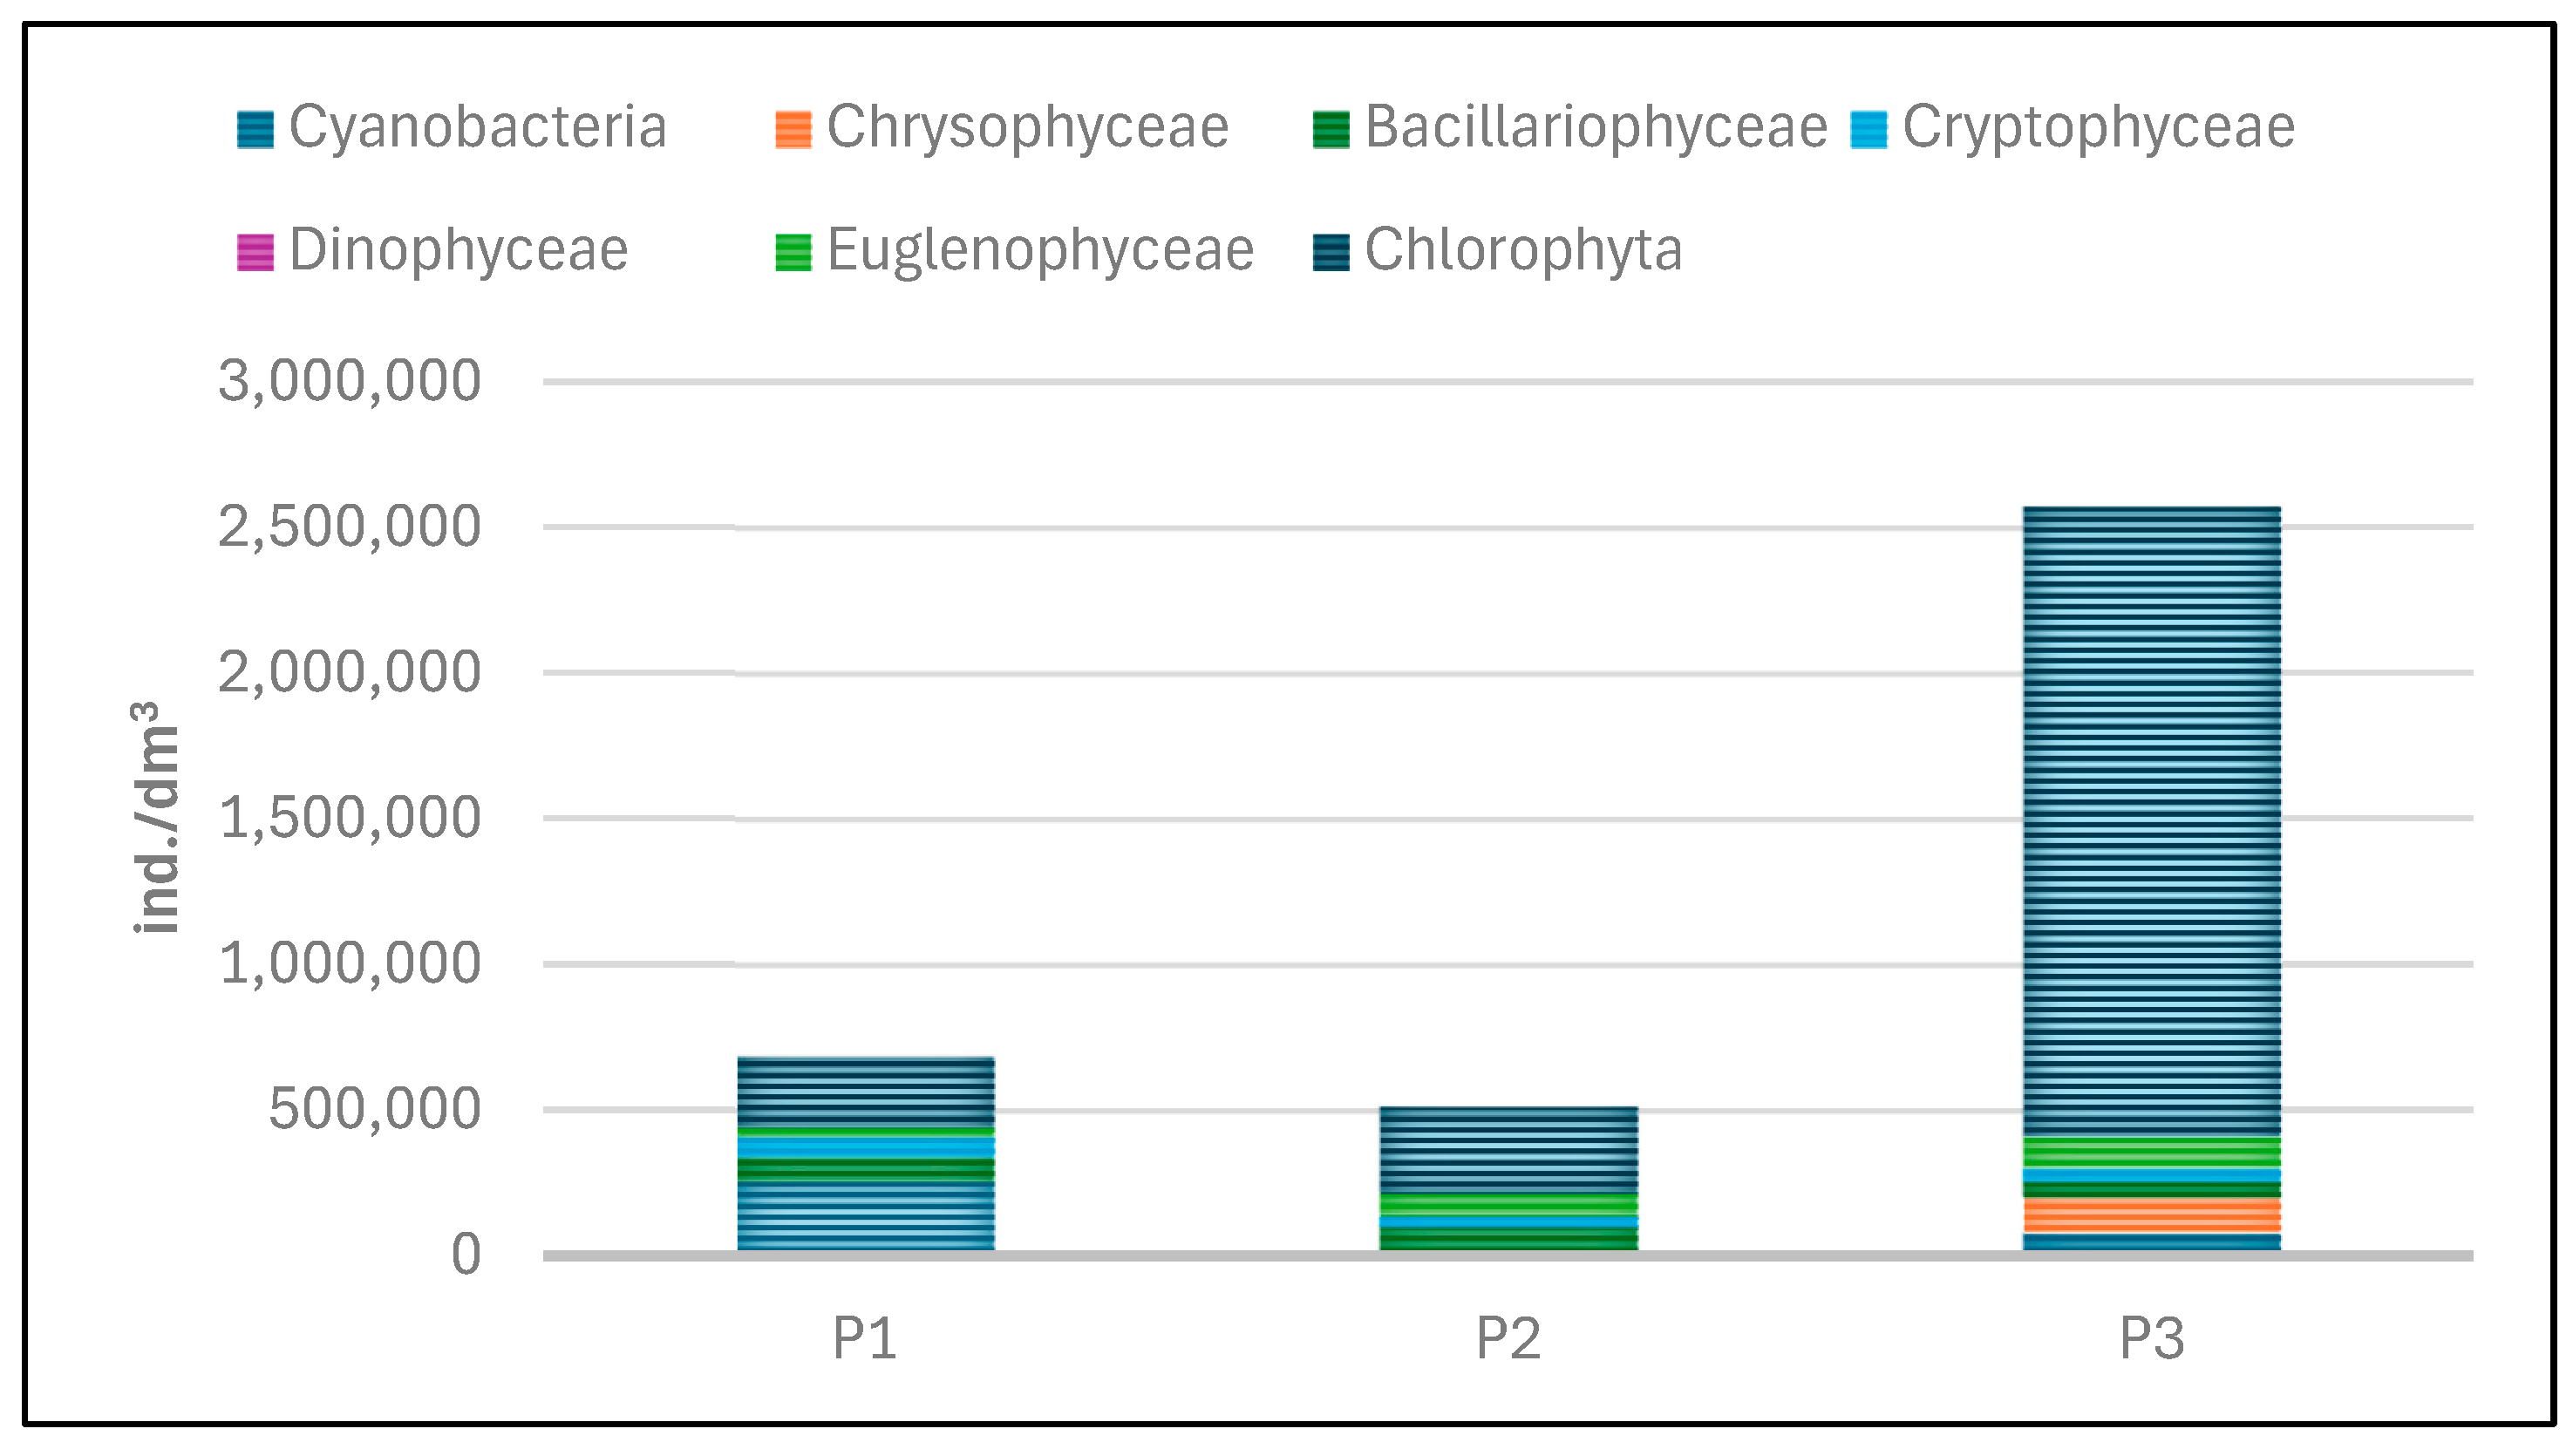
The quantitative structure of phytoplankton in the experimental reservoirs was determined based on abundance and biomass (Table 6, Figure 21 and Figure 22). Both the abundance and biomass of planktonic algae were low. The abundance of phytoplankton varied between the individual reservoirs. The total abundance of phytoplankton ranged from 512,145 individuals/dm3 in tank P2 to 2,572,336 individuals per dm3 of water in P3.
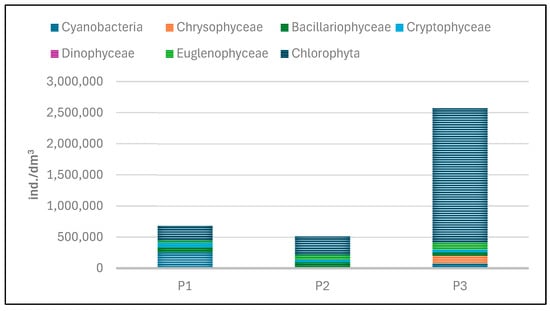
Figure 22.
Abundance of phytoplankton taxonomic groups recorded in reservoirs P1–P3 for samples collected in the 2023 season.
Lower abundance at the time of sampling was found in P1 and P2, while the highest abundance was found in P3 (Figure 22 and Figure 23). In P1, green algae and cyanobacteria had the largest share in total abundance. In the other two reservoirs (P2 and P3), green algae dominated.
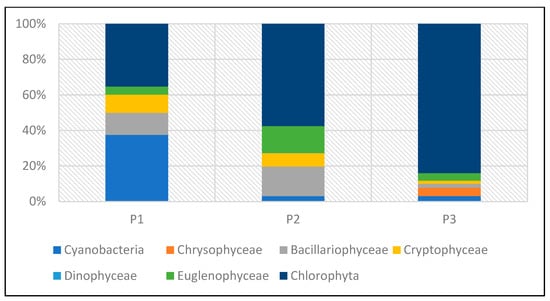
Figure 23.
Abundance of phytoplankton taxonomic groups in percent recorded in reservoirs P1–P3 for samples collected in the 2023 season.
The dominance of Chlorophyta was particularly noticeable in P3, where this group accounted for 84% of the total abundance. The high abundance of green algae in this reservoir was mainly determined by one species—Shroederia setigera (Schröd.) Lemm.
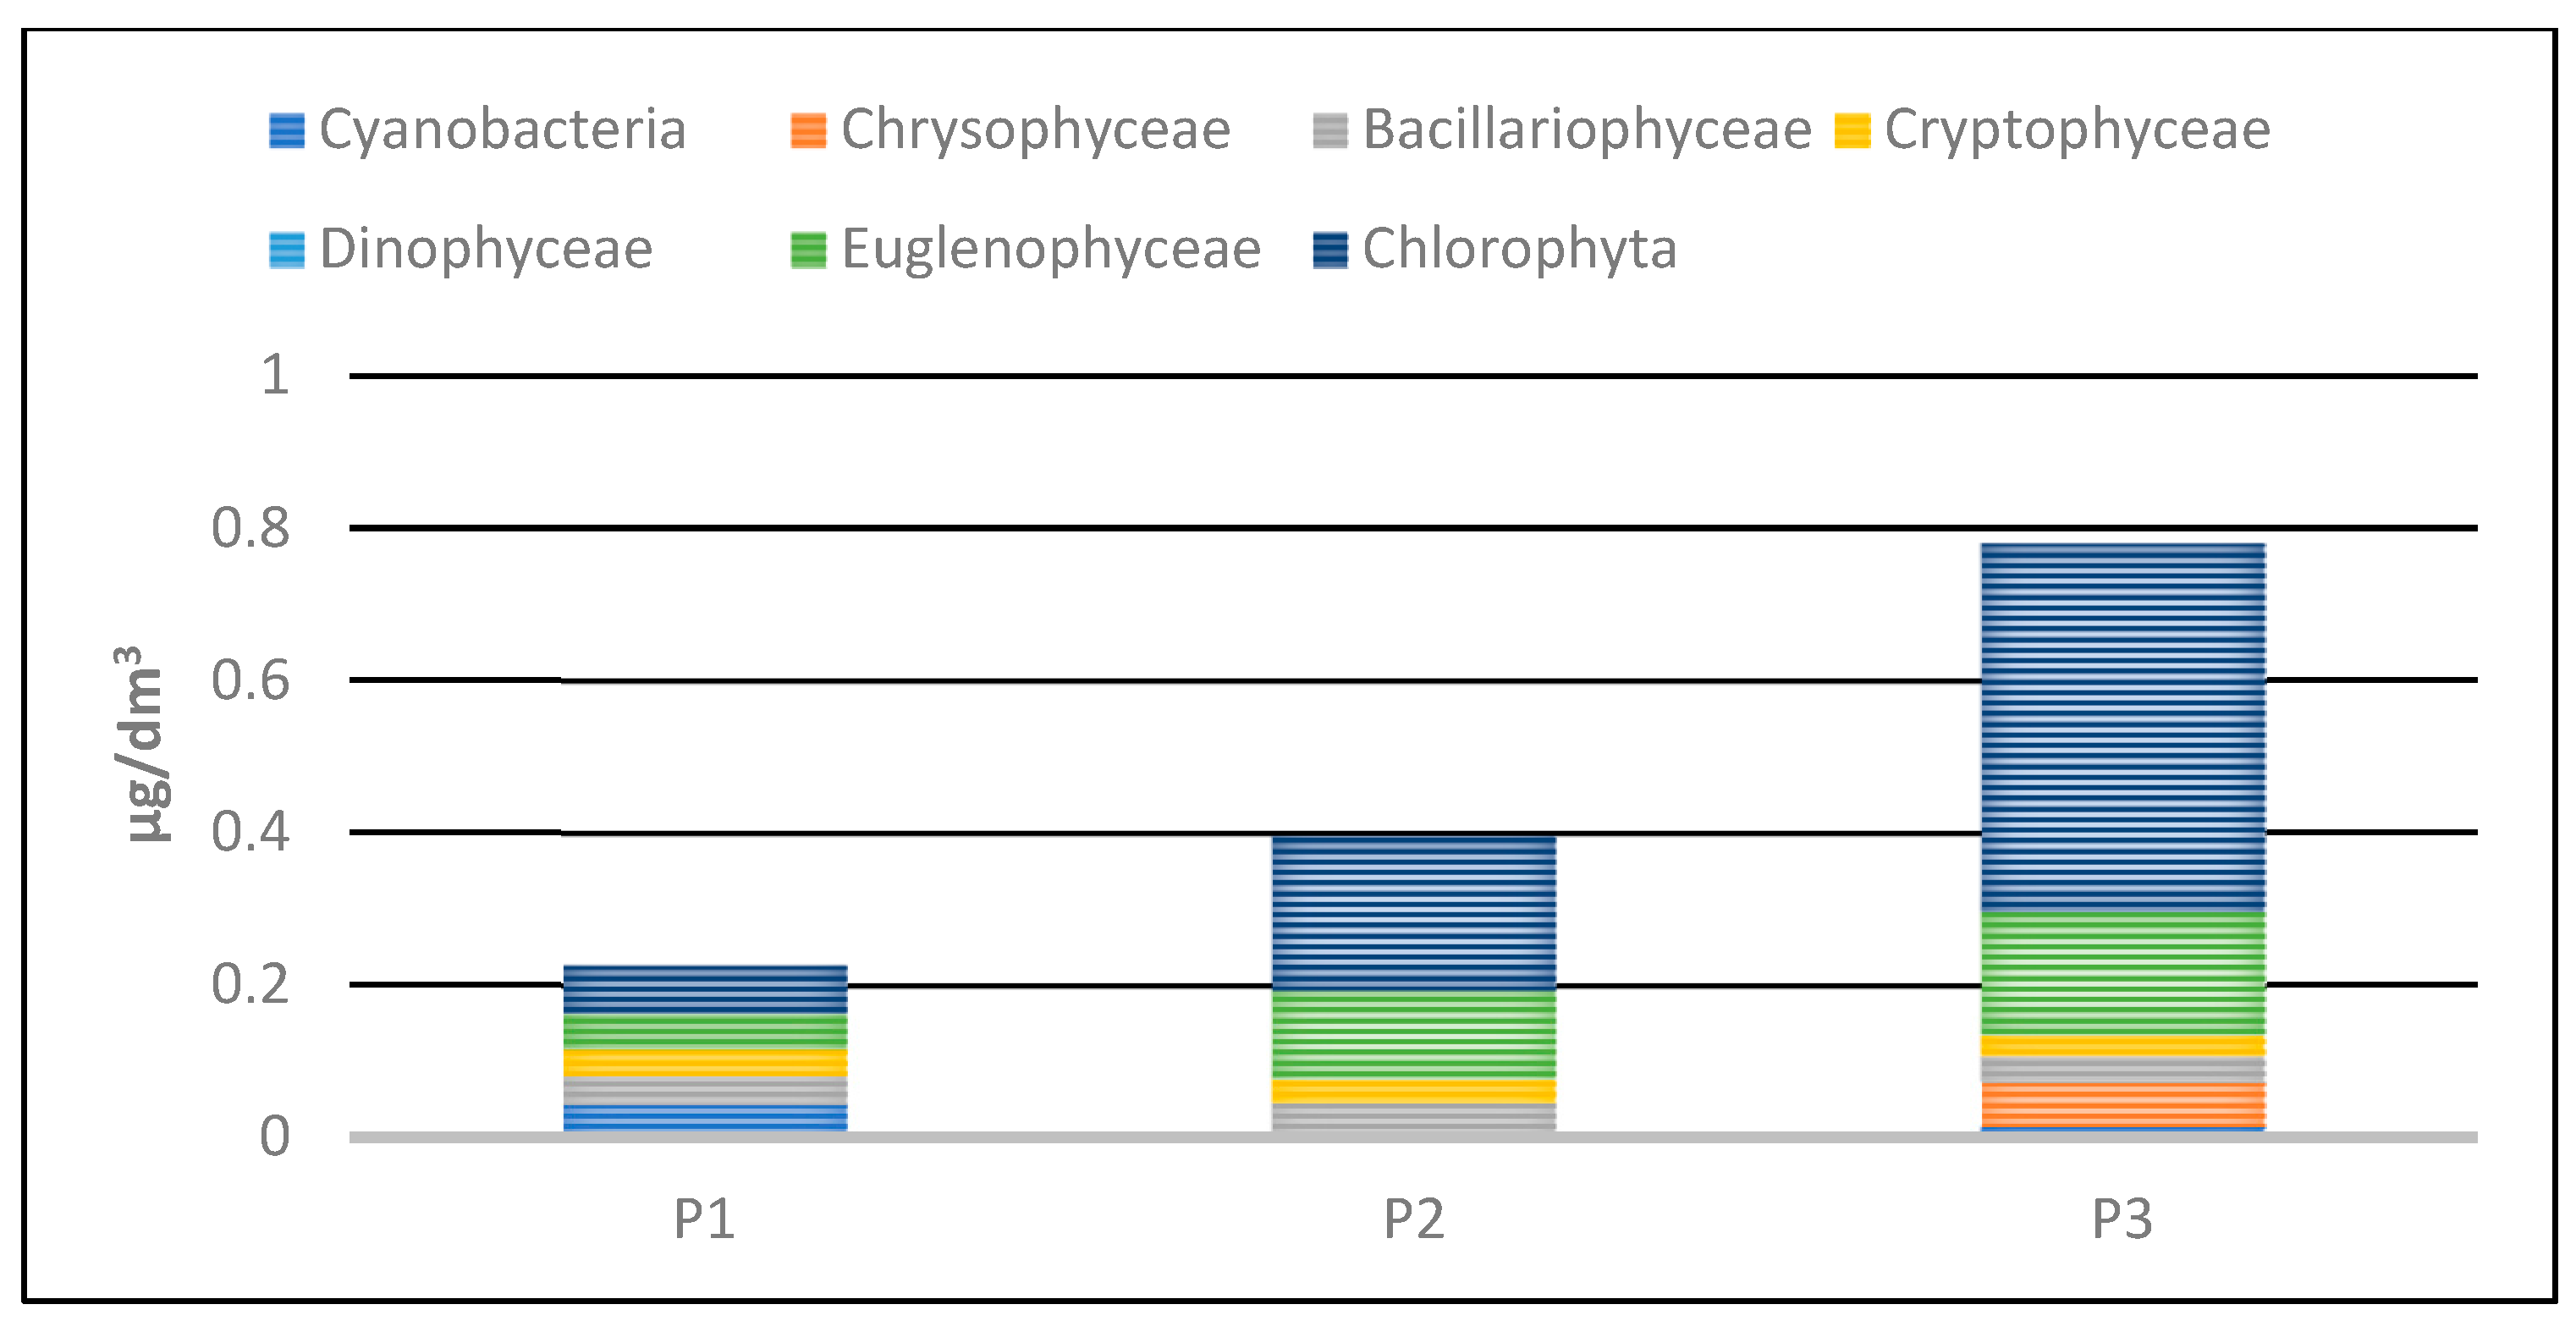
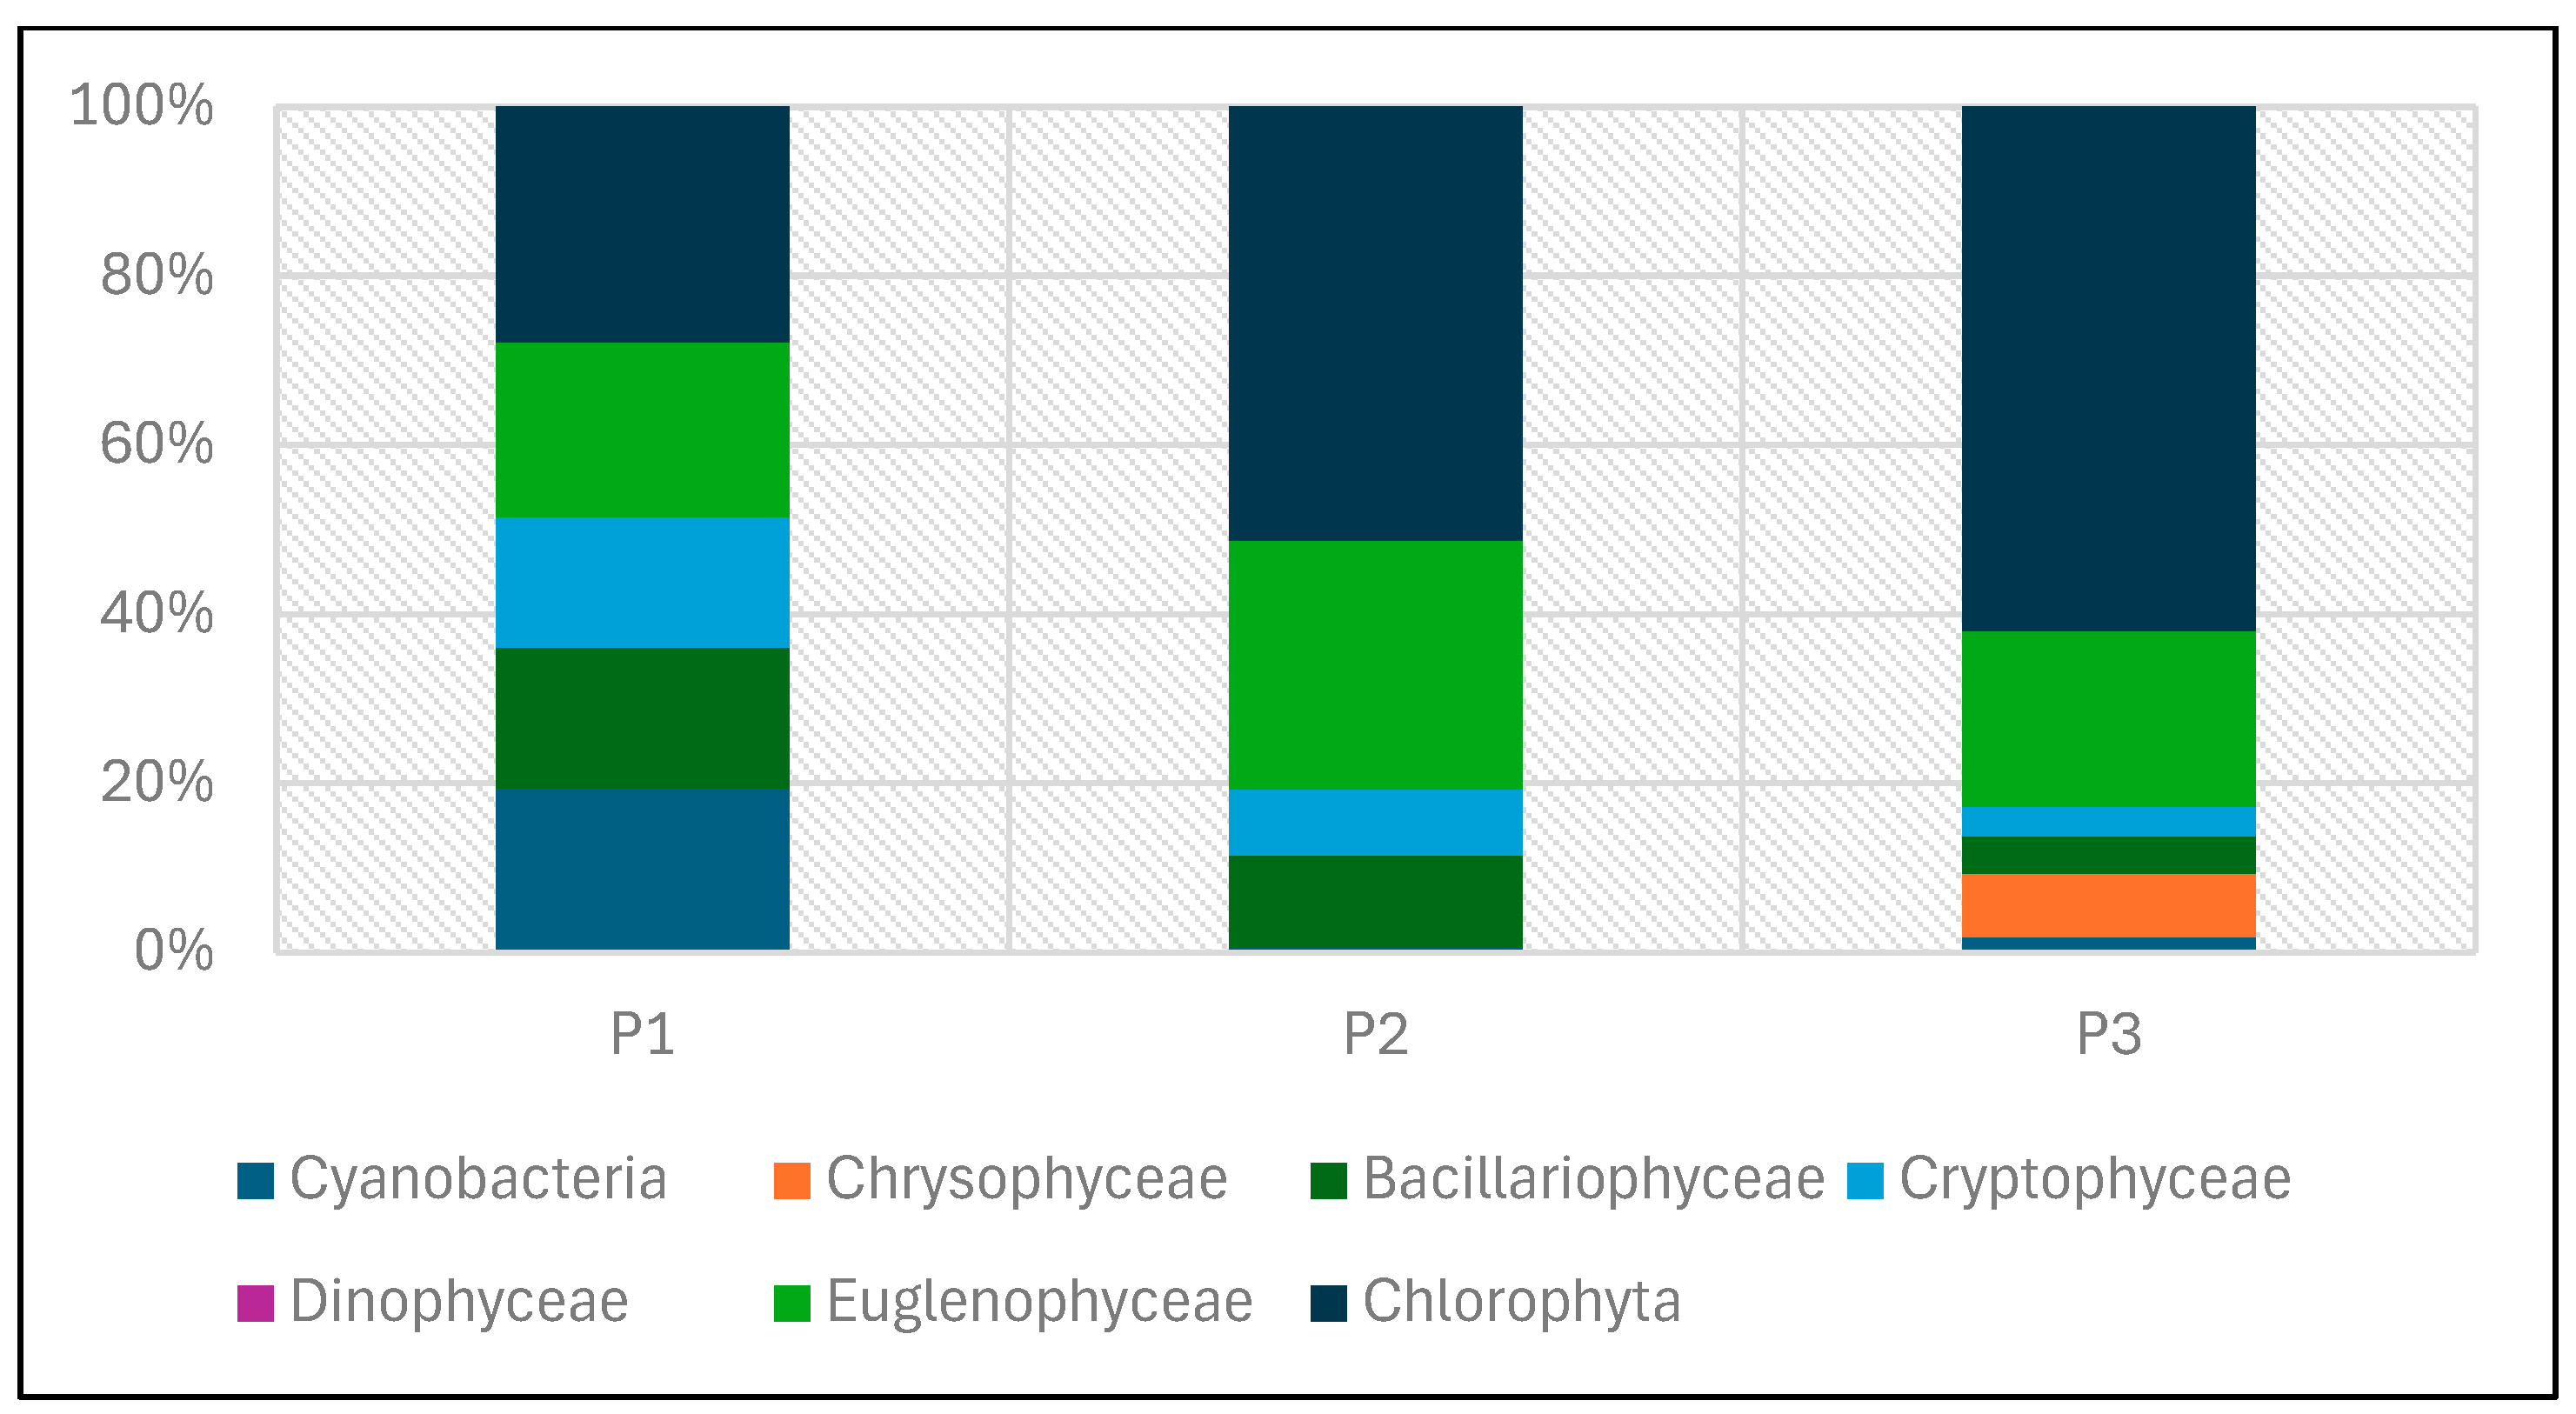
Phytoplankton biomass values in the studied reservoirs also varied (Table 5, Figure 24 and Figure 25). The lowest biomass, 0.22 mg/dm3 was found in P1, while the highest was in P3—0.8 mg/dm3. In the three studied reservoirs, green algae had the largest share in the total biomass, although in P1 the dominance of this group was not clear. In this reservoir, they accounted for 28% of the total biomass. In P2 and P3, they accounted for 51% and 62%, respectively. Eugenides were also a group with a significant quantitative share, accounting for over 20% of the biomass in all studied reservoirs.
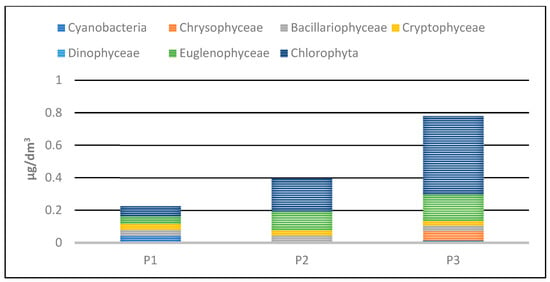
Figure 24.
Biomass of phytoplankton taxonomic groups recorded in reservoirs P1–P3 for samples collected in the 2023 season.
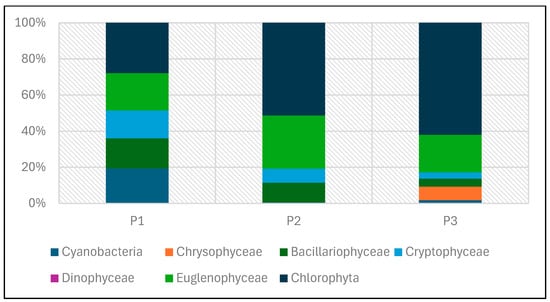
Figure 25.
Biomass of phytoplankton taxonomic groups in percent recorded in reservoirs P1–P3 for samples collected in the 2023 season.
Chlorophyll a concentrations, as an indirect indicator of phytoplankton productivity, were low and similar in the individual reservoirs studied. The range of average values for this factor was from 2.2 (P1) to 2.9 µg/dm3 (P2 and P3).
Microscopic analyses allowed the identification of 15 zooplankton species belonging to various higher taxonomic units: superorder Cladocera (4 species: 1 species—P1, 2 species—P2, 1 species—P3, mainly from the genus Chydorus sp.); superorder Copepoda (three species, one species in three reservoirs, mainly from the genus Eucyclopsis); Rotifera (four species: two species in P1 and one species in each of the other tanks, mainly from the genus Brachionus sp.) and Rhizopoda (four species: two species in P2 and one species in each of the other tanks, mainly Acanthocystis turfacea).
3.2. Efficiency Analyses of the Prototype Filtration System
Further tests and analyses were carried out to test the efficiency of the prototype water treatment system for a full-scale experimental pond (FSP) under operational load.
After its construction, it was filled with well water from the same source as before, with specifications that mostly corresponded to the standards adopted for natural swimming ponds FLL [10], see Table 8.

Table 8.
Physical and chemical parameters of well water used to fill the FSP. Red color—data above FLL standard.
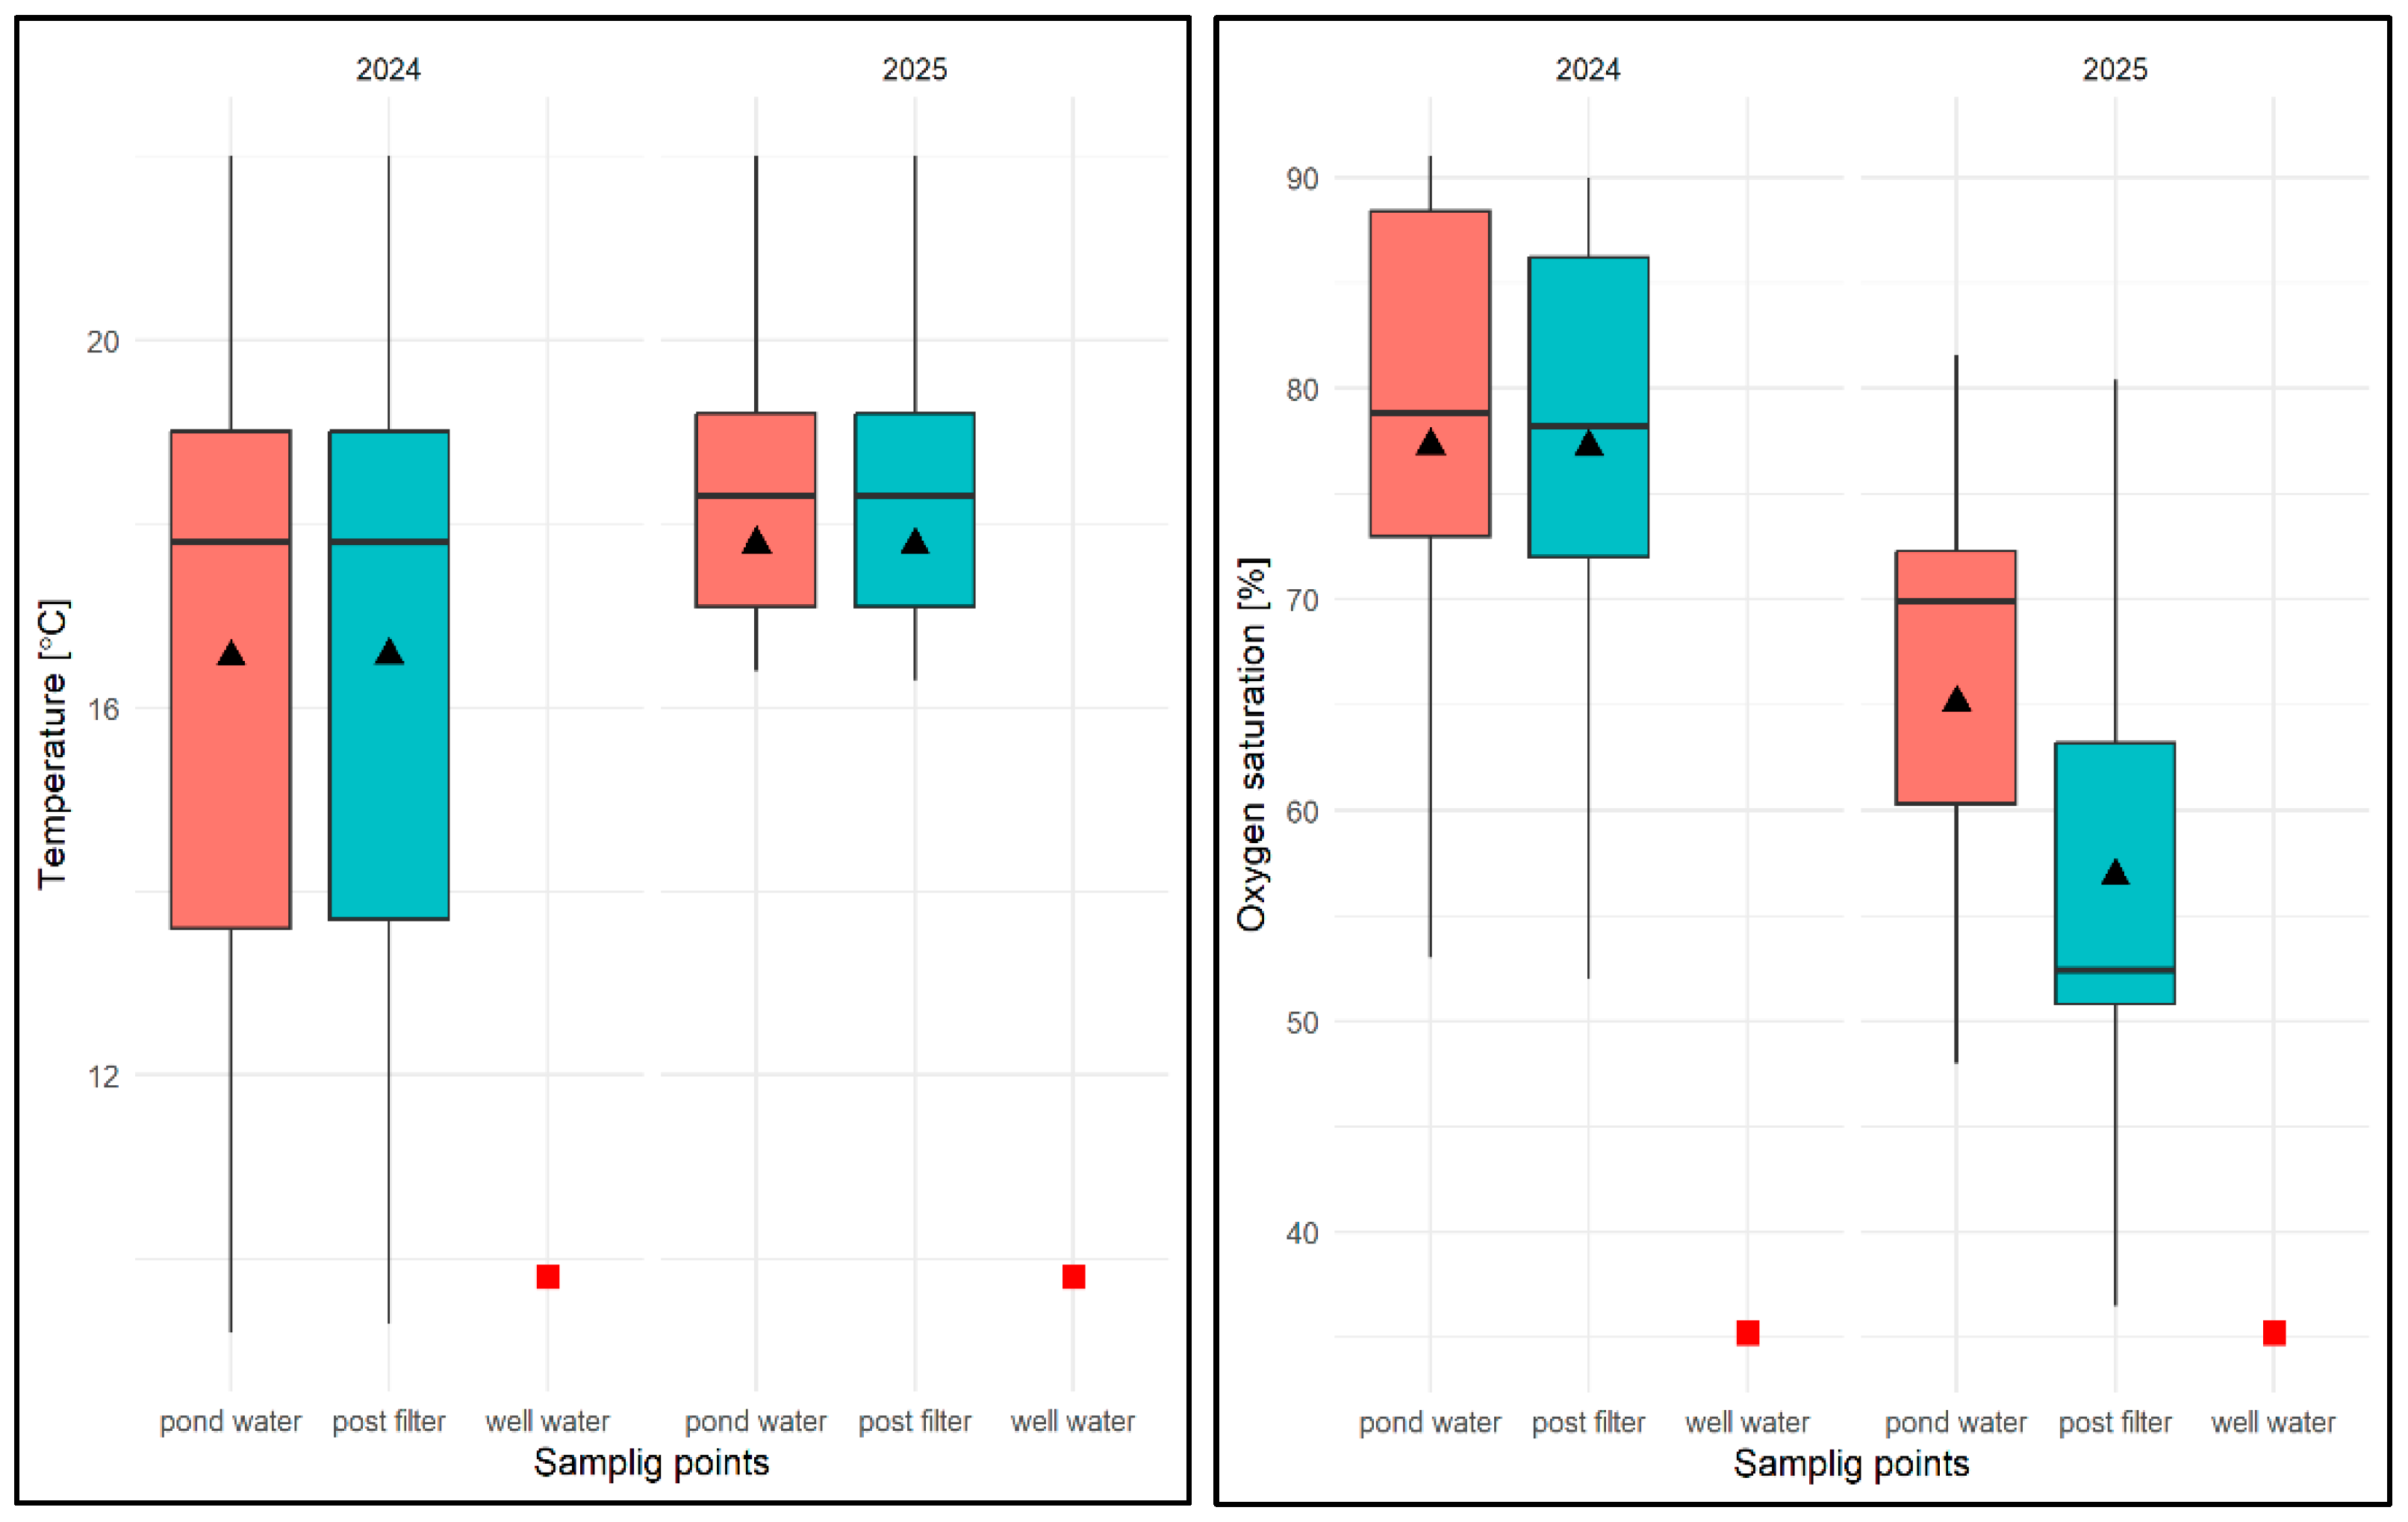
With regard to the physical and chemical analysis of water in an experimental pond of type II in 2024, it was found that the average water temperature for the entire study period was 16.56 °C, ranging from 9.2 °C (pond water) to 22.0 °C (pond water and filtrate) and was higher than in well water (9.8 °C). The average temperature from the reservoir was 16.36 °C and 16.57 °C in the filtrate (Figure 26). It was noted that the water temperature after filtration was equal to or slightly higher than the temperature of water taken directly from the pond (Figure 26). In terms of seasonal variation, the lowest water temperatures were expected in the spring months (March–May) and the highest in the summer months (July–August), regardless of the sampling location. In 2025, the average for the study period was 17.77 °C, ranging from 10.8 °C (pond water) to 22.0 °C (pond water and filtrate). The average temperature of pond water in that year was 17.73 °C, and that of the filtrate was 17.76 °C. In contrast to the previous year, it was noted that the temperature of the filtered water was equal to or slightly lower than the temperature of the water taken directly from the pond (by 0.1 °C). With regard to seasonal distribution (covering only the first half of the year), it was similar to the previous year.
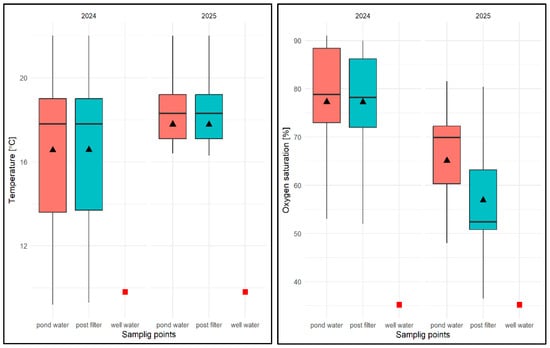
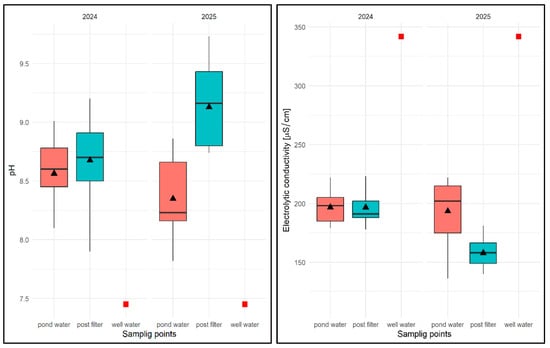
Figure 26.
Values of selected physical and chemical parameters of water: temperature, OS, pH, and EC for FSP and two sampling sites against the chemical specification of well water taken for replenishment in 2024 and 2025. Description as in Figure 13.
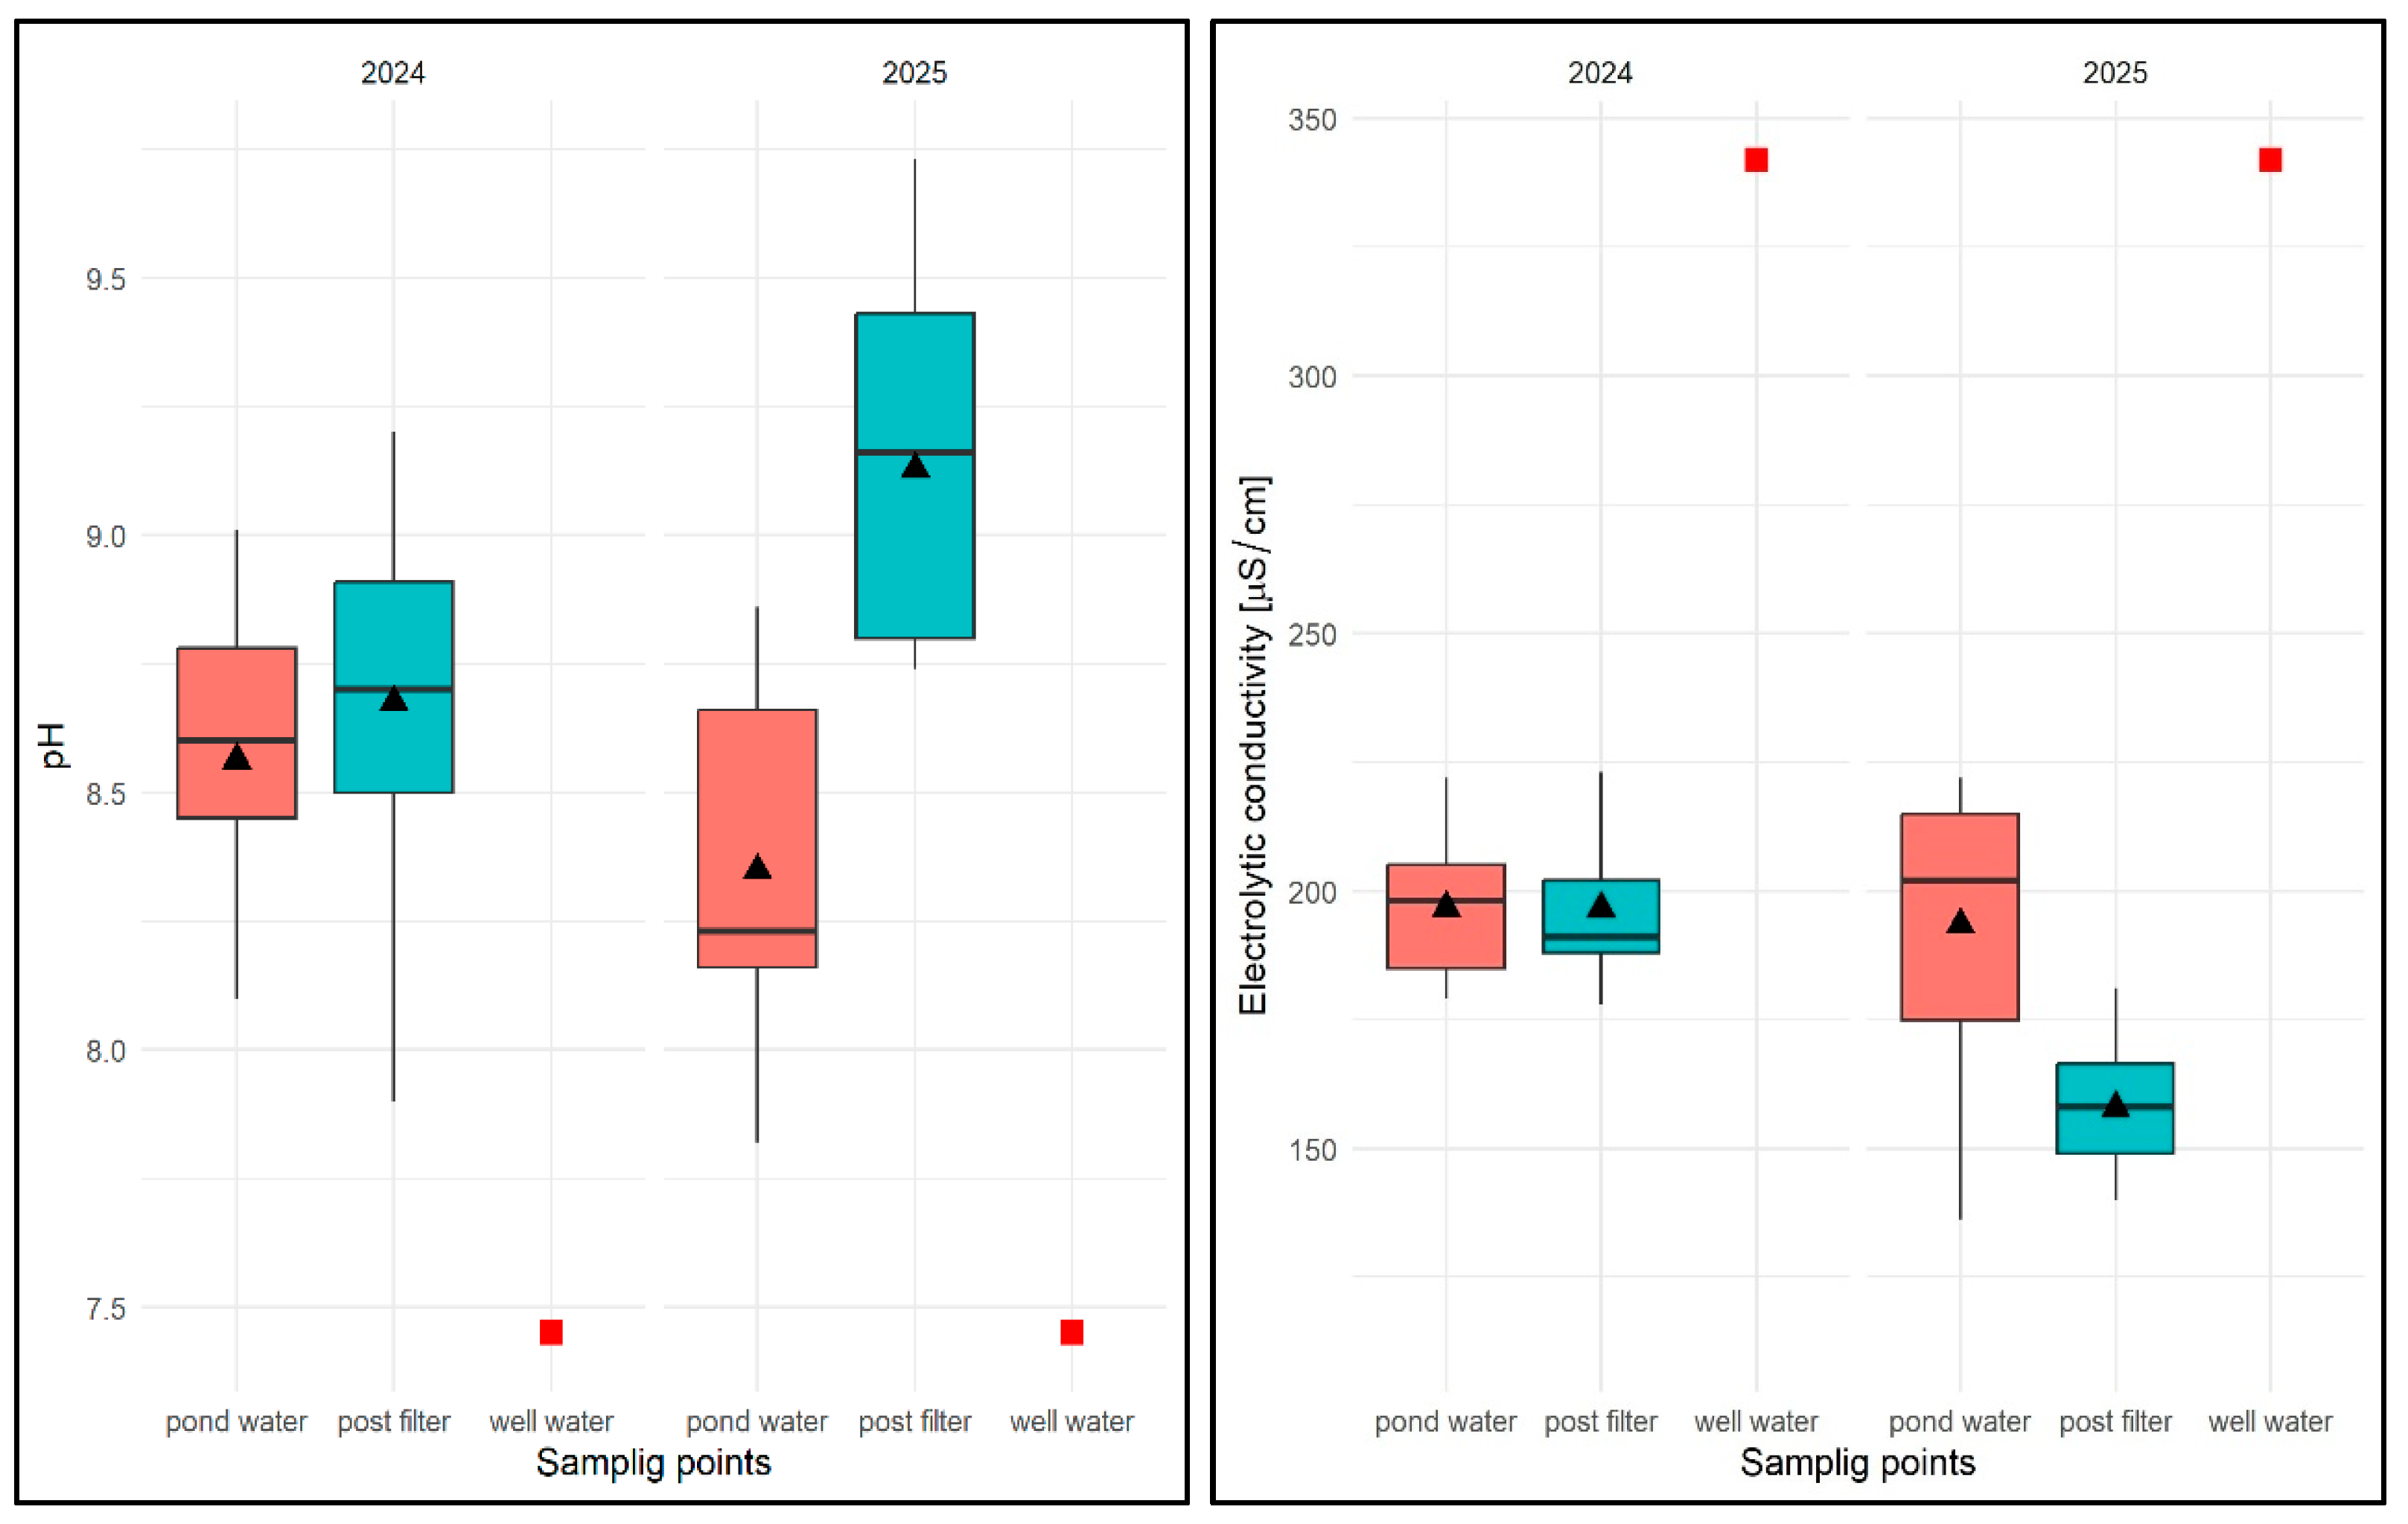
In the case of oxygen saturation (OS) concentration in water, the average for the entire study period in 2024 was 77.1%, ranging from 45.0% (pond water) to 91% (pond water) and was higher than in well water (35.2%). The average OS from the pond was 73.86%, while in the filter it was 76.87%, which, however, did not allow for the identification of consistent patterns in the temporal distribution of results in relation to the sampling location. In terms of seasonality, lower OS values were recorded in spring, the highest in summer, and in autumn these values ranged from 71.0 to 81%. In the following year, the values of this parameter averaged 61.8% for the entire study period, ranging from 48% (pond water) to 81.6% (pond water). The average OS value in pond water was 64.81%, and in filtered water 57.4% (Figure 26). No regularity in the distribution of OS values was found for the sampling site. In terms of seasonality (first half of the year), the highest values were recorded in April and May. In the remaining months, these values varied between 35.3% and 76.0%.
With regard to pH, the average value of this parameter for the 2024 season was pH = 8.61, ranging from 7.82 (pond water) to 9.2 (filtrate), with an average value for pond water of pH = 8.50 and an average value for filtrate of pH = 8.67, which was higher than in well water (pH = 7.45)—Figure 26. Higher values were always found for subsequent pH measurements in water after filtration through a mineral bed. In terms of seasonality, the lowest pH values were recorded at the beginning of the spring season (March–May) for both sampling sites, and then these values remained high in the range of pH = 8.48–9.2 in the following months. In 2025, the average pH value was 8.73, ranging from 7.2 (pond water) to 9.73 (filtrate), with an average pH of 8.29 for pond water and 9.12 for water after mineral filtration (Figure 26). As in the previous year, the pH values for subsequent test dates were higher in the filtered water. In the early spring months, the pH values for both sites were lower, ranging from 7.82 to 8.82. In the following months, the pH of the pond water ranged from pH = 8.16–8.66, and in the case of the filtrate, from the end of April to the end of June, pH > 9.0.
For the EC factor, the average for the 2024 season was EC = 196.64 µS/cm, with a range of 178 µS/cm (filtrate) to 217 µS/cm (filtrate), with an average EC of 198.8 µS/cm for pond water and 196.58 µS/cm for filtered water and was lower than in well water EC = 342 µS/cm (Figure 26). No regularities were found in the distribution of EC values for different sampling sites—they were varied. In the case of seasonal analysis, the initial higher EC values associated with the specific characteristics of well water fell to EC = 202 µS/cm, and between the end of June and the end of August, they exceeded 200 µS/cm regardless of the sampling site, and then fell to between 188 and 198 µS/cm. In 2025, the average EC value was 175.71 µS/cm, ranging from 114.2 µS/cm (filtered water) to 222 µS/cm (pond water), with an average of 198.58 µS/cm for pond water and 157.9 µS/cm for the filtrate (Figure 26). The lower EC values were found to be consistent for subsequent test dates in water after filtration with a mineral bed. Seasonally, however, no regularities were found—the results varied regardless of the season.
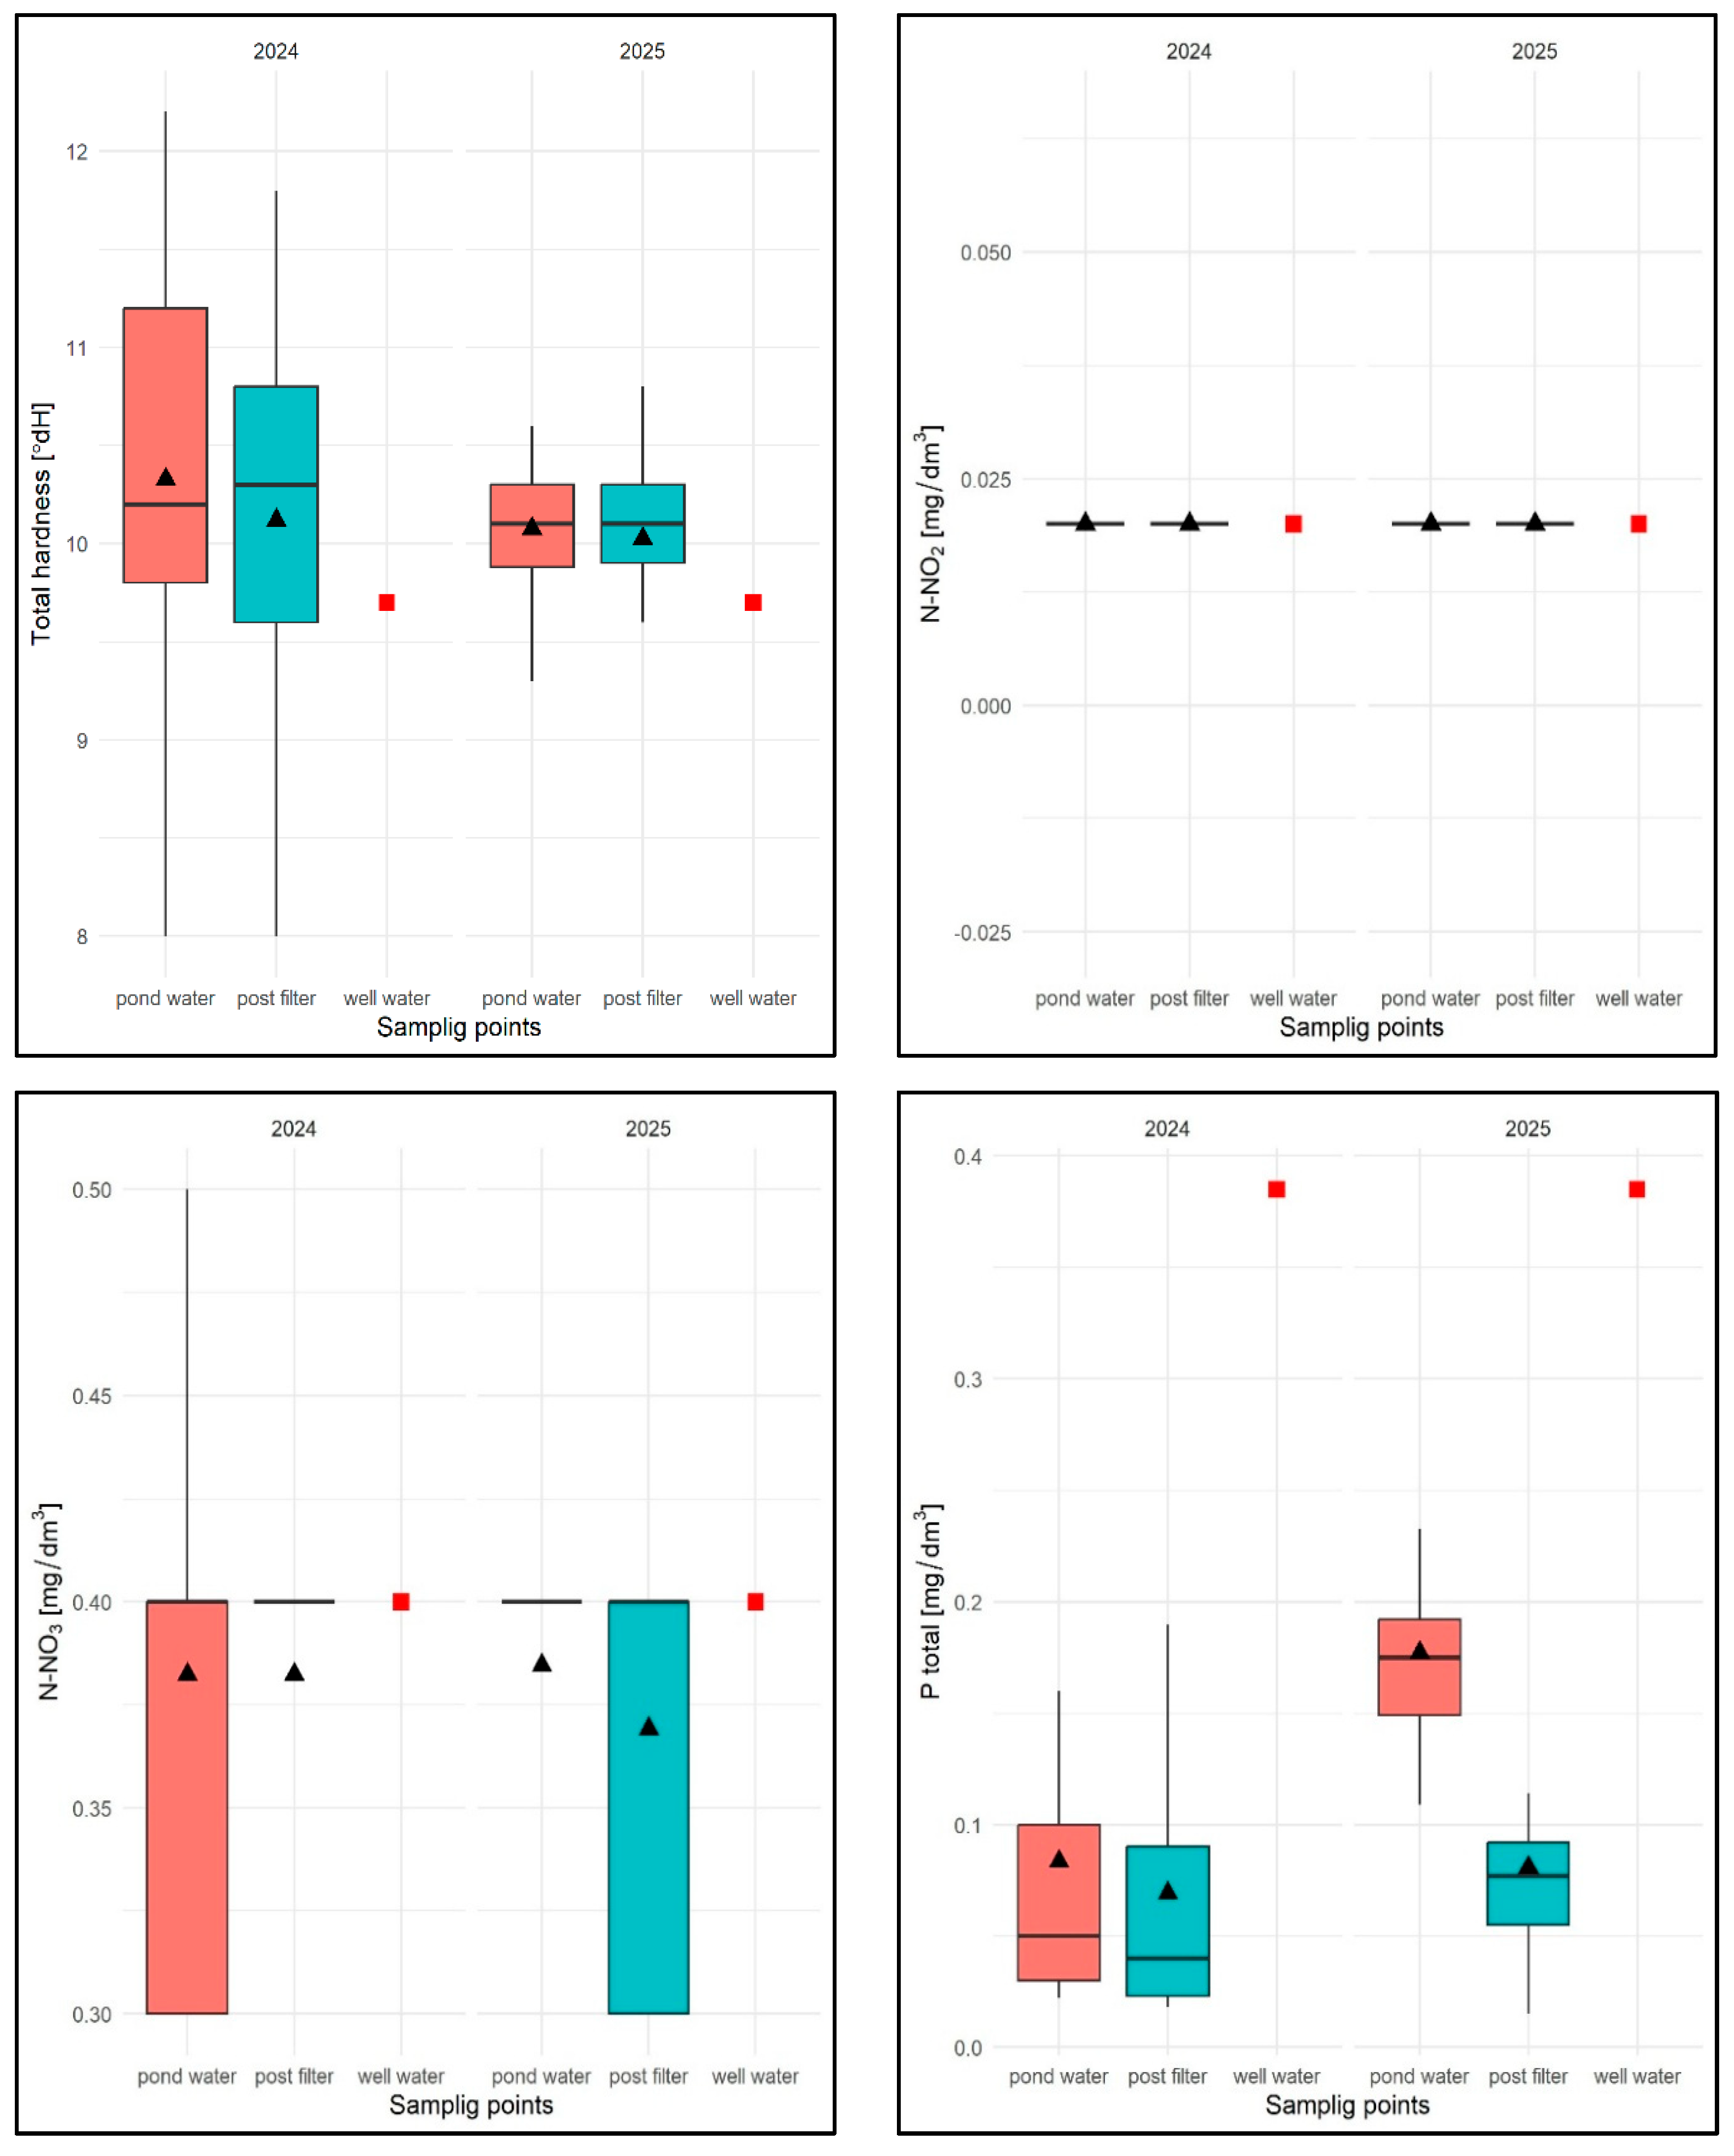
For the TH parameter, the average value for the 2024 season was 10.22 °dH with a range of 8.0 °dH (pond water) to 12.1 °dH (pond water), with an average of 10.30 °dH for pond water and 10.11 °dH for filtered water and was higher than in well water TH = 9.9 °dH (Figure 27). No regularity in the distribution of TH values was observed for the sampling sites, either in terms of seasonality or in terms of results.
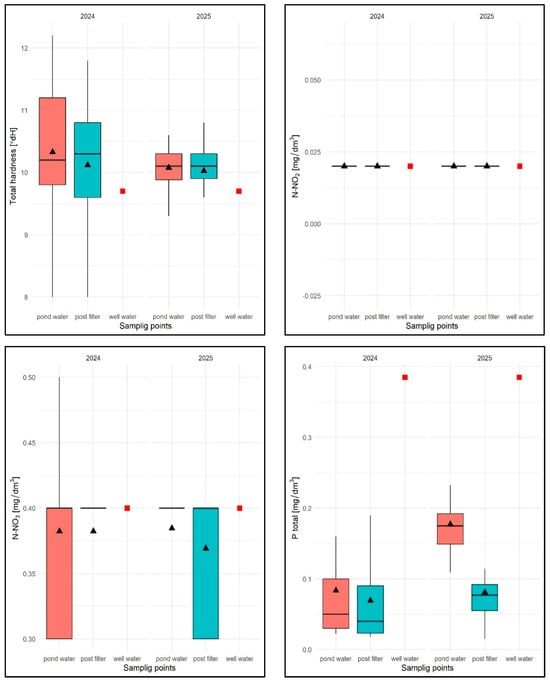
Figure 27.
Values of selected physical and chemical parameters of water: TH, N-NO2, N-NO3, Ptotal for FSP and two sampling sites against the chemical specification of well water taken for replenishment in 2024 and 2025. Description as in Figure 13.
In 2025, the average TH value was 10.05 °dH, ranging from 8.9 (filtrate) to 11 °dH (pond water), with an average of 10.04 °dH for pond water and 10.05 °dH for filtrate (Figure 27). Similarly, no regularity was found in the distribution of this parameter in relation to the sampling sites or in terms of seasonality.
The N-NO2 parameter, as in the previous experimental task, took a constant value for well water, water from the water surface, and water after chamber filtration in subsequent tests: 0.02 mg/dm3 (Figure 27).
The N-NO3 parameter, in turn, took an average value of 0.4 mg/dm3 in 2024, ranging from 0.3 mg/dm3 (pond water and filtrate) to 0.5 mg/dm3 (reservoir), with an average for pond water of 0.4 mg/dm3 and an average for filtrate of 0.38 mg/dm3 and was identical to that in well water (Figure 27).
These values corresponded to those in well water (0.4 mg/dm3). No regularity was found in relation to the sampling locations—the values varied both between them and seasonally. It should be added that the median for all seasons of the study was 0.4 mg/dm3 (Figure 27).
In 2025, the average value of this parameter was 0.39 mg/dm3 ranging from 0.3 mg/dm3 to 0.4 mg/dm3 (pond water and filtrate), with an average of 0.38 mg/dm3 for pond water and an average of 0.4 mg/dm3 for filtrate. The distribution of values was as varied as in the previous year, with no regularity, both for the sampling sites and in terms of seasonality.
For the Ptotal parameter in 2024, the average value was 0.076 mg/dm3, ranging from 0.017 mg/dm3 (filtrate) to 0.28 mg/dm3 (pond water), with an average of 0.091 mg/dm3 for pond water and 0.069 mg/dm3 for filtered water, and was lower for well water (0.385 mg/dm3)—Figure 27. For subsequent test dates, the regularity distribution of lower Ptotal values for filtered water was found (Figure 27).
In the case of seasonal distribution from early spring to the end of June, this parameter for pond water gradually decreased in the range of 0.301 mg/dm3 to 0.021 mg/dm3, and in the following months it had more varied values in the range of 0.018 mg/dm3 to 0.1 mg/dm3.
In 2025, Ptotal took an average value of 0.126 mg/dm3, ranging from 0.015 mg/dm3 (filtrate) to 0.308 mg/dm3 (pond water), with an average of 0.182 mg/dm3 for pond water and 0.080 mg/dm3 for filtered water.
As in the previous year, for the subsequent test dates, a lower Ptotal value was found in the filtrate. Seasonal analyses did not reveal any regularities in the distribution of this parameter. In pond water, Ptotal values varied regardless of the sampling date and were always lower in the filtrate.
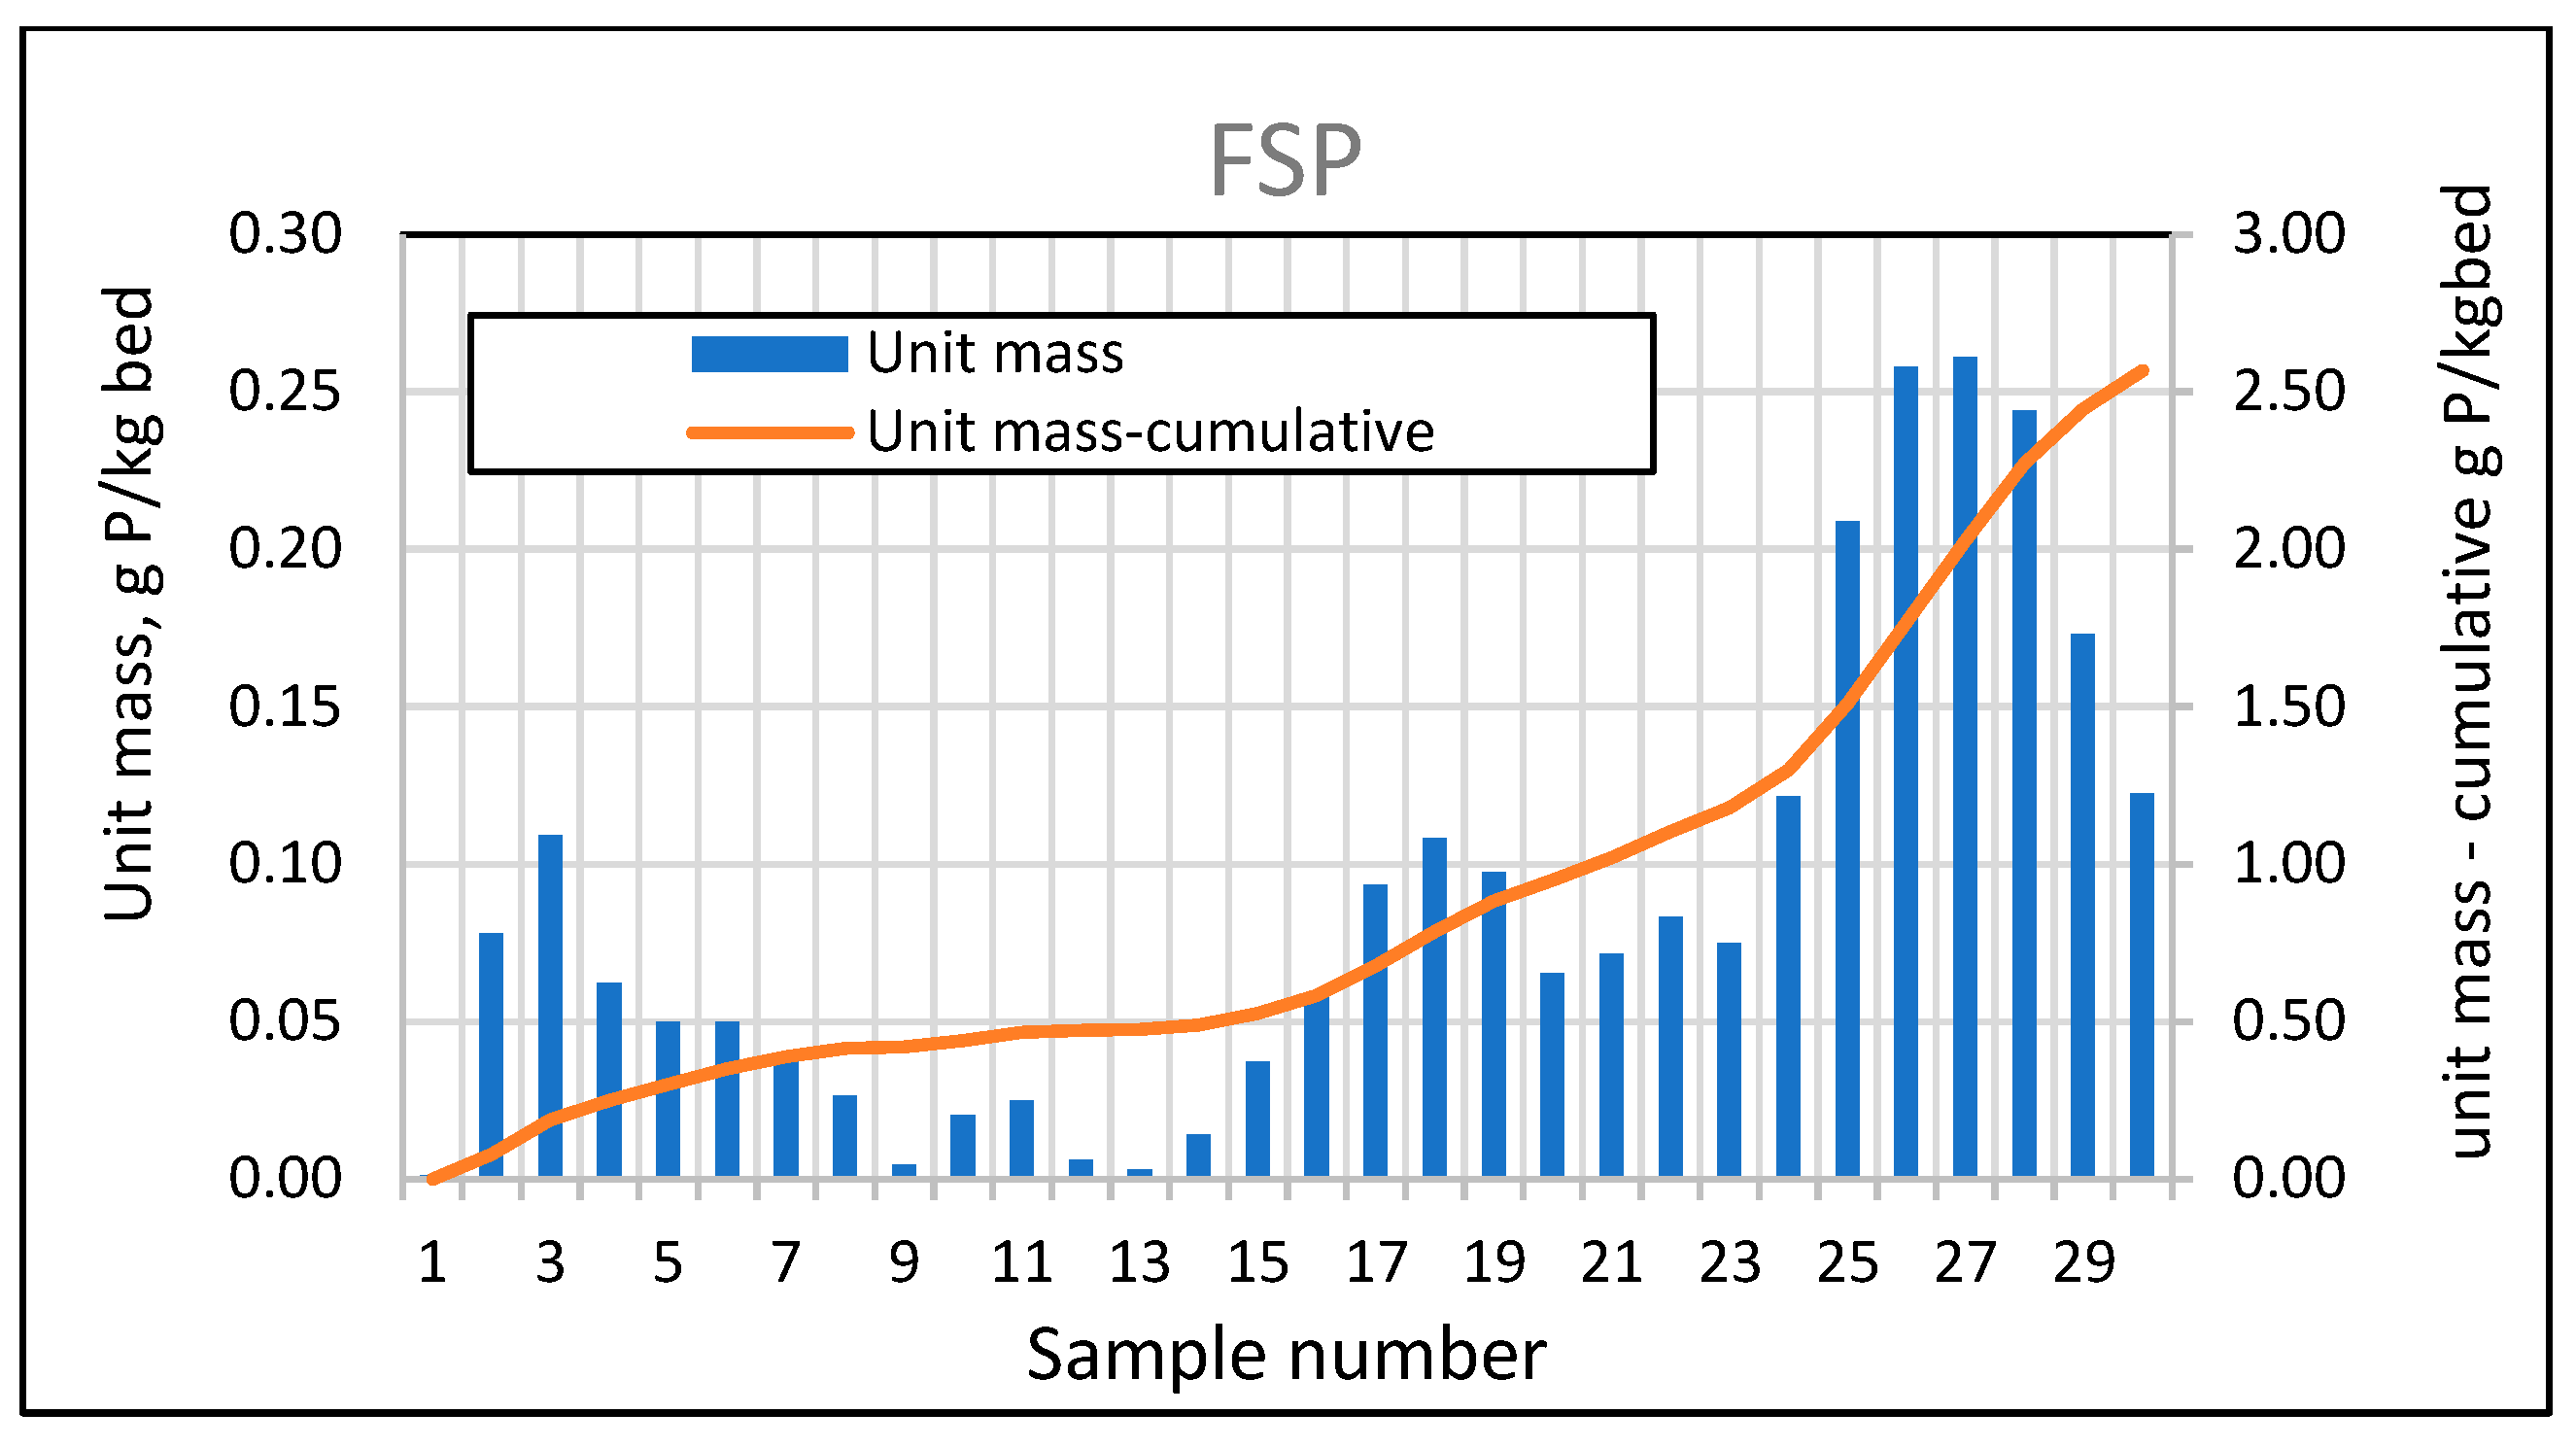
For a full-size swimming pond with a selected filtration rate of 5 m/h, extended tests were also carried out on the phosphorus adsorption efficiency and bed absorptivity, performed in the same way as for the analysis of the effective filtration rate for the three experimental ponds. The average phosphorus adsorption efficiency in 2024 was 18.28%, while in 2025 it was already 53.98%, with a tendency towards lower values in the summer period. An analysis of the variability of the mass of phosphorus absorbed by the bed (Figure 26) also confirms that its absorption efficiency decreases during the summer months.
The above observations are confirmed by the very low bar heights between measurements 8 (7 June 2024) and 14 (30 August 2024). A significant decrease can also be observed in 2025, as samples 29 and 30 were taken on 3 June 2025, and 10 June 2025. Significant favorable changes were observed only in the second year of operation (see Figure 28).
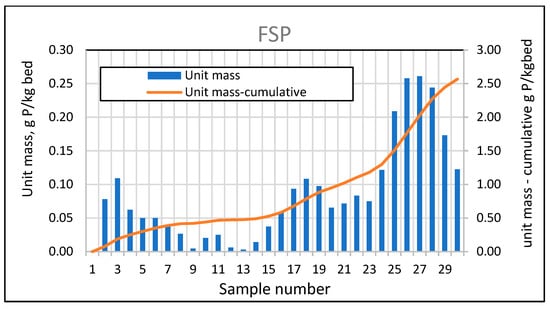
Figure 28.
Phosphorus absorbed by the mineral bed for FSP between sampling points and cumulative masses during the study period.
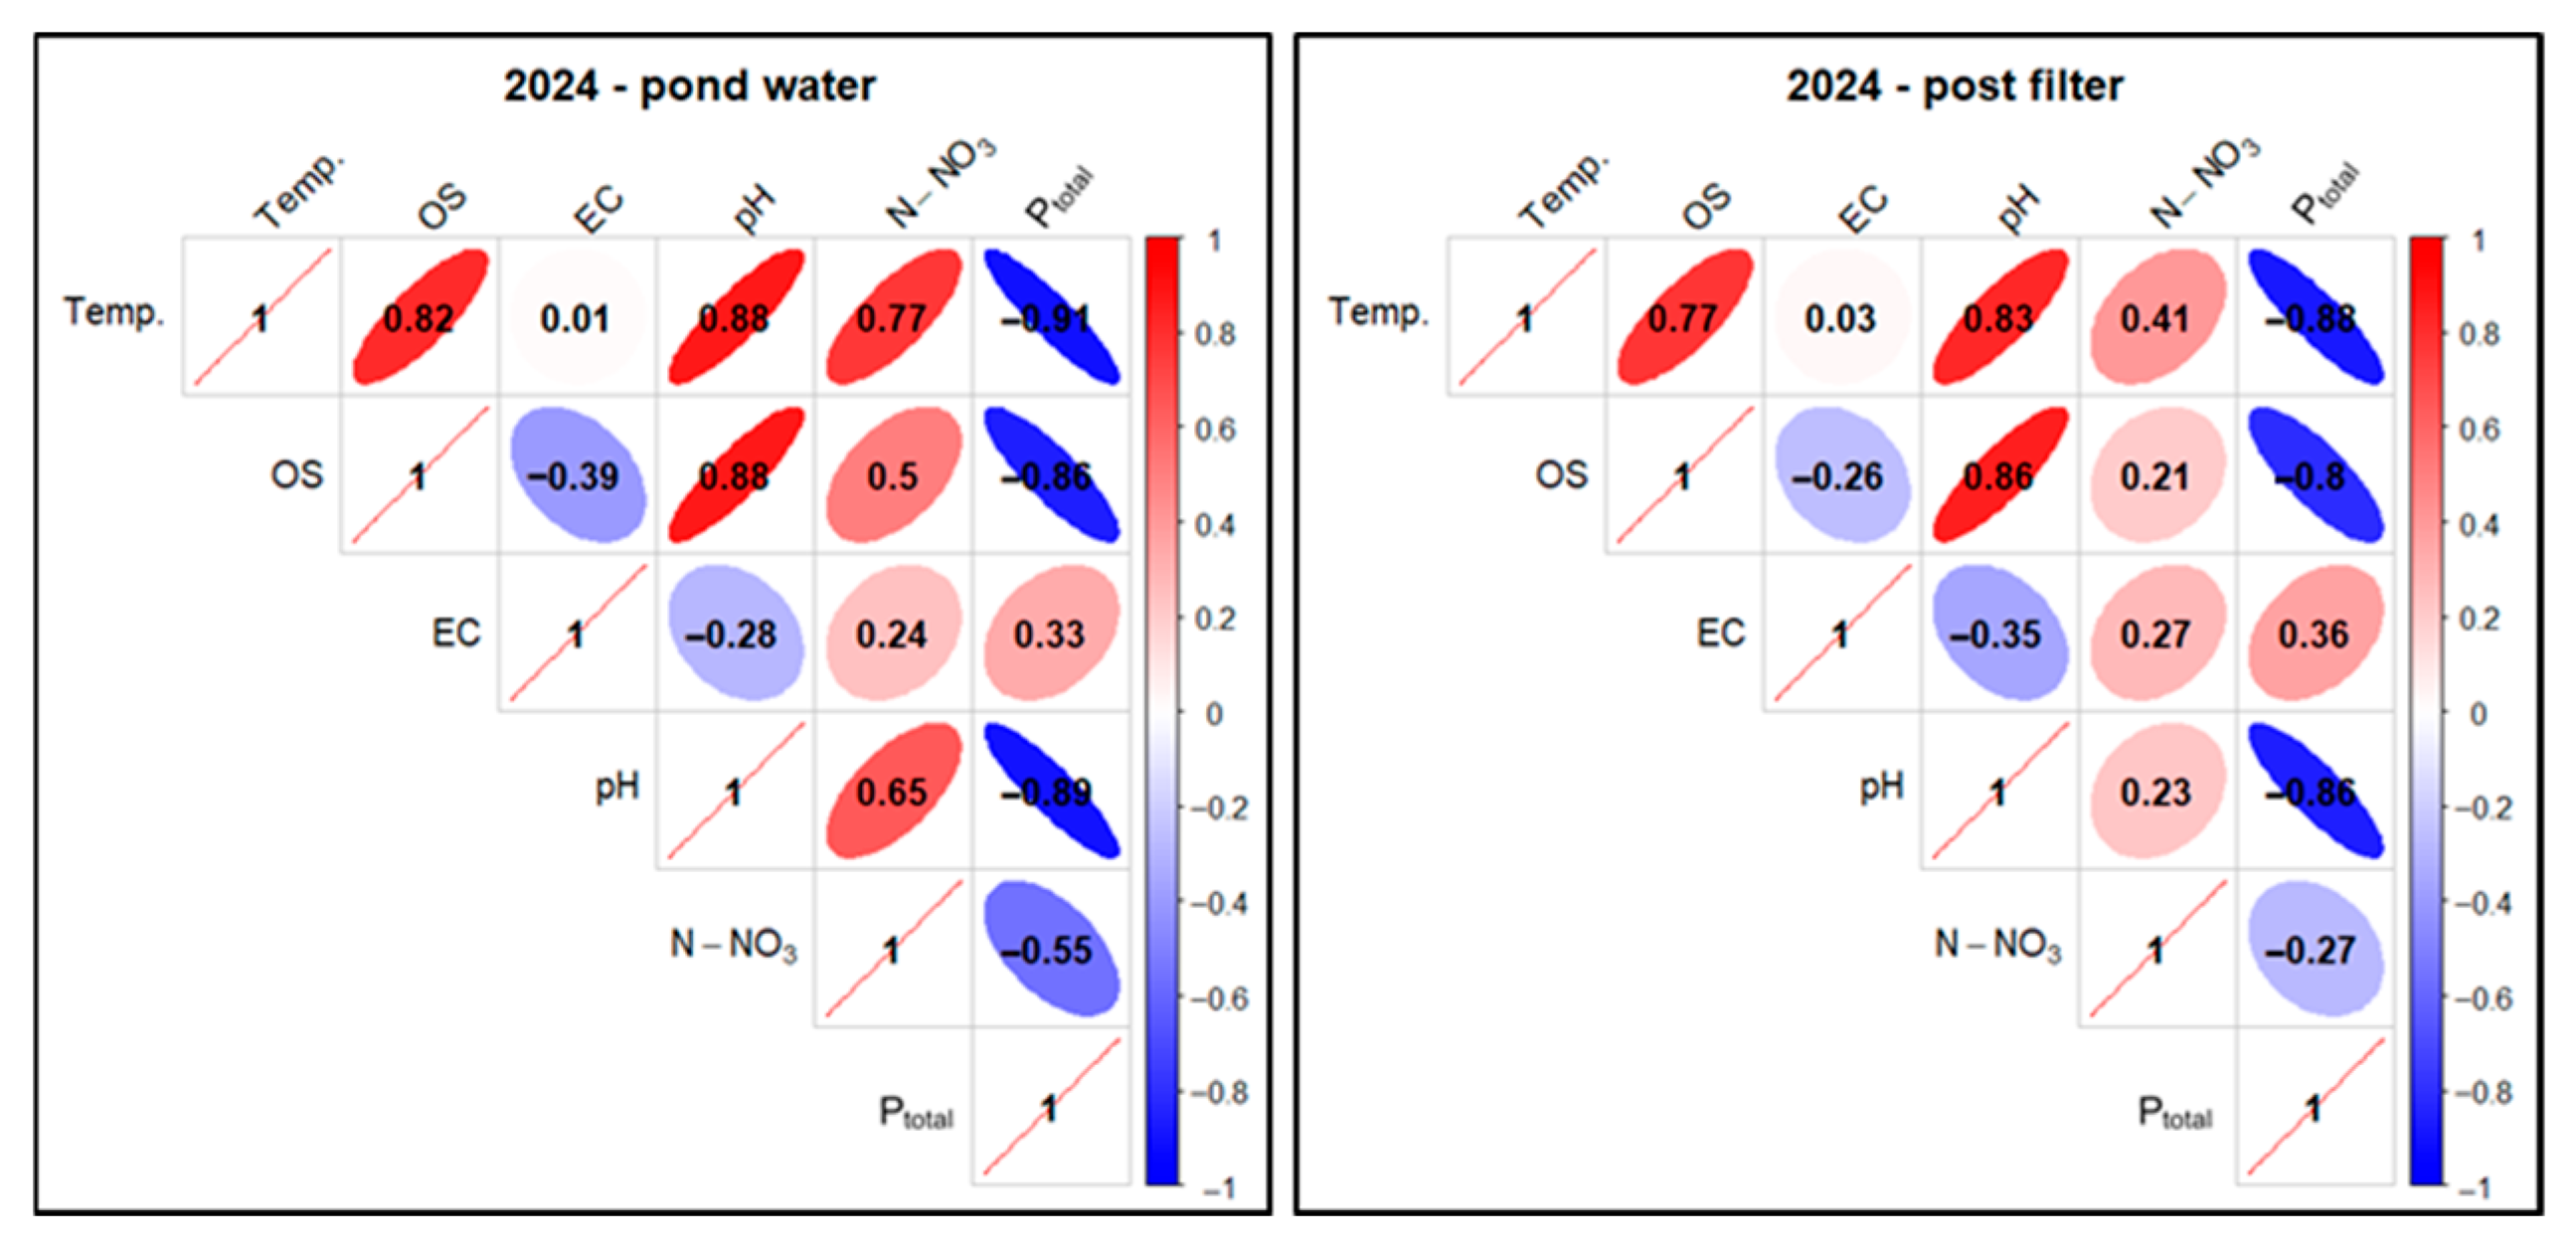
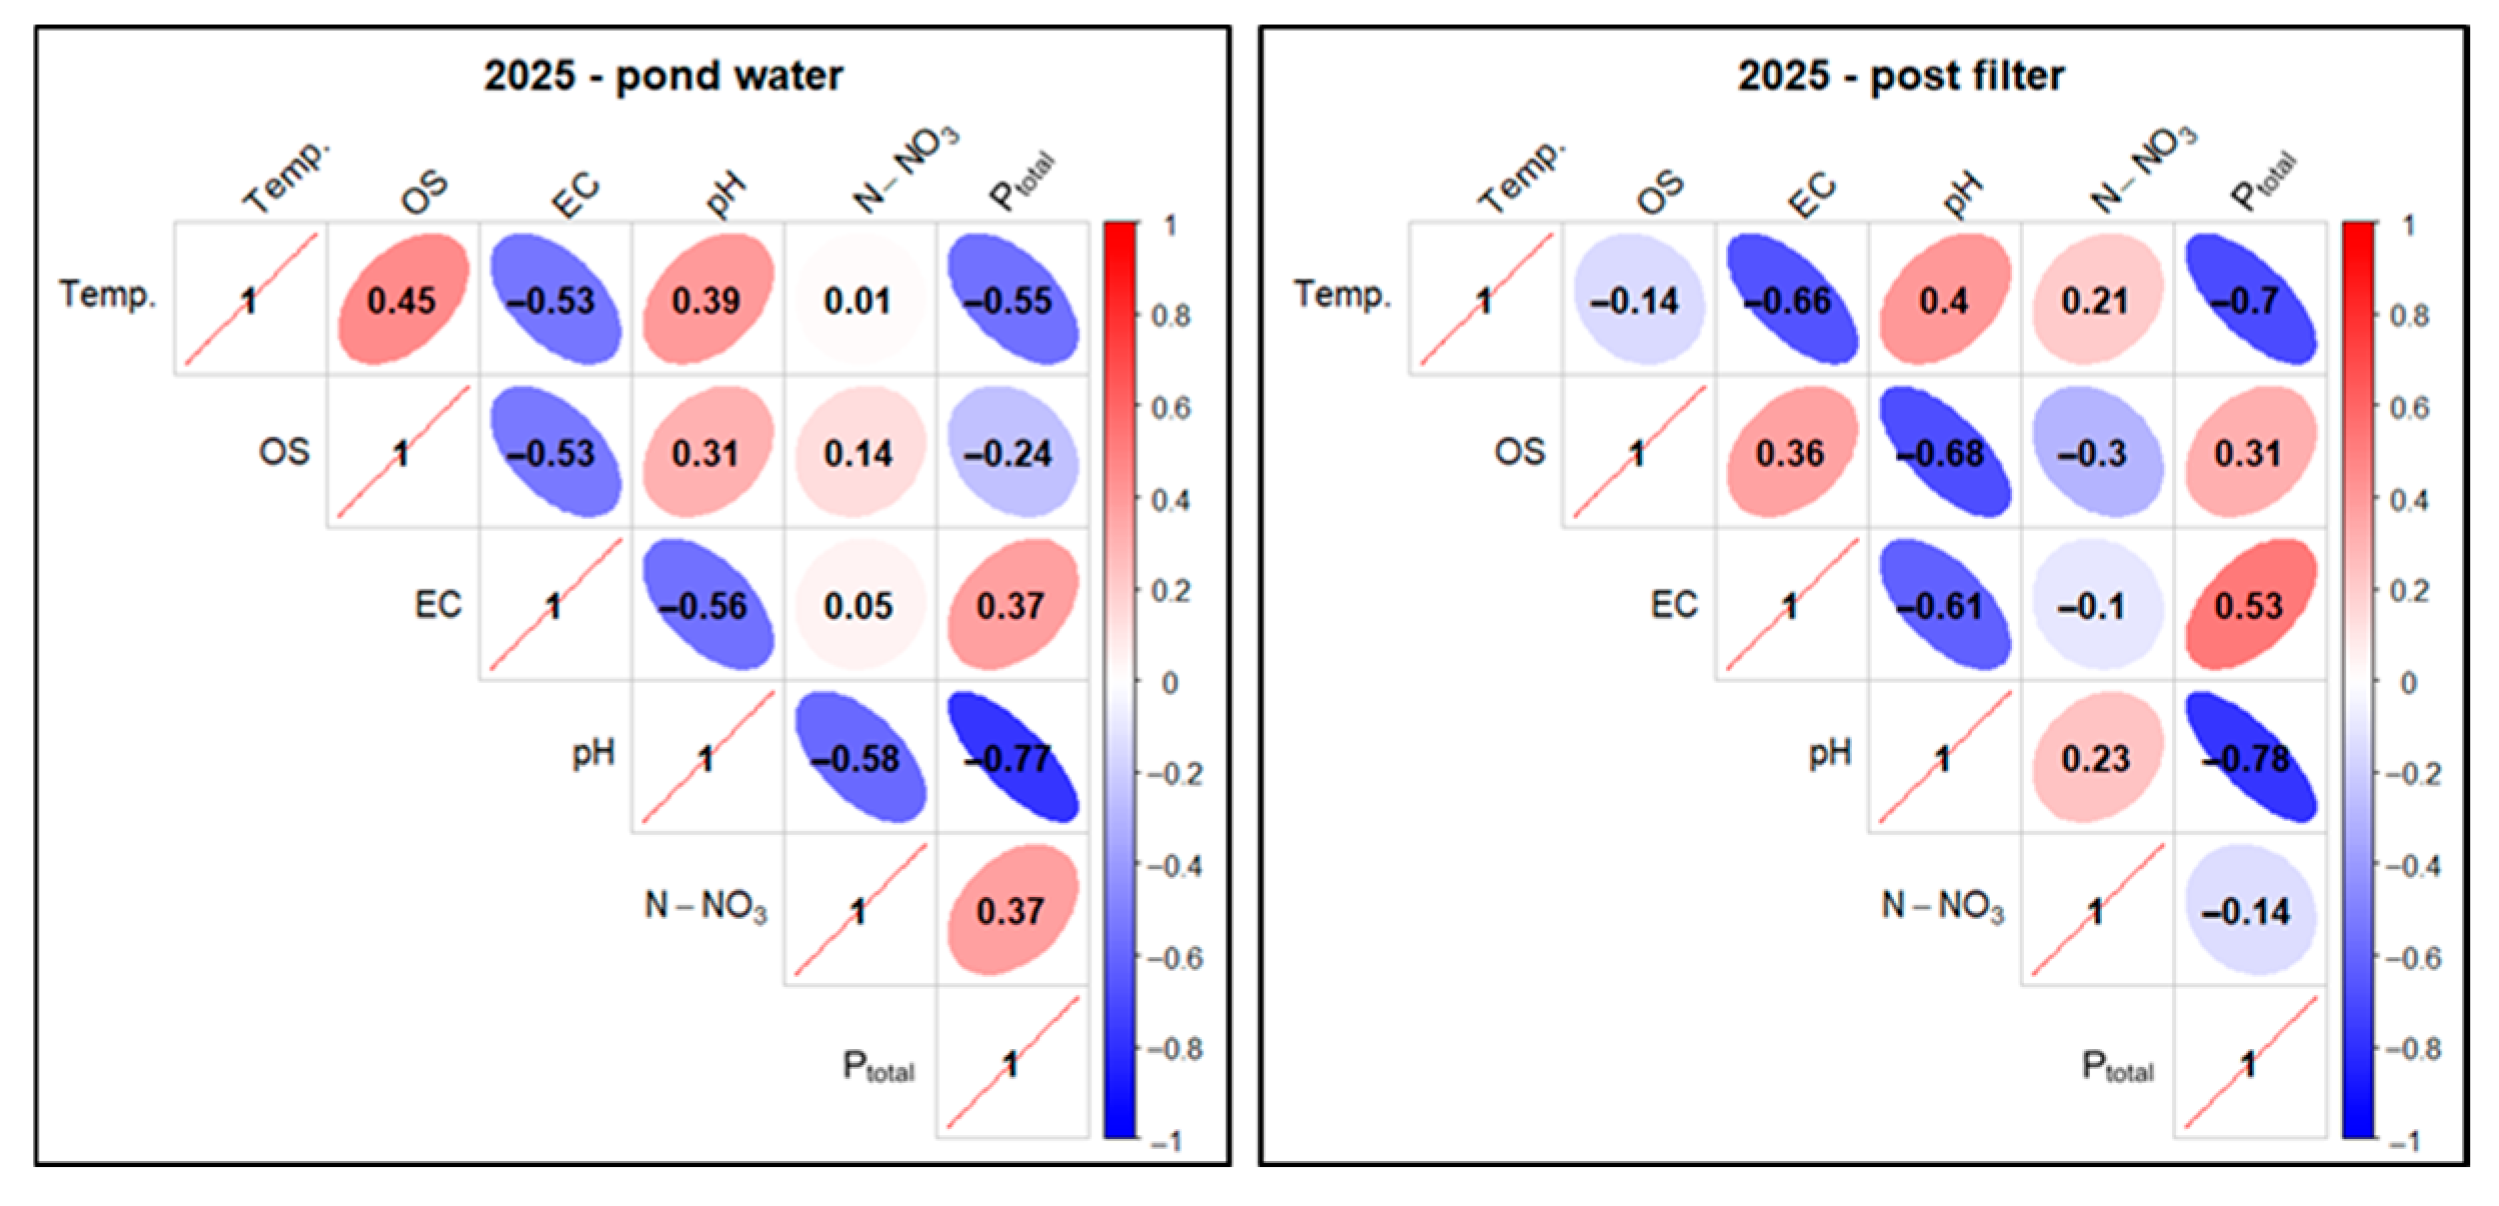
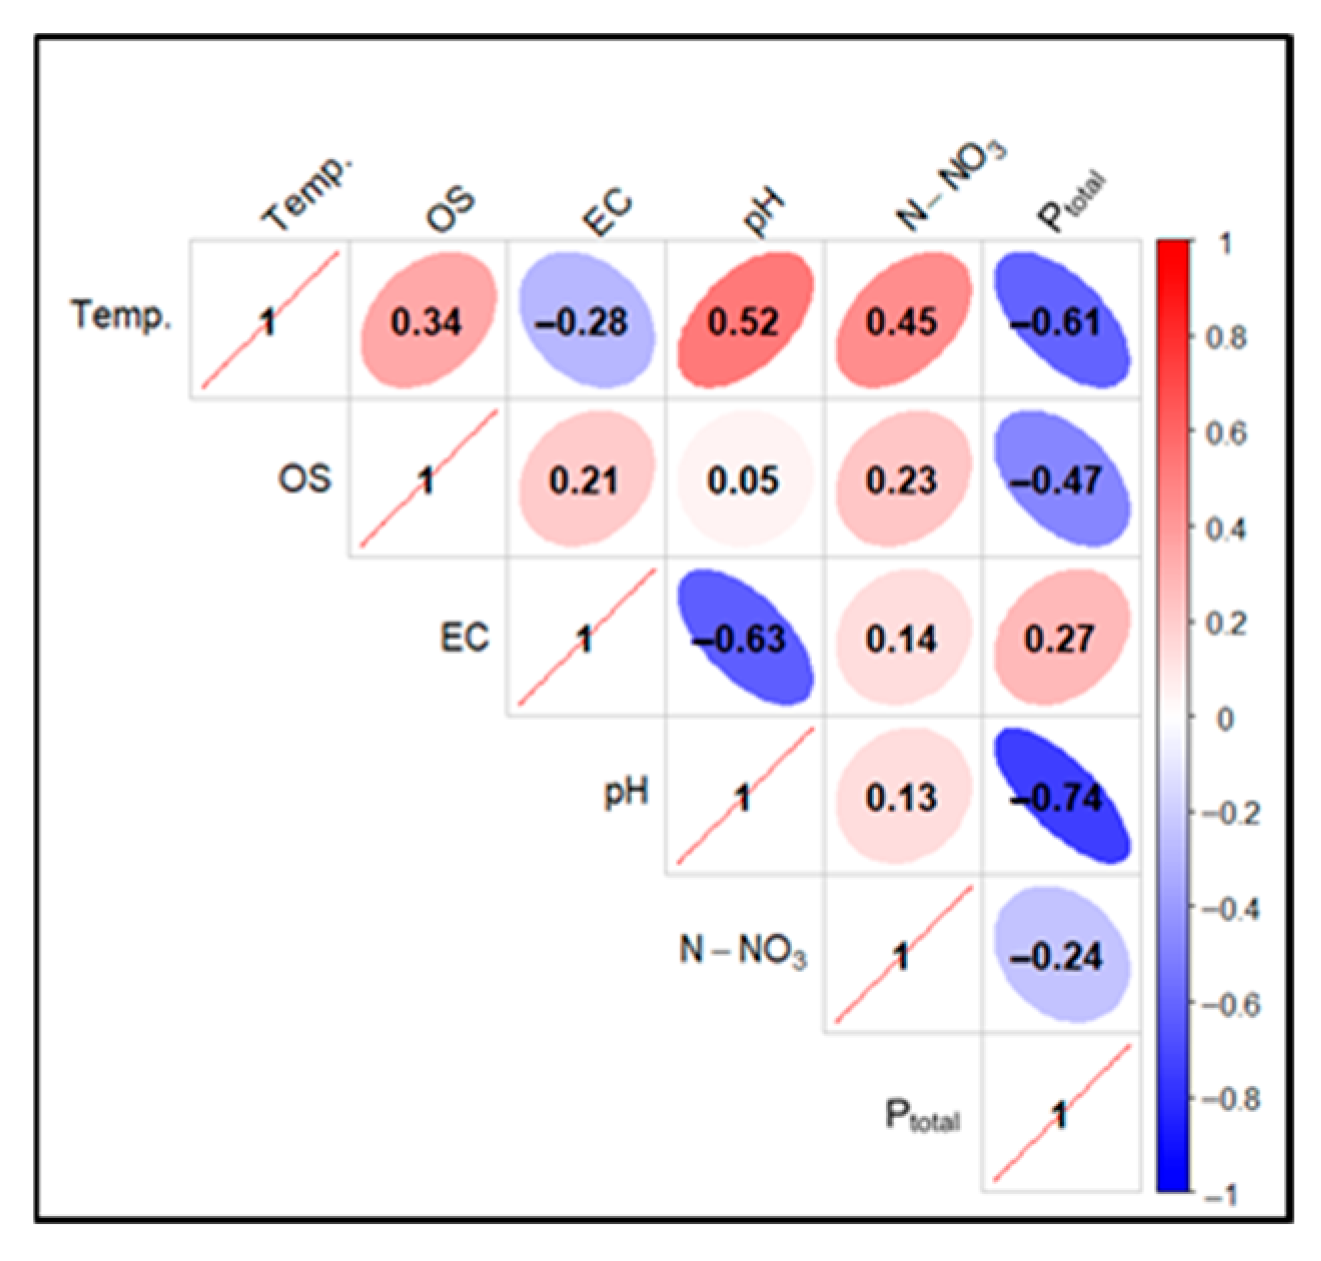
The test results for the analyzed parameters were subjected to statistical analysis. Correlations between the tested factors were examined for two sampling sites: pond water and water after mineral filtration, separately and collectively in 2024–2025 (Figure 29, Figure 30 and Figure 31) for technologically justified parameters (excluding N-NO2 and TH). A threshold value of ≥0.5 was taken as a high positive correlation and ≤−0.5 as a high negative correlation.
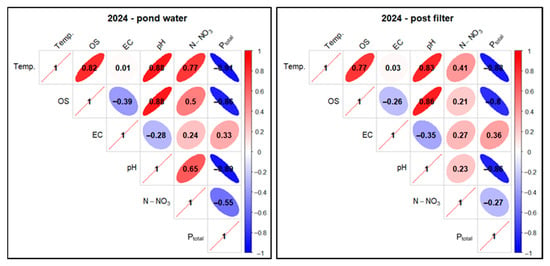
Figure 29.
Correlations between physicochemical factors of experimental pond water (FSP) in two sampling points as pooled data in 2024. Description as in Figure 18.
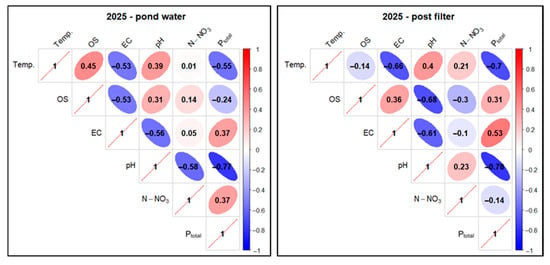
Figure 30.
Correlations between physicochemical factors of experimental pond water (FSP) in two sampling points as pooled data in 2025. Description as in Figure 18.
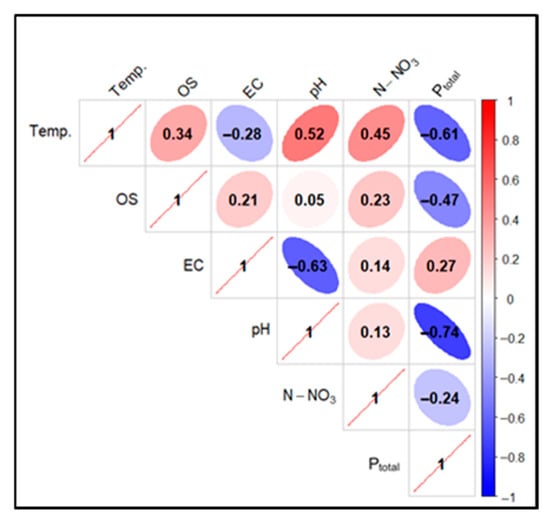
Figure 31.
Correlations between physicochemical factors of experimental pond water (FSP) in two sampling points as pooled data summary in 2024–2025. Description as in Figure 18.
In the case of pond water in 2024, a high positive correlation was found for the Temp. parameter in relation to OS (0.82), pH (0.88), and N-NO3 (0.77). For the pair Temp. and EC, a low positive correlation (0.01) was found, and for Temp. and Ptotal, a very high negative correlation (−0.91) was found. In the case of the relationship between OS and N-NO3, a high positive correlation (0.5) was determined, and for OS andPtotal, a very high negative correlation (−0.86) was found. The correlation between pH and Ptotal also took on very high negative values (−0.89)—Figure 29.
For mineral-filtered water in 2024, a high positive correlation was observed for Temp. compared to OS (0.77) and pH (0.83). For Temp. and N-NO3, there was an elevated positive correlation (0.41). In the case of the pair Temp. and EC, a low positive correlation (0.03) was found, while for Temp. and Ptotal, a very high negative correlation (−0.88) was found. When analyzing OS and N-NO3, an elevated positive correlation (0.21) was found, and for OS in relation to Ptotal, a high negative correlation (−0.8) was found. For the pH and Ptotal pair, a very high negative correlation (−0.86) was found—Figure 29.
In the second season of the study (2025), it should be taken into account that due to the completion date of the research project, it only covered the first half of the year, which probably influenced the final results of the statistical analyses.
In pond water in 2025, an increased positive correlation (0.45) was found for the Temp. factor in relation to OS, similarly to Temp. and pH (0.39). For Temp. in relation to N-NO3, a low positive correlation (0.01) was determined. A high negative correlation was found for Temp. in relation to EC (−0.53) and Ptotal (−0.55). There was a low positive correlation between OS and N-NO3 (0.14) and a reduced negative correlation between OS and Ptotal (−0.24). A high negative correlation (−0.77) was recorded for pH and Ptotal—Figure 30.
For the filtrate in 2025, elevated positive correlations were found for Temp. in relation to pH (0.4) and N-NO3 (0.21), while high negative correlations were found for Temp. in relation to EC (−0.66) and Ptotal (−0.7) and pH in combination with Ptotal (−0.78). Analysis of Temp. and OS indicated a low, negative correlation (−0.14). In turn, an elevated negative correlation (−0.3) was recorded for OS and N-NO3 and an elevated positive correlation (0.31) for OS and Ptotal—Figure 30.
When analyzing the total correlation for both sampling sites and the 2024–2025 study years, a high positive correlation was observed for the Temp. factor in relation to pH (0.52). Elevated positive correlations were observed for Temp. in relation to OS (0.34) and N-NO3 (0.45) and for the pair OS and N-NO3 (0.23). A high negative correlation (−0.61) was found for the relationship between Temp. and Ptotal, similar to pH and Ptotal (−0.74) and OS and Ptotal (−0.74)—Figure 31.
In the statistical analysis of water quality data before and after filtration in the experimental pond, the distribution of variables was assessed using the Shapiro–Wilk test. This test showed that the data on temperature and N-NO3 content did not meet the assumption of normal distribution. The remaining parameters had a distribution close to normal.
For variables with a normal distribution, the t-test for dependent samples was used to compare the values before and after filtration. For parameters that did not meet this assumption, the non-parametric Wilcoxon rank test, appropriate for data with a non-normal distribution, was used. Differences were considered statistically significant at a significance level of 0.05.
Based on the analysis, it was found that statistically significant differences for pond water before and after filtration concerned the following factors: EC, pH, TH, Ptotal, and Temp. (see Table 9).

Table 9.
p-values for the t-test and Wilcoxon rank test for the parameters in the water before and after filtration for the experimental pond. Bolded mean values indicate statistically significant differences.
4. Discussion
According to information obtained from the Polish Association of Natural Bathing Waters (PSNWK, Poland), approximately 200 private natural bathing ponds have been created in Poland in accordance with the FLL standard [10]. Only a few others, standardized by this standard, have the status of public bathing ponds, e.g., the one operating in Świętochłowice (MOSIR Skałka), or the character of scenic and recreational ponds, e.g., in Ostrów Mazowiecka—approx. 5000 m2, in Grodzisk Mazowiecki—approx. 10,000 m2, or in Zduńska Wola—approx. 10,000 m2.
Many more similar facilities are being built in Poland, but these are unregistered larger ponds, grandly called natural pools, which do not meet the basic assumptions and recommendations specifying the technical requirements and specifications of materials intended for the construction and operation of natural swimming ponds.
Although these recommendations are not included in the applicable legal standards, they are considered “good practices” and are part of nature-based solutions (NBS) in the field of green construction and are used in many European countries [2,13,29].
For more technologically advanced types of natural pools, one of the recommendations for the functional parameters of filters in their filtration systems according to FLL [10] standards is an appropriate filtration velocity in filter beds, defined as the ratio of the water flow rate to the filter surface area in plan view, without taking into account the bed. In particular, the effective filtration velocity is analyzed, i.e., the velocity at which water passes through the filter bed and is treated, usually expressed in meters per hour (m/h) or meters per second (m/s). This is a key design and operating parameter in filtration processes, influencing the effectiveness of contaminant removal and allowing the determination of operating parameters related to the length of filtration cycles and the filter rinsing regime [29,30,31].
The effective filtration velocity should be adjusted to the type of contaminants, the type of filter material, its chemical composition, the dimensions of the filter bed, and the functional nature of the tank [2,13,15,29,32,33]. Too high a filtration velocity can lead to contaminants passing through the filter, while too low a velocity can result in excessive loading of the bed. This, in turn, necessitates more frequent backwashing of the bed and its premature clogging, which reduces the utility value of the water reservoir and increases its operating costs.
The FLL guidelines [10] specify the filtration velocity range in filter beds at 0.8–5 m/h as appropriate for the proper functioning of the filtration system, which was taken as a reference point for studies on the operation of a modular filtration system. The functional efficiency of water filtration velocity in the modular filtration chamber was analyzed experimentally for three model ponds (P1—5 m/h; P2—10 m/h; P3—15 m/h) in relation to the system described in the Materials subsection using the modified rock material verified in numerous empirical studies, e.g., [15,27,34], and for the material of a specific manufacturer (Rockfos®)—by laboratory column tests [13]. To analyze the effective filtration velocity, physical and chemical tests, and microbiological and microbiocenotic tests were carried out.
The accuracy of the preliminary analyses was ensured by filling the experimental tanks with water from a well with physical and chemical specifications indicating high utility values, mostly without exceeding the FLL [10] standards for natural swimming ponds.
It was established that regardless of the filtration speed, higher values in the filtered water were found for the following parameters: temperature, oxygen saturation, pH, and total hardness, while lower values were found for nitrates and total phosphorus. No regularity was found in the distribution of nitrite values (constant value N-NO2 = 0.02 mg/dm3). Higher pH values in the filtrate should be associated with the high alkalinity of the Rockfos® filter material (pH = 11–12, due to the high content of alkaline Ca and Mg compounds) and its tendency to alkalize the water in the post-filtration effluent, as confirmed by earlier laboratory studies by Walczak et al. [13].
Longer contact of pond water with the filter material at a filtration rate of 5 m/h also resulted in higher pH values for the filtrate compared to higher filtration rates. However, it did not exceed the average limit values according to FLL standards (pH < 9.0). The same was true for other parameters tested. For the same reasons as for pH, higher values for a flow rate of 5 m/h (P1) were recorded for water hardness, which is a function of the concentration of mainly calcium and magnesium cations.
Electrical conductivity (EC), which is an indirect measure of mineralization and water pollution, was lower in the filtrate at the lowest filtration rate. This indicated the filtration potential of the mineral material against other contaminants during prolonged contact with pond water. This confirms the thesis that the degree of adsorbent utilization increases with the duration of water contact with the bed [13,35].
The concentration of biogenic nitrogen compounds is related to the dynamics of internal metabolism in aquatic ecosystems—mineralization and bioretention of nutrients [36]. For nitrate ions (N-NO3) formed mainly in the process of microbiological nitrification, lower values were found in the filtrate at speeds of 5 m/h and 10 m/h, which may indicate greater filtration capacity of these compounds with longer contact with the bed. However, it should be remembered that in natural swimming pools, the content of nitrogen compounds is mainly regulated by the metabolic activity of the ecosystem through the control of the biocenotic composition of the plants and the microbiology of the pond [2,13].
However, the key issue was the analysis of total phosphorus (P), a parameter that influences many other water quality factors and determines the negative consequences of eutrophication [6,23,37]. In the waters of various ecosystems, phosphorus occurs in the form of mineral and organic compounds, in a dissolved state, in the form of insoluble compounds, as well as in the form of suspensions and colloids. Its presence is determined by biocenotic processes in the ecosystem, as well as anthropogenic sources—polluted surface waters, atmospheric precipitation, and excreta, secretions, and cosmetics introduced into the reservoir during bathing [6,13,37,38].
In the case of P1 (5 m/h), the lowest initial values of total phosphorus concentration in the reservoir water with effective operation of the Rockfos® bed resulted in the lowest values of this parameter in the filter. However, the measure of filter efficiency is the average phosphorus removal efficiency, which was highest for this filtration rate and amounted to 32.65%. This was a clear indication for selecting this filtration rate for extended experimental studies. This conclusion was not overshadowed by the calculated cumulative phosphorus masses on the beds (bed capacity) for the analyzed filtration speeds. They show that the filter with the highest filtration speed (P3, 15 m/h) had the highest bed capacity. In this case, the water in the pond had the highest initial total phosphorus values, thus confirming the observation from previous laboratory tests [13] that the adsorption efficiency of the mineral material used is directly proportional to the phosphorus concentration in the tested solution. It is worth noting that for this single parameter, exceedances of the FLL standards [10] were found, for which the maximum level of Ptotal should not exceed 0.03 mg/dm3.
Generalizing the assessment of water quality changes in P1–P3, it can be seen that the complex processes occurring in the pools with vegetation and contact with atmospheric air obviously increase the water temperature and oxygenation compared to the same parameters determined in well water. The pH value increased, which is a consequence of the highly alkaline Rockfos® material. A particularly elevated pH occurred in P1, a consequence of the low filtration rate and, consequently, extended contact time with the filter bed. This extended contact time and the specific nature of the Rockfos® material contribute to increased hardness, reduced phosphorus concentration, and lower conductivity. Despite the undoubtedly ongoing biological processes in P1–P3, no changes in nitrogen compounds were observed.
In the experiment to determine the most effective filtration rate, correlations between the physical and chemical parameters of the water were also analyzed. For reasons related to the water treatment technology, only the relationships between the parameters key to this process were analyzed. It was found that under the specific conditions of quasi-natural bathing ponds (P1–P3), the correlations of some factors may differ from those expected and are generally not dependent on the filtration rate. An example is the high positive correlation between temperature and oxygen saturation of water. An increase in temperature usually reduces the solubility of gases in water, including oxygen. However, in ponds with a plant regeneration zone, elevated temperatures increase the intensity of photosynthesis, which has the side effect of releasing oxygen from water photolysis into the environment [6,39]. A high positive correlation was also found between temperature and pH. In this case, higher temperatures increase the dissociation of calcium and magnesium ions from the substrate, causing the water in the pond to become more alkaline.
As the temperature increases, the values of electrical conductivity (EC) in water increase. This is due to the fact that higher temperatures increase the mobility of ions in solutions, which in turn facilitates the flow of electricity [40]. For filtration rates (10 m/h and 15 m/h), a positive correlation between these parameters was expected and found, albeit insignificant. For a filtration rate of 5 m/h, the correlation was slightly negative, which may suggest a higher rate of metabolic changes in the ecosystem related to the bioaccumulation of compounds dissolved in water [6].
A slightly more problematic issue is the high negative correlation between temperature (Temp.) and total phosphorus concentration (Ptotal). On the one hand, an increase in temperature can lead to an increase in the solubility of various forms of phosphorus (orthophosphates) and accelerate biological and chemical processes, which increases the phosphorus content in water. On the other hand, an increase in temperature may accelerate the metabolic processes of microorganisms involved in its removal. This is, therefore, determined by many complex factors contributing to the functioning of a specific aquatic ecosystem [6,39] as well as by the processes taking place in the biological treatment chamber of a water treatment system.
Temperature, although in different ways, has a significant impact on the level of nitrates in water. Increased temperatures can accelerate processes that lead to the formation of nitrates in water, such as the decomposition of organic matter, including increasing the activity of enzymes responsible for nitrification processes (the oxidation of ammonia to nitrites and then to nitrates). Higher temperatures can also promote processes that remove them, such as denitrification (conversion of nitrates to nitrogen gas), which, however, occurs in an anaerobic environment [41]. For the lowest flow rate (P1, 5 m/h), a high positive correlation was found for temperature and N-NO3 concentration, which may indicate increased organic matter decomposition. At other filtration flow rates (P2, 10 m/h and P3, 15 m/h), only negative correlations between these parameters were observed, which should be associated with differences in the availability of organic matter, the nature of oxygen conditions, and the composition of microbiocenosis.
The distribution of phosphorus (P) in a water reservoir is generally inversely proportional to the oxygen concentration [6,39]. This is confirmed by analyses of the high negative correlation between water oxygen saturation and total phosphorus concentration in the experimental ponds (P1–P3).
During the experiment, a high negative correlation between pH and total phosphorus was also noted. It is assumed that pH affects the forms in which phosphorus occurs in water and its availability to living organisms. For plants, phosphorus in water is mainly available in the form of orthophosphate ions (H2PO4− and HPO42−). These ions are an inorganic form of phosphorus and are most easily absorbed by plant roots. Plants absorb phosphorus most efficiently at a pH of =5.6–7.2, with an optimal pH for this process of around 6.5. Higher pH can lead to the precipitation of phosphates from the solution, while lower pH can increase the solubility and availability of phosphorus, but also increase the toxicity of nitrates and ammonium ions [42], which can negatively affect aquatic organisms. The reason for the higher pH in the experimental ponds (P1–P3) is obviously due to the alkaline mineral bed (Rockfos®) used in the water treatment system in the ponds. However, the average values of this parameter did not exceed the FLL limits [10] and the baseline limits for a well-functioning pond ecosystem: pH = 7.5–8.5 [43].
For a filtration flow rate of 5 m/h (P1), a positive correlation between oxygen concentration (OS) and nitrate concentration N-NO3 was expectedly noted, though it was insignificant. Under aerobic conditions, nitrifying bacteria convert ammonia into nitrites and then into nitrates. The higher the oxygen concentration, the more effective this process is. Under anaerobic conditions, nitrates can be reduced to molecular nitrogen, which escapes into the atmosphere [40]. At higher filtration flow rates (10 m/h and 15 m/h), nitrification processes were not sufficiently intense, which resulted in increased negative correlations in statistical calculations. The negative correlation between OS and Ptotal in water results from the release of phosphorus into the water in the form of soluble orthophosphates, which, under conditions of high oxygen concentrations, accumulate as polyphosphates and organic phosphorus. A decrease in oxygen concentration in the bottom zone of the reservoir causes anaerobic decomposition of sediments, algae, and other organisms, converting phosphorus compounds into simple phosphates that dissolve in water, consequently increasing its concentration in the water.
The water flow rates through the treatment system influenced the statistical analysis of the parameters in the water before and after mineral filtration. For the t-test (for normally distributed data) and for the Wilcoxon rank test (for variables that did not meet this assumption) at a significance level of 0.05, statistically significant differences were found for different parameters for different experimental ponds: P1 (5 m/h): Temp., TH; P2 (10 m/h): EC, Ptotal and OS (O2); and for P3 (15 m/h): EC, TH, Ptotal, N-NO3. It was observed that with an increase in the filtration circulation speed in the ponds, the number of factors whose values in the water before and after filtration showed statistically significant differences increased. Similar observations can be made in the case of principal component analysis (PCA) of the studied factors. It was found that the filtration process significantly affects the physicochemical properties of water. Perhaps the biophysical and chemical conditions in the pond waters with varying filtration flow rates created a diverse, multi-factor background for the course and intensity of internal metabolic processes in the studied reservoirs.
The elements determining the conditions for the course of metabolic processes in the experimental reservoirs were certainly their bacteriocenoses and the developing biocenotic composition of phyto- and zooplankton.
The presence of human and animal pathogens, both fecal and non-fecal pathogenic microorganisms, poses a health risk to bathing water users [2,44,45]. It also impairs the metabolic activity of the biocoenosis of the reservoir [6]. The mechanism of natural sanitary water treatment is related to the function of the pond’s regeneration zone, which acts as Treated Wetlands (TWs). Here, biogenic substances and toxic compounds are bioaccumulated by repository plants forming a phyto-geochemical barrier [2,23,28]. The root zone of repository macrophytes is an element of phytoremediation (rhizofiltration, phytoextraction, and phytostabilization). Thanks to the root phytoncides secreted, with the participation of a developing biofilm from appropriate bacterial cultures, it accelerates the mineralization of organic compounds and participates in the natural process of water disinfection. This affects the species composition of the reservoir’s bacteriocenosis, determining its sanitary conditions [2,46,47,48,49].
For the analyzed flow rates, the data obtained for the number of coliform bacteria, the number of Escherichia coli bacteria, and the number of fecal enterococci were lowest at lower filtration rates (5 m/h and 10 m/h). This may result from the dynamics of water circulation, which at higher speeds causes greater leaching of the biofilm from the root zone of re-growing plants and is not conducive to the concentration of sanitizing root exudates, which reduces the natural disinfecting properties of the TWs system. Despite the lack of standards for the occurrence of fecal pathogens in natural swimming ponds, their abundance in relation to the nature of use of the tested water bodies should be considered harmless at all filtration speeds.
A properly functioning water reservoir ecosystem is associated with properly progressing ecological succession, which is most important for the functional parameters of the natural pool on a micro scale. The aim of such micro-succession is to achieve a biocenotic balance between phytoplankton (algae and cyanobacteria) and feeding on zooplankton (mainly crustaceans), based on functioning trophic networks [2,6,39]. Phytoplankton itself develops thanks to the availability of water-soluble orthophosphates, and its mass appearance (bloom) affects the growth of primary production in the reservoir. The amount of synergistic toxins secreted by phytoplankton also increases, which often leads to intoxication of the water reservoir, determining changes in water quality parameters [6,13,23].
Qualitative and quantitative analyses of pro- and eukaryotic planktonic algae in ponds with different filtration rates indicated typical early stages of succession, although not identical in nature. This could indicate the influence of filtration rate on the formation of biotope conditions for the developing phytoplankton biocenosis. The species similarity of phytoplankton for the three ponds with different filtration rates was low, reaching only 0.23 (Jaccard coefficient) on a scale of 0.0 to 1.0. However, the taxonomic structure for these reservoirs was not very diverse, with only 24–25 species recorded for each reservoir. In all reservoirs, although in varying proportions, green algae (Chlorophyta) were the most abundant, with a predominance of unicellular or cenobitic species of the genera Chlamydomonas, Monoraphidium, and Scenedesmus. Low biogenic phosphorus values in the tested reservoirs, combined with competition for nutrients with macrophytes in the regeneration zone, were not conducive to the appearance of filamentous green algae (e.g., from the Cladophora, Spirogyra, or Zygnema families), which are problematic for maintaining biocenotic balance [6,50] and, consequently, the recreational use of ponds. The share of taxa include those from the cyanobacteria (Cyanoprokaryota) and diatom (Bacillariopyceae) groups, as well as those represented mainly by single taxa of euglenines (Euglenophyceae), golden algae (Chrysophyceae), cryptophytes (Cryptophyceae), and dinoflagellates (Dinophyceae). Both the abundance of biocenotic groups and their biomass, in terms of numbers and percentages, showed the lowest values for ponds with lower filtration flow rates (5 m/h and 10 m/h). This is particularly important when analyzing the presence of cyanobacterial species, whose mass appearance and ability to release cyanotoxins (dermatotoxins, hepatotoxins, or neurotoxins) can lead to water body poisoning, which is problematic both for the water body ecosystem itself [6,49,50,51] as well as its users [13].
Low numbers and biomass of planktonic algae determined low concentrations of chlorophyll a, as an indirect indicator of their productivity, with the lowest value (2.2 µg/dm3) recorded for P1 with a filtration flow rate of 5 m/h. Despite this fact, according to the nomenclature based on trophic status [50], this and other tested ponds should be classified as oligotrophic.
Freshwater zooplankton is more biologically diverse than phytoplankton, so its detailed analysis requires specialist knowledge. It comprises many taxonomic groups, such as protozoa, rotifers, coelenterates, cnidarians, annelids, arthropods, larval stages of molluscs, and echinoderms, as well as simple forms of vertebrates and fish eggs and fish juvenile stages. However, freshwater zooplankton is typically composed of heterotrophic protozoa, rotifers, and crustaceans [6,50].
Limited by their scope, preliminary analyses of zooplankton also indicated the early stages of succession of this zoocoenosis. A small number (15) of typical species characteristic of the main systematic groups were found: cladocerans (Cladocera); copepods (Copepoda); rotifers (Rotifera); and rhizopods (Rhizopoda) with a similar biocenotic structure. The filtration circulation speed in the ponds, therefore, had no influence on its formation. In all tested reservoirs, only small forms of filter feeders dominated, mainly cladocerans (from the Chydorus family) capable of filtering the smallest food particles (e.g., single-celled algae) from the environment. It is worth noting that among planktonic filter feeders, especially rotifers, there is a general rule known as the Size Efficiency Hypothesis [52]. It is based on the fact that both small and large filter feeders (e.g., Daphnia magna) compete for small food, but only the large ones are able to consume larger food. When small food becomes scarce, larger filter feeders fare better in such conditions—they are able to tolerate lower densities of filtered food than smaller filter feeders. This perspective is changed by the presence of large filamentous algae (green algae or cyanobacteria) in the reservoir. They clog the filtering apparatus of large planktonic filter feeders, but due to their size, they do not limit the ability of smaller filter feeders to obtain food [6,52]. For the self-regulation of the ecological system of pond water, the presence of smaller forms of filter-feeding zooplankton, therefore, seems to be a more adaptive solution. It is worth noting that the mere presence of zooplankton, regardless of its taxonomic composition, does not always reduce the amount of phytoplankton. This takes into account, for example, the possibility of low consumption stimulating phytoplankton growth, or the growth of inedible phytoplankton forms due to selective feeding on edible forms. The processes of regulating biocenotic relationships are, therefore, difficult to implement and depend on many different biotic and abiotic factors in the aquatic environment [6,39,50].
A summary of the above issues:
- High effective filtration efficiency for phosphorus (32.65%).
- No exceedances of FLL standards [10] for most water quality parameters in the pond at its operational load.
- Lower number of problematic fecal pathogens (on average 393—coliform bacteria; 74—Escherichia coli; 34—fecal enterococci, MPN/100 mL).
- Correct phytoplankton succession with the lowest share of cyanobacteria threatening toxin formation in the reservoir (both in terms of abundance and biomass).
- Oligotrophic nature of the reservoir confirmed by the lowest chlorophyll a concentrations.
- The presence of a properly developing zooplankton biocenotic structure, with the participation of its smaller forms, in combination with the analysis of conversion and statistical results, provided a sufficient basis for accepting the extended filtration rate of 5 m/h for rapid filters for the study.
This choice of a 5 m/h filtration rate is also supported by preliminary economic analyses. The purchase cost of a pump for a flow rate of 15 m/h is 100% higher than for a rate of 5 m/h. The energy cost of maintaining a modular water filtration system at a flow rate of 5 m/h for a pond of approximately 100 m2 is approximately €65/year (a circulating pump with a power rating based on a 50 W pump operating 24 h a day for 300 days a year), and €195/year for a filtration rate of 15 m/h. The latter scenario assumes a higher frequency of cleaning and reactive material replacement due to faster bed clogging, which also increases the system’s operating costs.
Extended field experiments concerned the functioning of an innovative water treatment system using a prototype modular filter chamber. It was designed according to functional assumptions [2] as a dedicated technological solution mainly for natural swimming ponds.
Both the design and the prototype of the filter chamber were implemented according to the co-authors’ guidelines by a competent technology company and analyzed in terms of functionality, mechanical loads, and safety of use. It therefore meets the basic requirements for modularity and multiplicity (compatibility of multidirectional system connections), durability and lightness of construction (HDPE plastic), functionality in relation to various types and sizes of swimming ponds, the possibility of independent assembly and equipping the system with dedicated accessories, as well as service and maintenance facilities, allowing individual chambers to be disconnected without immobilizing the entire system.
The latter improvement is related to the use of valve control, which, in the context of the filtration system dedicated to the natural pool, is the subject of a patent application described in the first part of this paper.
The lack of such a solution is a fundamental drawback of current technological solutions for water treatment in ponds, as it does not allow for selective filtration during the functional rest of any of the filtration cartridges. System maintenance involves closing the water circulation loop, which has a negative impact on the operational efficiency of the entire system [2].
Therefore, the filtration efficiency of the prototype water treatment system described in the Materials section was tested for a full-size natural swimming pond type II (FSP).
The study found that regardless of the sampling location, most of the average values of the parameters tested (with the exception of Ptotal) did not exceed the standards for natural bathing ponds set by FLL [10]. The filtration processes in both study seasons did not have a significant impact on the values of Temp. and N-NO2 ion concentrations (constant value in pond water and in the N-NO2 filter = 0.02 mg/dm3). Higher values were obtained in the filtrate for the pH value and lower values for the other tested parameters (OS, EC, TH, N-NO3, and Ptotal).
As expected, the highly alkaline nature of Rockfos® caused alkalization processes in the pond water. Seasonal fluctuations in pH in the pond water were also noted for both study seasons. These are related to the specific environmental conditions associated with the succession of seasons: changes in temperature, precipitation, and biological activity, including the intensity of photosynthesis affecting the assimilation of CO2 from the aquatic environment [6,52].
For the electrolytic conductivity (EC) factor, of which values are a measure of the dissociation of various compounds dissolved in water, it was found that this parameter was characterized by variability regardless of the sampling date. This fact confirms the observed regularity of lower EC values in the filtrate water for subsequent sampling dates. The decrease in EC in pond water was due to the inflow of rainwater, which is naturally low in mineralization, but it could also indicate that the Rockfos® mineral material used gained greater filtration efficiency during the subsequent period of its operation and that the ecosystem of the reservoir was metabolically active.
Another parameter dependent on many environmental factors, including those related to the seasons, is oxygen saturation (OS). Its values in the filter were lower, probably due to the predominance of heterotrophic succession in the biological filter, with respiration prevailing over production (photosynthesis). Higher values of this parameter in pond water may also result from aeration of the reservoir during bathing. Water circulation and mixing promote the dissolution of oxygen in water, enabling gas exchange between water and the atmosphere, thus increasing the concentration of dissolved oxygen in water [6,49]. Higher oxygen concentrations in water were recorded in colder months, confirming the rule that the solubility of gases in liquids, including oxygen in water, is inversely proportional to temperature [53,54].
Water hardness (TH), which is a function of the concentration of calcium, magnesium, and sodium cations, took values significantly lower than the FLL standard [10] for natural pools TH > 30 °dH (10.7 mval/L) during the field experiment. It was above the values specified for well water (pond filling) in both the pond water and in the filter, but as a rule, it was lower in the filter than in the pond water. Despite the possibility of Ca and Mg ions being released from the deposit, its high alkalinity could cause calcium and magnesium carbonates to precipitate at elevated pH values, reducing the level of these elements in the filter [49]. The lack of consistent patterns in the distribution of this parameter in relation to sampling sites and in seasonal terms can be linked to varying intensities of biological processes, which, on the one hand, concern the biocenotic bioaccumulation of these elements and, on the other hand, concern their release during the decomposition of dead organic matter [6].
For nitrate ions (N-NO3) formed mainly from ammonium ions by nitrites in the process of microbiological nitrification, the adsorption reactivity of the filtration system was low (0.3 to 0.5 mg/dm3, corresponding to those in well water 0.4 mg/dm3). Their quantity is regulated by the internal metabolism of the reservoir, with the participation of repository macrophytes and the microbiocenotic structure of the pond (bioaccumulation, decomposition of organic matter, and nitrification).
For the proper functioning of natural bathing water bodies, it is necessary to control the phosphorus content, which is a key biogenic element determining other water quality parameters. For both seasons of the study, lower Ptotal values were found compared to well water, and the correct distribution of lower Ptotal values was found for filtered water, although with varying intensity. The average Ptotal values in the 2024 and 2025 seasons exceeded the FLL standards for eco-basins (Ptotal < 0.03 mg/dm3). However, the average effective efficiency value showed a progressive increase in phosphorus adsorption from season to season, reaching 53.98% in 2025. This confirmed the observation that for highly efficient filter materials, phosphorus removal efficiency increases with bed break-in [55]. An analysis of the bed’s absorptivity indicates that for both study seasons, its absorption efficiency decreases during the summer months, which is due to the intensity of seasonal biological processes. A notable issue is the exceeding of FLL standards [10] for the amount of Ptotal in FSP water. However, the practice of constructing, operating, and maintaining natural swimming ponds shows that full operational efficiency based on the development of environmental homeostasis in a living pond ecosystem and the appropriate selection of a treatment system and filtration parameters is only achieved after several years of operation. Based on the tests carried out, it can only be concluded that the tested water filtration system has progressive adsorption capabilities, which in the case of this study should be assessed positively.
The analysis of correlations between the physical and chemical factors of water at the sampling sites and in subsequent seasons showed similar high positive and negative correlations as in the case of testing the effective filtration rate. In particular, in the 2024 season, the previously analyzed high positive correlations were found between the temperature (Temp.) and the factors, OS, pH, and N-NO3, as well as high negative correlations between Temp. and Ptotal and for pH and Ptotal. Same as before, a high negative correlation was also found for OS and Ptotal. For the pair OS and N-NO3, on the other hand, only positive correlations were found, as in the tested ponds (P1–P3), indicating that the intensity of the microbiological nitrification process is directly proportional to the amount of dissolved oxygen in the water. Greater variation in the values and nature of the correlations was observed in the second season of the study (2025), particularly in the filtrate. Its analysis should, therefore, be considered incomplete, covering only the first half of the pond’s operating season; hence, there is no justification for drawing competent conclusions.
Testing statistically significant differences in water parameters before and after filtration using the t-test and Wilcoxon rank test allowed us to conclude that, in addition to the factors showing such differences in the previous experiment (EC, Ptotal, and TH), there is one more factor—pH. The nature of these relationships may be determined by the specific biocenotic interactions in the pond and the specifications of the filtration system used. In this case, for example, the efficiency of mechanical pollutant removal by a dedicated filter and the operation of a surface skimmer, the metabolic activity of the biological chamber, or the alkaline nature of the Rockfos® filter mineral.
A key issue for the commercialization of the presented technological solution is the investment cost, as well as the operating and maintenance costs of the water treatment system. Financial analyses indicate that the investment cost of a modular filtration system for a natural swimming pond with an area of approximately 100 m2 is approximately €7500, compared to €10,000–12,000 for other technological solutions currently available in the market. In the case of the presented system, the mechanical and biological filters have approximately 25% larger surface areas, and the mineral filter has approximately 35–40% larger capacity compared to existing market solutions. Operating and maintenance costs for all technological solutions are similar. The energy cost to maintain the modular water filtration system at a flow rate of 5 m/h for a pond with an area of approximately 100 m2 is approximately €65/year, while the maintenance cost—cleaning the mechanical and biological filters—is approximately €200/year (mechanical cleaning and possible replacement of the biological filter fabric). The use of the proposed water filtration system is, therefore, characterized by a 25% lower investment amount and shows potentially higher efficiency after the bed has been worked out and a similar cost of using and servicing the system in relation to other market systems.
The summary of the above analysis allows us to conclude that the prototype water treatment system with a modular mineral filtration chamber filled with the tested Rockfos® mineral, in a full-size pond of the second type (FSP), at a circulation rate of 5 m/h, demonstrates high functional efficiency under full operating conditions.
5. Conclusions
Field experiments based on the study of relevant physical and chemical parameters of water, microbiological and biocenotic tests, as well as calculations and statistical analyses of the tested reservoirs and water treatment systems, allowed the following conclusions to be drawn:
- The functionally verified design of the modular filter chamber and its prototype offer adaptive possibilities for system multiplication, which could be a dedicated solution for natural swimming ponds.
- A filtration system based on the modular functionality of the prototype chamber for type II natural swimming ponds should include a pre-filter, a filter ensuring biological processes, and a filter with a mineral bed, enriched with a pump section and dedicated accessories (skimmers, connectors, valves, pipes, drainage, etc.).
- The mineral bed filter should be filled with a highly reactive filter material with verified phosphorus adsorption efficiency and no increased release of ions from the bed, which increases the functional capabilities of the water treatment system.
- The tested possibility of selectively switching off the filter chamber with the mineral bed, in accordance with the patent application, allows for easier maintenance (material replacement, drying, regeneration) without affecting the functioning of the entire system.
- Experimental studies, including the analysis of the physical and chemical properties of water (including effective phosphorus removal efficiency—32.65%) and microbiological and biocenotic properties of water (including low number of fecal bacteria, low number and biomass of problematic cyanobacteria, low chlorophyll a content, and the presence of fine filter feeders in zooplankton), with reference to the FLL guidelines for natural pools, enabled positive verification of the filtration rate adopted for further research—5 m/h.
- Research on the physical and chemical parameters of water before and after filtration through the prototype modular water treatment system for a full-size natural swimming pond of type II and their statistical analysis, made it possible to confirm its high functional efficiency in bathing conditions. This was due to the progressive increase in the effective phosphorus filtration efficiency to 54% as the bed matured and the lack of exceedances of the FLL standards for other tested parameters.
- An economic analysis of the technological solution used for a medium-sized natural swimming pond (area 100 m2) indicates 25% lower investment costs compared to solutions currently available on the market. The operating costs of a 50 W circulating pump over a 10-month period of continuous system operation at a selected speed of 5 m/h (€65/year) are three times lower than that for a speed of 15 m/h, which, given the fixed costs of system maintenance and service of around €200/year, confirms the high commercialization potential of this solution.
Author Contributions
Conceptualization, W.W., A.S. (Artur Serafin), and T.S.; methodology, W.W., A.S. (Artur Serafin), and T.S.; software, W.W., A.S. (Artur Serafin), T.S., J.M. and A.S. (Agnieszka Szczurowska); validation, W.W., A.S. (Artur Serafin) and T.S.; formal analysis, W.W., A.S. (Artur Serafin), T.S., J.M. and A.S. (Agnieszka Szczurowska); investigation, W.W. and A.S. (Agnieszka Szczurowska), resources, W.W., A.S. (Artur Serafin) and A.S. (Agnieszka Szczurowska); data curation, A.S. (Artur Serafin), J.M. and T.S.; writing—original draft preparation, W.W., A.S. (Artur Serafin), T.S. and A.S. (Agnieszka Szczurowska); writing—review and editing, T.S. and J.M.; visualization, W.W., A.S. (Artur Serafin), T.S., J.M. and A.S. (Agnieszka Szczurowska); supervision, A.S. (Artur Serafin); project administration, A.S. (Artur Serafin) and T.S. All authors have read and agreed to the published version of the manuscript.
Funding
This research was funded by the Ministry of Education and Science (Poland) as part of the implementation doctoral project No. DWD/5/0334/2021, titled “Development and implementation of a modular water filtration system for natural swimming ponds”.
Data Availability Statement
Dataset available on request from the authors.
Conflicts of Interest
The authors declare no conflicts of interest.
References
- Littlewood, M. Natural Swimming Pools: An Inspirational Guide for Construction and Maintenance; Schiffer Publishing: Atglen, PA, USA, 2005. [Google Scholar]
- Walczak, W.; Serafin, A.; Siwiec, T. Natural Swimming Ponds as an Application of Treatment Wetlands—A Review. Water 2023, 15, 1878. [Google Scholar] [CrossRef]
- Dhote, S.; Dixit, S. Water quality improvement through macrophytes—A review. Environ. Monit Assess. 2009, 152, 149–153. [Google Scholar] [CrossRef]
- Radic, D.; Gujanicic, V.; Petricvic, J.; Raicevic, V.; Lalevic, B.; Rudic, Z.; Bozic, M. Macrophytes as remediation technology in improving Ludas lake sediment. Fresenius Environ. Bull. 2013, 22, 1787–1791. [Google Scholar]
- Bus, A.; Karczmarczyk, A. Kinetic and sorption equilibrium studies on phosphorus removal from natural swimming ponds by selected reactive materials. Fresenius Environ. Bull. 2015, 24, 2736–2741. [Google Scholar]
- Wetzel, R.G. Limnology: Lake and River Ecosystems; Gulf Professional Publishing: London, UK; Los Angeles, CA, USA; Tokyo, Japan, 2001. [Google Scholar]
- Ostroumov, S.A. Water quality and conditioning in natural ecosystems: Biomachinery theory of self-purification of water. Russ. J. Gen. Chem. 2017, 87, 3199–3204. [Google Scholar] [CrossRef]
- Wolski, P.; Gąsiorowski, M.; Walczak, W. Stawy kąpielowe—Formy bliskie naturze. Archit. Kraj. 2001, 2–3, 85–94. [Google Scholar]
- Koźmińska, A.; Hanus-Fajerska, E.; Muszyńska, E. Możliwości oczyszczania środowisk wodnych metodą ryzofiltracji. Woda-Sr.-Obsz. Wiej. 2014, 14, 89–98. [Google Scholar]
- FLL—Forschungsgesellschaft Landschaftsentwicklung Landschaftsbau e. V. Recommendations for Planning, Construction, Servicing and Operating of Outdoor Swimming Pools with Biological Water Purification (Swimming and Bathing Ponds); FLL: Bonn, Germany, 2011. [Google Scholar]
- Available online: www.hydroidea.com (accessed on 15 December 2022).
- Karczmarczyk, A.; Bus, A.; Baryła, A. Influence of operation time, hydraulic load and drying on phosphate retention capacity of mineral filters treating natural swimming pool water. Ecol. Eng. 2019, 130, 176–183. [Google Scholar] [CrossRef]
- Walczak, W.; Serafin, A.; Siwiec, T. Comparative analysis of phosphorus removal efficiency from water on selected filter beds for use in the natural swimming pond filtration systems. J. Ecol. Eng. 2025, 26, 298–314. [Google Scholar] [CrossRef]
- Pinińska, J. Właściwości geomechaniczne opok. Górnictwo i Geoinżynieria 2008, 32, 293–301. [Google Scholar]
- Bus, A.; Karczmarczyk, A. Charakterystyka skały wapienno-krzemionkowej opoki w aspekcie jej wykorzystania jako materiału reaktywnego do usuwania fosforu z wód i ścieków. Infrastrukt. i Ekol. Teren. Wiej. 2014, 1, 227–238. [Google Scholar]
- Waechter, D. Stawy Ogrodowe; Bellona: Warszawa, Poland, 2008. [Google Scholar]
- Mirek, Z.; Piękoś-Mirkowa, H.; Zając, A.; Zając, M. Flowering Plants and Pteridophytes of Poland. A Checklist. Vol. 1.; Biodiversity of Poland.—Krytyczna lista roślin naczyniowych Polski. T. 1. Różnorodność biologiczna Polski; W. Szafer Institute of Botany; Polish Academy of Sciences: Kraków, Poland, 2022. [Google Scholar]
- Zientek, H. Rośliny w Oczkach Wodnych; Medical Tribune Polska: Warszawa, Poland, 2008; pp. 25–31. [Google Scholar]
- Kłosowski, S.; Kłosowski, G. Rośliny Wodne i Bagienne; Multico Oficyna Wydawnicza: Warszawa, Poland, 2007. [Google Scholar]
- Available online: https://www.pkn.pl/polskie-normy/wykazy-pn/wykaz-opublikowanych-pn (accessed on 15 December 2022).
- Utermöhl, H. Zur Vervollkommnung der quantitativen Phytoplankton-Methodik: Mit 1 Tabelle und 15 abbildungen im Text und auf 1 Tafel. Int. Ver. für Theor. und Angew. Limnol. Mitteilungen 1958, 9, 1–38. [Google Scholar] [CrossRef]
- Hoek, C.; Mann, D.G.; Jahns, H.M. Algae: An Introduction to Phycology; Cambridge University Press: Great Britain, UK, 1995. [Google Scholar]
- Wysocki, C.; Sikorski, P. Fitosocjologia Stosowana; Wyd. SGGW: Warszawa, Poland, 2002. [Google Scholar]
- Serafin, A.; Sender, J.; Bronowicka-Mielniczuk, U. Potential of Shrubs, Shore Vegetation and Macrophytes of a Lake to Function as a Phytogeochemical Barrier against Biogenic Substances of Various Origin. Water 2019, 11, 290. [Google Scholar] [CrossRef]
- Nusch, A.E. Comparison of different methods for chlorophyll and phaeopigment determination. Arch. Hydrobiol. Beith. Ergebn. Limn. 1980, 14, 14–36. [Google Scholar]
- Rybak, J.I.; Błędzki, L.A. Słodkowodne Skorupiaki Planktonowe; Wyd. Uniw. Warszawskiego: Warszawa, Poland, 2010. [Google Scholar] [CrossRef]
- Martin, J.W.; Davis, G.E. An Updated Classification of the recent Crustacea. Nat. Hist. Mus. Los Angeles Cty. Sci. Ser. 2001, 39, 123. [Google Scholar]
- Jóźwiakowski, K. Studies on the efficiency of sewage treatment in chosen constructed wetland systems. Infrastruct. Ecol. Rural. Areas 2012, 1, 232. [Google Scholar]
- Walczak, W.; Serafin, A.; Siwiec, T. Analiza procesów filtracyjnych na złożach mineralnych stosowanych w filtrach naturalnych stawów kąpielowych. Instal 2024, 6, 37–45. [Google Scholar] [CrossRef]
- Sommerfeld, E.O. Iron and Manganese Removal Handbook; American Water Works Association: Denver, CO, USA, 1999. [Google Scholar]
- Dymaczewski, Z.; Jeż-Walkowiak, J.; Sozański, M.M. Zarządzanie procesem projektowania w fazie planowania nowych i modernizacji eksploatowanych zakładów uzdatniania wody. Forum Eksploatatora 2005, 1, 12–20. [Google Scholar]
- Cucarella, V.; Renman, G. Phosphorus sorption capacity of filter materials used for onsite wastewater treatment determined in batch experiments—A comparative study. J. Environ. Qual. 2009, 38, 381–392. [Google Scholar] [CrossRef]
- Karczmarczyk, A.; Bus, A.; Baryła, A. Wykorzystanie materiałów reaktywnych w systemach zagospodarowania wody opadowej w osiedlach mieszkaniowych. Kom. Tech. Infrastruktury Wsi 2015, 4, 1089–1096. [Google Scholar] [CrossRef]
- Renman, A.; Renman, G. Long-term phosphate removal by the calcium-silicate material Polonite in wastewater filtration systems. Chemosphere 2010, 79, 659–664. [Google Scholar] [CrossRef]
- Wąsik, E.; Chmielowski, K. Skuteczność oczyszczania ścieków bytowych w filtrach piaskowych o przepływie pionowym z dodatkiem ziarnistego węgla aktywnego. Infrastrukt. i Ekol. Teren. Wiej. 2013, 1, 7–17. [Google Scholar]
- Kowal, A.; Świderska-Bróż, M. Oczyszczanie Wody; Wyd. Naukowe PWN: Warszawa, Poland, 2007. [Google Scholar]
- Serafin, A.; Grzywna, A.; Augustyniak, R.; Bronowicka-Mielniczuk, U. Nutrients from beach recreation in the context of the limnological status of a mesotrophic lake. J. Water Land Dev. 2022, 54, 160–171. [Google Scholar] [CrossRef]
- Ho, G.E.; Mathew, K.; Gibbs, R.A. Nitrogen and phosphorus removal from sewage effluent in amended sand columns. Water Res. 1992, 26, 295–300. [Google Scholar] [CrossRef]
- Serafin, A.; Pogorzelec, M.; Czernaś, K. Estimation of potential load of eutrophicating compounds of recreational origin penetrating into the mesotrophic lake Piaseczno and of the tourist capacity of the lake in the summer seasons of 2008 and 2010. Teka Kom. Ochr. Kszt. Środ. Przyr. 2014, 11, 190–200. [Google Scholar]
- Kajak, Z. Hydrobiologia—Limnologia, Ekosystemy Wód Śródlądowych; Wyd. PWN: Warszawa, Poland, 1998. [Google Scholar]
- Gomółka, E.; Szaynok, A. Chemia Wody i Powietrz; Wyd. Oficyna Wydawnicza Politechniki Wrocławskiej: Wrocław, Poland, 1997. [Google Scholar]
- Pruss, A. Przemiany związków azotu podczas infiltracji w zależności od temperatury wody na przykładzie ujęcia infiltracyjnego w Poznaniu. Ochr. Sr. 1997, 3, 19–21. [Google Scholar]
- Jurga, B.; Filipek, A. Wpływ wybranych praktyk rolniczych na dostępność fosforu dla roślin—Przegląd piśmiennictwa. Stud. i Rap. IUNG-PIB 2017, 53, 55–66. [Google Scholar]
- Available online: https://www.stawy-kapielowe.com.pl/images/stories/download/lavaris.pdf (accessed on 27 July 2025).
- Sinclair, R.G.; Jones, E.L.; Gerba, C.P. Viruses in recreational water-borne disease outbreaks: A review. J. Appl. Microbiol. 2009, 107, 1769–1780. [Google Scholar] [CrossRef]
- Schets, F.M.; De Roda Husman, A.M.; Havelaar, A.H. Disease outbreaks associated with untreated recreational water use. Epidemiol. Infect. 2011, 139, 1114–1125. [Google Scholar] [CrossRef]
- Pilon-Smits, E. Phytoremediation. Annu. Rev. Plant Biol. 2005, 56, 15–39. [Google Scholar] [CrossRef]
- Vymazal, J.; Březinová, T.D.; Koželuh, M.; Kule, L. Occurrence and removal of pharmaceuticals in four full-scale constructed wetlands in the Czech Republic–the first year of monitoring. Ecol. Eng. 2017, 98, 354–364. [Google Scholar] [CrossRef]
- Langergraber, G.; Dotro, G. (Eds.) Wetland technology: Practical information on the design and application of treatment wetlands. In Scientific and Technical Report Series; IWA Publishing: London, UK, 2019; Volume 27, p. 191. [Google Scholar]
- Pliński, M. Hydrobiologia—Podstawy; Wyd. Ocean: Sopot, Poland, 1995. [Google Scholar]
- Gałczyński, Ł.; Ociepa, A. Toksyny wytwarzane przez sinice. Ecol. Chem. Eng. 2008, 15, 69–76. [Google Scholar]
- Hall, D.J.; Threlkeld, S.T.; Burns, C.W.; Crowley, P.H. The Size-Efficiency Hypothesis and the Size Structure of Zooplankton Communities. Annu. Rev. Ecol. Evol. Syst. 1976, 7, 177–208. [Google Scholar] [CrossRef]
- Zeebe, R.E. History of Seawater Carbonate Chemistry, Atmospheric CO2, and Ocean Acidification. Annu. Rev. Earth Planet. Sci. 2012, 40, 141–165. [Google Scholar] [CrossRef]
- U.S. EPA. Ambient Water Quality Criteria for Dissolved Oxygen; EPA/PB86-208253; U.S. Environmental Protection Agency, Office of Water: Washington, DC, USA, 1986. [Google Scholar]
- Kaleta, J.; Papciak, D.; Puszkarewicz, A. Usuwanie Fosforanów z Roztworów Wodnych w Procesie Koagulacji Powierzchniowej. 2014. Available online: https://water.put.poznan.pl/images/fullpapers/2014/technologie_uzdatninia_wod/767_woda2014_woda_2014.pdf (accessed on 27 July 2025).
Disclaimer/Publisher’s Note: The statements, opinions and data contained in all publications are solely those of the individual author(s) and contributor(s) and not of MDPI and/or the editor(s). MDPI and/or the editor(s) disclaim responsibility for any injury to people or property resulting from any ideas, methods, instructions or products referred to in the content. |
© 2025 by the authors. Licensee MDPI, Basel, Switzerland. This article is an open access article distributed under the terms and conditions of the Creative Commons Attribution (CC BY) license (https://creativecommons.org/licenses/by/4.0/).

