Abstract
Groundwater serves as a vital water resource for agricultural irrigation and domestic use in farmland areas. Its chemical composition is jointly influenced by agricultural fertilization, land use practices, and natural geological processes. However, research on the controlling factors and spatial distribution characteristics of groundwater hydrochemistry in agricultural regions remains insufficient. In this study, 56 groundwater samples were collected from the central-eastern plain of Henan Province, China. A combination of hierarchical cluster analysis, ionic ratio methods, principal component analysis, and kriging interpolation was employed to investigate the hydrochemical characteristics, spatial patterns, and primary controlling factors of regional groundwater. The results indicate that the first group of samples is characterized by high total dissolved solids (TDS), elevated Na+ and Cl− concentrations, predominantly controlled by evaporation and concentration processes. The second group exhibits high pH and low Ca2+ concentrations, mainly influenced by silicate weathering, with reverse cation exchange acting as a secondary controlling process. The third group is characterized by elevated concentrations of Ca2+ and NO3−, primarily controlled by carbonate weathering and agricultural activities. The western part of the study area serves as the main groundwater recharge zone and has the highest NO3− and Ca2+ concentrations. In the central area, most ion concentrations are relatively high, forming a distinct gradient with surrounding regions. Meanwhile, the eastern area displays elevated concentrations of HCO3−, TDS, Na+, and Cl−, highlighting pronounced spatial heterogeneity. Overall, the hydrochemical composition of groundwater in the study area is shaped by both natural processes and anthropogenic activities, exhibiting significant spatial heterogeneity. Notably, the spatial variation of NO3− concentrations is substantial, indicating that certain localities have already been affected by agricultural non-point source pollution.
1. Introduction
Groundwater is among the most vital freshwater resources on Earth, serving as a critical source for agricultural irrigation, industrial production, and domestic consumption. In China, nearly 400 cities and over 70% of the population depend on groundwater as their primary drinking water supply [1]. This reliance is particularly pronounced in regions with scarce surface water resources or frequent seasonal droughts, where groundwater provides a stable and reliable source [2]. However, accelerated industrial development, intensified agricultural fertilization, urban expansion, and the combined influences of geological conditions and climate change have increasingly threatened groundwater resources, resulting in both water quality degradation and risks to supply security [3]. These challenges are especially acute in predominantly agricultural regions, where groundwater is not only the main source for irrigation, but its chemical composition and evolution are also significantly affected by land use patterns and agricultural practices [4]. Consequently, investigating the hydrochemical characteristics and controlling factors of groundwater in typical agricultural areas is essential for elucidating the evolution of groundwater chemistry and promoting sustainable groundwater resource management.
In recent years, considerable advances have been made in groundwater hydrochemistry research, both in China and internationally, particularly in understanding the genesis of groundwater chemistry and identifying sources of contamination, driven by the development of diverse analytical approaches. For instance, Piper and Gibbs diagrams are widely employed to analyze the characteristics of major groundwater ions and their controlling mechanisms [5], while ionic ratio methods can further identify the sources of groundwater solutes and the intensity of ion exchange processes [6,7]. Moreover, multivariate statistical techniques such as principal component analysis (PCA) and hierarchical cluster analysis (HCA) have been utilized to determine the main controlling factors and interrelationships within groundwater chemical datasets [8,9]. By integrating multiple hydrochemical analytical methods, researchers have elucidated the mechanisms of rock weathering, water–rock interactions, evaporation concentration, and anthropogenic impacts on groundwater chemistry. Nevertheless, most existing studies focus on individual analytical methods; comprehensive research that systematically classifies and analyzes groundwater hydrochemistry in predominantly agricultural regions, especially in conjunction with land use patterns, remains limited. In particular, studies addressing the controlling factors and spatial distribution characteristics of groundwater hydrochemistry—and their connections with agricultural activities—are still insufficient.
Henan Province, located in the southern part of the North China Plain, is one of China’s most important agricultural production bases and major grain-producing areas. The region’s land use is dominated by agriculture, and groundwater is indispensable for agricultural irrigation [10,11]. Over the years, intensified agricultural activities, extensive application of fertilizers and pesticides, and industrial wastewater discharge have posed serious threats to groundwater resources through over-extraction and pollution [12]. Contaminants such as nitrate, chloride, and calcium ions are commonly found in agricultural groundwater, not only altering its chemical composition but also leading to complex and regionally differentiated spatial distribution patterns and controlling mechanisms [1,13]. Although some studies have preliminarily assessed groundwater quality and pollution status in Henan Province [14,15], systematic research on the classification, spatial distribution, and controlling factors of groundwater hydrochemistry in typical agricultural areas remains lacking. This gap hinders a deeper understanding of the causes of groundwater pollution induced by agricultural activities and limits the ability to provide scientific support for land use optimization and groundwater pollution prevention.
Therefore, this study focuses on a representative agricultural area in the central-eastern plain of Henan Province, systematically investigating the hydrochemical characteristics and controlling factors of groundwater by integrating multiple hydrochemical analytical methods with an assessment of land use patterns. The aim is to provide a scientific foundation for the sustainable utilization and pollution prevention of groundwater resources.
2. Materials and Methods
2.1. Study Area
The study area is located in the central-eastern part of Henan Province (112°43′ E–115°32′ E, 33°21′ N–34°34′ N), covering portions of Pingdingshan, Xuchang, Luohe, Zhoukou, and Shangqiu cities, as shown in Figure 1. The topography of the region is generally high in the west and low in the east, with elevations ranging from 13 m to 966 m and significant relief. The western part consists of the middle and low mountainous and hilly areas, which are the eastern foothills of the Funiu Mountains, while the eastern part is predominantly flat plain, except for a few isolated residual hills. The study area is situated in a warm temperate, semi-humid monsoon climate zone. The region experiences dry and windy springs with frequent sandstorms, hot summers with concentrated rainfall, sunny autumns with long sunshine duration, and cold winters with little rain or snow. Precipitation is unevenly distributed throughout the year, and there are large variations in sunshine and temperature. The annual precipitation ranges from 700 to 800 mm, the annual potential evapotranspiration ranges from 904.8 to 1251.8 mm, the average annual temperature is around 15 °C, and the frost-free period lasts between 214 and 231 days. There are five types of aquifers in the study area, with the majority being pore water in alluvial-proluvial deposits of accumulation plains. The other four aquifer types are mainly distributed in the higher elevation western part of the region. Zhoukou and Shangqiu are characterized by a single aquifer type, while Xuchang contains the most diverse aquifer types, with four identified. Both Pingdingshan and Luohe each have three aquifer types.
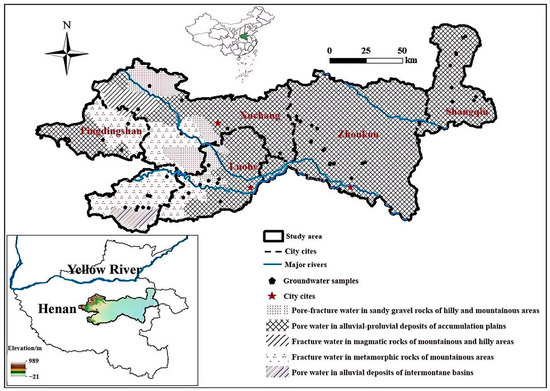
Figure 1.
Location map of the study area.
2.2. Sample Collection and Analysis
Field sampling was conducted in August 2022, resulting in the collection of 56 groundwater samples: 12 from Pingdingshan, 8 from Xuchang, 8 from Luohe, 18 from Zhoukou, and 10 from Shangqiu. The locations of the sampling sites are shown in Figure 1. All groundwater samples were collected from shallow groundwater and encompass all aquifer types present in the study area. Prior to sampling, each well was flushed using a pumping method, followed by rinsing the polyethylene sampling bottles with deionized water. A 500 mL water sample was collected at each site and stored in a cooler at 4 °C. Simultaneously, the location information of each site—including city, county, township, water source type, and well depth—was recorded, and the sampling sites were geolocated using GPS to obtain latitude and longitude. The concentrations of Cl−, SO42−, K+, Na+, Ca2+, Mg2+, and NO3− were determined using ion chromatography, while HCO3− and CO32− concentrations were measured by acid titration with hydrochloric acid. The cation–anion balance error for all samples was controlled within ±5%.
2.3. Data Processing and Statistical Analysis
Piper and Stiff diagrams were generated using AquaChem 3.70, and saturation indices were calculated with PHREEQC version 3.7.3 using the phreeqc.dat thermodynamic database. Other hydrochemical data analyses and plotting were performed in the R 4.4.2 environment, Principal component analysis was conducted using the FactoMineR and factoextra packages, cluster analysis was performed with the cluster package, and figures were generated using the ggplot2 package. Spatial mapping was carried out using ArcGIS 10.2. Land cover data were obtained from the European Space Agency (ESA) WorldCover 10 m 2021 dataset (ESA WorldCover 10 m 2021, v100), with a spatial resolution of 10 m.
3. Results
3.1. Sample Classification and Descriptive Statistical Analysis
In this study, hierarchical cluster analysis (HCA) was conducted on 56 groundwater samples using Ward’s linkage method to identify distinct hydrochemical types. Clustering was performed based on the concentrations of major ions, including HCO3−, SO42−, Cl−, K+, Ca2+, Mg2+, Na+, as well as pH. As illustrated in the dendrogram (Figure 2), the samples were grouped into three distinct clusters (C1, C2, and C3) by truncating the dendrogram at a linkage distance of approximately 10. The cluster sizes were 7, 20, and 29 samples, respectively, with C3 representing the most prevalent hydrochemical type in the study area, followed by C2, while C1 contained the fewest samples.
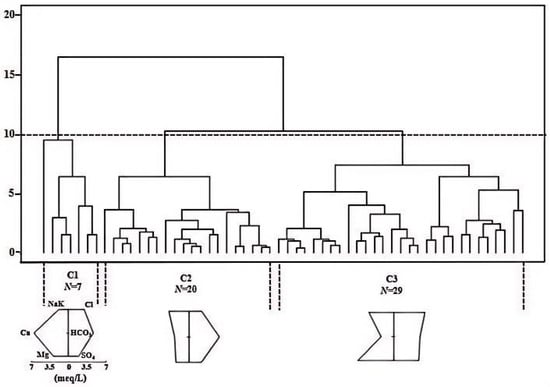
Figure 2.
Hierarchical Ward clustering of groundwater samples based on hydrochemical composition.
As shown in Table 1, cluster C1 exhibits the highest average TDS value (937.8 mg/L), with a maximum reaching 1189.3 mg/L. The concentrations of Na+ and Cl− in C1 are significantly higher than those in C2 and C3, and K+ levels are also relatively elevated. This suggests that groundwater in C1 is strongly influenced by evaporation–concentration processes and mineral dissolution. The distributions of HCO3− and Ca2+ are relatively uniform, indicating stable dissolution of carbonate minerals. Although the average NO3− concentration is low, the coefficient of variation (CV) reaches 1.09, implying that certain locations may be affected by agricultural non-point source pollution.

Table 1.
Descriptive statistics of hydrochemical parameters for groundwater clusters (C1, C2, and C3).
In C2, the concentrations of HCO3− and SO42− are at moderate levels, reflecting a mixed hydrochemical type. The average values of TDS, Ca2+, and Mg2+ are the lowest among all clusters, indicating that groundwater in this group is likely influenced by freshwater recharge or cation exchange processes. The distribution of NO3− is highly uneven, with an average concentration of 17.9 mg/L, a maximum of 158.8 mg/L, and a CV of 2.14, suggesting significant local impacts from agricultural fertilization or sewage infiltration. Cluster C3 has an average TDS of 428.7 mg/L, intermediate between C1 and C2, with a maximum of 713.3 mg/L, indicative of moderate mineralization. Both the average and maximum values of Ca2+ are the highest among all clusters. The mean NO3− concentration is also highest in C3 (21.5 mg/L), with a maximum of 133.1 mg/L and a CV of 1.60. Furthermore, SO42− and Cl− concentrations in C3 are significantly higher than those in C2 but lower than those in C1, indicating some contribution from the dissolution of sulfate and chloride minerals. In summary, C1 is characterized by the highest mineralization and relatively uniform ion distributions; C2 shows the lowest mineralization but a highly uneven NO3− distribution; and C3 exhibits intermediate mineralization and ion concentrations, with the highest average NO3− value among the three clusters.
To further validate the cluster analysis results and explore the dominant factors controlling groundwater hydrochemistry, principal component analysis (PCA) was applied to the hydrochemical dataset. As shown in the principal component score scatter plot (Figure 3), the three clusters are clearly separated into the principal component space, indicating that the hydrochemical types identified through cluster analysis possess distinct chemical signatures that are effectively distinguished by PCA. Some overlap of data points is observed at the boundaries between clusters, suggesting possible transitional or mixed states between different hydrochemical types.
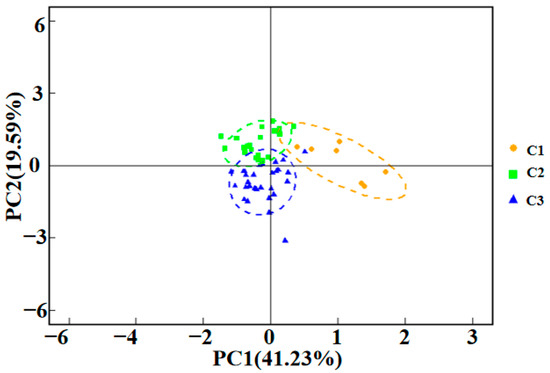
Figure 3.
Principal Component Analysis of hydrochemical parameters in groundwater samples, showing clusters C1, C2, and C3.
As shown in Table 2, principal component analysis (PCA) extracted three principal components: PC1, PC2, and PC3. PC1 and PC2 explain 41.23% and 19.50% of the total variance, respectively, with PC1 accounting for the largest share and thus representing the principal variation pattern within the hydrochemical dataset. The major controlling factors associated with each principal component can be inferred from their loading values. PC1 is primarily characterized by strong positive loadings for Na+, Cl−, Mg2+, SO42−, and HCO3−, indicating that high PC1 scores are associated with elevated concentrations of these ions. This suggests that PC1 reflects groundwater mineralization and processes related to the dissolution of evaporite minerals or potential seawater intrusion. PC2 is mainly defined by positive loadings of pH and Na+ and a strong negative loading of Ca2+, meaning that high PC2 scores correspond to higher pH, increased Na+, and reduced Ca2+ concentrations. This pattern implies that PC2 is indicative of reverse cation exchange processes in the groundwater. PC3 is dominated by a strong positive loading for K+, suggesting that high PC3 scores are linked to elevated K+ concentrations, which may result from the dissolution of potassium-bearing minerals or the impact of agricultural activities. Analysis of the principal component scores for the samples reveals that all C2 samples exhibit positive PC2 scores, with some also having positive PC1 scores. This indicates that reverse cation exchange is the main hydrochemical controlling factor for C2, consistent with the low Ca2+ and Mg2+ concentrations observed in Table 1. All C1 samples have positive PC1 scores, reflecting their high TDS, Na+, and Cl− concentrations. In contrast, most C3 samples display negative PC1 and PC2 scores, suggesting that other hydrochemical controlling factors, such as anthropogenic influences, may play a significant role in this cluster.
Table 2.
Factor loadings of hydrochemical parameters.
3.2. Analysis of Hydrochemical Characteristics
As shown in Figure 4, C1 samples are mainly distributed in regions with high proportions of Mg2+ and (CO32− + HCO3−). C2 samples are primarily found in areas with higher proportions of (Na+ + K+) and (CO32− + HCO3−), while C3 samples are concentrated in zones where Ca2+ and (CO32− + HCO3−) are more abundant. When projected onto the diamond-shaped field of the Piper diagram, C1 samples mainly fall between zones 1 and 4, with some points scattered in zone 9. This indicates that the cations in C1 are predominantly alkaline earth metals, and the anions are intermediate between strong and weak acid radicals. Some samples exhibit a more complex ionic composition without a clearly dominant ion. C2 samples are primarily distributed in zones 3, 5, and 9 of the diamond field. This suggests that a substantial portion of C2 samples is dominated by weak acid anions, with carbonate hardness exceeding 50%, indicating a close association with carbonate dissolution and a predominance of bicarbonate-type water. Samples located in zone 9 have complex ionic compositions without a dominant ion pair, suggesting that their hydrochemical composition is influenced by multiple factors, which may include the weathering of various rock types and mixing of different water sources. Overall, the hydrochemical types of C2 are relatively complex, possibly representing varying degrees of carbonate dissolution, weathering of other rocks, and mixing of water from different sources. C3 samples are mainly distributed in zones 1 and 5 of the diamond field, with additional occurrences in zones 3 and 4. This indicates that the majority of C3 samples are characterized by alkaline earth metal cations and carbonate hardness exceeding 50%. These samples are predominantly controlled by carbonate dissolution and are mainly of the Ca–Mg–HCO3 type. The distribution in zones 3 and 4 suggests that some C3 samples have relatively high concentrations of weak or strong acid anions, indicating that certain samples may be affected by other processes such as the weathering of different rock types or external inputs, leading to increased sulfate or chloride contents. Although C3 samples are primarily of the Ca–Mg–HCO3 type, they may also be influenced by other hydrogeochemical processes or anthropogenic activities, resulting in some diversity in their hydrochemical composition. According to the Shukarev classification, the hydrochemical types in the C3 cluster are the most diverse, encompassing 15 types, followed by C2 with 10 types, while C1 exhibits the least diversity with only four types. The predominant hydrochemical types in C1 are Na-Mg-HCO3-Cl, Na-Mg-HCO3-SO4-Cl, and Na-Mg-SO4-Cl. In C2, the main hydrochemical type is Na-Ca-Mg-HCO3, whereas in C3, Ca-HCO3-Cl is the dominant type (see Supplementary Materials Table S1).
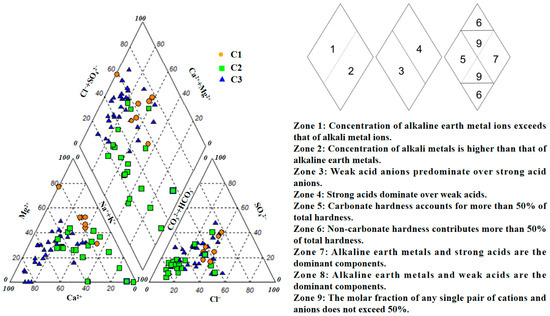
Figure 4.
Piper diagram representing the hydrochemical facies and zonation of the three clusters in groundwater samples.
3.3. Analysis of Hydrogeochemical Processes
The Gibbs diagram is an important method for qualitatively analyzing the genesis of groundwater chemistry and is among the most effective and widely used tools for distinguishing various hydrogeochemical processes [16]. As shown in Figure 5a,b, the scatter plots of Cl−/(Cl− + HCO3−) and Na+/(Na+ + Ca2+) ratios versus TDS demonstrate that rock weathering is the main mechanism controlling groundwater hydrochemistry in the study area. The majority of C2 and C3 samples are distributed within the rock weathering-dominated region, while those C2 and C3 samples located outside the boundaries of the Gibbs model indicate that anthropogenic activities also exert a certain influence on the formation of groundwater chemical components in this region [17]. C1 samples are mainly distributed in the evaporation–concentration-dominated region, indicating that evaporation is the key process controlling the chemical composition of C1. The relatively high TDS values, as well as elevated concentrations of Na+ and Cl− in C1, are consistent with the characteristics of salt accumulation caused by evaporation and concentration. Groundwater can react with aquifers of different lithologies, typically involving three types of weathering: carbonate weathering, silicate weathering, and evaporite weathering [18]. Further analysis of the controlling factors in the study area was performed by introducing a weathering end-member diagram. As shown in Figure 5c,d, all groundwater samples are distributed between the silicate and carbonate end-members. This indicates that groundwater chemistry in the study area is primarily controlled by carbonate weathering and by silicate weathering, while the contribution from evaporite weathering is minor.
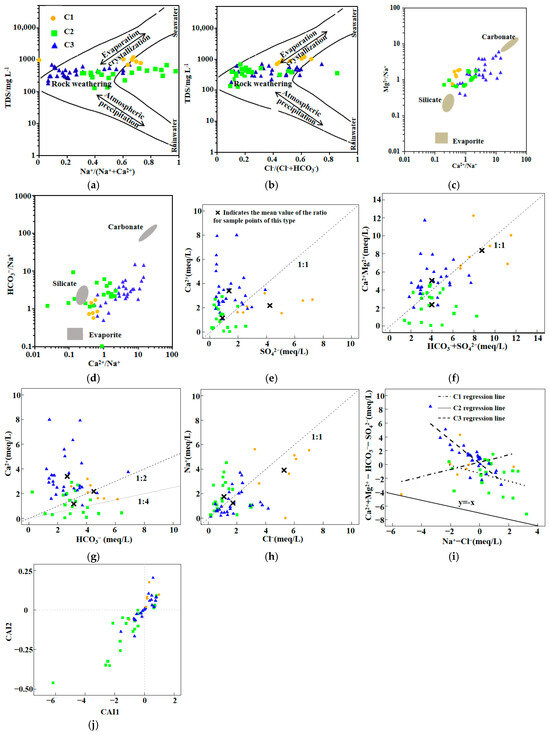
Figure 5.
Ion ratio analysis diagrams. (a) Gibbs diagram based on TDS vs. Na+/(Na+ + Ca2+); (b) Gibbs diagram based on TDS vs. Cl−/(Cl− + HCO3−); (c) Weathering Source Identification Diagram(Ⅰ); (d) Weathering Source Identification Diagram(Ⅱ); (e) Ca2+ vs. SO42− ion ratio plot; (f) (Ca2+ + Mg2+) vs. (HCO3− + SO42−) ion ratio plot; (g) Ca2+ vs. HCO3− ion ratio plot; (h) Na+ vs. Cl− ion ratio plot; (i) (Ca2+ + Mg2+) − (HCO3− + SO42−) vs. Na+ − Cl− diagram; (j) Chloro-Alkaline Indices (CAI) Diagram.
If gypsum dissolution is the principal source of Ca2+ and SO42−, the Ca2+/SO42− ratio should be close to 1. However, Figure 5e shows that most samples are located above and far from the 1:1 line, indicating that gypsum dissolution is not the main source of Ca2+ in groundwater. When the dissolution of calcite, dolomite, and gypsum is the dominant geochemical process, the ratio of (Ca2+ + Mg2+) to (SO42− + HCO3−) should approach 1:1 [19]. In Figure 5f, most samples exhibit (Ca2+ + Mg2+)/(SO42− + HCO3−) ratios close to 1:1, suggesting that carbonate dissolution is significant in the hydrochemical process. However, some C1 and C2 samples deviate from the 1:1 line, and most C3 samples are positioned above the 1:1 line, indicating that the principal cations Ca2+ and Mg2+ in C3 have additional sources, whereas C2 samples mainly distributed below the 1:1 line suggest the occurrence of reverse cation exchange. The 1:2 and 1:4 lines in Figure 5g represent the dissolution of dolomite and calcite, respectively. C1 and C2 samples are distributed near both lines, indicating that the dissolution of calcite and dolomite contributes comparably to Ca2+ and HCO3− in these groups. Most C3 samples are positioned above the y = 1/2x line, suggesting that besides calcite, dolomite, and gypsum dissolution, there are substantial anthropogenic sources of Ca2+ [20]. The Na+/Cl− ratio can be used to analyze the source of Na+ in groundwater [21]. If halite dissolution is the main source, the Na+/Cl− ratio should be approximately 1. As shown in Figure 5h, the sample points are closely distributed near the 1:1 line, indicating that halite dissolution is one of the sources of Na+ in the study area. C1 and C3 samples below the 1:1 line suggest the possible occurrence of direct cation exchange in the groundwater, whereby Na+ in the water is exchanged with Ca2+ and Mg2+ on the surface of the aquifer matrix [22], whereas C2 samples above the 1:1 line indicate the influence of silicate weathering and anthropogenic activities, as human activities may introduce salts into groundwater through various pathways, thus affecting the natural composition of the water [23].
Cation exchange is one of the sources of Na+ in groundwater, as Na+ is weakly adsorbed on soil particles, and Ca2+ and Mg2+ in groundwater can easily replace Na+ on soil surfaces [24]. When (Ca2+ + Mg2+ − SO42− − HCO3−) and (Na+ − Cl−) are negatively correlated and the slope approaches −1, this indicates a stronger cation exchange process [25]. In Figure 5i, the regression slopes for C2 and C3 are −0.79 and −0.87, respectively, with the slope for C3 being closer to −1 and the regression fit being better, suggesting that cation exchange intensity in C3 is greater than in C1 and C2, and that C3 groundwater samples are more open. The chloro-alkaline indices were calculated to further determine the direction of cation exchange in the samples. As shown in Figure 5j, the vast majority of C2 samples have negative CAI1 and CAI2 values, indicating the occurrence of reverse cation exchange, i.e., Ca2+ and Mg2+ in the water are replaced by Na+ and K+ from the rocks. The concentrations of Ca2+ and Mg2+ in C2 samples are also the lowest, which is consistent with the results of cluster analysis and principal component analysis. C1 shows relatively weak direct cation exchange. Both direct and reverse cation exchange occur in C3, indicating that cation exchange is not the main source of the high Ca2+ content in C3, and its source requires further investigation.
The mineral saturation index (SI) was calculated using SI = log(IAP/Ks), where IAP represents the ion activity product of the relevant ions in the mineral dissolution reaction, and Ks is the solubility product of the mineral. SI < 0, SI = 0, and SI > 0 indicate that groundwater is in an undersaturated, equilibrium, and supersaturated state with respect to the mineral, respectively. It is generally considered that when SI falls within the range of [−0.5, 0.5], the aqueous solution and the mineral are in equilibrium [26].
As shown in Figure 6, calcite and dolomite in groundwater from the study area are mostly in equilibrium or supersaturated states, with this phenomenon being particularly significant in the C2 and C3 clusters. When minerals are supersaturated in groundwater, it indicates their abundance in the hydrological system and relatively long residence times. In some samples, calcite and dolomite reach saturation equilibrium, while in the majority of samples, these minerals are supersaturated. The dominance of soda-type groundwater in the C2 cluster forms during the transition from carbonate dissolution to aluminosilicate dissolution [27], indicating that aluminosilicate weathering is the principal controlling factor for C2. Secondly, according to Figure 5a, most sampling points of C2 are distributed on the side where Na+/(Na+ + Ca2+) > 0.5. When the bedrock is mainly aluminosilicate, Na+/(Na+ + Ca2+) > 0.5 (i.e., Na+ > Ca2+) indicates a higher contribution from silicate chemical weathering. Under such conditions, minor dissolution of carbonate and gypsum cements may occur, which is consistent with the results of the saturation index analysis [28]. This further confirms that silicate weathering is the dominant controlling factor for C2. As shown in Figure 1, the study area is mainly composed of sandy gravel rocks, magmatic rocks, and metamorphic rocks that are rich in aluminosilicate minerals, which serve as the principal sources for silicate weathering. Evaporite minerals are clearly undersaturated in all clusters, which is attributed to the gradual dissolution of evaporite minerals during groundwater flow, with no precipitation occurring, leading to an increase in Ca2+ concentration in the water. This process results in carbonate minerals reducing Ca2+ content in groundwater through precipitation. The saturation index of gypsum is significantly positively correlated with the concentrations of Ca2+ and SO42−, but all SI values remain below zero, indicating that gypsum remains undersaturated in the groundwater of the study area and shows no tendency to precipitate. The degree of supersaturation in the C1 cluster is the lowest, which is consistent with the previous analysis that C1 is mainly influenced by evaporation and concentration.
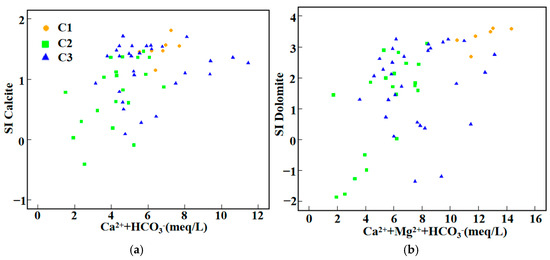
Figure 6.
Saturation index diagram (a) SI_Calcite vs. Ca2+ + HCO3−; (b) SI_Dolomite vs. Ca2+ + Mg2+ + HCO3−; (c) SI_Gypsum vs. Ca2+ + SO42−; (d) SI_Halite vs. Na+ + Cl−.
3.4. Analysis of Human Activity Inputs
To further investigate the sources of elevated Ca2+ concentrations in C3 water samples, correlation chord diagrams for each cluster were constructed, as shown in Figure 7. In C3, Ca2+ exhibits extremely strong correlations with hydrochemical indicators associated with human activities; the correlation coefficients between Ca2+ and Cl−, Ca2+ and NO3−, and Cl− and NO3− reach 0.81, 0.70, and 0.75, respectively. Based on previous conclusions that C3 water samples are not sensitive to other water–rock interaction processes, it can be inferred that anthropogenic inputs may be one of the main sources of chemical components in C3 samples. The high correlation between Ca2+ and Mg2+ in C1 and C2 water samples is consistent with the analysis in Figure 5. Except for C1, NO3− and Cl− in both C2 and C3 water samples show extremely strong correlations. Combined with the previous finding that halite dissolution is not the main source of Cl−, it can be concluded that the primary source of Cl− in the study area is likely anthropogenic input.
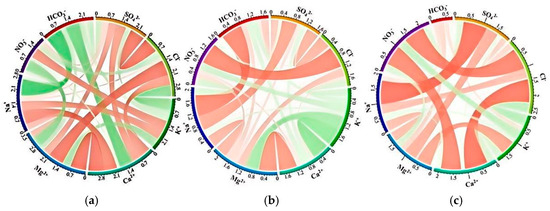
Figure 7.
Chord diagrams of Pearson correlations among major ions in groundwater clusters. (a) Cluster 1; (b) Cluster 2; (c) Cluster 3.
3.5. Spatial Distribution Characteristics of Major Ions
In this study, the spatial distribution maps of major ions were generated using the Kriging interpolation method, as shown in Figure 8. The additional spatial distribution maps and Kriging parameters are presented in Figure S1 and Table S2 of Supplementary Materials. Due to the relatively close distances between some sampling wells, a buffer zone with a radius of 500 m was established around each sampling point in this study, and the area proportions of different land use types within each buffer zone were calculated. The burial depth of groundwater shows obvious spatial differentiation, with greater depths in the western and central parts of the study area, and shallower depths in the eastern and some local regions. Overall, the burial depth of groundwater decreases from west to east, with the west and central regions characterized by deeper groundwater and the east by shallower groundwater. The main ions in groundwater also exhibit clear spatial heterogeneity. In the western part of the study area, NO3− concentrations are significantly higher and this region contains the highest NO3− levels observed. High Ca2+ concentrations are also mainly distributed in this region, whereas in other areas Ca2+ concentrations are substantially lower; Ca2+ and NO3− demonstrate strong spatial consistency. As a typical indicator pollutant of anthropogenic activities in groundwater [29], NO3− and the C3 samples are mainly distributed in the western part of the study area. The region with the lowest TDS is located in the western part of the study area, where only Ca2+ and NO3− concentrations are high among the main chemical components, while other ions are at low levels, once again highlighting the severity of anthropogenic pollution in the west. Na+ and K+ concentrations are generally high in most areas, which is consistent with previous conclusions regarding the effects of evaporation–concentration and reverse cation exchange. The area with low Na+ concentrations is mainly concentrated in the west, further validating the influence of agricultural activities on groundwater in this region. In the central and eastern parts of the study area, both Na+ and Cl− concentrations are high, and the highest TDS values are also found in the eastern part, where a greater number of C1 samples and construction land are distributed, with the proportion of construction land in C1 samples being the highest among the three water types. Both CO32− and HCO3− are highly concentrated in the eastern region. Combined with the distribution of high Ca2+, Mg2+, and CO32− concentrations, it can be further concluded that the southeastern part of Shangqiu City is the main groundwater area affected by carbonate mineral dissolution.
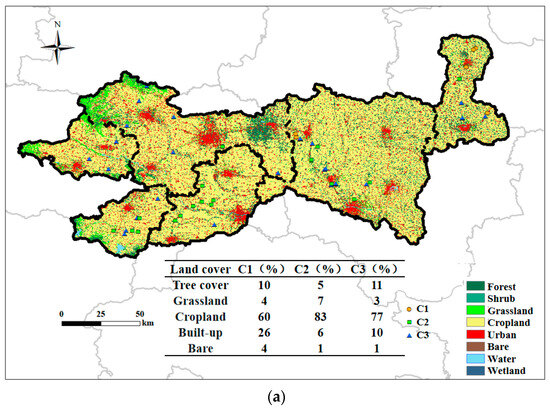
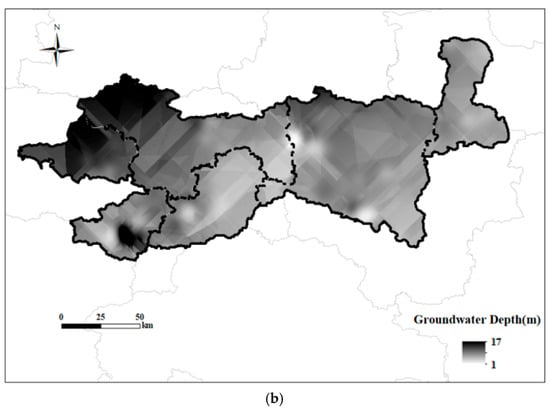
Figure 8.
Spatial distribution of land use (a) and groundwater depth (b) in the study area.
4. Discussion
4.1. Influence of Agricultural Activities on the Controlling Factors of Groundwater Hydrochemistry in Plain Areas
Previous studies have demonstrated that in typical plain regions, the hydrochemical composition of groundwater is mainly controlled by water–rock interactions, particularly the dissolution of carbonate rocks and cation exchange processes, which are considered the dominant sources of major ions in groundwater [30,31]. These conclusions are primarily based on analyses of ion ratios and calculations of saturation indices (SI). Through ion ratio analysis, previous research found that the major ions in groundwater of plain areas are closely related to the dissolution equilibrium of carbonate rocks, indicating that the formation of groundwater chemical characteristics is mainly governed by the weathering and dissolution, precipitation, and cation exchange processes of carbonate, silicate, and evaporite rocks.
However, this study conducted an in-depth analysis of the controlling factors of groundwater hydrochemistry in plain areas with intensive farmland distribution, and the results indicate that the dominant factors in groundwater hydrochemistry have changed significantly, with agricultural activities now becoming one of the key controlling factors. This finding is validated by ion ratio analyses. In addition, the calculated saturation indices show that groundwater is undersaturated with respect to major carbonate minerals, further suggesting that the contribution of carbonate dissolution to groundwater hydrochemistry is limited—a finding that stands in stark contrast to previous research in plain areas. Specifically, in the central and eastern regions of Henan Province, the proportion of cultivated land is high, and grain crops are intensively cultivated. To ensure high yields, farmers commonly apply substantial amounts of chemical and organic fertilizers, particularly nitrogen and compound fertilizers. Additionally, to meet the water demands of major crops such as wheat and maize, both irrigation frequency and intensity are elevated. Prolonged intensive fertilization and frequent irrigation have facilitated the leaching of NO3−, Ca2+, Cl−, and other ions from soils into the groundwater system via rainfall or irrigation, significantly altering the hydrochemical composition of regional groundwater and diminishing the dominance of traditional water–rock interactions [32]. Moreover, the widespread application of agricultural chemicals, including pesticides and herbicides, has resulted in the infiltration of various organic and inorganic constituents into the aquifer, further impacting groundwater chemistry [33]. Furthermore, the flat topography and shallow groundwater table in central and eastern Henan, coupled with the development of agricultural infrastructure such as drainage ditches and subsurface drainage systems, have enhanced the exchange between surface water and groundwater and increased the potential pathways for contaminants to enter the aquifer. Meanwhile, intensified shallow groundwater circulation and evaporation during irrigation further promote the accumulation of certain ions (e.g., Cl− and SO42−), exacerbating the anthropogenic impact on groundwater quality. Consequently, elevated concentrations of NO3− and Ca2+ have been observed in groundwater, posing potential risks of regional eutrophication.
In addition to being related to intensive fertilizer application and irrigation, the high concentrations of Ca2+ observed in the study area may also be attributed to the leakage of domestic sewage and livestock manure. In regions with developed animal husbandry or inadequate management of domestic wastewater, Ca2+ and other ions present in sewage and manure can infiltrate into the groundwater system through leaching. Henan Province is one of the most important animal husbandry provinces in China, with its livestock industry ranking third nationwide in output value in recent years. Large-scale livestock and poultry farming results in substantial manure production, and if not properly managed, Ca2+ and other ions in the manure can enter the groundwater via surface runoff or infiltration, thereby affecting the hydrochemical composition of regional groundwater. This process is particularly pronounced in areas with intensive animal husbandry, posing greater challenges to local groundwater environmental security. Furthermore, Henan is the third most populous province in China, with the majority of its population concentrated in the plains of the central and eastern regions. In these densely populated areas, domestic sewage discharge is substantial, and agricultural and animal husbandry activities are also more concentrated, further intensifying pressures on the groundwater system. Therefore, the contribution of domestic sewage and livestock manure leaching to groundwater Ca2+ concentrations cannot be neglected in the central and eastern plains of Henan Province.
4.2. Influencing Factors of the Spatial Differentiation of Major Ions
The transitional zone in the central part of the study area is characterized by gentle topography, shallow groundwater depths, and a mosaic of cultivated land, forest land, and construction land, indicating complex hydrogeological conditions and the presence of mixed recharge sources. This study also reveals that TDS and Mg2+ concentrations in the forest land of the central region are higher than those in the surrounding areas, forming a distinct spatial gradient. Although previous studies have generally reported that groundwater in forested catchments tends to exhibit lower TDS concentrations—primarily due to deeper flow paths, enhanced nutrient uptake by vegetation, and reduced anthropogenic disturbances [34]—the higher values observed in this study may be attributed to the unique hydrogeological conditions and land use patterns of the study area. Firstly, according to Zeng et al. [35], the decomposition of organic matter and high CO2 production under forest cover can enhance the weathering and dissolution of soil and bedrock, particularly of Mg-bearing minerals, thereby increasing Mg2+ concentrations in groundwater. In addition, as shown in Figure 8a, the forest land in the central region is not a pristine forest area, but is interspersed with cultivated and construction land, resulting in complex groundwater recharge sources and significant mixing of water bodies. The well-developed root systems and strong transpiration of trees, under conditions of limited precipitation or shallow groundwater tables, can lead to elevated concentrations of dissolved ions in the soil, which may subsequently percolate into the groundwater [36]. Moreover, surface runoff and atmospheric deposition associated with surrounding agricultural activities may introduce additional nutrients and ions into the forest land, further increasing TDS and Mg2+ concentrations. Furthermore, In the eastern part of the study area, the terrain is lower, and groundwater depth is shallower. Such flat and shallow regions are typically agricultural irrigation zones or river alluvial plains, where groundwater is more susceptible to recharge from surface water and the influence of pollution sources [37]. However, the level of nitrate contamination in this area is relatively low, indicating lower intensity of human activities and limited pollution sources. The western region of the study area is higher in elevation and has deeper groundwater levels, with notably high nitrate concentrations. This may be because the western area serves as the main recharge zone for groundwater, where atmospheric precipitation infiltrates and recharges the aquifer, and if nitrate sources exist on the surface, nitrate is likely to infiltrate and accumulate in the deeper aquifers. Furthermore, in high-elevation, deep-buried areas, the greater hydraulic gradient and higher groundwater flow velocity favor the migration and dispersion of soluble pollutants such as nitrate, potentially leading to nitrate accumulation along the flow path. C1-type water samples are mainly distributed in areas with a high proportion of construction land, where groundwater is generally shallow. The discharge of municipal sewage and industrial wastewater increases the extent and retention time of surface water bodies, indirectly enhancing the impact of evaporation–concentration processes on groundwater chemistry. The evaporation of shallow surface water promotes further solute enrichment, changes the recharge sources and chemical composition of groundwater, and leads to significantly increased concentrations of TDS, Na+, and Cl− [38].
In this study, although the spatial distribution of land use was considered, the dynamic changes and cumulative effects of land use over time on groundwater chemistry were not fully addressed, which may underestimate the potential impact of land use change on groundwater quality. Future research should incorporate land use change and climate scenarios, conduct long-term dynamic monitoring, and assess the cumulative impacts of different land use patterns on groundwater chemistry.
5. Conclusions
The hydrochemical composition of groundwater in the study area is jointly influenced by multiple factors.
The first type of water sample is primarily controlled by evaporation–concentration processes, characterized by high TDS, high Na+ concentration, and high Cl− concentration. The second type of water sample is primarily controlled by silicate weathering. Additionally, due to its characteristics of higher pH, relatively elevated Na+ concentrations, and lower Ca2+ concentrations, this type is also partially influenced by reverse cation exchange. The third type is primarily controlled by carbonate weathering and agricultural inputs and is characterized by elevated concentrations of Ca2+ and NO3−.
Major ions in groundwater in the study area exhibit significant spatial differentiation, which is jointly influenced by land use types and hydrogeological conditions in different regions. The western region serves as the main recharge area for groundwater, with significantly higher NO3− and Ca2+ concentrations. The central transitional zone has shallow groundwater and generally higher ion concentrations, influenced by mixed recharge and forest land vegetation. The eastern region is significantly affected by evaporation–concentration and carbonate dissolution processes.
Supplementary Materials
The following supporting information can be downloaded at https://www.mdpi.com/article/10.3390/w17192815/s1. Table S1: Shukalev Hydrochemical Facies Classification and Frequency Distribution in Different Clusters. Table S2: Kriging interpolation parameters. Figure S1: Spatial distribution of major ions (Ca2+, Mg2+, Na+, K+, HCO3−, CO32−, SO42−, Cl−, NO3−, mg/L), and total dissolved solids (TDS, mg/L).
Author Contributions
Conceptualization, K.H. and P.G.; methodology, S.C. and P.G.; software, P.G. and K.H.; formal analysis, P.G.; investigation, X.L.; data curation, P.G.; writing—original draft preparation, P.G.; visualization, P.G.; funding acquisition, X.L., K.H. and B.L. All authors have read and agreed to the published version of the manuscript.
Funding
This research was financed and conducted under the terms of the National Key Research and Development Program of China (2021YFD1700904), the Henan Province Science and Technology Research Project (252102110198), and the Major Projects of the Henan Provincial Science and Technology Research Joint Fund (235101610015). In particular, we are grateful to the editor and anonymous reviewers for providing numerous comments and suggestions, which helped improve this manuscript.
Data Availability Statement
The original contributions presented in this study are included in the article and Supplementary Materials. Further inquiries can be directed to the corresponding author.
Conflicts of Interest
The authors do not have any conflicts of interest to report.
References
- Cai, P.; Li, R.; Guo, J.; Xiao, Z.; Fu, H.; Guo, T.; Wang, T.; Zhang, X.; Song, X. Spatiotemporal dynamics of groundwater in Henan Province, Central China and their driving factors. Ecol. Indic. 2024, 166, 112372. [Google Scholar] [CrossRef]
- Zhu, M.; Chen, J.; He, C.; Ren, S.; Liu, G. Multi-method characterization of groundwater nitrate and sulfate contamination by karst mines in southwest China. Sci. Total Environ. 2024, 946, 174375. [Google Scholar]
- Cheng, W.; Feng, Q.; Xi, H.; Yin, X.; Sindikubwabo, C.; Habiyakare, T.; Chen, Y.; Zhao, X. Spatiotemporal variability and controlling factors of groundwater depletion in endorheic basins of Northwest China. J. Environ. Manag. 2023, 344, 118468. [Google Scholar] [CrossRef]
- Li, X.; Zhang, C.; Huo, Z. Optimizing irrigation and drainage by considering agricultural hydrological process in arid farmland with shallow groundwater. J. Hydrol. 2020, 585, 124785. [Google Scholar] [CrossRef]
- Choudhary, S.; Rao, N.S.; Chaudhary, M.; Das, R. Assessing sources of groundwater quality and health risks using graphical, multivariate, and index techniques from a part of Rajasthan, India. Groundw. Sustain. Dev. 2024, 27, 101356. [Google Scholar] [CrossRef]
- Chen, J.; Yan, B.; Xu, T.; Xia, F. Hydrochemical evolution characteristics and mechanism of groundwater funnel areas under artificial governance in Hengshui City, North China. Ecol. Indic. 2023, 148, 110059. [Google Scholar] [CrossRef]
- Wang, S.; Chen, J.; Zhang, S.; Zhang, X.; Chen, D.; Zhou, J. Hydrochemical evolution characteristics, controlling factors, and high nitrate hazards of shallow groundwater in a typical agricultural area of Nansi Lake Basin, North China. Environ. Res. 2023, 223, 115430. [Google Scholar] [CrossRef] [PubMed]
- Liu, H.; Yang, J.; Ye, M.; Tang, Z.; Dong, J.; Xing, T. Using one-way clustering and co-clustering methods to reveal spatio-temporal patterns and controlling factors of groundwater geochemistry. J. Hydrol. 2021, 603, 127085. [Google Scholar]
- Yang, J.; Ye, M.; Tang, Z.; Jiao, T.; Song, X.; Pei, Y.; Liu, H. Using cluster analysis for understanding spatial and temporal patterns and controlling factors of groundwater geochemistry in a regional aquifer. J. Hydrol. 2020, 583, 124594. [Google Scholar] [CrossRef]
- Li, X.; Yan, B.; Wang, Y.; Wang, X.; Li, Y.; Gai, J. Study of the interaction between Yellow River Water and groundwater in henan province, China. Sustainability 2022, 14, 8301. [Google Scholar] [CrossRef]
- Gao, Y.; Qian, H.; Ren, W.; Wang, H.; Liu, F.; Yang, F. Hydrogeochemical characterization and quality assessment of groundwater based on integrated-weight water quality index in a concentrated urban area. J. Clean. Prod. 2020, 260, 121006. [Google Scholar] [CrossRef]
- Cao, W.; Gao, Z.; Guo, H.; Pan, D.; Qiao, W.; Wang, S.; Ren, Y.; Li, Z. Increases in groundwater arsenic concentrations and risk under decadal groundwater withdrawal in the lower reaches of the Yellow River basin, Henan Province, China. Environ. Pollut. 2022, 296, 118741. [Google Scholar] [CrossRef]
- Savard, M.M.; Somers, G.; Smirnoff, A.; Paradis, D.; van Bochove, E.; Liao, S. Nitrate isotopes unveil distinct seasonal N-sources and the critical role of crop residues in groundwater contamination. J. Hydrol. 2010, 381, 134–141. [Google Scholar] [CrossRef]
- Ren, Y.; Cao, W.; Zhao, L.; Wang, S.; Pan, D.; Zhang, L.; Li, X.; Xiao, S.; Li, Z. Environmental Factors Influencing Groundwater Quality and Health Risks in Northern Henan Plain, China. In Exposure and Healt; Springer: Berlin/Heidelberg, Germany, 2024; pp. 1–16. [Google Scholar]
- Zhang, M.; Wang, L.; Zhao, Q.; Wang, J.; Sun, Y. Hydrogeochemical and anthropogenic controls on quality and quantitative source-specific risks of groundwater in a resource-based area with intensive industrial and agricultural activities. J. Clean. Prod. 2024, 440, 140911. [Google Scholar] [CrossRef]
- Gibbs, R.J. Mechanisms Controlling World Water Chemistry. Science 1970, 170, 1088–1090. [Google Scholar] [CrossRef] [PubMed]
- Selvakumar, S.; Chandrasekar, N.; Kumar, G. Hydrogeochemical characteristics and groundwater contamination in the rapid urban development areas of Coimbatore, India. Water Resour. Ind. 2017, 17, 26–33. [Google Scholar] [CrossRef]
- Gaillardet, J.; Dupre, B.; Louvat, P.; Allegre, C. Global silicate weathering and CO2 consumption rates deduced from the chemistry of large rivers. Chem. Geol. 1999, 159, 3–30. [Google Scholar] [CrossRef]
- Lu, S.; Chen, J.; Zheng, X.; Liang, Y.; Jia, Z.; Li, X. Hydrogeochemical characteristics of karst groundwater in Jinci spring area, north China. Carbonates Evaporites 2020, 35, 68. [Google Scholar] [CrossRef]
- Liu, P.; Hoth, N.; Drebenstedt, C.; Sun, Y.; Xu, Z. Hydro-geochemical paths of multi-layer groundwater system in coal mining regions-Using multivariate statistics and geochemical modeling approaches. Sci. Total Environ. 2017, 601, 1–14. [Google Scholar] [CrossRef]
- Magaritz, M.; Nadler, A.; Koyumdjisky, H.; Dan, J. The use of Na-Cl ratios to trace solute sources in a semi-arid zone. Water Resour. Res. 1981, 17, 602–608. [Google Scholar] [CrossRef]
- Tran, D.A.; Tsujimura, M.; Vo, L.; Nguyen, V.; Kambuku, D.; Dang, D. Hydrogeochemical characteristics of a multi-layered coastal aquifer system in the Mekong Delta, Vietnam. Environ. Geochem. Health 2020, 42, 661–680. [Google Scholar] [CrossRef] [PubMed]
- Wu, X.; Li, C.; Sun, B.; Geng, F.; Gao, S.; Lv, M.; Ma, X.; Li, H.; Xing, L. Groundwater hydrogeochemical formation and evolution in a karst aquifer system affected by anthropogenic impacts. Environ. Geochem. Health 2020, 42, 2609–2626. [Google Scholar] [CrossRef]
- Xiao, J.; Jin, Z.D.; Wang, J.; Zhang, F. Hydrochemical characteristics, controlling factors and solute sources of groundwater within the Tarim River Basin in the extreme arid region, NW Tibetan Plateau. Quat. Int. 2015, 380, 237–246. [Google Scholar] [CrossRef]
- El Ghali, T.; Marah, H.; Qurtobi, M.; Raibi, F.; Bellarbi, M.; Amenzou, M.; EI Mansouri, B. Geochemical and isotopic characterization of groundwater and identification of hydrogeochemical processes in the Berrechid aquifer of central Morocco. Carbonates Evaporites 2020, 35, 37. [Google Scholar] [CrossRef]
- Parkhurst, D.L.; Appelo, C.A.J. User’s Guide to PHREEQC (Version 2)—A Computer Program for Speciation, Batch-Reaction One-Dimensional Transport, and Inverse Geochemical Calculations; Water-resources Investigations Report; United States Geological Survey: Reston, VA, USA, 1999; pp. 99–4259.
- Shvartsev, S.L. Self-organizing abiogenic dissipative structures in the geologic history of the Earth. Earth Sci. Front. 2009, 16, 257–275. [Google Scholar] [CrossRef]
- Malov, A.I. The Conditions for the Formation of Strontium in the Water of Ancient Silicate Deposits Near the Arctic Coast of Russia. Water 2024, 16, 2369. [Google Scholar] [CrossRef]
- Zhu, X.; Miao, P.; Qin, J.; Li, W.; Wang, L.; Chen, Z.; Zhou, J. Spatio-temporal variations of nitrate pollution of groundwater in the intensive agricultural region: Hotspots and driving forces. J. Hydrol. 2023, 623, 129864. [Google Scholar] [CrossRef]
- Liu, J.; Lou, K.; Gao, Z.; Wang, Y.; Li, Q.; Tan, M. Comprehending hydrochemical fingerprint, spatial patterns, and driving forces of groundwater in a topical coastal plain of Northern China based on hydrochemical and isotopic evaluations. J. Clean. Prod. 2024, 461, 142640. [Google Scholar] [CrossRef]
- Li, C.; Gao, Z.; Chen, H.; Wang, J.; Liu, J.; Li, C.; Teng, Y.; Liu, C.; Xu, C. Hydrochemical analysis and quality assessment of groundwater in southeast North China Plain using hydrochemical, entropy-weight water quality index, and GIS techniques. Environ. Earth Sci. 2021, 80, 523. [Google Scholar] [CrossRef]
- Lawniczak, A.E.; Zbierska, J.; Nowak, B.; Achtenberg, K.; Grześkowiak, A.; Kanas, K. Impact of agriculture and land use on nitrate contamination in groundwater and running waters in central-west Poland. Environ. Monit. Assess. 2016, 188, 172. [Google Scholar] [CrossRef]
- Liu, G.; Wang, C.; Wang, X.; Huo, Z.; Liu, J. Growing season water and salt migration between abandoned lands and adjacent croplands in arid and semi-arid irrigation areas in shallow water table environments. Agric. Water Manag. 2022, 274, 107968. [Google Scholar] [CrossRef]
- Miranda, J.; Antunes, M.; Ribeiro, C.A. Groundwater Modeling from Urban Areas (NW Portugal): An Integrated Hydrological-Hydrogeological Approach. In Earth Systems and Environment; Springer: Berlin/Heidelberg, Germany, 2025; pp. 1–18. [Google Scholar]
- Zeng, S.; Liu, Z.; Jiang, Y.; Goldscheider, N.; Yang, Y.; Zhao, M.; Sun, H.; He, H.; Shao, M.; Shi, L. A greening Earth has reversed the trend of decreasing carbonate weathering under a warming climate. Nat. Commun. 2025, 16, 2583. [Google Scholar] [CrossRef]
- te Wierik, S.A.; Cammeraat, E.L.H.; Gupta, J.; Artzy-Randrup, Y.A. Reviewing the impact of land use and land-use change on moisture recycling and precipitation patterns. Water Resour. Res. 2021, 57, e2020WR029234. [Google Scholar]
- Foster, S.S.D.; Chilton, P.J. Groundwater: The processes and global significance of aquifer degradation. Philosophical Transactions of the Royal Society of London. Ser. B Biol. Sci. 2003, 358, 1957–1972. [Google Scholar] [CrossRef] [PubMed]
- Larsen, T.A.; Hoffmann, S.; Lüthi, C.; Truffer, B.; Maurer, M. Emerging solutions to the water challenges of an urbanizing world. Science 2016, 352, 928–933. [Google Scholar] [CrossRef]
Disclaimer/Publisher’s Note: The statements, opinions and data contained in all publications are solely those of the individual author(s) and contributor(s) and not of MDPI and/or the editor(s). MDPI and/or the editor(s) disclaim responsibility for any injury to people or property resulting from any ideas, methods, instructions or products referred to in the content. |
© 2025 by the authors. Licensee MDPI, Basel, Switzerland. This article is an open access article distributed under the terms and conditions of the Creative Commons Attribution (CC BY) license (https://creativecommons.org/licenses/by/4.0/).