Abstract
A GIS-based Plant Coefficient Method (PCM), termed the Plant Coefficient Method Tool (PCMT), is presented and validated through this research. It is designed for sustainable irrigation management within arid urban environments, exemplified by Riyadh, Saudi Arabia. The study integrates remote sensing data, including Landsat 8 satellite imagery, vegetation indices (NDVI, LAI), and climatic parameters to estimate daily and seasonal plant water demand for diverse landscape species. Results demonstrate that plant-specific coefficients () fluctuate seasonally, ranging from 0.1 to 1.4, with average water demand () reaching up to 25 L per square meter during the summer months and decreasing to around 6 L in winter. It may be found by good management based on PCMT that average daily projected rates can be lowered to as low as 3 mm/day, resulting in a significant decrease in water needs, by around 70% to 50%, when compared to higher categories. Validation across three sites (urban trees, date palms, and turf grass), showed strong correlations (R2 > 0.8) between satellite-derived vegetation indices and modeled water needs. The volumetric water demand estimates closely aligned with actual irrigation practices, albeit with some over- and under-irrigation episodes. Spatial analysis indicated that high-demand zones predominantly occur in summer, emphasizing the necessity of adaptive irrigation scheduling. Overall, the PCMT presents a scalable, accurate tool for optimizing water use, supporting sustainable landscape management aligned with Saudi Arabia’s green initiatives.
1. Introduction
Water shortage is a major issue in dry and semi-arid countries, especially in countries like Saudi Arabia, where sustainable management of limited water resources has become indispensable. Urban greening and afforestation initiatives, such as the Green Saudi Arabia program [1], require accurate estimates of plant water demand to ensure efficient irrigation planning and conservation of groundwater resources [2,3]. In such environments, understanding and managing evapotranspiration (ET), the sum of water lost through soil evaporation and plant transpiration, is central to sustaining healthy urban landscapes while minimizing water waste [4,5]. Traditional irrigation methods often depend on fixed schedules or broad estimates, which fail to account for the dynamic variations in plant type, density, and local microclimate. This leads to inefficient water consumption, either through over-irrigation or through inadequate supply [6]. To address this issue, the development and application of spatially explicit models and methods that estimate plant water demand based on remote sensing and site-specific parameters have become an increasingly valuable tool for modern landscape management [7,8]. Plant evapotranspiration () plays a critical role in modulating the water cycle, influencing climate dynamics, and shaping agricultural systems. Through the analysis and measurement of this process, researchers, agronomists, and policymakers can better understand water resource availability, determine plant water needs, and assess the overall health of ecosystems. Such insights are essential for sustainable water management and environmental conservation efforts [9].
Remote sensing technologies (RST), particularly the use of multispectral satellite imagery such as Landsat 8, enable the monitoring of vegetation conditions, growth cycles, and transpiration responses across large spatial extents with moderate temporal resolution [10,11,12]. Vegetation indices (), including the normalized difference vegetation index (NDVI) and Leaf Area Index (LAI), have proven to be highly effective at assessing plant health and estimating plant coefficients (), which in turn are used to determine water needs [3,13,14]. Combining these techniques facilitates a thorough evaluation of water demands across various plant species, enhancing the precision of irrigation timing and promoting an effective water conservation approach [15]. Several methodologies have been developed to quantify the volumetric water demands (of landscape vegetation. Among these, the Landscape Coefficient Method () is widely utilized, wherein water demand is determined using plant coefficient values () that integrate the effects of species characteristics, planting density, and local microclimatic conditions [8,16]. Furthermore, Alazba, Mattar [17] introduced two models, WUCOLS and LIMP, for estimating water demands in landscape irrigation. It evaluates the accuracy and efficiency of these approaches through empirical data, highlighting their applicability in water management practices. The study concludes that these models can significantly improve water consumption efficiency in landscape irrigation planning by providing precise demand estimates.
This study introduces and validates the Plant Coefficient Method Tool (PCMT), a GIS-based model developed within ArcMap 10.8, designed using a visual programming language to estimate plant water demands across urban and peri-urban green areas in Riyadh, Saudi Arabia. The model is built upon the Plant Coefficient Method (PCM) proposed by Elkatoury and Alazba [3], which integrates reference evapotranspiration () calculated via a modified Penman–Monteith equation, as proposed by Alazba [18], and vegetation-specific coefficients derived from satellite-based . This hybrid approach allows for the spatial mapping of and the corresponding over time. Therefore, the fundamental purpose of this research is to develop and apply the PCMT across three representative landscape types within Riyadh city which are (1) a heterogeneous urban landscape comprising trees and groundcovers; (2) an agricultural site dominated by date palms; and (3) a football stadium with seasonally managed turf grass species. Each of these sites reflects diverse plant types, management practices, and microclimatic conditions, making them ideal for evaluating the PCMT’s performance and utility.
The significance of this work lies in its alignment with the Green Saudi Initiative, which aims to plant billions of trees and expand green spaces across the whole country to mitigate urban heat, improve air quality, and enhance biodiversity [19]. By enabling real time, scalable, and precise estimation of plant water needs, the PCMT supports efficient irrigation scheduling and long-term water sustainability, critical goals in water-stressed environments like Riyadh.
Despite several studies having evaluated the majority of them have concentrated on agricultural crops and large-scale irrigation systems. Strategies such as the FAO-56 dual crop coefficient method and the WUCOLS framework provide useful guidelines, but they are often generalized and fail to capture the complexity of urban landscapes, which are characterized by heterogeneous vegetation, varying planting densities, and diverse microclimatic conditions [16,20,21]. Likewise, while RS-based have been used to estimate water demand, they are seldom incorporated into a GIS-based water demand estimation tool. As a result, this work tackles these gaps by creating and testing the Plant Coefficient Method Tool (PCMT).
2. Materials
2.1. Study Area and Data Description
Saudi Arabia (KSA) is primarily characterized by its vast desert landscapes and harsh climatic conditions, with temperatures that can soar above 50 °C in the summer. The nation experiences low annual precipitation, primarily concentrated in the winter months, contributing to its arid environment. The geological features of the region include extensive sedimentary basins and limestone formations, which significantly influence the availability and management of aquifer resources. Riyadh, located in the central part of the Arabian Peninsula as shown in Figure 1, sits on a plateau with an elevation of approximately 600 m above sea level. The city experiences extreme temperature variations, with hot summers and mild winters. According to the United Nations Environment Programme (UNEP), aridity can be expressed utilizing the Aridity Index (AI), defined as the ratio of mean annual precipitation to mean annual potential evapotranspiration [22]. Based on long-term climatic data, Riyadh exhibits an AI of 0.02–0.20, which classifies it as hyper-arid to arid [23]. Its semi-arid climate sees average precipitation between 100 and 200 mm annually [24], further emphasizing the need for efficient water demand management in landscaping and agriculture. The geological composition in and around Riyadh consists mainly of sedimentary rock, including sandstone and limestone, which serve as aquifers. However, over-extraction of groundwater due to rising urbanization and agricultural demands has led to declining water levels [3]. Thus, Riyadh presents an unparalleled opportunity for research on plant water demand management, aiming to develop models that align with the Green Saudi Arabia Initiative, ensure sustainable water use, and promote ecological balance in the region.
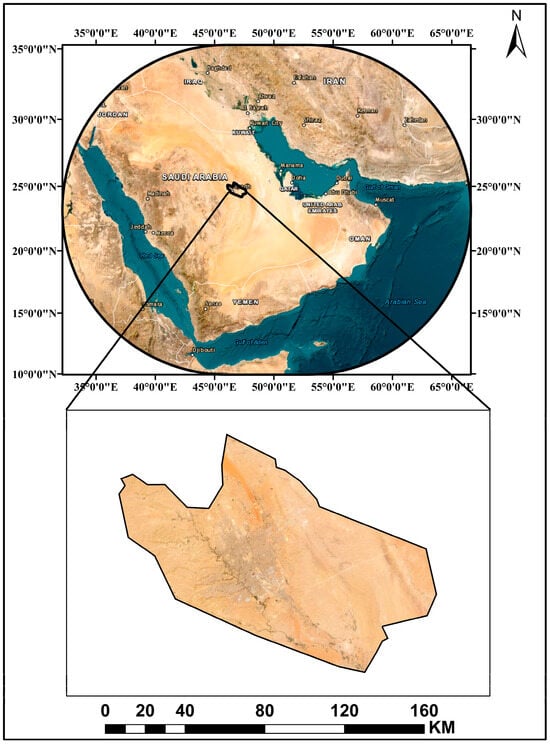
Figure 1.
Map of the study area with the location of AR-Riyadh city illustrated.
The initial phase of this research involved selecting three specific sites where various urban landscape plants actually exist, as illustrated in Figure 2. It was essential to include a range of diverse plant species. Consequently, the crossroads of King Salman Road and Airport Road was designated as the focus of this investigation, where ten commonly recognized native landscape plants are present. These are six tree species (, , , , , and ) and four ground cover species (, , , and ). This location was one of the early developments under the Green Riyadh initiative, encompassing approximately 627,000 m2. Additionally, two more study sites were included, as illustrated in Figure 2; Al-Awwal Park Stadium features (Buffalo grass) with the common name C2000 grass, covering the field’s dimensions, which are 115 m × 78 m. However, C2000 grass grows in the summer season; the grass used to turf playing fields remains all year, reinforced with winter ryegrass during the winter. Meanwhile, Al-Ahmadiya Farm, known for its expansive date palm groves, adds to the ecological diversity of the region, contributing to both agricultural and landscape experiences within this urban framework.
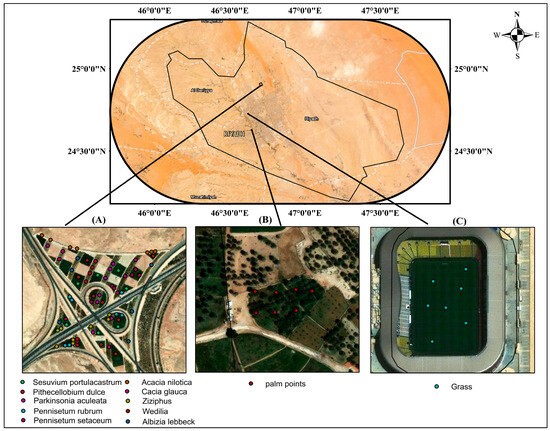
Figure 2.
The main three study sites located in Riyadh city: (A) the intersection of King Salman and Airport Roads, (B) Al-Ahmadiya Farm and (C) Al-Awwal Park Stadium. The anchor points were selected for each pixel and plant utilizing ArcMap and AutoCAD programs and verified using a Trimble R12 GNSS Receiver.
2.2. Materials and Data Sources
Substantial data was collected and analyzed using a range of methods and tools. Remote sensing () approaches utilizing Landsat 8 (L8) satellite imagery were critical for observing land use patterns and transformations, offering important insights into vegetation cover, vegetation indices (), and water allocation. This research was performed by gathering L8 satellite images throughout a period of 12 months in 2023, leveraging an operational land imager/thermal infrared sensor (OLI/TIRS) as shown in Table 1. The imagery was sourced from the United States Geological Survey (USGS) platform [25]. The operational approach of the L8 mission includes the establishment and maintenance of an international data archive. L8 follows the same Worldwide Reference System as Landsat 4, 5, and 7, allowing its sensors to capture a full view of the globe every 16 days. ArcMap (Version 10.8) software was employed for processing and mapping spatiotemporal data, facilitating an in-depth analysis of the study area. A ( Co., , CO, ) played a significant role in accurately validating and mapping the coordinates of various plant species, contributing to the development of a detailed as-built layout.

Table 1.
Dates of Landsat 8 satellite images for the study area during 2023.
Trimble R12 GNSS technology strengthens performance and signal management, enabling precise placement even in areas shaded by trees or in proximity to buildings. The study area features the ten most prevalent plant species involved in the Green Riyadh initiative, which include six tree varieties, , , , , , and , amounting to a total of 9635 trees. Additionally, four species of ground cover and shrubs are represented, , , , and , covering an expanse of 115,500 m2. The study also incorporates Al-Ahmadiya Farm, featuring date palm trees, and Al-Awwal Park, which includes a football field planted with C2000 grass, providing further diversity in the evaluated plant species and environmental conditions.
Contemporary irrigation networks employ two bubblers for each tree, delivering a flow rate of 115.5 L per hour per bubbler, alongside five emitters per square meter, each with a flow of 3.4 L. The final drawing of the plants as-built was created using AutoCAD 2018 software (Version 22.0), utilizing the necessary coordination points collected via GPS technology, as illustrated in Figure 2. A total of 48 sprinklers are employed in the playground’s grass irrigation network, with 15 control valves. The operation specifications of the sprinklers indicate a precipitation rate ranging from 9 to 32 mm/h, which is suitable for various types of irrigation needs. The effective radius of coverage extends from 11.3 to 19.8 m, allowing for flexible installation in different green sports fields. It operates efficiently under a pressure range of 2.1 to 3.2 bar, with flow rates between 10.8 and 82.2 L per minute. It is important to note that the precipitation rates work on half-circle operation, and square spacing should be calculated using 50% of the diameter of the throw to ensure optimal distribution of water.
Additionally, meteorological data played a crucial role in calculating reference evapotranspiration (), providing vital insights into the environmental factors affecting water requirements. This data was sourced from the Meteorological Department of the Ministry of Environment, Water, and Agriculture. Through the integration of these various materials and technologies, the PCM was programmed as an additional tool in the ArcMap software to evaluate irrigation practices and advocate for more sustainable water management practices. By concentrating on the water needs of plants, researchers can explore innovative strategies to optimize water usage, improve irrigation productivity, and save valuable water resources.
Actual water applied at the three study sites was closely monitored throughout the study period using a full smart irrigation central control system; furthermore, periodic field visits were necessary to avoid all operation issues.
3. Methods
3.1. Plant Water Demand
The proper management and scheduling of irrigation are critical for maintaining water supplies for plants and enhancing green spaces. In arid regions such as Riyadh, Saudi
Arabia, accurately estimating plant evapotranspiration () is essential for efficient water management. The water demands of plants are determined by their evapotranspiration, which can be calculated by multiplying the plant coefficient () by the reference evapotranspiration (). This approach allows for a more precise understanding of water demand and assists in optimizing irrigation practices for sustainable landscaping [16] as follows in Equation (1):
The plant coefficient is derived from three variables: plant type or variety, planting density, and climatic conditions, as represented in Equation (2). This framework allows for the accurate assessment of water requirements specific to different plant species and their environmental contexts [3,16].
in which is a species factor that depends on differences in vegetation type, is a density factor that depends on differences in vegetation density across landscape plantings and is a climate conditions factor that depends on variations among landscapes, resulting in differences in microclimate.
3.2. Plant Coefficient Method (PCM)
The plant coefficient method (PCM) was produced by [3] as one of the most accurate techniques of managing plant water demand. PCM estimates plant water demand requirements by processing Landsat 8 satellite images, referencing an evapotranspiration calculation using the Penman–Monteith equation developed by [18] and the plant coefficient . The main pivotal factor in this approach is , which is modeled as a function of vegetation indices () based on satellite image processing. An as-built drawing of the three selected study locations was created to validate the spatial distribution of plant species and to estimate their plant coefficients. The ecological data associated with these layouts were derived from calculated through the processing of satellite imagery. Specifically, the indices were obtained using the red (band 4; 0.636–0.673 µm) and near-infrared (band 5; 0.851–0.879 µm) spectral bands. These spectral ranges are detailed in the accompanying Table 2.

Table 2.
Landsat 8 ETM + image bands with the resolution and wavelength of each band.
The modeled species factor () was modeled as a function of the average normalized difference vegetation index (NDVI) data for the selected sites over a 12-month period in 2023, utilizing data available from Landsat 8 satellite intervals, which capture images of the entire Earth every 16 days. To validate the values extracted from the satellite imagery, values were obtained from the Water Use Classifications of Landscape Species (WUCOLS) database [16] which categorizes plant types into four distinct groups as outlined in Table 3. Additionally, the validation process involved verifying the locations of the different plant species involved using GPS surveying techniques. The modeling of based on NDVI data is illustrated in Equation (3).

Table 3.
Species factors , , and ranges as listed in WUCOLS [16].
The density factor represents the level of vegetation density, serving as a measure of the leaf area for all plants within a landscape. Consequently, was modeled based on the average Leaf Area Index (LAI) data collected over the 12 months in 2023, utilizing intervals from Landsat 8 satellite images. Similarly to the validation process for , underwent validation as well. Additionally, values sourced from the WUCOLS database [3,16] varied between 0.5 and 1.3 and are categorized into three groups as illustrated in Table 3. The estimation of was conducted using the LAI data expressed in Equation (4).
Plants were categorized by into three groups based on the correlation between leaf area and water loss. Specifically, species with larger leaf areas, such as shrubs, trees, and groundcovers, tended to lose more water compared to those with smaller leaf areas.
The climate conditions factor, , is influenced by variations in climate factors, including temperature, wind speed, humidity, and light intensity, which are further affected by landscape components such as buildings and pavement. In the WUCOLS dataset, values range from 0.5 to 1.4 and are divided into three classifications, as shown in Table 1. Due to the differing microclimatic conditions affecting identical plantings, which align with conditions, the selected site—located at the intersection of two highways and designated as a street median—experiences climate variations between arid and semi-arid. Additionally, plantings in Riyadh are governed by open-site regulations, leading to being assigned to a higher category for this study.
3.2.1. Satellite Image Processing
Landsat 8 satellite imagery was acquired from the USGS in 2023, covering paths 165 and 166 and row 43, utilizing an operational land imager/thermal infrared sensor (OLI/TIRS). To improve the accuracy of its analysis regarding Earth’s surface features, satellite imagery often necessitates atmospheric correction to mitigate interference from haze, aerosols, and scattering. Common methods for atmospheric correction include Dark Object Subtraction (DOS) and the Fast Line-of-sight Atmospheric Analysis of Spectral Hypercubes (FLAASH) algorithm [26,27]. These methods generally involve correcting for atmospheric scattering and absorption by comparing the acquired images with reference data, such as spectral databases or atmospheric models. By applying atmospheric correction to Landsat 8 images as illustrated in different studies [11,24,28], researchers can significantly improve the accuracy of their analyses and obtain more dependable data related to land cover, land use, and environmental changes over time, as shown in Equation (5) [28]:
In this equation, represents the corrected reflectivity for each band, is the reflectance multiplicative scaling factor for the band (as found in the Landsat 8 data user’s handbook), denotes the level 1 pixel value in digital number (DN), is the reflectance additive scaling factor for the band (also from the metadata) and θ indicates the sun elevation angle (derived from the Landsat 8 metadata).
The following steps were executed using ESRI’s ArcGIS (version 10.8) software. The clip tool from the analysis toolbox was utilized to isolate a specific section of the raster dataset representing the study area. The study area’s boundaries were established using a shape file created in AutoCAD, along with the Arc Catalog application. Furthermore, most operations were conducted using ArcGIS (version 10.8) spatial analyst tool (Map Algebra).
3.2.2. Vegetation Indices ()
Transpiration accounts for a minimum of 80 percent of evapotranspiration (ET), making the assessment of foliage coverage a crucial method for estimating ET in agricultural landscapes. Consequently, vegetation indices () are among the earliest tools employed in remote sensing studies to estimate foliage coverage [29]. Among the various , three key indices that have consistently demonstrated a strong correlation with vegetation canopy greenness across numerous studies are the normalized difference vegetation index (NDVI), leaf area index (LAI), and soil adjusted vegetation index (SAVI).
For each image captured, the simple ratio (SR) vegetation index was computed using the raster calculator in ESRI’s ArcGIS 10.8, incorporating both top-of-atmosphere (TOA) and surface reflectance data.
NDVI is derived from the difference in radiation absorption between the red and near-infrared bands from the Landsat 8 satellite and can be calculated using the following formula, (Equation (6)) [14]:
where () represents the near-infrared band and () stands for the red band. SAVI aims to mitigate the influence of background soil on NDVI, thereby reducing the impact of soil moisture on the index. It is formulated as follows (Equation (7)) [3]:
where (L) is a constant specific to SAVI. If L is zero, SAVI becomes equal to NDVI. A value of 0.5 frequently appears in the literature for L. However, a value of 0.1 is better used to represent the soil of southern Idaho.
LAI is defined as the ratio of the total leaf area of a plant to the ground area it occupies. Various methodologies exist for calculating LAI, one of which relies on SAVI and is represented by the following equation (Equation (8)) [3]:
The maximum LAI is 6.0, correlating with a maximum SAVI value of 0.687. Beyond this SAVI threshold, LAI values increase more gradually. The relationship between SAVI and LAI may vary depending on the location and type of vegetation. Consequently, [30,31] introduced an alternative formulation that incorporates the simple ratio (SR) index, as shown in Equation (9) [3]:
The simple ratio (SR) is calculated using Equation (10) [3]:
Ultimately, according to the findings presented by Blinn, House [31], the following LAI formulation (Equation (11)) was adopted for this study:
3.2.3. Plant Reference Evapotranspiration (
Reference evapotranspiration () was calculated by utilizing daily climatic data collected from weather stations in the study area over the period from 1980 to 2023. This data was sourced from the Meteorological Department of the Ministry of Environment, Water, and Agriculture. For the purpose of this study, was defined as the evapotranspiration from a reference surface, specifically a grass field maintained at a height of 12 cm, which is actively growing and sufficiently watered, with a roughness coefficient of 70 (s m−1) and a surface albedo of 0.23. The calculation of employed the Penman–Monteith equation (Equation (12)) form, expressed as follows [18]:
where represents the plant reference evapotranspiration (in mm/day), λ denotes the latent heat of vaporization (MJ/kg), Δ is the slope of the saturation vapor pressure-temperature curve at the average air temperature (kPa/°C), γ is the psychrometric constant (kPa/°C), Rn is the net radiation (MJ/m2/day), G represents the soil heat flux (MJ/m2/day), γ* is the modified psychrometric constant (kPa/°C), and K is a parameter valued at (MJ/m2/day/kPa). Additionally, T is the air temperature (°C), es is the saturation vapor pressure at the given air temperature (kPa), e_a is the actual vapor pressure (kPa), and the aerodynamic resistance (ra) is dependent on the wind speed measured 2 m above ground level (U2) and the height of the reference plant (hpl), calculated as [1−ln (hpl)]/[0.1232 × U2], with hpl set twice at 15 cm and 5 cm for this study.
3.3. PCM Tool (PCMT) Structure Based on Visual Programming Language
The plant coefficient method tool (PCMT) was developed using the visual programming language capabilities of the ArcMap 10.8 Model Builder tool as displayed in Figure 3. The model leverages the Penman–Monteith equation to evaluate water needs for landscapes and afforestation projects in various regions, including the Kingdom of Saudi Arabia (KSA). Model builder is a visual programming language for enabling automatic processing of many extensive tasks. The PCMT is used for estimating and evaluating and the amount of water added for any existing landscape and afforestation projects. Further, volumetric water demands are estimated and maps developed for the green expansions proposed for implementation in Riyadh city or any other sites in the world. Volumetric water demand magnitudes and maps will be produced using the water demand tool developed as follows in Equation (13):
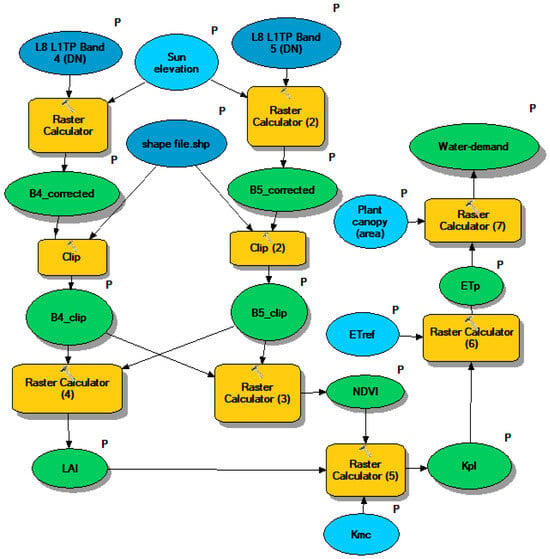
Figure 3.
Processing procedure for estimating and using the model builder incorporated in ArcGIS; all abbreviations are explained in the manuscript, the symbol (P) expresses the parameter that the user must enter as input.
The final developed model will be a plugin compatible with ArcMap software as in Figure 4. In the case of local use inside the KSA, the model inputs will be satellite images for a specific area in which water demands need to be estimated, in addition to vegetation area as a shape file or written number. Alternatively, in the case of universal usage or the unavailability of maps, meteorological data for the region will need to be entered.
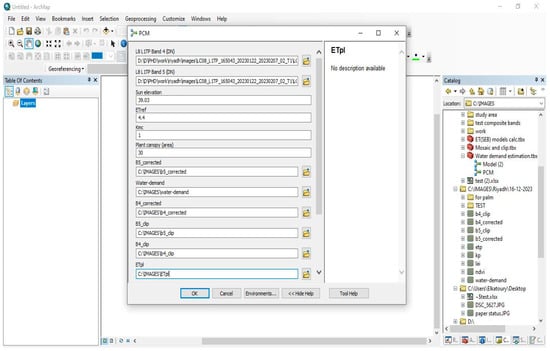
Figure 4.
The PCM tool’s (PCMT) final interface for and water demand estimation, based on the model builder incorporated in ArcGIS.
Developed Model Validation
The model developed in this study was validated in two steps. First, the validation of the plant coefficients and developed based on sampling data that were collected from the different landscape sites. We then extracted reference values from the WUCOLS guide for and that corresponded to the vegetation type at each point. Then, a correlation was created between the referenced coefficient values and the values extracted from satellite image processing at each point, corresponding to the collected field data.
The second step in the validation was to use the final form of the model for estimating the of Riyadh city. The model output included maps, which were validated from each point with the corresponding point in each site included on the map.
4. Results and Discussion
4.1. Plant Coefficient Method (PCM) Verification
To determine the suitability of PCM for irrigation management, precise extraction of vegetation indices () for individual plants was necessary. The study required a site with spatial segregation of plants, allowing for accurate measurement. Seven randomly selected pixels per plant were used to estimate NDVI and LAI from monthly satellite images, and these values were averaged over the twelve-month period. In Site (A), which featured four ground cover species and six tree species with 50–80% coverage, 70 anchor points were selected overall. This setup facilitated individual plant analysis and contributed to the accuracy of the results by accounting for plant diversity and heterogeneity in cover density.
The data for Site (A) indicate that the mean values of NDVI and LAI are consistent with the classification ranges established by WUCOLS [16]. Figure 5 and Figure 6 illustrate the spatial distribution of these indices over the course of the study period. NDVI values for and both equal 0.3, aligning with WUCOLS’ low species factor classification ( ranging from 0.1 to 0.3). Similarly, the LAI values for these two ground covers are both 0.7, reflecting an average range between 0.5 and 0.9. and fall within the moderate water demand category, with NDVI and LAI averages of 0.5 and 0.1, respectively, consistent with the classification standards. Conversely, six tree species demonstrated low water demand, with presenting the lowest average NDVI (0.1) and LAI (0.4). and exhibited similar NDVI values of 0.2, with LAI values of 0.6 and 0.5, respectively. Additionally, , , and showed mean NDVI values around 0.3 and LAI averages of approximately 0.6, confirming their low classification status.
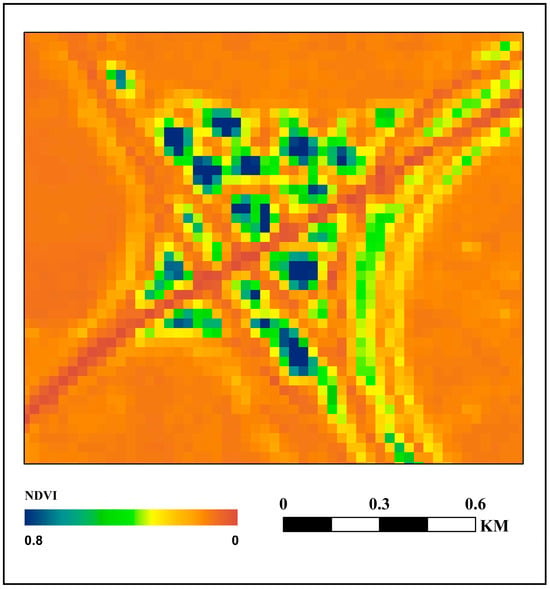
Figure 5.
Normalized difference vegetation index (NDVI) average map of the twelve months during 2023 for Site (A).
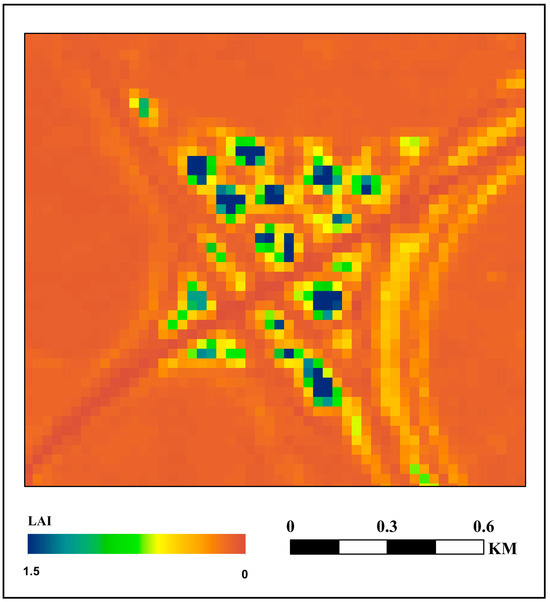
Figure 6.
Leaf area index (LAI) average map of the twelve months during 2023 for Site (A).
On the other side, The findings from the date palms at Site (B) revealed that the estimated NDVI values vary slightly, ranging from 0.2 to 0.4, which indicates low to moderate vegetation health. For instance, NDVI peaks at 0.4 in May, as shown in Table 4, aligning with increasing temperatures and possibly enhanced photosynthetic activity as plants start to utilize more light energy for growth. Estimated values for LAI show fluctuations, peaking in October at a value of 0.9, which reflects increased leaf area development during the study period. During the spring months (March to May), LAI values reach up to 0.8, indicating healthy vegetation density, while values drop in November (0.5), suggesting a reduction in leaf area as plants enter dormancy. Between March and June, NDVI remains relatively stable at 0.3, but the drop in LAI to 0.6 in June reflects inadequate moisture availability possibly due to higher evapotranspiration rates in a hotter climate. The relatively constant (1.1–1.4) implies that microclimate conditions may have favored growth. The improvement in NDVI and LAI in September and October may hint at moisture recovery due to irrigation practices that support growth before the winter months. However, the drop in to 0.1 in November signifies that the plants are moving towards a state of dormancy, and their water needs significantly decrease. NDVI values of 0.2 in November and 0.3 in December reflect reduced plant activity and lower health during the winter months. The values suggest a reliance on adaptive strategies for plant survival during the drought conditions common in these seasons.

Table 4.
Average monthly estimated NDVI, LAI, and based on remote sensing techniques in addition to and WUCOLS ranges for date palms at Site (B).
The assessment of PCM at Site (C) provides essential insights into the health and management of the turf throughout the year. This analysis utilizes verified data from WUCOLS to understand the varying water requirements and vegetation responses to changing environmental conditions. The grass type utilized in the stadium is Bouteloue Dactyloides (Buffalo grass) C2000, which is known for its robust growth during summer months but experiences a decline in vigor as temperatures rise. To mitigate this issue, a grafting process is implemented in winter with the Rye Grass Gold 1 grass variety, effectively filling gaps in coverage during the less favorable growth conditions for C2000. This seasonal management strategy is crucial for maintaining optimal turf health and playability. During January and February, the NDVI value is approximately 0.5, reflecting relatively healthy vegetation despite cooler temperatures. The corresponding LAI values are stable at around 1.1, indicating sufficient leaf area for effective photosynthesis. The estimated remains consistent at 0.8, suggestive of moderate plant water requirements aligning with WUCOLS values for this time of year. In March, a decline in NDVI to 0.39 is observed, accompanied by a decrease in LAI to 0.8. This may indicate an initial stress response as the grass prepares for the warmer months. However, by April, the NDVI recovers to 0.52, with LAI increasing to 1.2, highlighting improved conditions likely aided by favorable weather and irrigation practices. The estimated values during these months (0.4 to 0.8) reflect the adaptive response of the turf to maintain growth. A drastic reduction in NDVI to 0.15 in June signals significant stress conditions, likely due to high temperatures, decreased moisture availability, and the grafting process with the summer species. Correspondingly, LAI values plummet to 0.5, reflecting the turf’s struggle during the grafting period. The estimated drops sharply to 0.1, indicating very low plant water requirements, correlating with the dormant state of the grass. In July and August, NDVI shows modest recovery back to 0.46 and 0.49, with a slight increase in LAI, suggesting a post-stress recovery phase. The transition into autumn (September and October) allows for improved growth conditions, as evidenced by NDVI values rising to 0.57 and LAI reaching 1.3. The estimated increases to 1.1, indicating higher water needs in response to the accelerated growth of the grass. However, a dramatic drop in November (NDVI at 0.11 and LAI at 0.4) suggests a retraction into dormancy, possibly due to cooler temperatures, winter species removal and reduced sunlight, as reflected in the estimated of 0.1. December marks a rebound in NDVI to 0.62 and LAI to 1.7, likely due to the favorable conditions following the cool season and the impacts of management practices post-grafting. The increase in to 1.4 indicates heightened water requirements to sustain the grass health and further establish vigor before the onset of winter dormancy.
Therefore, applying the developed PCM based on RST reflects the overall condition of the plants and allows us to obtain the most accurate value for . This, in turn, aids in estimating the required water demands of the plants and facilitates better management of water resources. Accordingly, the analysis of plant coefficients values estimated based on PCM reveals crucial insights into the growth and health patterns of vegetation within this ecosystem. The data indicates stable plant performance and agreement with WUCOLS classifications, with seasonal variations reflecting the important relationship between water availability and plant health.
The validation of the PCMT represents a critical step toward advancing irrigation water management in landscape systems, particularly under the growing emphasis on sustainable practices within horticulture and urban greening. The integration of geospatial technologies, such as high-precision GPS instruments (e.g., Trimble R12 GNSS) alongside digital tools including AutoCAD and ArcMap, has enhanced the accuracy of mapping and analyzing plant species distribution. The present discussion integrates both the study outcomes and supporting literature to evaluate the reliability of the PCM when tested against such as NDVI and LAI. Findings demonstrate the successful spatial characterization of plant species, underscoring the distinct diversity of landscape vegetation compared with conventional agricultural settings [32]. Furthermore, the moderate NDVI and LAI values recorded for and portulacastrum at Site (A) illustrate their resilience under fluctuating irrigation regimes, reinforcing the necessity for species-specific irrigation strategies that account for differences in water consumption. These results are consistent with earlier research advocating the use of vegetation-index-based approaches for quantifying plant water requirements [33].
4.2. Plant Coefficient () Modeling
The plant coefficient () is determined as the product of three components: the species factor (), the density factor (), and the microclimate factor, with integer values assigned to each parameter as outlined in Equation (2). For Site (A), and , values corresponding to ten landscape plant species were derived using the WUCOLS database. These reference values, together with coefficients established for other land cover types in previous research, were subsequently employed to establish relationships with 16-day interval Landsat 8–derived NDVI data.
According to plants species diversity at Site (A), a simple linear regression model was developed to establish a general relationship between the average of seven estimated NDVI-chosen points for each plant separately across 12 months of 2023, with values tabulated by WUCOLS (Figure 7). The regression model (Figure 7) demonstrates a strong positive relationship between NDVI and (WUCOLS), as indicated by R2 = 0.9, implying that approximately 90% of the variability in KS (WUCOLS) is explained by NDVI. Also, monthly average LAIs estimated using Equation (11) were modeled as a function of values by the WUCOLS guide, which displays LAI- relationships with R2 = 0.8 (Figure 8). The regression lines closely fit the data, with narrow 95% confidence intervals for both the mean prediction and individual observations. The standardized coefficient figures show that the predictors (NDVI, LAI) significantly contribute to the model, with a confidence interval that does not cross zero. This reinforces the reliability of NDVI and LAI as predictors of and . The standardized residual figures appear randomly scattered without obvious patterns against NDVI, (WUCOLS), LAI, and (WUCOLS). Also, there is no apparent heteroscedasticity and no major outliers, though residuals ranging up to ±2 suggest a few moderately high deviations, but nothing extreme. Hence, the figures confirm a strong linear association between the estimated NDVI, LAI, tabulated , and by WUCOLS, supporting the suitability of NDVI and LAI as a remote sensing approach for estimating and values in the studied context.
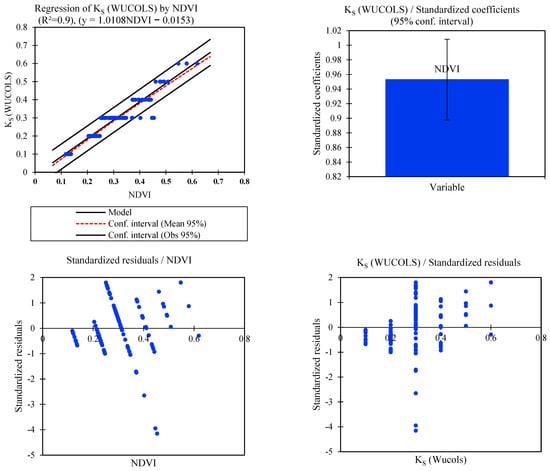
Figure 7.
Regression analysis of (WUCOLS) as a function of NDVI. The top left plot shows the fitted regression model with 95% confidence intervals for the mean prediction and individual observations. The top right plot presents standardized coefficients with 95% confidence intervals. The bottom figures display standardized residuals versus NDVI and (WUCOLS).
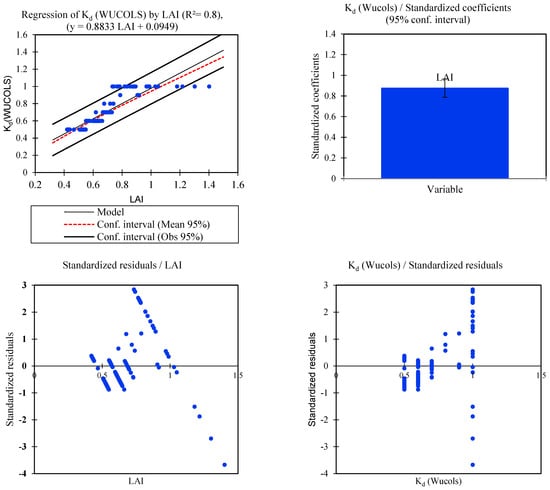
Figure 8.
Regression analysis of (WUCOLS) as a function of LAI. The top left plot shows the fitted regression model with 95% confidence intervals for the mean prediction and individual observations. The top right plot presents standardized coefficients with 95% confidence intervals. The bottom figures display standardized residuals versus LAI and (WUCOLS).
The analysis of the date palm data in Site (B) reveals that the NDVI values remained relatively stable throughout the year, fluctuating between 0.3 and 0.4, indicating a consistently moderate level of vegetation greenness as shown in Table 4. Correspondingly, LAI ranged from 0.5 to 0.9, aligning with the classification standards established by WUCOLS, which categorize such vegetation as a low-water-use species. According to WUCOLS guidelines, the values for date palms in this context fall within the range of 0.1 to 0.3, reflecting low water demand, while the values vary from 0.5 to 0.9. When applying the previously mentioned of 1.4 and assuming of 0.9, the calculated reaches approximately 0.4. This value closely aligns with the estimated through the PCM, demonstrating that the model effectively captures the water requirement characteristics of date palms in this environment. Overall, the stability of NDVI and LAI, along with the congruence between calculated and estimated values, underscores the reliability of the PCM in modeling water demands for date palms under similar ecological conditions.
In Site (C), which contains turf grass covering the KSU football field which is the Bouteloue dactyloides (Buffalo grass) C2000 species in summer and the Rye Grass Gold 1 species in winter, values for the grass were classified according to WUCOLS into two seasons: summer and winter, with values of 0.6 and 0.8, respectively, as shown in Table 5. It was observed that the estimated during the winter months was 0.8, except for a decrease in March, when it dropped to 0.4 due to maintenance activities. A gradual decline in the occurred, reaching 0.7 in May. An exceptional deviation was noted in June, where the plant coefficient was approximately 0.1, resulting from aeration, mowing, and the removal of the winter grass type used for patching during winter. Subsequently, the plant coefficient ranged between 0.5 and 0.7 during July, August, and September. A significant increase in occurred in October, which then decreased again in November due to seasonal maintenance involving the planting of winter grass. Therefore, the highest value was recorded in December at 1.4, reflecting the increase in LAI, which was 1.7.

Table 5.
Average monthly estimated NDVI, LAI and based on remote sensing techniques in addition to and WUCOLS values for grass at Site (C).
A study conducted by Mahmoud and Gan [34] derived from NDVI using MODIS (16-day) reported strong regression fits (R2 = 0.72–0.95 across months; R2 up to 0.97 for alfalfa). It appears there is a robust statistical relationship between NDVI and for different vegetation types, which agrees with our findings. Additionally, Elkatoury and Alazba [3] confirmed that NDVI and LAI are robust predictors for /, with regressions achieving very high R2 (0.86–0.97) confirming the reliability of vegetation indices in estimating plant coefficients.
Microclimates are inherently present across all urban plants and should be considered when estimating plant water requirements. Urban environments influence microclimates with factors such as structural features, asphalt surfaces, temperature, wind velocity, light intensity, and humidity, which exhibit significant variability among different landscapes. To accommodate these differences, a microclimate adjustment factor () is employed, typically ranging from 0.5 to 1.4 according to WUCOLS standards and detailed in Table 5. Incorporating this factor is crucial because urban microclimates can elevate evapotranspiration rates, thereby requiring modifications to irrigation scheduling [35,36]. In this study, a value of 1.4 was used, and the resulting values are presented in Table 5. For example, the for , , and is 0.3, indicating alignment with WUCOLS’ low water demand classification. Conversely, species such as , , , and have of 0.2, while has the lowest of 0.1. Additionally, and conform to the moderate water demand category, with a of 0.6, which signifies a requirement of 60% of their full water needs to maintain health, aesthetic value, and growth potential.
The estimated values demonstrated strong agreement with the WUCOLS water use categories, classifying , , and as low-water-requirement species, whereas and were categorized as having moderate water demand [16]. Such classifications provide valuable guidance for landscape architects and urban planners by highlighting opportunities to optimize irrigation efficiency through the strategic application of the PCM approach in estimating plant water requirements. Additionally, utilizing spectral reflectance data based on PCM is the optimal method to assess plant water stress because of the correlation between reflectance and chlorophyll concentration in plants. Zhu, He [37] highlighted that plant reflectance is intricately linked to leaf biochemistry and biophysical properties. Under water-stress conditions, alterations in these properties lead to increased reflectance, particularly in the visible and infrared regions of the spectrum.
4.3. Average Estimated Plant Coefficient () Based on PCMT
The PCM tool (PCMT) developed here was applied to Riyadh city due to its afforestation initiatives, expansions of green spaces, international parks, and giant landscape projects. Figure 9 illustrates the monthly spatial distribution of the mean across Riyadh city for 2023, as estimated utilizing the PCMT within ArcMap. The figure reveals that the distinct spatial and seasonal variation in values according to plant diversity ranged from 0 to 1.5, which agrees with the WUCOLS range. at Site (A) remains low (around 0.2–0.4) during most months (Table 6), indicating relatively moderate water consumption tailored to diverse plant types. Site-specific variation shows average in Site (B) approximately equal to 0.3 according to inter-spaces between palm fronds and the increasing of palm canopy area attributable to the water-demanding date palms. While Site (C) exhibited more stability in the geographical distribution of average and there was not a significant influence by the seasonal transition between warm- and cool-season turf grasses, Site (A) exhibited intermediate and more heterogeneous patterns due to species diversity. Therefore, the based on PCMT serves as an indicator of plant water needs and is critical for irrigation planning. The observed trends align with the ecological and physiological characteristics of the planted species. Whereas, in Site B, the consistently average of 0.3 with a high canopy area underscores the high water demand of mature date palms, which retain active transpiration year-round, Site A reflects complex interactions due to mixed vegetation, where groundcovers likely contribute average values relative to trees. Site C demonstrates the impact of turf management practices, showing a drop in during winter ryegrass coverage and a rise in summer with the dominance of C2000 grass.
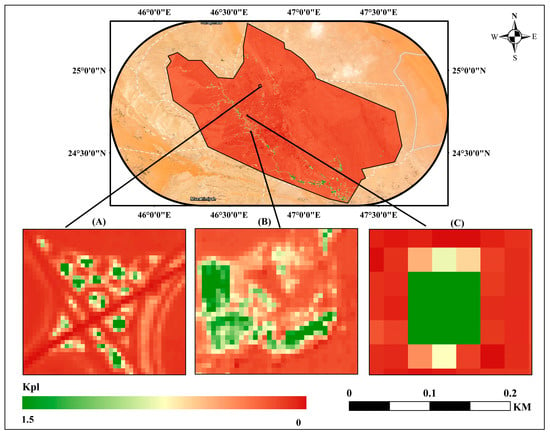
Figure 9.
P Spatial distribution maps of the mean plant coefficient for Riyadh city utilizing PCM developed tool (PCMT) based on ArcMap software, focuses on the three study sites, Site (A), Site (B), and Site (C), based on PCMT.

Table 6.
Average monthly estimated and by PCMT for the main three study sites, in addition, actual water applied.
4.4. Volumetric Plant Water Demand () Estimated Utilizing PCMT
Volumetric plant water demand () maps for AR Riyadh city have been developed based on PCMT. Figure 10 demonstrates the spatial and temporal dynamics of plant volumetric water demand, represented as across Riyadh city throughout 2023. The highest values were recorded during summer months (), matching the peak values and high evaporative demand. A clear decline in is seen during the winter season, with the lowest values in November (). Site B exhibited the highest annual , in line with the permanent canopy and year-round transpiration of date palms as shown in Table 6. Site C showed a seasonal dip during the winter due to dormancy of C2000 grass, offset slightly by ryegrass supplementation. Spatial patterns reveal a gradient of intensity, generally increasing from urban core areas with limited vegetation to more vegetated peripheral zones.
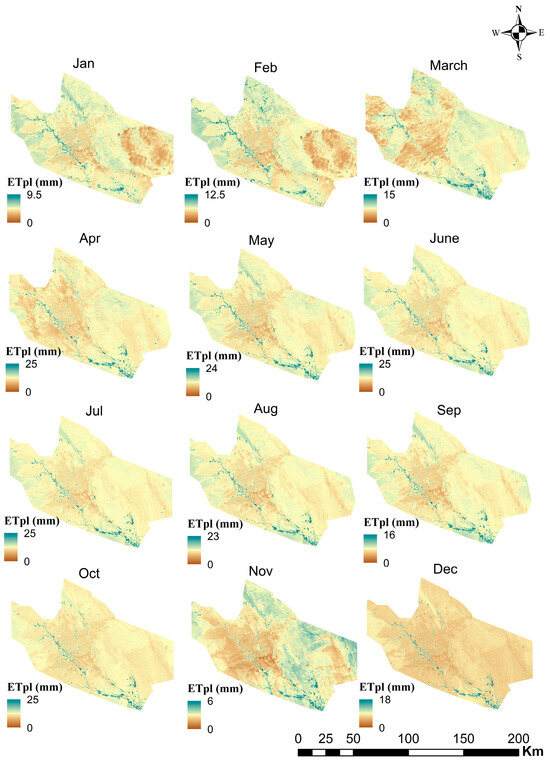
Figure 10.
Spatial-temporal distribution for estimated volumetric evapotranspiration utilizing PCM tool (PCMT) plugged in ArcMap software.
integrates plant physiological activity with atmospheric demand and thus serves as a direct proxy for landscape water requirements. The results reaffirm the importance of plant species selection and seasonal irrigation planning. High zones (e.g., Site B) demand more rigorous irrigation management or drought-tolerant alternatives. In turf systems (Site C), seasonal grass rotation effectively manages by reducing cool-season water use while maintaining year-round cover. High zones (e.g., Site B) demand more rigorous irrigation management or drought-tolerant alternatives. In turf systems (Site C), seasonal grass rotation effectively manages by reducing cool-season water use while maintaining year-round cover. Mixed landscapes (Site A) pose challenges due to varied water needs, making zoned irrigation systems or species unification strategies beneficial.
4.5. Actual and Estimated Water Application
Across all sites, the data suggests that water application generally aligns with the estimated , though some deviations are noticed, especially during months with high , possibly due to water conservation practices or operational constraints. Table 6 reveals that for Site (A), estimated generally consistent with the estimated coefficients, has a high value in July (up to 8.1 mm). Actual water applied is approximately constant (5.7 mm) in winter/spring and increases to 8.5 L/m2 in summer, reflecting adaptive irrigation. However, over-irrigation is evident in the winter months. For example, in February, estimated was 2.3 mm, but 5.7 mm was applied, representing a 148% surplus. In June, estimated demand rose to 6.3 mm, but 8.5 mm was applied, still within an acceptable buffer.
For Site (B), palm watering shows under-irrigation in May–July (around 281–234 L/palm), aligning with higher estimates, but only 175–234 L/palm was applied, representing a 37% deficit. Over-irrigation in March: 124 L/palm was applied vs. the 132 L/palm needed, representing a minor surplus. Oct–Dec had a significant mismatch; in October, demand was 216 L/palm, but only 116 L/palm was supplied, representing a 100 L shortfall.
On the other side, under-irrigation occurred in summer for Site (C). In August, actual irrigation was 99 m3 vs. the 125 m3 needed (20% deficit). Over-irrigation occurred in winter. In November, 45 m3 was applied despite a demand of only 5 m3, due to seasonal maintenance, replacement, and mowing of the turfgrass. December had a surprising demand of 80 m3, with 54 m3 applied, likely reflecting high water uptake from active ryegrass establishment. Therefore, the estimated at Site (C) varied significantly, with peaks during July–August, reaching 121–125 m3 for the whole stadium, corresponding with peak ET rates. As a result, this demonstrates that higher , occurs during the summer months (June–August) at all sites, consistent with temperature-driven increases in evapotranspiration. Lower demand occurs in winter (December–February), with minimal differences between estimated and actual applications, indicating water savings during cooler months.
PCMT findings show higher water demand in summer and a decline in winter, with site-specific variations (e.g., date palms requiring year-round water, turfgrasses showing seasonal variation). Mahmoud and Gan [34] confirmed these results with findings which illustrated an and peak in summer (April–September) and a decline in winter; NDVI— trends were consistent with growth cycles. Hence, This confirms that PCMT aligns with established coefficient-based ET estimation approaches. Moreover, another study conducted by NOURI compared three approaches to evapotranspiration estimation in mixed urban vegetation: field-based, remote-sensing-based and observational-based methods. It shows that RS- methods track water demand well in heterogeneous landscape fields and that WUCOLS may underestimate consumption relative to SWB, which matches the PCMT validation/results notes indicating that -based coefficients capture seasonal dynamics.
4.6. PCMT Utility
Table 6 illustrates clear seasonal trends and species-specific water demands across diverse urban landscape types. The PCMT proved instrumental in distinguishing between diverse plant species in mixed zones (Site A), accurately quantifying high water demands of perennial palms (Site B), and reflecting the dynamic irrigation needs of dual turf systems in sports infrastructure (Site C). Additionally, PCMT offers a precise, flexible, and scalable solution for water demand estimation. Its major advantages are that PCMT enables users to assign values without knowing plant species, allowing for fine-tuned water modeling. By integrating monthly climatic data and plant response curves, PCMT models temporal changes in and , facilitating adaptive irrigation. Spatial flexibility is a main advantage, as it accommodates various scales from a single turf field to mega greening projects using GIS-based mapping. Furthermore, PCMT is user-friendly, with compatibility in ArcMap and potential for automation, enabling decision-makers, municipal engineers, and landscape managers to apply it even with basic technical knowledge. By comparing estimated with actual irrigation schedules, PCMT helps identify over- or under-irrigation practices, supporting precision irrigation planning, resource optimization and water conservation. Finally, in arid regions like Riyadh, where evapotranspiration significantly exceeds precipitation for most of the year, data-driven water management is critical. The PCMT provides a robust foundation for transforming irrigation from static schedules to climate- and plant-responsive practices.
5. Conclusions
The PCMT developed here effectively estimates spatial and temporal water demands for diverse landscape vegetation in water-scarce regions, enabling precise, adaptive irrigation planning. The integration of satellite-derived vegetation indices (NDVI and LAI) with climate data enabled precise estimation of plant-specific evapotranspiration () and water demands () across diverse landscape typologies, including urban greenery, date palm groves, and turf systems. The satellite-based extraction of NDVI and LAI demonstrated strong correlations with plant coefficients (and ), with R2 values of 0.9 and 0.8, respectively, confirming the reliability of remote sensing data for estimating plant-specific water needs. Seasonal and spatial variations in were accurately captured, showing peak values of approximately 25 L/m2 during the summer months and minimum values around 6 L/m2 in winter, aligning with temperature-driven evapotranspiration patterns. Validation results confirm high reliability in reflecting real-world water usage patterns, providing essential insights for water conservation efforts. Comparison of estimated versus actual water applied showed instances of both over and under irrigation, with a deviation especially notable during peak demand months, emphasizing the model’s capacity to identify and optimize current irrigation practices.
However, certain limitations should be illustrated. The model’s performance in extreme weather events, such as dust storms, clouds and prolonged heatwaves, remains uncertain and warrants further evaluation and corrections. Furthermore, PCMT was based on Landsat 8 imagery with a 16-day revisit cycle, which may limit responsiveness for real-time irrigation management. Broader testing across alternative sensors (e.g., Sentinel-2, MODIS, or upcoming high-resolution platforms) is needed to confirm transferability and scalability. On the other side, future studies could build upon these findings by integrating higher-resolution satellite images and real-time meteorological data. Coupling PCMT with machine learning techniques could further refine the estimation of plant coefficients and account for complex interactions among species, density, and microclimate. Such improvements will allow PCMT to evolve into a decision-support tool not only for urban greening initiatives but also for broader sustainability areas, including agriculture, climate adaptation, and water resource conservation.
Overall, PCMT proved to be a practical, scalable, and accurate tool for climate-sensitive water demand management, supporting sustainable water consumptive and urban greening efforts in water-scarce regions like Riyadh. Its user-friendly design and compatibility with existing GIS platforms make it a practical solution for advancing climate-sensitive irrigation strategies, ultimately supporting the Green Saudi Arabia initiative and broader ecological sustainability objectives.
Author Contributions
A.A.A., A.E., N.A. and F.R. contributed to multiple aspects of the study, including data curation, formal analysis, methodology, software development, validation, and original draft writing, as well as reviewing and editing. F.R., M.E. (Mahmoud Ezzeldin) and M.E. (M.N. Elnesr) participated in reviewing and editing the manuscript. All authors have read and agreed to the published version of the manuscript.
Funding
This project was funded by the National Plan for Science, Technology and Innovation (MAARIFAH), King Abdulaziz City for Science and Technology, Kingdom of Saudi Arabia, Award Number (WAT539) and the APC was funded by (MAARIFAH).
Data Availability Statement
The original contributions presented in this study are included in the article. Further inquiries can be directed to the corresponding author.
Conflicts of Interest
No conflicts of interest are declared by the authors in relation to the publication of this research.
References
- Prantner, Z.; Al-Najjar, A.A.A. The Saudi Green Initiative Facts and Perspectives. Saudi Green Initiat. Facts Perspect. 2024, 2024, 633–652. [Google Scholar]
- Taft, H.L. Water scarcity: Addressing the challenges. In Abstracts of Papers of the American Chemical Society; American Chemical Society: Washington, DC, USA, 2011; p. 242. [Google Scholar]
- Elkatoury, A.; Alazba, A.A. Irrigation Water Demand Management-Based Innovative Strategy: Model Application on the Green Riyadh Initiative, Saudi Arabia. Water 2024, 16, 3559. [Google Scholar] [CrossRef]
- Halecki, W. Sustainable water management for integrating solutions in urban and agricultural spaces: Balancing water needs for urban and agricultural solutions. In Balancing Water-Energy-Food Security in the Era of Environmental Change; IGI Global Scientific Publishing: Hershey, PA, USA, 2025; pp. 147–168. [Google Scholar]
- Wanniarachchi, S.; Sarukkalige, R. A review on evapotranspiration estimation in agricultural water management: Past, present, and future. Hydrology 2022, 9, 123. [Google Scholar] [CrossRef]
- Noun, G.; Lo Cascio, M.; Spano, D.; Marras, S.; Sirca, C. Plant-based methodologies and approaches for estimating plant water status of Mediterranean tree species: A semi-systematic review. Agronomy 2022, 12, 2127. [Google Scholar] [CrossRef]
- Lopez-Jimenez, J.; Vande Wouwer, A.; Quijano, N. Dynamic modeling of crop–soil systems to design monitoring and automatic irrigation processes: A review with worked examples. Water 2022, 14, 889. [Google Scholar] [CrossRef]
- Ezzeldin, M.; Alazba, A.A.; Alrdyan, N.; Radwan, F. Rationalizing Irrigation Water Consumption in Arid Climates Based on Multicomponent Landscape Coefficient Approach. Earth Syst. Environ. 2024, 9, 277–298. [Google Scholar] [CrossRef]
- Yu, D.; Li, X.; Cao, Q.; Hao, R.; Qiao, J. Impacts of climate variability and landscape pattern change on evapotranspiration in a grassland landscape mosaic. Hydrol. Process. 2020, 34, 1035–1051. [Google Scholar] [CrossRef]
- Gerhards, M.; Schlerf, M.; Mallick, K.; Udelhoven, T. Challenges and future perspectives of multi-/Hyperspectral thermal infrared remote sensing for crop water-stress detection: A review. Remote Sens. 2019, 11, 1240. [Google Scholar] [CrossRef]
- Elkatoury, A.; Alazba, A.A.; Radwan, F.; Kayad, A.; Mossad, A. Evapotranspiration Estimation Assessment Using Various Satellite-Based Surface Energy Balance Models in Arid Climates. Earth Syst. Environ. 2024, 8, 1347–1369. [Google Scholar] [CrossRef]
- Hashemi, Z.; Sodaeizadeh, H.; Mokhtari, M.H.; Ardakani, M.A.H.; Aliabadi, K.K. Monitoring and forecasting desertification and land degradation using remote sensing and machine learning techniques in Sistan plain, Iran. J. Afr. Earth Sci. 2024, 218, 105375. [Google Scholar] [CrossRef]
- Sarvakar, K.; Thakkar, M. Different vegetation indices measurement using computer vision. In Applications of Computer Vision and Drone Technology in Agriculture 4.0; Springer: Berlin/Heidelberg, Germany, 2024; pp. 133–163. [Google Scholar]
- Alazba, A.; Mossad, A.; Geli, H.M.; El-Shafei, A.; Elkatoury, A.; Ezzeldin, M.; Alrdyan, N.; Radwan, F. Mapping Land Surface Drought in Water-Scarce Arid Environments Using Satellite-Based TVDI Analysis. Land 2025, 14, 1302. [Google Scholar] [CrossRef]
- Zhao, Y.; Chen, Y.; Wu, C.; Li, G.; Ma, M.; Fan, L.; Zheng, H.; Song, L.; Tang, X. Exploring the contribution of environmental factors to evapotranspiration dynamics in the Three-River-Source region, China. J. Hydrol. 2023, 626, 130222. [Google Scholar] [CrossRef]
- Costello, L.R.; Matheny, N.P.; Clark, J.R.; Jones, K.S. A guide to estimating irrigation water needs of landscape plantings in California. In The Landscape Coefficient Method and WUCOLS III; University of California: Berkeley, CA, USA, 2000. [Google Scholar]
- Alazba, A.; Mattar, M.A.; El-Shafei, A.; Ezzeldin, M.; Radwan, F.; Alrdyan, N. Water Demand Determination for Landscape Using WUCOLS and LIMP Mathematical Models. Water 2025, 17, 1429. [Google Scholar] [CrossRef]
- Alazba, A. Estimating palm water requirements using Penman-Monteith mathematical model. J. King Saud Univ. 2004, 16, 137–152. [Google Scholar]
- Klingmann, A. Rescripting Riyadh: How the capital of Saudi Arabia employs urban megaprojects as catalysts to enhance the quality of life within the city’s neighborhoods. J. Place Manag. Dev. 2023, 16, 45–72. [Google Scholar] [CrossRef]
- Allen, R.G.; Pereira, L.S.; Raes, D.; Smith, M. FAO Irrigation and Drainage Paper No. 56; Food and Agriculture Organization of the United Nations: Rome, Italy, 1998; Volume 56, p. e156. [Google Scholar]
- Nouri, H.; Glenn, E.P.; Beecham, S.; Chavoshi Boroujeni, S.; Sutton, P.; Alaghmand, S.; Noori, B.; Nagler, P. Comparing three approaches of evapotranspiration estimation in mixed urban vegetation: Field-based, remote sensing-based and observational-based methods. Remote Sens. 2016, 8, 492. [Google Scholar] [CrossRef]
- Middleton, N.J.; Thomas, D.S. World Atlas of Desertification; CABI Digital Library: Oxfordshire, UK, 1992. [Google Scholar]
- Middleton, N.; Thomas, D. World Atlas of Desertification; CABI Digital Library: Oxfordshire, UK, 1997. [Google Scholar]
- Elkatoury, A.; Alazba, A.; Mossad, A. Estimating evapotranspiration using coupled remote sensing and three SEB models in an arid region. Environ. Process. 2020, 7, 109–133. [Google Scholar] [CrossRef]
- USGS. EarthExplorer. 2023. Available online: https://earthexplorer.usgs.gov/ (accessed on 11 December 2024).
- Yang, M.; Hu, Y.; Tian, H.; Khan, F.A.; Liu, Q.; Goes, J.I.; Gomes, H.d.R.; Kim, W. Atmospheric correction of airborne hyperspectral CASI data using polymer, 6S and FLAASH. Remote Sens. 2021, 13, 5062. [Google Scholar] [CrossRef]
- Guo, Y.; Deng, R.; Yan, Y.; Li, J.; Hua, Z.; Wang, J.; Tang, Y.; Cao, B.; Liang, Y. Dark-object subtraction atmosphere correction for water body information extraction in Zhuhai-1 hyperspectral imagery. Egypt. J. Remote Sens. Space Sci. 2024, 27, 382–391. [Google Scholar] [CrossRef]
- Missions, U.L. Using the USGS Landsat8 Product; US Department of the Interior-US Geological Survey–NASA: Washington, DC, USA, 2016.
- Glenn, E.P.; Huete, A.R.; Nagler, P.L.; Hirschboeck, K.K.; Brown, P. Integrating remote sensing and ground methods to estimate evapotranspiration. Crit. Rev. Plant Sci. 2007, 26, 139–168. [Google Scholar] [CrossRef]
- Flores, F.J.; Allen, H.L.; Cheshire, H.M.; Davis, J.M.; Fuentes, M.; Kelting, D. Using multispectral satellite imagery to estimate leaf area and response to silvicultural treatments in loblolly pine stands. Can. J. For. Res. 2006, 36, 1587–1596. [Google Scholar] [CrossRef]
- Blinn, C.E.; House, M.N.; Wynne, R.H.; Thomas, V.A.; Fox, T.R.; Sumnall, M. Landsat 8 based leaf area index estimation in loblolly pine plantations. Forests 2019, 10, 222. [Google Scholar] [CrossRef]
- Roberts, D.P.; Short Jr, N.M.; Sill, J.; Lakshman, D.K.; Hu, X.; Buser, M. Precision agriculture and geospatial techniques for sustainable disease control. Indian Phytopathol. 2021, 74, 287–305. [Google Scholar] [CrossRef]
- de Vito, R.; Portoghese, I.; Pagano, A.; Fratino, U.; Vurro, M. An index-based approach for the sustainability assessment of irrigation practice based on the water-energy-food nexus framework. Adv. Water Resour. 2017, 110, 423–436. [Google Scholar] [CrossRef]
- Mahmoud, S.H.; Gan, T.Y. Irrigation water management in arid regions of Middle East: Assessing spatio-temporal variation of actual evapotranspiration through remote sensing techniques and meteorological data. Agric. Water Manag. 2019, 212, 35–47. [Google Scholar] [CrossRef]
- Gill, S.E.; Handley, J.F.; Ennos, A.R.; Pauleit, S. Adapting cities for climate change: The role of the green infrastructure. Built Environ. 2007, 33, 115–133. [Google Scholar] [CrossRef]
- Ramyar, R.; Ackerman, A.; Johnston, D.M. Adapting cities for climate change through urban green infrastructure planning. Cities 2021, 117, 103316. [Google Scholar] [CrossRef]
- Zhu, J.; He, W.; Yao, J.; Yu, Q.; Xu, C.; Huang, H.; Mhae, B.; Jandug, C. Spectral reflectance characteristics and chlorophyll content estimation model of Quercus aquifolioides leaves at different altitudes in Sejila Mountain. Appl. Sci. 2020, 10, 3636. [Google Scholar] [CrossRef]
Disclaimer/Publisher’s Note: The statements, opinions and data contained in all publications are solely those of the individual author(s) and contributor(s) and not of MDPI and/or the editor(s). MDPI and/or the editor(s) disclaim responsibility for any injury to people or property resulting from any ideas, methods, instructions or products referred to in the content. |
© 2025 by the authors. Licensee MDPI, Basel, Switzerland. This article is an open access article distributed under the terms and conditions of the Creative Commons Attribution (CC BY) license (https://creativecommons.org/licenses/by/4.0/).