Article

A Method for Improving the Efficiency and Effectiveness of Automatic Image Analysis of Water Pipes

1
Department of Hydraulic Engineering, College of Civil Engineering, Tongji University, Shanghai 200092, China
2
State Key Laboratory of Disaster Reduction in Civil Engineering, Tongji University, Shanghai 200092, China
3
Shanghai Institute of Disaster Prevention and Relief, Tongji University, Shanghai 200092, China
*
Author to whom correspondence should be addressed.
Water 2025, 17(18), 2781; https://doi.org/10.3390/w17182781
Submission received: 4 August 2025 / Revised: 12 September 2025 / Accepted: 14 September 2025 / Published: 20 September 2025
(This article belongs to the Section Urban Water Management)

Abstract

The integrity of urban water supply pipelines, an essential element of municipal infrastructure, is frequently undermined by internal defects such as corrosion, tuberculation, and foreign matter. Traditional inspection methods relying on CCTV are time-consuming, labor-intensive, and prone to subjective interpretation, which hinders the timely and accurate assessment of pipeline conditions. This study proposes YOLOv8-VSW, a systematically optimized and lightweight model based on YOLOv8 for automated defect detection in in-service pipelines. The framework is twofold: First, to overcome data limitations, a specialized defect dataset was constructed and augmented using photometric transformation, affine transformation, and noise injection. Second, the model architecture was improved on three levels: a VanillaNet backbone was adopted for lightweighting, a C2f-Star module was introduced to enhance multi-scale feature fusion, and the WIoUv3 dynamic loss function was employed to improve robustness under complex imaging conditions. Experimental results demonstrate the superior performance of the proposed YOLOv8-VSW model. This study validates the framework on a curated, real-world image dataset, where YOLOv8-VSW achieved mAP@50 of 83.5%, a 4.0% improvement over the baseline. Concurrently, GFLOPs were reduced by approximately 38.9%, while the inference speed was increased to 603.8 FPS. The findings validate the effectiveness of the proposed method, delivering a solution that effectively balances detection accuracy, computational efficiency, and model size. The results establish a strong technical basis for the intelligent and automated control of safety in urban water supply systems.

1. Introduction

Urban water supply networks are a vital elements of municipal infrastructure, essential for public welfare and socioeconomic development [1]. Throughout their long service life, these pipelines are subjected to the combined effects of internal hydraulic conditions and the external environment factors, rendering them vulnerable to several internal flaws, including corrosion, tuberculation and obstructions from foreign matter [2,3]. The failure to detect and repair these defects in a timely and accurate manner can compromise the structural integrity and safety of the network, resulting in substantial water loss, service interruptions, and possible public health hazards due to secondary water contamination. In extreme instances, catastrophic failures such as pipe bursts can cause severe damage to public infrastructure, including road surface collapse (Figure 1) [4,5]. Consequently, the efficient and accurate inspection of these pipelines has emerged as a significant concern for urban administration.
Advances in sensor technology have facilitated the application of a diverse range of methods for pipeline condition assessment. These include established techniques such as Closed-Circuit Television (CCTV), sonar, infrared thermography, ultrasonic testing, and Ground Penetrating Radar (GPR) [6,7]. More recently, methods based on hydraulic transient theory, known as Transient Test-Based Techniques (TTBTs), have emerged as a novel approach to fault diagnosis [8,9]. For instance, some studies have demonstrated that by inducing small pressure waves and analyzing their response to anomalies (such as leaks and wall degradation) using Inverse Transient Analysis, it is possible to successfully identify and locate damaged sections in subsea pipelines [8]. Despite this variety of advanced technologies, CCTV inspection remains the most widely adopted method in the industry. Its prevalence is due to its technological maturity and its unique ability to provide direct visual evidence of a pipe’s internal condition. The critical bottleneck in the CCTV workflow, however, is the subsequent task of rapidly and accurately interpreting the vast amount of collected visual data.
While various advanced inspection technologies, including sonar, infrared thermography, and ground penetrating radar (GPR), have emerged, closed-circuit television (CCTV) remains the most widely adopted method due to its ability to provide direct visual evidence [10]. However, the essence of the CCTV-based approach—the interpretation of video footage—is predominantly a manual process. This reliance on human operators is inefficient, labor-intensive, and highly subjective. The accuracy of these manual assessments is often compromised by factors such as poor image quality and operator fatigue, leading to missed detections or misclassifications [11,12,13,14]. Implementing artificial intelligence technology to create a novel data-driven, automated detection system offers a possible option to address these constraints [15].
Initial automated approaches for defect detection were based on traditional computer vision (CV) techniques. However, these methods often suffered from complex workflows and limited accuracy due to their reliance on manually engineered features, a process that required significant domain expertise and tedious trial-and-error [16]. In contrast, the development of deep learning (DL), particularly convolutional neural networks (CNNs), has significantly advanced AI-driven detection. DL models can automatically learn hierarchical and discriminative features straight from unprocessed data, offering a more robust and effective solution for automated pipeline defect detection [17,18,19,20,21]. Within the DL domain, object detection has emerged as a primary technique, capable of concurrently classifying and locating several sorts of faults inside a single image [22,23,24]. These algorithms are broadly categorized into two main frameworks: two-stage and single-stage. Two-stage frameworks, such as the Faster Region-based Convolutional Neural Network (Faster R-CNN) [25,26,27], prioritize accuracy by first generating region proposals and then classifying them. Cheng et al. [22] utilized a Faster R-CNN model to achieve an 83% mean average precision (mAP) for sewer defect detection, emphasizing the essential trade-off between accuracy and computational expense. Li et al. [28] enhanced a two-stage network with an improved region proposal network and multi-layer feature fusion to achieve state-of-the-art performance in both localization and fine-grained classification. Conversely, single-stage frameworks, such as the You Only Look Once (YOLO) series [19,22,29,30], were developed to address the slow inference speeds of two-stage models. By eliminating the region proposal step and performing predictions in a single pass, these models offer a superior balance of speed and accuracy, rendering them particularly appropriate for real-time applications. Concurrently, to address other practical challenges in pipeline inspection, researchers have explored advanced techniques including data augmentation, synthetic data generation to combat data scarcity [31], and more granular tasks like pixel-level segmentation [32] and 3D point cloud analysis [33] to extract more detailed defect information.
Despite these advances, achieving an optimal balance between model efficiency (lightweighting) and detection accuracy remains a primary challenge, particularly for real-time applications on resource-constrained devices. Recent studies have made significant progress in addressing this trade-off. Situ et al. [34] employed transfer learning and channel pruning to compress a YOLOv5s model, reducing its parameters by 81.0% and computational load by 48.8% while maintaining a high mAP of 91.8%. Liu et al. [35] developed the Sewer-YOLO-Slim framework, achieving a 60.2% reduction in model size while reaching an impressive 93.5% mAP. Other studies, such the YOLOv8-ALWP model by Zheng et al. [36] have integrated multiple optimizations to reduce the parameter count by 64.67% while simultaneously improving mAP by 1.7%, demonstrating a concurrent enhancement in both model efficiency and accuracy. While approaches focusing on integrating advanced modules like SK attention have enhanced accuracy, as demonstrated by Lu et al. [37] challenges in model generalization to new defect types and sufficient lightweighting for edge device deployment often remain.
Therefore, the practical implementation of automated inspection for in-service, pressurized water supply pipelines is currently constrained by three fundamental issues that this research seeks to address. First, there is a scarcity of specialized datasets in this domain, and existing data often suffers from significant class imbalance, which hinders the effective training and generalization of data-driven models. Second, state-of-the-art detection models are typically computationally intensive and have a large parameter count, rendering them unsuitable for real-time deployment on resource-constrained edge devices such as pipeline inspection robots. Third, challenging imaging conditions within these pipelines—characterized by turbidity, poor illumination, and reflections—degrade image quality. Consequently, existing models, including the otherwise high-performing YOLOv8 [38], exhibit poor robustness in detecting small, irregularly shaped, or obscured defects in these low-quality images, highlighting a clear need for targeted optimization. This study aims to propose and validate a novel method for the high-precision, real-time identification of internal pipeline defects by introducing a systematically optimized and lightweight model based on YOLOv8, named YOLOv8-VSW. The objective is to develop a comprehensive framework that enhances performance from the data level through to the model architecture and optimization strategy, ultimately bridging the gap between high-accuracy models and the demands of practical field deployment. The main contributions of this work are threefold. First, to address data limitations, this study constructed and augmented a specialized dataset of common defects (corrosion, tuberculation, and foreign matter) using a multifaceted strategy that included photometric, affine, and noise transformations. Second, to enable efficient edge deployment, this study introduces a lightweight architecture by replacing the complex backbone of YOLOv8 with a minimalist VanillaNet backbone. Finally, to improve detection robustness in challenging conditions, this study enhances multi-scale feature representation with a novel C2f-Star module in the neck and employs the WIoUv3 dynamic loss function to optimize localization accuracy on low-quality images.
Figure 1. Implications of the deteriorating health of water supply pipelines. (a) Secondary pollution of water; (b) Rupture and leakage. Reproduced or adapted from [39], with permission from Elsevier, 2025; (c) Damage to road surfaces [40].
Water 17 02781 g001

2. Methods

2.1. Data Collection

The data for this study were collected between 2023 and 2024 from four distinct municipal water distribution systems in a major city in China. The inspection was performed using a Snake701 in-pipe inspection robot, which is equipped with a high-definition pan-tilt-zoom camera that records continuous video, not time-lapse images. The pipelines included in our dataset ranged in diameter from 200 mm to 800 mm. The inspected pipelines primarily consisted of ductile iron and steel pipes, which are common materials in municipal water systems. This research focused on the detection of three common types of internal defects known to significantly impact network safety: corrosion, tuberculation, and foreign matter, as illustrated in Figure 2. Key frames were initially retrieved from the raw video feed to build the image dataset. A manual curation process was conducted to meticulously filter and discard low-quality images, including those affected by equipment jitter or high water turbidity, as well as frames with highly repetitive content. This rigorous selection process yielded a final raw dataset comprising 1936 high-quality defect images, each with a resolution of 1980 × 1080 pixels.

2.2. Image Enhancement and Annotation

2.2.1. Image Enhancement

The performance of DL models is highly dependent on the scale and diversity of the training data. To mitigate the risk of overfitting often associated with limited datasets and to enhance model generalization, this study employed a systematic data augmentation strategy [41]. The objective was to improve the model’s robustness by synthetically expanding the dataset to simulate the diverse conditions encountered during real-world pipeline inspections, such as variations in lighting, perspective, and signal noise. This was achieved through three primary techniques: photometric transformation, random affine transformation, and noise injection.
(1) Photometric Transformation
This study employs photometric transformation for data augmentation to simulate fluctuating light conditions induced by light sources, water turbidity, and other elements within the water supply pipeline, and proposes a visual feature reconstruction method based on linear attenuation. This method can effectively construct the extension characteristics of data distribution by adjusting the parameterization through linear contrast mapping technology, with the mathematical description as follows:
y = α x + β
where x 0 ,   1 represents the original pixel value, α serves as the contrast gain coefficient, and β acts as the brightness bias. In this study, setting parameters such as α = β = 0.8 was used to effectively simulate conditions of high-intensity illumination. The primary advantage of this approach is its ability to synthetically expand the diversity of lighting conditions in the training data while preserving the essential morphological structures of the defects, such as edge gradients and texture patterns. This strategy is particularly effective for addressing the domain shift problem arising from a dataset predominantly composed of low-light images.
(2) Random Affine Transformation
This study employs an affine transformation as the geometric space transformation for data augmentation to enhance the model’s robustness against geometric variations in the target. This transformation effectively combines linear mapping and translation, allowing for parametric control over the spatial domain feature expansion of the image. In the field of CV, the homogeneous coordinate representation of this transformation is as follows:
x y 1 = M x y 1 = m 11 m 12 m 13 m 21 m 22 m 23 0 0 1 x y 1
where ( x , y ) and ( x , y ) represent the coordinate vectors of the original space and the transformed space, respectively, and the transformation matrix M is composed of the rotation matrix R θ , the scaling matrix S s x , s y and the translation vector T t x , t y .
(3) Noise injection
This study employs a combination of salt and pepper noise with Gaussian noise to enhance the model’s anti-interference capability by augmenting the training dataset. Salt and pepper noise can simulate the distortion phenomenon of discrete pixels caused by abnormal signal transmission in image devices. The formula for salt and pepper noise generation is as follows:
I ( x , y ) = 0 , p / 2 255 , p / 2 I ( x , y ) , 1 p
where I ( x , y ) is the pixel value of the original image at coordinate ( x , y ) , p is the noise density, usually taken from 0.01 to 0.05, that is, 1% to 5% of the pixels are contaminated.
Gaussian noise mainly reproduces the continuous random fluctuation caused by the fluctuation of illumination conditions and the inherent characteristics of the sensor. The formula for Gaussian noise generation is as follows:
I ( x , y ) = I ( x , y ) + ε σ N ( 0 , 1 )
where I ( x , y ) is the pixel value of the original image at coordinate ( x , y ) , ε is the noise scaling factor, σ is the standard deviation of the image, and N ( 0 , 1 ) is the standard normal distribution. The original image has been normalized and σ = 1 is taken, where the salt and pepper noise density p is taken as 0.03 and the Gaussian noise scaling factor ε is taken as 0.02.

2.2.2. Dataset Partitioning and Labeling

Application of the data augmentation strategy described in Section 2.2.1 resulted in the expansion of the dataset from 1936 to 2122 images. The final dataset was partitioned into training, validation, and test subsets in an 8:1:1 ratio for model training and evaluation. Stratified sampling was utilized during this process to ensure that the proportional representation of each defect category was maintained across all subsets. The final class distribution is detailed in Table 1.
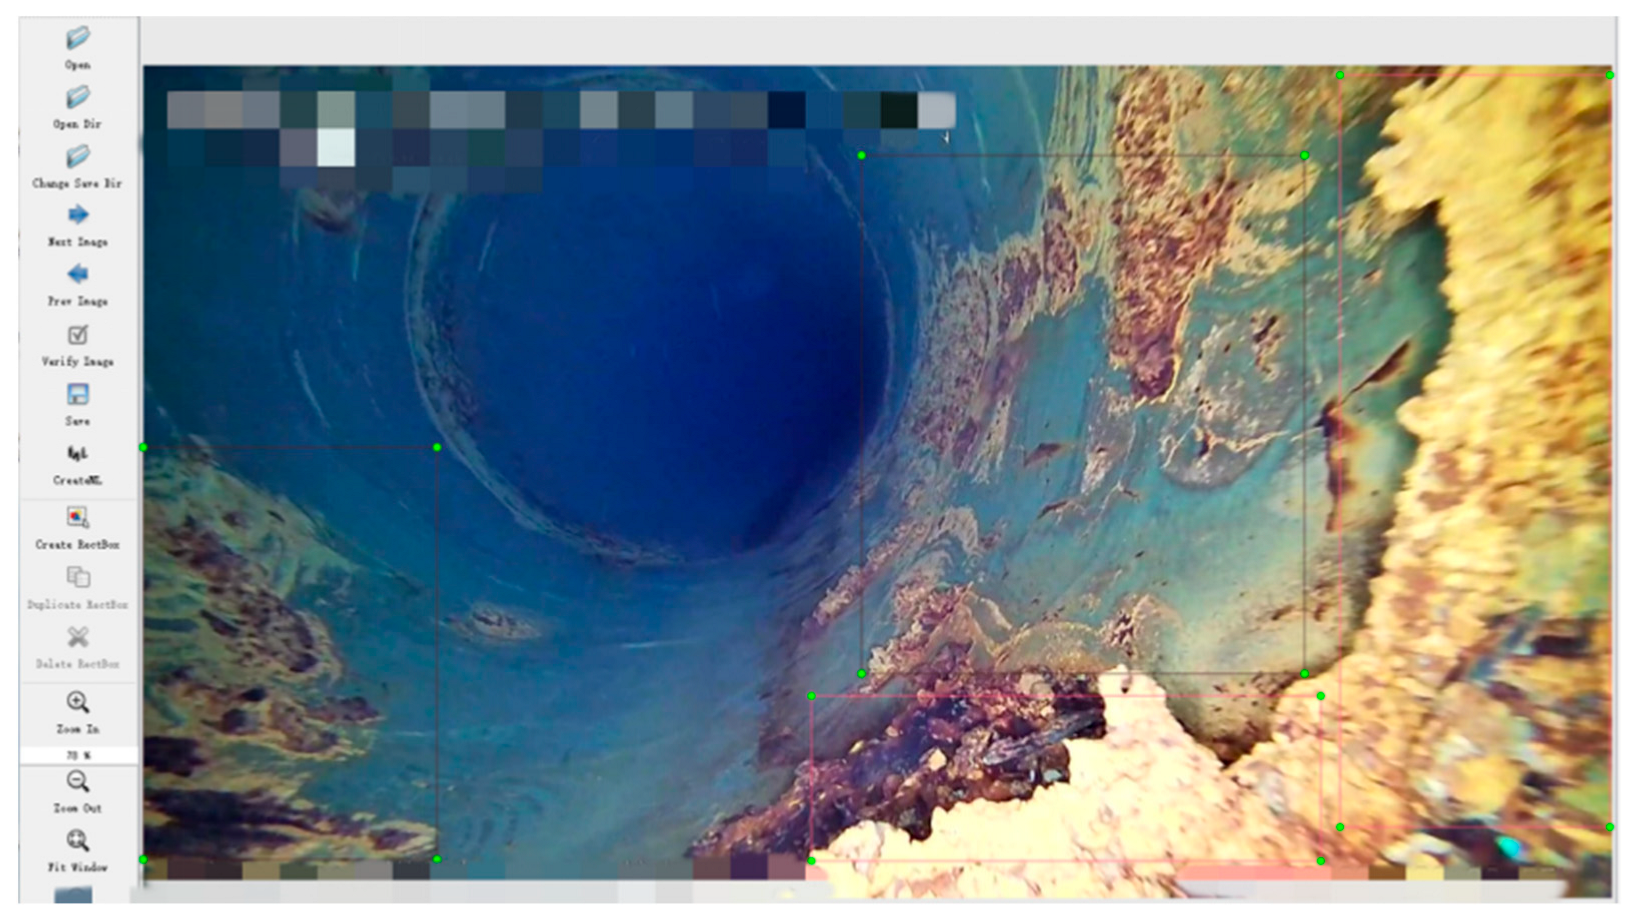
Following augmentation, the entire dataset of 2122 images was manually annotated using the open-source tool, LabelImg [42]. Annotators meticulously delineated precise bounding boxes around every defect instance (i.e., corrosion, tuberculation, and foreign matter) and assigned the corresponding class label, as illustrated by the interface in Figure 3. A stringent quality control process was established to guarantee the quality and consistency of the annotations, involving multiple rounds of review and proofreading by domain experts. This process resulted in the generation of a corresponding .txt annotation file for each image. These files contain the class and bounding box coordinates in a format fully compatible with the YOLOv8 training pipeline, serving as the ground truth data for model supervision. An example of the annotation file format is shown in Table 2.

2.3. YOLOv8 Architecture

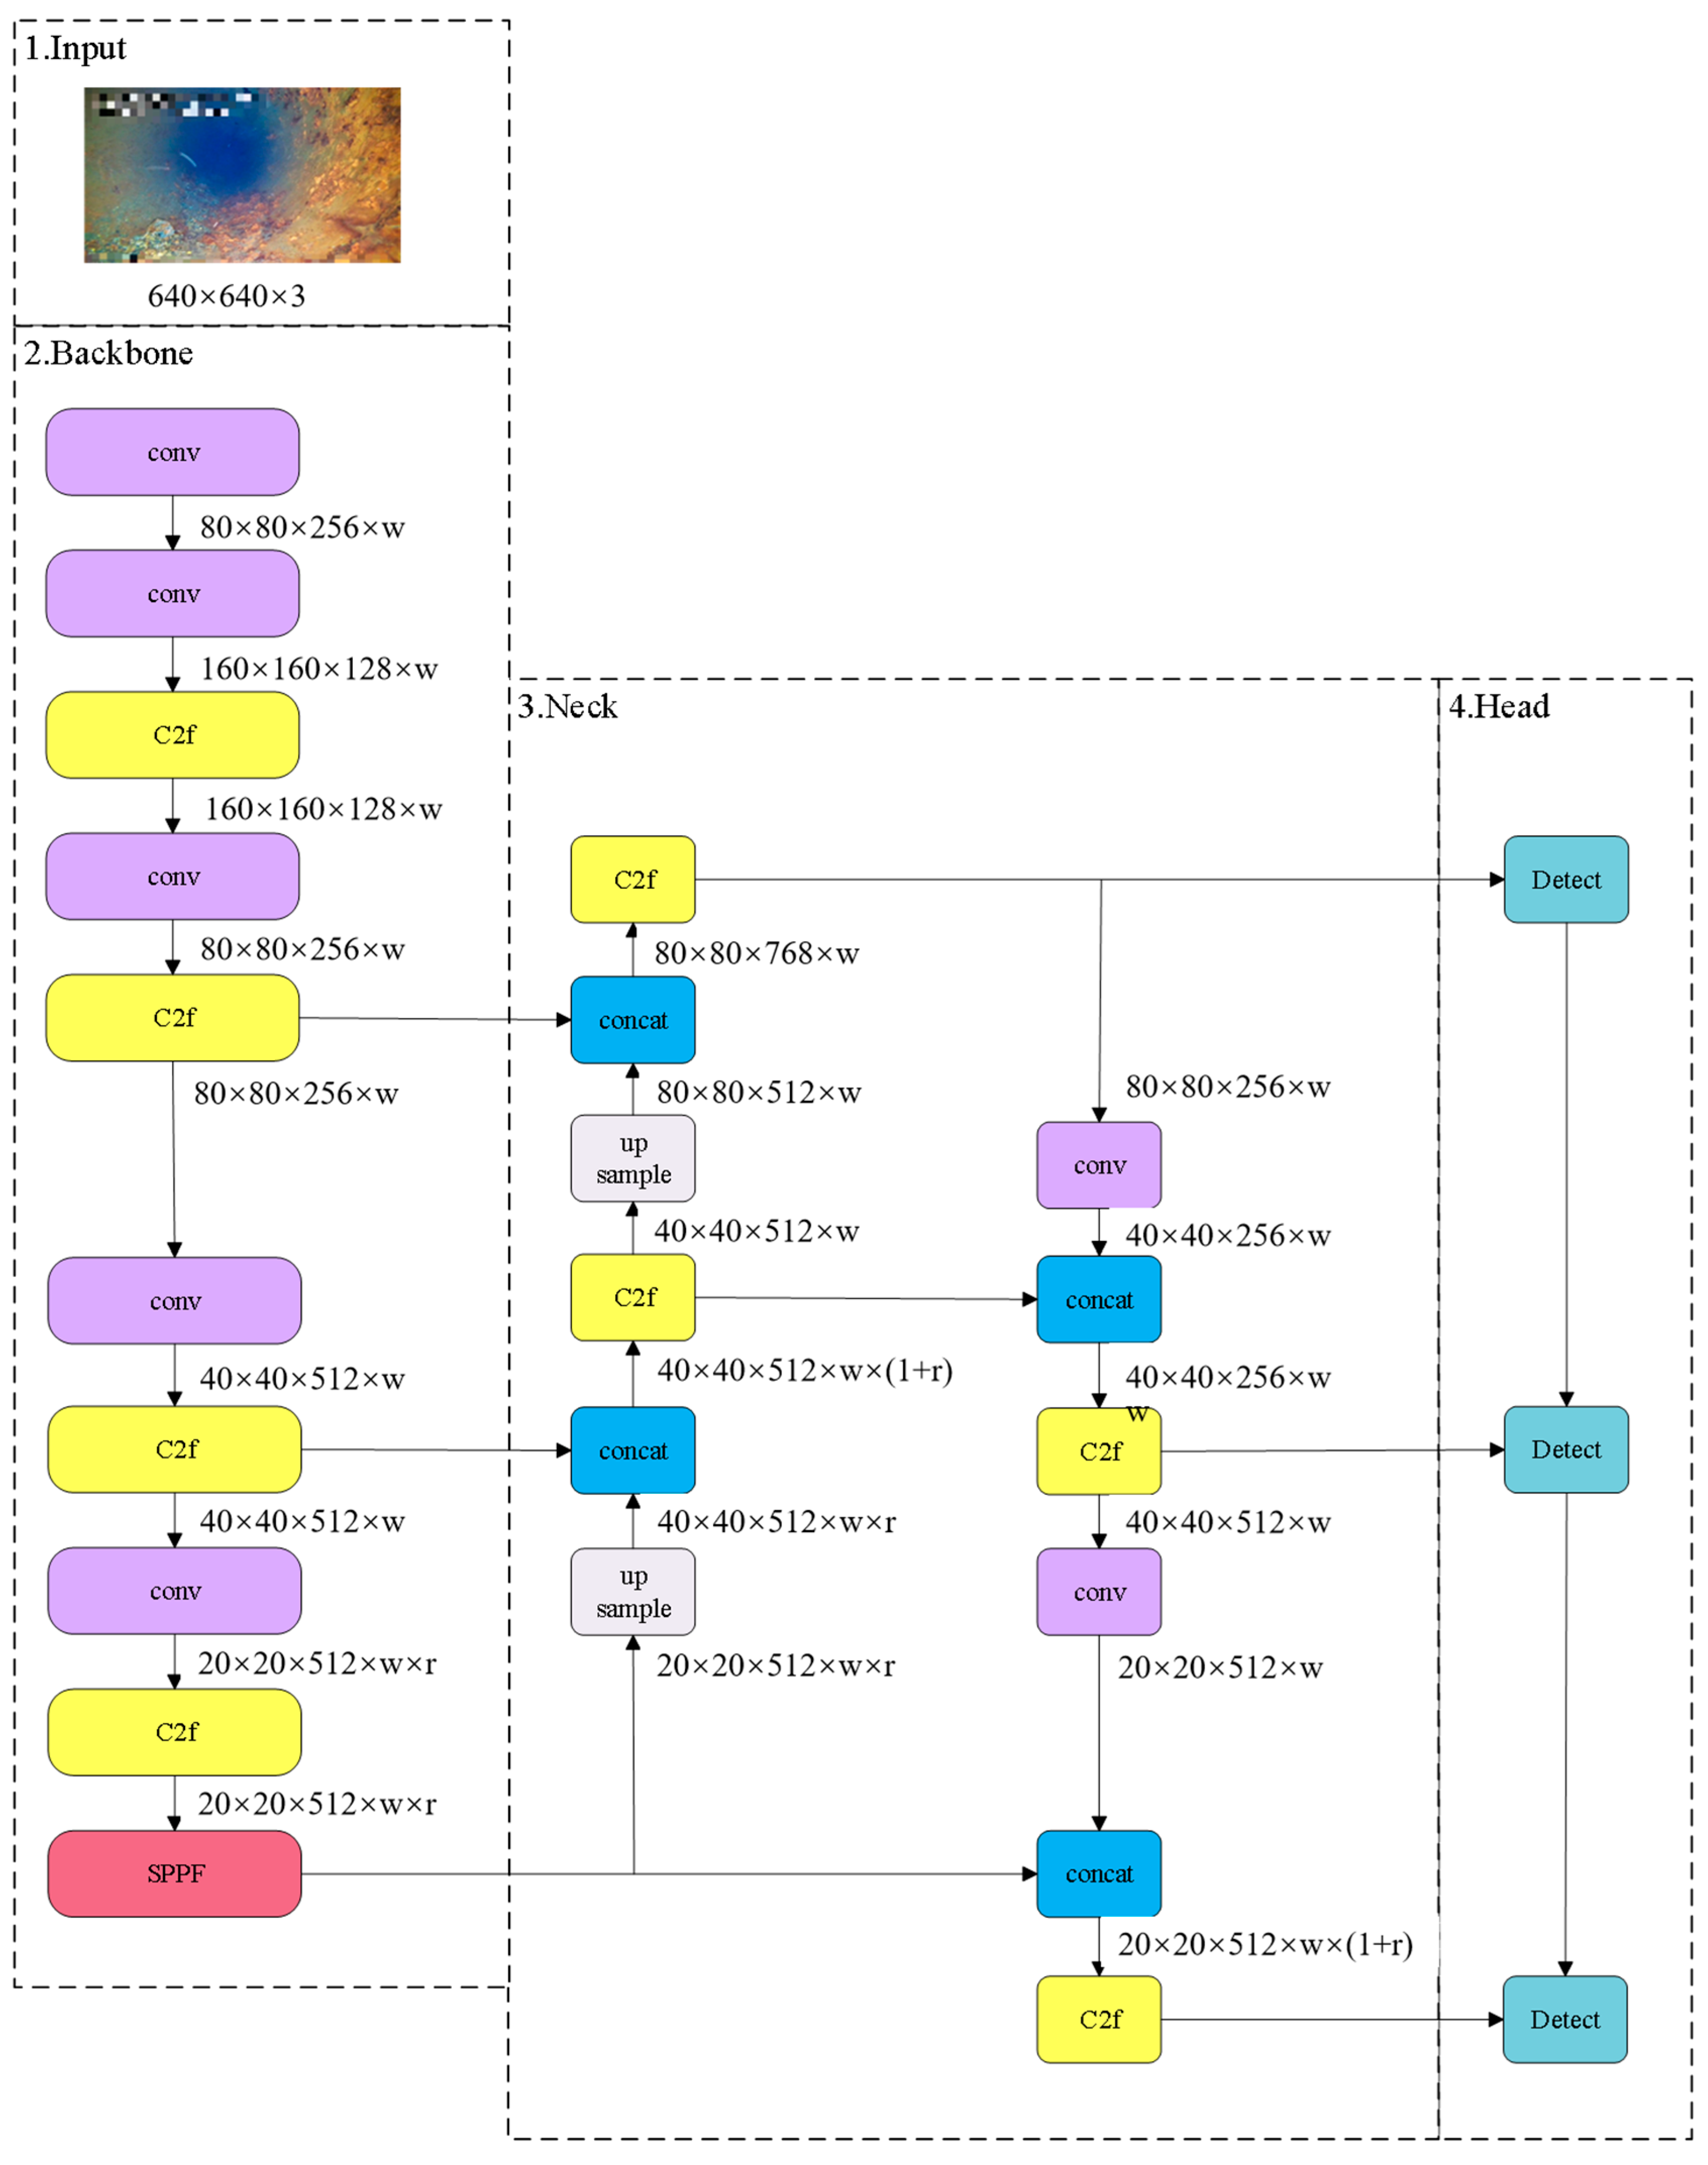
The YOLOv8 architecture, as illustrated in Figure 4, is a state-of-the-art single-stage object detector composed of three primary components: a Backbone for feature extraction, a Neck for feature fusion, and a Head for prediction [41]. The backbone network is founded on a cross-stage partial (CSP) design principle, aiming to achieve a superior balance between accuracy and efficiency. The primary element is the C2f module, which is inspired by the CSP concept and integrates ideas from ELAN to facilitate richer gradient flow. The backbone is primarily constructed from basic convolutional units, C2f modules, and a spatial pyramid pooling-fast (SPPF) module at its end. This architecture enables the extraction of powerful features through efficient cross-stage connections, ensuring a lightweight yet high-performance design. YOLOv8 utilizes a path aggregation network (PANet) for feature fusion in its neck architecture. The PANet structure facilitates bidirectional information flow, effectively combining high-level semantic features from deeper layers with fine-grained localization features from shallower layers. This multi-scale fusion mechanism is crucial for enhancing the detection of objects at various scales. Subsequently, the fused features are passed to an anchor-free, decoupled head. This design separates the classification and regression (localization) tasks into distinct branches, which has been shown to mitigate task conflict and improve overall model performance. At the input layer, YOLOv8 leverages advanced data augmentation strategies during training. In addition to the standard Mosaic augmentation, which enriches the background and spatial composition of training samples, it innovatively incorporates a strategy of progressively disabling augmentations during the final training epochs. This allows the model to adapt more closely to the original data distribution, thereby enhancing its final generalization ability [43].

2.4. Improved YOLOv8 Model

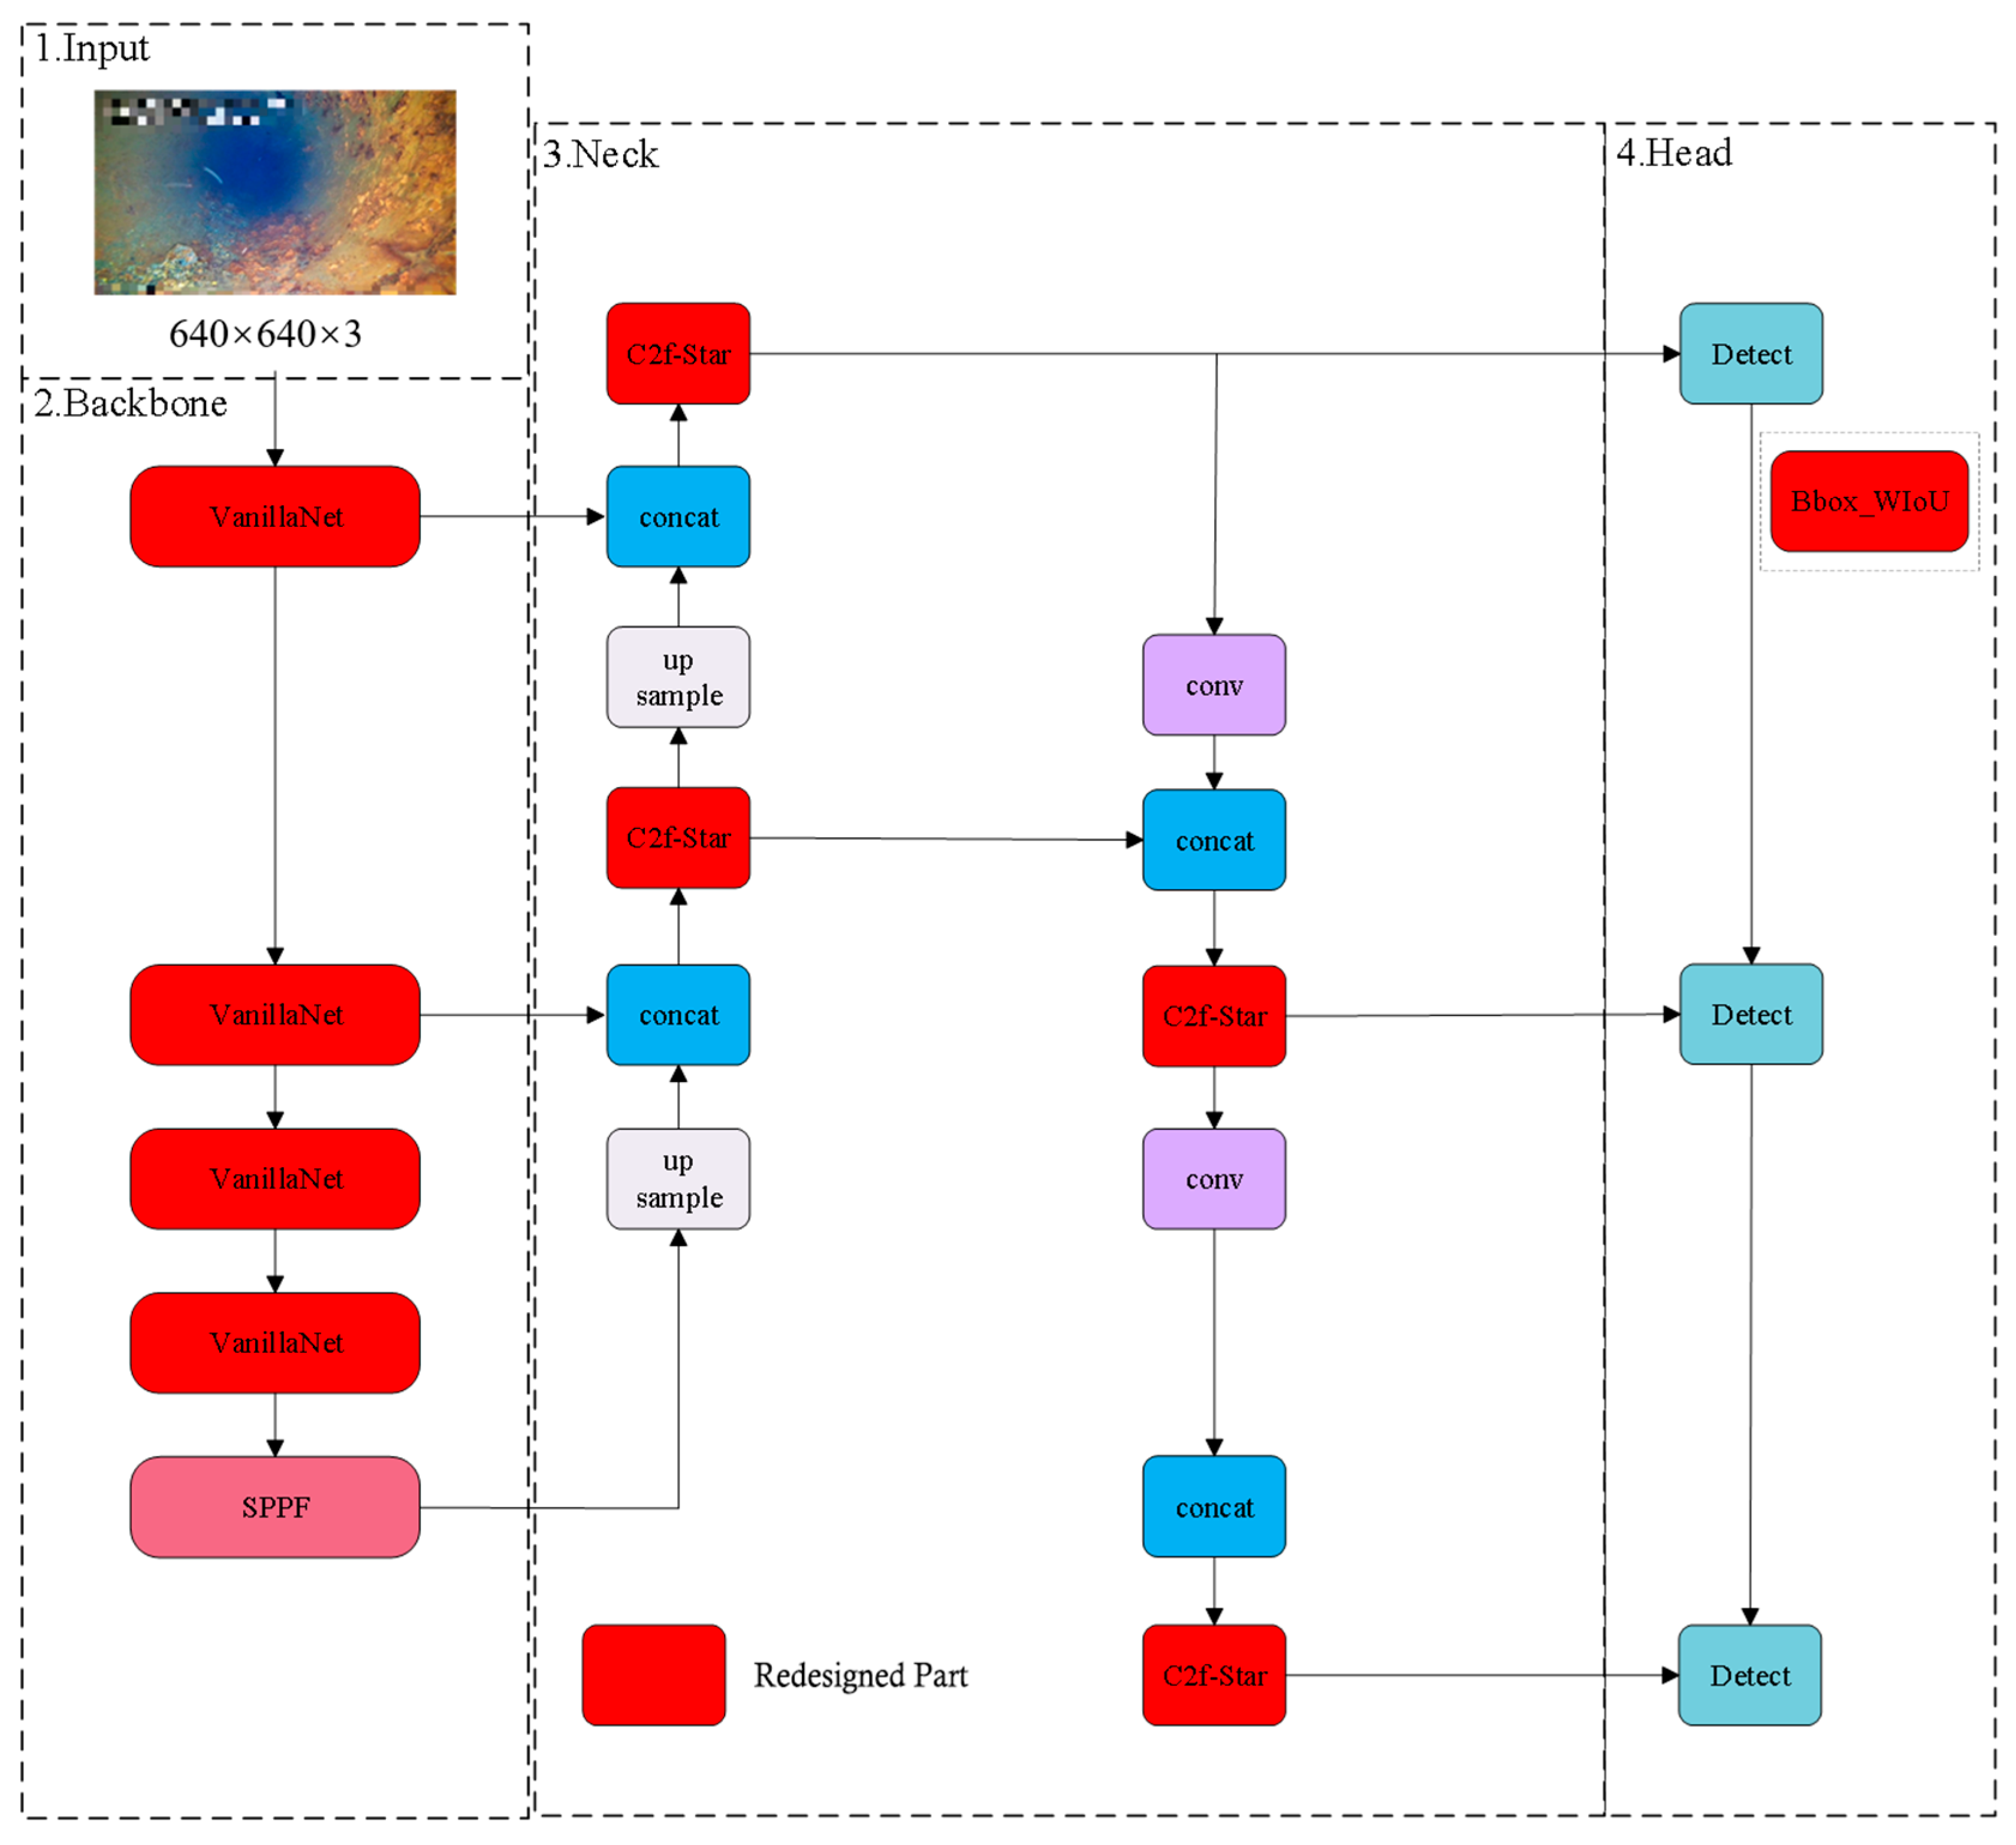
This study proposes YOLOv8-VSW, a model that systematically optimizes the baseline YOLOv8 across three key areas: its architecture, feature fusion mechanism, and loss function. The standard backbone is replaced with a minimalist VanillaNet architecture; by leveraging 1 × 1 convolutions, this modification significantly reduces the parameter count and computational redundancy, thereby increasing inference speed while preserving essential small-target features. A novel C2f-Star module is introduced in the neck, integrating a dynamic Star operation with efficient depth-wise separable convolutions (DW-Conv) to enhance multi-scale feature representation and improve defect detection accuracy. The WIoUv3 dynamic loss function is employed; its gradient equalization and outlier suppression mechanisms significantly enhance the model’s robustness against low-quality samples (e.g., blurred or occluded images) and improve overall localization accuracy. These innovations result in a lightweight, high-precision solution for the intelligent inspection of in-service water supply pipelines, the architecture of which is illustrated in Figure 5.

2.4.1. Lightweight Improvement Based on VanillaNet

While the baseline YOLOv8 model demonstrates powerful detection capabilities, its complex backbone network, such as CSPDarknet, is characterized by a high parameter count and significant computational load. These characteristics pose considerable challenges for real-time deployment on computationally constrained edge devices, like pipeline inspection robots. This study presents a lightweight architectural change that substitutes the original sophisticated backbone with a simplified VanillaNet design to alleviate this constraint.
The design philosophy of VanillaNet [44] reverts to the fundamental principles of CNNs. It deliberately eschews modern complex components, including residual connections, CSP blocks, and multi-branch fusion. The architecture consists of a straightforward, sequential arrangement of fundamental convolutional and max-pooling layers. To maximize efficiency, the convolutional layers primarily utilize 1 × 1 kernels for feature extraction and channel manipulation, while downsampling is performed by standard 2 × 2 max-pooling. This linear and simplified structure renders the entire feature extraction process highly direct and computationally efficient.

2.4.2. Neck Improvement Based on C2f-Star

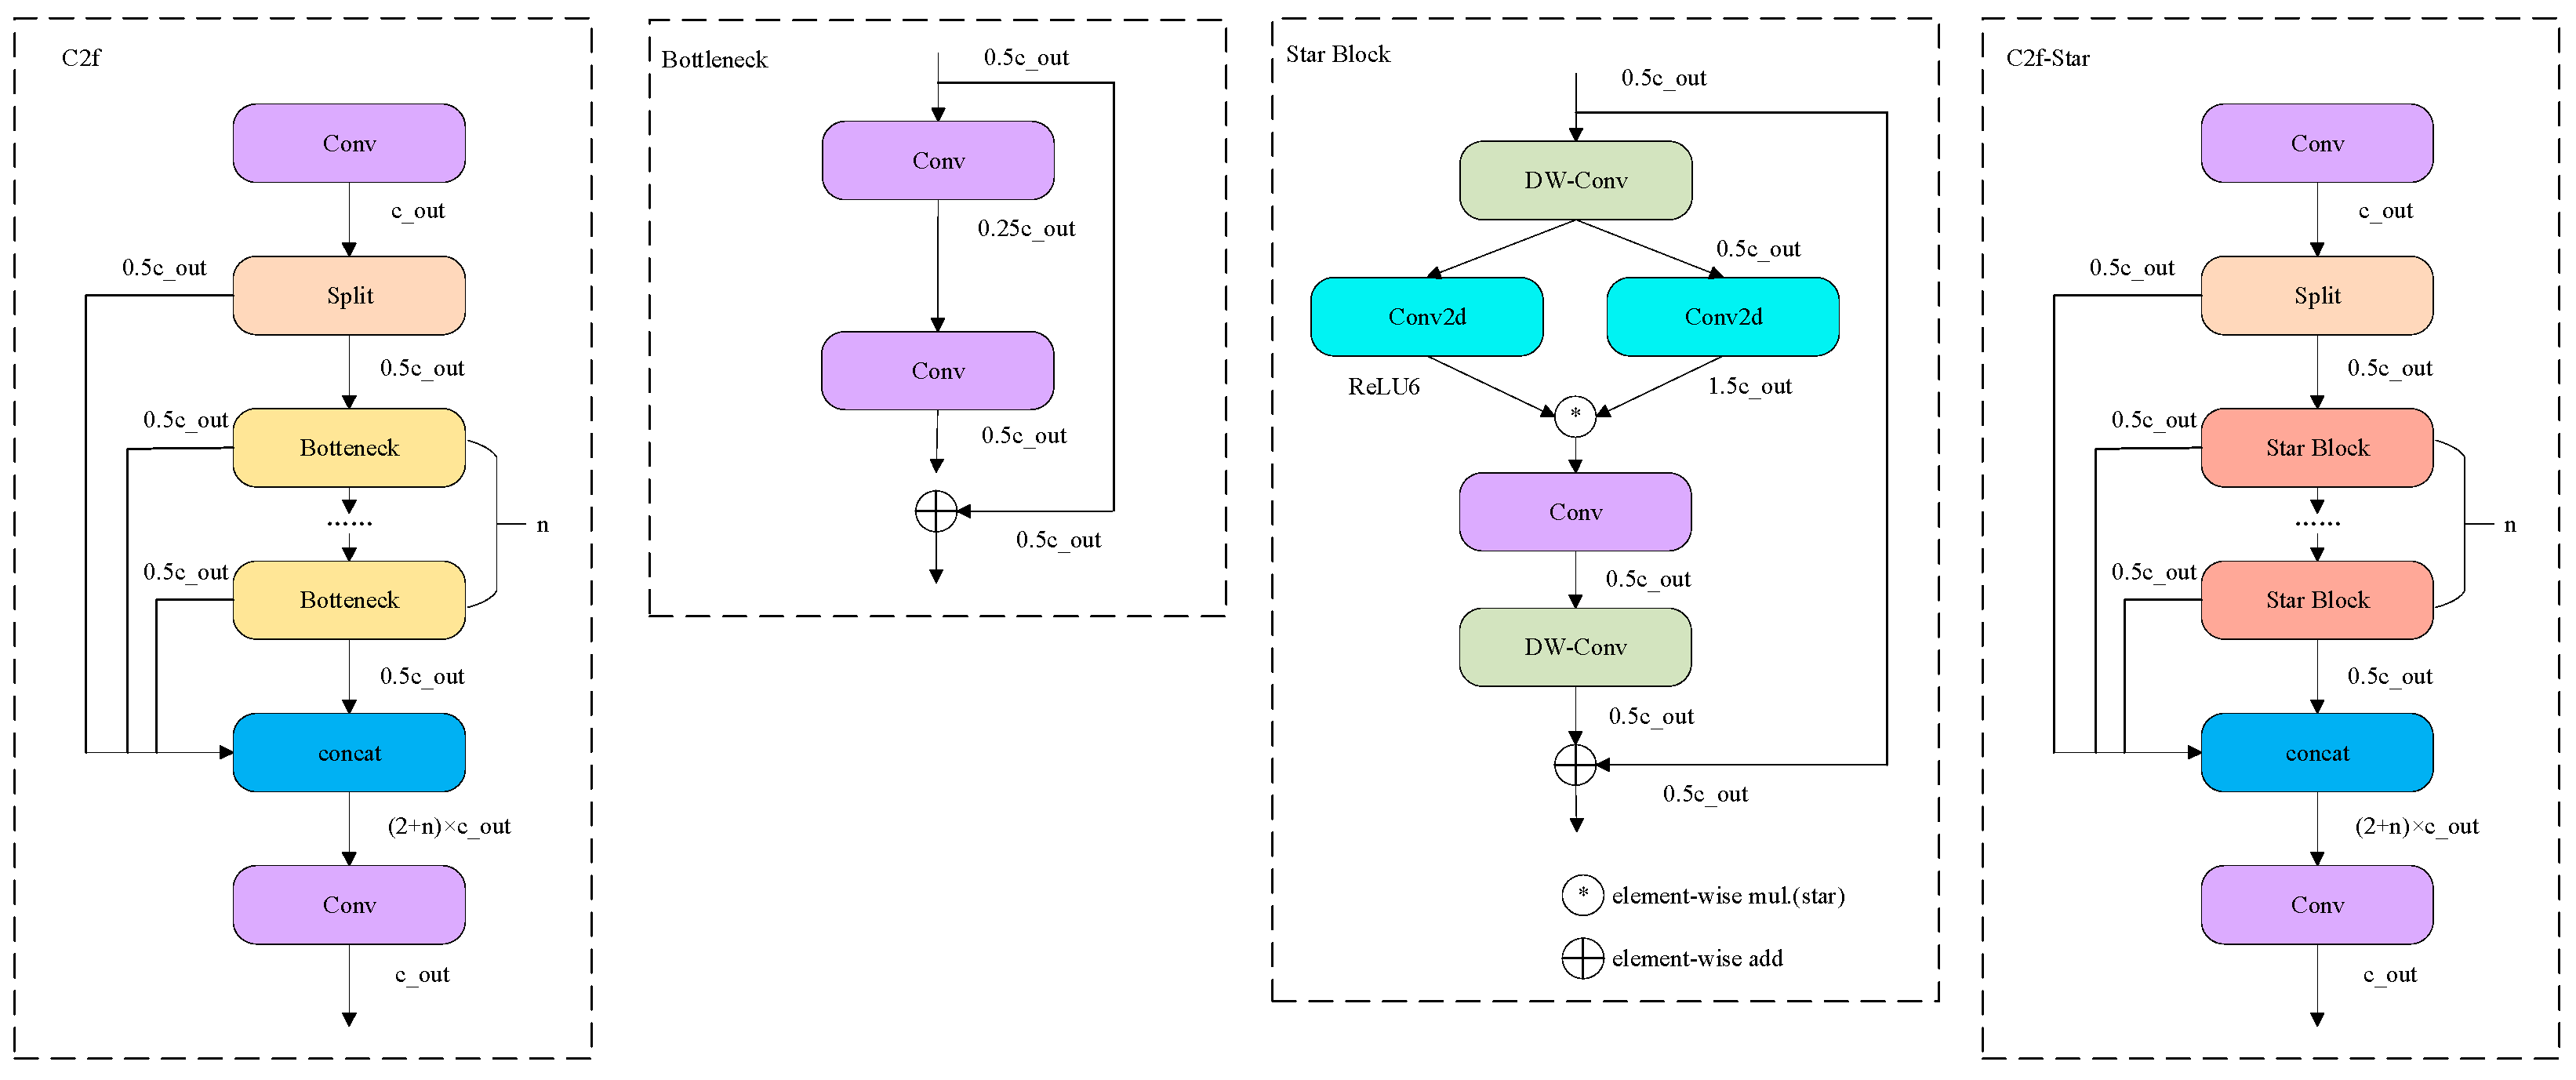
In the feature fusion neck of the standard YOLOv8 architecture, the C2f module processes features by stacking multiple Bottleneck blocks (Figure 6). This design, however, relies on standard 3 × 3 and 1 × 1 convolutions, which results in a fixed geometric receptive field. This study identified this as a limitation when dealing with the diverse morphologies and wide scale variations in defects found in water supply pipelines. The standard approach performs basic feature superposition and does not adequately explore potential higher-order relationships between features. This study introduces the C2f-Star module, an improved iteration of C2f, as depicted in Figure 7.
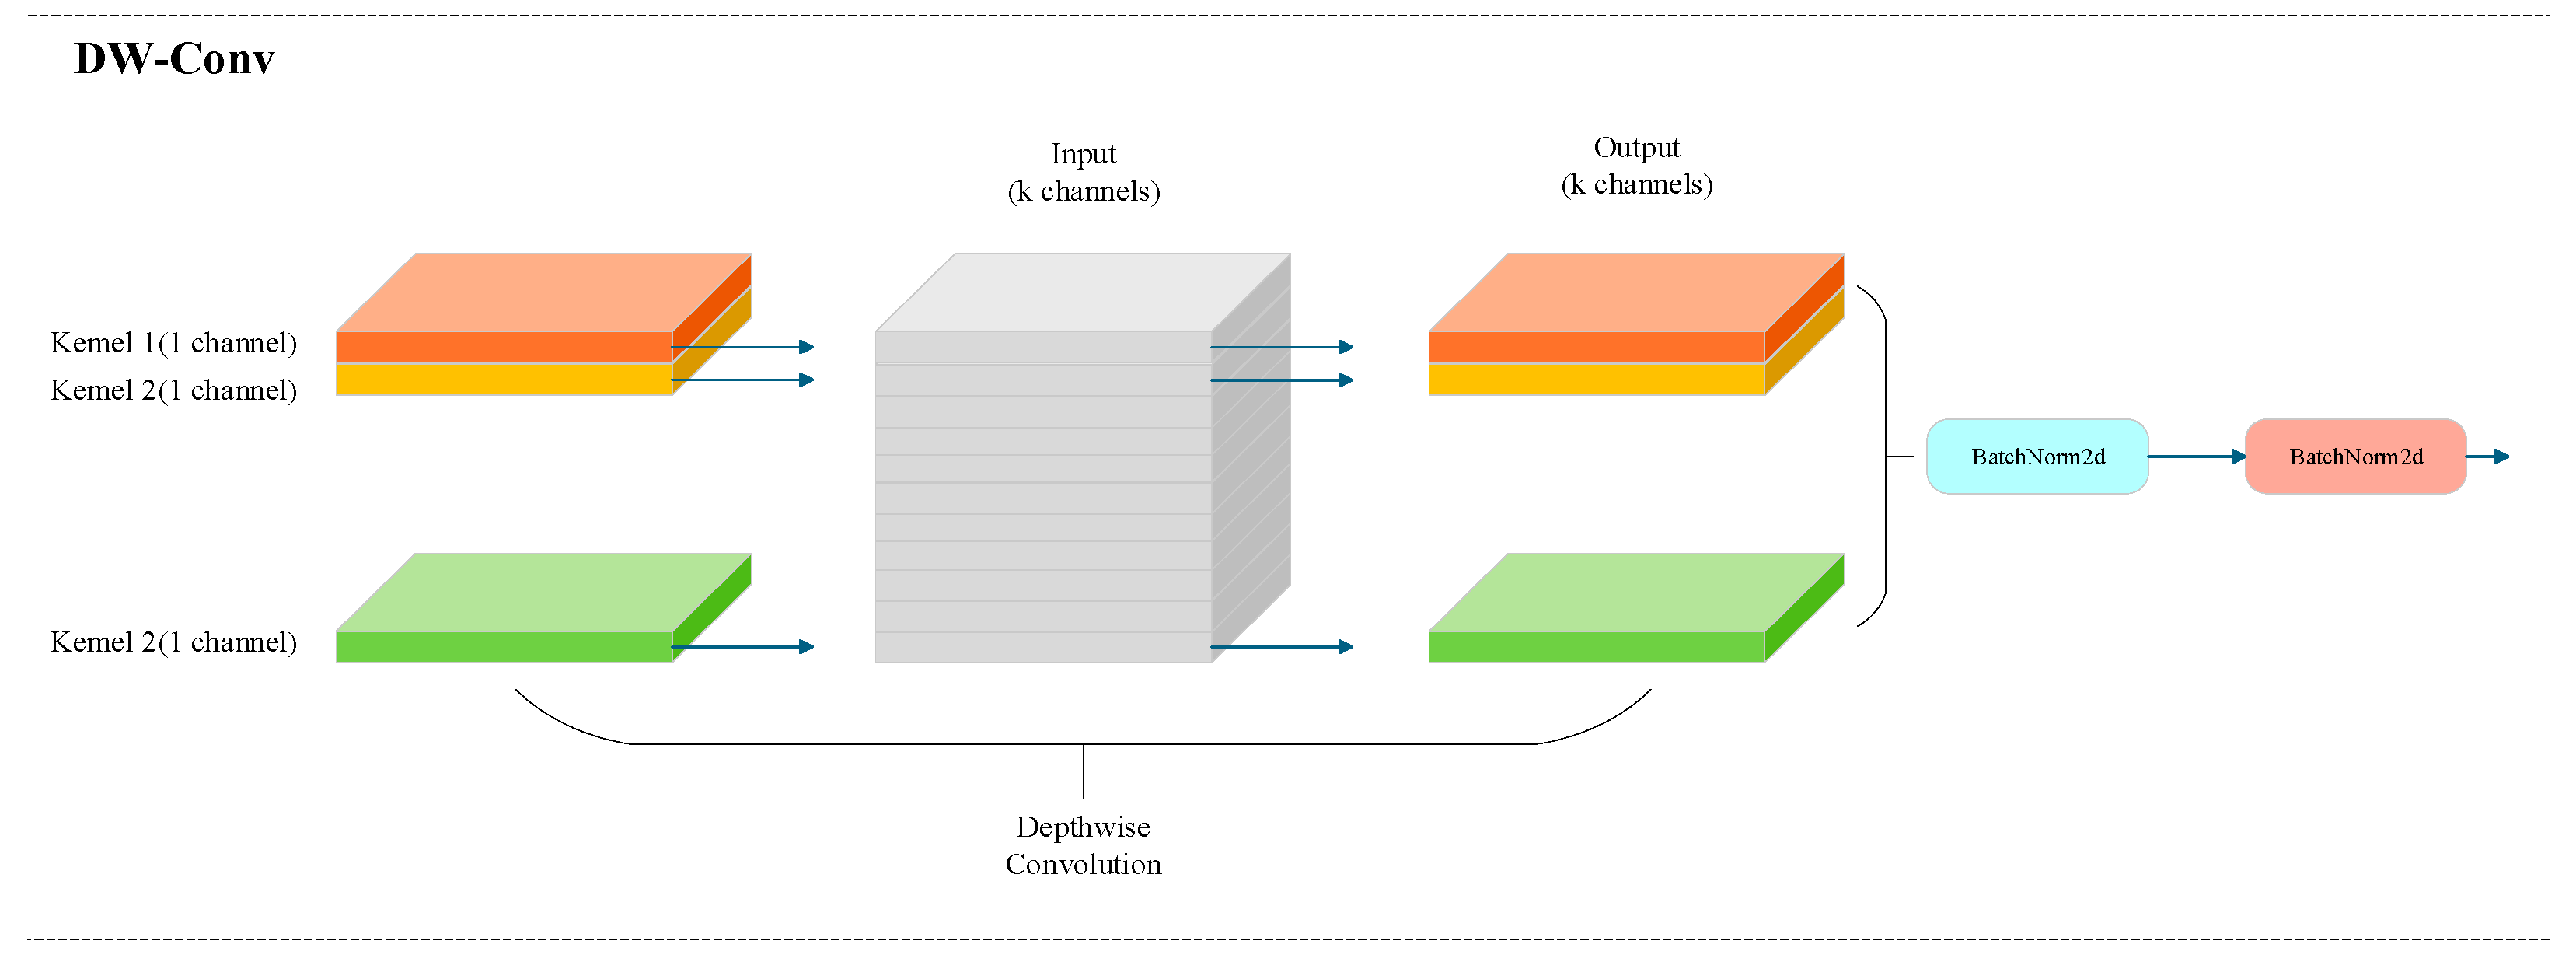
The core innovation of the C2f-Star module is the replacement of the conventional Bottleneck block with a novel Star Block. The Star Block integrates two key components: efficient DW-Conv to reduce computational cost [45], and the innovative Star operation [46]. Through a specific non-linear combination of feature channels, the Star operation map features a higher-dimensional implicit space for interaction. This mechanism enables the model to capture complex feature relationships that are imperceptible to traditional convolutions, as shown in Equation (5). For a single-channel transformation, the mathematical expression of the Star operation can be simplified as follows:
w 1 T x w 2 T x = i = 1 d + 1 w 1 i x i j = 1 d + 1 w 2 j x j = i = 1 d + 1 j = 1 d + ! w 1 i w 2 j x i x j = α 1 , 1 x 1 x 1 + + α 4 , 5 x 4 x 5 + + α d + 1 , d + 1 x d + 1 x d + 1
where i and j are channels and α are the coefficients of each term as shown in Equation (6):
α i , j = w 1 i w 2 j i f ( i = j ) w 1 i w 2 j + w 1 j w 2 i i f ( i j )
By expanding the Star operation in Equation (5), A combination of terms totaling d + 2 d + 1 / 2 can be obtained. Each term is nonlinearly related to x , indicating that they represent independent hidden dimensions. From the perspective of computational efficiency, the mapping process of Star operation in d dimensional space can be equivalently transformed into the mathematical expression of d + 2 d + 1 / 2 dimensional implicit feature space.

2.4.3. WIoU-Based Loss Function Improvement

Bounding box regression in mainstream object detection models is often handled by loss functions like the complete-IoU (CIoU) loss [47]. CIoU improves upon the basic IoU loss by incorporating three key geometric factors: overlap area, center point distance, and aspect ratio. However, a fundamental limitation of CIoU and similar variants is that they are static metrics. They treat all training samples equally, regardless of quality, which restricts their optimization capability when dealing with the low-quality images (e.g., blurred or occluded) prevalent in this study. To overcome this, our research employs a dynamic alternative: the wise-IoU (WIoU) loss [48].
The core principle of the WIoU algorithm is its dynamic, non-monotonic focusing mechanism, which allocates gradient weights based on the quality of the anchor box. Specifically, WIoU assesses sample quality using an “outlier degree.” It assigns a smaller gradient to high-quality samples (those with a high degree of overlap with the ground-truth box) to prevent the model from overfitting on easy examples. Simultaneously, it suppresses large, potentially harmful gradients from low-quality samples, allowing the model to focus more effectively on learning from ordinary-quality examples. This study specifically adopts the final version, WIoUv3, which further incorporates a gradient gain equalization strategy to stabilize the training process. The model’s algorithm is detailed in Equation (7).
L W I o U v 3 = β L W I o U v 2 + ( 1 β ) Ε ( L W I o U v 2 )
where β 0 ,   1 is the gain factor (0.25 by default) and Ε ( L W I o U v 2 ) is the mean loss of the current batch.

2.5. Test Set up

All experiments were conducted within a unified computational environment. The software stack was built on the Windows 11 operating system, utilizing Python 3.8.20 and the PyTorch 2.4.1 DL framework. An NVIDIA RTX 4080 GPU was used to accelerate model training and inference. All models were trained for 300 epochs with a batch size of 32. The complete hardware specifications and key training hyperparameters are detailed in Table 3 and Table 4, respectively.

2.6. Model Evaluation Method

This study utilizes a range of criteria to evaluate the model’s performance in terms of detection accuracy and computing efficiency. In object detection, relying solely on traditional metrics like Precision and Recall is often insufficient due to the inherent trade-off between them. Therefore, to holistically evaluate accuracy, this study uses mAP as the primary performance indicator. This metric, derived from the confusion matrix (i.e., True Positives, False Positives, and False Negatives), provides a single, comprehensive score that balances both precision and recall across all defect classes. To assess the model’s efficiency and suitability for real-world deployment, this study also measures its computational load in gigaFLOPs (GFLOPs) and its inference speed in frames per second (FPS).
(1) Precision
Precision, also known as the positive predictive value, measures the accuracy of the model’s positive predictions. It quantifies the proportion of correct positive identifications among all instances predicted as positive. In the context of this study, Precision answers the question: “Of all the instances that the model identified as a defect, what fraction were actually defects?” It is calculated using the following formula:
P = T P T P + F P × 100 %
where TP represents the number of true positives that correctly predicted the disease; FP is the number of false positives incorrectly predicted as a disease.
(2) Recall
Recall, also known as sensitivity or the true positive rate, measures the model’s ability to identify all relevant instances within a class. It quantifies the proportion of actual positive instances that were correctly identified by the model. In the context of this study, Recall answers the question: “Of all the defects that were actually present, what fraction did the model successfully detect?” It is calculated using the following formula:
R = T P T P + F N × 100 %
where FN represents the number of false negatives incorrectly predicted as disease-free.
(3) Average precision (AP) and mAP
Average Precision (AP) is computed to derive a singular measure that reconciles the trade-off between Precision and Recall. AP summarizes the shape of the precision-recall (P-R) curve, which plots precision against recall at various confidence thresholds, and is defined as the area under this curve. The detection performance for a singular defect category is quantified as follows:
A P = 0 1 P ( R ) d R × 100 %
m A P = 1 N i = 1 N A P i × 100 %
where N represents the number of all categories and A P i represents the object detection accuracy of category i .
(4) Computational complexity (FLOPs)
FLOPs measure the total number of FLOPs required for a model to perform a single forward pass on an input image. It is a hardware-independent metric used to quantify a model’s computational cost and is often reported in GFLOPs (billions of operations). A lower GFLOPs value indicates a more computationally efficient and lightweight model, which is a desirable characteristic for deployment on resource-constrained devices.
(5) FPS
For real-world applications such as the automated inspection of water supply pipelines, a model’s processing speed is of paramount importance. This is measured by FPS, which quantifies the number of images the model can process per second on specific hardware. A higher FPS value signifies a faster model, which is essential for achieving real-time detection from video streams.

3. Results

3.1. Enhance the Evaluation of Data Augmentation Experiment Results

This work employed a systematic data augmentation technique to mitigate the challenges of a restricted sample size and substantial class imbalance, especially regarding the underrepresentation of the “foreign matter” defect category. The primary objective was to enhance the model’s generalization and robustness by increasing the diversity and variability of the training data. This strategy comprised three techniques designed to simulate real-world inspection conditions: (1) Photometric transformations, including adjustments to brightness and contrast, to replicate varying in-pipe illumination (Figure 8); (2) Random affine transformations, such as rotation, to simulate changes in the inspection robot’s pose (Figure 9); and (3) Noise injection, using both Gaussian and salt-and-pepper noise to model potential signal interference during image acquisition (Figure 10).
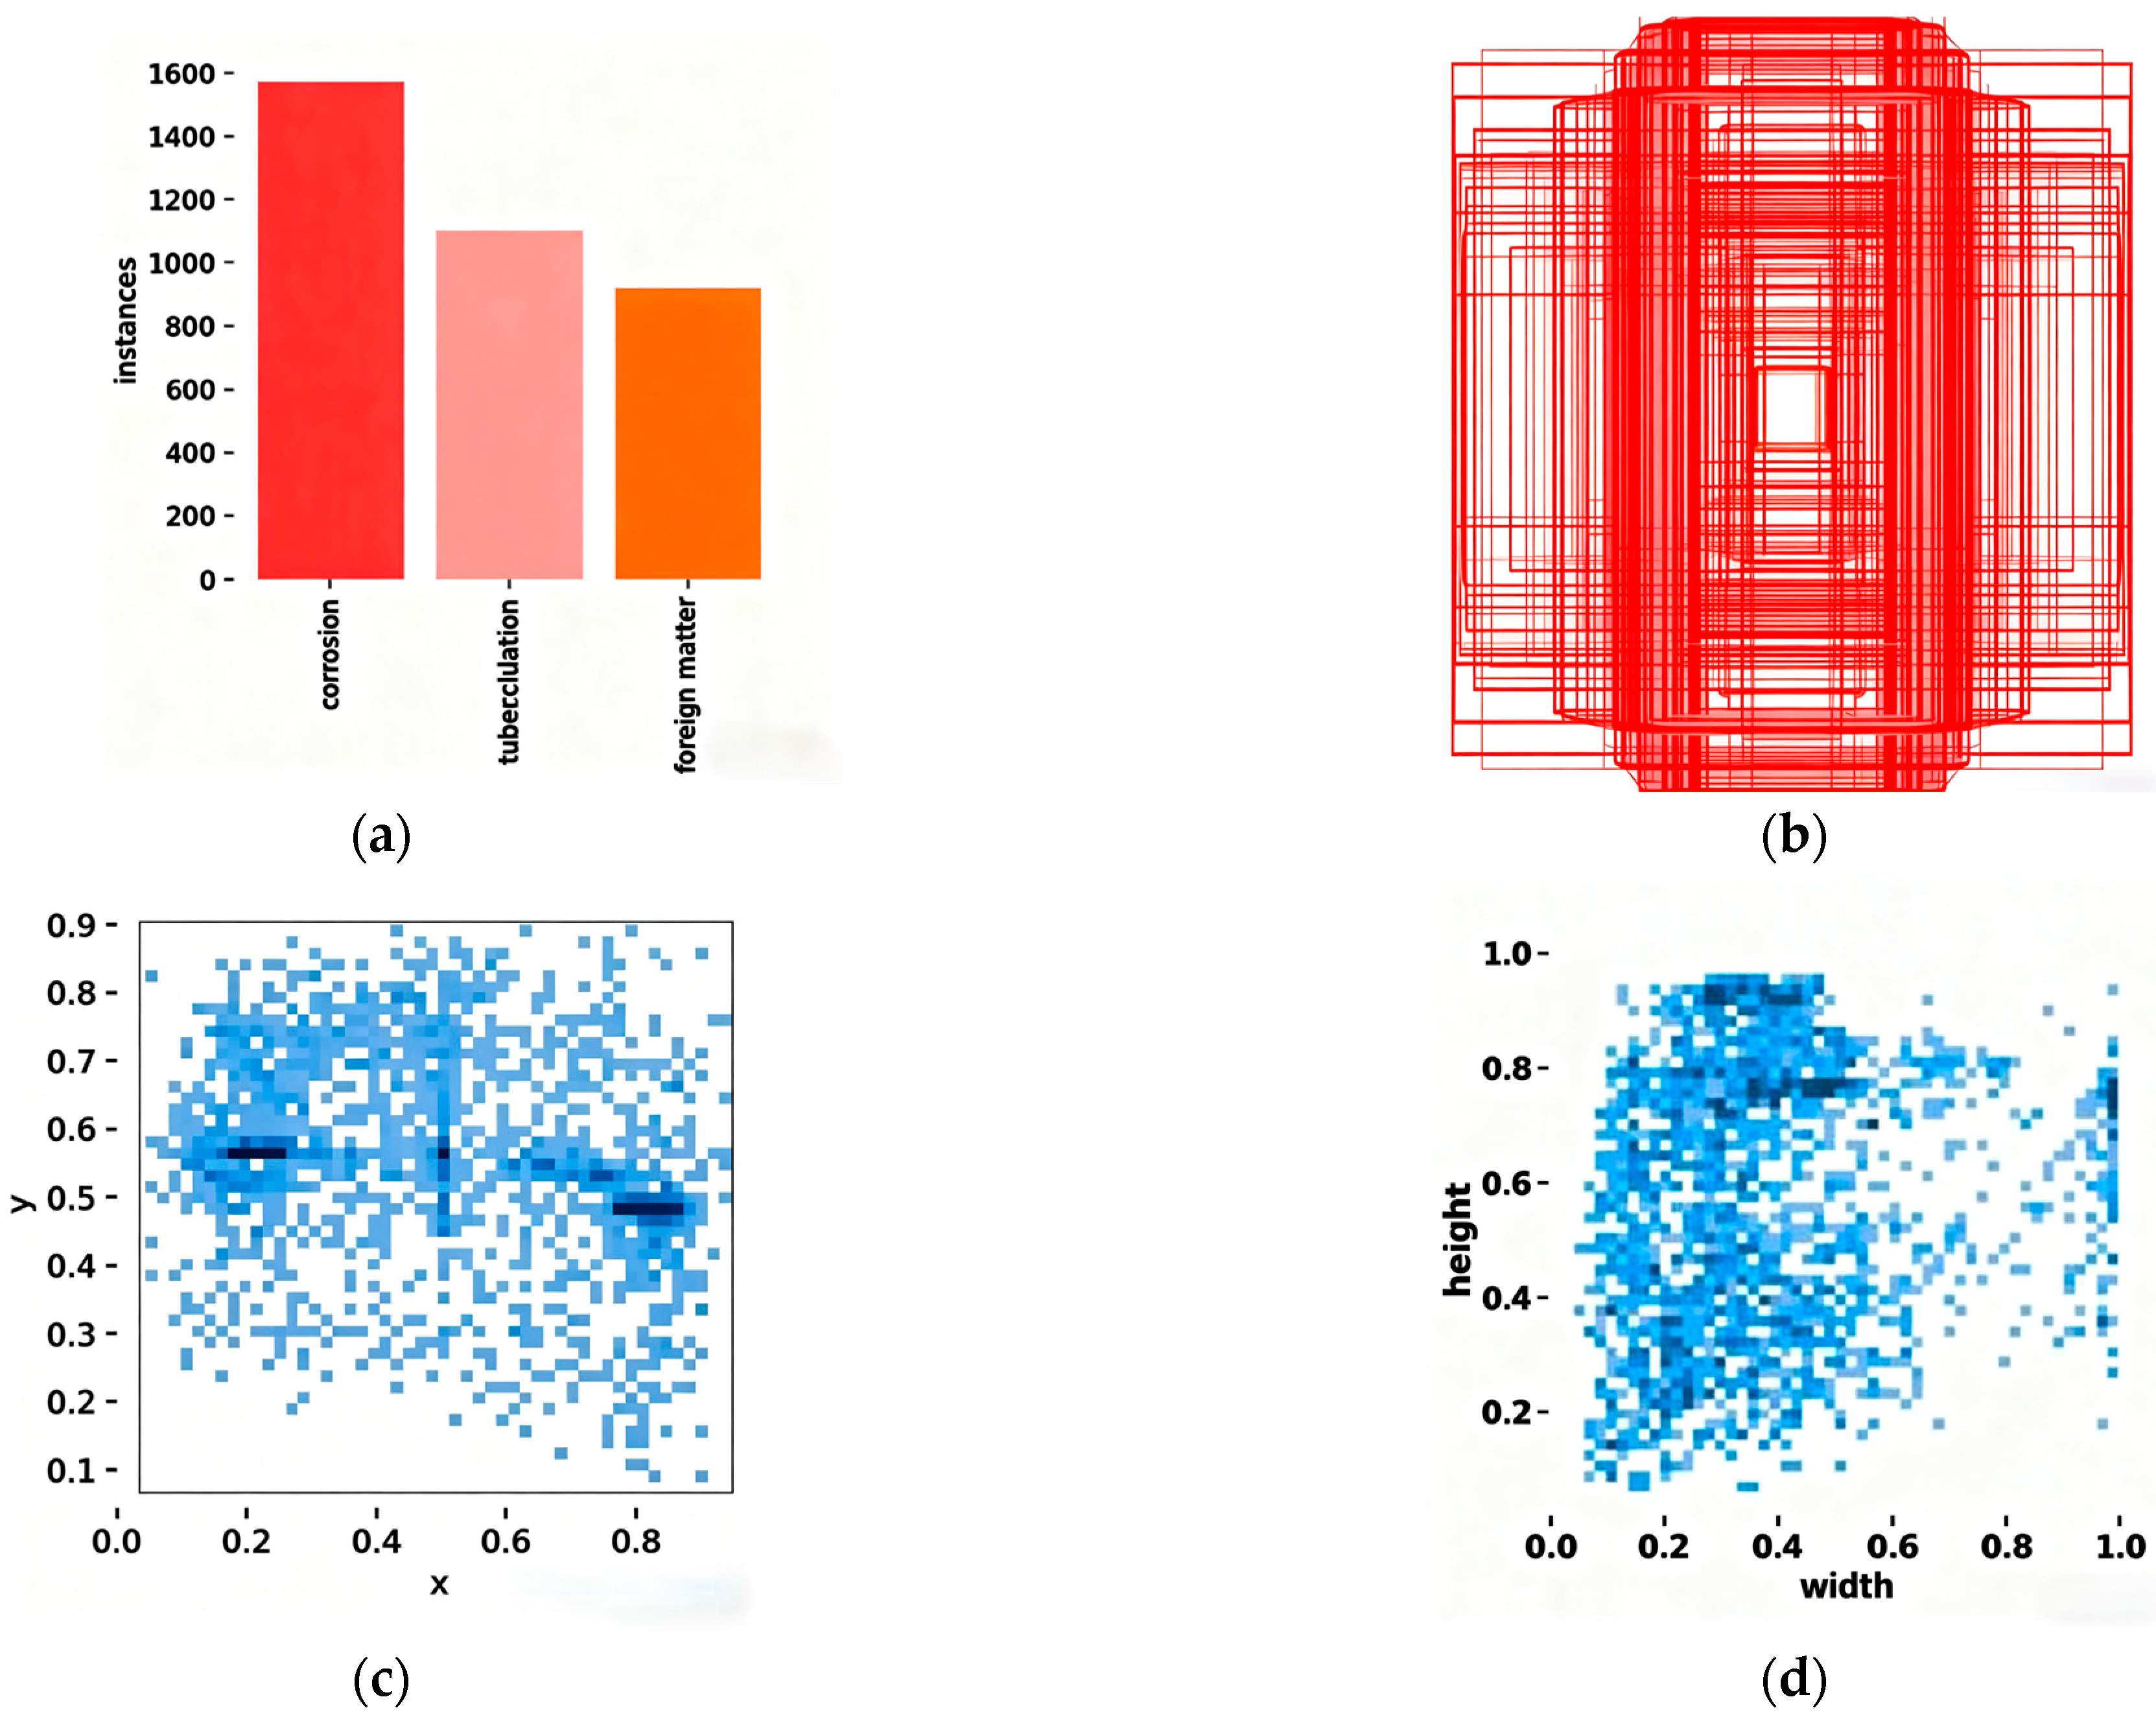
Application of this strategy moderately expanded the dataset from 1936 to 2122 images, the final statistics of which are detailed in Figure 11. Table 5 demonstrates that training the model on this augmented dataset resulted in a significant performance increase. While all defect categories saw an improvement in detection accuracy, the most substantial gain was observed for the minority “foreign matter” class, for which mAP@50 increased by 11.5%. This result demonstrates that the targeted augmentation strategy was highly effective in mitigating the negative effects of class imbalance. The moderate level of expansion was deliberately chosen to enhance sample diversity while preserving the fundamental statistical characteristics of the original real-world dataset.

3.2. Enhanced Test Results of Lightweight Based on VanillaNet

The standard YOLOv8 backbone, while powerful, is computationally intensive, which poses significant challenges for real-time, lightweight deployment. To validate our proposed lightweight architecture, this study conducted an ablation study focused on the backbone network. This experiment aimed to evaluate the impact on overall model performance after replacing the original complex backbone of YOLOv8 with the minimalist VanillaNet structure. The resulting model, hereafter referred to as YOLOv8-V, was then comprehensively compared against the baseline YOLOv8 model.
The results of this comparison, detailed in Table 6, demonstrate the effectiveness of the lightweighting strategy across multiple dimensions. YOLOv8-V demonstrated a reduction exceeding 40% in model complexity, with parameter count decreasing from 11.13 million to 6.54 million and GFLOPs declining from 23.4 to 13.5. This significant decrease in complexity translated directly to improved efficiency, with FPS increasing by 16.2% from 526.2 Hz to 611.4 Hz. Counter-intuitively, despite this substantial simplification, the model’s core detection accuracy also improved, with mAP@50 increasing from 79.5% to 81.3%. These findings confirm that the proposed VanillaNet-based approach is highly effective, successfully reducing the model’s deployment cost while maintaining.

3.3. Neck Improvement Test Results Based on C2f-Star

While the lightweighting of the YOLOv8-V backbone enhances computational efficiency, it can potentially compromise the model’s feature representation capabilities. To mitigate this and further boost performance, this study conducted an ablation study focused on the neck architecture. This experiment was designed to specifically evaluate the impact of replacing the standard C2f module in the YOLOv8-V baseline with our proposed C2f-Star module. The resulting model, named YOLOv8-VS, was then comprehensively benchmarked against YOLOv8-V to isolate the contribution of the enhanced neck.
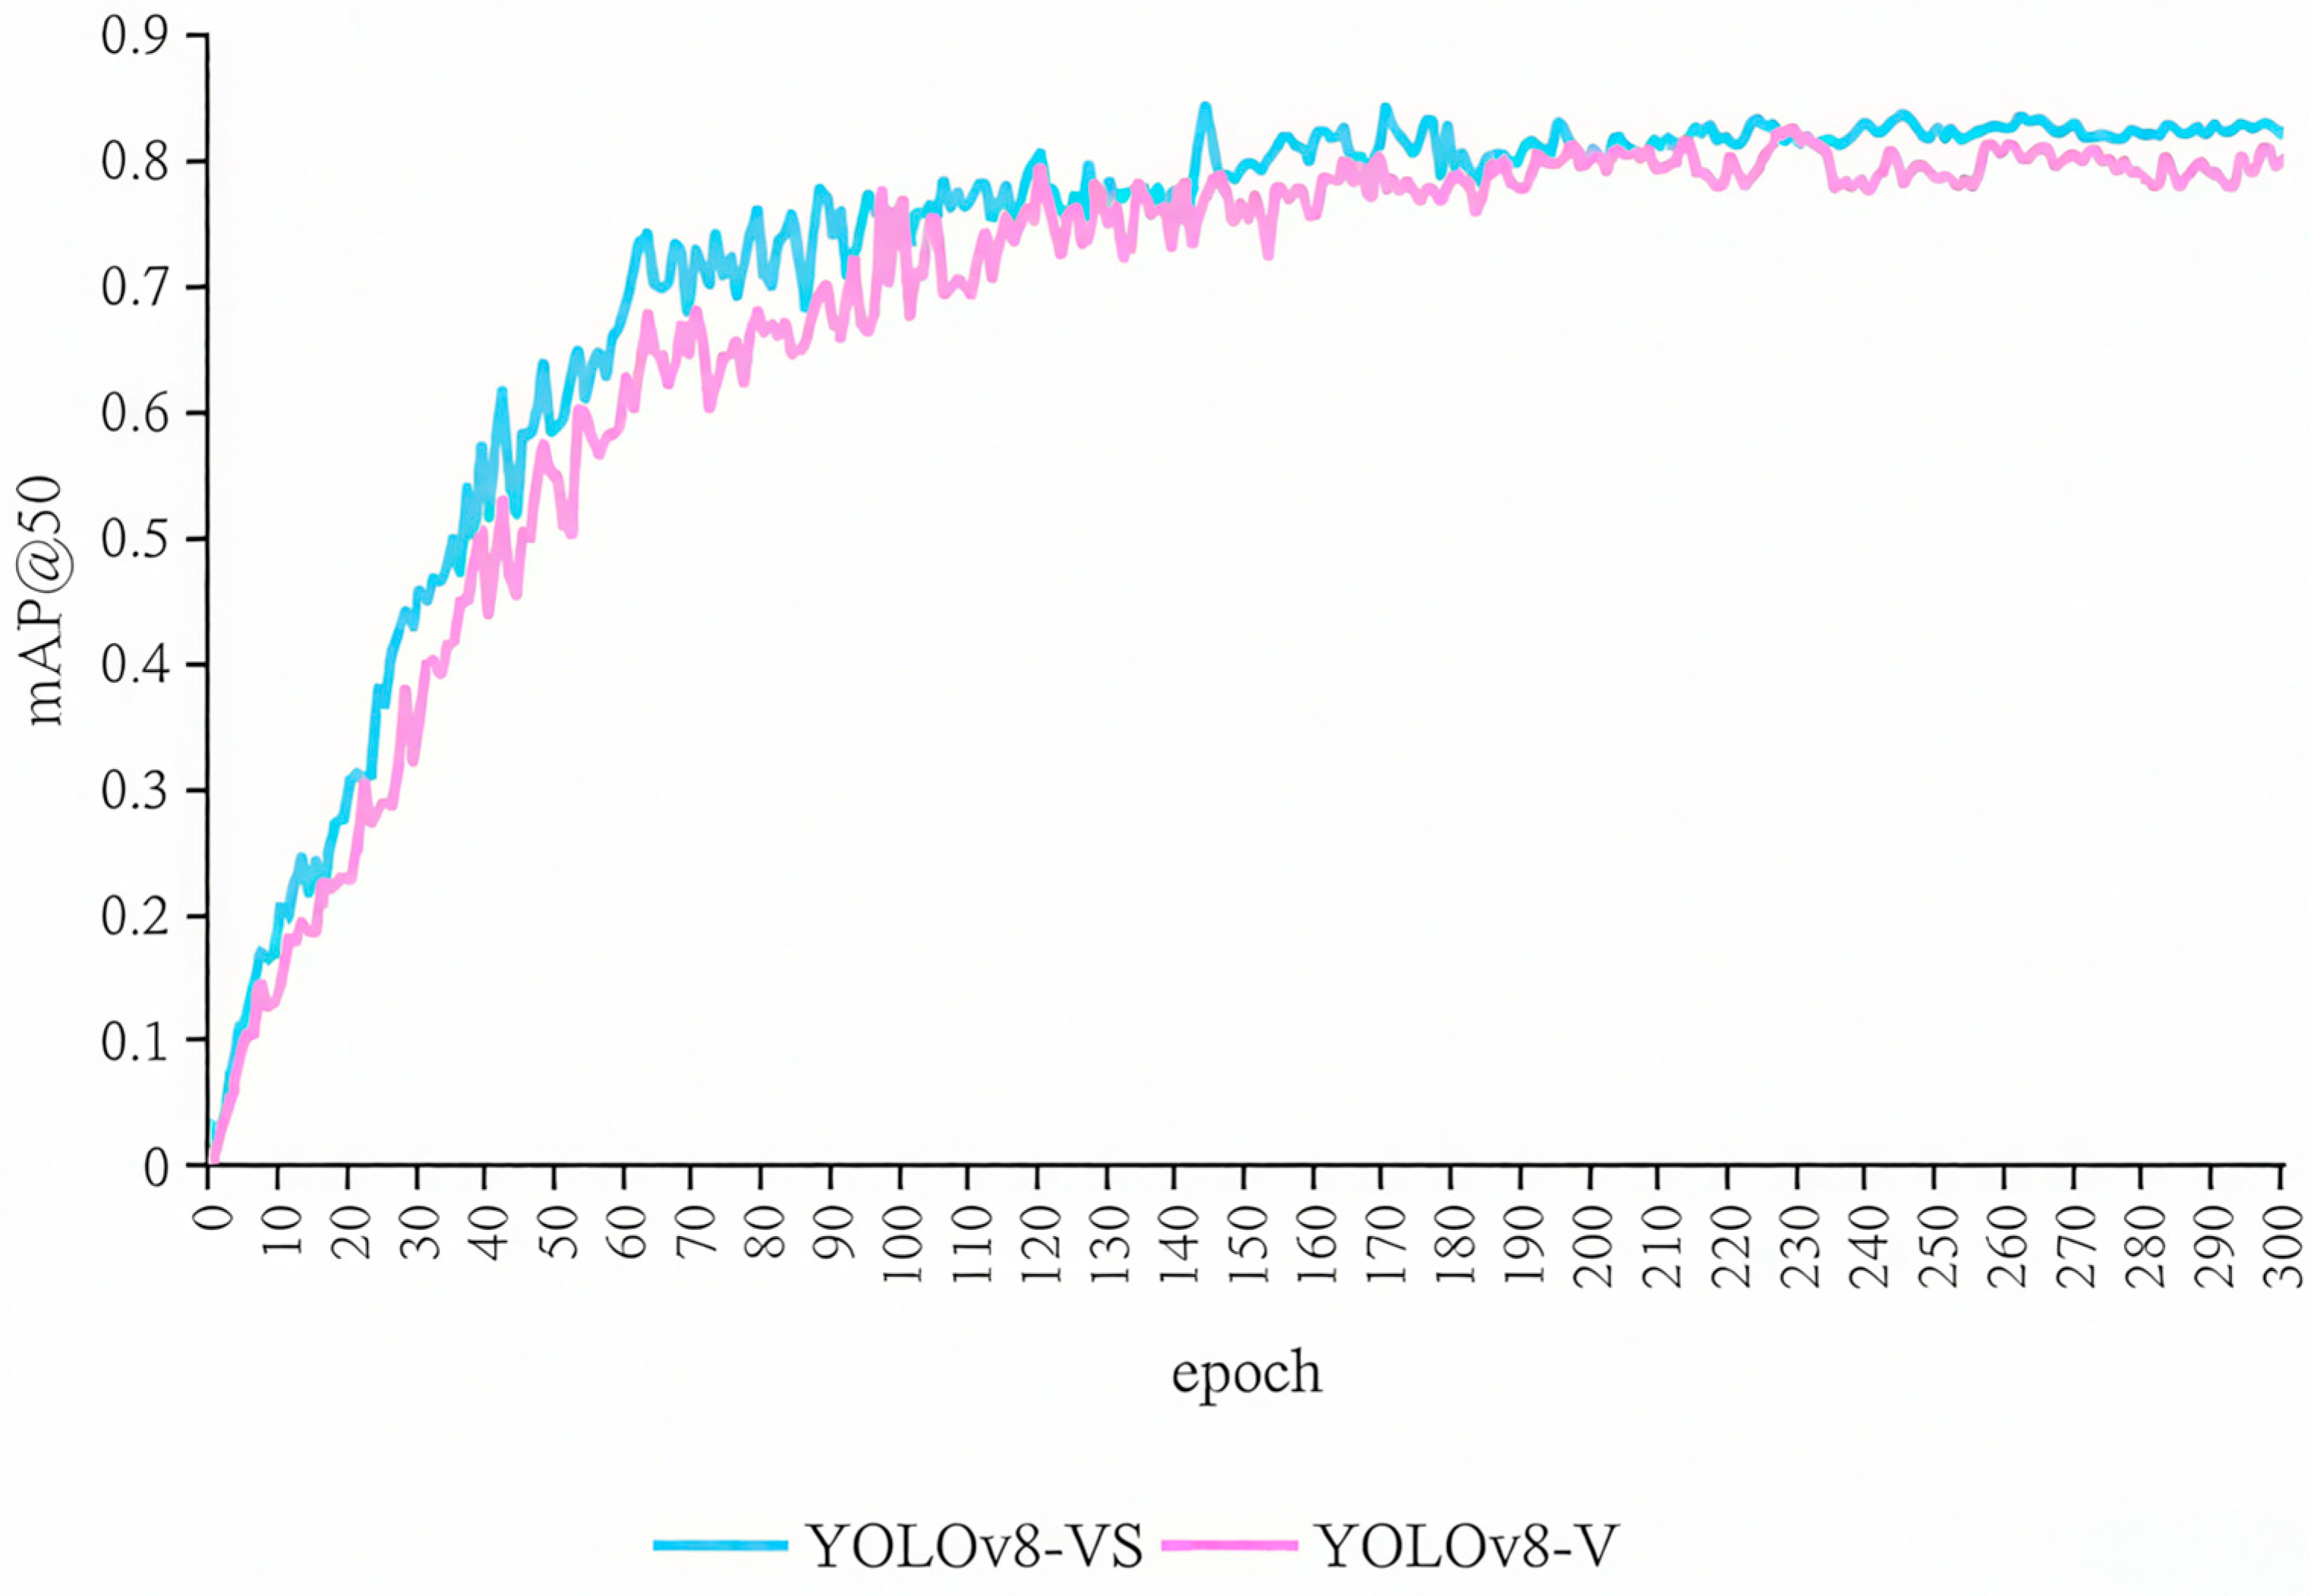
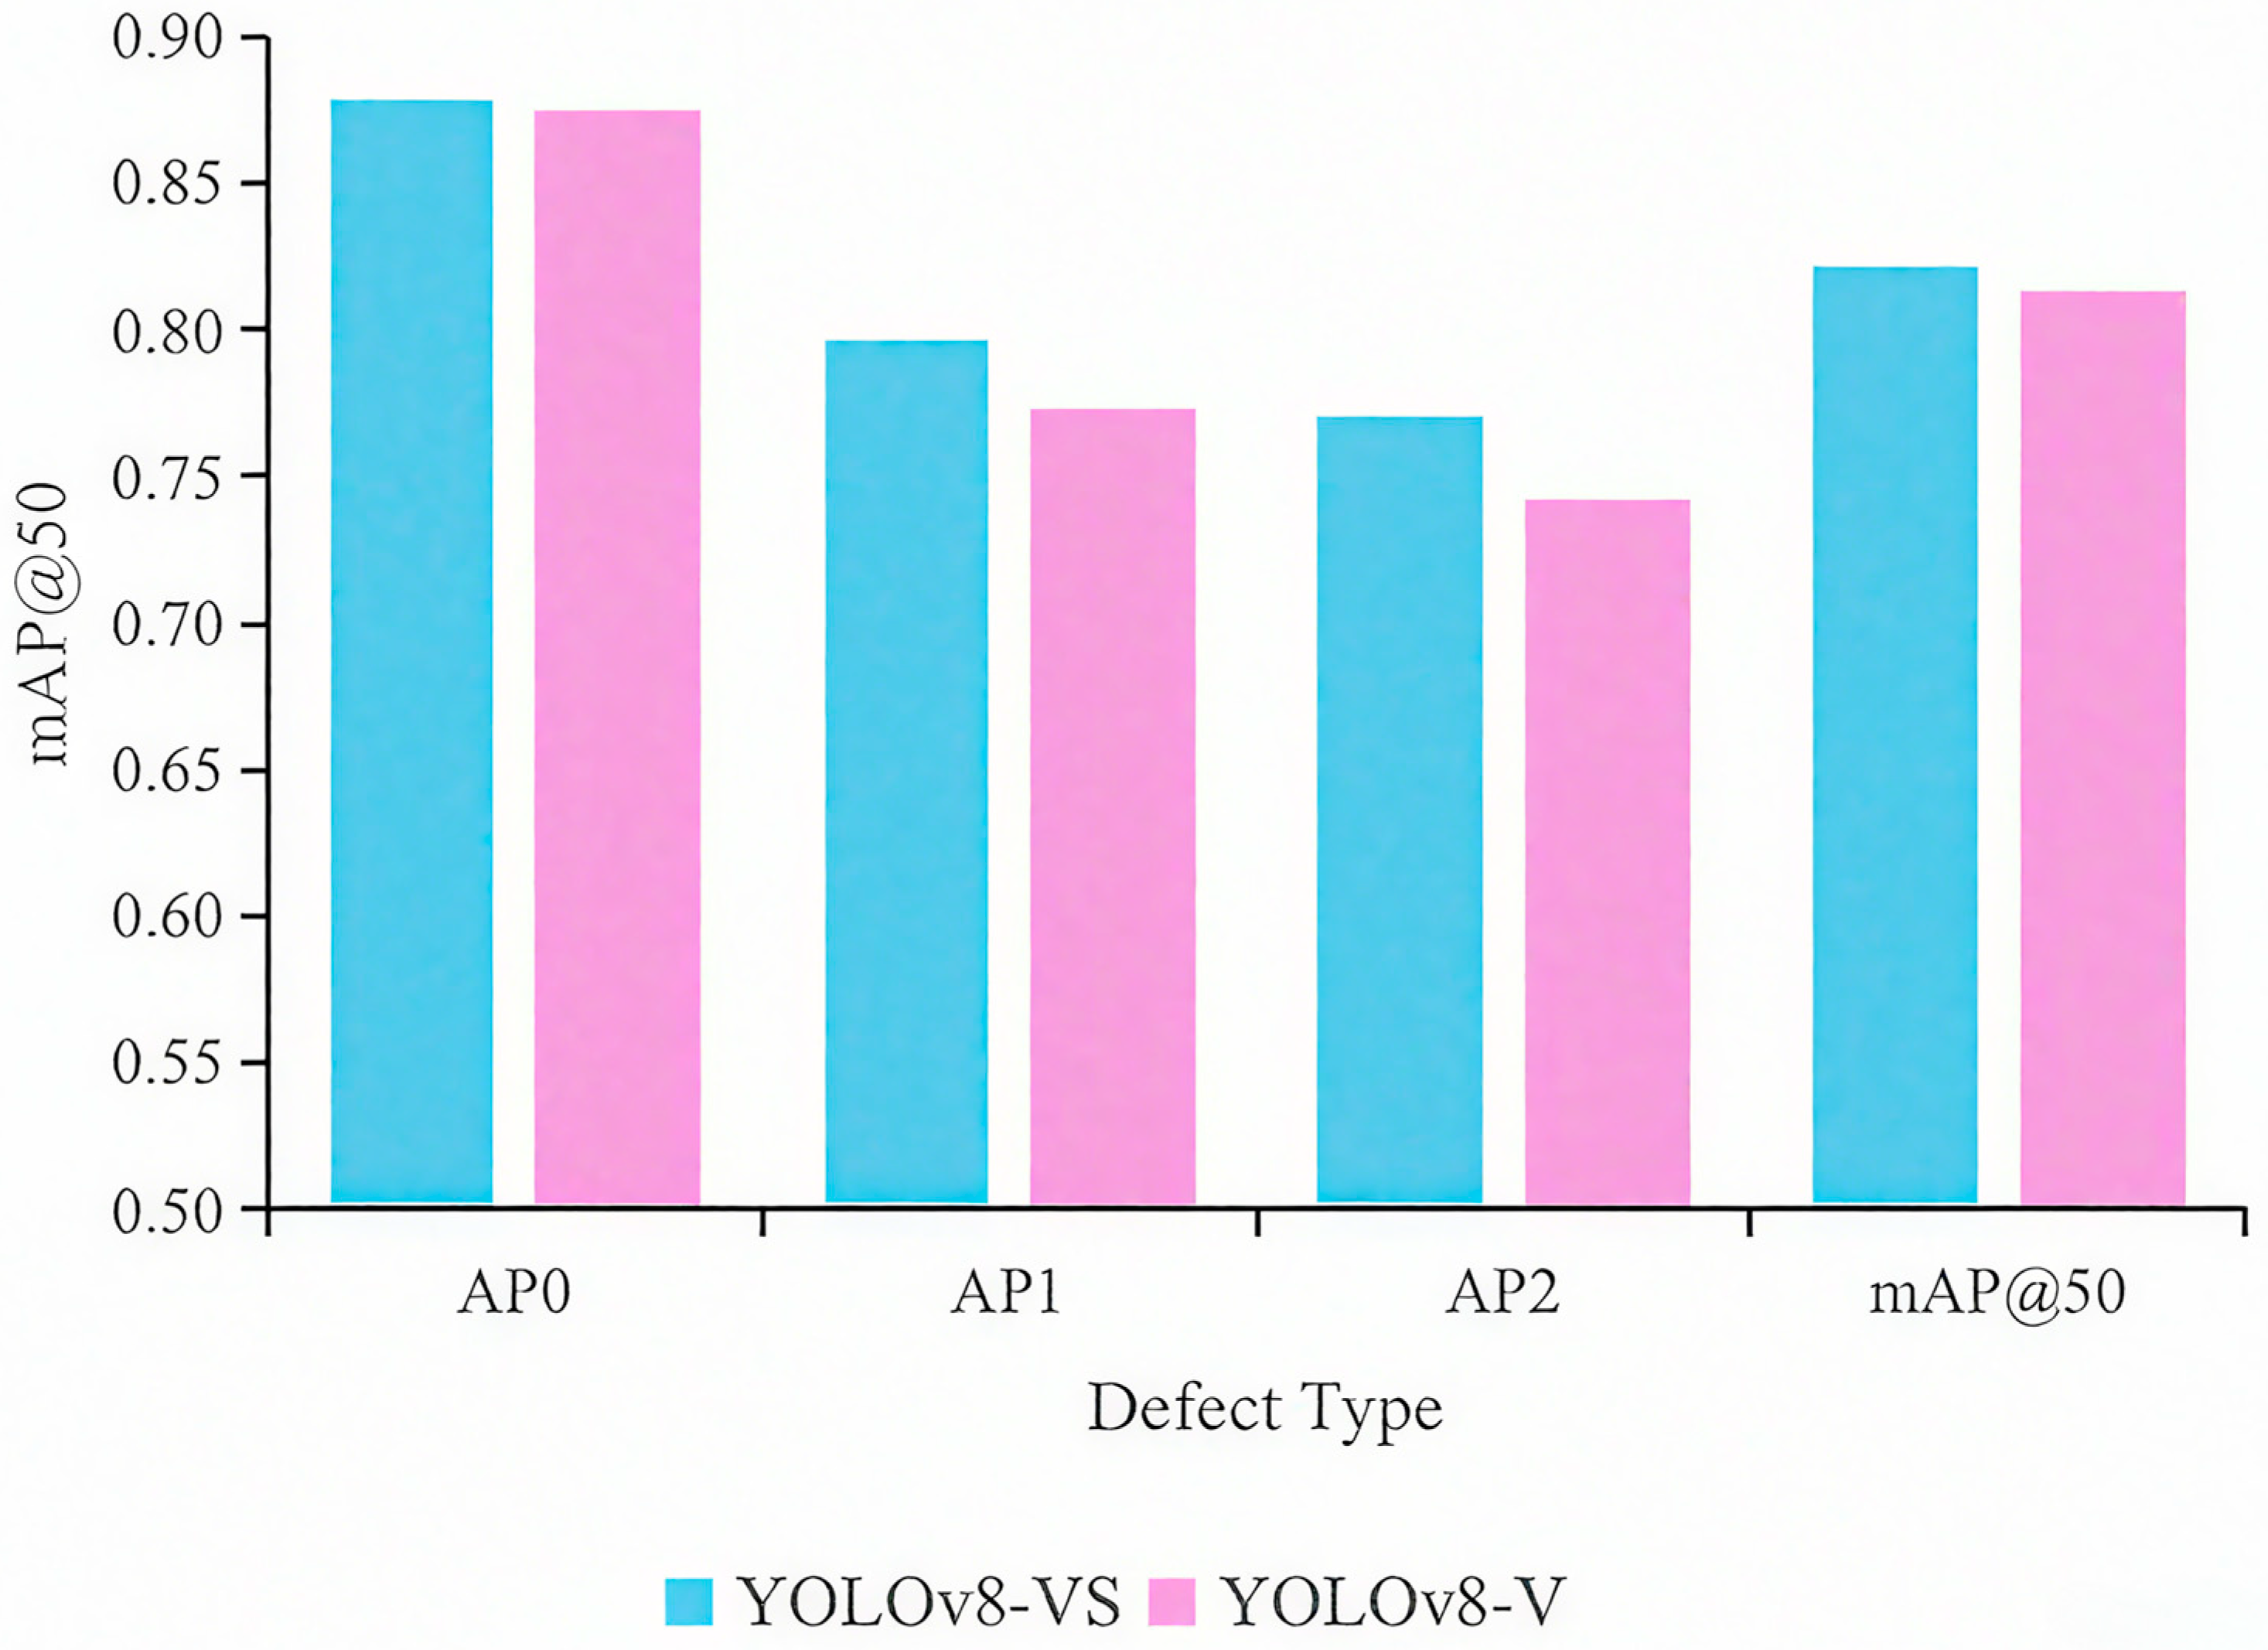
The training dynamics of the two models were compared by analyzing their mAP@50 curves on the validation set, as illustrated in Figure 12. The plot reveals that the YOLOv8-VS model (blue trace) consistently outperforms the YOLOv8-V baseline (red trace) throughout the training process. While both models exhibit a similar rapid performance increase during the initial training phase, the YOLOv8-VS model establishes and maintains a clear performance advantage in the later epochs. A key observation is the significant difference in convergence speed: the YOLOv8-VS model converges after approximately 70 epochs, whereas the baseline requires around 110 epochs to stabilize. This demonstrates the superior training efficiency conferred by the C2f-Star module. This improvement in training dynamics also translated to higher final detection accuracy, as detailed in the per-class analysis presented in Figure 13.
A quantitative evaluation on the test dataset confirmed that the improved training efficiency of the YOLOv8-VS model translated into higher final detection accuracy. Overall, the introduction of the C2f-Star module increased the model’s mAP@50 from 81.3% to 82.2%. A per-class analysis, detailed in Figure 13, reveals that the performance gains were most pronounced for geometrically complex defects. The AP for tuberculation and foreign matter increased significantly by 3.10% and 3.91%, respectively (from 77.3% to 79.7% and from 74.2% to 77.1%). A modest improvement of 0.46% was also observed for corrosion (from 87.5% to 87.9%). These results demonstrate that the proposed C2f-Star module is more effective than the standard C2f block for feature fusion. Its ability to better represent diverse features is particularly impactful for defects with irregular morphologies, confirming its contribution to enhancing the model’s overall detection capabilities.

3.4. Experimental Results of Loss Function Improvement Based on WIoU

While the preceding architectural enhancements improved the model’s accuracy and efficiency, training stability and localization precision, particularly on low-quality images, remained areas for further optimization. This is a common limitation of static loss functions like CIoU. Therefore, to address this, this study conducted an experiment to evaluate the impact of incorporating a dynamic loss function. This study investigates the effect of replacing the baseline CIoU loss function in the YOLOv8-VS model with the advanced WIoUv3 loss function. The resulting model, our final proposed architecture named YOLOv8-VSW, was then benchmarked against the YOLOv8-VS to isolate the contributions of the dynamic loss mechanism to training stability and final detection performance.
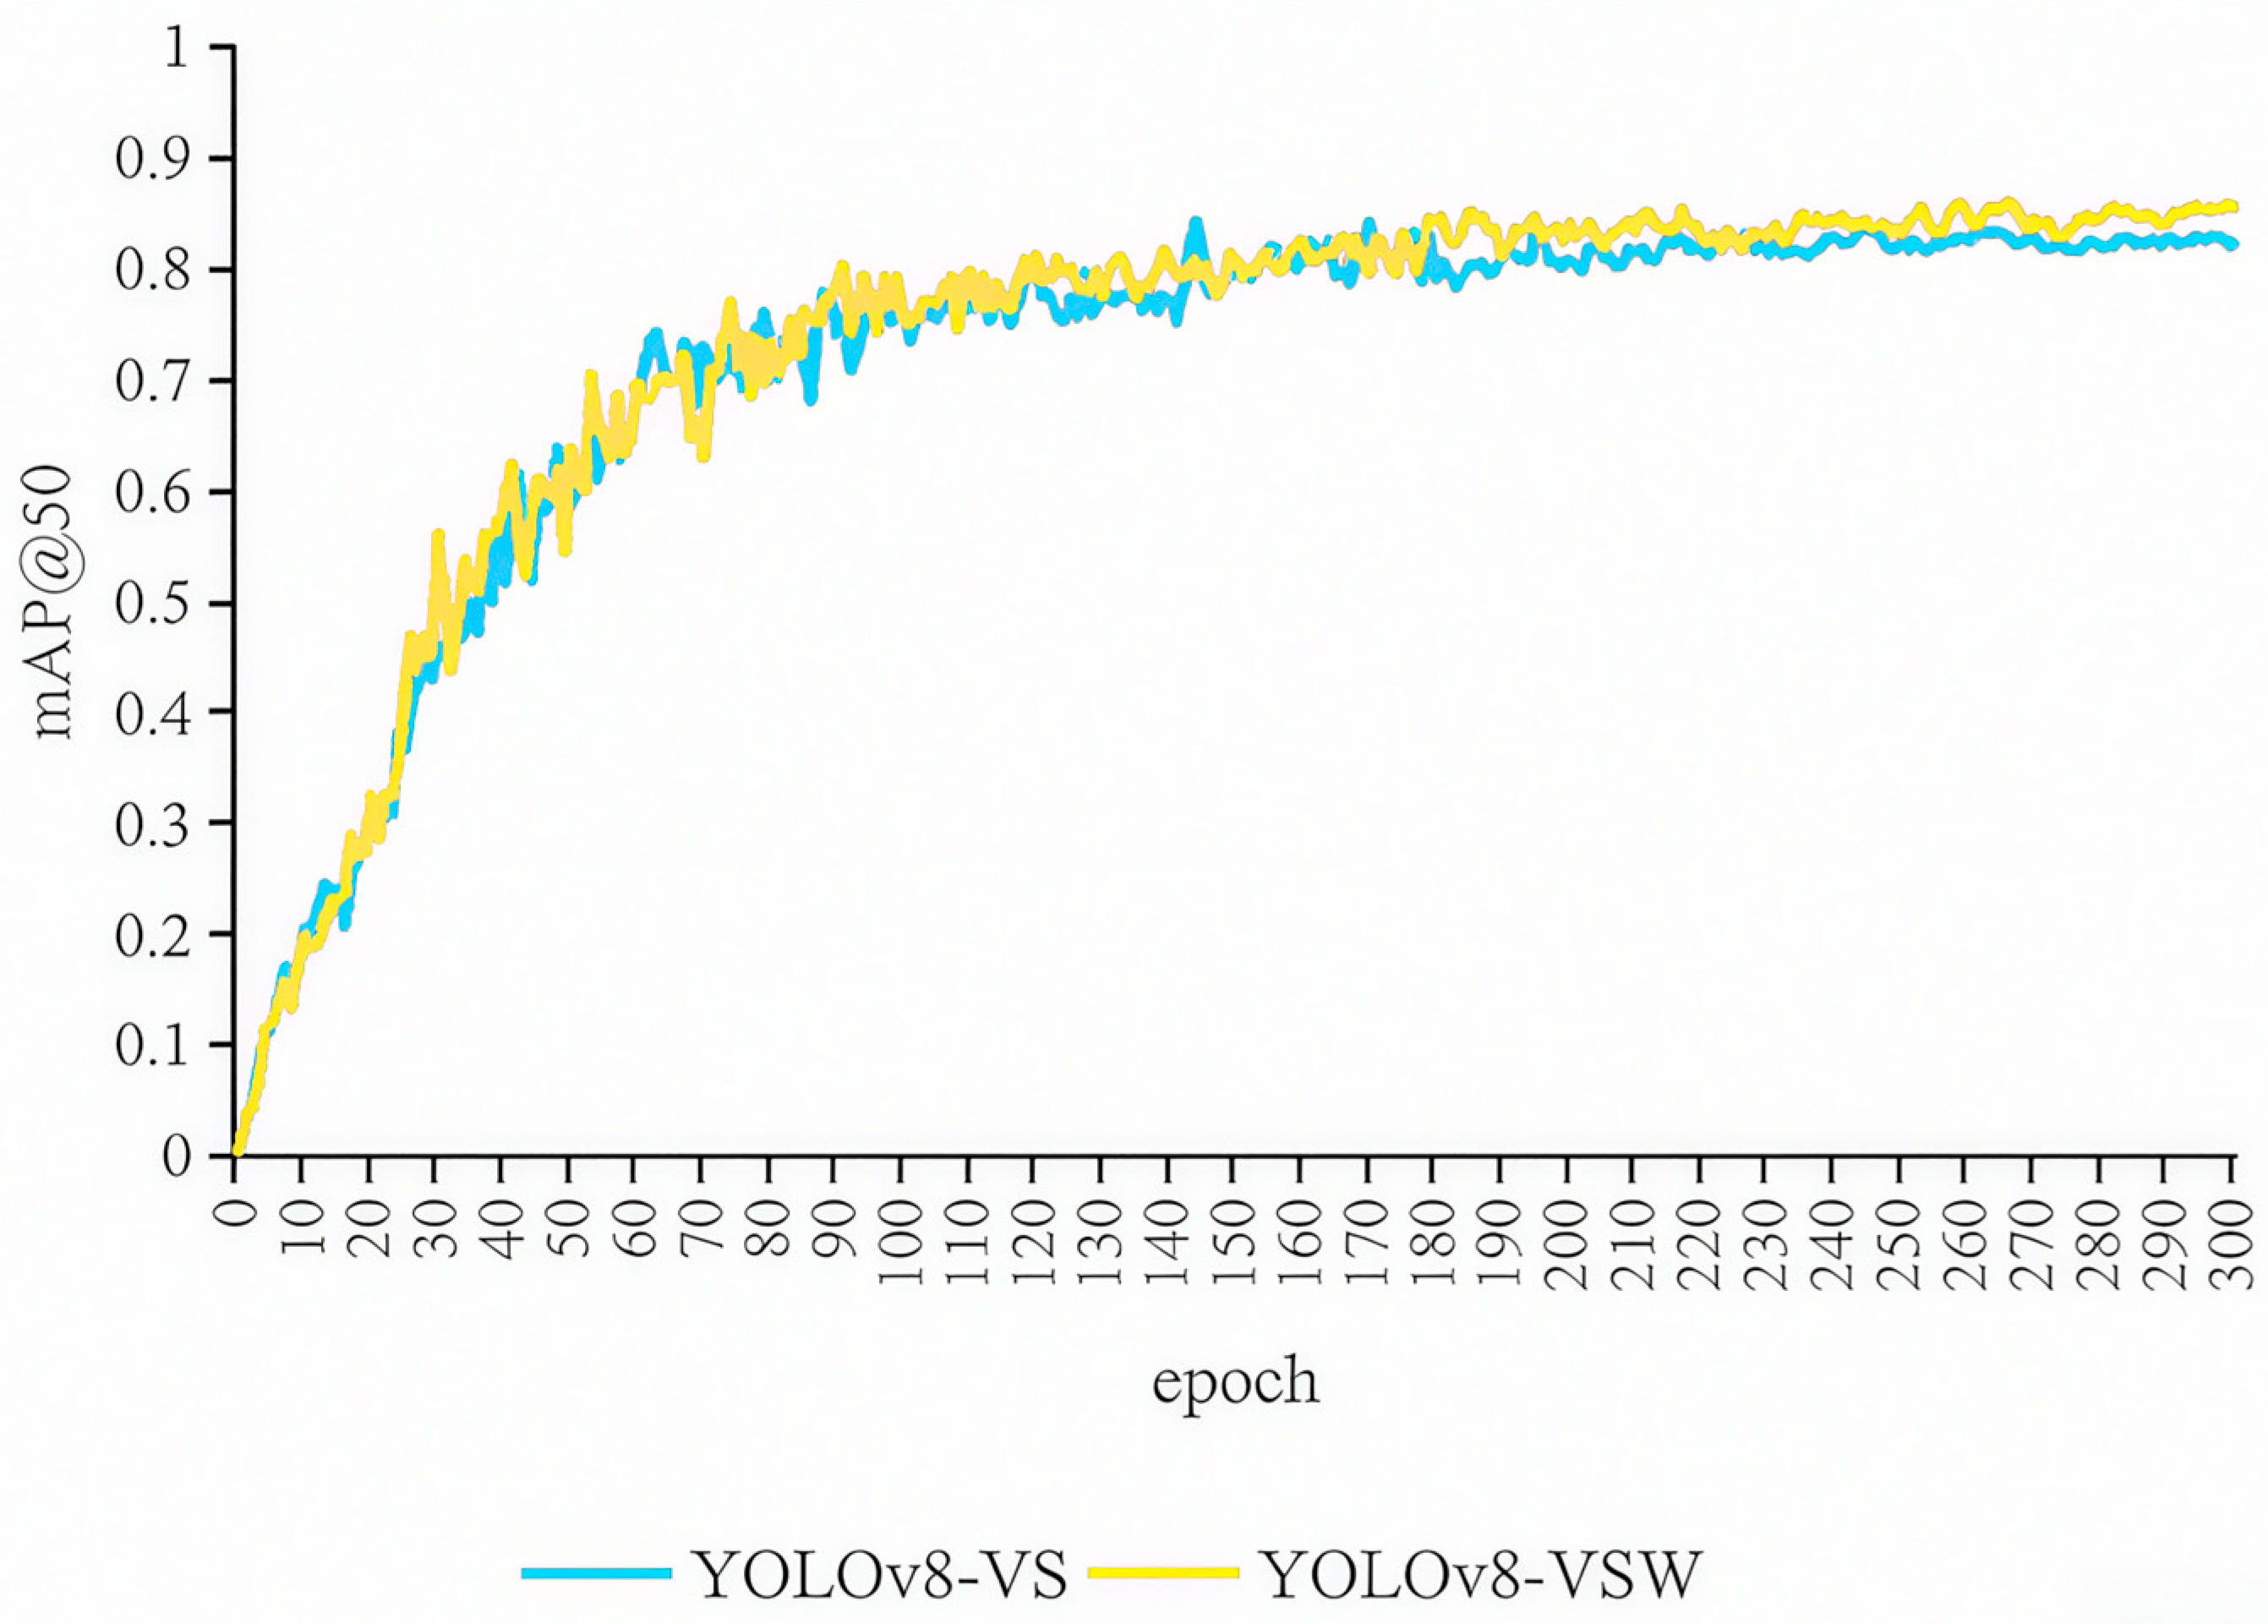
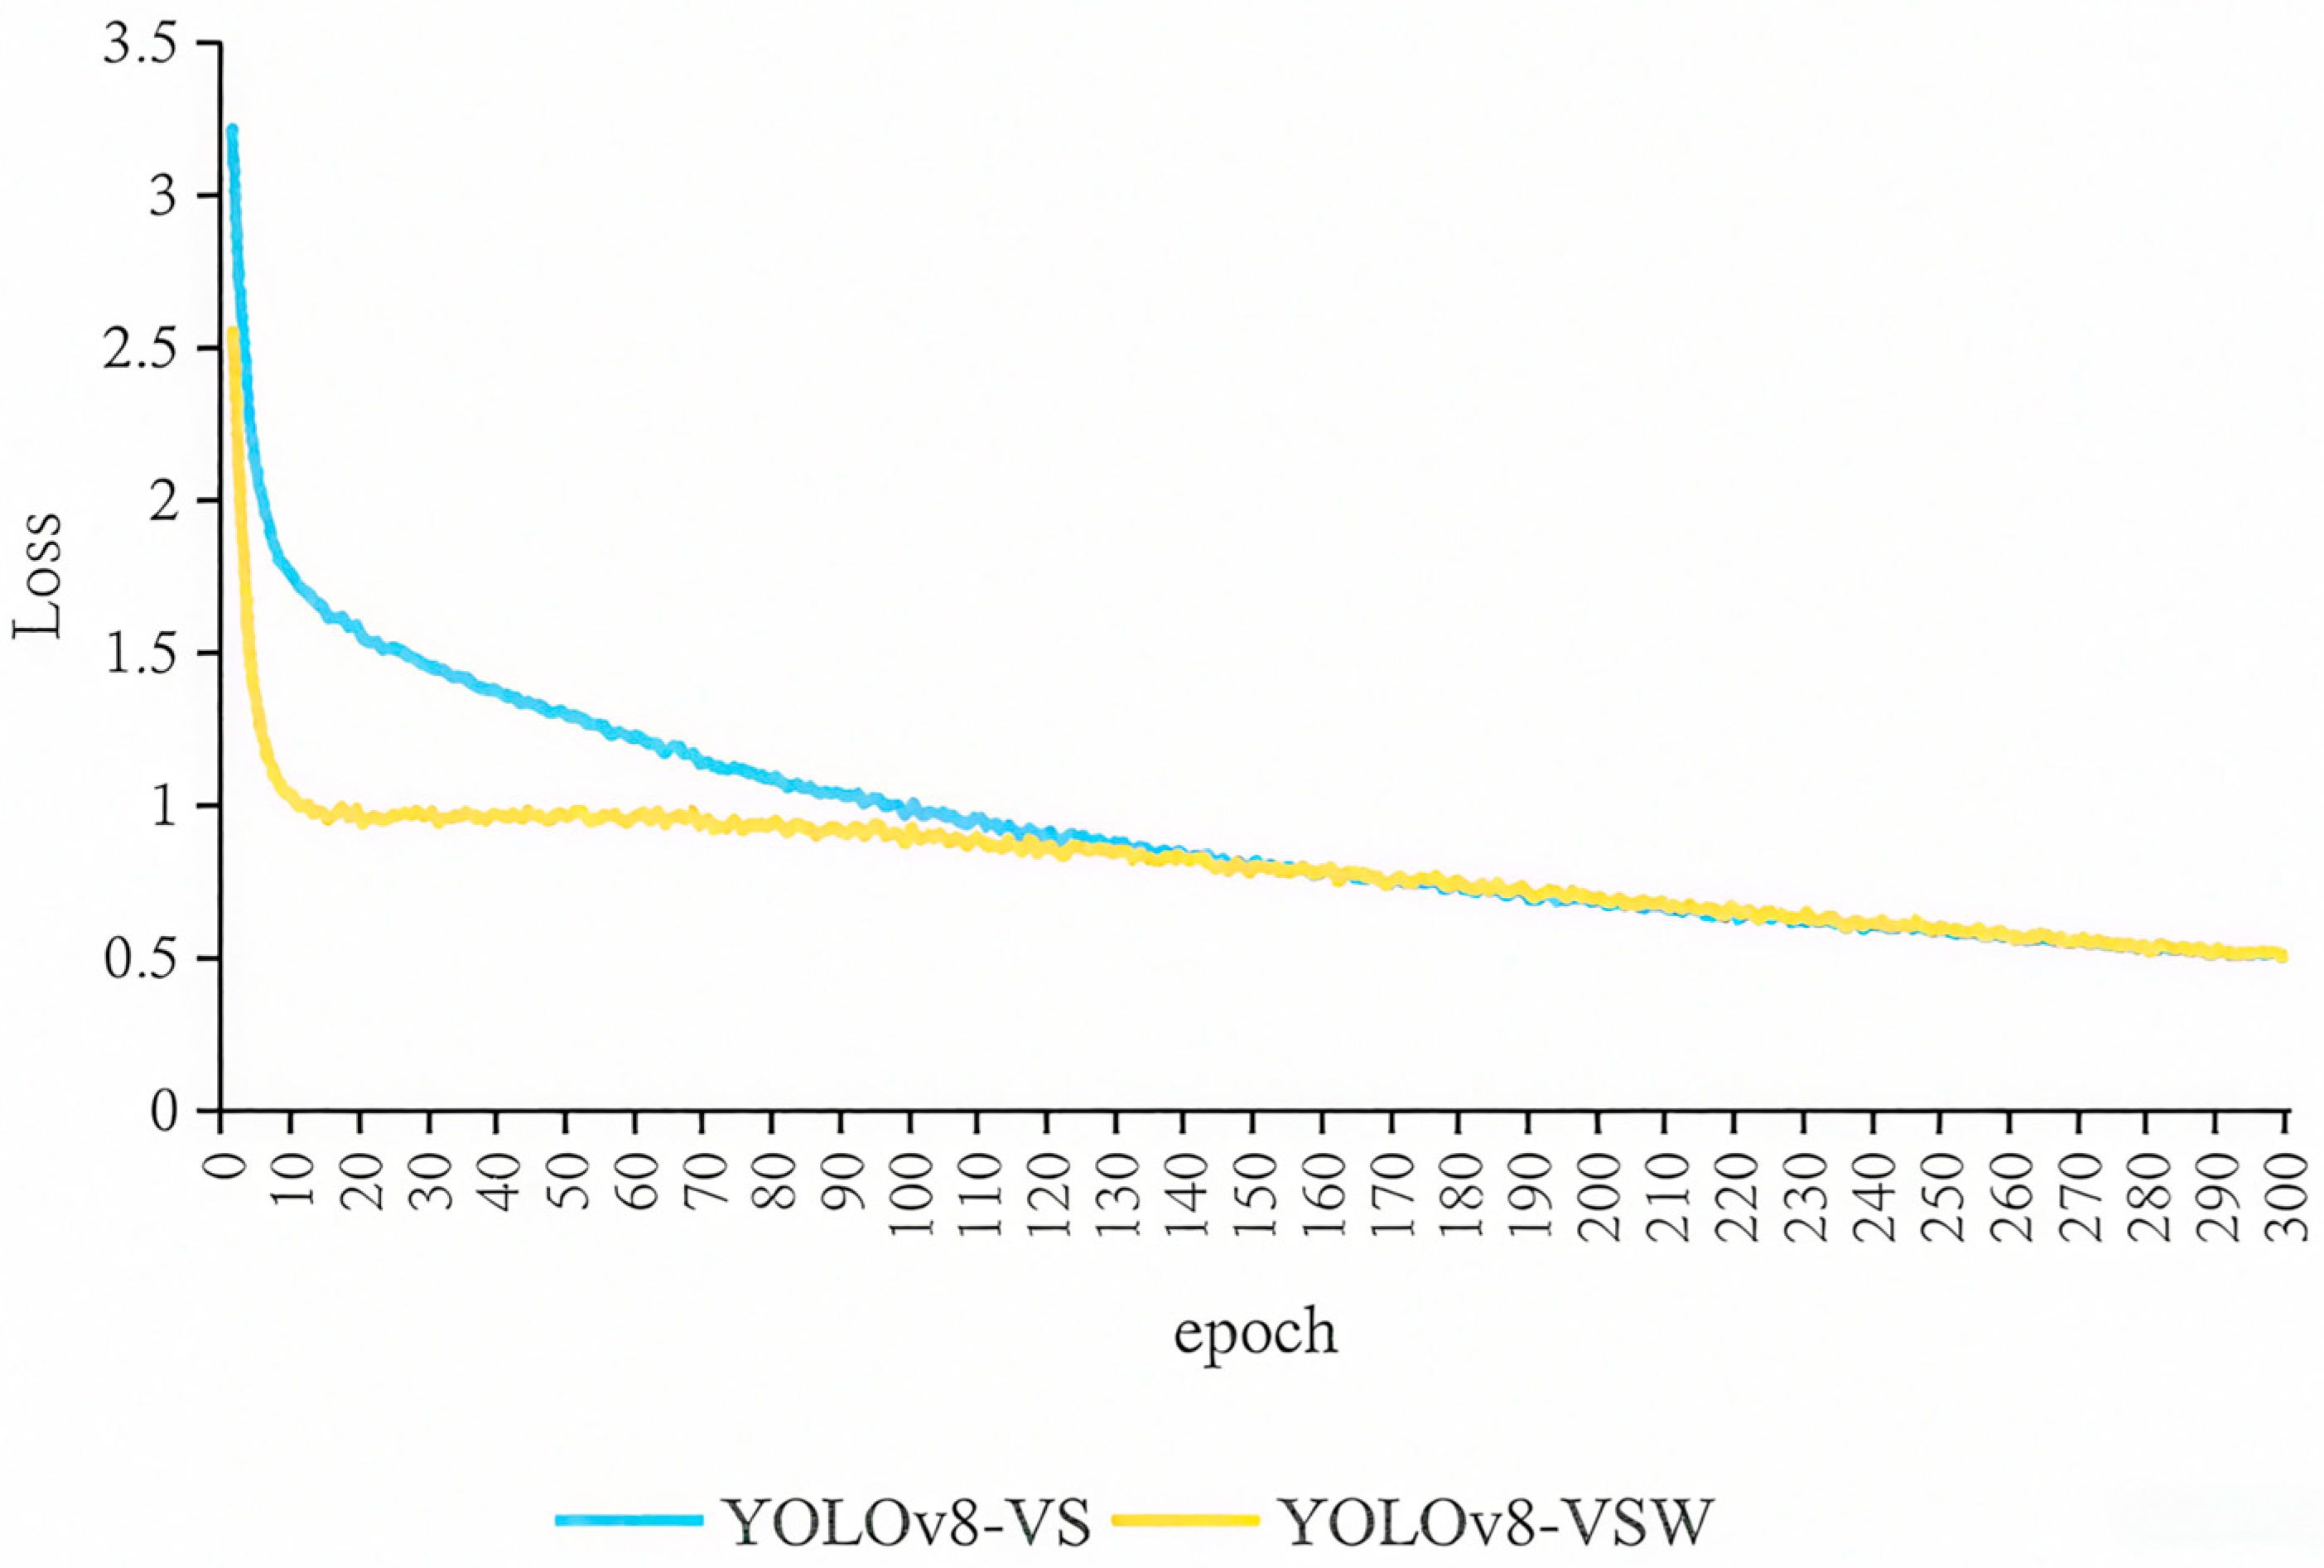
The training dynamics of the models were analyzed by examining their mAP@50 and loss curves, presented in Figure 14 and Figure 15, respectively. The mAP@50 curve (Figure 14) reveals that while both models perform similarly in the initial training phase, the YOLOv8-VSW model (blue trace), which utilizes WIoUv3, demonstrates markedly greater stability with smaller fluctuations during the mid-training phase (epochs 70–140). Furthermore, the loss curve (Figure 15) highlights a substantial improvement in convergence speed. The YOLOv8-VSW model’s loss stabilizes below 1.0 within approximately 10 epochs, whereas the YOLOv8-VS model requires nearly 100 epochs to reach a similar state. The final converged loss for the YOLOv8-VSW model is lower (0.49) compared to the baseline (0.51). Collectively, these results indicate that incorporating the WIoUv3 loss function leads to a significantly faster, smoother, and more stable training process compared to the standard CIoU loss.
A comprehensive evaluation of the final proposed model, YOLOv8-VSW, was conducted against the baseline YOLOv8, with the key performance metrics summarized in Table 7. The results demonstrate that the YOLOv8-VSW model achieves superior performance across all evaluated aspects. The mAP@50 increased by 5.0 percentage points from 79.5% to 83.5%, and the Recall improved from 75.0% to 79.2%. Concurrently, the model was made significantly more efficient: the parameter count was reduced by 38.7% and GFLOPs by 38.9%, which translated to a 14.7% increase in FPS.

4. Case Verification and Discussion

4.1. Case Verification

A qualitative and intuitive evaluation of the suggested model’s performance was performed by a comparative examination of detection outcomes on standard photos. Figure 16, Figure 17 and Figure 18 illustrate the performance of the baseline YOLOv8 model against the improved YOLOv8-VSW model across different defect types and levels of complexity. In simple, well-illuminated scenarios, such as the corrosion case shown in Figure 16, both models performed effectively. The baseline YOLOv8 and the improved YOLOv8-VSW both achieved high confidence scores of 94% and 95%, respectively, indicating that the architectural improvements did not compromise performance on straightforward cases. The advantages of the YOLOv8-VSW model become apparent in more challenging cases. For the detection of a foreign matter (Figure 17), the baseline model produced two overlapping and conflicting bounding boxes with diluted confidence scores (87% and 52%). In contrast, YOLOv8-VSW generated a single, precise bounding box with 100% confidence. This improved localization accuracy can be attributed to the WIoUv3 loss function, whose dynamic focusing mechanism is more effective at handling ambiguous targets. The model’s robustness was further tested on a complex, low-quality image featuring tuberculation (Figure 18). The baseline YOLOv8 exhibited multiple failures: it produced a false positive by misclassifying a section of the background, and it generated two conflicting predictions (tuberculation at 73% and corrosion at 54%) for the actual defect. The YOLOv8-VSW model, however, correctly identified the tuberculation with a high confidence of 94% and produced no false positives. This demonstrates the superior ability of the improved architecture to accurately identify defects while effectively suppressing interference from complex backgrounds.
The quantitative metrics and qualitative case studies collectively demonstrate that the proposed YOLOv8-VSW model is not only significantly more lightweight and computationally efficient than the YOLOv8 baseline, but also exhibits superior accuracy and robustness, making it better adapted to the challenging conditions of real-world pipeline inspection environments.

4.2. Discussion

The experimental results confirm that each of the core innovations proposed in this study—targeting the model architecture, feature fusion module, and loss function—contributed positively to the overall performance of the defect detection model. The specific contributions are detailed as follows: Regarding the model architecture, the complexity and high computational load of the standard CSPDarknet backbone hinder its deployment on edge devices. This study employed VanillaNet [44] as a lightweight backbone. By eschewing complex components like cross-stage connections and residual blocks in favor of a simple stack of convolutional and pooling layers, this modification significantly reduces the model’s parameter count and computational cost. Furthermore, its streamlined feature extraction path proved to be more focused on the key patterns of the defects themselves, which also contributed to an improvement in detection accuracy. To improve feature fusion, this study addressed the limited capability of the standard C2f module to represent defects with diverse morphologies and scales. The suggested C2f-Star module integrates the Star operation [46] with efficient DW-Conv [45]. By mapping features to a higher-dimensional implicit space for interaction, this module demonstrably enhanced the model’s multi-scale feature representation and fusion capabilities, leading to improved detection performance for irregularly shaped targets such as tuberculation and foreign matter. Concerning the loss function, traditional static metrics like CIoU loss [47] are ill-suited for handling the low-quality (e.g., blurred and occluded) images common in pipeline inspections. Consequently, this study introduced the WIoUv3 loss function [48]. Its dynamic non-monotonic focusing mechanism intelligently assigns gradient weights based on sample quality, which effectively suppresses the adverse effects of low-quality samples, stabilizes the training process, and improves the final localization accuracy. The final enhanced YOLOv8-VSW model had an average inference speed of 603.8 FPS, which was roughly 14.7% superior to the baseline model’s performance of 526.2 FPS. This demonstrates that the proposed architecture enhances the mAP without incurring additional computational overhead, thereby achieving a synergistic optimization of both performance and efficiency.

5. Conclusions

This study presents an automated method for identifying internal defects in water supply pipelines using DL. Based on the YOLOv8 framework, this study proposes a lightweight, high-precision model, YOLOv8-VSW, through systematic optimizations of the backbone, feature fusion neck, and loss function. The primary work and conclusions are as follows:
(1)
A specialized dataset for in-service water supply pipeline defects was constructed. It was demonstrated that a combined data augmentation strategy, including photometric and affine transformations and noise injection, effectively addresses the challenges of data scarcity and class imbalance inherent in this domain.
(2)
Qualitative analysis revealed the typical “failure modes” of the baseline YOLOv8 model in this context, including a tendency for FP errors on complex backgrounds and localization inaccuracies, such as generating redundant bounding boxes for single targets. This demonstrates that general-purpose object detection models struggle to adapt to the challenging internal pipeline environment without targeted modifications.
(3)
The proposed YOLOv8-VSW architecture enhances the model’s information processing on three levels: the VanillaNet backbone simplifies feature extraction to focus on key defect patterns; the C2f-Star neck improves multi-scale feature fusion through high-dimensional implicit space interaction, boosting accuracy for irregular targets like tuberculation; and the WIoUv3 loss function dynamically adjusts gradients based on sample quality, significantly improving model performance and stability.
(4)
Ablation studies quantified the impact of each module, with their contribution to the mAP@50 improvement ranked as follows: VanillaNet > WIoUv3 > C2f-Star. Backbone replacement provided the most significant gain of 1.8 percentage points, suggesting that an efficient, task-specific top-level design is critical for baseline model performance.
(5)
The final proposed YOLOv8-VSW model achieved an mAP@50 of 83.5% on the test set while reducing the parameter count by 38.7% compared to the baseline. This result confirms that a synergistic optimization of accuracy and efficiency was achieved, meeting the requirements for real-time, automated inspection.
The generalizability of our current study is limited to the three defect types investigated. Future work should address this by continuously expanding the dataset to include more diverse and subtle defects, such as cracks, joint displacements, and biological growth, to improve the model’s comprehensive diagnostic capability. Future research will therefore include comprehensive on-site testing to bridge the gap between our robust computational analysis and practical deployment.

Author Contributions

Conceptualization, Q.W. and L.L.; methodology, Q.W. and L.L.; software, Q.W. and L.L.; validation, Q.W. and L.L.; formal analysis, Q.W. and L.L.; investigation, Z.S. and S.X.; resources, Q.H.; data curation, Q.W. and L.L.; writing—original draft preparation, Q.W.; writing—review and editing, S.L. and Q.H.; visualization, Q.W. and L.L.; supervision, S.L. and Q.H.; project administration, S.L. and G.Z.; funding acquisition, S.L. All authors have read and agreed to the published version of the manuscript.

Funding

This research was funded by National Key Research & Development Program of China (No. 2022YFC3801001).

Data Availability Statement

The data presented in this study are available on request from the corresponding author.

Conflicts of Interest

The authors declare no conflicts of interest.

Abbreviations

The following abbreviations are used in this manuscript:
CCTVclosed-circuit television
GPRground penetrating radar
CVcomputer vision
DLdeep learning
CNNsconvolutional neural networks
mAPmean average precision
YOLOYou Only Look Once
CSPcross-stage partial
SPPFspatial pyramid pooling-fast
PANetpath aggregation network
DW-Convdepth-wise separable convolutions
CIoUcomplete-IoU
WIoUwise-IoU
GFLOPsgigaFLOPs
FPSframes per second
APaverage precision
P-Rprecision-recall
FLOPscomputational complexity

References

  1. National Bureau of Statistics of China. China Statistical Yearbook; China Statistics Press: Beijing, China, 2023. [Google Scholar]
  2. Li, Y.; Kang, G.; Hu, Z.; Zhou, B.; Tian, T. Analysis of Shallow Groundwater Nitrate Pollution Sourcesin the Suburbs of Liaocheng City. J. China Hydrol. 2020, 40, 91–96. [Google Scholar] [CrossRef]
  3. Da, H.; Shen, H.; Yuan, J.; Wang, R.; Hu, S.; Sang, Z. Emergency Repair and Safeguard Measures of Leakage Points in Large Diameter Water Supply Jacking Pipe. China Water Wastewater 2020, 36, 140–144. [Google Scholar] [CrossRef]
  4. Guo, H.; Tian, Y.; Zhang, H.; Li, X.; Jin, Y.; Yin, J. Research Progress on Internal Corrosion of Lron-metal Pipes of Water Distribution Systems. China Water Wastewater 2020, 36, 70–75. [Google Scholar] [CrossRef]
  5. Zhang, Z. Discussion on Connotations and Requirements of Leakage Control for Public Water Supply Networks. Water Purif. Technol. 2022, 22, 1–3. [Google Scholar]
  6. Joseph, K.; Sharma, A.K.; van Staden, R.; Wasantha, P.L.P.; Cotton, J.; Small, S. Application of Software and Hardware-Based Technologies in Leaks and Burst Detection in Water Pipe Networks: A Literature Review. Water 2023, 15, 2046. [Google Scholar] [CrossRef]
  7. Bertulessi, M.; Bignami, D.F.; Boschini, I.; Longoni, M.; Menduni, G.; Morosi, J. Experimental Investigations of Distributed Fiber Optic Sensors for Water Pipeline Monitoring. Sensors 2023, 23, 6205. [Google Scholar] [CrossRef] [PubMed]
  8. Meniconi, S.; Brunone, B.; Tirello, L.; Rubin, A.; Cifrodelli, M.; Capponi, C. Transient Tests for Checking the Trieste Subsea Pipeline: Diving into Fault Detection. J. Mar. Sci. Eng. 2024, 12, 391. [Google Scholar] [CrossRef]
  9. Meniconi, S.; Brunone, B.; Tirello, L.; Rubin, A.; Cifrodelli, M.; Capponi, C. Transient Tests for Checking the Trieste Subsea Pipeline: Toward Field Tests. J. Mar. Sci. Eng. 2024, 12, 374. [Google Scholar] [CrossRef]
  10. Awwad, A.; Albasha, L.; Mir, H.S.; Mortula, M.M. Employing Robotics and Deep Learning in Underground Leak Detection. IEEE Sens. J. 2023, 23, 8169–8177. [Google Scholar] [CrossRef]
  11. Feng, Y.; Fan, G.; Zhang, H. Analysis of Water Quality Characteristics in Aeras with Frequent Water Quality Problems in a City of South China. Water Wastewater Eng. 2018, 111–116. [Google Scholar]
  12. Wang, Y.; Wang, R.; Hu, Q.; Wang, F. Risk Assessment Model for Structural Stability of Urban Water Supply Pipeline. Water Purif. Technol. 2018, 115, 104–110. [Google Scholar]
  13. Cui, Y.; Yu, P.; Wu, J. Research and Discussion on Construction of Whole Process Information System of Drainage Pipe Network. Water Wastewater Eng. 2022, 58, 537–541. [Google Scholar] [CrossRef]
  14. He, M.; Zhao, Q.; Gao, H.; Zhang, X.; Zhao, Q. Image Segmentation of a Sewer Based on Deep Learning. Sustainability 2022, 14, 6634. [Google Scholar] [CrossRef]
  15. Yusuf, W.; Alaka, H.; Ahmad, M.; Godoyon, W.; Ajayi, S.; Toriola-Coker, L.O.; Ahmed, A. Deep Learning for Automated Encrustation Detection in Sewer Inspection. Intell. Syst. Appl. 2024, 24, 200433. [Google Scholar] [CrossRef]
  16. Liu, R.; Shao, Z.; Yu, Z.; Li, R. Research on Real-Time Helmet Detection and Deployment Based on an Improved YOLOv7 Network with Channel Pruning. SIViP 2025, 19, 118. [Google Scholar] [CrossRef]
  17. Wu, Z.; Guo, Y.; Huang, S.; Ma, B. A Sewer Pipeline Defect Detection Model Based onYOLOv8 with Efficient ViT Algorithm. Water Wastewater Eng. 2025, 125–130. [Google Scholar]
  18. Li, W. Research on Key Technology of Defect Detection of Urban Drainage Pipeline. Master’s Thesis, South China University of Technology, Guangzhou, China, 2022. [Google Scholar]
  19. Acharyya, A.; Sarkar, A.; Aleksandrova, M. Deep Learning-Based Object Detection: An Investigation. In Lecture Notes in Electrical Engineering; Springer Nature: Singapore, 2022; pp. 697–711. ISBN 978-981-19-5036-0. [Google Scholar]
  20. Kacprzyk, J. Analyzing Deep Neural Network Algorithms for Recognition of Emotions Using Textual Data. In Lecture Notes in Networks and Systems; Springer International Publishing: Cham, Switzerland, 2023; pp. 60–70. ISBN 978-3-031-31152-9. [Google Scholar]
  21. Sharma, A.; Kumar, P.; Babulal, K.S.; Obaid, A.J.; Patel, H. Categorical Data Clustering Using Harmony Search Algorithm for Healthcare Datasets. Int. J. E-Health Med. Commun. (IJEHMC) 2022, 13, 1–15. [Google Scholar] [CrossRef]
  22. Cheng, J.C.; Wang, M. Automated Detection of Sewer Pipe Defects in Closed-Circuit Television Images Using Deep Learning Techniques. Autom. Constr. 2018, 95, 155–171. [Google Scholar] [CrossRef]
  23. Yin, X.; Chen, Y.; Bouferguene, A.; Zaman, H.; Al-Hussein, M.; Kurach, L. A Deep Learning-Based Framework for an Automated Defect Detection System for Sewer Pipes. Autom. Constr. 2020, 109, 102967. [Google Scholar] [CrossRef]
  24. Ha, B.; Schalter, B.; White, L.; Koehler, J. Automatic Defect Detection in Sewer Network Using Deep Learning Based Object Detector. In Proceedings of the 3rd International Conference on Image Processing and Vision Engineering, Prague, Czech Republic, 21–23 April 2023; pp. 188–198. [Google Scholar]
  25. Zhu, J.; Wang, Y. Research on Transducers Impedance Matching Technology in Sonar Imaging Detection of Drainage Pipelines. Mod. Electron. Tech. 2024, 47, 129–134. [Google Scholar] [CrossRef]
  26. Ma, S. Underground Pipeline Quality Inspection Method Based on Infrared Thermal Imaging. Beijing Surv. Mapp. 2023, 37, 465–470. [Google Scholar] [CrossRef]
  27. Ren, S.; He, K.; Girshick, R.; Sun, J. Faster R-Cnn: Towards Real-Time Object Detection with Region Proposal Networks. Adv. Neural Inf. Process. Syst. 2015, 28, 1137–1149. [Google Scholar] [CrossRef]
  28. Li, D.; Xie, Q.; Yu, Z.; Wu, Q.; Zhou, J.; Wang, J. Sewer Pipe Defect Detection via Deep Learning with Local and Global Feature Fusion. Autom. Constr. 2021, 129, 103823. [Google Scholar] [CrossRef]
  29. Boaretto, N.; Centeno, T.M. Automated Detection of Welding Defects in Pipelines from Radiographic Images DWDI. Ndt E Int. 2017, 86, 7–13. [Google Scholar] [CrossRef]
  30. Redmon, J.; Divvala, S.; Girshick, R.; Farhadi, A. You Only Look Once: Unified, Real-Time Object Detection. In Proceedings of the IEEE Conference on Computer Vision and Pattern Recognition, Las Vegas, NV, USA, 27–30 June 2016; pp. 779–788. [Google Scholar]
  31. Siu, C.; Wang, M.; Cheng, J.C. A Framework for Synthetic Image Generation and Augmentation for Improving Automatic Sewer Pipe Defect Detection. Autom. Constr. 2022, 137, 104213. [Google Scholar] [CrossRef]
  32. Dang, L.M.; Wang, H.; Li, Y.; Nguyen, L.Q.; Nguyen, T.N.; Song, H.-K.; Moon, H. Lightweight Pixel-Level Semantic Segmentation and Analysis for Sewer Defects Using Deep Learning. Constr. Build. Mater. 2023, 371, 130792. [Google Scholar] [CrossRef]
  33. Wang, N.; Ma, D.; Du, X.; Li, B.; Di, D.; Pang, G.; Duan, Y. An Automatic Defect Classification and Segmentation Method on Three-Dimensional Point Clouds for Sewer Pipes. Tunn. Undergr. Space Technol. 2024, 143, 105480. [Google Scholar] [CrossRef]
  34. Situ, Z.; Teng, S.; Liao, X.; Chen, G.; Zhou, Q. Real-Time Sewer Defect Detection Based on YOLO Network, Transfer Learning, and Channel Pruning Algorithm. J. Civ. Struct. Health Monit. 2024, 14, 41–57. [Google Scholar] [CrossRef]
  35. Liu, R.; Shao, Z.; Sun, Q.; Yu, Z. Defect Detection and 3D Reconstruction of Complex Urban Underground Pipeline Scenes for Sewer Robots. Sensors 2024, 24, 7557. [Google Scholar] [CrossRef]
  36. Zheng, X.; Guan, Z.; Chen, Q.; Wen, G.; Lu, X. A Lightweight Road Traffic Sign Detection Algorithm Based on Adaptive Sparse Channel Pruning. Meas. Sci. Technol. 2024, 36, 016176. [Google Scholar] [CrossRef]
  37. Lu, J.; Song, W.; Zhang, Y.; Yin, X.; Zhao, S. Real-Time Defect Detection in Underground Sewage Pipelines Using an Improved YOLOv5 Model. Autom. Constr. 2025, 173, 106068. [Google Scholar] [CrossRef]
  38. Li, H.; Pang, X. YOLOv8-plus: A Small Object Detection Model Based on Fine Feature Capture and Enhanced Attention Convolution Fusion. Acad. J. Comput. Inf. Sci. 2025, 8, 116–125. [Google Scholar] [CrossRef]
  39. Barton, N.A.; Farewell, T.S.; Hallett, S.H.; Acland, T.F. Improving Pipe Failure Predictions: Factors Affecting Pipe Failure in Drinking Water Networks. Water Res. 2019, 164, 114926. [Google Scholar] [CrossRef] [PubMed]
  40. Guo, J.; Zhang, Y.; Li, Y.; Zhang, X.; Zheng, J.; Shi, H.; Zhang, Q.; Chen, Z.; Ma, Y. Model Experimental Study on the Mechanism of Collapse Induced by Leakage of Underground Pipeline. Sci. Rep. 2024, 14, 17717. [Google Scholar] [CrossRef]
  41. Tan, Y.; Cai, R.; Li, J.; Chen, P.; Wang, M. Automatic Detection of Sewer Defects Based on Improved You Only Look Once Algorithm. Autom. Constr. 2021, 131, 103912. [Google Scholar] [CrossRef]
  42. Bai, D.; Wei, S.; He, X.; Yu, Q. Annotation Methods for Object Detection: A Comparative Analysis from Manual Labeling to Automated Annotation Technologies. In Proceedings of the 2025 5th International Conference on Artificial Intelligence and Industrial Technology Applications (AIITA), Xi’an, China, 28–30 March 2025; IEEE: New York, NY, USA, 2025; pp. 1473–1479. [Google Scholar]
  43. Sohan, M.; Sai Ram, T.; Rami Reddy, C.V. A Review on YOLOv8 and Its Advancements. In Algorithms for Intelligent Systems; Springer Nature: Singapore, 2024; pp. 529–545. ISBN 978-981-99-7999-8. [Google Scholar]
  44. Zhu, S.; Li, X.; Wan, G.; Wang, H.; Shao, S.; Shi, P. Underwater Dam Crack Image Classification Algorithm Based on Improved Vanillanet. Symmetry 2024, 16, 845. [Google Scholar] [CrossRef]
  45. Ma, X.; Wang, W.; Li, W.; Wang, J.; Ren, G.; Ren, P.; Liu, B. An Ultralightweight Hybrid CNN Based on Redundancy Removal for Hyperspectral Image Classification. IEEE Trans. Geosci. Remote Sens. 2024, 62, 1–12. [Google Scholar] [CrossRef]
  46. LING, L.; Zhu, C.; Liu, M.; Hu, J.; Zhang, X.; Ge, M. YOLOv8-SC: Improving the YOLOv8 Network for Real-Time Detection of Automotive Coated Surface Defects. Meas. Sci. Technol. 2025, 36, 036003. [Google Scholar] [CrossRef]
  47. Liu, X.; Yang, X.; Chen, Y.; Zhao, S. Object Detection Method Based on CloU Improved Bounding Box Loss Function. Chin. J. Liq. Cryst. Disp. 2023, 38, 656–665. [Google Scholar] [CrossRef]
  48. Yang, X.; Liu, C.; Han, J. Reparameterized Underwater Object Detection Network Improved by Cone-Rod Cell Module and WIOU Loss. Complex Intell. Syst. 2024, 10, 7183–7198. [Google Scholar] [CrossRef]
Figure 2. Images of water supply pipeline diseases (a) corrosion; (b) Tuberculation; (c) Foreign matter.
Water 17 02781 g002
Figure 3. LabelImg annotation interface.
Water 17 02781 g003
Figure 4. YOLOv8 network structure diagram.
Water 17 02781 g004
Figure 5. YOLOv8-VSM model structure diagram.
Water 17 02781 g005
Figure 6. DW-Conv structure diagram.
Water 17 02781 g006
Figure 7. Module diagrams of C2f, C2f-Star, Bottleneck and Star block.
Water 17 02781 g007
Figure 8. Photometric transformation. (a) Original image; (b) After optical enhancement.
Water 17 02781 g008
Figure 9. Random affine transformation. (a) Original image; (b) Rotate 30°.
Water 17 02781 g009
Figure 10. Noise injection. (a) Original image; (b) Salt and pepper noise; (c) Gaussian noise.
Water 17 02781 g010
Figure 11. Dataset Information. (a) Number of diseases in three categories; (b) Disease anchor box visualization; (c) Distribution of disease anchor frame coordinates; (d) Disease size distribution.
Water 17 02781 g011
Figure 12. Plot of YOLOv8-VS and YOLOv8-VmAP@50 curve changes.
Water 17 02781 g012
Figure 13. Plots of each disease detection accuracy for YOLOv8-VS and YOLOv8-V.
Water 17 02781 g013
Figure 14. Curve variation plots of mAP@50 for YOLOv8-VS and YOLOv8-VSW.
Water 17 02781 g014
Figure 15. Change plot of Loss curve for YOLOv8-VS and YOLOv8-VSW.
Water 17 02781 g015
Figure 16. Corrosion detection picture. (a) YOLOv8 model detection results; (b) YOLOv8-VSW model detection results.
Water 17 02781 g016
Figure 17. Foreign matter detection picture. (a) YOLOv8 model detection results; (b) YOLOv8-VSW model detection results.
Water 17 02781 g017
Figure 18. Tuberculation detection picture. (a) YOLOv8 model detection results; (b) YOLOv8-VSW model detection results.
Water 17 02781 g018
Table 1. Water supply pipeline disease categories and corresponding labels.
Categories of Water Supply Pipeline DiseasesNumber of ImagesCorresponding Label
corrosion11840
tuberculation7941
foreign matter1442
Table 2. Label text information.
Class IDCenter_xCenter_yWidthHeight
00.9066110.4625000.1836310.902778
00.6282790.8555560.3468000.198148
10.6398220.4185190.3016790.622222
10.1002100.7050930.1993700.495370
Table 3. Test Environment Configuration.
ConfigurationTest EnvironmentModel Version
Hardware environmentCPUIntel Core i9 14900kf
GPUNVIDIA RTX 4080
Video memory16 GB
Memory64 GB
Software environmentOperating systemWindows 11
Programming languagesPython 3.8.20
Development environmentPycharm
DL FrameworkPytorch 2.4.1
CUDA version12.1
Table 4. Relevant hyperparameter Settings.
HyperparametersNumerical Value
Input image size640 × 640
Batch size32
Initial learning rate0.01
optimizerSGD
Weight decay term0.0005
Epoch300
Table 5. Comparison of images before and after enhancement in the disease dataset.
Image EnhancementCorrosionTuberculationForeign Matter
Number before enhancement112273282
Augmented quantity1184794144
Enhanced before mAP@5076.275.462.3
Enhanced mAP@5080.479.973.8
Table 6. Comparing model results between YOLOv8-V and YOLOv8.
ModelR/%mAP
@50/%
mAP
@50–95/%
Parameter Count/106FLOPsFPS/HZ
YOLOv875.079.562.211.1323.4526.2
YOLOv8-V74.281.365.26.5413.5611.4
Table 7. Comparison of model results between YOLOv8-VSW, YOLOv8-V and YOLOv8.
ModelR/%mAP
@50/%
mAP
@50–95/%
Parameter Count/106FLOPsFPS/HZ
YOLOv875.079.562.211.1323.4526.2
YOLOv8-V74.281.365.26.5413.5611.4
YOLOv8-VSM79.283.566.66.8214.3603.8
Disclaimer/Publisher’s Note: The statements, opinions and data contained in all publications are solely those of the individual author(s) and contributor(s) and not of MDPI and/or the editor(s). MDPI and/or the editor(s) disclaim responsibility for any injury to people or property resulting from any ideas, methods, instructions or products referred to in the content.