Abstract
This study aims to investigate the spatiotemporal evolution of cavitating flow and the associated acoustic responses around a NACA0015 hydrofoil. A coupled fluid–acoustic interaction model is developed by integrating a nonlinear cavitation model with vortex–sound coupling theory. Numerical simulations are conducted within a computational domain established for the hydrofoil to capture the interactions between cavitation dynamics and acoustic radiation. The results indicate that the temporal variations in cavity evolution and pressure fluctuations agree well with experimental observations. The simulations predict a dominant pressure fluctuation frequency of 30.15 Hz, consistent with the cavitation shedding frequency, revealing that the evolution of leading-edge vortex structures governs the periodic variations in the lift-to-drag ratio. Cavitation significantly modifies the development of vortex structures, with vortex stretching effects mainly concentrated near cavitation regions. The dilation–contraction term is closely associated with cavity formation, while the pressure–torque tilting term predominantly affects cloud cavitation collapse. Dynamic mode decomposition (DMD) shows that the coherent structures of the leading modes exhibit morphological similarity to multiscale cavitation and vortex structures. Furthermore, hydrofoil cavitation noise consists mainly of loading noise and cavitation-induced pulsating radiation noise, with surface acoustic sources concentrated in cloud cavitation shedding regions. The dominant frequency of cavitation-induced radiation noise is highly consistent with experimental measurements.
1. Introduction
During the operation of hydraulic machinery, when local pressure falls below the saturation vapor pressure, water undergoes a phase transition from liquid to vapor [1,2], a phenomenon termed cavitation flow. The generation, development, and collapse of cavitation bubbles in this process induce strong nonlinear flow characteristics. The energy and pulses generated during the collapse are highly destructive and radiate intense cavitation noise. This may result in noise generation (cavitation noise) and vibrations within hydraulic machinery, potentially causing severe fatigue and operational instability. Therefore, investigating cavitation flow characteristics and its acoustic radiation holds significant engineering importance.
Cavitation-induced noise constitutes a critical component of underwater radiated noise, which compromises vessel safety and comfort while adversely affecting marine ecosystems [3]. Typically, high cavitation numbers lead to sparsely distributed transient cavitation bubbles that advect along the flow. This state generally remains stable or near-stable. However, lower cavitation numbers trigger alternative mechanisms, such as the rupture of sheet cavities and the development of large vapor structures like cavitation clouds [4]. These clouds predominantly contribute to cavitation noise generation due to their simultaneous growth and collapse [5]. Cavitation noise manifests in two distinct forms: tonal noise (blade rate) and broadband noise (tip vortex cavitation). Sheet cavitation elevates noise levels in low-frequency regions (i.e., tonal blade rate components), while tip vortex cavitation significantly contributes to broadband noise across high-frequency and mid-to-low frequency ranges [6,7]. Notably, tonal noise levels exhibit amplification during collapse phenomena [8].
Accurate capture of cavity evolution within the flow field is a prerequisite for predicting cavitation noise, and cavity prediction relies on precise cavitation modeling. Several studies have evaluated differences in cavitation noise prediction using various turbulence models [9]. Reynolds-Averaged Navier–Stokes (RANS) models fail to accurately estimate noise due to their neglect of fluctuating quantities [10]. Large Eddy Simulation (LES) is recognized as the most accurate technique for simulating cavitating flows [11,12], particularly with LES-subgrid scale (LES-SGS) models. However, LES overpredicts the dominant frequency of cavity oscillations, underestimates sidewall effects, and demands extensive computational resources, limiting its applicability to complex engineering problems. For cavitation noise prediction, the Detached Eddy Simulation (DES) turbulence model has gained widespread adoption [13]. It effectively predicts diverse cavitating flows, captures a broader range of turbulent scales [14], and better estimates the dominant frequency of cavity oscillations, which is often overpredicted by LES models [15]. Qin et al. [16] integrated a wall-nucleation model with a transition-corrected DDES framework, achieving accurate prediction of sheet cavitation inception and morphology in close agreement with experiments. Kumar et al. [17] experimentally demonstrated that bio-inspired scalloped riblets suppress cloud cavitation shedding and shock intensity on a NACA 0015 hydrofoil, offering an effective passive control strategy against cavitation erosion. Consequently, this study employs a DDES-based approach combined with a numerical computational domain for the NACA0015 hydrofoil, integrating a nonlinear cavitation model with vortex-sound coupling theory to achieve coupled fluid-acoustic simulations.
The mathematical formulation of flow-induced acoustic sources serves as a foundational methodology for investigating turbulent noise. Widely adopted equations include Lighthill’s acoustic analogy and Powell’s vortex-sound equation [18], which reorganize velocity, pressure, and viscous terms within the flow field to derive far-field radiated noise through surface and volume integrals [19]. Subsequently, Williams and Hawkings extended Lighthill’s acoustic analogy into a generalized formulation [20], incorporating solid-body motion, now referred to as the Ffowcs Williams and Hawkings (FW-H) equations. In practical engineering applications, noise levels are typically evaluated by monitoring acoustic pressure at specific points. By inputting unsteady flow field data and solving the FW-H integrals, the acoustic pressure distribution at a far-field point can be determined. Seol et al. [21] employed the FW-H Farassat 1A formulation to resolve monopole noise generated by propeller cavitation volume fluctuations, though extracting cavitation surface normal velocity vectors using this approach remains challenging. Wei et al. [22] applied the FW-H acoustic analogy method to predict and analyze noise from cavitating hydrofoils, while Sakamoto and Kamiirisa [23] bypassed FW-H-based simulations, instead developing a viscous CFD semi-empirical method to predict near-field propeller cavitation-induced noise, validated against experimental data. Sun et al. [24] also utilized the FW-H surface integral formulation to solve cavitation-induced noise. Powell [25] and Howe [26] explored acoustic characteristics of flow-generated sound, establishing vortex-sound theory through investigations into fluid noise mechanisms and turbulence–acoustic interactions. Their work revealed that acoustic wave generation is intrinsically linked to vorticity, potential flow interactions, and nonlinear energy transfer via vortex dynamics. For NACA0012 hydrofoil models, hybrid methodologies combining LES with either FW-H or Powell’s acoustic equations demonstrate comparable performance, both proving reliable for flow-induced noise prediction under low Mach number conditions. These hybrid approaches decouple flow field and acoustic field computations, neglecting feedback from acoustic perturbations to the flow. In recent years, emerging algorithms such as the Lattice Boltzmann Method (LBM) and Smoothed Particle Hydrodynamics (SPH) have advanced computational acoustics [27,28]; however, their application in geometrically complex engineering scenarios remains challenging due to prohibitive computational resource demands. Consequently, developing coupled fluid-acoustic computational methods is essential for elucidating noise propagation mechanisms and enhancing predictive accuracy.
Despite notable progress in cavitation noise research for hydrofoils, challenges remain in achieving accurate noise prediction and in elucidating the underlying mechanisms. Most existing numerical approaches rely on the Lighthill acoustic analogy, which restricts simultaneous resolution of flow and acoustic fields. Furthermore, previous studies have primarily focused on the noise response induced by cavitation, while systematic insights into the localization and generation mechanisms of surface noise sources are still limited. To overcome these limitations, the present study develops a spatiotemporal cavitating flow–acoustic simulation framework by integrating a nonlinear cavitation model with the Delayed Detached Eddy Simulation (DDES) turbulence model. A coupled prediction methodology, incorporating vortex–sound interaction theory, is proposed to simultaneously capture cavitation dynamics and acoustic responses. The novelty of this work lies in clarifying the governing mechanisms of cavitation–acoustic interactions through spatiotemporal analysis and validating the proposed methodology against experimental measurements.
2. Numerical Simulation Method
2.1. Turbulence Model
The numerical simulation methods for turbulence include Direct Numerical Simulation (DNS), Reynolds-Averaged Navier–Stokes (RANS), and Large Eddy Simulation (LES). These approaches have given rise to various turbulence models applicable to different flow conditions. The DNS method directly solves the Navier–Stokes equations without requiring assumptions about the flow field or additional turbulence equations for closure. However, DNS imposes stringent requirements on grid size and time step resolution. Currently, most numerical studies are based on RANS and LES methods. While LES still demands relatively fine grid resolution, hybrid RANS-LES models (e.g., Scale-Adaptive Simulation (SAS) and Detached Eddy Simulation (DES)) have emerged to balance computational efficiency and accuracy. Specifically, the DES model is tailored for transient flow analysis, employing RANS for small-scale turbulence near walls and LES for larger-scale turbulence away from walls. Nishino et al. [29] demonstrated through simulations of transient vorticity fields in cylinder flows that DES resolves finer flow structures compared to Unsteady RANS (URANS). Spalart [30] further noted that DES achieves computational efficiency comparable to LES while maintaining similar accuracy.
In addition to the original DES model, recent years have seen the development of modified versions such as IDES, Delayed DES (DDES), and Stress-Blended DES (SDES), each optimized for specific applications. Owing to the advantages of the SST k-ω model and DDES in handling flow separation, studies on hydrofoils and centrifugal pumps have adopted DDES for transient flow simulations based on steady-state SST k-ω calculations. The governing equations for the SST k-ω model and DDES are as follows:
- (1)
- SST k-ω model
- (2)
- DDES model based on SST k-ω model
Building upon the SST k-ω model, the DDES approach modifies the last term in Equation (1) by introducing the turbulence length scale Lt, expressed as:
The SST k-ω equations are modified as:
Subsequently, the dissipation term in Equation (7) is modified to incorporate a dependency on the grid scale, expressed as:
CDES represents the model coefficient calculated by the blending function, typically taken as , . When the boundary layer is refined such that the grid scales in different directions become comparable, the characteristic LES length scale is activated earlier, prompting premature flow separation near the wall. To address this, Spalart et al. [31] accounted for viscous effects on the turbulence length scale and reconstructed the characteristic length scale lDDES, establishing the DDES method. The length scale in DDES can be expressed as:
where S is the strain rate tensor; Ω is the vorticity tensor; the model constants Cd1 and Cd2 are is 8 and 3, respectively.
2.2. Nonlinear Cavitation Model
Cavitating flow represents a complex physical process involving turbulence, heat transfer, and mass transfer. In solving cavitation problems in centrifugal pumps, the liquid phase and vapor phase are typically treated as a homogeneous mixture with no relative velocity between phases. The homogeneous flow model established based on this concept has been widely adopted in practice due to its high computational efficiency and broad applicability. The present simulations employ the mixture method based on the mean equilibrium flow assumption. For cavitation modeling, both the Schnerr–Sauer cavitation model and a modified cavitation model incorporating nonlinear variations in bubble radius are implemented in this study.
The generalized cavitation dynamic equation is:
where the left side of the equal sign is the instantaneous tension term, which is determined by the boundary conditions far from the cavitation bubble, pB is the pressure in the cavitation bubble, and p∞(t) is the pressure at infinity; the first item on the right side of the equal sign is the second-order motion term of the cavity, and R is the cavity radius; the second term is the first-order motion term of the cavity; the third term is the viscosity term, vl is the kinematic viscosity of the liquid phase; the fourth term is the surface tension term, and S is the surface tension coefficient. It is only translated into professional English thesis format without additional content and segmentation.
The Schnerr–Sauer model uses the number of cavitation nuclei per unit volume to derive the volume fraction of cavitation and liquid:
The Schnerr–Sauer cavitation model is derived from a simplified form of the Rayleigh–Plesset equation, requiring the estimation of the initial bubble number density N0. In Fluent software (Version 2021R1), the default N0 is set to 1 × 10¹¹ [32], while Schnerr and Sauer specified 1 × 10¹³ [33]. Hong et al. demonstrated that N0 = 1 × 10¹³ better captures shedding cavitation at the hydrofoil trailing edge; thus, this value is adopted in subsequent calculations. In Equation (17), the unknown bubble radius R is expressed in terms of N and the vapor volume fraction αν as:
The evaporation and condensation rates of the model can be expressed as:
where Fvap and Fcond are empirical coefficients, generally taken as 50 and 0.2; ρm is the mixing density, which can be expressed as .
The derivation of Schnerr–Sauer, ZGB, and similar models does not account for the effects of non-condensable cavitation nuclei. Research by Žnidarčič et al. [34] demonstrated that the second-order derivative term significantly influences bubble radius evolution, which in turn governs interphase mass transfer in cavitating flows. Consequently, models incorporating more realistic bubble radius dynamics can better simulate actual cavitation behavior. Below, we extend the Schnerr–Sauer model by incorporating non-condensable gas effects and second-order derivative terms to derive a nonlinear cavitation model.
To accurately represent cavitation physics, the medium is treated as a mixture of vapor bubbles, liquid, and non-condensable gas. The volume fractions of these three components are expressed as:
where αl, αv and αg are the volume fraction of liquid phase, gas phase and non-condensable gas, respectively.
There are evaporation and condensation processes in the process of cavitation. The continuity equation of liquid phase and gas phase can be expressed as:
It is assumed that there is no relative slip velocity between the components, which is , the continuity equation of the mixed phase can be expressed as:
The mixing density ρ and the viscosity coefficient μ are expressed as:
The volume fraction relationship of non-condensable gas phase, can be expressed as:
Since the sum of the three phases of αl, αv, αg is 1, that is, αg = 1 − αl − αv, the expression (27) is expressed by
Similarly to the Schnerr–Sauer model, the relationship between the vapor volume fraction and the number density of cavitation nuclei per unit liquid volume can be expressed using Equation (17). By differentiating Equation (27), we obtain:
By combining Equations (23) and (29) and substituting them into Equation (16), the vaporization rate expression can be derived as:
Similarly, the condensation rate expression is:
Considering the influence of turbulent pulsation on cavitation inception, the cavitation pressure is corrected to
where ptur can be expressed as
The cavitation model is embedded with DEFINE_CAVITATION_RATE macro, with the following parameter settings: the number density of nuclei N0 = 1.0 × 10¹³ m−3, the initial bubble radius R0 = 1 μm, the mass fraction of non-condensable gas fg = 1.5 × 10⁻⁶, and the saturated vapor pressure psat = 3169 Pa.
2.3. Numerical Method for Flow–Acoustic Field Coupling
2.3.1. Powell’s Vortex Sound Theory
The acoustic analogy approach is widely employed for characterizing aerodynamic noise generation. In Lighthill’s acoustic analogy theory, noise is attributed to momentum variations and other physical changes during fluid motion. Ffowc-Williams and Hawkings extended Lighthill’s theory by incorporating noise contributions from moving boundaries in fluids, establishing the generalized form of Lighthill’s equation—the FW-H equation. The FW-H equation can be expressed as Equation (34), which introduces generalized functions and Dirac delta functions, where represents the stress tensor and denotes the Lighthill tensor. Reference [20] provides a detailed derivation of the FW-H equation, whose right-hand terms, respectively, represent monopole, dipole, and quadrupole noise sources.
Powell and Howe introduced vorticity into the governing equations to establish the vortex sound theory, positing that vortical structures and their scales fundamentally determine acoustic radiation. Sound wave generation is closely linked to nonlinear interactions between turbulence and vortices, through which acoustic energy is formed and transferred. For internal flows in centrifugal pumps, the vortex sound theory represents a specialized solution of the Lighthill equation under low Mach number conditions. Given the non-negligible interactions between cavitation and vorticity, this study employs the vortex sound theory to analyze flow-induced noise in centrifugal pumps while neglecting cavitation pulsation effects. The Powell vortex sound equation is formulated as:
The left-hand side of the equation comprises temporal and spatial terms, while the right-hand side represents acoustic sources generated by pressure and vorticity variations. When the fluid velocity is less than the sound velocity, terms other than become negligible. By further assuming adiabatic and isentropic flow conditions within the pump, the density can be expressed in terms of pressure perturbations:
Equation (36) reveals that the acoustic source term comprises two components: one generated by vorticity stretching and another arising from kinetic energy perturbations . For low-Mach-number flows in centrifugal pumps, the former exhibits dipole characteristics while the latter demonstrates quadrupole behavior. Numerical solution of this equation is achieved via the finite volume method. Performing volume integration over the computational domain:
Following FLUENT’s User-Defined Scalar (UDS) framework, Equation (37) is discretized with the following boundary conditions: at solid walls, where the flow velocity vanishes, all physical quantities (pressure, velocity, density) remain invariant, leading to zero acoustic pressure (p′ = 0) as derived from the vortex sound theory; for inlet/outlet boundaries, non-reflecting absorbing boundary conditions are imposed to minimize spurious wave reflections in the implicit finite-volume-method solution.
After achieving stabilized unsteady cavitating flow field simulations, the customized Powell equation is activated to concurrently solve both the flow field and flow-induced noise (excluding cavitation pulsation effects) through coupled numerical simulation.
2.3.2. Prediction of Cavitation Volume Pulsation Noise
In addition to flow-induced noise, the acoustic radiation generated by cavitation bubble growth and collapse (volume pulsations) must be considered; thus, the cavitation volume variation is incorporated as a source term to solve for cavitation pulsation noise.
According to the Di Francescantonio assumption, the monopole noise caused by bubble pulsation is simplified as
Referring to the solution of the FW-H equation proposed by Di Francescantonio, if the bubbles over the hydrofoil and the impeller are used as the pulsation source, the monopole sound pressure at the distance of r from the cavitation is:
The monopole noise sound pressure induced by cavitation pulsations at monitoring field points can be calculated using Equation.
As cavitation pulsation noise constitutes a primary source of flow-induced noise under cavitating conditions in hydrofoils and centrifugal pumps, its prediction requires time-resolved cavitation volume data, which is obtained by summing the vapor volumes across all computational grids via Equation (42) to determine the total cavitation volume.
where Vc is the total volume of the cavity; N is the total number of grids; i is the void volume fraction in the control volume; Vi is the volume of the control volume.
Figure 1 presents the integrated flow–acoustics computational framework developed in this study.

Figure 1.
Flow–Acoustics computational procedure.
In this study, the Delayed Detached Eddy Simulation (DDES) turbulence model was coupled with a nonlinear cavitation model to simulate the unsteady cavitating flow. The choice of DDES was motivated by its ability to capture large-scale vortical structures and unsteady flow features with reasonable computational cost, while still providing sufficient accuracy for noise-related analysis. The nonlinear cavitation model was adopted because it offers improved representation of bubble dynamics and collapse processes compared with simplified cavitation models, which is essential for accurately predicting the mechanisms of cavitation-induced flow–acoustic interactions.
3. Calculation and Experimental Verification
3.1. Research Model
The NACA 0015 hydrofoil is selected as the research object, with a chord length of C = 0.1 m and a spanwise length of 2C, operating at an angle of attack of 12°. Notably, Sagaut [34] investigated the influence of hydrofoil spanwise length on numerical simulations, concluding that a spanwise domain length of twice the chord is sufficient for accurate computations. As illustrated in Figure 2, the computational domain is a cuboid water volume with dimensions 10C × 2C × 2C. To ensure fully developed flow conditions around the hydrofoil, the inflow boundary is positioned 4C upstream of the leading edge, while the outflow boundary is located 5C downstream of the trailing edge. Four pressure monitoring points are arranged on the suction surface of the hydrofoil, starting from 0.18C behind the leading edge and spaced at intervals of 0.14C, as depicted in Figure 3. A no-slip boundary condition is applied to the hydrofoil surface, while free-slip wall conditions are imposed on the fluid domain boundaries. The inlet velocity v is set to 10 m/s, and the outlet pressure pout is adjusted according to the cavitation number. The cavitation number, a dimensionless parameter characterizing cavitation states, is defined as:
where ρl is the density of water.
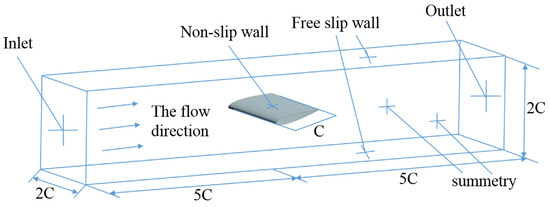
Figure 2.
Computational domain and boundary condition settings.
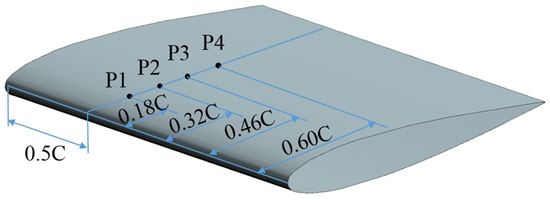
Figure 3.
Pressure monitoring points on the hydrofoil lift surface.
The apparent cavitation phenomena on hydrofoils can be categorized into incipient cavitation, sheet cavitation, cloud cavitation, and supercavitation. Based on high-speed imaging results, the complete shedding cycle of cloud cavitation is observed at a cavitation number σ1 = 1.4. Consequently, numerical simulations for the hydrofoil are conducted at σ1 = 1.4 using ANSYS Fluent (Version 2021R1) to solve transient cavitating flows. To ensure accuracy, a non-cavitating steady-state simulation is first performed until convergence is achieved. The cavitation model is subsequently activated, with the steady-state flow field solution serving as the initial condition for transient simulations. The water temperature in the experiment is 33 °C, corresponding to a saturated vapor pressure of 5035 Pa.
In cavitating flow simulations, the time step size critically influences computational accuracy. A time step of 5 × 10⁻⁵ s is adopted, with 30 iterations per time step and a residual convergence criterion of 2 × 10⁻⁵. To validate the suitability of this time step for detached eddy simulation (DES), Kornhaas et al. [35] investigated its impact on turbulence modeling. Their results demonstrated negligible differences in predicted turbulent energy spectra and pressure fluctuations between time steps of 5 × 10⁻⁵ s and 1 × 10⁻⁴ s, confirming the adequacy of 5 × 10⁻⁵ s for the current study. The acoustic signals were solved synchronously with the flow field, using the same temporal resolution as the CFD solver (5 × 10⁻⁵ s), which ensures sufficient accuracy for capturing the dominant frequency components.
3.2. Mesh and Mesh Independence Analysis
The Detached Eddy Simulation (DES) method requires refined grids to resolve small-scale turbulent structures. While sufficiently fine meshes are essential for numerical accuracy, a balance must be struck between flow resolution and computational cost. As shown in Figure 4, four sets of hexahedral structured grids were generated for the hydrofoil domain using ICEM CFD. An O-type topology with grid refinement is applied near the hydrofoil wall and wake regions. To ensure y+ ≤ 1 on the hydrofoil surface, the height of the first boundary layer grid is set to 0.0015 mm with a growth rate of 1.15. To maintain computational efficiency while preserving accuracy, sufficient nodes are maintained in the streamwise direction, while grid refinement is applied solely in the spanwise direction. Along the spanwise direction, grid node counts are set to 40, 80, 120, and 160, as illustrated in Figure 4.
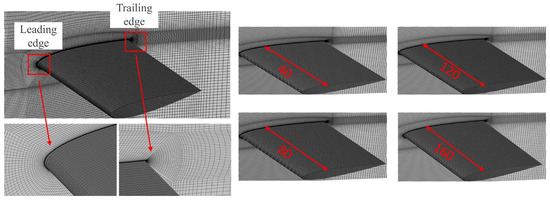
Figure 4.
Grid division near the hydrofoil and distribution of 4 sets of grids in spanwise direction.
Taking the change in lift-drag coefficient of hydrofoil as the standard of grid independence verification, the lift coefficient Cl, drag coefficient Cd and lift–drag ratio K of hydrofoil are defined as:
where L is the lift force on the hydrofoil; D is the drag on the hydrofoil; A = C × Span, which represents the effective area of the hydrofoil.
As shown in Table 1, the differences in CL and CD between Mesh3 and the finer Mesh4 are less than 0.3%. This confirms that Mesh3 provides sufficient accuracy while maintaining reasonable computational cost, and it was therefore selected for all subsequent simulations.

Table 1.
Grid independence analysis.
The SST k-ω and DES model require the grid resolution to meet y+ ≤ 1. It can be seen from Figure 5 that the y+ value is almost lower than 1 except for the leading edge of the hydrofoil, indicating that the set of grids meets the requirements of using the DES turbulence model.
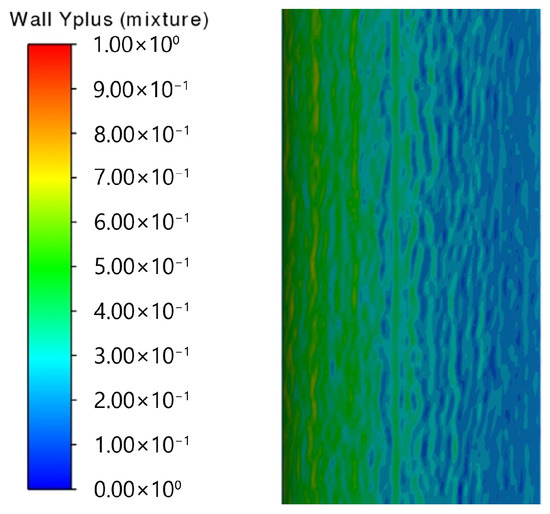
Figure 5.
Distribution of y+ near the suction surface.
The grid resolution requirements for acoustic field simulations are generally less stringent than those for flow field simulations. The maximum grid size must satisfy the condition , where λ represents the wavelength. In this study, the hydrofoil’s numerical simulation frequency is 5000 Hz. Assuming a sound speed of 1500 m/s, the calculated wavelength yields a maximum allowable grid size of < 0.05 m. Since the acoustic field simulation shares the same grid scheme (Mesh3) as the flow field simulation, and the maximum grid dimension of Mesh3 is significantly smaller than 0.05 m, the mesh resolution fully meets the requirements for acoustic computations.
3.3. Experimental Verification
3.3.1. Experimental Method
The numerical simulation results of the hydrofoil in this study were compared and analyzed based on Reference [36]. Figure 6 illustrates the schematic diagram of the cavitation water tunnel experimental setup, which primarily consists of the following instrumentation: a control console, high-speed camera, data acquisition system, hydrophone, pressure transducers, lighting apparatus, and computer systems. Through the data acquisition system, this experimental platform enables synchronous recording of pressure fluctuations, acoustic signals, and flow field snapshots.
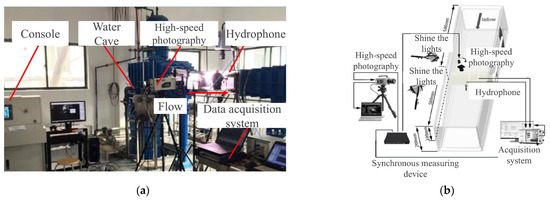
Figure 6.
Experimental site and schematic diagram of water tunnel [36]. (a) On-site photograph. (b) Schematic diagram.
The reference experiments were performed in a cavitation tunnel with a 200 × 200 mm2 test section, where the inlet velocity was maintained at 10 m/s and the cavitation number ranged from 1.35 to 1.7. Pressure sensors were mounted at chordwise positions of 18%, 32%, 46%, and 60%, and acoustic measurements were obtained using a calibrated hydrophone covering the frequency range of 1–200 kHz.
3.3.2. Experimental Results
Figure 7a presents the time-domain acoustic pressure measurements acquired by the hydrophone under a cavitation number of σ = 1.4. The sound pressure level (SPL), defined in Equation (47), is adopted as the acoustic evaluation metric. The results reveal distinct periodic fluctuations in the acoustic pressure during cavity growth and collapse. Figure 7b displays the frequency spectrum of the measured noise SPL. The SPL initially increases within the 0–200 Hz range, followed by a decreasing trend and subsequent stabilization at frequencies above 200 Hz. A dominant spectral peak is observed at 29.99 Hz.
where pref is the reference sound pressure, in this paper, the value is 1×10⁻⁶ Pa; T0 is the total calculation time; pf is the frequency domain sound pressure.

Figure 7.
Sound pressure and sound pressure level spectrum. (a) Time domain sound pressure; (b) sound pressure level spectrum.
4. Results and Discussions
4.1. Numerical Analysis of Cavitation Flow Field
4.1.1. Spatiotemporal Dynamics of Cavitation Bubbles
Figure 8 compares high-speed photographic snapshots of cavitation bubble growth and shedding observed in Reference [36] with numerical simulations of periodic cavitation evolution, where the vapor volume fraction is represented by the 10% isosurface at intervals of 0.167T. Experimental measurements of cavitating flow around a NACA0015 hydrofoil revealed a bubble shedding frequency of approximately 30.05 Hz. The numerical simulations capture a quasi-periodic process involving cavity formation, growth, shedding, and collapse, with the isosurface evolution illustrating the transition to cloud cavitation. Good agreement was observed between experimental and numerical results. Under the cavitation number condition σ1 = 1.4, the cavitation evolution process is categorized into four phases: (1) initial sheet cavitation formation at time instant (a); (2) sheet cavitation growth at time instants (b,c); (3) sheet cavitation fragmentation at time instants (d,e); and (4) cloud cavitation generation at time instant (f). Specifically, in Figure 8a, sheet cavitation first forms at the leading edge of the hydrofoil suction surface, with incomplete shedding of cloud cavitation and significant wake fluctuations. In Figure 8, the sheet cavitation gradually extends downstream, while large-scale cloud cavitation begins to develop in the hydrofoil wake. At mid-chord length in Figure 8, shock wave interactions with the cavitation boundary induce sheet cavitation rupture, causing fragmented cavities to detach from the hydrofoil surface and coalesce into cloud cavitation. By Figure 8, the sheet cavitation nearly disappears, and the fragmented cavities aggregate into fully developed cloud cavitation structures.
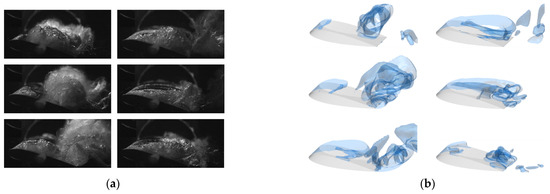
Figure 8.
Comparison between experimental and numerical simulations of unsteady bubble structure evolution (time interval 0.167 T, α1 = 10%, σ1 = 1.4). (a) Experimental. (b) Simulation.
4.1.2. Fluctuation Characteristics of Hydrofoil Lift and Drag Forces
Figure 9 illustrates five periodic cycles of the hydrofoil lift and drag coefficients (Cd and Cl, both represented in absolute values). The fluctuation characteristics of Cl and Cd exhibit similar trends. Taking the lift coefficient Cl as an example, it initially undergoes a sustained increase until reaching a local maximum, followed by an abrupt transition point. Subsequently, Cl gradually declines to a local minimum, after which it initiates another ascending-descending cycle. Notably, a distinct trough emerges within the evolutionary cycle of Cl. This phenomenon arises when shock waves generated at the hydrofoil trailing edge propagate toward the sheet cavitation, triggering cavitation fragmentation and inducing transient fluctuations in the hydrodynamic forces acting on the hydrofoil surface.
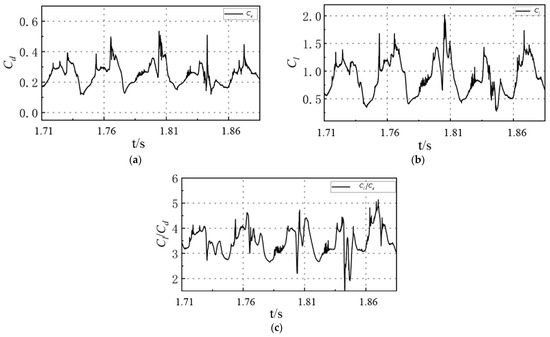
Figure 9.
Variation in lift and drag coefficients of a hydrofoil with quasi-periodic changes; (a) drag coefficient; (b) lift coefficient; (c) lift-to-drag coefficient ratio.
During the cavitation evolution process of the hydrofoil, shock waves disrupt sheet cavitation and trigger the shedding of cloud cavitation, resulting in significant variations in hydrodynamic forces. To further investigate cavitation dynamics, the following analysis integrates experimental data from pressure monitoring points to examine pressure variations and their underlying causes. The pressure values on the hydrofoil suction surface are non-dimensionalized through the pressure fluctuation coefficient , defined as:
where p is the monitoring point pressure, p∞ is the outlet pressure.
Figure 10 compares the periodic pressure fluctuation distributions at monitoring points P1, P2, P3, and P4, where the minimum values of the pressure coefficient () indicate local pressures below the saturated vapor pressure (signifying cavitation coverage at the monitoring points), while rising values reflect cavitation detachment. As shown in Figure 10, the numerically simulated pressure fluctuations exhibit periodic temporal variations consistent with experimental trends. Spatially, the pressure fluctuation amplitude progressively decreases from P1 to P4 along the hydrofoil’s mainstream direction, accompanied by a gradual reduction in the mean . Temporally, a distinct phase lag exists among the monitoring points: the pressure coefficient at P4 initiates the rise first, followed sequentially by P3, P2, and P1.
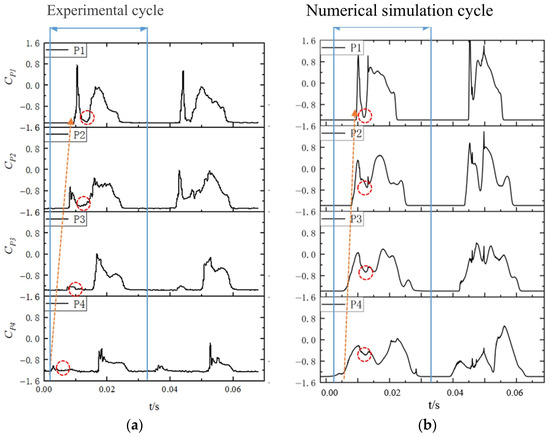
Figure 10.
Pressure fluctuation coefficients at monitoring points (σ1 = 1.4). (a) Test results. (b) Numerical simulation results.
Numerical simulations systematically overpredict pressure fluctuation amplitudes compared to experimental measurements. This discrepancy arises because numerical monitoring points are defined at microscale grid nodes, whereas pressure sensors in experiments spatially average fluctuations over their finite sensing areas, thereby attenuating high-frequency components induced by small-scale cavitation structures. The blue-shaded region in Figure 10 demarcates a full cavitation cycle. Initially, all four points exhibit low . values due to cavitation coverage. As the cycle progresses, adverse pressure gradients at the hydrofoil trailing edge generate upstream-propagating shock waves. These shocks sequentially sever the sheet cavitation, first triggering a sharp pressure spike at P4, followed by delayed spikes at P3, P2, and P1 as the shock propagates upstream. Detached cloud cavitation subsequently migrates downstream, modulating the near-surface pressure field and inducing prolonged secondary fluctuations.
Time-domain pressure data from points P3 and P4 (near cloud cavitation shedding regions) were analyzed via Fast Fourier Transform (FFT), with the resultant power spectral density (PSD) shown in Figure 11. These two points were deliberately selected because the pressure fluctuations in this region are most intense and representative of the cavitation-induced oscillations. The PSD analysis reveals the dominant frequency components associated with the periodic shedding and collapse of cloud cavities, thereby providing critical insights into the flow–acoustic coupling mechanisms. According to Batchelor’s theory, the turbulent energy cascade in the inertial subrange should obey the −7/3 power law. Under the condition σ1 = 1.4, the PSD slopes align well with this theoretical scaling. Dominant frequency peaks at 30.15 Hz for both P3 and P4 closely match the measured cavitation shedding frequency of 29.99 Hz, confirming that periodic vortex generation, growth, and collapse at the trailing edge drive synchronized pressure pulsations on the hydrofoil surface. This coherence between vortex dynamics and pressure fluctuations ultimately governs the periodic variations in lift and drag coefficients.

Figure 11.
Pressure power spectral density at the monitoring point; (a) P3; (b) P4.
4.1.3. Vortex Structure Evolution of Hydrofoil Flow Field
Vortex structures represent critical flow field features. To identify vortical regions, Hunt et al. [37] proposed the Q-criterion based on the second invariant of the velocity gradient tensor, defined as
This criterion quantifies the relative dominance of fluid rotation versus deformation. Regions with Q > 0 indicate rotation-dominated flow, while Q < 0 corresponds to deformation-dominated zones. In turbulent cavitating flows, vortical structures exhibit intricate twisting and interconnections. To isolate vortex cores, a threshold of Q = 50,000 s−2 is applied, as shown in Figure 12, revealing cavitation-modulated vortex dynamics. The cavitation evolution profoundly influences both hydrofoil surface flow and wake development. Along the vortex boundaries marked by black dashed lines in Figure 12, distinct turbulent shear layers envelop the cavitation regions. During stages (a)–(d), these shear layers progressively extend toward the trailing edge. Conversely, stages (d)–(f) demonstrate upstream shear layer propagation, consistent with the sheet cavitation evolution patterns in Figure 8. As highlighted by black solid arrows, large-scale vortices emerge near the trailing edge due to cavitation rupture. Throughout the cycle, these vortices migrate downstream with the transition from sheet to cloud cavitation and eventually dissipate.
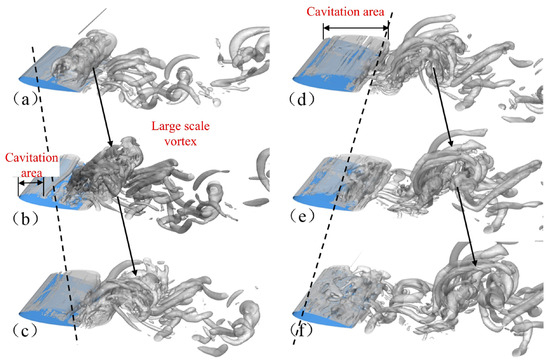
Figure 12.
Three-dimensional vortex structure distribution at a typical non-periodic time instant. (a) 1/6T; (b) 1/3T; (c) 1/2T; (d) 2/3T; (e) 5/2T; (f) T.
4.1.4. Dynamic Mode Decomposition of Hydrofoil Flow Field
Dynamic Mode Decomposition (DMD) was applied to analyze the unsteady cavitating flow under flow–acoustic coupling conditions. This method decomposes the flow field into modes with distinct temporal frequencies, providing spatially and frequency-resolved information. It is particularly effective for capturing the frequency characteristics of cavitating flows and their coupling with acoustic responses.
The evolution of a field, such as the velocity field v (x, y, z, t), can be described by a time series consisting of vectors , where each vector represents the field data at a specific spatial location and discrete time step. By capturing flow field snapshots from time step 1 to N, the following two numerical matrices can be constructed:
Assuming that the time interval between successive snapshots is t, the flow field at time step i + 1, denoted as vi+1, can be approximated by a linear mapping of the previous flow field vi, such that:
where the matrix A contains dynamic information about the temporal evolution of the flow field and captures the behavior of the system over time. The core idea of modal decomposition is to identify the system matrix A and extract its dominant eigenvalues and modes. Based on the above assumptions, Equation (51) can be written as:
When a sufficient number of flow field snapshots have been collected, the sequence is able to capture the dominant features of the flow. At this stage, the sequence becomes linearly dependent, and thus can be expressed as a linear combination of the first N linearly independent vectors,
where , r is the residual of the approximation.
where S is the companion (or projected) matrix, whose eigenvalues approximate those of the original system matrix A. The eigenvalue problem is solved via Singular Value Decomposition (SVD).
The matrix A is approximated by a reduced matrix , which is then subjected to eigenvalue decomposition. The eigenvalues are expressed in logarithmic form, where the real part indicates the modal growth or decay rate , and the imaginary part corresponds to the modal frequency . The dynamic mode can then be expressed as:
To investigate the complex flow characteristics of hydrofoil cavitation, dynamic mode decomposition (DMD) was performed on the flow field data spanning two cavitation cycles, with a total of 1500 instantaneous snapshots collected for the analysis. The sampling data consisted of pressure values on the hydrofoil surface, where the pressure at the first grid layer height above the wall was specifically selected as input to minimize numerical errors. The sampling time interval matched the computational time step of the numerical simulation to ensure accurate decomposition of the flow field dynamics.
Figure 13 presents the eigenvalue distribution derived from dynamic mode decomposition (DMD) of the hydrofoil surface pressure field. The eigenvalues are observed as complex conjugate pairs symmetrically distributed about the imaginary axis, with most eigenvalues lying on or within the unit circle. This configuration confirms the periodic nature of the flow field evolution, consistent with the experimentally observed periodic cavitation shedding under the current operating conditions. Figure 14 displays the modal energy intensity distribution across frequencies for the DMD modes of the hydrofoil pressure field. Notably, modes 2–3, 4–5, 6–7, and 8–9 exist as conjugate pairs. Consequently, the energy distribution is illustrated using the real component of Mode 1 and the even-numbered modes (2, 4, 6, 8), corresponding to frequencies of 0 Hz (mean flow), 31 Hz, 66 Hz, 91 Hz, and 188 Hz, respectively. These frequencies align with dominant flow instabilities, where the 31 Hz mode matches the primary cavitation shedding frequency, while higher-frequency modes reflect turbulence–cavitation interactions and harmonic resonances.
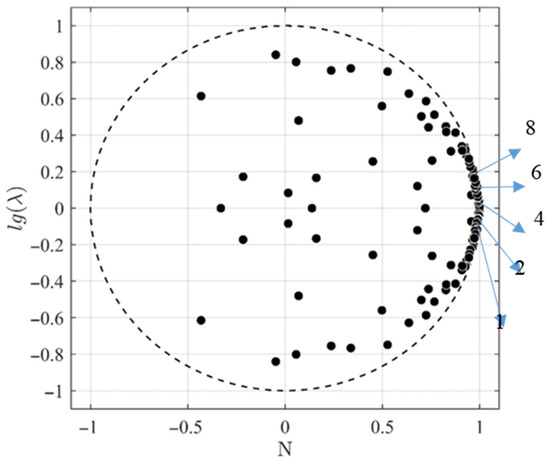
Figure 13.
Distribution of eigenvalues.
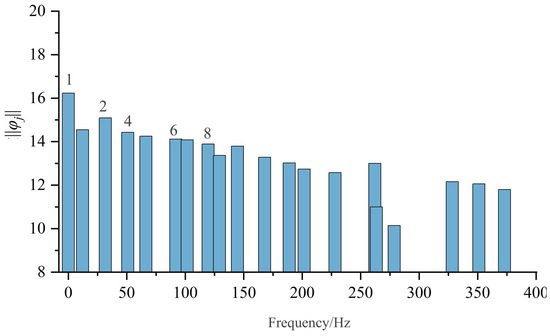
Figure 14.
Distribution of energy for different modes.
Figure 14 displays the modal energy distribution of 20 modes within the 0–400 Hz frequency range, revealing multiple coherent flow structures. High-energy modes are predominantly concentrated in the low-frequency range. To further characterize the flow field, Figure 15 presents the pressure contours (real components of the complex modes) for the first nine DMD modes of the hydrofoil pressure field, with normalized “mode pressure” derived from the original pressure data. Figure 15a shows the averaged pressure distribution over two cavitation cycles, featuring a low-pressure zone at the hydrofoil leading edge and gradual pressure recovery toward the trailing edge. Figure 15b exhibits a static pressure distribution similar to the mean flow. Higher-order modes (Modes 2–9) progressively reveal complex flow structures: Modes 2–3 (Figure 15c) and Modes 6–7 (Figure 15e) display alternating pressure gradients with significant variations near the trailing edge, particularly in the mid-chord transition region. Modes 4–5 (Figure 15d) and Modes 8–9 (Figure 15f) show pressure minima in the rear half and maxima in the front half of the hydrofoil, corresponding to cloud cavitation shedding and the disappearance of sheet cavitation. These rear-half pressure variations align with the sheet-to-cloud cavitation transition observed earlier, where cloud cavitation shedding drives the pressure fluctuations. Cross-referencing with vorticity and vapor fraction contours confirms that the coherent structures identified by DMD modes spatially match the distributions of sheet and cloud cavitation.
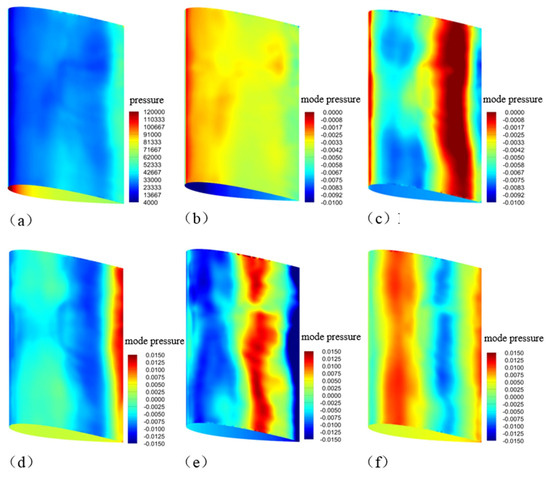
Figure 15.
Distribution of the first 9 modes decomposed by DMD. (a) mean; (b) DMD mode l; (c) DMD mode 2–3; (d) DMD mode 4–5; (e) DMD mode 6–7; (f) mode 8–9.
To further analyze the flow–acoustic coupling mechanism, Table 2 presents the dominant frequencies obtained from different approaches. The experimentally measured cavitation shedding frequency (30.05 Hz) and SPL peak (29.99 Hz) are consistent with the dominant frequency extracted from the FFT of pressure fluctuations (30.15 Hz) and the DMD mode (31 Hz). These results indicate that the periodic cloud cavitation shedding governs the unsteady dynamics of the hydrofoil flow, which directly manifests in the pressure fluctuations and radiated acoustic responses.

Table 2.
Comparison of dominant frequencies between simulation and experiment.
4.2. Hydrofoil Cavitation–Vortex Energy Conversion Analysis
Previous investigations of cavitation and vorticity distributions in the flow field reveal that cavitation structures are consistently accompanied by vortices, and their evolution plays a critical role in vortical development. In unsteady flow analyses, vorticity distributions in cavitating flows exhibit intense spatial heterogeneity and temporal variability. Localized regions of elevated vorticity induce drastic pressure and velocity fluctuations, which in turn reciprocally influence cavitation inception and evolution. Through in-depth analysis of vortical isosurface distributions, it is further demonstrated that cavitation volume pulsations perturb the flow structure. To advance the understanding of cavitation-flow interactions, the vorticity transport equation (Equation (61)) is employed in the following analysis to systematically investigate the interplay between vortical structures and cavitation dynamics.
where the left-hand term represents the temporal variation in vorticity. The right-hand terms are defined as follows: the first term (vortex stretching and tilting) arises from velocity gradient variations; the second term (dilatation/compression) relates to fluid volume changes; the third term (baroclinic torque) originates from density gradient variations in the flow field; the fourth term (viscous diffusion) accounts for laminar viscous diffusion of vorticity at fluid boundaries. Under high Reynolds number conditions, the viscous diffusion term becomes negligible compared to the other terms in vorticity transport.
Figure 16 presents the cavitation–vortex energy transfer mechanisms at the hydrofoil cross-section (Z = 5 mm), including spatial distributions of vapor volume fraction (vapor-vof), Q-criterion-based vortical structures, and the four terms on the right-hand side of Equation (49) at sequential time instants. The vorticity magnitude is color-coded with signed values to denote rotational direction (positive/negative). The contour labels are defined as: vapor-vof (vapor volume fraction), Q Criterion (Q-value), vortex stretching (stretching/tilting term), vortex dilatation (dilation/compression term), baroclinic torque (density-gradient-driven term), and viscous diffusion (viscous term). Observations reveal that regions of elevated vorticity magnitude predominantly localize at vapor-liquid interfaces, the hydrofoil surface, and wake regions. The results indicate that vorticity mainly concentrates at vapor–liquid interfaces, on the hydrofoil surface, and in the wake. The vortex stretching/tilting term is most pronounced at the leading edge of cloud cavitation and in the wake, governing the cavity growth process. The dilatation term appears along the interfaces of sheet and cloud cavitation, with alternating positive and negative values that reflect volume variations and play a decisive role in cavity inception. The baroclinic torque term localizes at the cavity front and around detached cloud cavitation, where density–pressure gradient imbalance intensifies its effect, particularly during cloud collapse. In contrast, viscous diffusion remains negligible throughout the cycle. Overall, vortex stretching dominates cavity growth, dilatation drives cavity inception, and baroclinic torque controls collapse evolution.
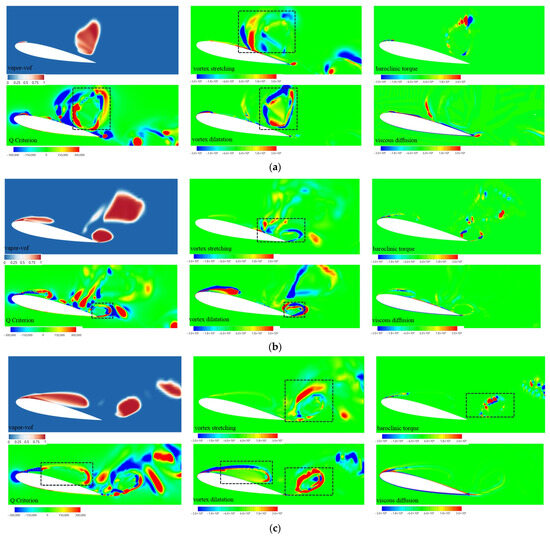
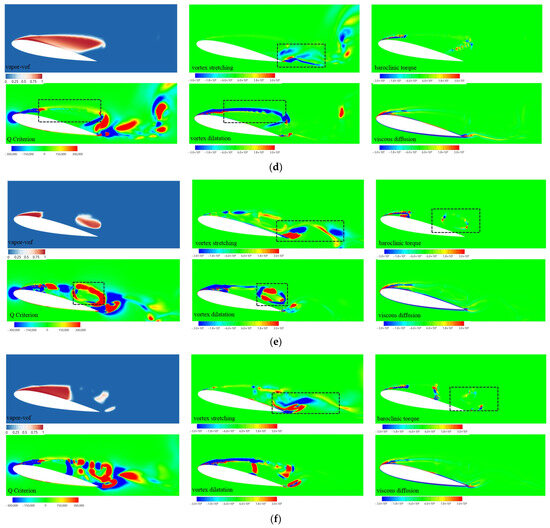
Figure 16.
The void volume fraction, Q value, vortex stretching term, vortex expansion term, baroclinic torque term, and viscous diffusion term on the mid-longitudinal section (a) 1/6T; (b) 1/3T; (c) 1/2T; (d) 2/3T; (e) 5/2T; (f) T.
To quantitatively support these observations, RMS values of the vortex stretching and baroclinic torque terms were evaluated in key regions. In the cavity closure region the RMS magnitude of the vortex stretching/tilting term reaches 0.082, exceeding the baroclinic torque value of 0.061, indicating that stretching dominates vorticity amplification during cavity growth. By contrast, in the wake region, the RMS of the baroclinic torque increases to 0.094, surpassing the stretching term (0.072), which highlights its stronger influence on vortex dynamics during cloud cavitation collapse.
4.3. Analysis of Numerical Simulation Results of Cavitation-Induced Noise
4.3.1. Cavitation-Induced Noise Sound Field Distribution
Figure 17 shows the arrangement of 21 acoustic measurement points around the hydrofoil, where points A1 to A20 are uniformly distributed on a 1 m radius circle centered at the hydrofoil midspan, and point A21 is located 0.15 m upstream of the hydrofoil center, corresponding to the hydrophone position in experiments. Under non-cavitating conditions, flow-induced noise from the hydrofoil primarily originates from load noise. This is computed by solving the flow field and using the obtained surface pressure fluctuations and velocity variations as source terms in the vortex sound equation via a User-Defined Function (UDF) to simulate the radiated acoustic field of load noise. During cavitation, the noise spectrum includes both load noise and cavitation-induced noise. Therefore, the hydrofoil pressure/velocity fluctuations and cavitation volume pulsations are separately extracted as source terms to calculate the load noise radiation and cavitation-pulsation noise.
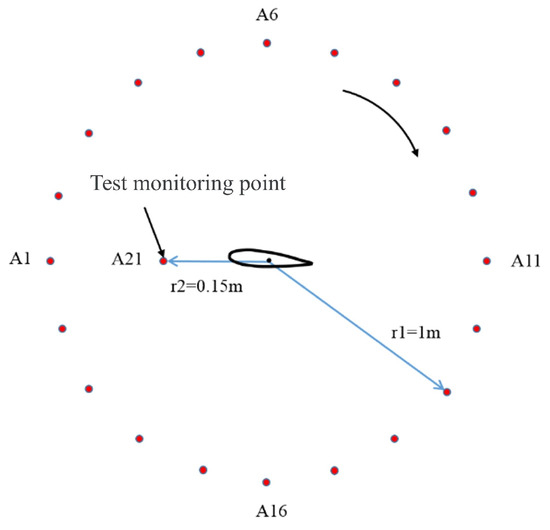
Figure 17.
Acoustic monitoring points.
Figure 18 displays the dipole sound pressure level (SPL) directivity curves for points A1 to A20, showing a figure-eight distribution. The effective SPL gradually increases from the leading edge to the trailing edge, with the maximum SPL occurring between points A6 and A7, near the mid-chord normal direction. Cross-referencing with Figure 8, the location of maximum SPL projects to the mid-chord position on the hydrofoil surface, closely aligned with the sheet cavitation boundary. This is attributed to the transition from sheet to cloud cavitation near the trailing edge, which induces drastic flow restructuring and significant pressure/velocity fluctuations around the hydrofoil.
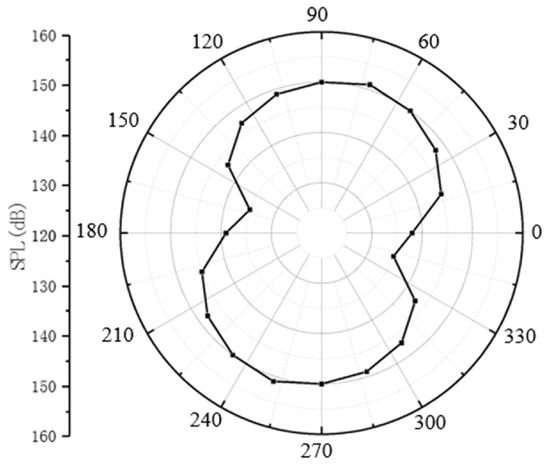
Figure 18.
Dipole sound pressure level.
During the derivation of the vortex sound equation, the two acoustic sources generated by vorticity stretching and kinetic energy distribution arise from variations in velocity, density, vorticity, and other flow parameters. Under adiabatic and isentropic conditions, density fluctuations correlate with pressure fluctuations, where changes in pressure and velocity near the hydrofoil surface induce hydrodynamic force fluctuations. For stationary hydrofoil surface noise studies, the Mach number on the control surface and the normal velocity component of the integration surface are typically constrained to zero. Consequently, Yang et al. [38] simplified the dipole noise formulation to the form shown in Equation (62).
where F is the force acting on the surface of the hydrofoil. The formula indicates that the dipole noise component of the flow-induced noise of the hydrofoil is related to the force acting on the hydrofoil and its change rate.
Figure 19 presents the time-domain analysis of the calculated sound pressure, showing the dipole effective sound pressure at point A6 above the hydrofoil. To investigate the relationship between cavitation flow and noise, the temporal variation in the resultant force coefficient acting on the hydrofoil is also included. For simplicity, the resultant force coefficient is denoted as ct (where ), cl and cd represent the lift and drag coefficients, respectively. The black curve corresponds to ct, while the red solid line represents the time-domain sound pressure. The figure reveals quasi-periodic fluctuations in ct, driven by corresponding quasi-periodic cavitation dynamics and unsteady flow characteristics. Notably, the dipole sound pressure reaches extremal values during specific intervals of each cycle, coinciding with elevated ct magnitudes.
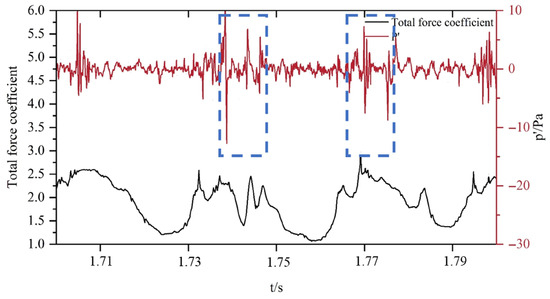
Figure 19.
Comparison of hydrofoil total force coefficient and time-domain dipole sound pressure at location P6.
Figure 20 illustrates the temporal variations in hydrofoil surface pressure and cavitation volume within the same timeframe. Cross-referencing with Figure 18, the cavitation volume reaches a trough at the instant of acoustic pressure extremum. During this phase, the monitored pressure exhibits a marked increase, accompanied by shock-induced rupture of sheet cavitation and subsequent volume reduction. Intense turbulence-driven pressure fluctuations on the hydrofoil surface during this interval induce significant variations in the resultant force coefficient (ct). At other times, ct remains relatively stable, and the absolute dipole sound pressure fluctuations diminish considerably. These observations confirm a correlation between the oscillations of ct and the time-domain dipole sound pressure.
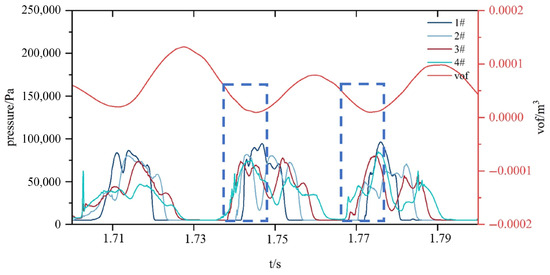
Figure 20.
Pressure pulsation of the hydrofoil and variation in bubble volume.
Figure 21a presents the monopole time-domain sound pressure and cavitation volume fluctuations for hydrofoil cavitating flow at a cavitation number of σ1 = 1.4. The monopole sound pressure, derived by substituting the time-domain cavitation volume (obtained via volume integration during numerical simulations) into Equation (41), exhibits quasi-periodicity in the time-domain plot, corresponding to the periodic cavitation volume pulsations. During cavitation collapse phases, abrupt volume reductions generate multiple noise peaks.

Figure 21.
Monopole sound pressure. (a) Time-domain cavitation monopole noise of hydrofoil. (b) Hydrofoil cavitation monopole noise sound pressure level spectrum.
Figure 21b displays the monopole sound pressure level spectrum, showing a dominant peak of 151 dB at 30.5 Hz, closely matching the experimentally measured noise frequency (29.99 Hz) and cavitation shedding frequency. This frequency alignment confirms that the primary monopole noise component originates from cavitation volume pulsations, demonstrating the significant influence of cavitation dynamics on hydrofoil flow-induced noise.
4.3.2. Sound Source Distribution of Hydrofoil Cavitation Flow Field
Figure 22 and Figure 23 are the time domain sound source and time domain sound pressure distribution at the hydrofoil section (Z = 0.5 C) when σ1 = 1.4, respectively, where the time interval is 1/6T. The extreme values are mainly concentrated on the hydrofoil surface and in the wake, particularly on the suction side. Figure 23 displays the corresponding time-domain sound pressure distribution, which is also primarily located on the suction surface and its wake region.

Figure 22.
Time-domain sound source at the Z = 0.5 C section (σ1 = 1.4).

Figure 23.
Time-domain sound pressure at the Z = 0.5 C section (σ1 = 1.4).
The sound source amplitude varies significantly in space and time. On the suction side, large fluctuations occur with interlaced maxima and minima, while the pressure side shows much weaker variations. At T1–T2, incomplete collapse of the previous cloud cavitation and the growth of leading-edge cavities cause strong fluctuations at the trailing edge. At T3–T4, sheet cavitation dominates and the source intensity is weaker and more localized near the leading edge, corresponding to a relatively stable flow state. At T5–T6, shock-induced rupture and detachment of cloud cavitation at the trailing edge trigger strong instabilities, leading to expanded high- and low-value regions that propagate upstream. These observations indicate that the temporal variations in the sound source are closely related to vortex shedding and cavitation dynamics.
5. Conclusions
To investigate cavitation dynamics and the associated noise over a hydrofoil, a numerical framework was developed that couples a nonlinear cavitation model with the Delayed Detached Eddy Simulation (DDES) turbulence model. Within this framework, cavitation-induced noise was predicted by integrating three-dimensional implicit vortex–sound theory with the unsteady cavitation flow field of the NACA0015 hydrofoil. The main findings are summarized as follows:
- (1)
- The temporal evolution of vapor cavities over a typical cycle shows good agreement with high-speed photographic observations. The lift and drag forces exhibit quasi-periodic oscillations with alternating peaks and troughs, while shock-wave propagation generates sequential pressure spikes at upstream monitoring points. Phase differences in pressure fluctuation coefficients were observed across locations, with numerical amplitudes generally smaller than experimental values. The dominant pressure fluctuation frequency of about 30 Hz corresponds to the cavity shedding cycle, indicating that periodic growth and shedding of trailing-edge vortices drive cyclic pressure variations and force oscillations. Vortex structures were primarily concentrated near liquid–vapor interfaces and in the wake, highlighting the role of cavitation in vortex evolution. Dynamic Mode Decomposition (DMD) of the pressure field further revealed that the dominant modes occur at integer multiples of cavity pulsation frequencies, and the coherent structures resemble multi-scale cavities and vortices.
- (2)
- Analysis of vorticity transport confirmed that vortex stretching is intensified near cavitation regions and contributes to cavity growth, while the baroclinic torque term governs the collapse of cloud cavitation.
- (3)
- Cavitation-induced noise consisted of loading noise and collapse-induced noise. The loading noise displayed dipole-type distribution characteristics linked to surface force fluctuations, whereas monopole-type noise associated with cavity volume pulsations peaked near 30 Hz. The main acoustic sources were concentrated in cloud cavitation shedding regions, confirming the strong coupling between cavitation dynamics and radiated sound.
This study is limited to a single hydrofoil geometry and relies on literature data for validation. Future research will extend the methodology to different fluid machinery systems, integrate more comprehensive experimental validations, and explore advanced turbulence–cavitation–acoustic coupling models to further improve predictive accuracy.
Author Contributions
D.T.: Writing—review and editing, methodology, data curation. X.X.: Writing—original draft, formal analysis. Y.L.: Software, methodology. J.Y.: supervision, resources. Q.S.: investigation, funding acquisition, methodology. All authors have read and agreed to the published version of the manuscript.
Funding
This work was supported by the National Natural Science Foundation of China (Grant No. 52479083), Jiangsu Water Resources Science and Technology Project (Grant No. 2024026).
Data Availability Statement
The raw data supporting the conclusions of this article will be made available by the authors on request.
Conflicts of Interest
Author Yu Lu was employed by the company NR Electric Power Electronics Co., Ltd. The remaining authors declare that the research was conducted in the absence of any commercial or financial relationships that could be construed as a potential conflict of interest.
References
- Cao, W.; Jia, Z.; Zhao, Z.; Zhou, L. Validation and simulation of cavitation flow in a centrifugal pump by filter-based turbulence model. Eng. Appl. Comput. Fluid Mech. 2022, 16, 1724–1738. [Google Scholar] [CrossRef]
- Cheng, X.; Li, Y.; Zhang, S. Effect of inlet sweepback angle on the cavitation performance of an inducer. Eng. Appl. Comput. Fluid Mech. 2019, 13, 713–723. [Google Scholar] [CrossRef]
- Geng, L.; Escaler, X. Assessment of RANS turbulence models and Zwart cavitation model empirical coefficients for the simulation of unsteady cloud cavitation. Eng. Appl. Comput. Fluid Mech. 2020, 14, 151–167. [Google Scholar] [CrossRef]
- Peng, X.X.; Ji, B.; Cao, Y.; Xu, L.; Zhang, G.; Luo, X.; Long, X. Combined experimental observation and numerical simulation of the cloud cavitation with U-type flow structures on hydrofoils. Int. J. Multiphase Flow 2016, 79, 10–22. [Google Scholar] [CrossRef]
- Chen, G.; Wang, G.; Hu, C.; Huang, B.; Gao, Y.; Zhang, M. Combined experimental and computational investigation of cavitation evolution and excited pressure fluctuation in a convergent–divergent channel. Int. J. Multiphase Flow 2015, 72, 133–140. [Google Scholar] [CrossRef]
- Cheng, H.; Long, X.; Ji, B.; Peng, X.; Farhat, M. A new Euler-Lagrangian cavitation model for tip-vortex cavitation with the effect of non-condensable gas. Int. J. Multiph. Flow 2021, 134, 103441. [Google Scholar] [CrossRef]
- Cheng, H.-Y.; Ji, B.; Long, X.-P.; Huai, W.-X.; Farhat, M. A review of cavitation in tip-leakage flow and its control. J. Hydrodyn. 2021, 33, 226–242. [Google Scholar] [CrossRef]
- Sezen, S.; Atlar, M.; Fitzsimmons, P.; Sasaki, N.; Tani, G.; Yilmaz, N.; Aktas, B. Numerical cavitation noise prediction of a benchmark research vessel propeller. Ocean Eng. 2020, 211, 107549. [Google Scholar] [CrossRef]
- Kamali-Moghadam, R.; Javadi, K.; Kiani, F. Assessment of the LES-WALE and Zonal-DES turbulence models in simulation of the flow structures around the finite circular cylinder. J. Appl. Fluid Mech. 2016, 9, 909–923. [Google Scholar] [CrossRef]
- Bai, X.; Cheng, H.; Ji, B. LES investigation of the noise characteristics of sheet and tip leakage vortex cavitating flow. Int. J. Multiph. Flow 2022, 146, 103880. [Google Scholar] [CrossRef]
- Wang, Z.; Cheng, H.; Ji, B. Euler–Lagrange study of cavitating turbulent flow around a hydrofoil. Phys. Fluids 2021, 33, 112108. [Google Scholar] [CrossRef]
- Li, Z.; Qian, Z.; Ji, B. Transient cavitating flow structure and acoustic analysis of a hydrofoil with whalelike wavy leading edge. Appl. Math. Model. 2020, 85, 60–88. [Google Scholar] [CrossRef]
- Hu, J.; Ning, X.; Zhao, W.; Li, F.; Ma, J.; Zhang, W.; Sun, S.; Zou, M.; Lin, C. Numerical simulation of the cavitating noise of contra-rotating propellers based on detached eddy simulation and the Ffowcs Williams–Hawkings acoustics equation. Phys. Fluids 2021, 33, 115117. [Google Scholar] [CrossRef]
- Kinzel, M.; Lindau, J.; Peltier, L.; Kunz, R.; Sankaran, V. Detached-Eddy simulations for cavitating flows. In Proceedings of the 18th AIAA Computational Fluid Dynamics Conference, Miami, FL, USA, 25–28 June 2007. [Google Scholar]
- Sedlar, M.; Ji, B.; Kratky, T.; Rebok, T.; Huzlik, R. Numerical and experimental investigation of three-dimensional cavitating flow around the straight NACA2412 hydrofoil. Ocean Eng. 2016, 123, 357–382. [Google Scholar] [CrossRef]
- Qin, X.; Chen, Y.; Feng, X.; Shao, X.; Deng, J. A numerical investigation concerning wall-nucleation effects of the inception of sheet cavitation. Int. J. Multiph. Flow 2025, 185, 105142. [Google Scholar] [CrossRef]
- Kumar, P.; Kadivar, E.; el Moctar, O. Experimental study of cavitation control on a hydrofoil with bio-inspired riblets using proper orthogonal decomposition. Ocean. Eng. 2025, 334, 121500. [Google Scholar] [CrossRef]
- Lighthill, M.J. On sound generated aerodynamically I. General theory. Proc. R. Soc. A Math. Phys. Eng. Sci. 1952, 211, 564–587. [Google Scholar]
- Qian, Z.H.; Han, H.; Zeng, Y.S.; Peng, X.X.; Luo, X.W. Universal law for identifying the singing vortex. Int. J. Multiph. Flow 2024, 181, 104993. [Google Scholar] [CrossRef]
- Williams, J.F.; Hawkings, D.L. Sound generation by turbulence and surfaces in arbitrary motion. Philos. Trans. R. Soc. London Ser. A Math. Phys. Sci. 1969, 264, 321–342. [Google Scholar]
- Seol, H.; Suh, J.-C.; Lee, S. Development of hybrid method for the prediction of underwater propeller noise. J. Sound Vib. 2005, 288, 345–360. [Google Scholar] [CrossRef]
- Wei, A.; Wang, S.; Gao, X.; Qiu, L.; Yu, L.; Zhang, X. Investigation of unsteady cryogenic cavitating flow and induced noise around a three-dimensional hydrofoil. Phys. Fluids 2022, 34, 042120. [Google Scholar] [CrossRef]
- Sakamoto, N.; Kamiirisa, H. Prediction of near field propeller cavitation noise by viscous CFD with semiempirical approach and its validation in model and full scale. Ocean Eng. 2018, 168, 41–59. [Google Scholar] [CrossRef]
- Sun, T.; Ding, Y.; Huang, H.; Xie, B.; Zhang, G. Numerical study on the effects of modulated ventilation on unsteady cavity dynamics and noise patterns. Phys. Fluids 2021, 33, 123307. [Google Scholar] [CrossRef]
- Powell, A. Theory of vortex sound. J. Acoust. Soc. Am. 1964, 36, 177. [Google Scholar] [CrossRef]
- Howe, M.S. Contributions to the theory of aerodynamic sound, with application to excess jet noise and the theory of the flute. J. Fluid Mech. 2006, 71, 625. [Google Scholar]
- Si, Q.; Ali, A.; Yuan, J.; Fall, I.; Muhammad Yasin, F. Flow-induced noises in a centrifugal pump: A review. Sci. Adv. Mater. 2019, 11, 909. [Google Scholar] [CrossRef]
- Si, Q.; Ali, A.; Liao, M.; Yuan, J.; Gu, Y.; Yuan, S.; Bois, G. Assessment of cavitation noise in a centrifugal pump using acoustic finite element method and spherical cavity radiation theory. Eng. Appl. Comput. Fluid Mech. 2023, 17, 2173302. [Google Scholar] [CrossRef]
- Nishino, T.; Roberts, G.T.; Zhang, X. Unsteady RANS and detached-eddy simulations of flow around a circular cylinder in ground effect. J. Fluids Struct. 2008, 24, 18–33. [Google Scholar] [CrossRef]
- Spalart, P.R.; Deck, S.; Shur, M.L.; Squires, K.D.; Strelets, M.K.; Travin, A. A new version of detached-eddy simulation, resistant to ambiguous grid densities. Theor. Comput. Fluid Dyn. 2006, 20, 181–195. [Google Scholar] [CrossRef]
- ANSYS Inc. ANSYS Fluent User’s Guide; ANSYS Inc.: Canonsburg, PA, USA, 2021. [Google Scholar]
- Nicoud, F.; Ducros, F. Subgrid-scale stress modelling based on the square of the velocity gradient tensor. Flow Turbul. Combust. 1999, 62, 183–200. [Google Scholar] [CrossRef]
- Žnidarčič, A.; Mettin, R.; Dular, M. Modeling cavitation in a rapidly changing pressure field—Application to a small ultrasonic horn. Ultrason. Sonochem. 2015, 22, 482–492. [Google Scholar] [CrossRef] [PubMed]
- Sagaut, P. Large eddy simulation for incompressible flows: An introduction. Meas. Sci. Technol. 2001, 12, 1745. [Google Scholar] [CrossRef]
- Kornhaas, M.; Sternel, D.C.; Schfer, M. Influence of time step size and convergence criteria on large eddy simulations with implicit time discretization. In Quality and Reliability of Large-Eddy Simulations; Springer: Dordrecht, The Netherlands, 2008; Volume 12, pp. 119–130. [Google Scholar]
- Qiu, N. Study on Cavitation Erosion Test of Pump Impeller Material. Master’s Thesis, Zhejiang University, Hangzhou, China, 2016. [Google Scholar]
- Hunt, J.C.R.; Wray, A.A.; Moin, P. Eddies, streams, and convergence zones in turbulent flows. In Center for Turbulence Research Proceedings of the Summer Program; Stanford University: Stanford, CA, USA, 1988; Volume 1, pp. 193–208. [Google Scholar]
- Yang, C.; Zhang, J.; Huang, Z. Numerical study on cavitation-vortex-noise correlation mechanism and dynamic mode decomposition of a hydrofoil. Phys. Fluids 2022, 34, 125105. [Google Scholar] [CrossRef]
Disclaimer/Publisher’s Note: The statements, opinions and data contained in all publications are solely those of the individual author(s) and contributor(s) and not of MDPI and/or the editor(s). MDPI and/or the editor(s) disclaim responsibility for any injury to people or property resulting from any ideas, methods, instructions or products referred to in the content. |
© 2025 by the authors. Licensee MDPI, Basel, Switzerland. This article is an open access article distributed under the terms and conditions of the Creative Commons Attribution (CC BY) license (https://creativecommons.org/licenses/by/4.0/).