Article

GIS-Based Multi-Criteria Assessment of Managed Aquifer Recharge (MAR) Zones Using the Analytic Hierarchy Process (AHP) Method in Southern Kazakhstan

1
Ahmedsafin Institute of Hydrogeology and Environmental Geosciences, Satbayev University, Almaty 050010, Kazakhstan
2
Division of Water Resources Engineering & Centre for Advanced Middle Eastern Studies, Lund University, 221 00 Lund, Sweden
3
Department of Science, Kazakh National University of Water Management and Irrigation, Taraz 080000, Kazakhstan
*
Author to whom correspondence should be addressed.
Water 2025, 17(18), 2774; https://doi.org/10.3390/w17182774
Submission received: 10 August 2025 / Revised: 6 September 2025 / Accepted: 15 September 2025 / Published: 19 September 2025
(This article belongs to the Section Water Use and Scarcity)

Abstract

Southern Kazakhstan, particularly the Zhambyl Region, is facing increasing groundwater stress due to climate change, degradation of irrigation infrastructure, and unsustainable water use. Despite substantial renewable groundwater reserves (8.33 km3/year), irrigation still relies on ephemeral surface flow. This study delineates priority zones for Managed Aquifer Recharge (MAR) using a GIS-based Multi-Criteria Decision Analysis framework integrated with the Analytic Hierarchy Process (AHP). Nine hydrogeological criteria were incorporated: shallow aquifer depth, groundwater salinity, precipitation, terrain slope, soil texture, land use/land cover, Normalized Difference Vegetation Index (NDVI), drainage density, and lineament density. Each parameter was normalized to a five-class suitability scale and weighted through expert-informed pairwise comparisons. The MAR suitability map identifies about 19% of the region (27,060 km2) as highly favorable for implementation. Field investigations at eleven groundwater sites in 2024 corroborate model results, providing aquifer depth, quality, and infiltration data. The most suitable areas are concentrated on Quaternary alluvial–proluvial fans near the Kyrgyz Alatau foothills and the Talas-Assa interfluve. Three hydrostratigraphic settings were identified: unconfined alluvial aquifers, Neogene–Quaternary unconsolidated sediments, and fractured Carboniferous carbonates. Recommended MAR methods include infiltration galleries, check dams, and injection wells. The proposed approach, validated through consistency analysis (Consistency Ratio ≤ 0.1), demonstrates the applicability of integrated geospatial and field methods for site-specific MAR planning. Strategic MAR deployment could restore productivity to 37,500 ha of degraded irrigated lands and improve groundwater resilience. These findings provide a practical framework for policymakers and water management authorities to optimize groundwater use and enhance agricultural sustainability under changing climatic conditions.

1. Introduction

Amid growing global water stress, assessing groundwater vulnerability and identifying suitable zones for Managed Aquifer Recharge (MAR) has become crucial. Contemporary research documents progressive groundwater aquifer depletion driven by agricultural intensification in many areas of the world. In Kazakhstan, the Zhambyl Region is experiencing acute water stress, with its aquifer systems among Central Asia’s most severely impacted [1,2,3]. MAR—such as controlled infiltration of surface water, runoff, or treated wastewater into aquifers—is a key solution for stabilizing hydrogeological conditions that may be effective in arid Kazakhstan [1].
A comparative analysis of studies in Djibouti [4], northwestern Saudi Arabia [5], and Italy’s Metaponto coastal plain [6] demonstrates the consistent effectiveness of integrating geospatial tools with Multi-Criteria Decision Analysis (MCDA). The Djibouti study utilized a hybrid fuzzy TOPSIS model, highlighting precipitation, slope gradient, and Normalized Difference Vegetation Index (NDVI) as critical parameters. Research in Saudi Arabia applied GIS-Ordered Weighted Average (OWA) techniques, while the Italian case adapted the SINTACS-LU method to quantify coastal aquifer vulnerability. These studies underscore the necessity of combining hydrogeological (e.g., aquifer depth, soil permeability) with socio-environmental factors (land use, water demand), offering transferable frameworks for regions like Zhambyl. MAR implementation can be combined with advanced GIS-MCDA. Studies in Europe include Belgian–Dutch assessments of stormwater infiltration [7] and French GIS-based cost–benefit analysis tools [8]. African assessments reveal continent-scale applicability [9], including Egyptian demonstrations of wastewater reuse potential [10]. Asian research encompasses Chinese–Pakistani site delineation [11], Indian correlation of NDVI with rainwater harvesting [12], and Turkish–Djiboutian fuzzy-AHP-TOPSIS models [4]. Middle Eastern contributions feature Saudi GIS-OWA models aligned with national goals [5] and Jordan’s Wadi Arabah suitability mapping [13]. Central Asian research, specifically Kazakh–German cooperation, has produced region-specific MAR potential assessments for Zhambyl using physical criteria and remote sensing [14]. US and East Asian studies have established standardized protocols for coastal MAR impact assessment [15,16].
A seminal German–Colombian meta-analysis of 63 global case studies [17] has categorized weight assignment methodologies and empirically validated slope gradient, land use classification, and infiltration capacity as universally determinant parameters. This confirms MAR as a data-intensive intervention where context-specific adaptation is critical, emphasizing multi-parameter optimization and local hydrostratigraphic characterization.
Small dams demonstrate considerable potential for sustainable water management and recharge. Studies show that off-channel structures can significantly enhance infiltration and support aquatic ecosystems [18]. Examples from Pakistan document rises in groundwater levels and agricultural productivity [19]. A GIS-based study in Spain estimates that unintentional recharge from small dams accounts for 812 to over 2700 million m3 annually, where infiltration is influenced by lithological permeability and optimal slopes of 5–7% [20]. The concept of energy recharge dams further emphasizes their strategic role in national water management frameworks [21].
Against this background, intensifying water scarcity in southern Kazakhstan and many other arid Central Asian regions demands sustainable groundwater solutions. Although the Zhambyl Region possesses substantial renewable reserves, reliance on ephemeral surface flows undermines irrigation reliability. This study introduces a novel GIS-based MCDA framework integrated with AHP to systematically identify priority MAR zones. It is the first framework tailored to Central Asia, applying nine regionally calibrated criteria and uniquely validated through fieldwork at eleven groundwater sites, including hydrostratigraphic mapping, groundwater salinity measurements, and surveys of water intake structures. The integration of hydrogeological information with remote sensing indices (e.g., NDVI, drainage density) advances methodological rigor and ensures operational feasibility for resource-scarce environments. To further enhance robustness, AHP results are cross-validated through fuzzy multi-criteria evaluation [22,23] and Monte Carlo simulations [24,25], providing both fuzzy logic and stochastic sensitivity perspectives and establishing an unprecedented level of methodological reliability.

2. Materials and Methods

2.1. Study Area

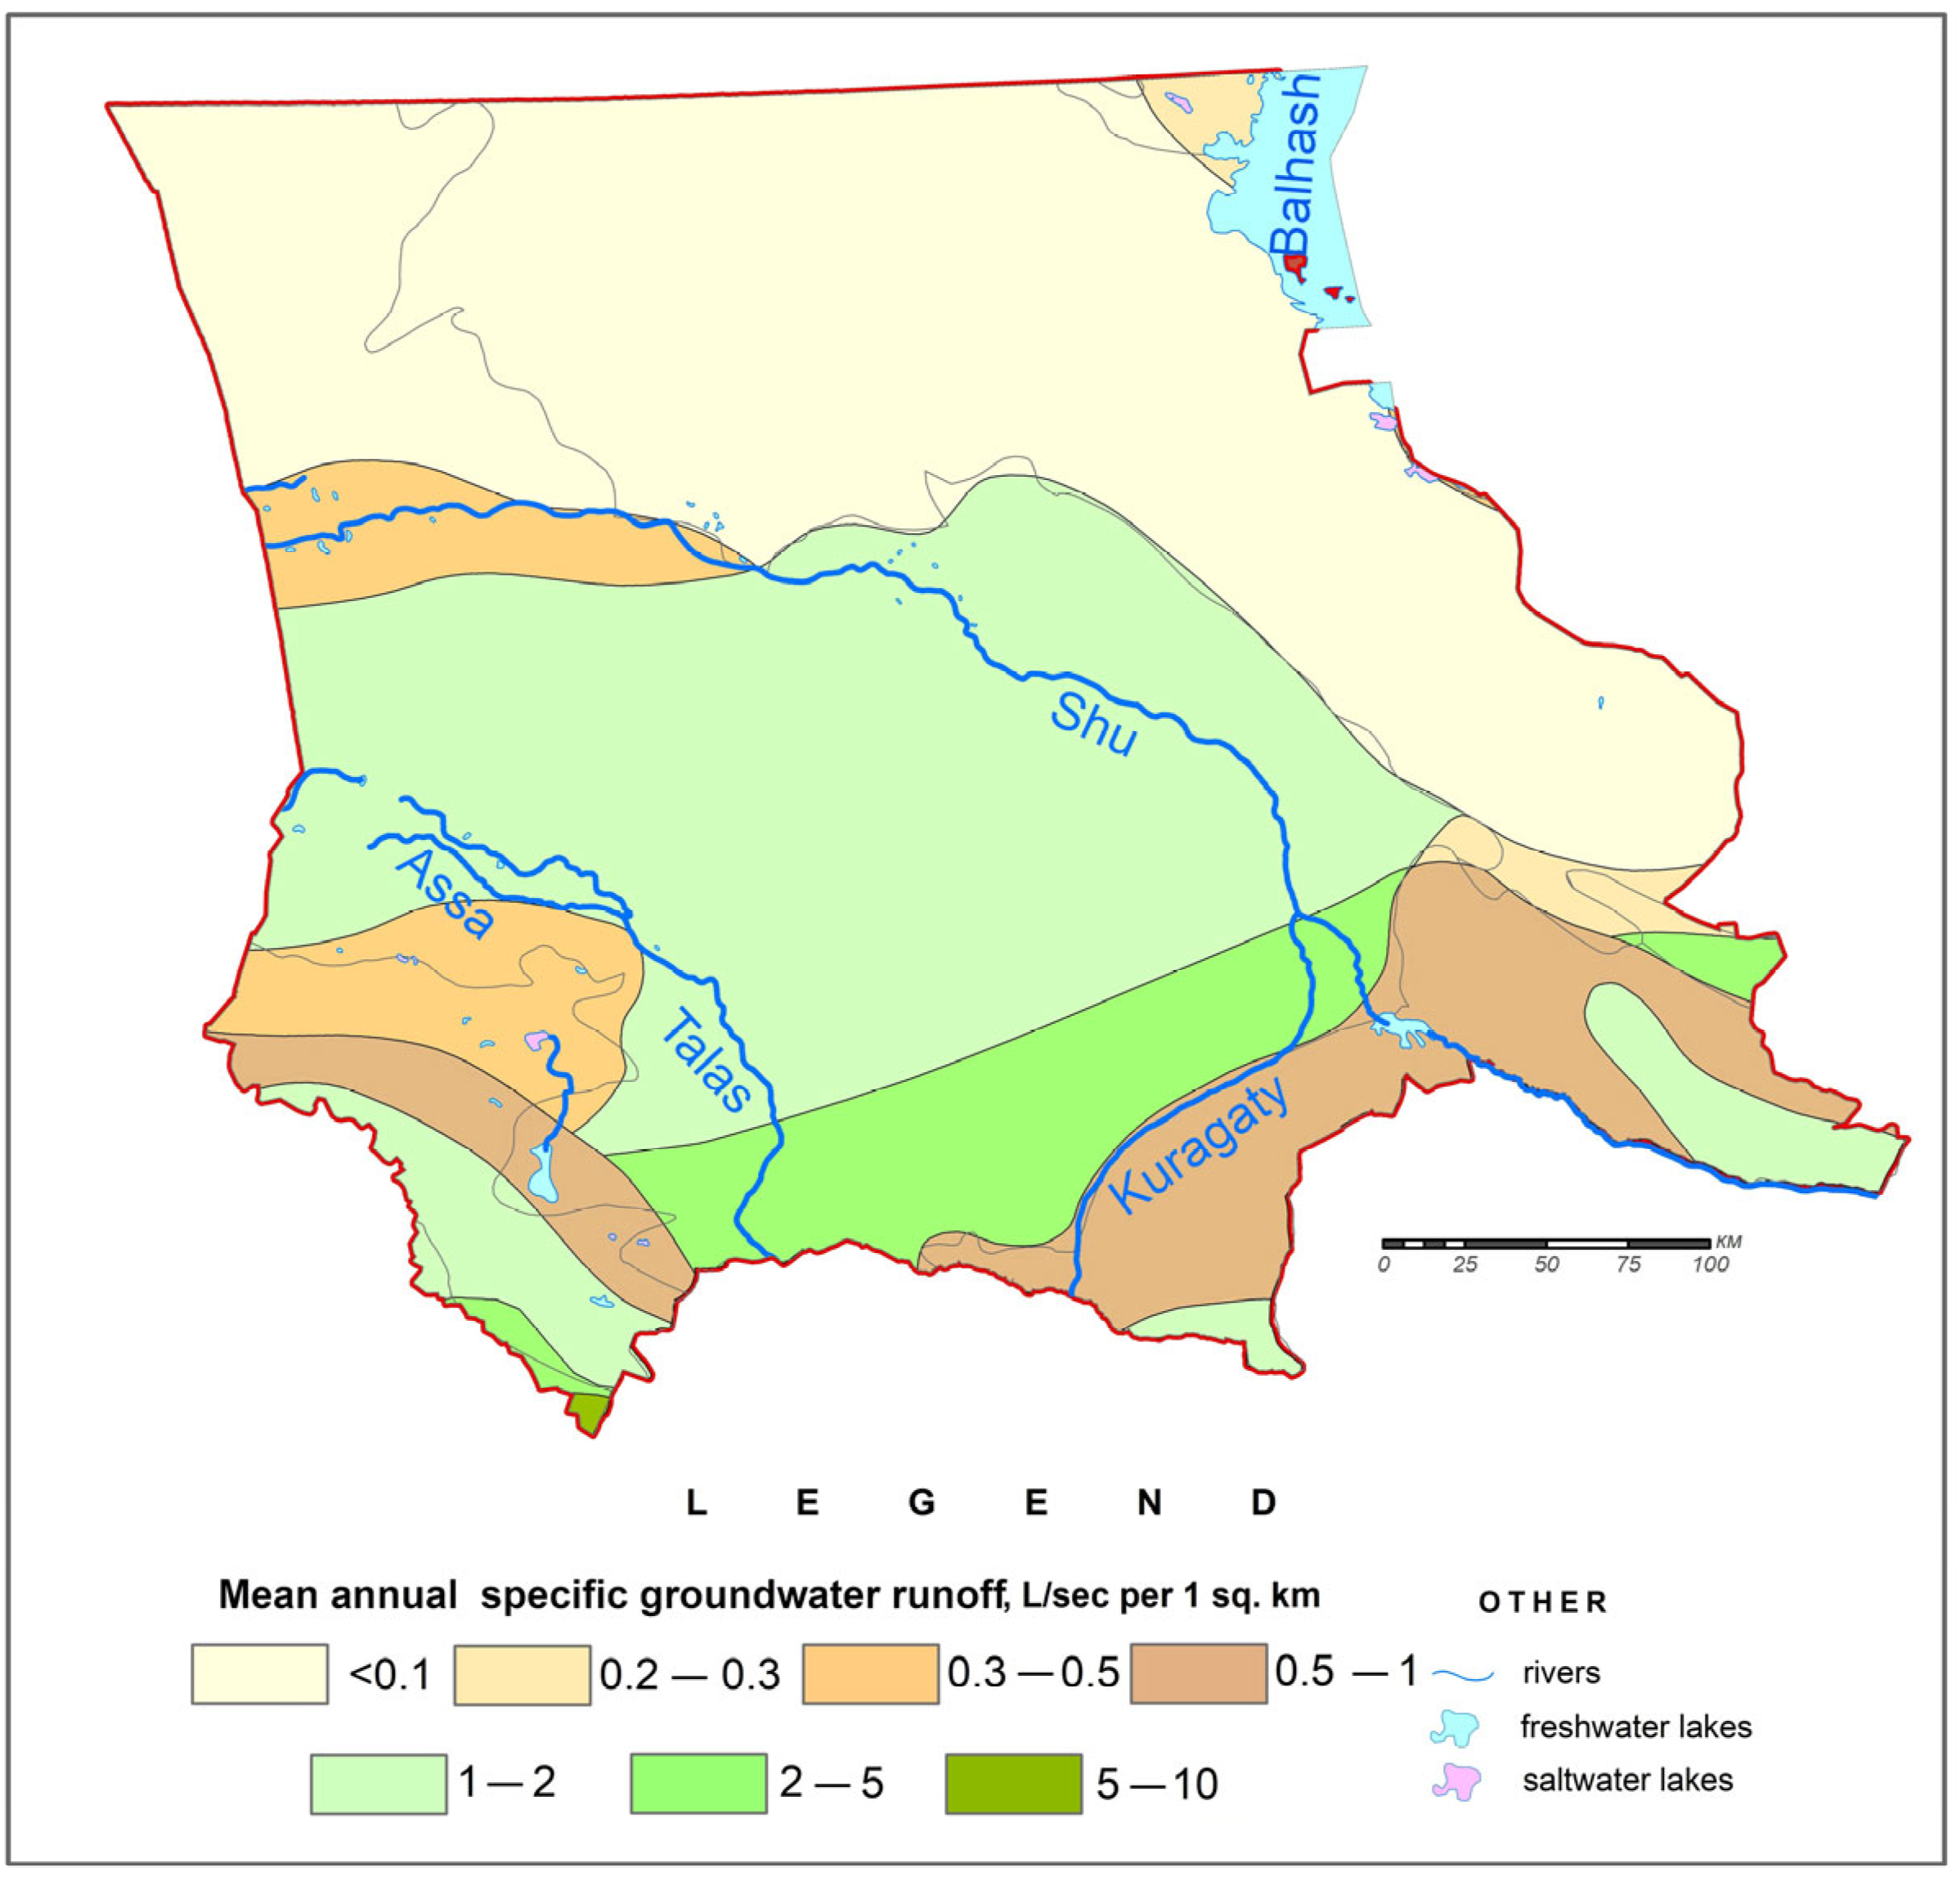
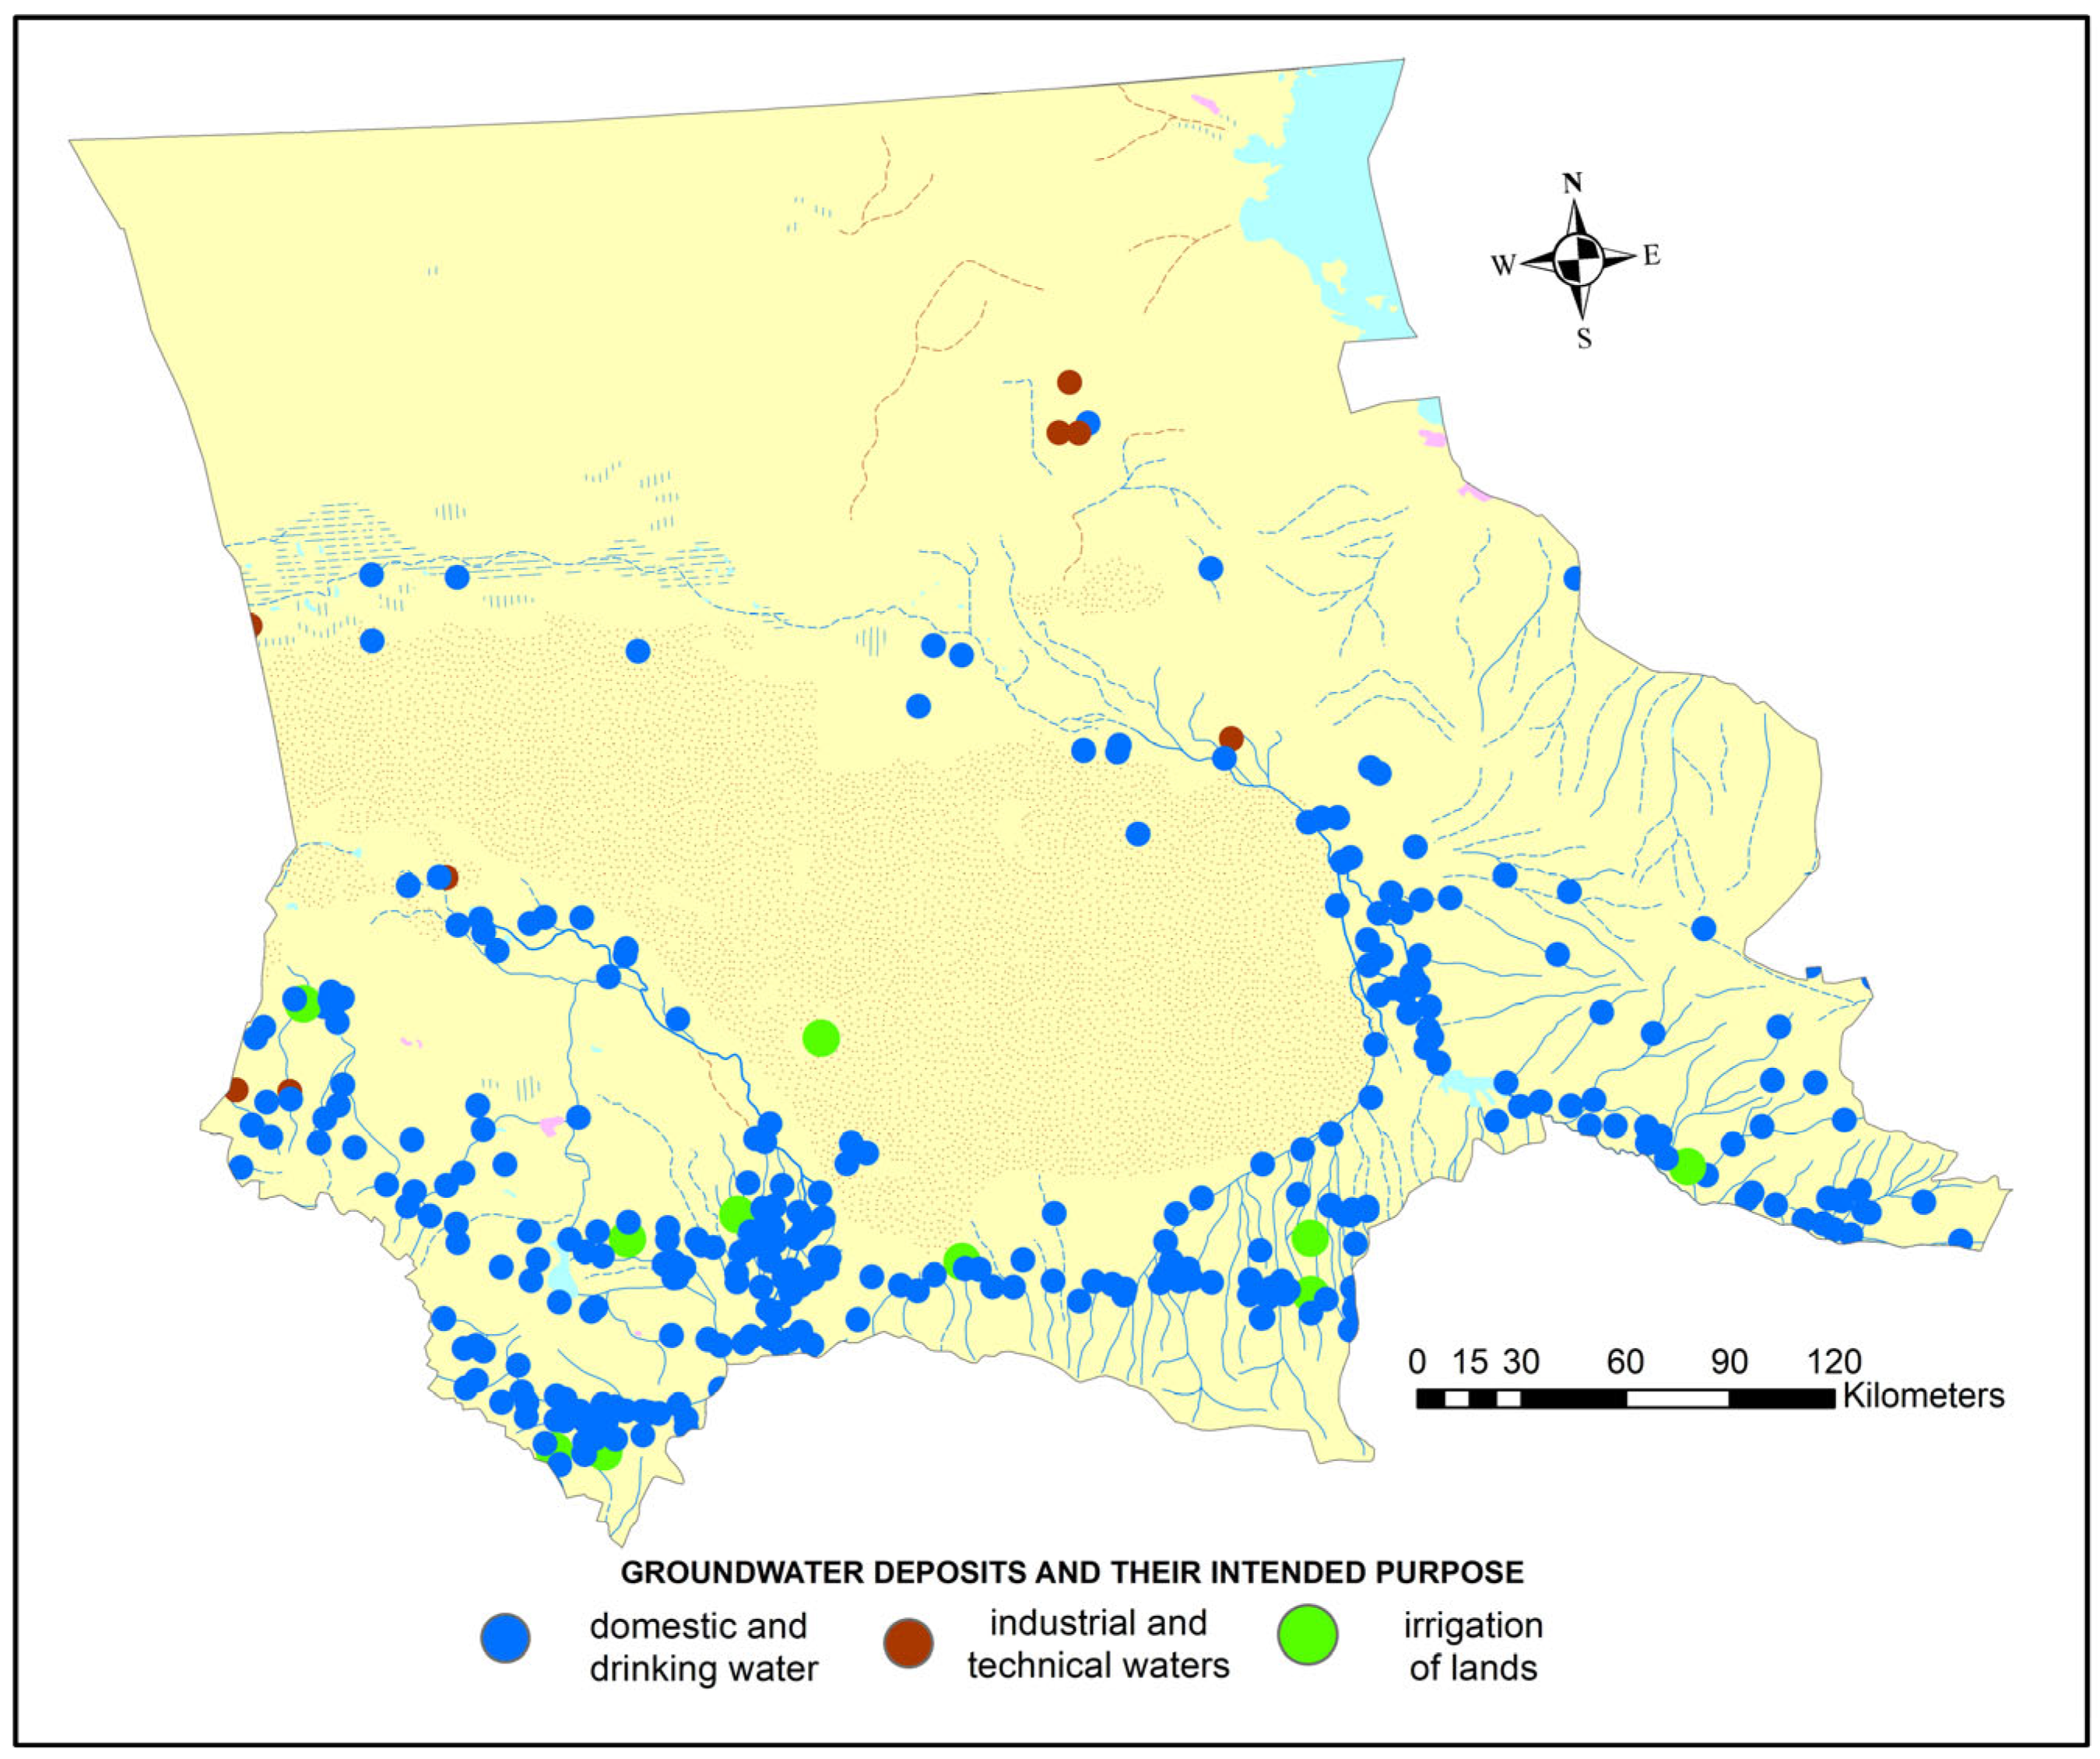
The Zhambyl Region (Figure 1), located in the central part of southern Kazakhstan, features a hydrographic network composed of the Shu, Talas, Kuragaty, and Assa Rivers, along with numerous smaller streams originating on the northern slopes of the Kyrgyz Alatau mountain range. The region is characterized by a sharply continental and arid climate, with extremely hot summers (average July temperatures of 21–25 °C and absolute maxima up to 48 °C) and relatively mild winters for its latitude, although Arctic air incursions can occasionally cause severe frosts down to –50 °C. The duration of the period with average daily temperatures above 0 °C ranges from 240 to 270 days. Annual precipitation is generally low (140–220 mm in the plains), with the lowest amounts (135 mm) near Lake Balkhash and higher values in the foothills (210–330 mm) and mountainous areas of the Kyrgyz Alatau (up to 500 mm). Precipitation is unevenly distributed throughout the year, with the majority falling in the winter–spring period. The average annual river flow is estimated at 4.15 km3/year, with 3.92 km3/year of potentially usable water, decreasing to 2.77 km3/year (2.32 km3/year potentially usable) during low flow periods (Figure 2). The region benefits from favorable hydrogeological conditions and substantial groundwater reserves, particularly within the Quaternary alluvial–proluvial deposits of the Kyrgyz Alatau foothills and the alluvial valleys of the Shu, Talas, Assa, and Kuragaty rivers (Figure 3). These sources are extensively used for drinking water, industrial needs, and irrigation. In contrast, the northern Betpakdala and western Balkhash areas, underlain by pre-Paleozoic and Paleozoic formations, possess limited freshwater resources, with the most viable supplies found in tectonically fractured zones and carbonate structures [2].
Predicted exploitable groundwater resources (with total dissolved solids (TDS) up to 3.0 g/L) reach 8.2 km3/year, including 5.45 km3/year with TDS below 1 g/L (Figure 3). Natural groundwater resources amount to 8.33 km3/year. For irrigation, 11 groundwater deposits have been explored, with reserves of 0.830 km3/year, suitable for both drinking and agricultural use. Major deposits include Asparinskoye (0.047 km3/year), Merkenskoye (0.043 km3/year), and Lugovskoye (0.183 km3/year) in the Kyrgyz Alatau foothills, and Akzharskoye (0.016 km3/year), Talas-Assinskoye (0.083 km3/year), and Biylikolskoye (0.107 km3/year) in the Shu-Sarysu depression. The Shakpakata deposit (0.0003 km3/year), associated with fractured Carboniferous rocks in the foothills of the Karatau Range, is characterized by freshwater with low mineral content (0.3–0.5 g/L) [2].
The region’s irrigated lands span 140.2 thousand ha, of which 124.8 thousand ha are actively cultivated, while 15.4 thousand ha remain unused due to poor irrigation infrastructure (11.25 thousand ha), soil salinization (3.3 thousand ha), waterlogging (0.05 thousand ha), or financial constraints (0.8 thousand ha).
Groundwater depth varies: over 3.0 m (57% of land, low risk), 1.0–3.0 m (38%, moderate risk), and less than 1.0 m (5%, high risk). Groundwater mineralization in irrigated lands indicates that 63% of the area is under fresh water conditions (<1 g/L), 30% under slightly saline (1–3 g/L), and 7% under highly saline conditions (>3 g/L). Reclamation status is rated as good (47%), satisfactory (26%), or poor (27%), with the worst conditions concentrated in Zhambyl, Bayzak, and Talas districts. Currently, surface water remains the sole source for irrigation across all areas [2].
Despite the availability of significant groundwater resources, the Zhambyl region faces increasing water scarcity, especially in the agricultural sector. Climate change, declining surface runoff, and the inefficiency of existing irrigation infrastructure contribute to increasing water stress in the region. According to UNESCO [26], southern Kazakhstan, including the Zhambyl region, is one of the most vulnerable areas in Central Asia in terms of water availability. This problem is exacerbated by the fact that most surface water is used for irrigation, while groundwater, despite its high quality and availability in some areas, is only partially utilized for economic activities.

2.2. Methodology of Research

To develop the depth-to-aquifer map, hydrogeological information from the Atlas of Hydrogeological Maps of the Republic of Kazakhstan [3] was utilized. Geological, hydrogeological, and lithological maps were analyzed to delineate the spatial extent of aquifer units and determine their depths. This integrated analytical approach enabled the creation of an informative and up-to-date cartographic foundation, essential for evaluating the suitability of areas for implementing managed aquifer recharge initiatives.
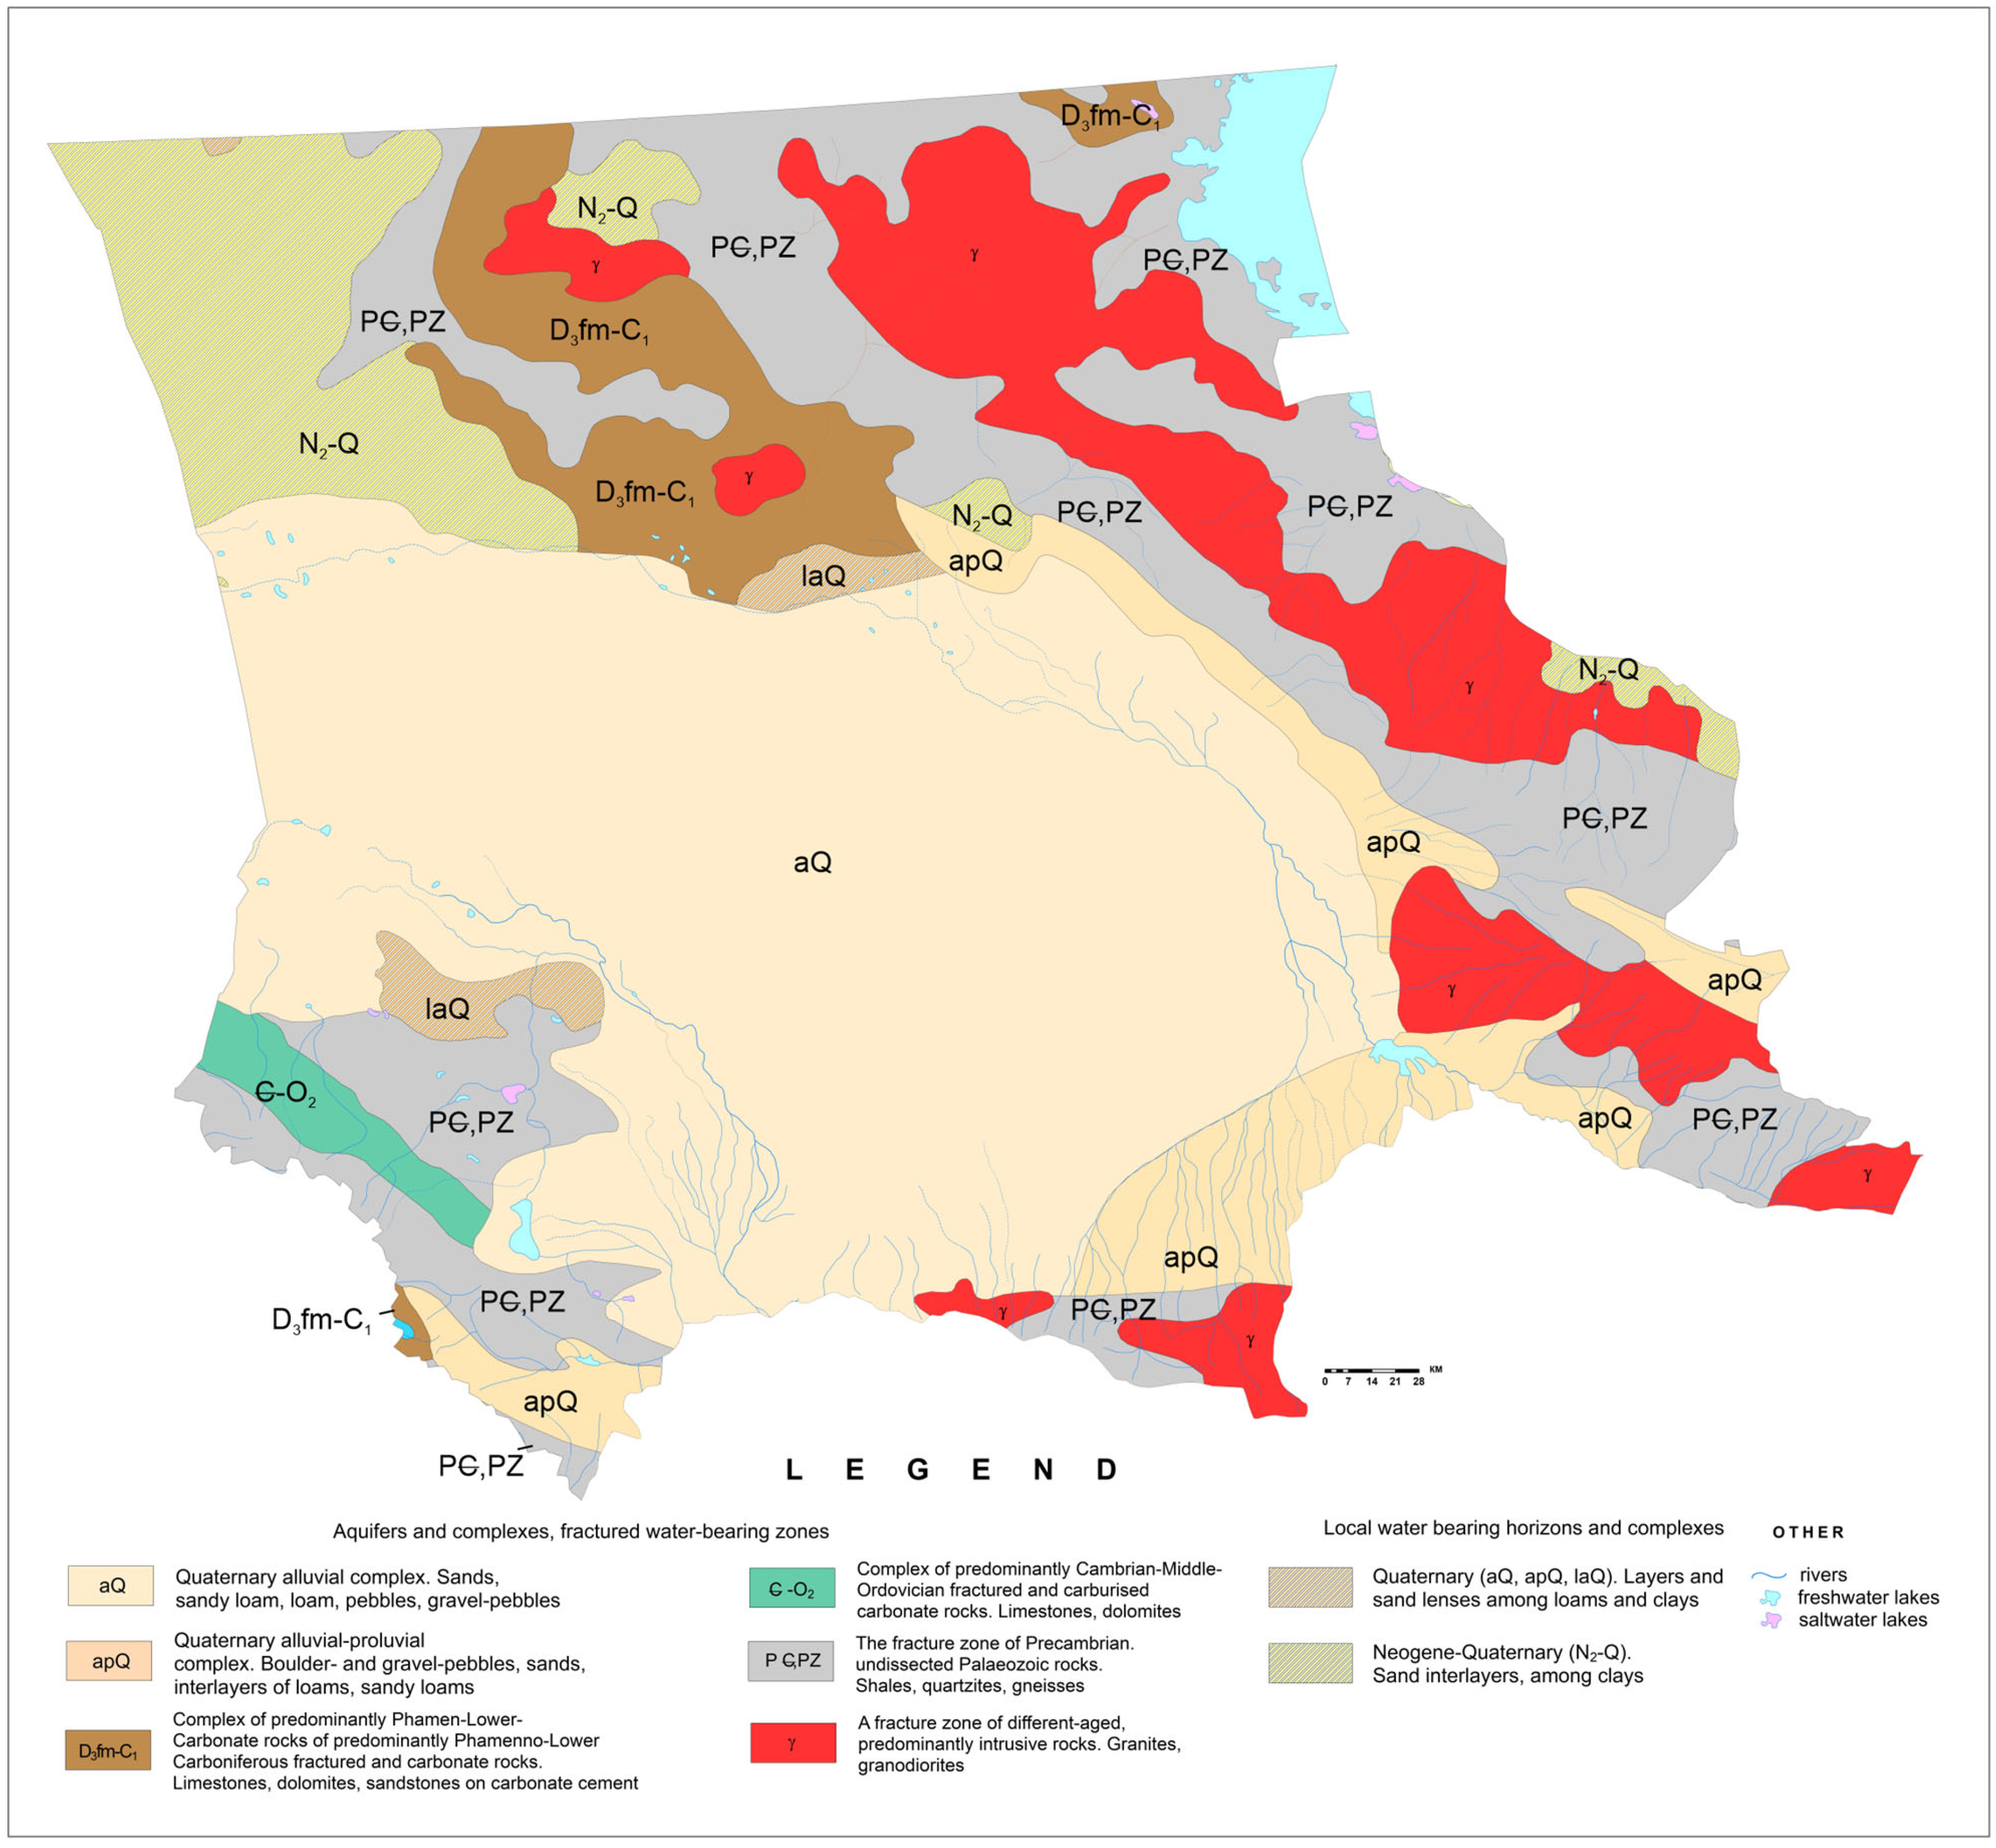
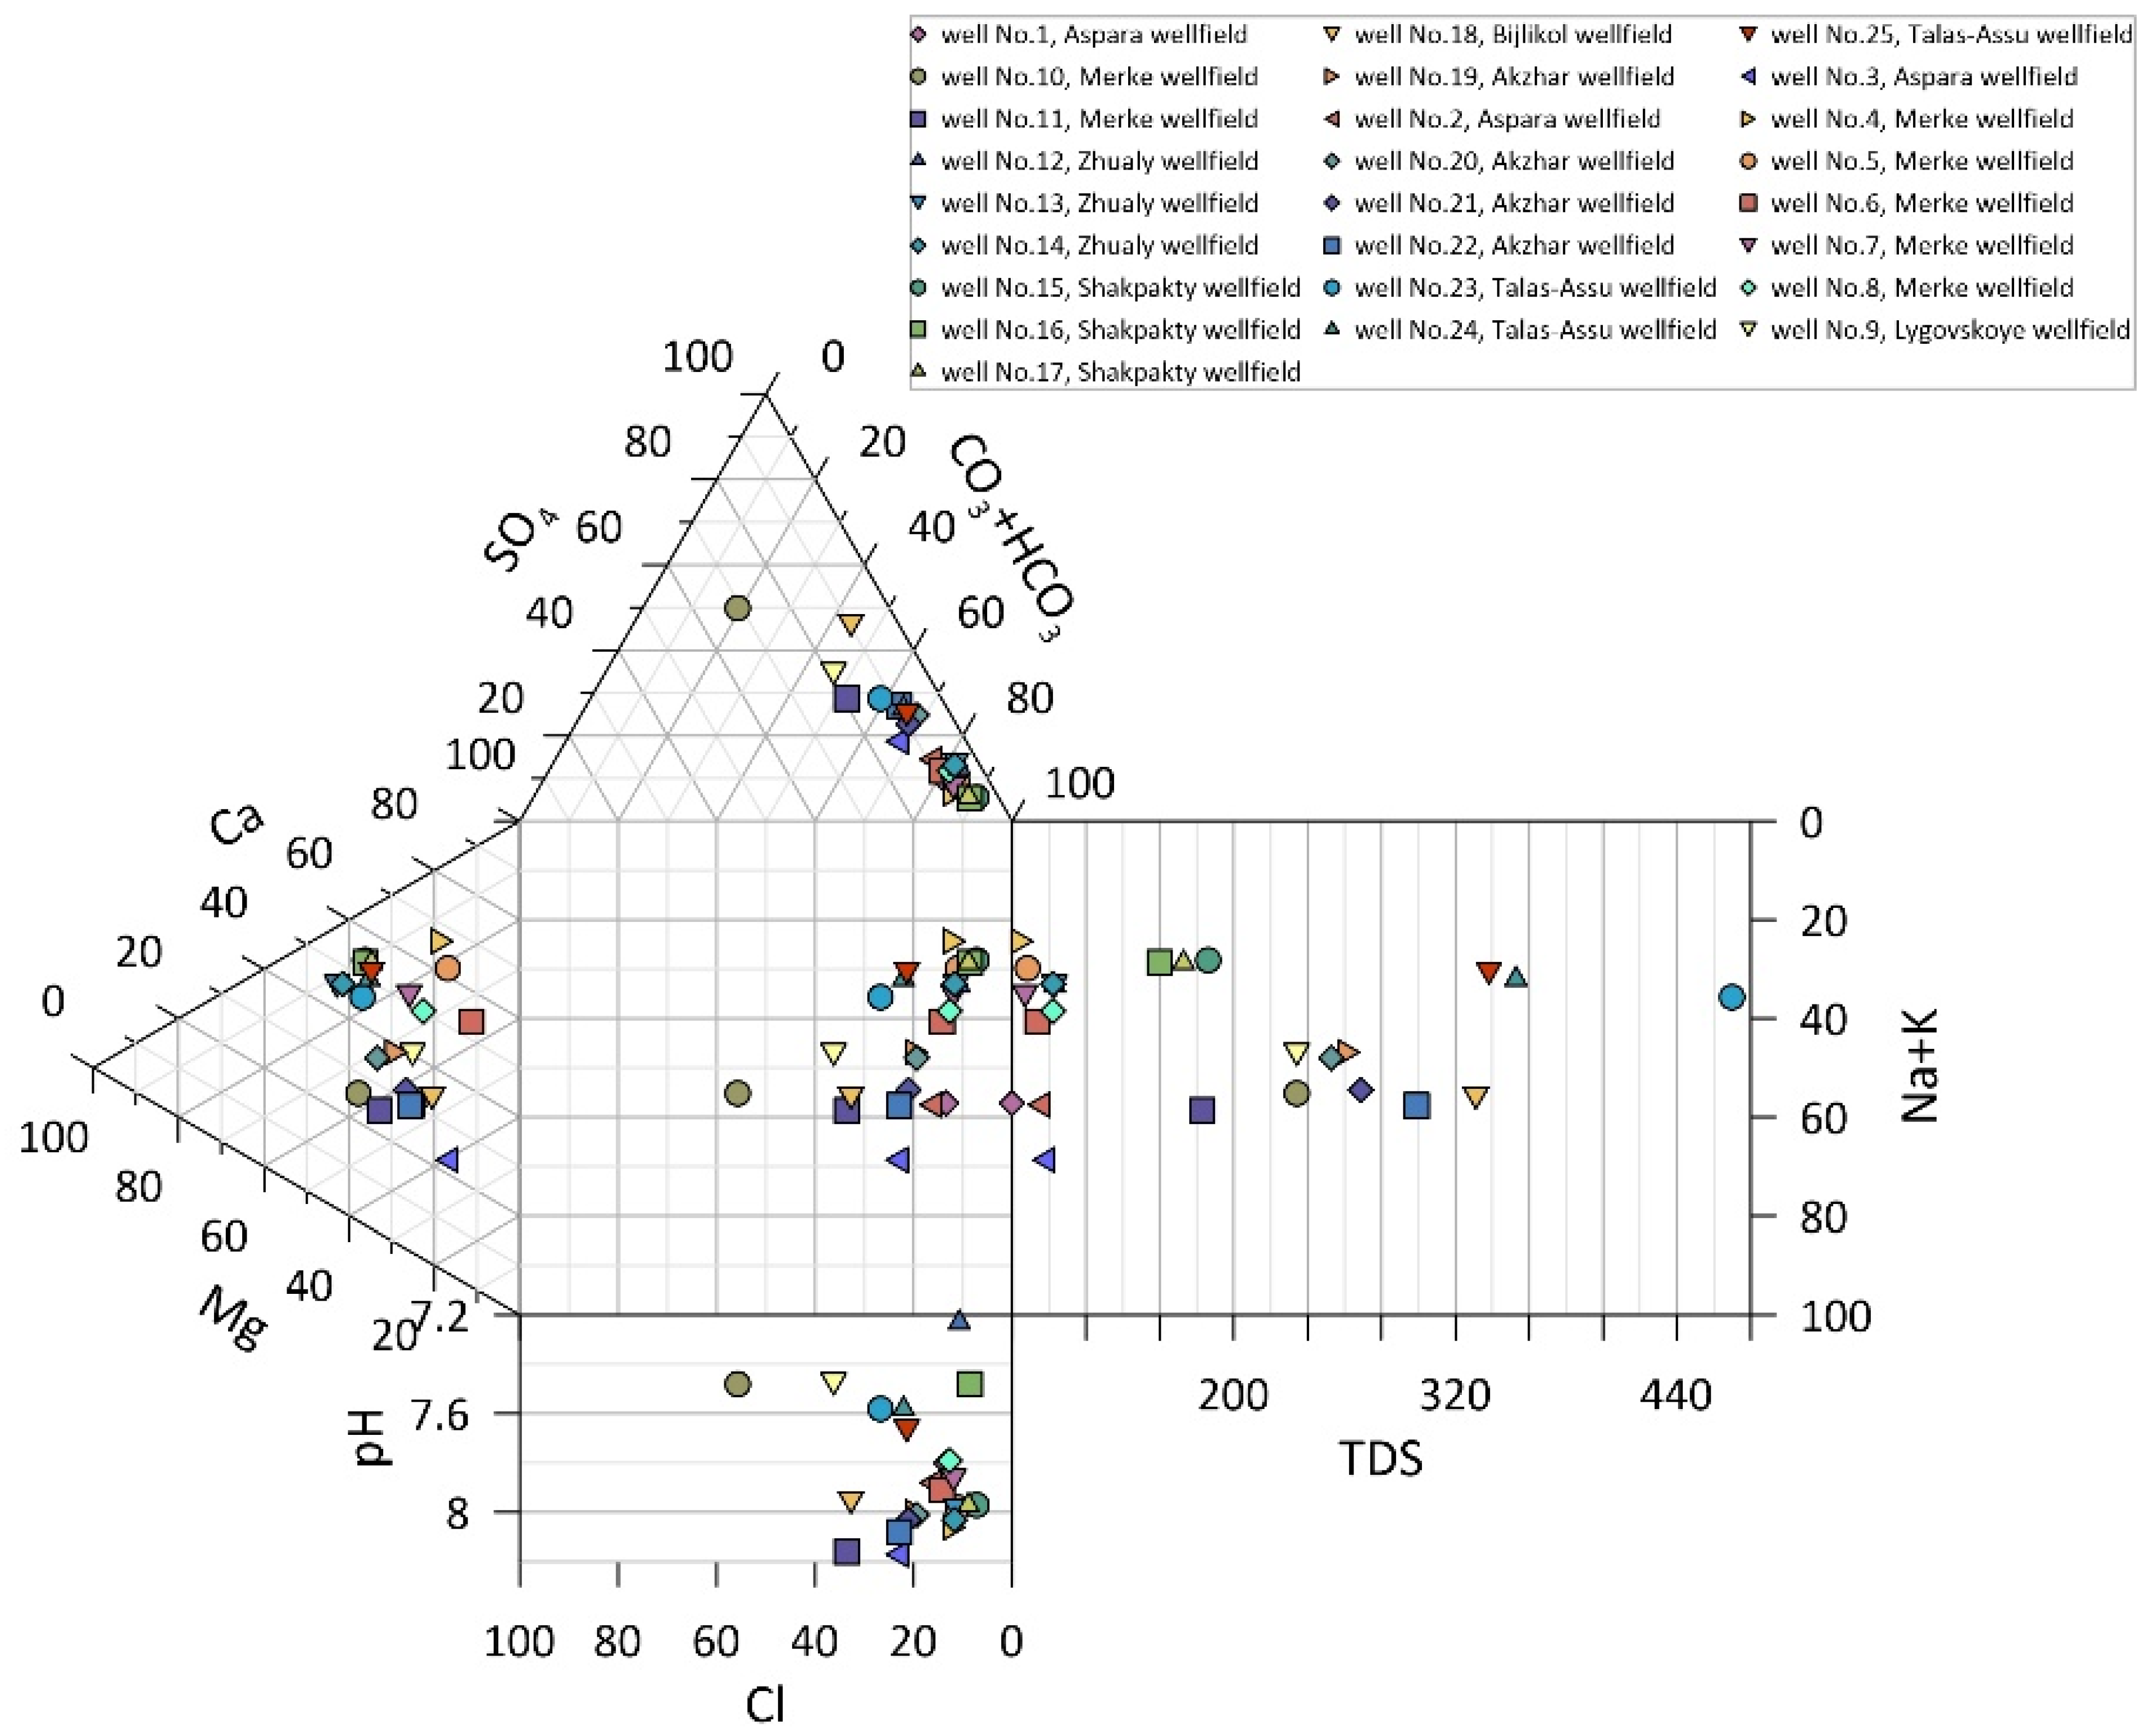
In 2024, regional field investigations were conducted in the Zhambyl Region to assess the current state of groundwater deposits previously explored for agricultural irrigation. The sites investigated are shown in Figure 4, marked with bright green circular symbols. The study area encompassed the Shu-Talas water management basin (Figure 5), where the region’s main irrigated agricultural zones are concentrated. During the fieldwork, hydrogeological boreholes at eleven groundwater deposits were examined, and the results of the chemical analysis of water samples from these boreholes are presented in Figure 6. This included evaluating the sanitary and ecological conditions of the sites, as well as conducting technical inspections of wells to assess their suitability for continued operation.
During the fieldwork, 84 soil samples (28 sites, three samples each: 0.5 m, 1.0 m, and a composite of both intervals) and 25 groundwater samples from boreholes within eleven groundwater deposits were collected, labeled, and georeferenced (Appendix A). Soil samples of 0.5 kg were air-dried, sieved (1–2 mm), homogenized, and stored in polyethylene bags. Groundwater was taken after purging the boreholes for at least 2.5 h or until water clarification, with 5 L collected per borehole; aliquots for cation analysis were filtered (0.45 μm) and acidified with ultrapure HNO3, while non-acidified samples were preserved for anion, TDS, and hydrochemical tests. Analyses were performed in the ISO/IEC 17025 [27]-accredited laboratory of the U.M. Ahmedsafin Institute of Hydrogeology and Environmental Geosciences using standard methods: titrimetric, spectrophotometric (UV-1900i, Shimadzu, Kyoto, Japan), fluorimetric (Fluorat-02-4M, Lumex, Hsinchu, Taiwan), and ICP-OES (ICPE 9820, Shimadzu). Groundwater was analyzed for major ions, trace metals, petroleum hydrocarbons, TDS, pH, and hardness, while soil analyses included granulometric composition, humus and hydrocarbon content, and water–salt extracts for ionic composition, pH, EC, and heavy metals.
The information obtained during the field campaign—including coordinates of wells, condition of water intake structures, and results of chemical analyses of groundwater and soil—was integrated into a geoinformation database consistent with the methodology for creating geoinformation-analytical systems for monitoring irrigated lands. These data were employed to evaluate the suitability of groundwater for regular agricultural irrigation and to support monitoring efforts aimed at assessing the resilience of agro-landscapes to anthropogenic and natural impacts. The Analytical Hierarchy Process (AHP) method was used to evaluate potential Managed Aquifer Recharge (MAR) application areas, using nine maps as evaluation criteria that reflect key environmental, hydrogeological and geographic parameters that influence MAR performance.
As part of the methodological framework, the Normalized Difference Vegetation Index (NDVI) of the Zhambyl Region was derived. NDVI was computed using multispectral imagery from the Landsat 8 and 9 missions acquired during August 2024. This acquisition period was specifically chosen as it represents the driest time of the year in the study area, when most seasonal vegetation has withered, precipitation is minimal, and plant survival largely depends on groundwater discharge. Consequently, residual vegetation detected in August serves as a robust spatial indicator of groundwater-supported ecosystems. A total of 13 cloud-free scenes covering the Zhambyl region were obtained from the USGS Earth Explorer platform (Table 1).
NDVI was subsequently derived in ArcGIS from a seamless mosaic generated using maximum value compositing to ensure consistent spatial coverage and optimal spectral representation. The NDVI is defined as
NDVI = (NIR − RED)/(NIR + RED)
where NIR corresponds to Landsat Band 5 (0.85–0.88 µm, 30 m resolution) and RED corresponds to Landsat Band 4 (0.64–0.67 µm, 30 m resolution)
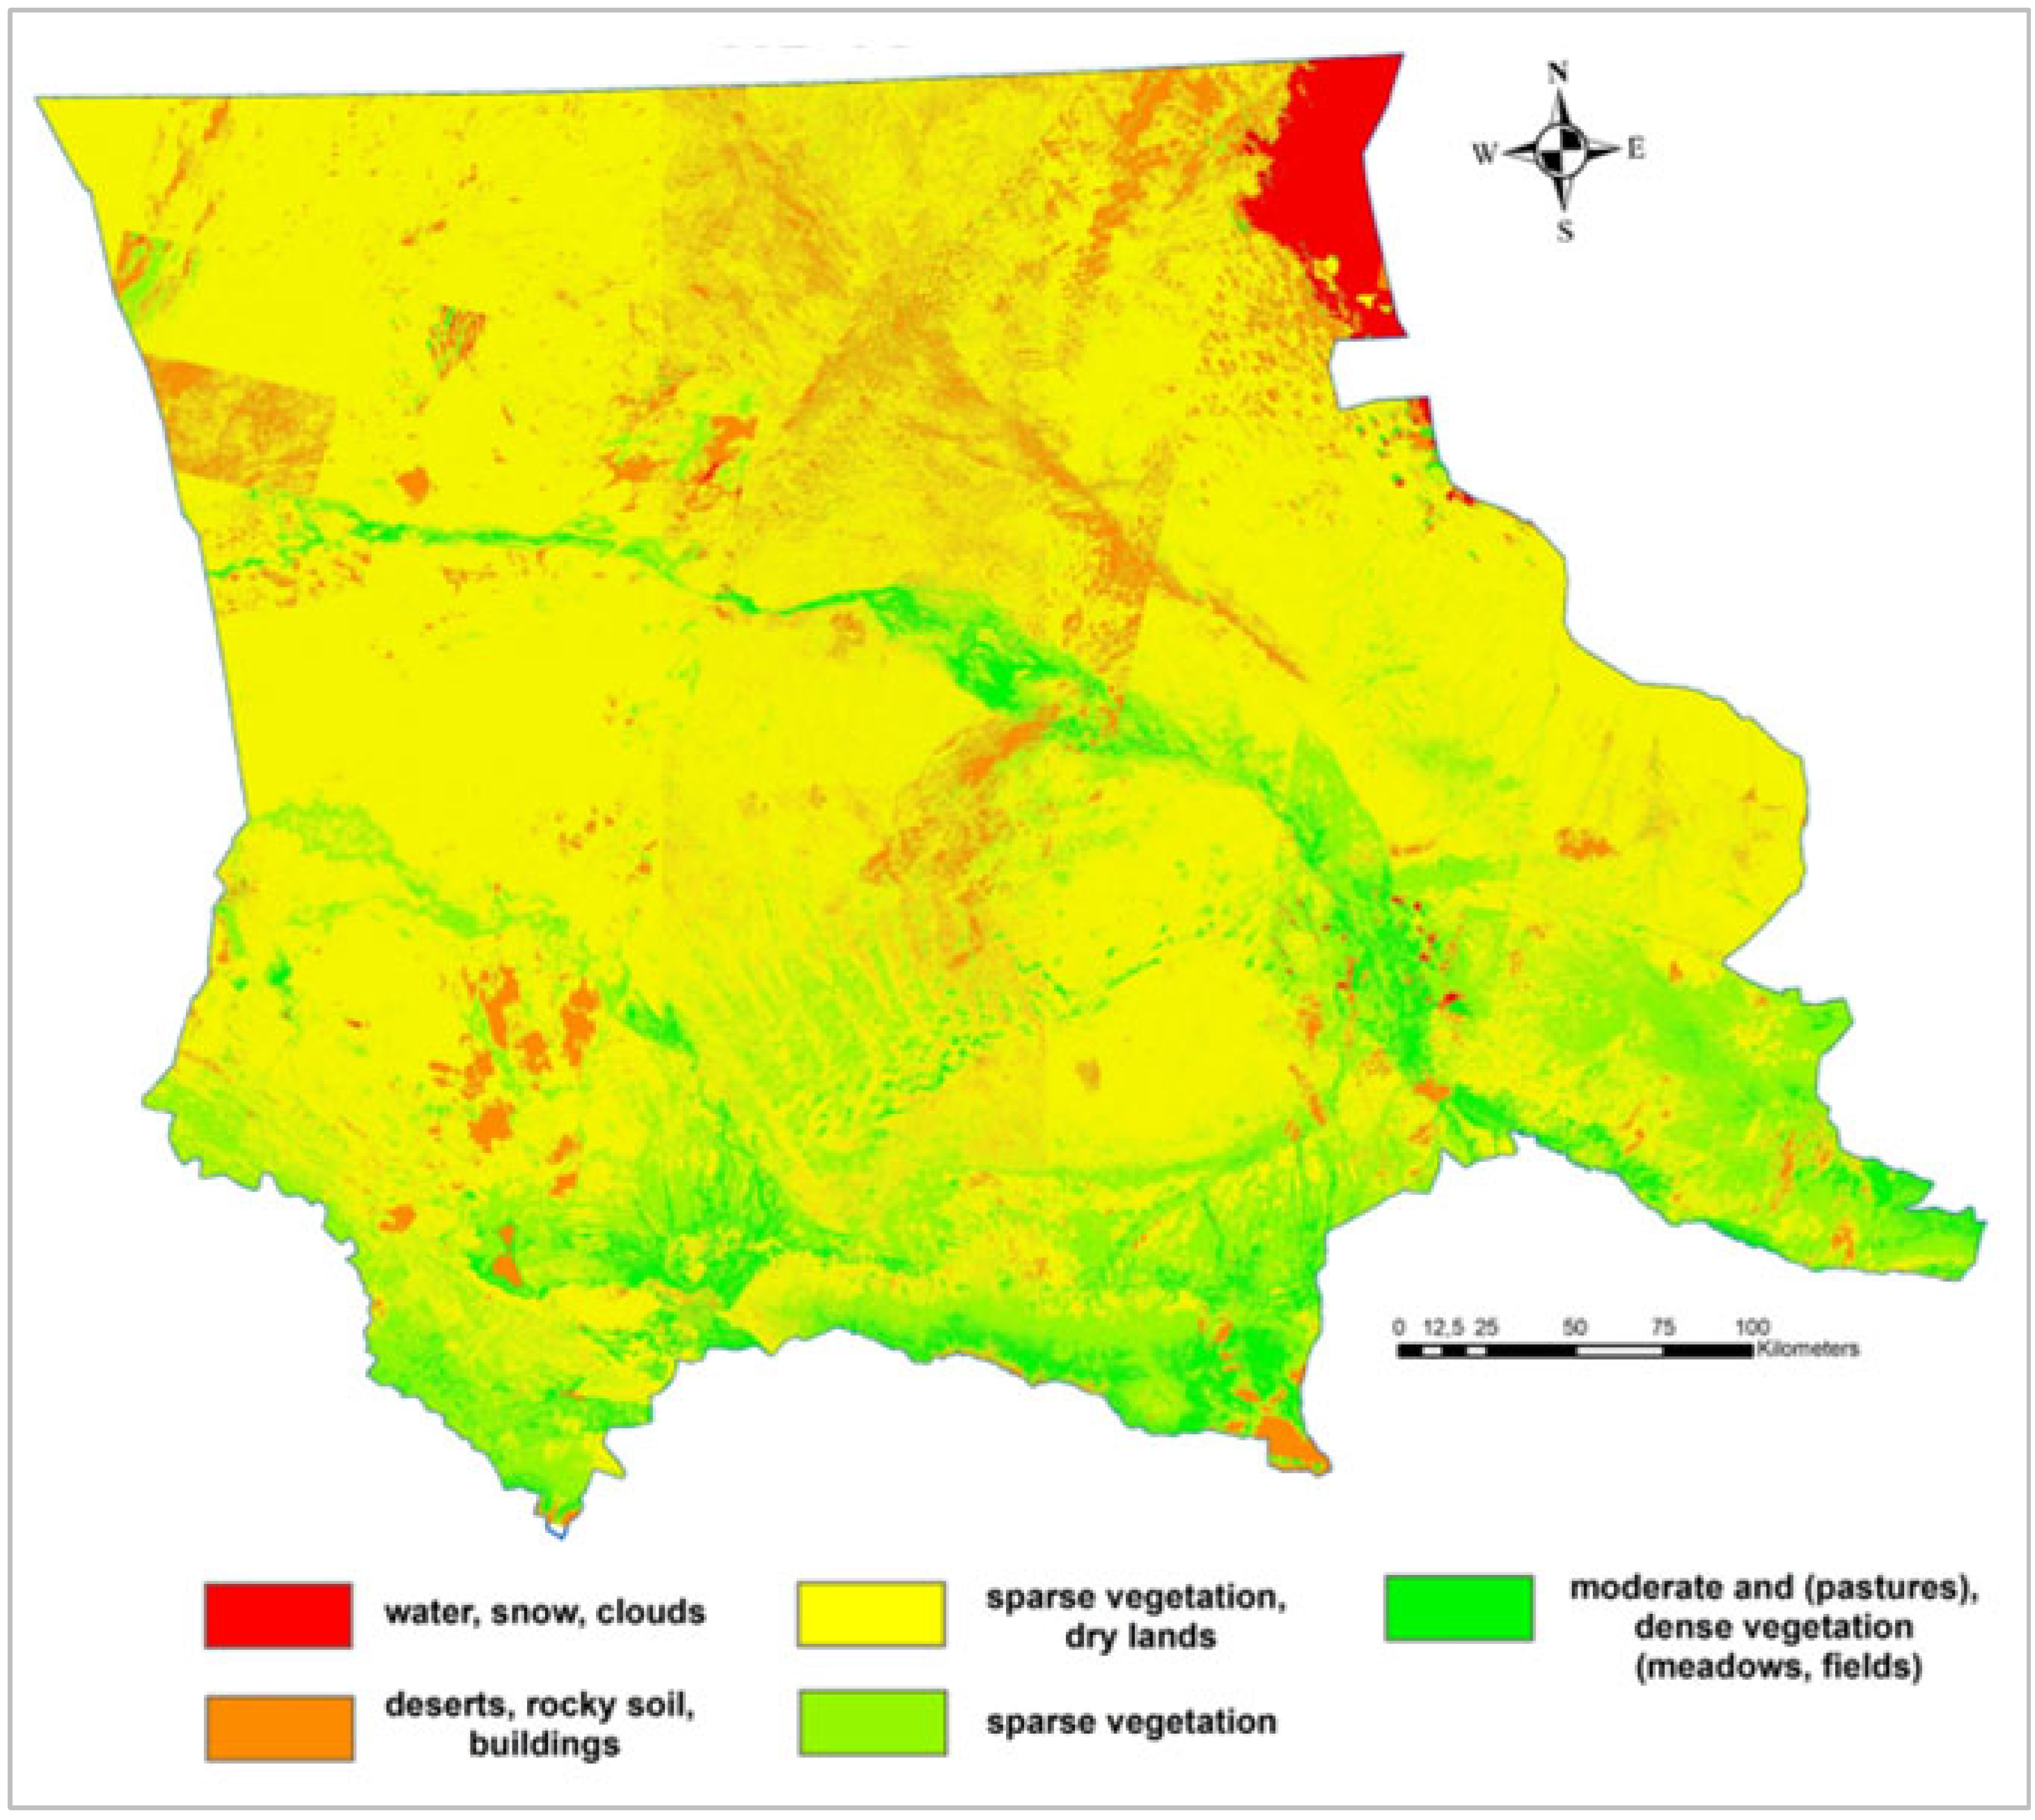
The resulting NDVI raster was reclassified into vegetation health categories to support spatial interpretation of recharge dynamics. Areas with higher NDVI were interpreted as zones where increased infiltration and vegetative transpiration may suggest favorable groundwater recharge conditions, while areas with low NDVI were prioritized as critical zones where MAR interventions could mitigate ecological stress and support water balance restoration.
The slope map was generated using digital elevation data from the Shuttle Radar Topography Mission (SRTM) with a spatial resolution of 30 m. The raw DEM was first preprocessed and reprojected to match the spatial reference system of the study area. Using ArcMap 10.x, the “Slope” tool from the Spatial Analyst toolbox was applied to calculate the slope in degrees across the entire Zhambyl region. The resulting raster layer was then classified into slope categories relevant to MAR suitability assessment, with lower slope classes receiving higher weights in the multi-criteria evaluation framework.
A high-resolution Land Use/Land Cover (LULC) map of the Zhambyl Region was obtained from an open-source dataset available on the ESRI platform. This global LULC layer was derived from ESA Sentinel-2 satellite imagery with a spatial resolution of 10 m. The dataset was produced using a deep learning-based classification algorithm—specifically, a convolutional neural network (CNN)—trained on over five billion manually labeled Sentinel-2 pixels, collected from more than 20,000 field-validated sites across all major global biomes. The model classified land cover into nine standardized categories, enabling consistent, high-accuracy land use mapping at the global scale.
For the suitability modeling and validation, the composite MAR suitability index (SI) was computed via weighted linear combination (WLC) in the GIS environment:
S I   =   i   =   1 n w i     x i
where w i denotes the AHP-derived weight for criterion i and x i represents the normalized score (1–5).
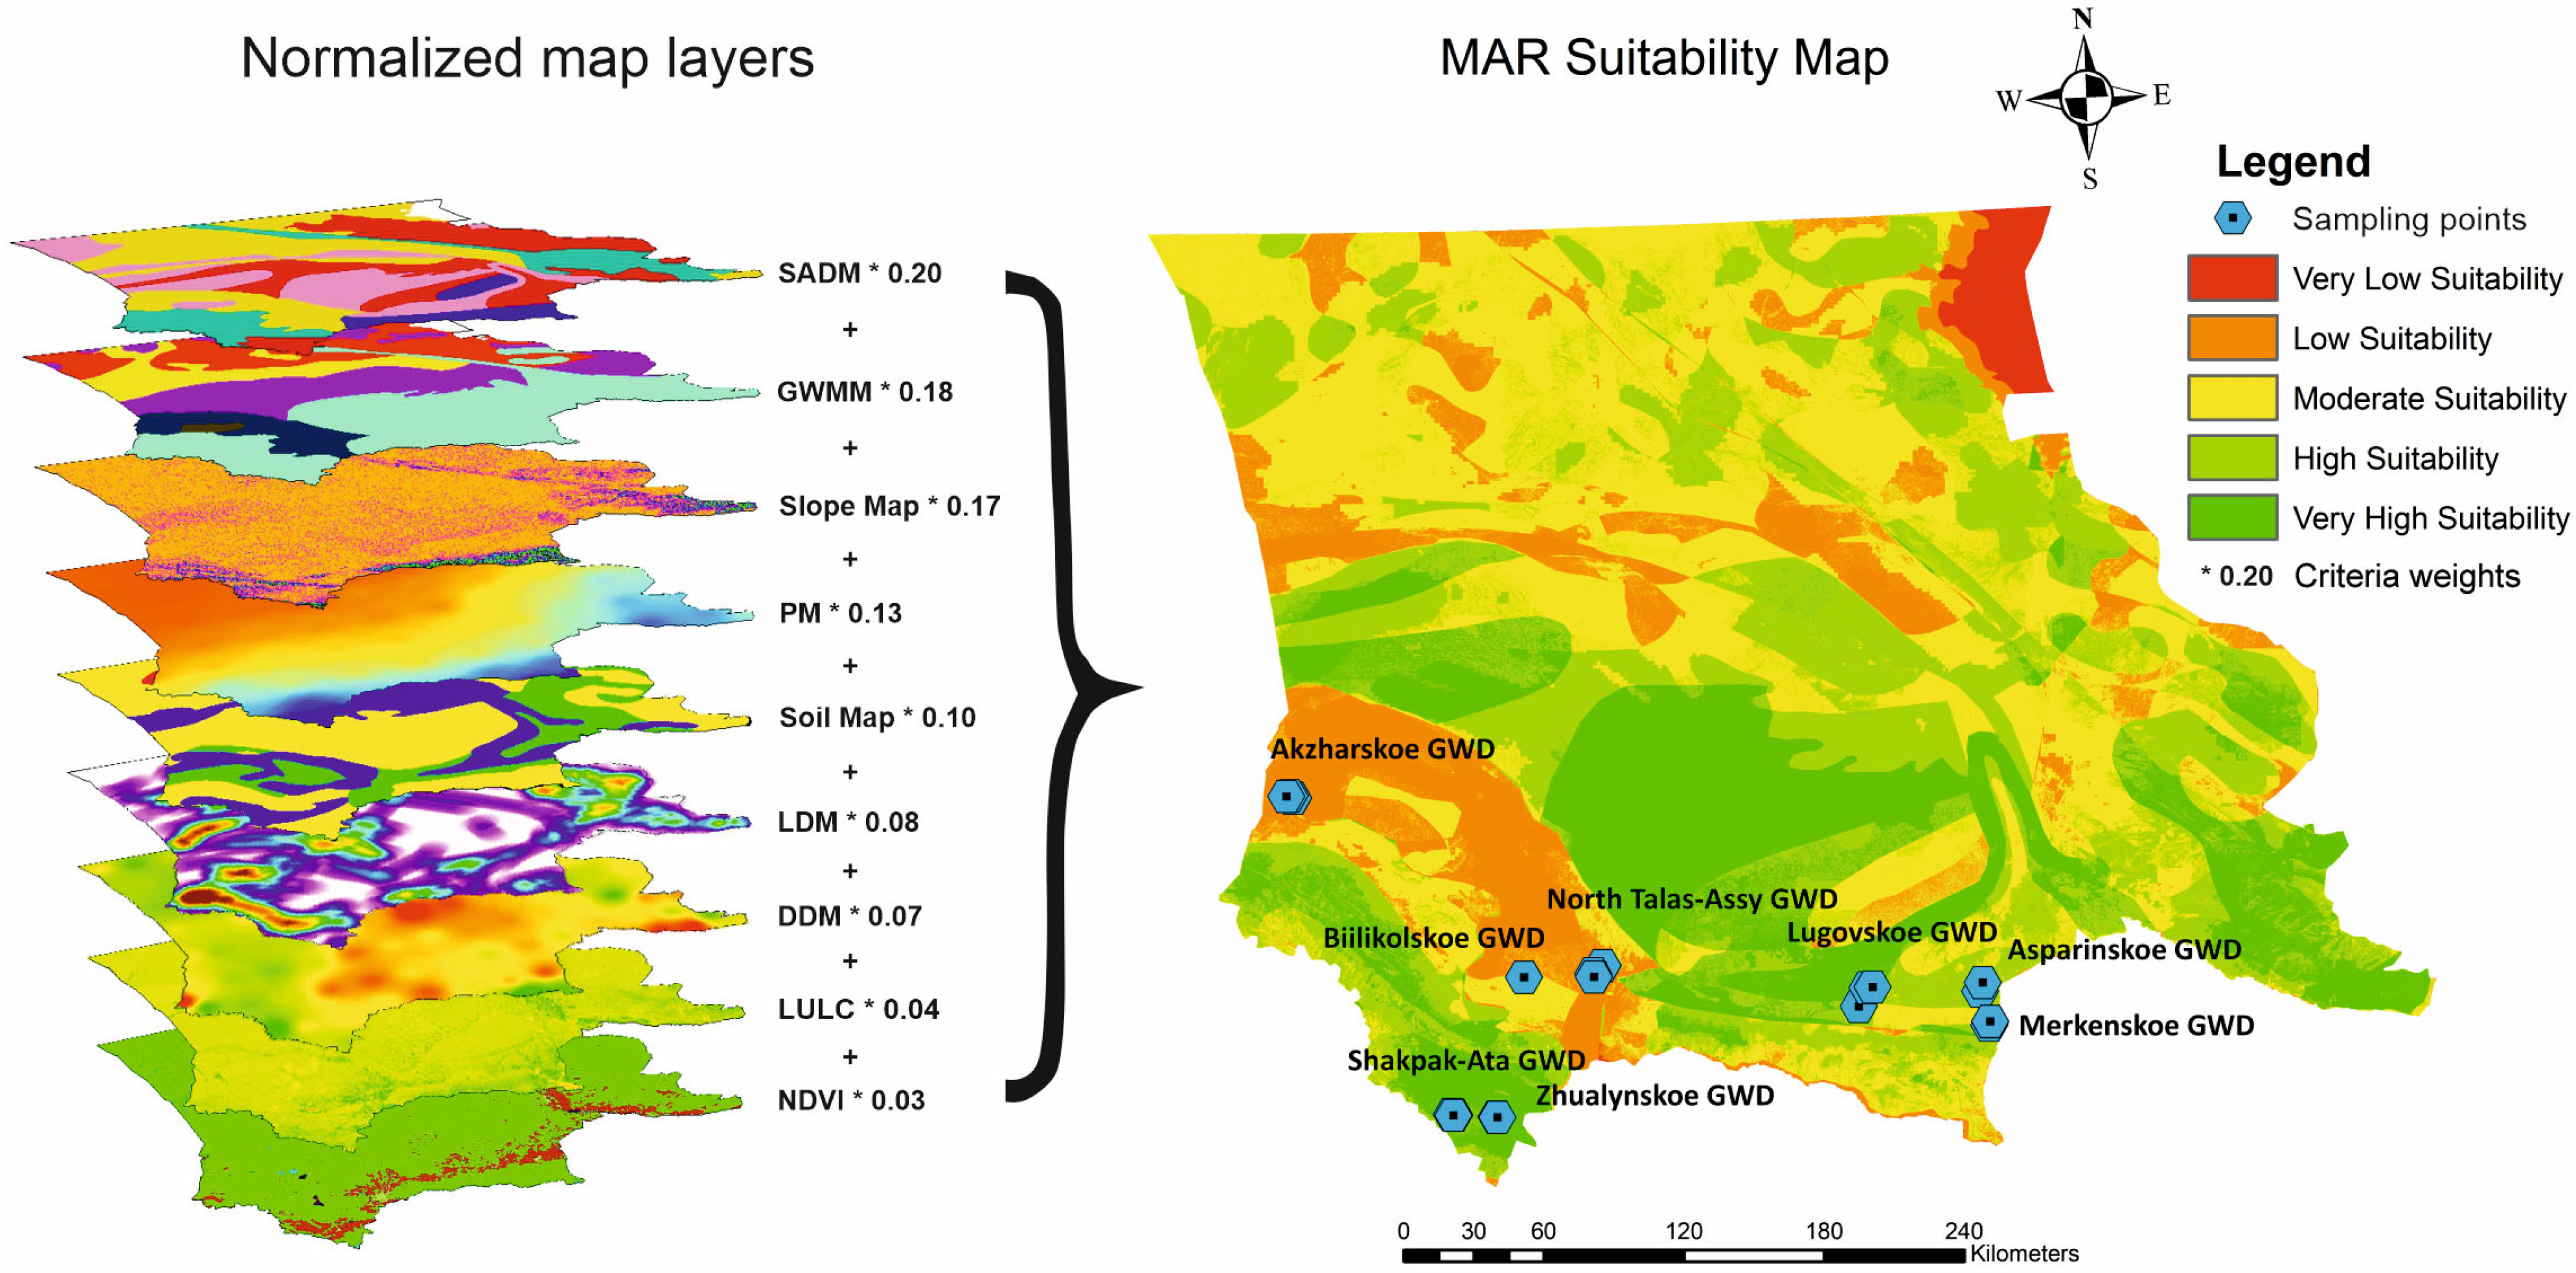
The output raster was classified into five suitability tiers using the Jenks natural breaks algorithm, minimizing intra-class variance. Each thematic layer was reclassified according to its hydrogeological relevance for MAR implementation using small dam structures, with the following suitability scale:
1 
Very low suitability;
2 
Low suitability;
3 
Moderate suitability;
4 
High suitability;
5 
Very high suitability.
The pairwise comparison matrix was developed based on expert judgment to evaluate the relative importance of each criterion in the context of MAR with small dams. Model consistency was verified through calculation of the Consistency Ratio (CR < 0.1), confirming statistically robust weight assignments. High-suitability zones (SI ≥ 4) were identified as prime candidates for detailed hydrogeological characterization, including pumping tests and infiltration studies.
This methodology provides a reproducible framework for MAR site selection in semi-arid regions, integrating quantitative and qualitative hydrogeological constraints into a spatially explicit decision-support tool.

2.3. Uncertainty and Robustness Analysis (Monte Carlo and Fuzzy MCE)

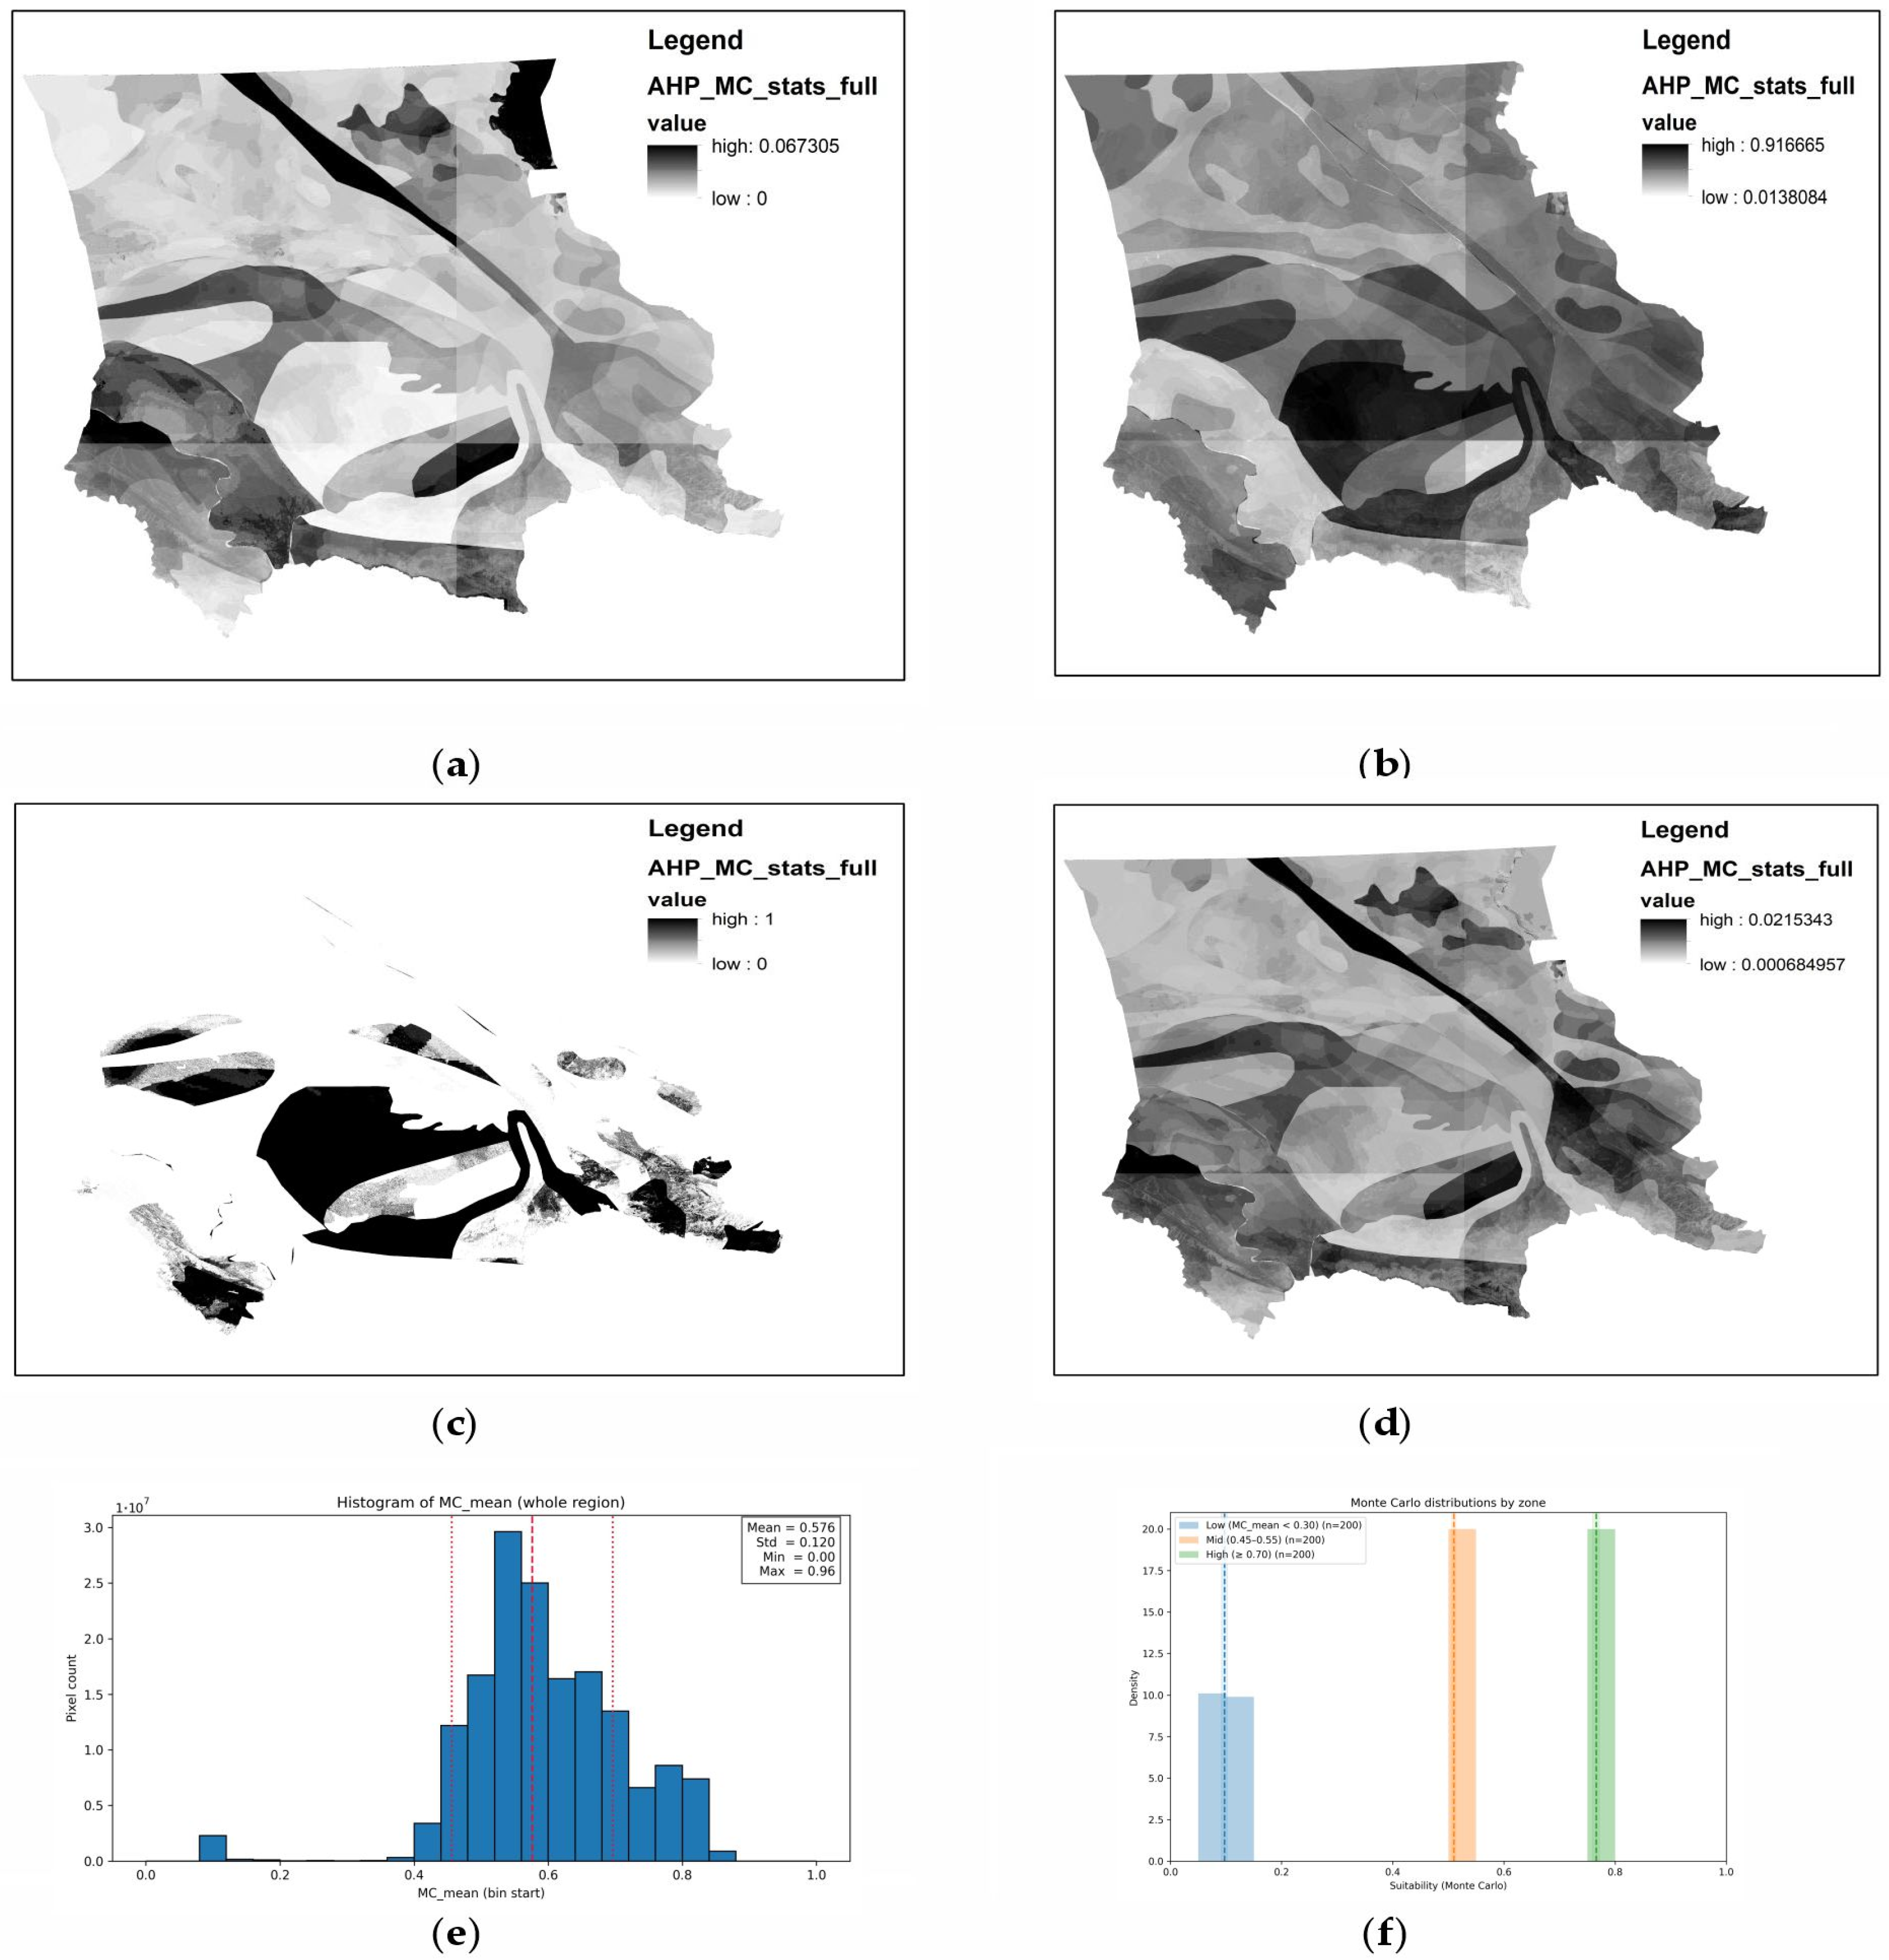
To quantify the sensitivity of the suitability model to uncertainty in expert-derived AHP weights, a Monte Carlo (MC) experiment was implemented. At each iteration, the nine AHP weights were randomly perturbed within a ±15% range around their baseline values and renormalized to sum to one (Dirichlet-like re-weighting). Subsequently, a weighted linear combination of the nine normalized layers was computed. In total, 300 realizations were generated over the study area, and the ensemble was summarized by the pixel-wise mean (MC_mean), standard deviation (MC_std), coefficient of variation (MC_cv = MC_std/MC_mean), and the exceedance probability P(SI ≥ 0.70) (MC_prob ≥ 0.7).
This MC design isolated weight uncertainty. The uncertainties of the satellite-derived layers and interpolated surfaces were addressed as follows: (I) NDVI was restricted to late-summer (August) conditions to minimize seasonal variability, with residual atmospheric and phenological effects discussed in Section 4; (II) rainfall fields (WorldClim, CHIRPS climatologies) were incorporated as multi-year means, with plausibility supported by station records, although sub-grid variability remained a limitation; (III) drainage density was derived from flow-accumulation thresholds calibrated against known channels and validated by expert review; and (IV) lineaments were mapped through expert-guided interpretation of multi-azimuth hillshades to reduce DEM- and texture-related artefacts. These methodological choices and their implications are explicitly considered in the Discussion.
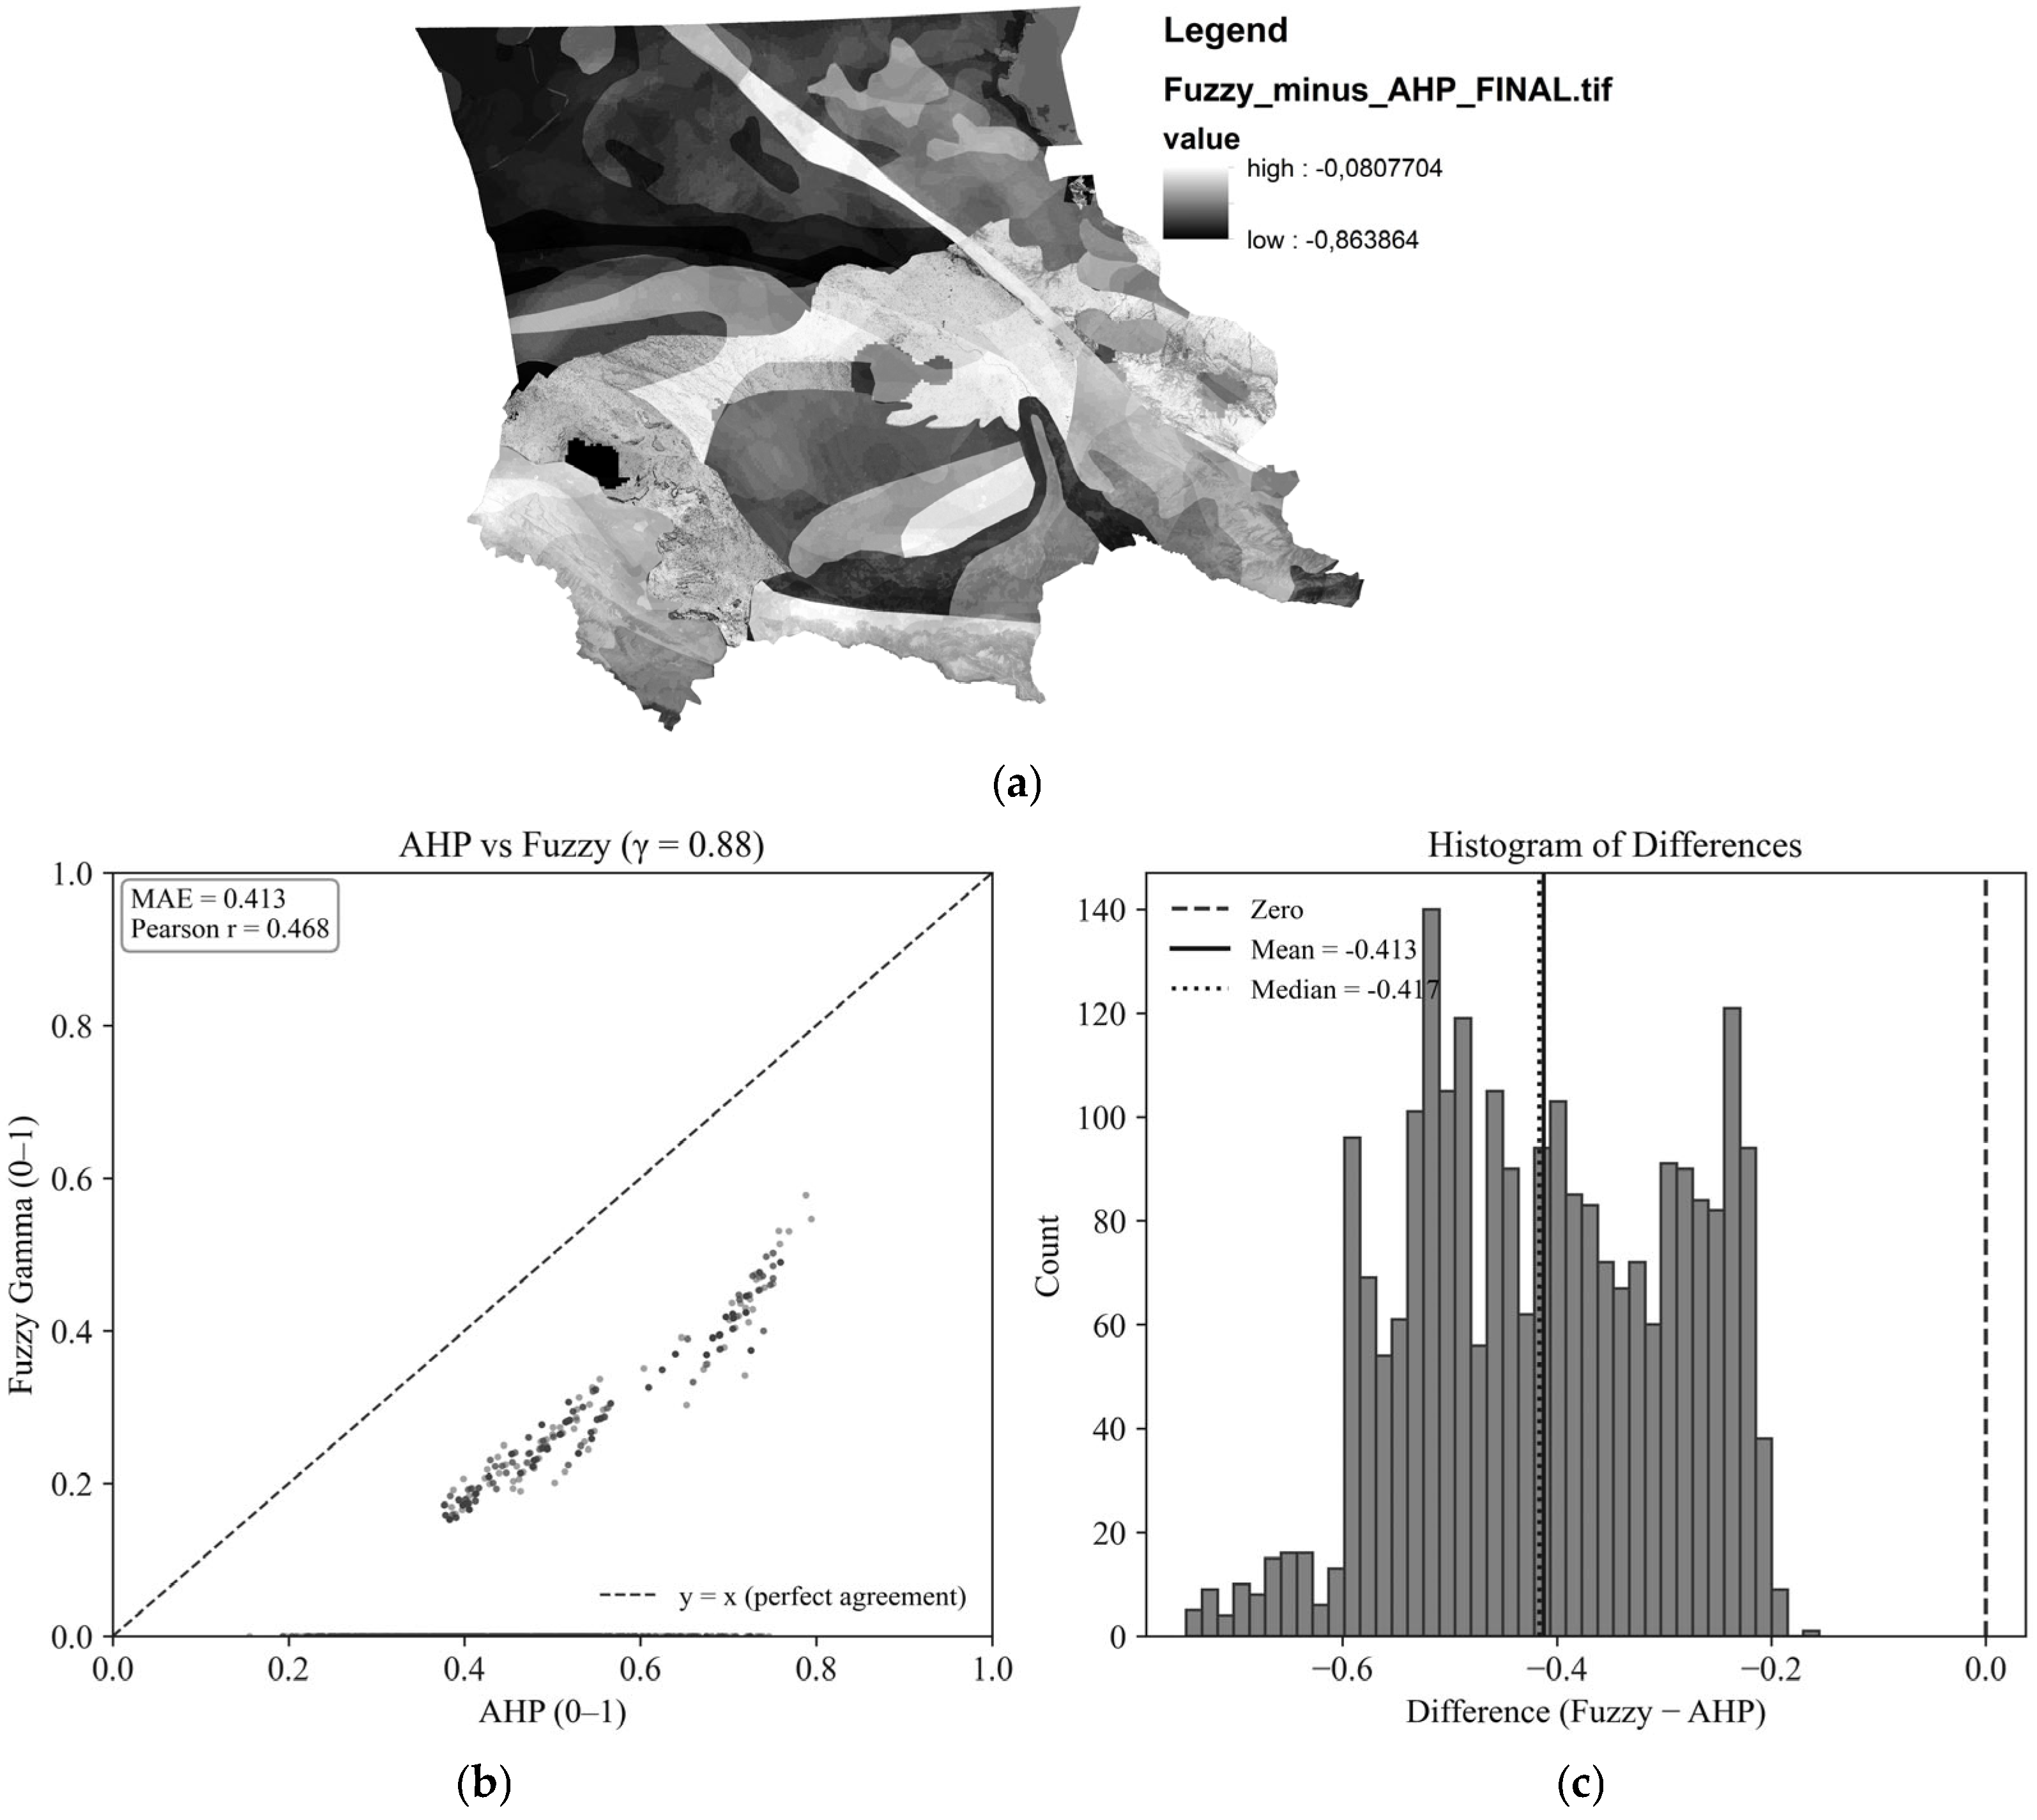
In parallel, a fuzzy multi-criteria evaluation (Fuzzy MCE, gamma operator) was applied to the same nine layers using membership functions consistent with the AHP reclassification rules and criterion influence scaled by the baseline AHP weights. The fuzzy configuration and its comparative diagnostics are reported together with the MC outcomes in Section 3 to provide a unified robustness assessment.

3. Results

Figure 6 shows the chemical composition of groundwater from monitoring wells for the MAR suitability zones. The figure presents mineralization levels, total dissolved solids (TDS), and the spatial distribution of major ions, represented as a Piper diagram. These diagrams depict the concentrations of key major and trace elements in the groundwater, based on geochemical sampling in 2024. The groundwater is characterized by a dominance of sulfate (5.1–166.3 mg/L), bicarbonate (64.0–335.6 mg/L), calcium (8.0–81.0 mg/L), and magnesium (2.4–39.5 mg/L) ions.
The water mineralization does not exceed 685 mg/L, while the standard limit is 1000 mg/L (see Figure 6). The total dissolved solids (dry residue) also do not surpass the allowable threshold. The water hardness in these wells is recorded at 7.3, which barely exceeds the limit of 7.0 meq/L (Kazakhstani threshold).
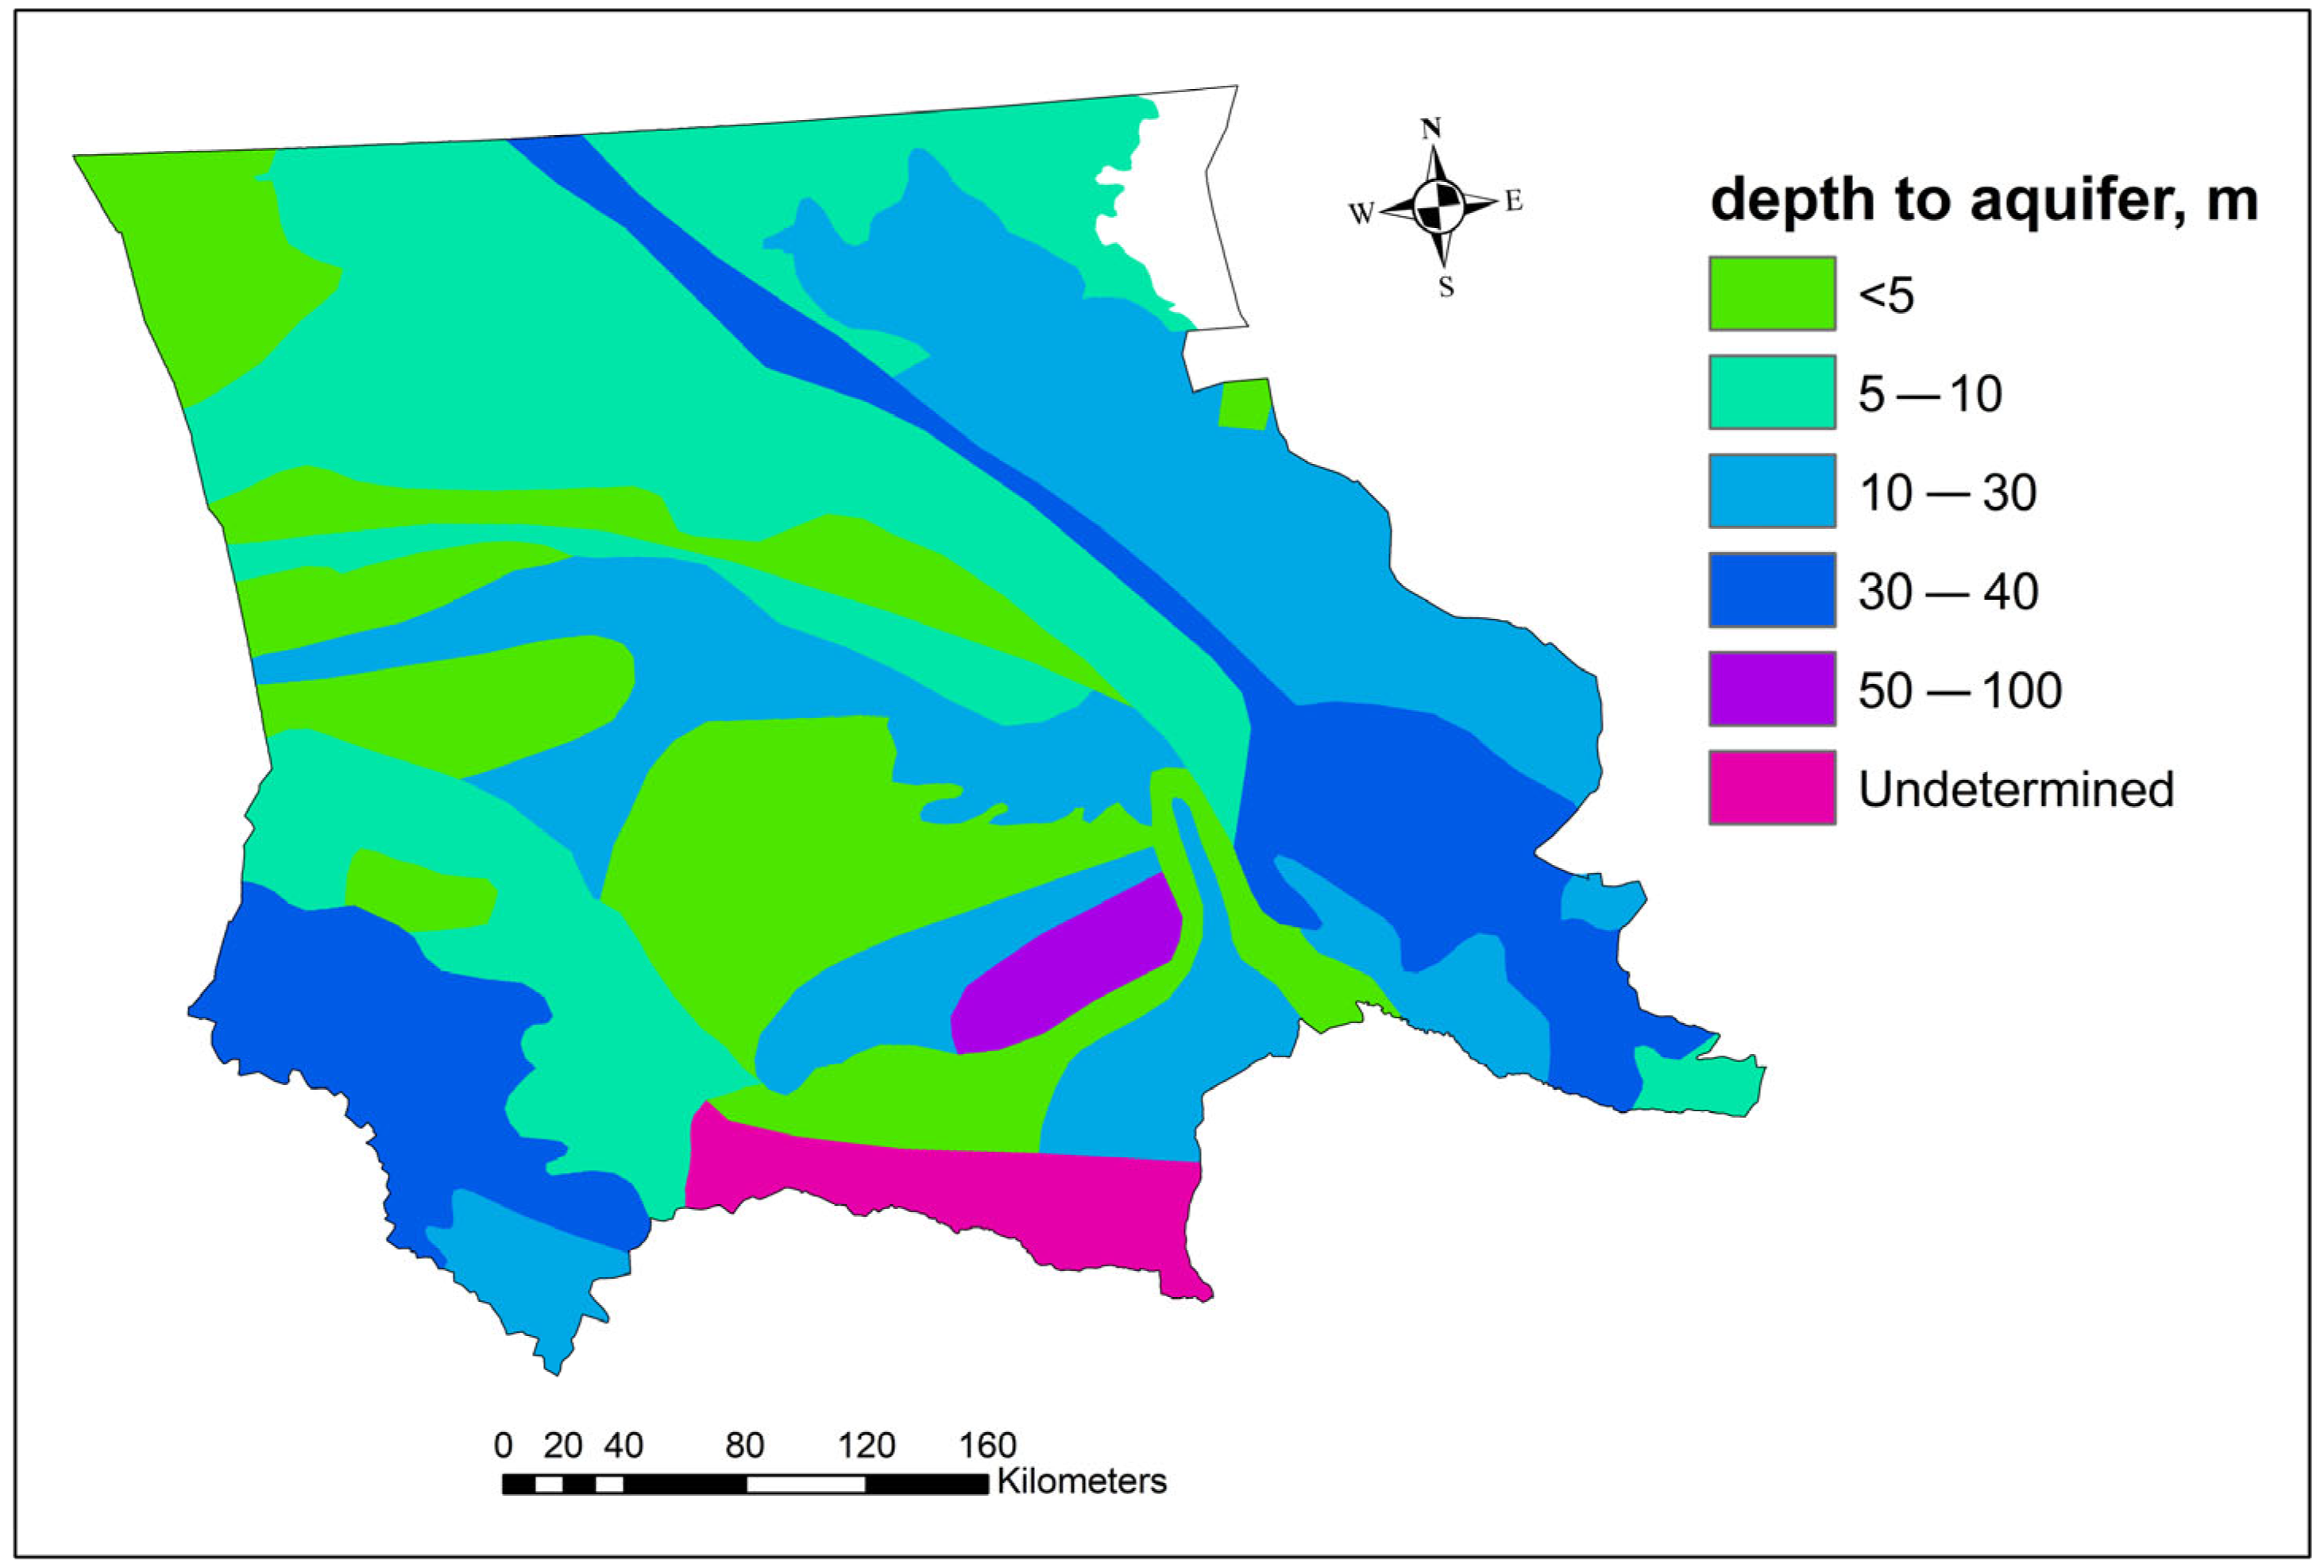
Shallow aquifer depth map (SADM). The depth-to-aquifer map (Figure 7) is a key element in assessing the accessibility of groundwater resources that can be utilized for MAR. Aquifers located at significant depths may limit the efficiency of MAR due to the high costs associated with drilling and water extraction [28]. This is consistent with general considerations for well drilling for drinking and irrigation water. Shallow aquifers, on the other hand, are generally more accessible for artificial recharge and tend to respond more rapidly to changes in precipitation and groundwater exchange [29].
Therefore, identifying locations with favorable depth-to-aquifer characteristics is crucial for effective MAR implementation, which aligns with sustainable water resource management goals.
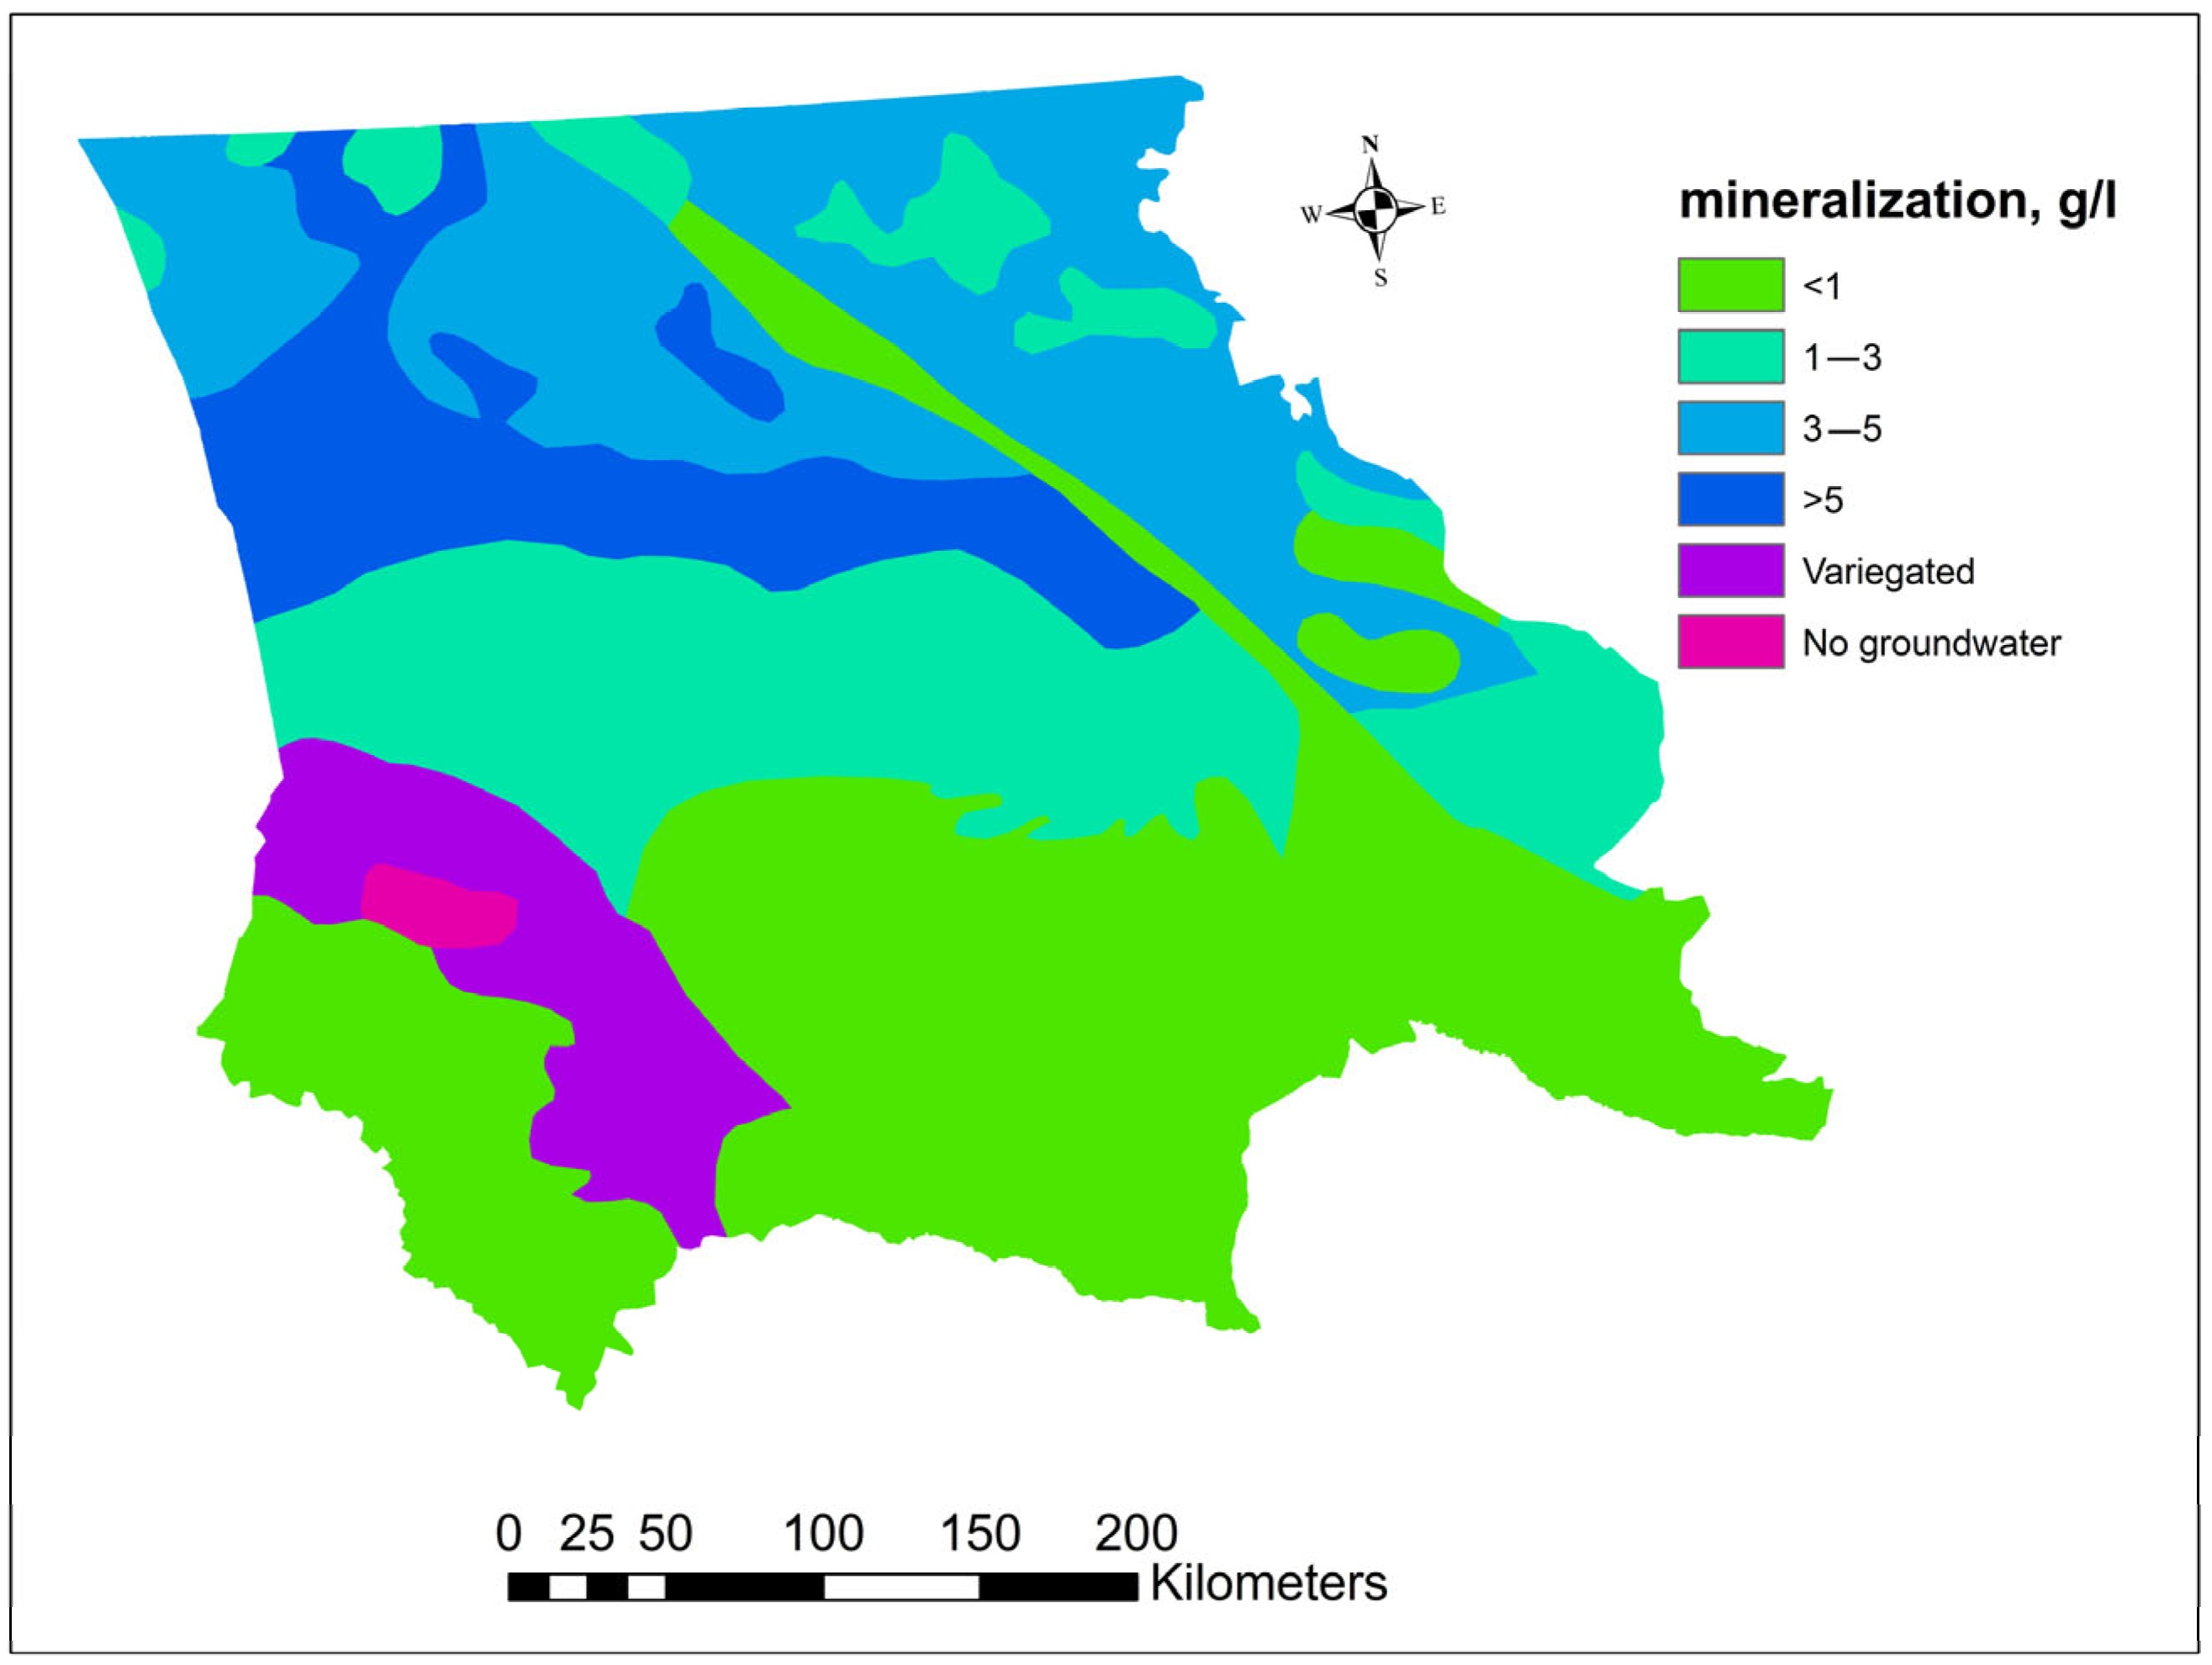
Groundwater mineralization map (GWMM). Groundwater salinity is a key parameter in evaluating the feasibility of MAR initiatives (Figure 8). Elevated salinity levels can significantly restrict the use of groundwater for irrigation and potable supply, while also posing risks to soil structure and the stability of local ecosystems [30]. Conversely, zones characterized by low salinity are more favorable for recharge activities, as they impose minimal chemical stress on receiving aquifers and associated environmental systems.
To assess the spatial distribution of salinity, a groundwater salinity map was produced using a combined methodology that integrated archival hydrogeological data with the 2024 fieldwork. The baseline data were obtained from the Atlas of Hydrogeological Maps of the Republic of Kazakhstan, specifically the 1:500,000 scale hydrogeological map. These were complemented by the field sampling campaigns, during which groundwater samples were collected from representative observation points across the study area and subjected to laboratory-based chemical analysis.
The incorporation of field data was critical for updating and verifying the older cartographic sources, many of which no longer reflect current hydrochemical conditions due to both natural dynamics and anthropogenic pressures. Field validation not only improves the spatial resolution of salinity estimates but also enhances the overall accuracy and relevance of the map for decision-making. This integrated approach ensures that MAR site selection is based on the most current and scientifically grounded understanding of subsurface water quality.
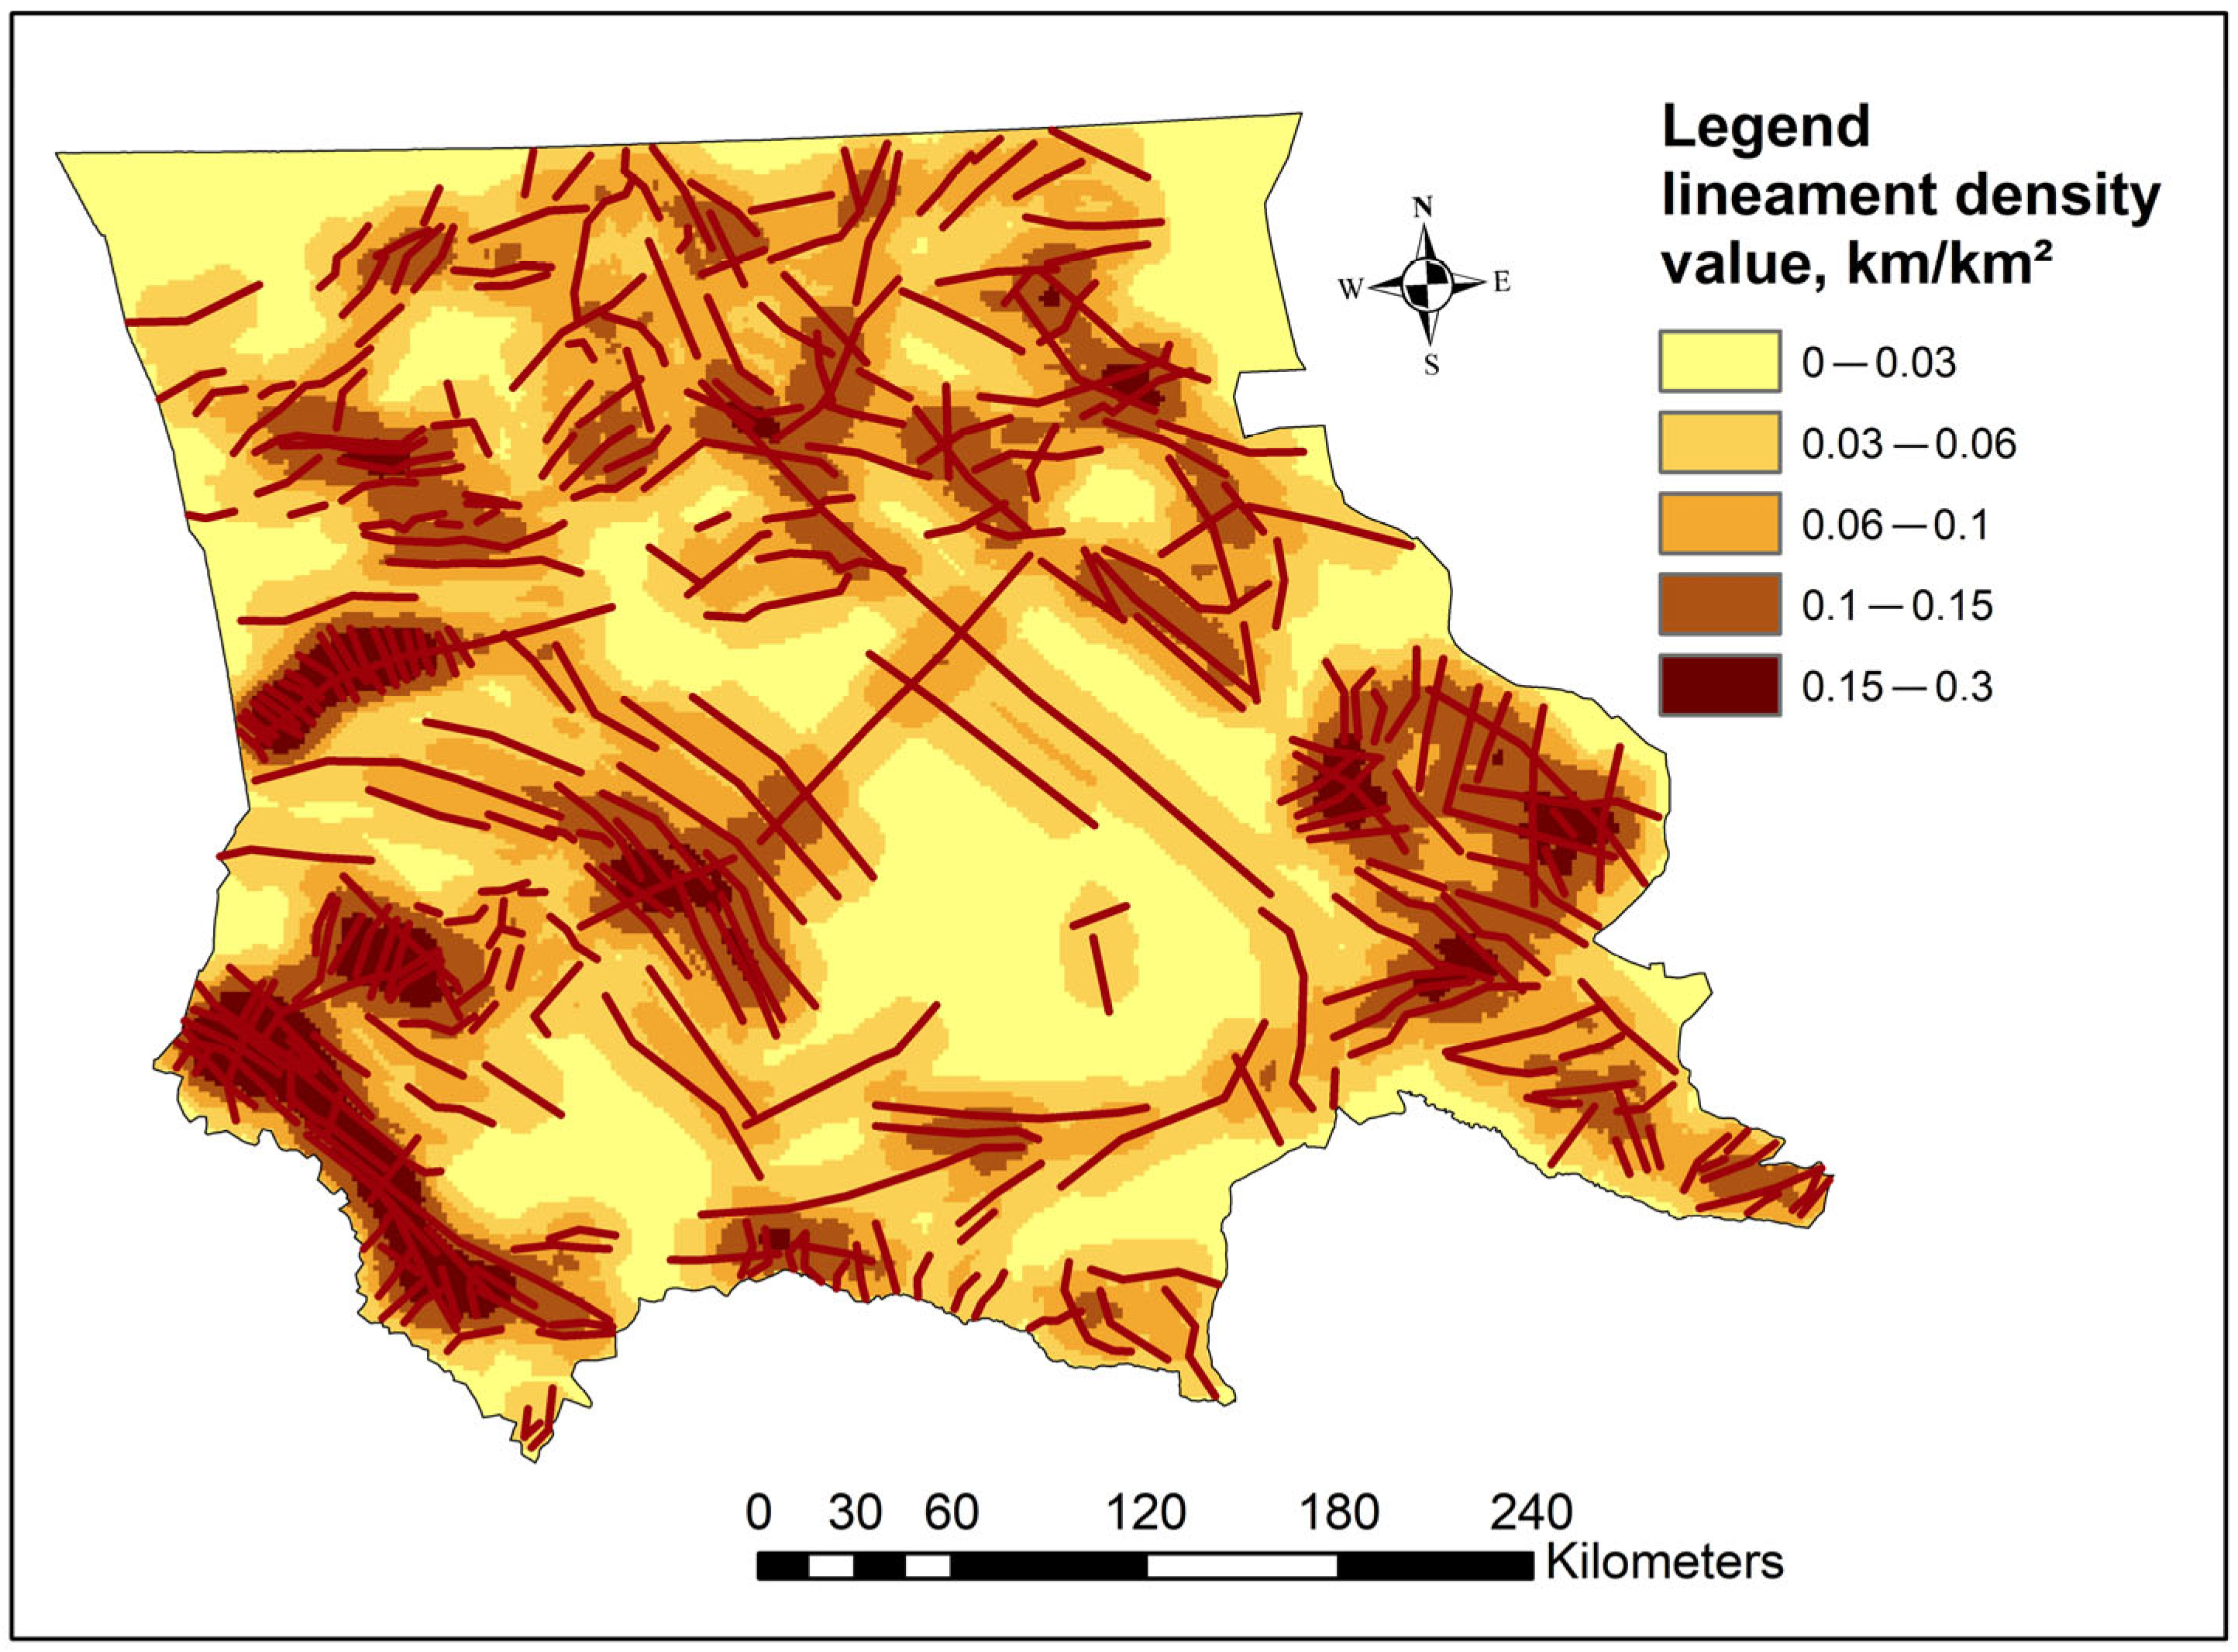
Lineament density map (LDM). In the context of assessing the hydrogeological potential for Managed Aquifer Recharge, the identification and spatial analysis of lineaments—linear geological features such as faults, fractures, and zones of structural weakness—are of particular importance (Figure 9). These structures significantly influence subsurface hydrodynamics by enhancing vertical and lateral groundwater movement, thereby acting as conduits for recharge processes. As such, areas with high lineament density can be indicative of enhanced groundwater recharge potential, making them attractive targets for MAR implementation. Numerous studies [31] have demonstrated a strong correlation between high lineament density and increased groundwater infiltration potential.
To capture the distribution of these structures, a detailed lineament map was produced in ArcMap using a processed Digital Elevation Model derived from Shuttle Radar Topography Mission data. A multi-directional hill shading technique was applied to enhance the visibility of linear features under varying illumination conditions. Specifically, four hill shade maps were generated using combinations of azimuth and altitude angles (200–50°, 50–90°, 100–60°, and 180–0°). These were carefully analyzed to reveal geomorphological signatures indicative of structural discontinuities.
Importantly, all lineaments were manually digitized by a structural geology expert. The manual interpretation approach was deliberately selected over automated detection algorithms due to the latter’s known limitations—particularly their susceptibility to misclassification caused by vegetation patterns, man-made features, or DEM artifacts. Expert-guided digitization ensures a higher degree of geological validity, as it allows for the contextual interpretation of terrain features within a broader tectonic framework.
Following the creation of the base lineament map, a lineament density map was generated to evaluate spatial variations in structural permeability. This layer is crucial for identifying zones with enhanced recharge potential, as dense lineament networks are often associated with increased secondary porosity and fracture connectivity. The resulting map provides a scientifically robust foundation for hydrogeological zoning and supports the delineation of priority areas for MAR implementation.
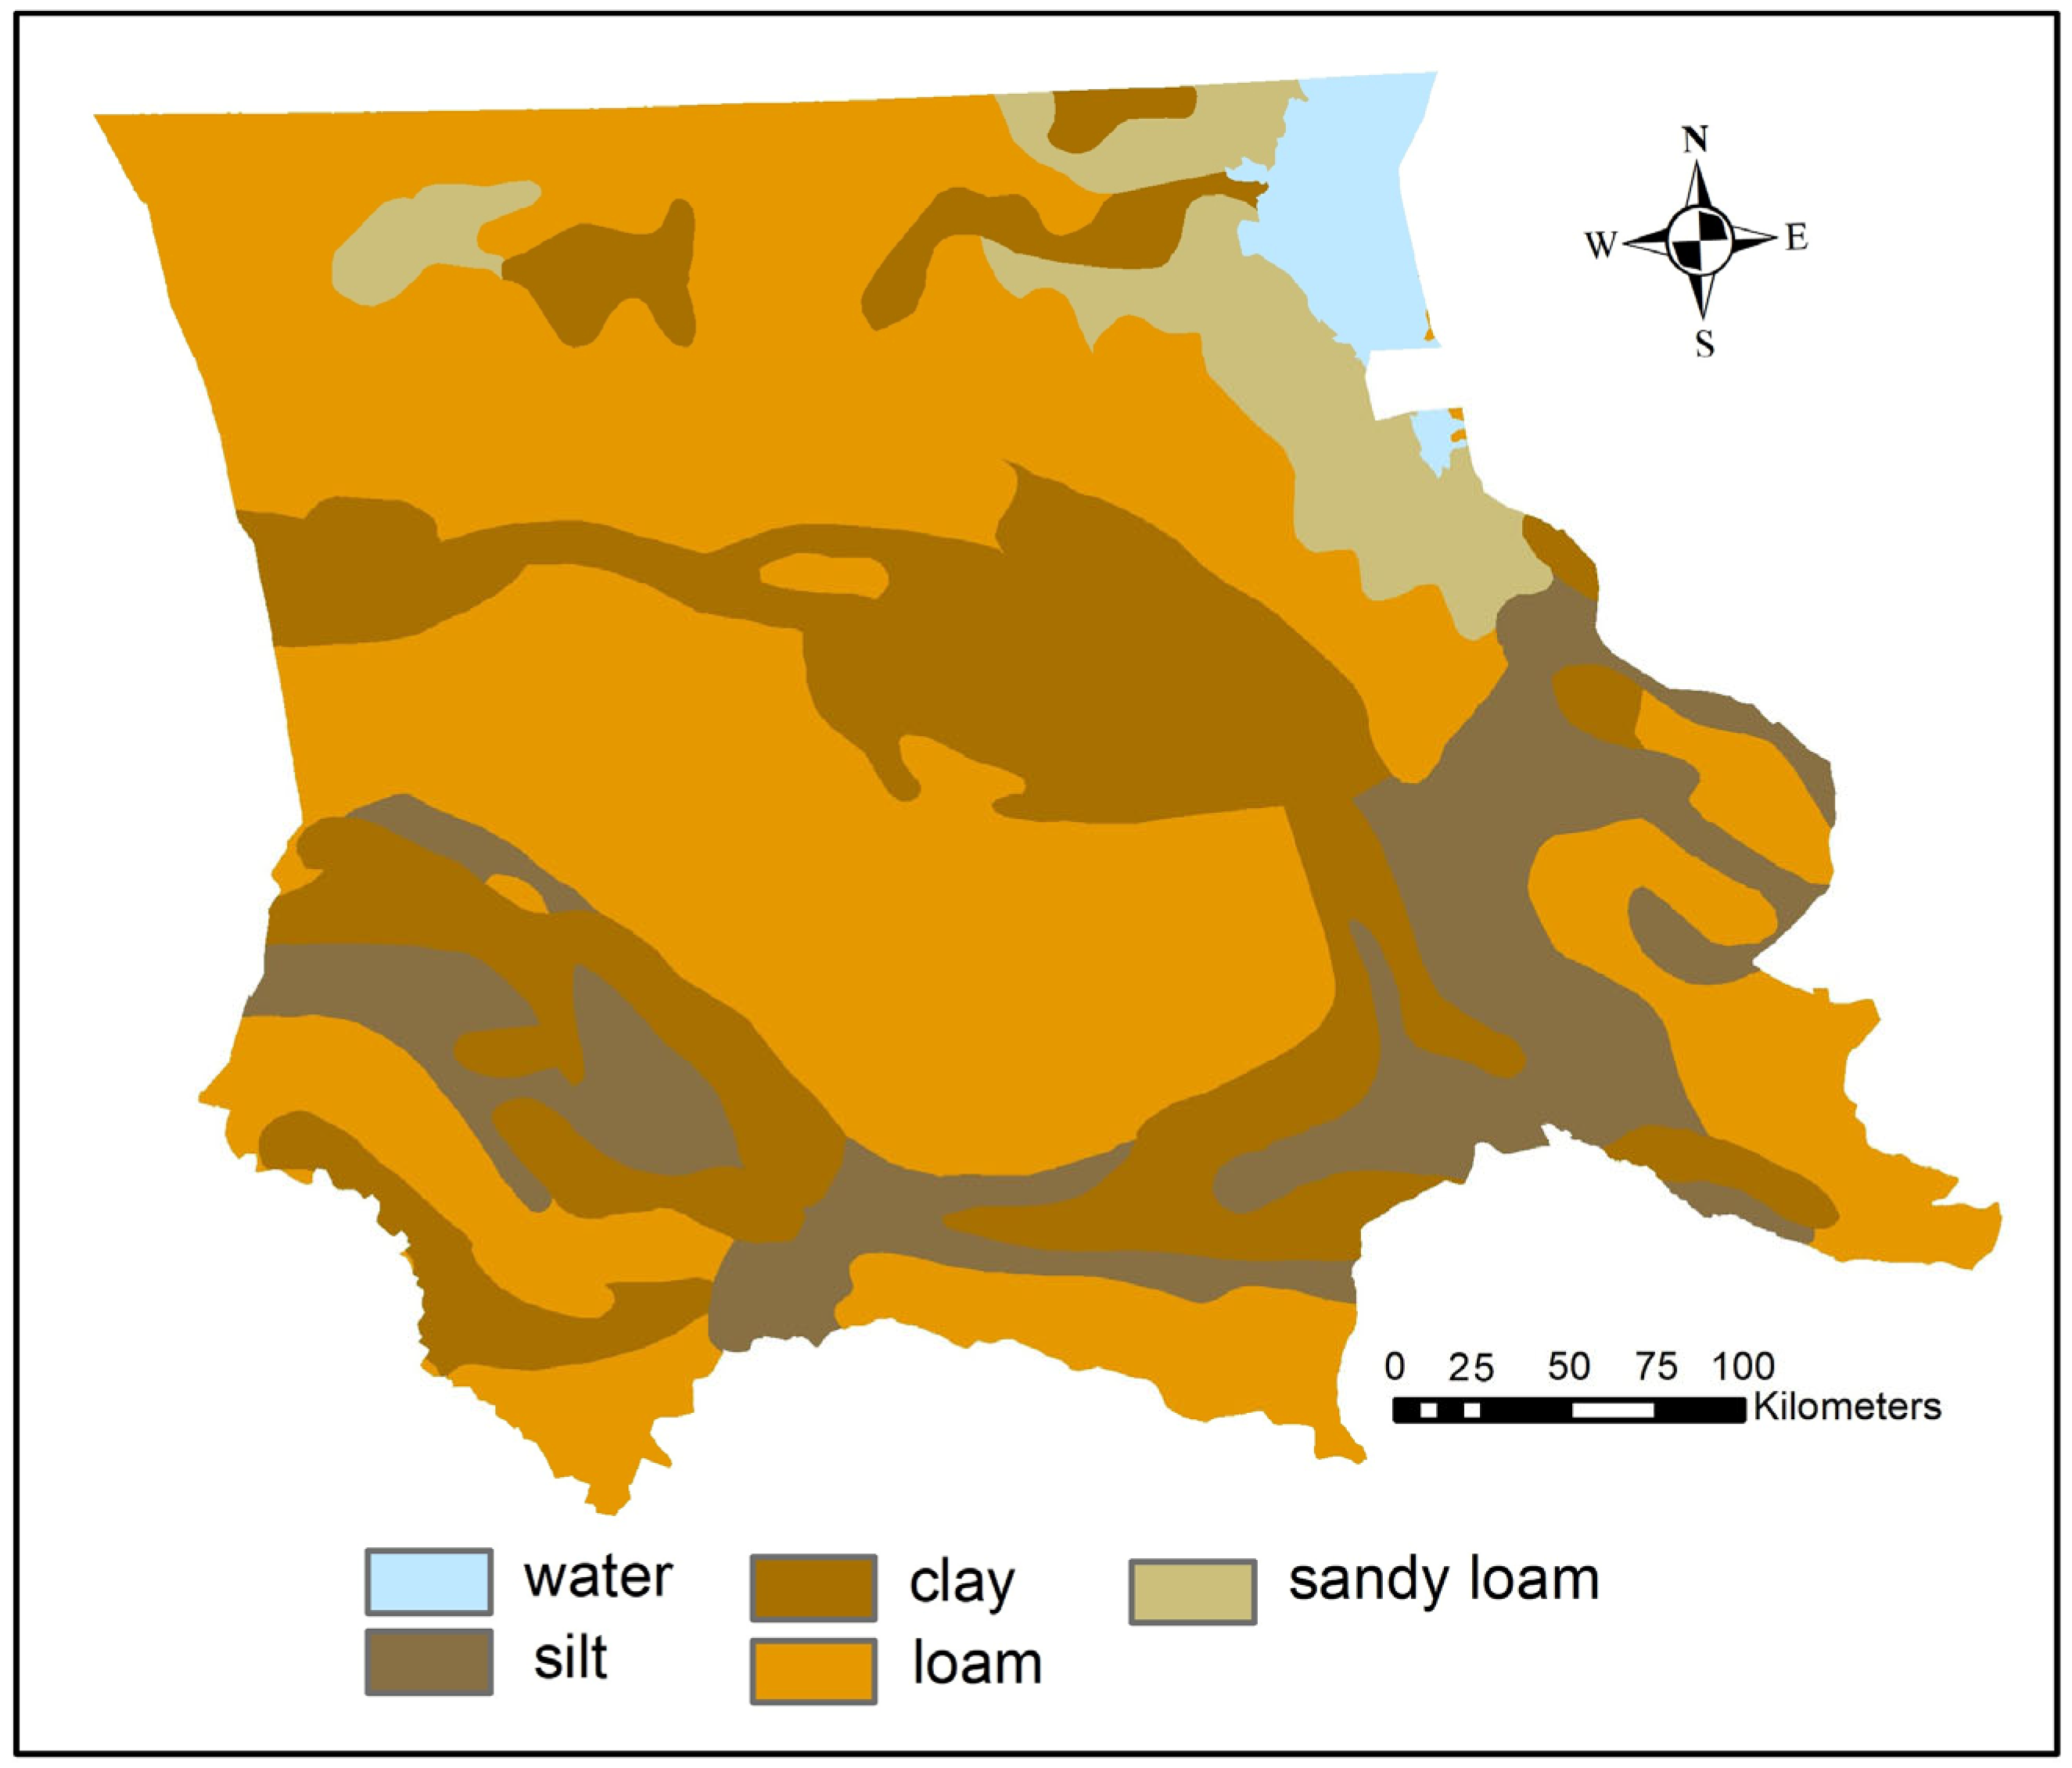
From a hydrogeologist’s perspective, soil types are a critical factor influencing groundwater recharge processes, as they determine both the permeability and the ability of soil to facilitate water infiltration. Soils with low permeability, such as clays, pose limitations on the effective infiltration of water into the ground, which can hinder recharge in certain areas. In contrast, soil like sand and loam, which typically exhibit higher permeability, are more conducive to water movement and can facilitate more efficient recharge into aquifers. This highlights the importance of soil maps as essential tools in identifying regions with favorable conditions for MAR. The soil map was developed using publicly available data sourced from global soil databases and national geospatial resources (Figure 10). To ensure the map’s accuracy and reliability, it was validated through fieldwork, which included soil sampling for chemical analysis. This approach allowed for a more precise characterization of soil properties, particularly those influencing permeability and water retention, which are crucial for groundwater infiltration.
The significance of soil characteristics in MAR projects is underscored by studies like [32], which emphasize the necessity for detailed assessment of soil hydraulic conductivity in the effective management of water resources. The authors observe that variations in soil permeability can significantly influence infiltration rates, and, by extension, the effectiveness of aquifer recharge initiatives. Thus, the integration of data from open sources with field observations not only enhances the accuracy of soil condition assessments but is vital for the successful design and implementation of MAR strategies. This comprehensive approach ensures a robust understanding of the area’s hydrological dynamics and is fundamental to optimizing groundwater recharge efforts.
Land Use and Land Cover (LULC) play a pivotal role in regulating surface and subsurface hydrological processes, including evapotranspiration, infiltration, and groundwater recharge. Regions dominated by intensive agriculture or urban development typically exhibit higher water consumption and greater surface sealing, which can negatively affect the recharge potential.
As [33] point out, such areas are generally less suitable for Managed Aquifer Recharge due to anthropogenic pressures and altered hydrological regimes. In contrast, forested or natural areas tend to maintain more stable hydrological conditions, promoting infiltration and minimizing ecological disturbance, making them more favorable for MAR implementation. For the Zhambyl region, the LULC classification revealed that the dominant land cover consists of pasturelands (Figure 11).
These are described as open areas uniformly covered with herbaceous vegetation (mainly wild grasses), often with sparse or no woody vegetation and minimal human disturbance. The landscape is characterized by scattered individual plants or small plant clusters interspersed with exposed soil or rock surfaces. In forested zones, shrub-dominated clearings within dense forest stands—clearly not exceeding tree height—were also identified. Detailed LULC data are critical for evaluating the MAR suitability of different land cover types, particularly in arid and semi-arid environments where land management and vegetation significantly influence infiltration rates and recharge dynamics. Integrating this information allows for a more robust and ecologically sound assessment of recharge potential areas.
Drainage density map (DDM) is a critical parameter that reflects the degree of surface water runoff and its influence on groundwater recharge processes. Areas characterized by high drainage density—such as regions with extensive canal systems, irrigation networks, or natural drainage lines—tend to facilitate rapid surface water conveyance, thereby reducing the amount of water available for percolation into aquifers. This can significantly constrain the efficiency of Managed Aquifer Recharge. As a result, site-screening tools are needed to identify locations and aquifers that have the greatest potential for successful implementation of MAR [34].
To generate the drainage density map used in this study, a high-resolution Digital Elevation Model from the Shuttle Radar Topography Mission served as the foundational dataset. The DEM was first hydrologically corrected to remove depressions (sinks) and ensure accurate simulation of flow direction and accumulation. Using the Spatial Analyst tools in ArcGIS, flow direction and flow accumulation rasters were derived, forming the basis for delineating surface water flow paths. A threshold value of flow accumulation—calibrated against satellite imagery and known hydrological features—was applied to extract the stream network, capturing both natural and artificial drainage lines. Drainage density was then calculated using the Line Density tool in ArcGIS, which computes the total stream length per unit area (e.g., per square kilometer), resulting in a continuous raster of drainage density values. These were subsequently classified into zones of low, medium, and high density for interpretation. Special attention was given to the accuracy of stream network delineation, as automated methods can produce errors in arid or flat terrains. Manual validation by a geoscience expert ensured a more reliable and hydrologically meaningful output. This drainage density map plays an essential role in assessing the suitability of different areas for MAR, as zones with lower drainage density are generally more conducive to groundwater recharge due to reduced surface runoff and enhanced water retention (Figure 12).
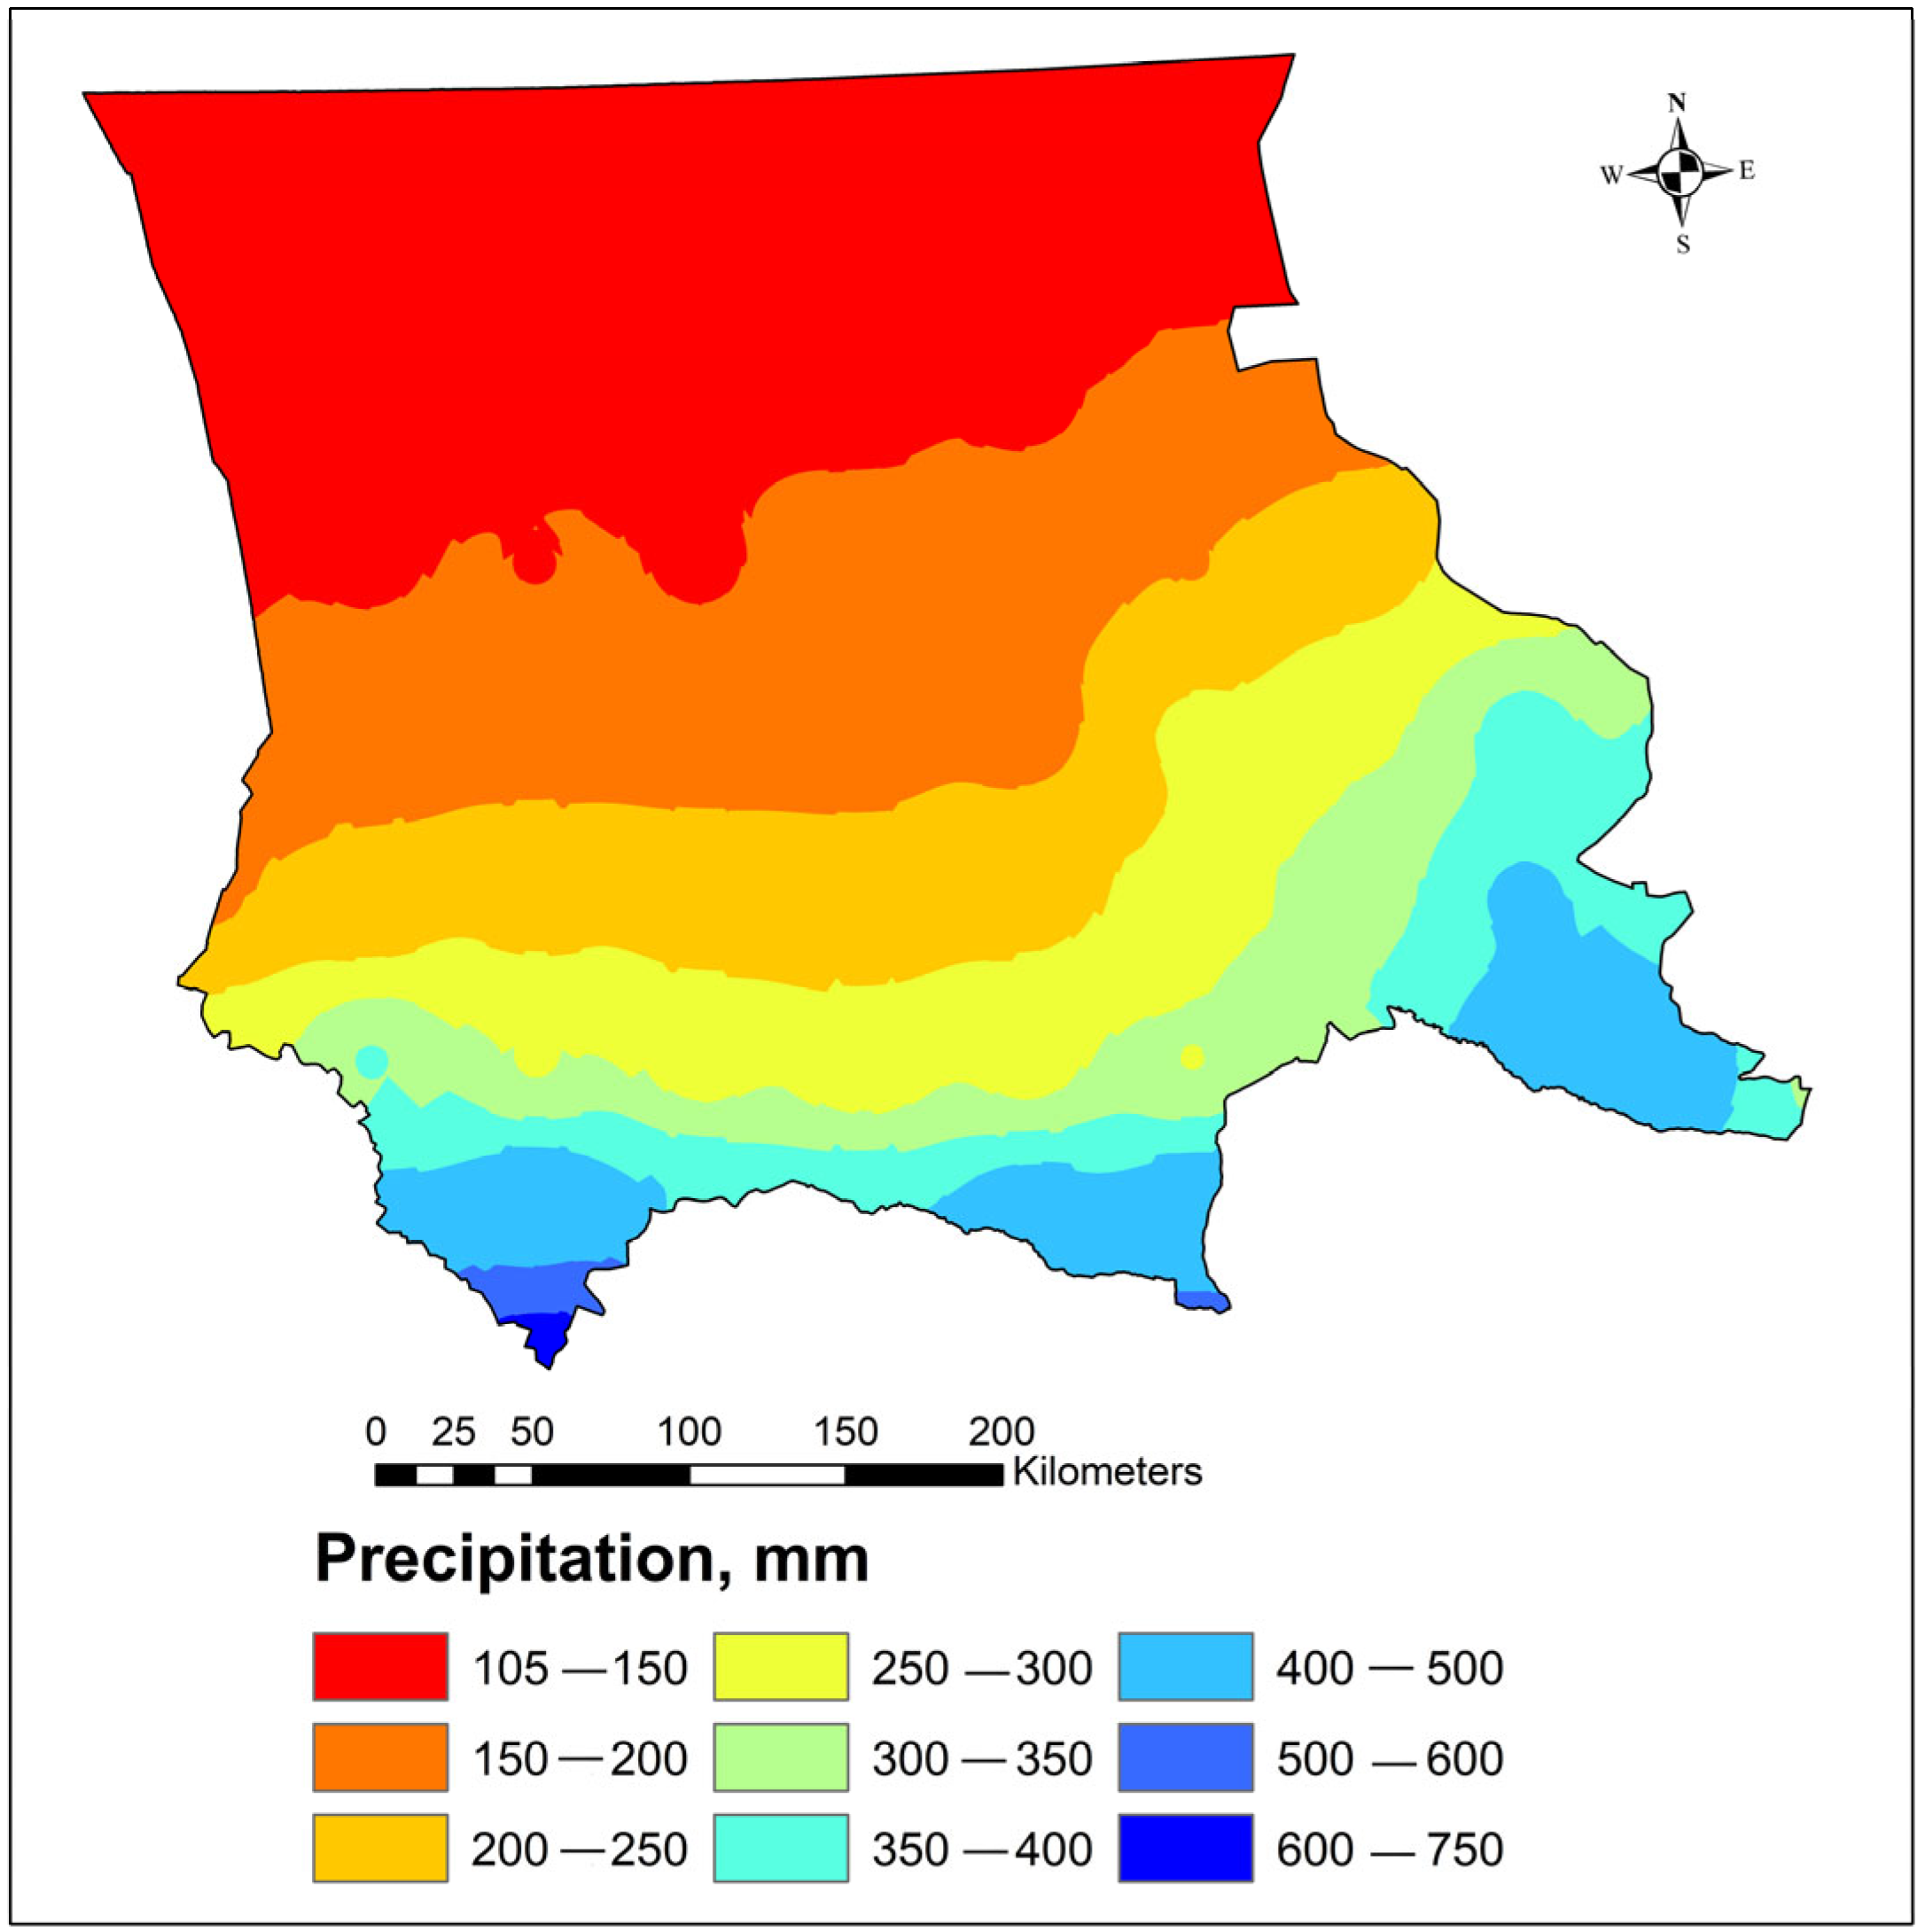
Precipitation map (PM) is a fundamental climatic variable that directly governs the hydrological cycle and exerts primary control on groundwater recharge potential. Spatial and temporal patterns of rainfall influence the rate and depth of percolation, thereby determining the extent to which aquifers are naturally replenished. In regions characterized by high annual precipitation, natural recharge processes may adequately sustain groundwater levels, potentially reducing the immediate necessity for MAR interventions [35]. In contrast, areas subject to low or irregular precipitation regimes often exhibit diminished recharge rates, thus necessitating the implementation of MAR strategies to enhance aquifer storage and improve long-term water availability.
In this study, a precipitation map was developed to quantify and spatially represent rainfall variability across the Zhambyl Region (Figure 13). High-resolution gridded climate data were sourced from globally recognized open-access datasets, including WorldClim (long-term average for 1970–2000) and CHIRPS (1981–2024 climatology).
To validate and calibrate these gridded estimates, data from six meteorological stations within the region were employed. The datasets were selected based on their proven reliability, extensive temporal coverage, and suitability for regional hydroclimatic analysis. Using GIS techniques, the data were processed into a raster representing mean annual precipitation, which was then reclassified into three categories—low, moderate, and high—based on natural breaks in the distribution. This stratification facilitated the spatial interpretation of recharge potential within the MAR framework. The use of publicly available climate data ensures methodological transparency while enabling consistent evaluation of recharge dynamics under current and future climatic conditions. Such an approach provides a robust basis for integrated groundwater resource planning in data-scarce regions.
The Normalized Difference Vegetation Index (NDVI) is a widely recognized remote sensing indicator for assessing vegetation health and density, which in turn can serve as a proxy for soil moisture availability. Areas exhibiting low NDVI values are generally indicative of sparse or stressed vegetation and may be at greater risk of ecological degradation, particularly under arid or semi-arid conditions where vegetation relies heavily on groundwater resources [36]. Incorporating NDVI data into groundwater recharge assessments provides valuable insights into vegetative water requirements and can assist in identifying locations where MAR could support ecosystem restoration by enhancing subsurface water availability (Figure 14).
Slope map. Topographic characteristics, particularly slope, play a critical role in controlling surface runoff, infiltration, and the overall subsurface water movement. As demonstrated by Almaliki [37], areas with steep slopes are typically less suitable for MAR because water tends to flow rapidly toward lower elevations, reducing opportunities for infiltration and localized recharge. Conversely, flat or gently sloping terrains are more favorable for water retention and downward percolation into aquifers, making them prime candidates for MAR interventions.
The use of SRTM data ensures consistent and globally validated topographic inputs, while GIS-based derivation enables high-resolution spatial analysis across diverse terrain. The slope map, thus, serves as a foundational layer in identifying potential MAR zones, especially when integrated with other thematic layers such as soil type, land use, lineament density, and drainage (Figure 15).
Suitability Assessment for Managed Aquifer Recharge (MAR) Using AHP and GIS-Based Multi-Criteria Decision Analysis. Following the derivation of weight coefficients via the Analytic Hierarchy Process (AHP), a critical step involved the normalization of input geospatial datasets to a standardized scale (1–5) to ensure comparability in subsequent weighted overlay analysis. Parameter-Specific Normalization Criteria incorporated hydrogeological and physiographic constraints to reflect site-specific recharge potential using SADM (Shallow aquifer depth map). Optimal infiltration conditions were associated with depths of 5–20 m (score: 4–5), while shallow (<2 m) or deep (>50 m) groundwater tables were deemed less favorable (score: 1–2). For the GWMM (groundwater mineral content), fresh groundwater zones (TDS < 1 g/L) were prioritized (score: 5), whereas brackish conditions (TDS > 3 g/L) were discounted due to reduced usability (score: 1–2). For slope, gentle slopes (2–8%) were assigned high suitability (score: 4–5) due to enhanced surface water retention, contrasting with steep (>15%) or flat (<1%) terrain. Regarding precipitation (PM), regions with mean annual precipitation >300 mm received maximum scores, reflecting greater available recharge volume. High permeability soils (sandy loams, loamy sands) were favored (score: 4–5), while clay-rich or lithified units were penalized (score: 1–2). Non-vegetated and agricultural lands (LULC) received optimal (score: 4–5), whereas impervious urban surfaces were excluded (score: 1). Low vegetation density (NDVI <0.3) correlated with higher infiltration potential (score: 4–5). Enhanced secondary permeability in fractured aquifers increased suitability (score: 4–5). Excessive channelization (>3 km/km2) reduced suitability due to rapid runoff losses (score: 1–2) (Table 2).
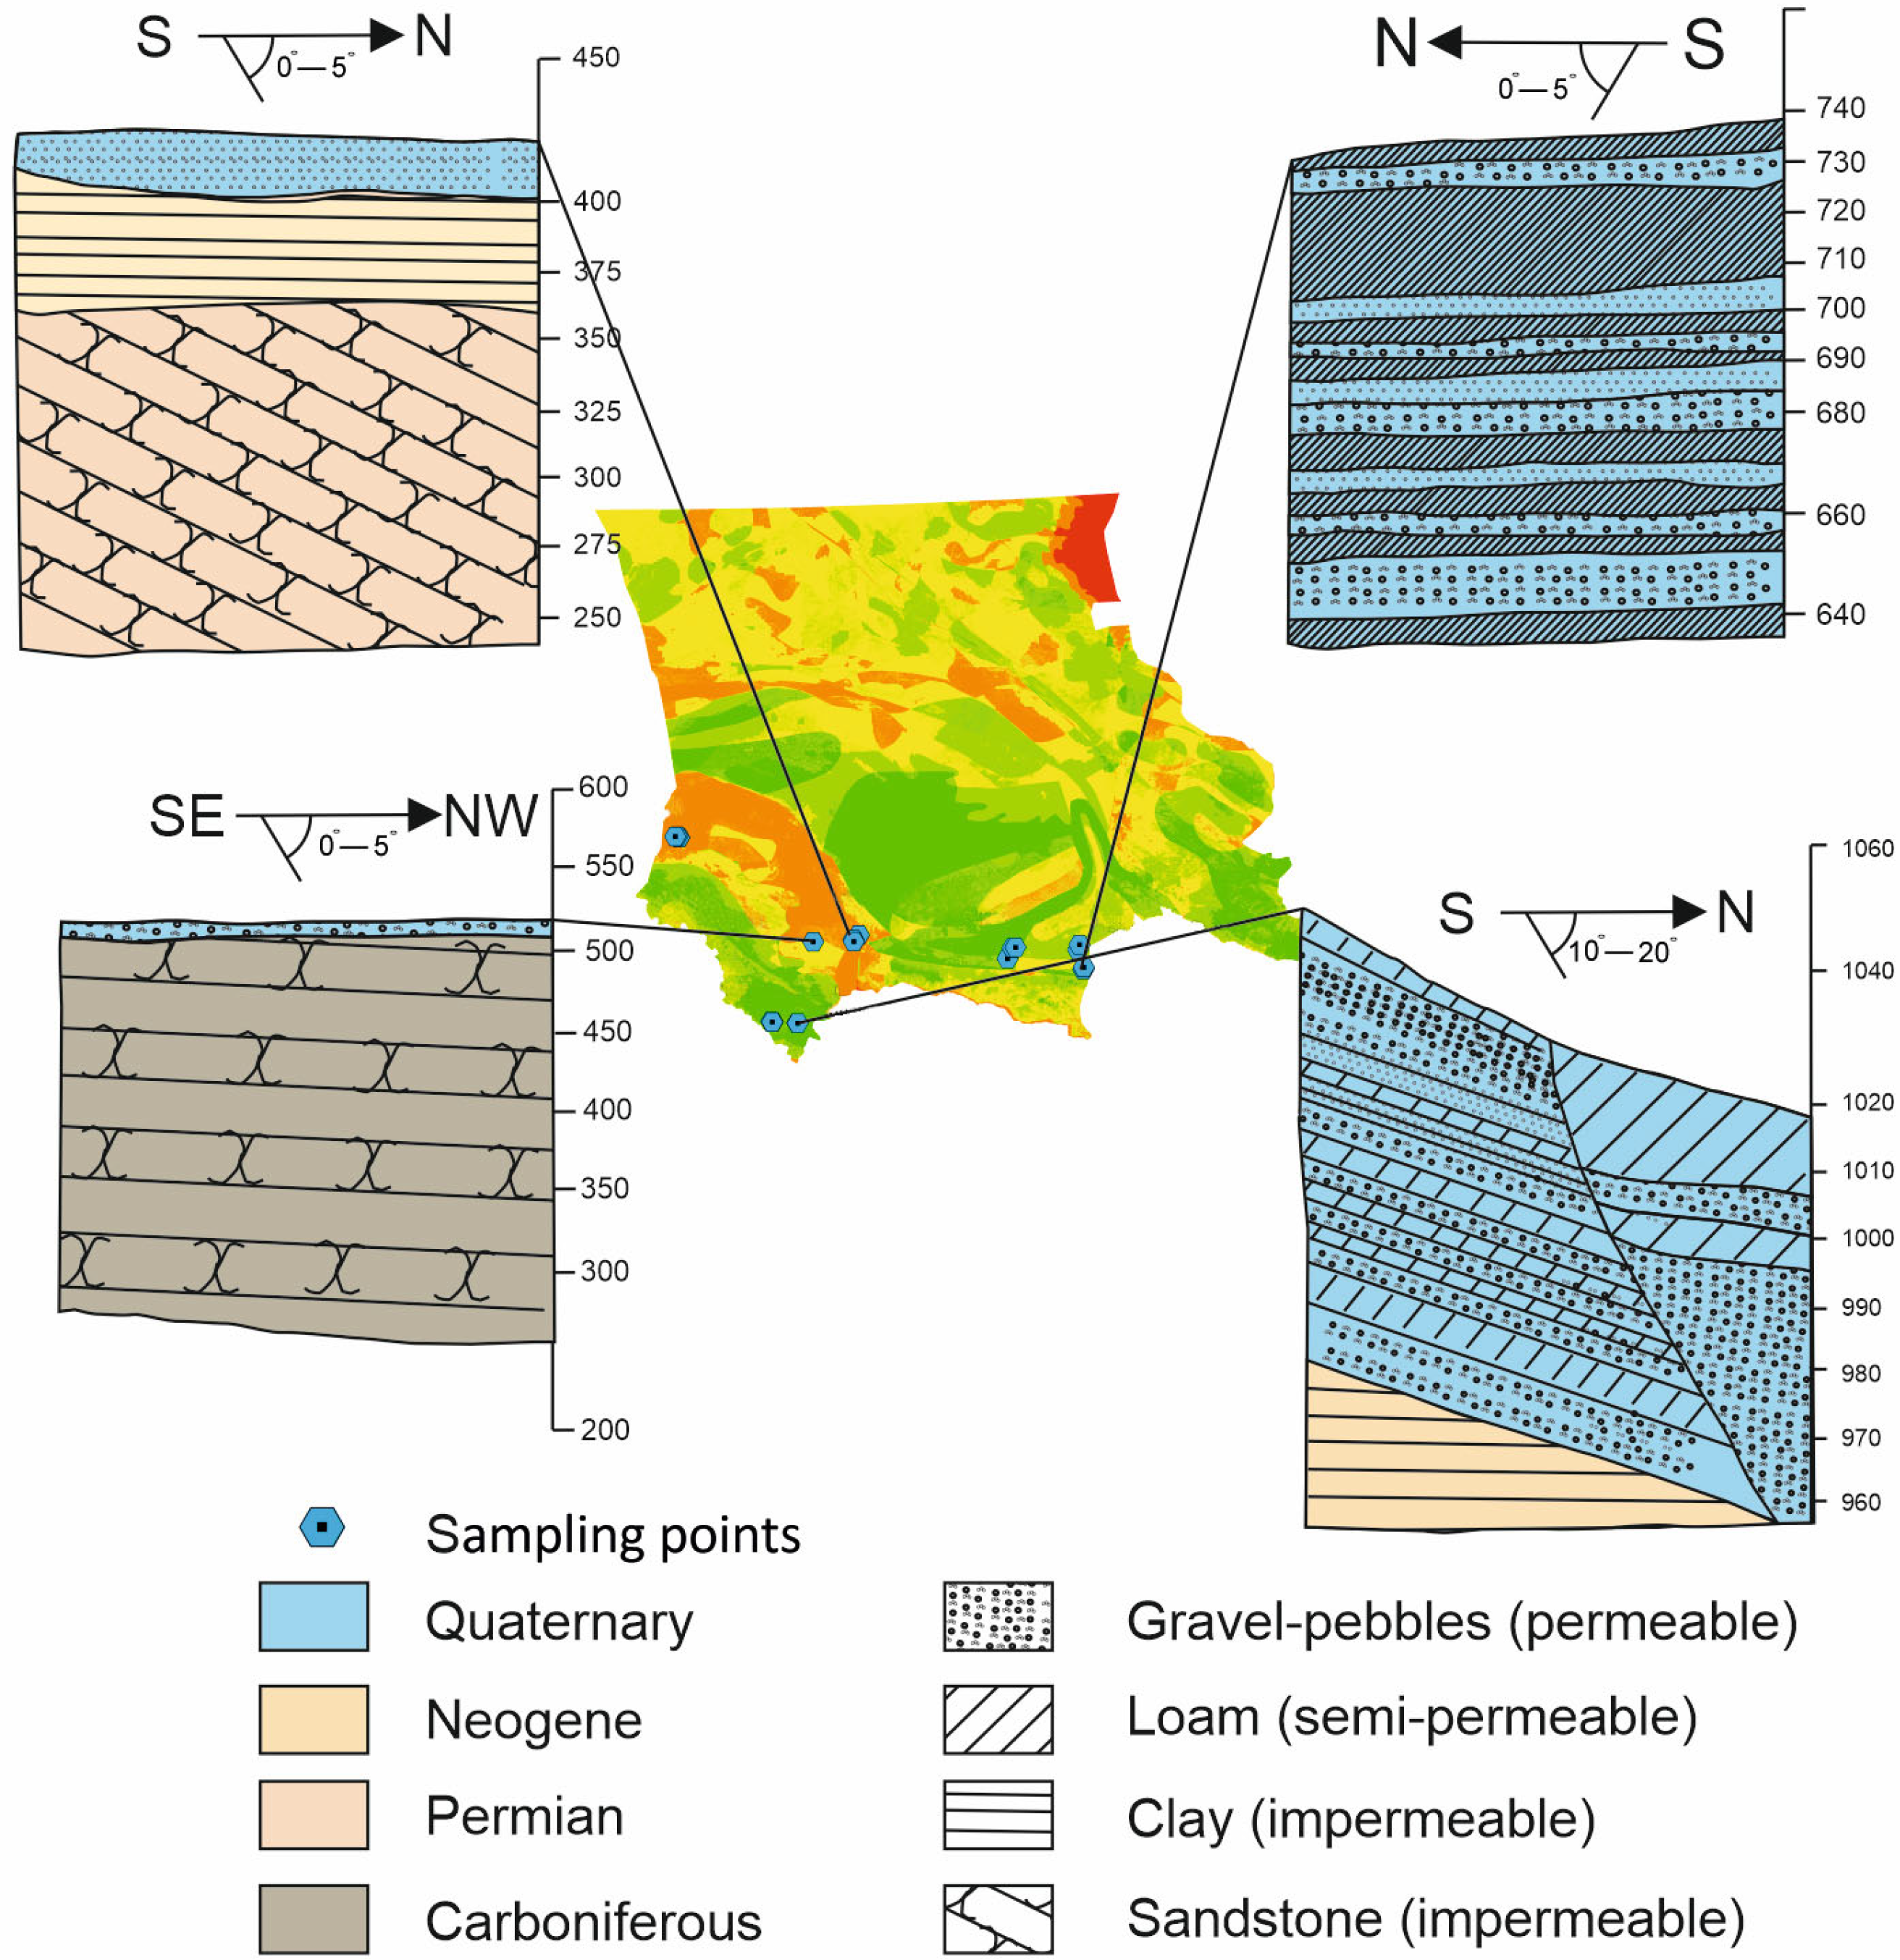
The comprehensive evaluation of Zhambyl region’s aquifer systems through the AHP methodology identified significant potential for implementing MAR technologies. Our findings indicate that approximately 19% (27,060 km2) of the region’s territory exhibits optimal hydrogeological conditions for MAR implementation, characterized by: shallow unconfined aquifers (5–20 m depth) in Quaternary alluvial–proluvial deposits low TDS groundwater (<1 g/L) of Ca-HCO3 type, and favorable infiltration rates (20–90 L/s) in proximal fan settings Figure 16). These high-potential zones are predominantly concentrated along the piedmont of the Kyrgyz Alatau range and within the Talas-Assa interfluve, where hydraulic conductivity exceeds 15 m/day (Figure 17).
Monte Carlo outcomes confirmed the robustness of the AHP-derived suitability surface underweight perturbations. The ensemble mean (MC_mean) closely matched the baseline AHP map, whereas the standard deviation (MC_std) and coefficient of variation (MC_cv) highlighted localized uncertainty along major drainage corridors and lineament zones. The probability surface P(SI ≥ 0.70) further delineated areas where high suitability was consistently reproduced across iterations, reinforcing the stability of piedmont alluvial fans as priority MAR zones (Figure 18).
The fuzzy gamma evaluation (γ = 0.88) reproduced the main suitability trends identified by AHP but yielded systematically lower scores, consistent with its conservative aggregation logic. A pixel-wise comparison revealed a mean absolute error of approximately 0.41 and a correlation coefficient of 0.47 between the AHP and fuzzy maps, while the histogram of differences demonstrated a negative bias, indicating systematic underestimation by the fuzzy approach (Figure 19).
The current water management paradigm reveals a critical disconnect between available groundwater resources (8.33 km3/year renewable, including 5.45 km3/year with TDS <1 g/L) and irrigation practices that exclusively utilize surface water from the Shu (3.92 km3/year mean discharge) and Talas (2.32 km3/year in drought conditions) river systems. This reliance on ephemeral surface supplies has contributed to the abandonment of 15,400 ha (11%) of formerly irrigated lands, with 3300 ha affected by secondary salinization and 11,250 ha abandoned due to canal system deterioration. From a hydrostratigraphic perspective, three principal aquifer systems demonstrate particular suitability for MAR:
Quaternary alluvial–proluvial sequences in the Aspara and Merke fields (Kₓ: 10−3–10−2 m/s)
Neogene–Quaternary unconsolidated deposits of the Shu-Sarysu depression (specific yields: 25–85 L/s)
Fractured carbonate aquifers in Carboniferous karst systems (estimated recharge rates: 150–300 mm/year).
The technical feasibility of MAR implementation is further supported by favorable vadose zone characteristics in 63% of irrigated areas, where groundwater quality (TDS < 1 g/L) and depth (>3 m) minimize salinization risks. Our analysis suggests that strategic MAR deployment could potentially recover 37,500 ha of degraded irrigation lands, particularly in the Shu and Talas districts, where shallow water tables (1–3 m depth across 38% of the study area) currently contribute to waterlogging. Implementation priorities should focus on
Pilot infiltration galleries in the Biylikol field (Qₜ: 82 L/s, sustainable yield);
Check dam systems along ephemeral channels in the Talas-Assa interfluve;
Injection wells targeting the Asparinskoe Quaternary aquifer (transmissivity: 500–800 m2/day).
This assessment underscores the need for detailed hydrodynamic modeling to optimize recharge rates while preventing water table rise in areas with shallow phreatic surfaces. Future work should incorporate stable isotope analysis (δ18O, δ2H) to quantify recharge mechanisms and age-dating (3H, 14C) to assess aquifer vulnerability in proposed MAR zones. The integration of these hydrogeological findings with socio-economic assessments will be crucial for developing sustainable water management strategies in this agriculturally critical region.

4. Discussion

The integration of remote sensing, GIS, and the Analytic Hierarchy Process (AHP) in this study has enabled a spatially explicit, multi-criteria evaluation of Managed Aquifer Recharge (MAR) suitability across the semi-arid landscapes of the Zhambyl Region. The geospatial framework provides an efficient alternative to conventional MAR feasibility assessments, which often rely on sparse hydrogeological field data and offer limited spatial resolution. By incorporating multiple thematic layers—both physical (e.g., slope, aquifer depth, soil texture) and anthropogenic (e.g., land use, NDVI)—the model accounts for the heterogeneous conditions affecting recharge processes.
One of the notable outcomes of the AHP analysis is the relatively high weight assigned to terrain slope, which was quantified at 0.17. This deviates from conventional MAR studies, where slope is typically assigned moderate importance (e.g., <0.10 in similar semi-arid contexts). In the specific context of small dam-based MAR techniques, however, slope becomes a critical factor: areas with gentle slopes (2–8%) facilitate surface water retention and enhance infiltration potential, while steeper terrains increase runoff losses. Importantly, this interpretation was reinforced by the robustness analyses: both the fuzzy gamma operator and Monte Carlo simulations confirmed slope as a consistently influential factor across methodological variations. This convergence suggests that the unusually high slope weight observed in the Zhambyl Region is not a methodological artefact but reflects the genuine hydro-geomorphological control on MAR feasibility in piedmont environments.
The study further emphasizes the value of updating archival datasets with ground-truthed observations. For example, combining recent groundwater salinity data with historical hydrogeological maps allowed for the identification of previously overlooked zones affected by secondary salinization—particularly in the Talas-Assa interfluve. Likewise, NDVI layers derived from mid-summer satellite imagery highlighted vegetation-stressed areas where MAR interventions could simultaneously support ecological restoration and groundwater recovery.
Comparison with international MAR suitability studies [4,11,38] confirms alignment in methodological logic but reveals divergence in parameter prioritization. A similar divergence is evident when compared with Central Asian studies: a recent national-scale MAR mapping for Kazakhstan produced relatively coarse screening outputs relying exclusively on open-source datasets and generalized physical criteria, without field-based validation. Conducted at a broad mapping scale, this assessment did not incorporate detailed hydrogeological features such as shallow aquifer depth (SAD) and groundwater mineralization (GWM), thereby limiting its resolution for site-specific planning [16]. By contrast, irrigation-recharge studies in Uzbekistan, particularly in the Khorezm and Fergana regions, have emphasized the role of groundwater table dynamics, salinity control, and irrigation-induced recharge processes, especially through canal leakage and field percolation [39,40]. This contrast underscores how regional hydro-geomorphic and water-management regimes govern the weighting of MAR suitability criteria.
The integration of fuzzy logic and Monte Carlo simulation provided a unified framework for uncertainty and robustness assessment. While the fuzzy gamma operator accounted for ambiguity in criterion thresholds and ensured conservative suitability estimates, the Monte Carlo experiment quantified the sensitivity of results to subjective weight assignment. Together, these approaches revealed that the overall spatial structure of suitability is resilient to methodological variation, with convergence of AHP, fuzzy, and MC_mean maps supporting the reliability of identified hotspots. At the same time, elevated uncertainty near drainage and structural features underscores the need for targeted field validation. By jointly applying deterministic (AHP), fuzzy, and stochastic (MC) evaluations, the analysis established a more transparent and defensible basis for MAR site prioritization.
In addition, the present analysis did not incorporate quantitative field measurements of infiltration rates, aquifer storage capacity, or spatially distributed hydraulic conductivity and transmissivity, primarily due to the spatial limitations of available datasets. Consequently, MAR feasibility was evaluated in terms of relative rather than absolute infiltration potential, and the results should be regarded as a screening-level suitability assessment. Future research should refine this framework by integrating in situ infiltration testing, aquifer pumping data, and numerical groundwater modeling, thereby enabling a more detailed evaluation of recharge sustainability and long-term feasibility [38].
Climate variability and interannual groundwater fluctuations were not explicitly incorporated into the current modeling framework, as the primary objective was to generate a spatially explicit baseline assessment of MAR suitability. The resulting maps should therefore be interpreted as representative of average hydroclimatic conditions. While this design provides a robust basis for site prioritization under present-day conditions, future studies may complement the analysis by integrating transient groundwater modeling and climate projections to assess long-term resilience.
Lastly, by incorporating socio-environmental layers such as land abandonment and irrigation system degradation, the MAR suitability extends beyond hydrological viability to address pressing land management challenges. It provides a decision-support tool for integrating groundwater sustainability with rural development strategies, particularly in water-stressed, agriculture-dependent regions of Central Asia.

5. Conclusions

This study confirms the value of a GIS-based multi-criteria evaluation approach, underpinned by the Analytic Hierarchy Process (AHP), for delineating suitable zones for Managed Aquifer Recharge (MAR) using small-scale dam structures in the Zhambyl Region of southern Kazakhstan. By integrating nine key spatial criteria—including aquifer depth, groundwater salinity, terrain slope, precipitation, and drainage density—the model identified approximately 19% of the study area (around 27,060 km2) as highly favorable for MAR implementation.
Ground-based hydrochemical sampling and terrain verification validated the model’s outputs, confirming the presence of shallow, fresh, and transmissive aquifers in several priority zones. The most promising recharge areas are located along Quaternary alluvial–proluvial fans at the piedmont of the Kyrgyz Alatau and within tectonically influenced zones of the Talas-Assa interfluve. These areas align hydrologically and morphologically with the operational requirements of small dam-based recharge schemes.
This spatial framework provides not only an academic contribution to understanding groundwater recharge dynamics but also a practical decision-support tool for regional water managers, environmental planners, and donor-backed infrastructure programs. Its reliance on open-access satellite data and structured expert input makes the method replicable in other semi-arid, data-constrained settings of Central Asia.
Nonetheless, the approach has delimitations, particularly the use of static inputs without temporal dynamics or detailed subsurface hydraulic conductivity data. Future research should incorporate time-series observations (e.g., GRACE gravity anomalies, InSAR deformation data, or isotopic tracing) and integrate coupled surface–subsurface models to quantify recharge fluxes under variable climate and land-use scenarios.
The outcomes of this work lay the foundation for technically sound, economically efficient, and environmentally sustainable design and prioritization of MAR infrastructure. As climate variability and water scarcity continue to threaten agricultural production and ecosystem services, this study offers a timely and adaptable planning instrument for enhancing groundwater resilience in the region.

Author Contributions

Z.O. was responsible for conceptualisation, formal analysis, methodology and writing the manuscript. T.R. was responsible for organising and conducting the expedition research. R.B. was responsible for formal analysis, methodology, reviewing and writing the initial draft. K.T. was responsible for writing, reviewing and conceptualising. V.R. was responsible for translation, editing, preparation of tables and digitisation of graphics. I.R. was responsible for the computational part and research results. A.J. was responsible for conducting expedition research and analyses. M.M. was responsible for writing the initial draft of the article. All authors have read and agreed to the published version of the manuscript.

Funding

This study was funded by the Science Committee of the Ministry of Science and Higher Education of the Republic of Kazakhstan (‘Groundwater Resources as the Main Reserve for Sustainable Irrigated Agriculture in Kazakhstan’ No. BR 21882211).

Data Availability Statement

The original contributions presented in this study are included in the article. Further inquiries can be directed to the corresponding author.

Conflicts of Interest

The authors declare no conflicts of interest.

Appendix A

Appendix A.1. Results of Soil Sampling in the Zhambul Region

Table A1. Results of granulometric composition of soils in the Zhambul region.
Sampling
No.
DateFraction Content, %Soil Type
Fraction Size, mm
>200200–1010–55–22–11–0.50.5–0.250.25–0.10.1–0.050.05–0.010.01–0.0050.005–0.001<0.001
120-119/05/2024--0.250.750.670.793.746.8813.7533.7115.2416.367.86dusty heavy loam
120-219/05/2024--0.290.950.790.883.236.3719.6033.0812.2815.057.47dusty heavy loam
120-319/05/2024---0.980.850.594.126.6818.0731.9715.0213.917.81dusty heavy loam
120-420/05/2024------1.704.2014.6441.9613.366.6717.46dusty heavy loam
120-520/05/2024------1.503.8015.6443.0212.8612.3010.86dusty heavy loam
120-623/05/2024--1.001.370.620.104.466.6020.4125.2211.3215.2013.70dusty heavy loam
120-723/05/2024--0.821.450.560.193.697.4821.4827.477.9015.8713.08dusty heavy loam
120-823/05/2024--0.621.870.710.292.716.6821.8229.399.369.6516.90dusty heavy loam
120-927/05/2024------1.003.0015.2829.4013.9316.6020.79clay
120-1027/05/2024------0.702.8014.8430.3312.7718.1020.46clay
120-1127/05/2024------1.002.7012.2133.709.6020.3320.46clay
120-1228/05/2024------1.503.0018.2739.929.6615.3312.29dusty heavy loam
120-1328/05/2024---0.040.140.706.896.5913.0546.598.3211.556.15dusty heavy loam
120-1428/05/2024----0.010.200.806.1015.4447.098.3012.639.42dusty heavy loam
120-1529/05/2024---0.370.330.202.482.9820.1029.729.9320.1913.69clay
120-1629/05/2024---0.340.310.102.582.8820.2830.4310.6618.1214.30clay
120-1729/05/2024---0.360.370.102.982.6819.9930.4710.6518.4013.99clay
120-1830/05/2024--0.510.120.090.100.793.0815.1840.2812.2712.5515.03dusty heavy loam
120-1930/05/2024--0.480.110.10-0.893.1820.6038.0710.8214.3711.38dusty heavy loam
120-2020/05/2024--0.370.100.10-0.702.9825.3934.1012.3012.4611.49dusty heavy loam
120-2103/06/2024---0.010.210.201.403.7917.1036.5813.3014.2013.20dusty heavy loam
120-2203/06/2024---0.040.230.301.303.9918.2935.4410.6016.6213.19dusty heavy loam
120-2306/06/2024----0.06-0.104.6014.5040.6411.6617.6610.78dusty heavy loam
120-2406/06/2024----0.07-0.204.5014.9640.4411.3917.6510.78dusty heavy loam
120-2506/06/2024----0.06--3.6015.6039.9713.3616.6210.78dusty heavy loam
120-2612/06/2024----0.08--2.4017.2340.1012.7217.699.78dusty heavy loam
120-2712/06/2024----0.09--2.1017.0940.9612.3216.9810.45dusty heavy loam
120-2812/06/2024---0.160.050.701.105.2918.1437.6210.9116.669.37dusty heavy loam
Table A2. Results of soil humus and petroleum hydrocarbons analysis in the Zhambyl Region.
Sampling
No.
Sampling LocationDepth, mDateHumusPetroleum Hydrocarbons
%mg/kg
120-1Kordai district (Georgievskoe–Talapty wellfield)0.519/05/20240.03290.0077
1.019/05/20240.03480.0075
0.5 and 1.019/05/20240.03360.0076
120-2Kordai district (Georgievskoe–Talapty wellfield)0.519/05/20240.04210.0081
1.019/05/20240.03850.0078
0.5 and 1.019/05/20240.04150.0078
120-3Kordai district (Georgievskoe–Talapty wellfield)0.519/05/20240.02710.0076
1.019/05/20240.02890.0072
0.5 and 1.019/05/20240.02780.0075
120-4Akermensky District (Asparinskoe Wellfield)0.520/05/20240.02950.005
1.020/05/20240.02190.0043
0.5 and 1.020/05/20240.02530.0046
120-5Akermensky District (Asparinskoe Wellfield)0.520/05/20240.03250.0053
1.020/05/20240.02640.0044
0.5 and 1.020/05/20240.02860.0049
120-6Andas Batyr District (Merke Wellfield)0.523/05/20240.04050.0041
1.023/05/20240.04650.0038
0.5 and 1.023/05/20240.04370.0038
120-7Andas Batyr District (Merke Wellfield)0.523/05/20240.04630.0043
1.023/05/20240.04330.0038
0.5 and 1.023/05/20240.04660.0041
120-8Andas Batyr District (Merke Wellfield)0.523/05/20240.04010.0039
1.023/05/20240.04040.0033
0.5 and 1.023/05/20240.04030.0034
120-9Akbulaksky District (Lugovskoye wellfield)0.527/05/20240.02720.0041
1.027/05/20240.02840.0039
0.5 and 1.027/05/20240.0270.0041
120-10Akbulaksky District (Lugovskoye wellfield))0.527/05/20240.03390.0041
1.027/05/20240.03960.0039
0.5 and 1.027/05/20240.03830.004
120-11Akbulaksky District (Lugovskoye wellfield)0.527/05/20240.03010.0044
1.027/05/20240.03120.0041
0.5 and 1.027/05/20240.03090.0042
120-12Akyrtobinsky District (Podgornenskoe Wellfield)0.528/05/20240.01720.0023
1.028/05/20240.02090.0018
0.5 and 1.028/05/20240.01770.0022
120-13Abai District (Podgornenskoe Wellfield))0.528/05/20240.02550.0016
1.028/05/20240.01980.0012
0.5 and 1.028/05/20240.0220.0014
120-14Zhanaturmysky District (Podgornenskoe Wellfield)0.528/05/20240.04520.0026
1.028/05/20240.03460.0021
0.5 and 1.028/05/20240.05080.0022
120-15Mynbulaksky District (Dzhvalinskoe Wellfield)0.529/05/20240.04790.0035
1.029/05/20240.05030.0032
0.5 and 1.029/05/20240.05050.0033
120-16Mynbulaksky District (Dzhvalinskoe Wellfield)0.529/05/20240.0560.0043
1.029/05/20240.05350.004
0.5 and 1.029/05/20240.05880.0042
120-17Mynbulaksky District (Dzhvalinskoe Wellfield)0.529/05/20240.0460.0043
1.029/05/20240.04770.0035
0.5 and 1.029/05/20240.04410.0042
120-18Shakpaksky District (Shakpakata Wellfield)0.530/05/20240.02280.003
1.030/05/20240.0290.0028
0.5 and 1.030/05/20240.0280.0029
120-19Shakpaksky District (Shakpakata Wellfield)0.530/05/20240.02770.0033
1.030/05/20240.02590.0029
0.5 and 1.030/05/20240.02730.003
120-20Shakpaksky District (Shakpakata Wellfield)0.530/05/20240.02750.0032
1.030/05/20240.02610.0029
0.5 and 1.030/05/20240.02620.0029
120-21Karakemersky District (Biilikol Wellfield)0.503/06/20240.02780.0032
1.003/06/20240.02270.0027
0.5 and 1.003/06/20240.02650.0026
120-22Karakemersky District (Biilikol Wellfield)0.503/06/20240.02380.0039
1.003/06/20240.02140.0029
0.5 and 1.003/06/20240.02330.0036
120-23Baykadamsky District (Akzhar Wellfield)0.506/06/20240.02030.0032
1.006/06/20240.02330.003
0.5 and 1.006/06/20240.02160.0031
120-24Baykadamsky District (Akzhar Wellfield)0.506/06/20240.02520.0038
1.006/06/20240.02190.0036
0.5 and 1.006/06/20240.02540.0038
120-25Baykadamsky District (Akzhar Wellfield)0.506/06/20240.0220.0039
1.006/06/20240.0260.0036
0.5 and 1.006/06/20240.02340.0036
120-26 Madimar Yntymaksky District (Talas-Assa Wellfield)0.512/06/20240.03090.0054
1.012/06/20240.03180.0052
0.5 and 1.012/06/20240.03090.0054
120-27 Madimar Yntymaksky District (Talas-Assa Wellfield)0.512/06/20240.03050.0054
1.012/06/20240.03270.0048
0.5 and 1.012/06/20240.03110.0052
120-28Zhalgyztobinsky District (Talas-Assa Wellfield)0.512/06/20240.11670.0032
1.012/06/20240.13510.0029
0.5 and 1.012/06/20240.11560.0031

Appendix A.2. Results of Groundwater Sampling in the Zhambul Region

Table A3. Results of groundwater sampling in the Zhambul region.
Sampling LocationCa (meq%)Mg (meq%)Na + K (meq%)Cl (meq%)CO3 + HCO3 (meq%)SO4 (meq%)TDS (mg/L)pH
well No.1, Aspara wellfield30.8124.0045.188.7482.079.20807.8
well No.2, Aspara wellfield30.1324.6945.189.2376.2514.5294.57.88
well No.3, Aspara wellfield22.8017.1360.0714.1367.2218.65978.17
well No.4, Merke wellfield66.5218.1715.318.5484.966.50858.06
well No.5, Merke wellfield61.6916.8521.456.5584.558.9088.37.98
well No.6, Merke wellfield53.6511.3135.048.3979.7911.8293.57.91
well No.7, Merke wellfield51.5825.8322.598.0384.247.73877.87
well No.8, Merke wellfield50.2222.6427.146.7981.4411.781027.79
well No.9, Lygovskoye wellfield39.9825.1734.8519.0746.4834.452347.48
well No.10, Merke wellfield26.0037.7536.2530.8019.4249.792347.48
well No.11, Merke wellfield24.9232.7642.3319.2152.1928.601838.16
well No.12, Zhualy wellfield45.9841.4512.564.5082.9512.541037.23
well No.13, Zhualy wellfield45.1142.8312.064.8481.9513.221037.99
well No.14, Zhualy wellfield46.2041.4012.405.2081.6313.171028.03
well No.15, Shakpakty wellfield53.6336.2310.144.4590.045.511867.97
well No.16, Shakpakty wellfield53.3136.0810.615.8988.775.341607.48
well No.17, Shakpakty wellfield54.0134.6811.316.0488.245.721737.97
well No.18, Bijlikol wellfield33.5820.5145.929.8344.3145.863317.96
well No.19, Akzhar wellfield38.6028.9932.417.1468.3624.502628
well No.20, Akzhar wellfield35.3133.3531.347.0168.1824.812538.01
well No.21, Akzhar wellfield32.2426.5941.169.8067.5422.662698.03
well No.22, Akzhar wellfield29.4025.7644.849.3663.6526.982998.08
well No.23, Talas-Assa wellfield45.9036.8917.2112.4358.8128.774707.58
well No.24, Talas-Assa wellfield50.2635.3714.378.9764.6926.353537.58
well No.25, Talas-Assa wellfield51.7534.7913.469.0966.1524.763387.67

References

  1. Adenova, D.; Tazhiyev, S.; Sagin, J.; Absametov, M.; Murtazin, Y.; Trushel, L.; Miroshnichenko, O.; Zaryab, A. Groundwater quality and potential health risk in Zhambyl Regio, Kazakhstan. Water 2023, 15, 482. [Google Scholar] [CrossRef]
  2. Absametov, M.K.; Murtazin, E.Z.; Ospanov, K.T.; Smolyar, V.A. Groundwater Resource Potential of Kazakhstan as a Source of Sustainable Drinking Water Supply; Smart University Press: Almaty, Republic of Kazakhstan, 2023. [Google Scholar]
  3. Absametov, M.K.; Ayazbayev, R.; Kuldeev, E.I.; Murtazin, E.Z.; Smolyar, V.A. Atlas of Hydrogeological Maps of the Republic of Kazakhstan; Institute of Hydrogeology and Geoecology Named After Ahmedsafin: Almaty, Republic of Kazakhstan, 2023. [Google Scholar]
  4. Mouhoumed, R.M.; Ekmekcioğlu, Ö.; Başakın, E.E.; Özger, M. Integrated fuzzy AHP-TOPSIS model for assessing managed aquifer recharge potential in a hot dry region: A case study of Djibouti at a country scale. Water 2023, 15, 2534. [Google Scholar] [CrossRef]
  5. Seif, A.K.; Masria, A.; Ghareeb, M.; Saleh, A.A.; Soliman, K.; Ammar, A.I. Identifying managed aquifer recharge and rainwater harvesting sites and structures for storing non-conventional water using GIS-based multi-criteria decision analysis approach. Appl. Water Sci. 2024, 14, 181. [Google Scholar] [CrossRef]
  6. Canora, F.; Muzzillo, R.; Sdao, F. Groundwater vulnerability assessment in the Metaponto coastal plain (Basilicata, Italy). Water 2022, 14, 1851. [Google Scholar] [CrossRef]
  7. Speijer, L.; Six, S.; van der Grift, B.; Cirkel, D.G.; Verreydt, G.; Dams, J.; Huysmans, M. Enhancing groundwater recharge in drinking water protection zones in Flanders (Belgium): A novel approach to assess stormwater managed aquifer recharge potential. J. Hydrol. Reg. Stud. 2024, 50, 101747. [Google Scholar] [CrossRef]
  8. Maréchal, J.-C.; Bouzit, M.; Rinaudo, J.-D.; Moiroux, F.; Desprats, J.-F.; Caballero, Y. Mapping economic feasibility of managed aquifer recharge. Water 2020, 12, 680. [Google Scholar] [CrossRef]
  9. Ebrahim, G.Y.; Stefan, C.; Sallwey, J.; Lautze, J. Mapping the potential of managed aquifer recharge in Africa: GIS-based multi-criteria decision analysis approach. Groundw. Sustain. Dev. 2024, 14, 101374. [Google Scholar] [CrossRef]
  10. Hani, H.M.; El Din, M.M.N.; Khalifa, A.; Elalfy, E. Development of suitability map for managed aquifer recharge: Case study, West Delta, Egypt. Aqua 2023, 72, 868–884. [Google Scholar] [CrossRef]
  11. Afzal, M.; Liu, T.; Butt, A.Q.; Nadeem, A.A.; Ali, S.; Pan, X. Geospatial assessment of managed aquifer recharge potential sites in Punjab, Pakistan. Remote Sens. 2023, 15, 3988. [Google Scholar] [CrossRef]
  12. Farswan, S.; Vishwakarma, C.A.; Mina, U.; Kumar, V.; Mukherjee, S. Assessment of rainwater harvesting sites in a part of North-West Delhi, India using geomatic tools. Environ. Earth Sci. 2019, 78, 329. [Google Scholar] [CrossRef]
  13. Alelaimat, A.; Yusoff, I.; Nizar, M.K.; Ng, T.F.; Majali, Y.A. Groundwater management in the face of climate change: Enhancing groundwater storage in the alluvium aquifer of Wadi Arabah, Jordan, through GIS-based managed aquifer recharge and groundwater MODFLOW. Water Supply 2023, 23, 5136–5153. [Google Scholar] [CrossRef]
  14. Sallwey, J.; Ongdas, N.; Al-Hosban, M.; Stefan, C. Mapping the potential for managed aquifer recharge in Kazakhstan. Cent. Asian J. Water Res. 2024, 10, 95–116. [Google Scholar] [CrossRef]
  15. Russo, T.A.; Fisher, A.T.; Lockwood, B.S. Assessment of managed aquifer recharge site suitability using a GIS and modeling. Groundwater 2015, 53, 389–400. [Google Scholar] [CrossRef] [PubMed]
  16. Yeh, H.-F.; Cheng, Y.-S.; Lin, H.-I.; Lee, C.-H. Mapping groundwater recharge potential zone using a GIS approach in Hualian River, Taiwan. Sustain. Environ. Res. 2016, 26, 33–43. [Google Scholar] [CrossRef]
  17. Sallwey, J.; Bonilla Valverde, J.P.; Vásquez López, F.; Junghanns, R.; Stefan, C. Suitability maps for managed aquifer recharge: A review of multi-criteria decision analysis studies. Environ. Rev. 2019, 27, 138–150. [Google Scholar] [CrossRef]
  18. Mantel, S.K.; Rivers-Moore, N.; Ramulifho, P. Small dams need consideration in riverscape conservation assessments. Aquat. Conserv. 2017, 27, 748–754. [Google Scholar] [CrossRef]
  19. Ashraf, M.; Kahlown, M.A.; Ashfaq, A. Impact of small dams on agriculture and groundwater development: A case study from Pakistan. Agric. Water Manag. 2007, 92, 90–98. [Google Scholar] [CrossRef]
  20. Escalante, E.F.; Casas, J.D.H.; Per, C.M.d.G.; Vera, M.D.M.; Valverde, C.M. Unintentional recharge of aquifers from small dams and dykes in Spain: A GIS-based approach to determine a fractional volume. Earth 2023, 4, 584–605. [Google Scholar] [CrossRef]
  21. Kazakis, N.; Karakatsanis, D.; Ntona, M.M.; Polydoropoulos, K.; Zavridou, E.; Voudouri, K.A.; Busico, G.; Kalaitzidou, K.; Patsialis, T.; Perdikaki, M.; et al. Groundwater depletion. Are environmentally friendly energy recharge dams a solution? Water 2024, 16, 1541. [Google Scholar] [CrossRef]
  22. Papadopoulos, C.; Spiliotis, M.; Pliakas, F.; Gkiougkis, I.; Kazakis, N.; Papadopoulos, B. Hybrid Fuzzy Multi-Criteria Analysis for Selecting Discrete Preferable Groundwater Recharge Sites. Water 2022, 14, 107. [Google Scholar] [CrossRef]
  23. Abdulrazzaq, Z.T.; Agbasi, O.E.; Aziz, N.A.; Hamid, O.S.; Abdulrazzaq, A.Z. Identification of potential groundwater locations using geophysical data and fuzzy gamma operator model in Imo, Southeastern Nigeria. Appl. Water Sci. 2020, 10, 188. [Google Scholar] [CrossRef]
  24. Adam, A.B.; Appiah-Adjei, E.K.; Adjei, K.A.; Alhassan, A.; Anim, A.O.; Agodzo, S.K.; Miezah, K. Managed aquifer recharge site suitability analysis in the Nabogo Basin of Ghana using GIS and Monte Carlo simulation-aided analytic hierarchy process. Arab. J. Geosci. 2024, 17, 76. [Google Scholar] [CrossRef]
  25. Ligmann-Zielinska, A.; Jankowski, P. Spatially-Explicit Integrated Uncertainty and Sensitivity Analysis of Criteria Weights in Multicriteria Land Suitability Evaluation. Environ. Model. Softw. 2014, 57, 235–247. [Google Scholar] [CrossRef]
  26. UNESCO. The United Nations World Water Development Report 2025: Mountains and Glaciers—Water Towers; United Nations Educational, Scientific and Cultural Organization: Paris, France, 2025; Available online: https://www.unwater.org/publications/un-world-water-development-report-2025 (accessed on 3 September 2025).
  27. ISO/IEC 17025:2017; General Requirements for the Competence of Testing and Calibration Laboratories. International Organization for Standardization. International Electrotechnical Commission: Geneva, Switzerland, 2017. Available online: https://www.iasonline.org/services/testing-laboratories/ (accessed on 14 September 2025).
  28. Messerschmid, C.; Aliewi, A. Spatial distribution of groundwater recharge based on regionalized soil moisture models in Wadi Natuf karst aquifers, Palestine. Hydrol. Earth Syst. Sci. 2022, 26, 1043–1061. [Google Scholar] [CrossRef]
  29. Scanlon, B.R.; Keese, K.E.; Flint, A.L.; Flint, L.E.; Gaye, C.B.; Edmunds, W.M.; Simmers, I. Global synthesis of groundwater recharge in semiarid and arid regions. Hydrol. Process. 2006, 20, 3335–3370. [Google Scholar] [CrossRef]
  30. Hassan, W.H.; Ghanim, A.A.J.; Mahdi, K.; Adham, A.; Mahdi, F.A.; Nile, B.K.; Riksen, M.; Ritsema, C. Effect of artificial (pond) recharge on the salinity and groundwater level in Al-Dibdibba aquifer in Iraq using treated wastewater. Water 2023, 15, 695. [Google Scholar] [CrossRef]
  31. Diriba, D.; Karuppannan, S.; Takele, T.; Husein, M. Delineation of groundwater potential zonation using geoinformatics and AHP techniques with remote sensing data. Heliyon 2024, 10, e25532. [Google Scholar] [CrossRef]
  32. Thiyagarajan, S.; Subbarayan, S. Groundwater potential zone mapping using analytical hierarchy process (AHP) and GIS for Kancheepuram District, Tamil Nadu, India. Model. Earth Syst. Environ. 2020, 6, 1105–1122. [Google Scholar] [CrossRef]
  33. Kassa, A.; Roba, N.; Habtamu, A.; Girma, B.; Adane, Z. Identifying groundwater recharge potential zone using analytical hierarchy process (AHP) in the semi-arid Shinile watershed, Eastern Ethiopia. Water Pract. Technol. 2023, 18, 2841–2858. [Google Scholar] [CrossRef]
  34. Maliva, R. Managed aquifer recharge: State-of-the-art and opportunities. Water Supply 2015, 15, 578–588. [Google Scholar] [CrossRef]
  35. Zhang, H.; Xu, Y.; Kanyerere, T. Site assessment for MAR through GIS and modeling in West Coast, South Africa. Water 2019, 11, 1646. [Google Scholar] [CrossRef]
  36. Parizi, E.; Hosseini, S.M.; Ataie-Ashtiani, B.; Simmons, C.T. Normalized difference vegetation index as the dominant predicting factor of groundwater recharge in phreatic aquifers: Case studies across Iran. Sci. Rep. 2020, 10, 17473. [Google Scholar] [CrossRef] [PubMed]
  37. El-Bagoury, H.; Darwish, M.; Hassan, S.; Oh, S.; Attia, K.; Megahed, H. Potentiality Delineation of Groundwater Recharge in Arid Regions Using Multi-Criteria Analysis. Water 2025, 17, 766. [Google Scholar] [CrossRef]
  38. Kumar, V.; Chaplot, B.; Omar, P.J.; Mishra, S.; Azamathulla, H.M. Experimental Study on Infiltration Pattern: Opportunities for Sustainable Management in the Northern Region of India. Water Sci. Technol. 2021, 84, 2675–2685. [Google Scholar] [CrossRef]
  39. Ibrakhimov, M.; Khamzina, A.; Forkutsa, I.; Lamers, J.P.A.; Tischbein, B.; Vlek, P.L.G.; Martius, C. Groundwater table and salinity: Spatial and temporal distribution and influence on soil salinization in Khorezm region (Uzbekistan, Aral Sea Basin). Irrig. Drain. Syst. 2007, 21, 219–236. [Google Scholar] [CrossRef]
  40. Karimov, A.K.; Amirova, I.; Karimov, A.A.; Tohirov, A.; Abdurakhmanov, B. Water, Energy and Carbon Tradeoffs of Groundwater Irrigation-Based Food Production: Case Studies from Fergana Valley, Central Asia. Sustainability 2022, 14, 1451. [Google Scholar] [CrossRef]
Figure 1. Experimental case study area, the Zhambyl region in South Kazakhstan.
Water 17 02774 g001
Figure 2. Zhambyl Region natural groundwater resource formation.
Water 17 02774 g002
Figure 3. Zhambyl Region groundwater resource distribution.
Water 17 02774 g003
Figure 4. Groundwater use in the Zhambyl Region.
Water 17 02774 g004
Figure 5. Hydrogeological map of the Zhambyl Region [3].
Water 17 02774 g005
Figure 6. Hydrochemical characteristics of groundwater from monitoring wells within the MAR suitability zones in the Zhambyl region.
Water 17 02774 g006
Figure 7. Spatial distribution of shallow aquifer depth in the Zhambyl region.
Water 17 02774 g007
Figure 8. Groundwater mineralization for the Zhambyl Region.
Water 17 02774 g008
Figure 9. Lineament density map for the Zhambyl Region.
Water 17 02774 g009
Figure 10. Soil types of the Zhambyl Region.
Water 17 02774 g010
Figure 11. Land Use and Land Cover (LULC) of the Zhambyl Region.
Water 17 02774 g011
Figure 12. Drainage density map of the Zhambyl Region.
Water 17 02774 g012
Figure 13. Rainfall map of the Zhambyl Region.
Water 17 02774 g013
Figure 14. Normalized Difference Vegetation Index (NDVI) for the Zhambyl Region.
Water 17 02774 g014
Figure 15. Slope map of the Zhambyl Region.
Water 17 02774 g015
Figure 16. AHP and GIS-Based Multi-Criteria Decision Analysis results for the Zhambyl Region.
Water 17 02774 g016
Figure 17. Cross-sections of sampled groundwater deposits in the Zhambyl Region.
Water 17 02774 g017
Figure 18. Monte Carlo sensitivity analysis of AHP-derived MAR suitability model: (a) coefficient of variation (MC_cv), (b) pixel-wise mean (MC_mean), (c) probability of SI ≥ 0.70 (MC_prob ≥ 0.7), (d) standard deviation (MC_std), (e) histogram of MC_mean values for the whole study area, and (f) zone-wise distribution of MC_mean.
Water 17 02774 g018
Figure 19. Comparison between AHP and Fuzzy Gamma results (γ = 0.88): (a) spatial distribution of differences across the study area, (b) scatterplot of AHP versus Fuzzy Gamma values, and (c) histogram of differences (Fuzzy—AHP).
Water 17 02774 g019
Table 1. Identification of Landsat 8/9 data used.
IDPathRowDateCloud %
1LC08_L2SP_150030_20240827_20240831_02_T11503027 August 20246.22
2LC09_L2SP_151029_20240826_20240827_02_T11512926 August 20240.17
3LC08_L2SP_151030_20240802_20240808_02_T1151302 August 202435.05
4LC08_L2SP_152028_20240825_20240831_02_T11522825 August 20244.0
5LC08_L2SP_152029_20240825_20240831_02_T11522925 August 20241.76
6LC08_L2SP_152030_20240825_20240831_02_T11523025 August 20240.25
7LC08_L2SP_153028_20240816_20240822_02_T11532816 August 20244.23
8LC08_L2SP_153029_20240816_20240822_02_T11532916 August 20245.17
9LC09_L2SP_153030_20240808_20240809_02_T1153308 August 20240.19
10LC08_L2SP_154028_20240807_20240814_02_T1154287 August 20245.88
11LC08_L2SP_154029_20240823_20240830_02_T11542923 August 202412.31
12LC08_L2SP_154030_20240823_20240830_02_T11543023 August 202411.78
13LC08_L2SP_155028_20240830_20240906_02_T11552830 August 20240.01
Table 2. Pairwise Comparison Matrix for the Zhambyl Region.
SADMGWMMPMSoil MapSoil MapLULCNDVILDMDDM
SADM1.01.03.03.05.05.07.03.05.0
GWMM1.01.03.03.05.05.07.03.05.0
PM0.30.31.02.03.03.05.01.03.0
Slope Map0.30.30.51.03.03.04.02.03.0
Soil Map0.20.20.30.31.02.02.02.01.0
LULC0.20.20.30.30.51.02.02.01.0
NDVI0.10.10.20.30.50.51.00.50.5
LDM0.30.31.00.50.50.52.01.02.0
DDM0.20.20.30.31.01.02.00.51.0
Disclaimer/Publisher’s Note: The statements, opinions and data contained in all publications are solely those of the individual author(s) and contributor(s) and not of MDPI and/or the editor(s). MDPI and/or the editor(s) disclaim responsibility for any injury to people or property resulting from any ideas, methods, instructions or products referred to in the content.