Article

Phosphorus Loss Risk in the Ju River Basin, China, Under Urbanization and Climate Change: Insights from the Hydrological Simulation Program—FORTRAN (HSPF) Model

1
College of Agriculture, Yangtze University, Jingzhou 434023, China
2
Jingzhou Hydrology and Water Resources Survey Bureau, Jingzhou 434007, China
*
Author to whom correspondence should be addressed.
These authors contributed equally to this work.
Water 2025, 17(18), 2771; https://doi.org/10.3390/w17182771
Submission received: 14 August 2025 / Revised: 11 September 2025 / Accepted: 17 September 2025 / Published: 19 September 2025
(This article belongs to the Topic Water-Soil Pollution Control and Environmental Management)

Abstract

Despite increasing concerns over recurrent phosphorus (P) pollution, the Ju River—a small tributary of the Yangtze River—has received limited scientific attention. To correct this, the present study integrates field-based observations with the Hydrological Simulation Program—FORTRAN (HSPF) model to comprehensively assess the conjunct effects of urban expansion and changing precipitation patterns on watershed hydrology and phosphorus dynamics at the small-catchment scale. A total of five urban expansion scenarios and three precipitation enhancement scenarios were simulated to capture both seasonal and event-driven variations in daily discharge and total phosphorus (TP) concentrations. The model was calibrated and validated using in situ water quality data, ensuring high reliability of the simulations. The results indicate that agricultural non-point sources are the primary contributor to total phosphorus (TP) loads. During the overlapping period of intensive farming and heavy rainfall (June–July), TP concentrations more than doubled compared to other months, with these two months accounting for over 70% of the annual TP load. Urban expansion significantly amplified hydrological extremes, increasing peak discharge by up to 224% under extreme rainfall, thereby intensifying flood risks. Although increased precipitation diluted TP concentrations, it simultaneously accelerated overall phosphorus export. This study offers a novel modeling–monitoring framework tailored for small watersheds and provides critical insights into how land use transitions and climate change jointly reshape nutrient cycling. The findings support the development of targeted, scenario-based strategies to mitigate eutrophication risks in vulnerable river systems.

1. Introduction

Phosphorus (P), together with nitrogen (N) and potassium (K), is one of the three essential macronutrients for agricultural production and plays a vital role in sustaining crop growth and ecosystem productivity [1]. However, unlike N and K, which are predominantly present in soluble forms and easily mobilized by hydrological processes, phosphorus exhibits markedly different environmental behavior. It tends to bind with iron, aluminum, and calcium ions to form insoluble compounds in the soil, greatly limiting its bioavailability [2,3]. Consequently, the global utilization efficiency of phosphorus in agricultural soils remains below 20%, with the majority either immobilized in soils or lost through surface runoff into aquatic ecosystems [1].
Phosphorus inputs to river systems originate from both natural and anthropogenic sources [4]. Natural processes such as rock weathering and soil erosion contribute marginally (<0.1 kg P/ha annually) [5], whereas human-induced inputs—especially from agriculture and urban development—are now the primary drivers of freshwater eutrophication. These inputs typically enter rivers through three main pathways: (1) diffuse agricultural runoff from chemical fertilizers and livestock waste, accounting for 50–60% of riverine P loads globally [6]; (2) urban point sources such as wastewater treatment effluent and combined sewer overflows [7]; and (3) atmospheric deposition, particularly in heavily industrialized regions [8].
Urbanization further alters phosphorus transport dynamics by expanding impervious surfaces, increasing surface runoff rates by two- to three-fold and enhancing P mobilization during storm events [9]. Simultaneously, climate change is intensifying the hydrological cycle, increasing the frequency and intensity of extreme rainfall, and further amplifying the spatiotemporal variability of phosphorus fluxes in watersheds [10,11].
To better understand these dynamics, numerous studies have employed watershed-scale models such as SWAT and HSPF to simulate long-term phosphorus transport under various environmental scenarios. For instance, Bian et al. [12] and Yin et al. [13] applied process-based models to reconstruct decadal-scale P loading trends in the Mississippi River Basin and found that agricultural non-point sources accounted for 57–63% of total inputs. Similarly, Lucas et al. [14] and Menge et al. [15] projected that climate change could increase global riverine P fluxes by 15–30% by the end of this century. However, most existing studies are concentrated in large-scale river basins with strong data support, limiting their resolution and accuracy in capturing phosphorus dynamics in transitional or heterogeneous landscapes—particularly at the urban–agricultural interface [16].
An equally important yet addressed area is small and medium-sized catchments. These watersheds typically have slower hydrological turnover and longer water residence times, enabling them to retain phosphorus 3–5 times more efficiently than large river systems [7]. Studies have shown that small tributaries, despite their limited discharge, may disproportionately contribute to nutrient loading and eutrophication risks [17,18]. Unfortunately, due to limited monitoring infrastructure and data availability, such systems are often overlooked in modeling efforts. This results in a significant knowledge gap between localized environmental processes and macro-scale model generalizations.
To end this, field-based monitoring studies have been used to explore the mechanisms of phosphorus transport in small agricultural or urban catchments [19,20]. While these efforts provide valuable empirical insights, their capacity to simulate future scenarios or guide policy remains constrained by limited temporal coverage and poor scalability.
This study addresses these critical gaps by integrating high-resolution field data with the HSPF model to investigate phosphorus dynamics in the Ju River Basin—a small tributary of the Yangtze River that has recently experienced recurrent phosphorus pollution but remains underrepresented in the literature. The main purpose of this study was to quantify the impacts of (1) urban expansion and (2) altered precipitation regimes on hydrological processes and total phosphorus concentrations under multiple scenarios. By focusing on a small, data-scarce watershed with increasing development pressures, this study offers three key contributions: (1) a scenario-based modeling framework tailored to small and transitional watersheds; (2) empirical evidence that disentangles seasonal and anthropogenic drivers of P pollution; and (3) the practical implications for nutrient management in similar under-monitored catchments facing land use and climate change. The findings are expected to improve our understanding of eutrophication risks in small watersheds and offer transferable methods for data-limited regions undergoing rapid environmental transitions.

2. Materials and Methods

2.1. Study Areas

The Ju River Basin is located in the eastern part of Yichang City, Hubei Province, China, spanning from 111°12′ E to 112°12′ E and 30°23′ N to 31°02′ N (Figure 1a,b). As a major tributary of the Juzhang River, the Ju River has a total length of approximately 226 km, with an average gradient of 1.89‰ and a drainage area of 3382 km2, accounting for 46% of the total area of the Juzhang River Basin. The Ju River is characterized by an underdeveloped drainage network, with few and relatively short tributaries.
Situated in the middle reaches of the Yangtze River, the region experiences a subtropical monsoon climate, with an average annual precipitation of approximately 1100 mm, most of which occurs between June and August [21,22]. Land use in the basin is dominated by forest and agricultural land (Figure 1c,d), with major economic crops including rice, rapeseed, tea, and citrus. However, excessive agricultural reclamation and rapid urbanization in recent years have led to ongoing ecological degradation and increasing deterioration of water quality in the basin.

2.2. Data Collection and Processing

The HSPF model requires multiple input datasets, including land use types, a digital elevation model (DEM), soil classification maps, and meteorological records. The datasets for land use types, DEM, and soil classification were sourced from the Resource and Environmental Science Data Platform of China. Meteorological data were obtained from the China Meteorological Data Sharing Service and included daily records of precipitation, temperature, evaporation, solar radiation, wind speed, cloud cover, and dew point for the period 2022–2023. For clarity and ease of reference, the sources of these datasets together with the associated parameter information are summarized in Table 1.
Hydrological data were collected from the Herong Hydrological Station, located downstream of the confluence of the Ju and Zhang Rivers, and comprised daily natural discharge data from February 2022 to August 2023. Total phosphorus (TP) concentrations were determined through field sampling. Since the Ju River is located at the tail end of a Yangtze River tributary without upstream phosphorus input, TP in the river during non-precipitation periods is mainly derived from municipal wastewater and remains relatively stable. In contrast, precipitation events introduce nonpoint source phosphorus through surface runoff, resulting in fluctuations in TP concentrations. Based on this pattern, we collected 100 water samples from 20 control sites following the July 2022 precipitation event for model calibration, and 84 samples from 7 control sites after the July 2022, February 2023, May 2023, and July 2023 precipitation events for model validation. Samples were collected at a depth of 2 m below the river surface and approximately 0.1 m from the river center and stored in 500 mL polyethylene bottles and kept in cool, dark conditions during transport and preservation. TP concentrations were analyzed in the laboratory using the ammonium molybdate spectrophotometric method (GB11893-89) [23]. The measured hydrological data and TP concentrations served as the basis for calibrating and validating the model.

2.3. Model Calibration and Validation

The HSPF model was downloaded from the U.S. Environmental Protection Agency (EPA) website (https://19january2021snapshot.epa.gov/ceam/hydrological-simulation-program-fortran-hspf_.html (accessed on 21 July 2022)) and applied to simulate hydrological processes in the Ju River Basin. Due to regional differences in soil types, topography, and climate conditions, several parameters within the PERLND, IMPLND, and RCHRES modules were calibrated to reflect local characteristics.
Model calibration was conducted using meteorological inputs from January to October 2022, while pollutant source information (Table S1) was obtained through field surveys. Following previous studies [24,25] and the official technical guidelines of the U.S. Environmental Protection Agency, sensitive parameters were identified and sequentially adjusted. After each adjustment, simulated hydrological processes were compared with observations at the hydrological station, and simulated total phosphorus (TP) concentrations at 20 control sites were compared with measured sample concentrations. Parameter adjustment was considered satisfactory when deviations were within 15%. This procedure resulted in a finalized set of calibrated parameters (Table 2) and the corresponding HSPF configuration file (Supplementary File: HSPF_config_Ju_River.txt).
To mitigate the risk of model equivalence, this study compared the simulated total phosphorus (TP) concentrations (generated by the calibrated model) at seven control points on four sampling dates (14 July 2022 and 24 February, 12 May, and 5 July 2023) with field-measured TP concentrations (Figure S1). Additionally, the model’s overall performance was evaluated by validating the simulated hydrological processes (January–August 2023) against observational data from the hydrological station (Figure S2). Then, the predictive ability of the hydrological model was evaluated by calculating the Nash-Sutcliffe efficiency coefficient (NSE), the coefficient of determination (R2), and relative error (Re). The results (Table 3) indicate good agreement between the simulated and observed values of flow rate and total phosphorus (TP) concentrations. The minimum Nash–Sutcliffe efficiency (NSE) was 0.75, exceeding the commonly accepted threshold of 0.65. The minimum coefficient of determination (R2) was 0.87, higher than the widely accepted benchmark of 0.75. The maximum relative error (Re) was 17.46%, remaining within the acceptable range of less than 30%. These results suggest that the calibrated model parameters are reasonable and that the HSPF model performs well in simulating hydrological and water quality dynamics in the Ju River Basin.

2.4. Scenario Design

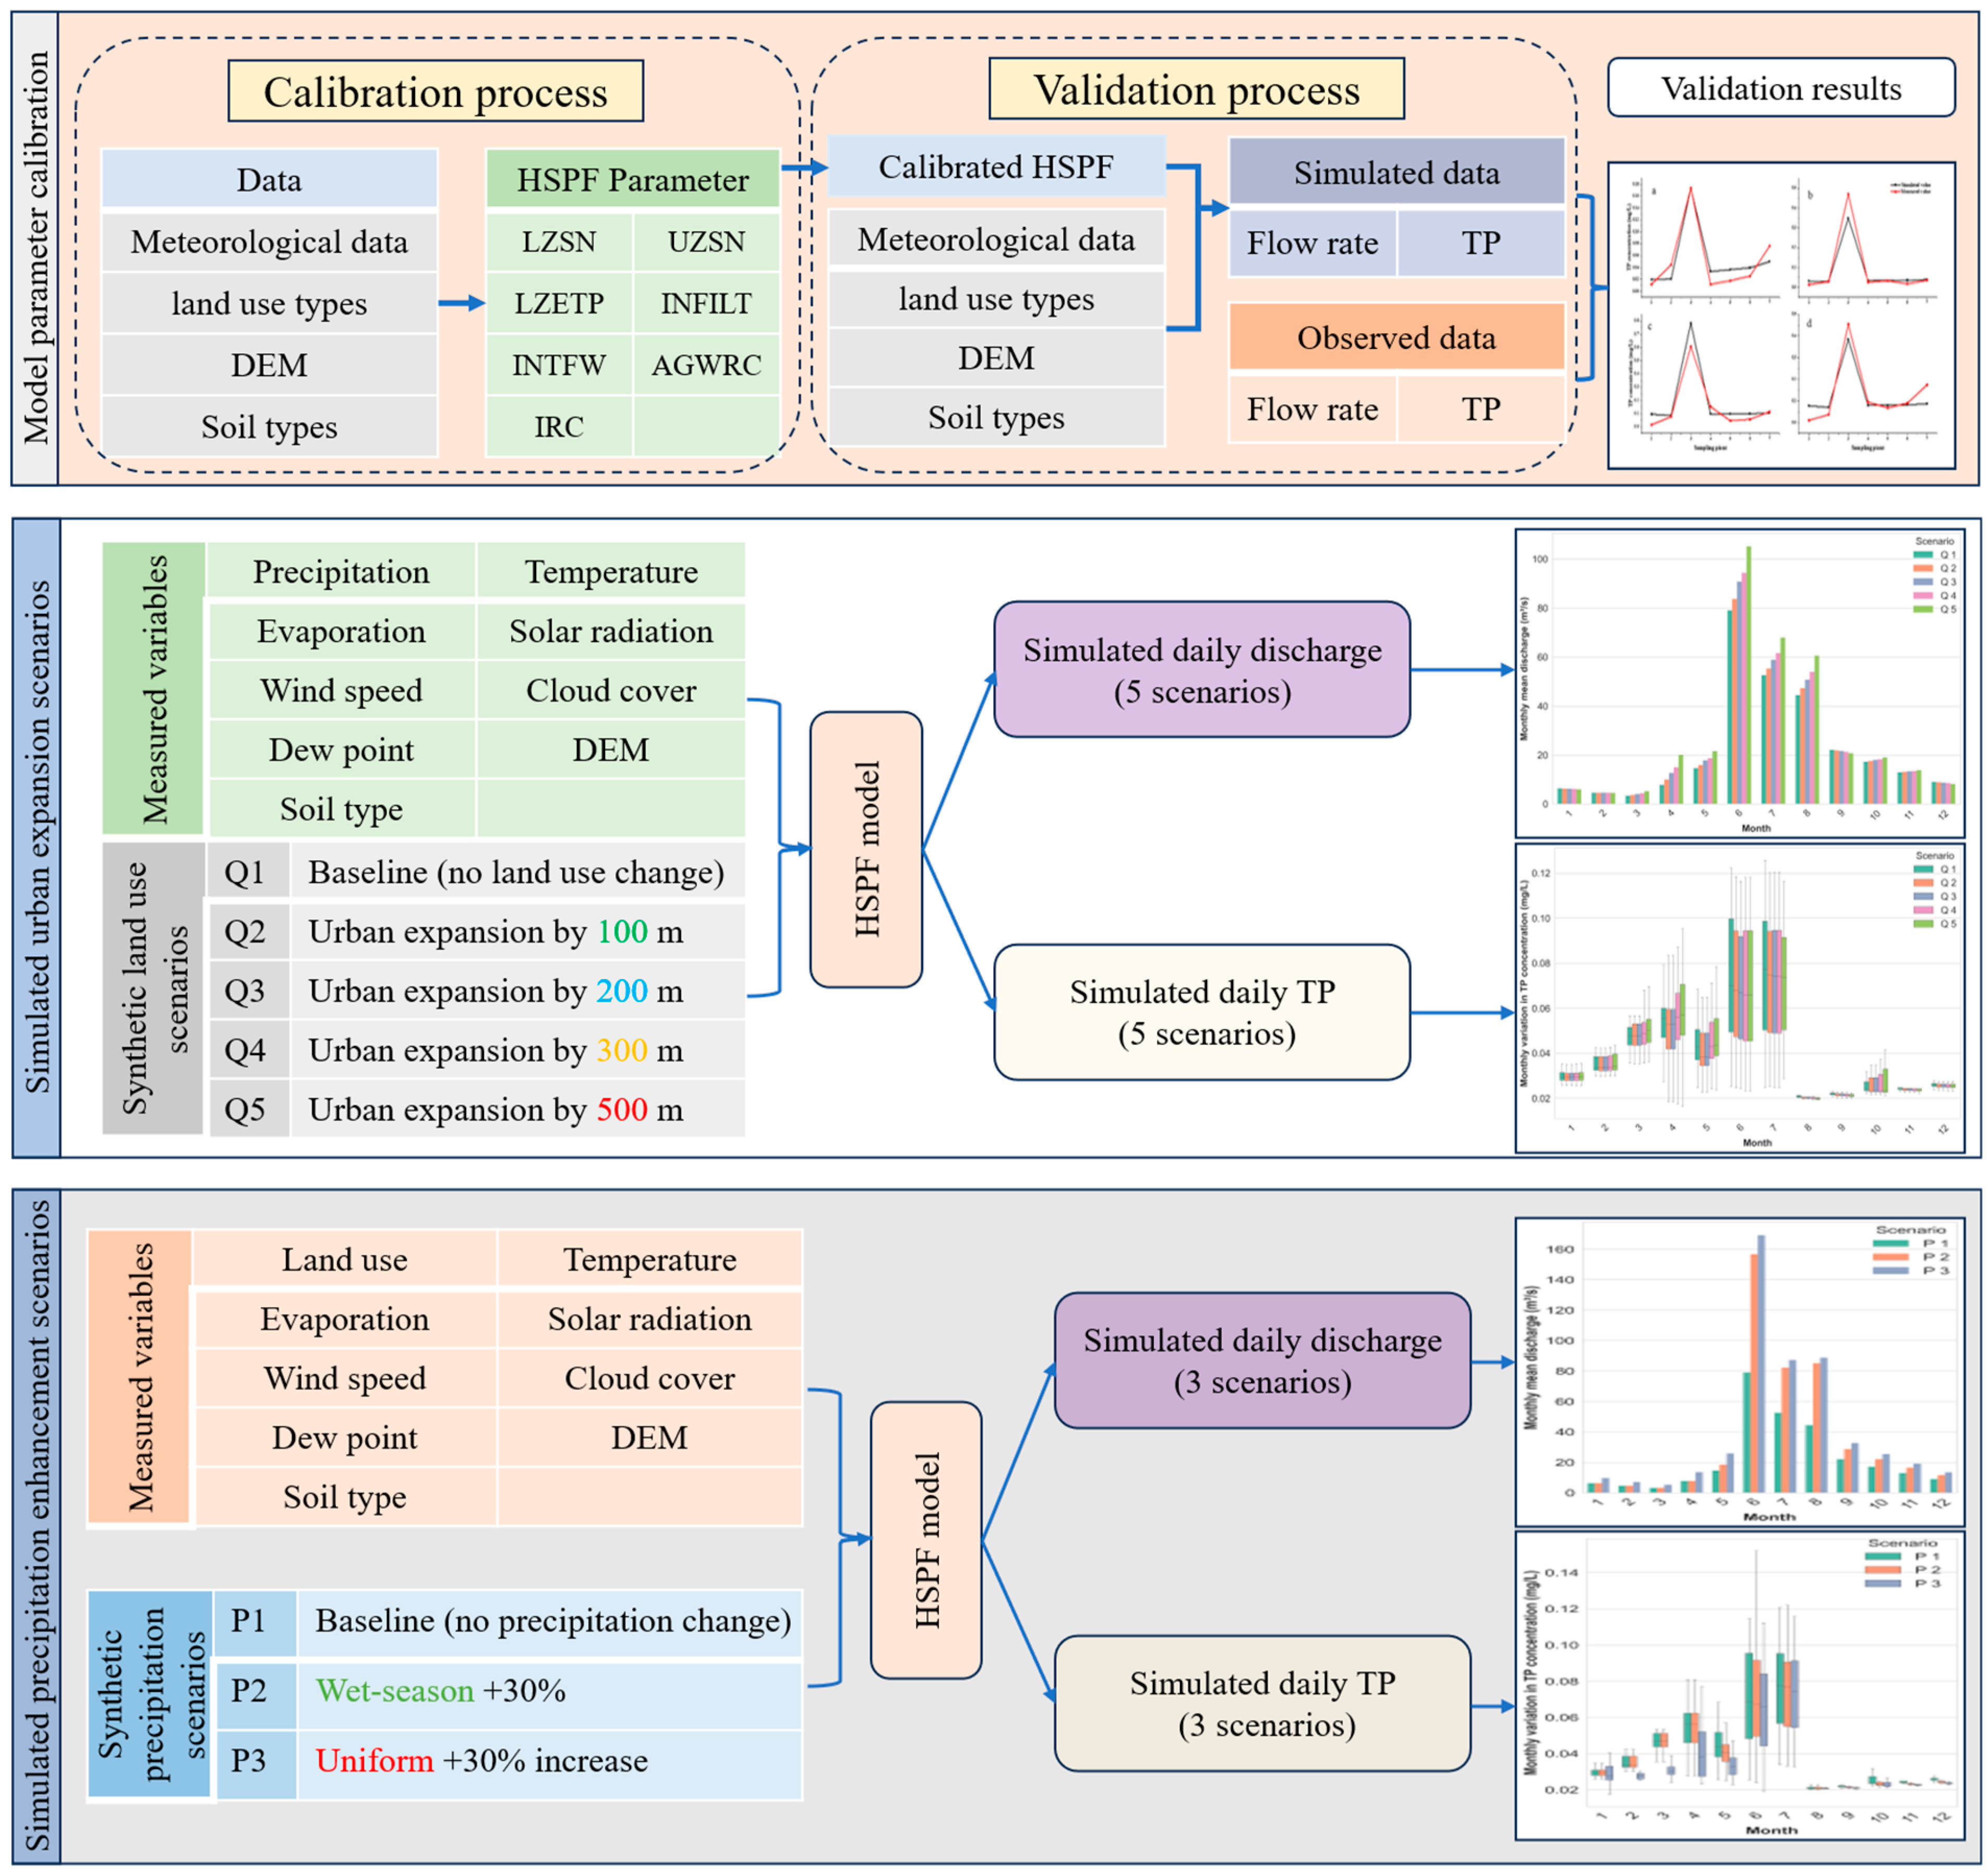
Due to limited urban infrastructure data availability, hypothetical scenarios of urban expansion and increased precipitation were simulated to investigate the impacts of land use change and climate variability on streamflow and total phosphorus concentrations in the Ju River basin. For the urban expansion scenarios, the current land use map was defined as the baseline scenario (Q1). Four additional scenarios were created by expanding urban land outward by 100 m (Q2), 200 m (Q3), 300 m (Q4), and 500 m (Q5), respectively. Each of these land use configurations was combined with 2023 meteorological data, soil type, and elevation data as inputs to the HSPF model, generating daily runoff and TP concentration outputs for the Ju River Basin.
For the precipitation enhancement scenarios, the observed 2023 precipitation data were used as the baseline (P1). In scenario P2, precipitation during the wet season (May–August) was increased by 30%. In scenario P3, all precipitation events throughout the year were uniformly increased by 30%. This adjustment means that 30% was added to the observed value for each precipitation event. These three precipitation datasets, along with the original 2023 meteorological conditions (excluding precipitation), soil, and elevation data, were input into the HSPF model to simulate daily runoff and TP concentrations. The overall simulation framework is illustrated in Figure 2.

3. Results

3.1. Impact of Urban Expansion on River Discharge

Simulations under five urban expansion scenarios revealed that the Ju River experiences its wet season between May and August, during which monthly average discharge is substantially higher than in other months. Moreover, a consistent increasing trend in monthly average discharge was observed with the expansion of urban areas (Figure 3a). Compared to the baseline scenario (Q1), the annual average discharge increased by 3.97%, 4.23%, 4.40%, and 4.83% in scenarios Q2 through Q5, respectively.
However, the boxplots of daily discharge grouped by month (Figure 3b) showed a contrasting pattern: the median daily discharge decreased with greater urban expansion, while the interquartile range (i.e., the box length) increased. This indicates that the variability of daily river discharge becomes more pronounced as urban areas expand. In other words, while monthly averages increase, daily flows tend to be lower most of the time, with more extreme fluctuations. This pattern suggests that urban expansion, by increasing the proportion of impervious surfaces, significantly alters the soil’s water retention capacity—leading to rapid increases in discharge during rainfall events and sharp declines during dry periods.

3.2. Impact of Urban Expansion on Total Phosphorus Concentration

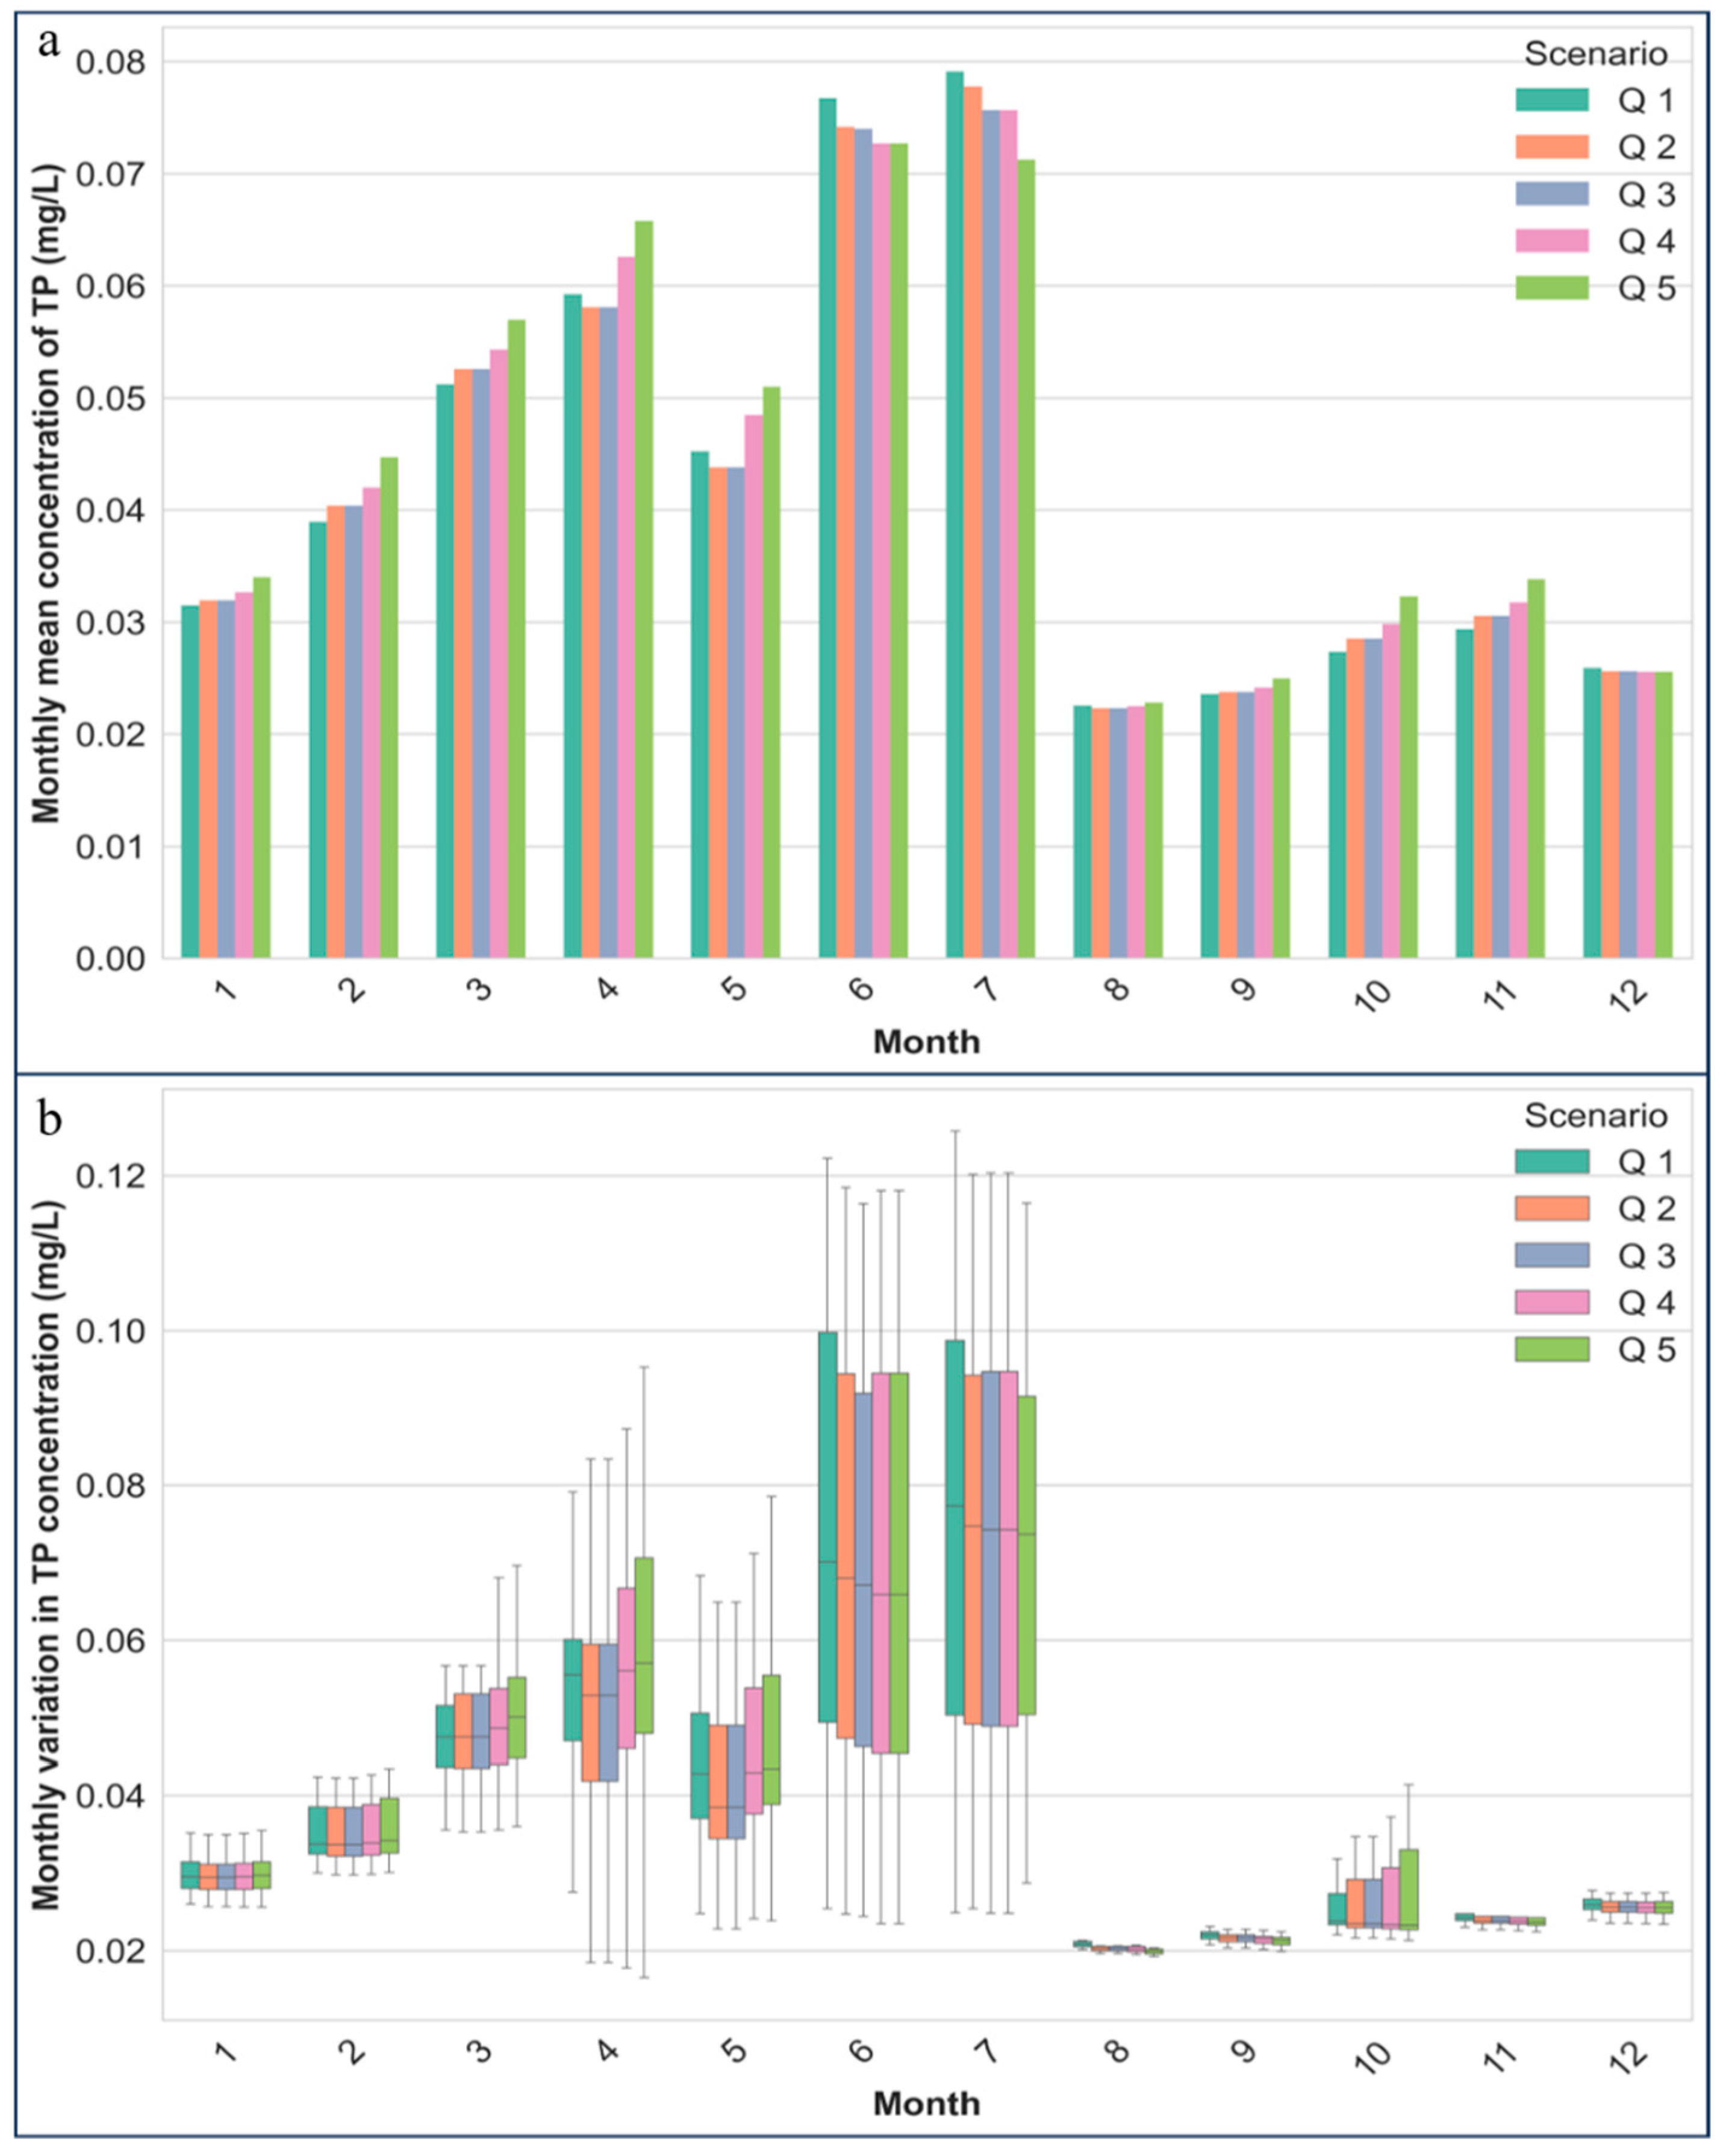
Simulation results under urban expansion scenarios (Figure 4a) show that the monthly average total phosphorus (TP) concentration in the Ju River decreased with increased urban expansion during June and July. In contrast, during the other months, TP concentrations increased as urban areas expanded. This indicates a seasonal shift in the dominant source of phosphorus pollution—from agriculture in the summer to urban areas in the rest of the year.
June and July coincide with the peak agricultural season in the region, characterized by intensive fertilizer application and frequent rainfall, which enhances the transport of phosphorus from cropland into the river. In the Q5 scenario (maximum urban expansion and minimal cropland), TP concentrations were the lowest; conversely, in the Q1 scenario (no urban expansion), TP levels were the highest, suggesting that non-point source agricultural runoff is the primary driver of phosphorus pollution during these months.
In the remaining months, TP concentrations increased with urban expansion. During these periods, agricultural activity and precipitation intensity are relatively low, reducing phosphorus input from cropland. Meanwhile, urban wastewater remains a continuous source of phosphorus, making it the dominant contributor to riverine TP levels during the non-agricultural season.
Moreover, the monthly grouped distributions of daily TP median concentrations (Figure 4b) followed a similar trend to the monthly means. The boxplot lengths were relatively consistent across scenarios within the same month, indicating that urban expansion does not significantly increase short-term variability in TP concentrations. These results suggest that agricultural practices and rainfall events remain the primary factors influencing phosphorus dynamics in the Ju River.

3.3. Impact of Increased Precipitation on River Discharge

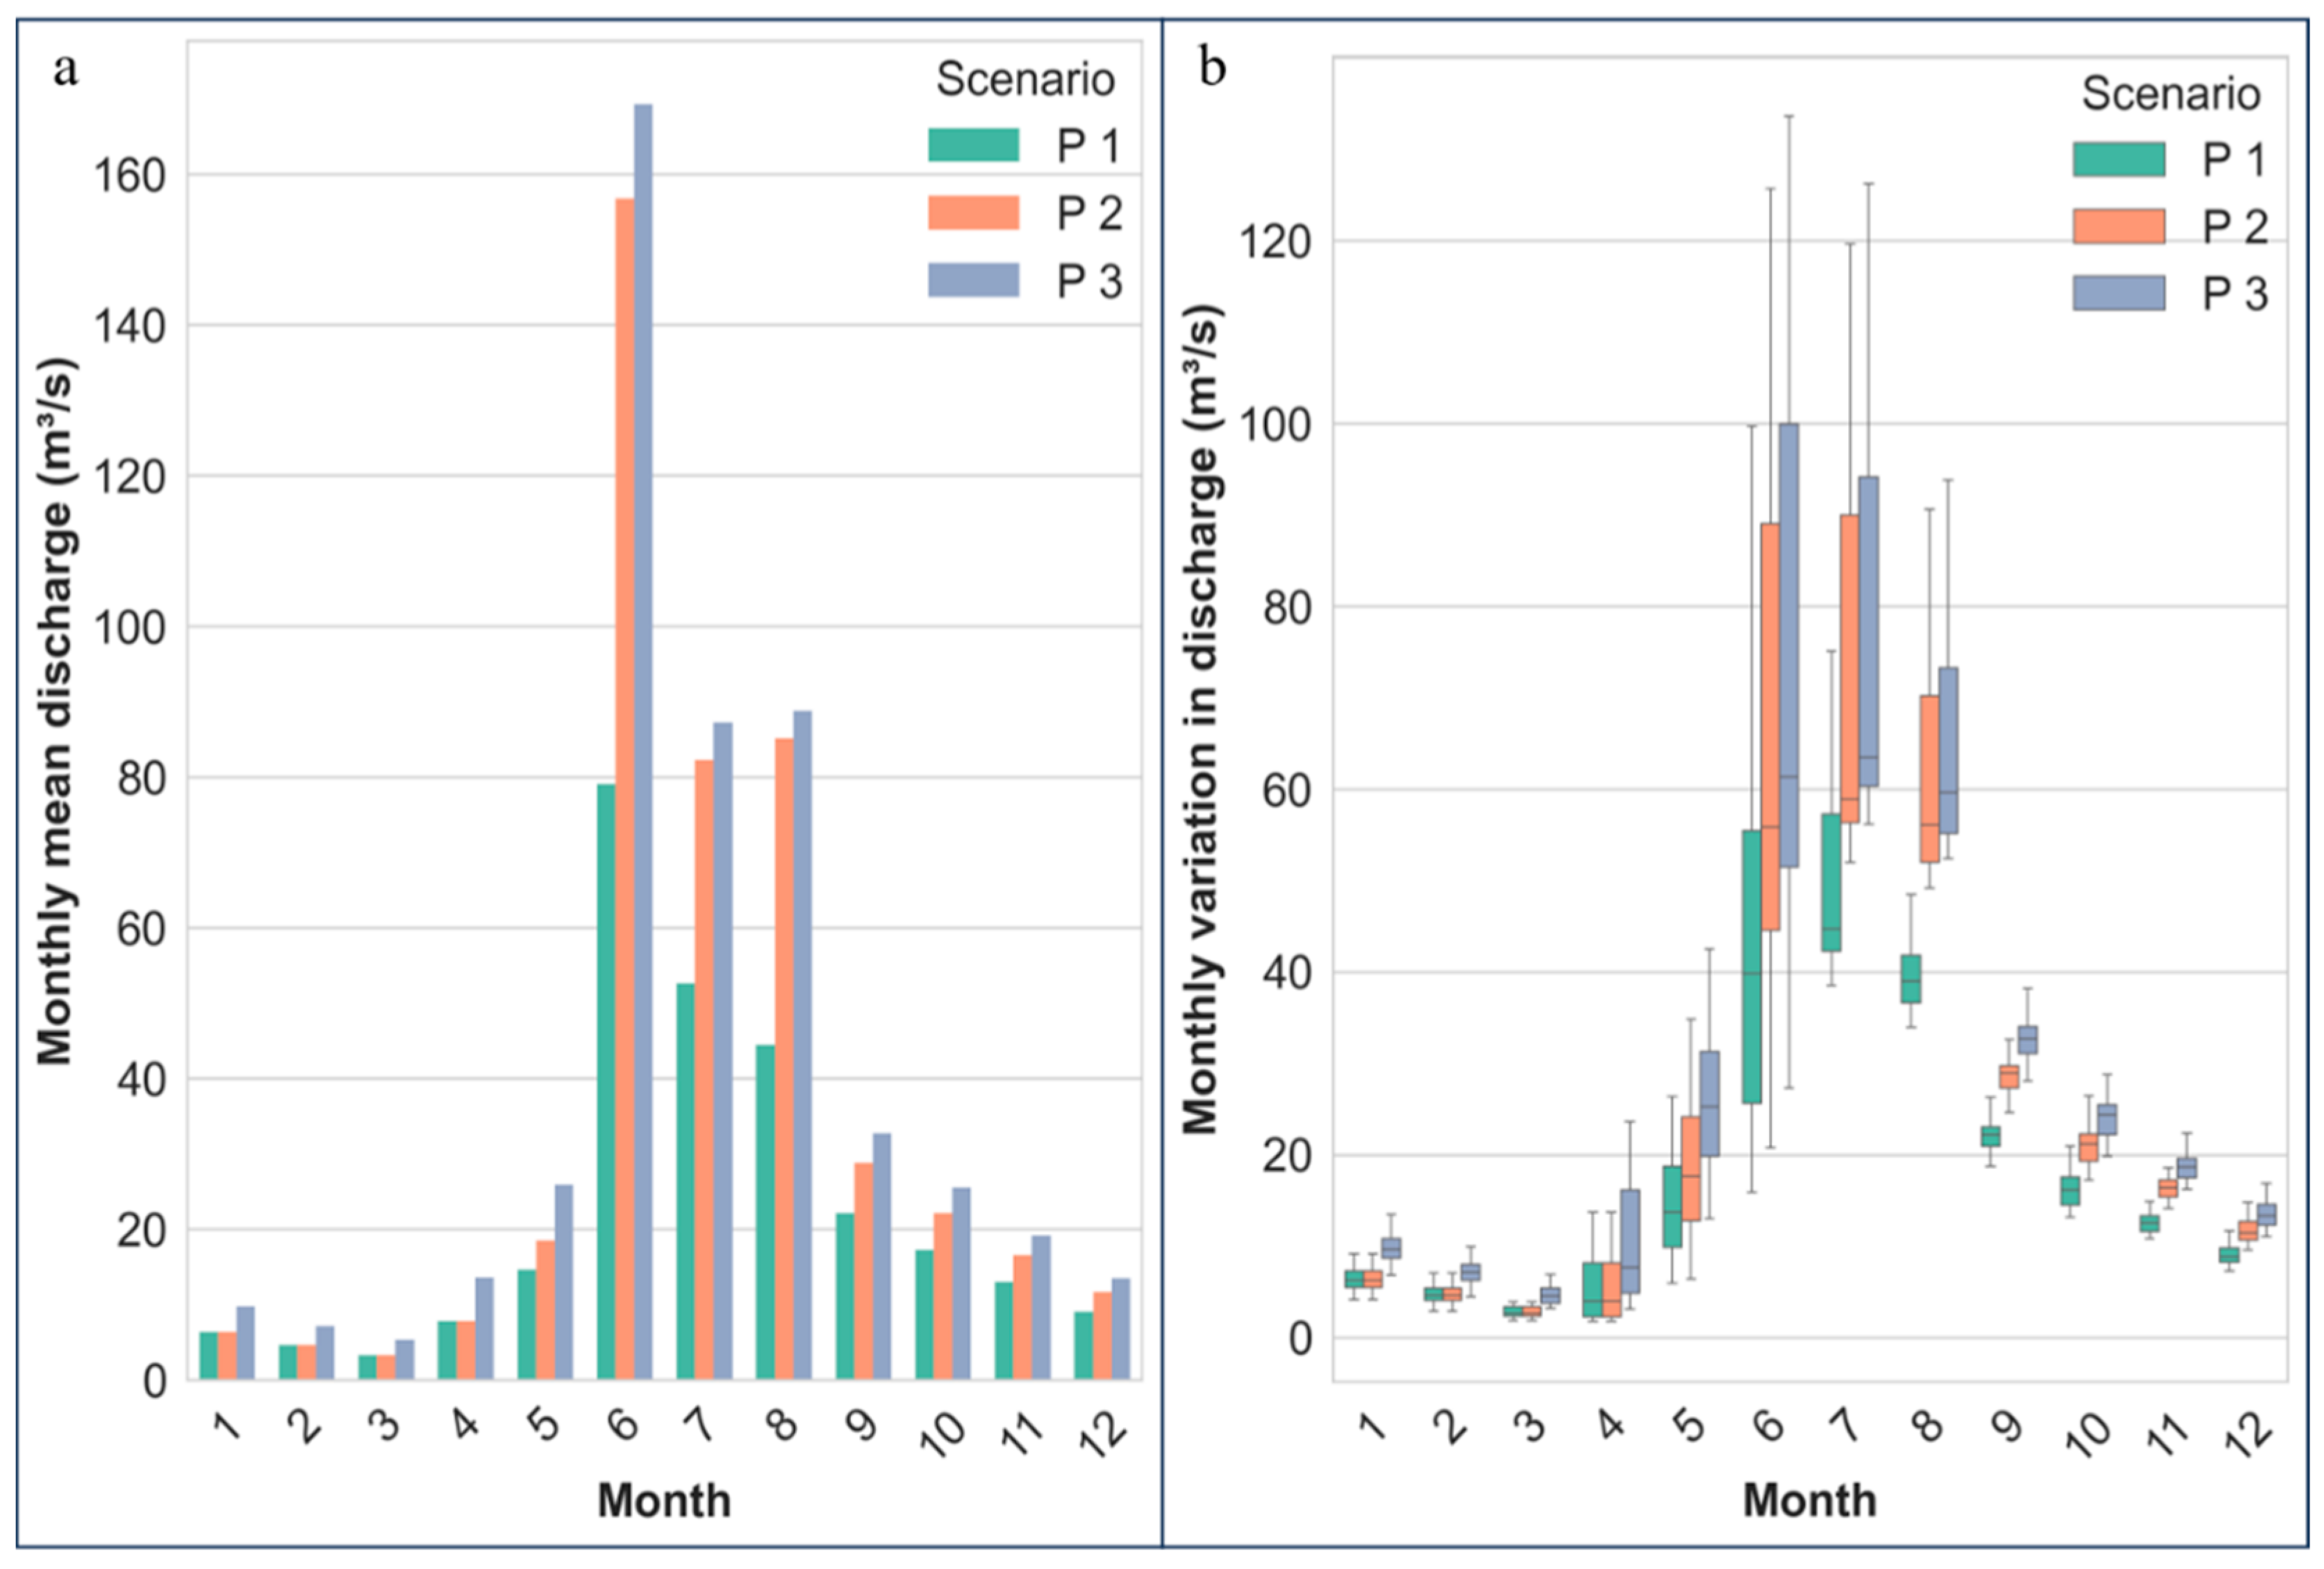
Simulation results under precipitation enhancement scenarios (Figure 5a) revealed varying impacts of increased rainfall on the monthly average discharge of the Ju River across different seasons. During the early dry season (January to April), the influence of precipitation increase was relatively limited. In scenario P3, which involved a 30% increase in annual precipitation, the discharge rose about 20% compared to the baseline (P1) and the wet-season-only enhancement scenario (P2).
By contrast, during the wet season (May to August), both P2 and P3 led to substantial increases in monthly average discharge, exceeding that of P1 by more than 65%. This demonstrates that rainfall increases during the flood season have a direct and amplified effect on runoff generation. Furthermore, although P2 and P3 featured the same 30% increase in rainfall during this period, P3 produced approximately 10% higher discharge than P2. This suggests that during intense rainfall events, soil water retention and delayed release processes play a significant regulatory role. This lag effect was further confirmed in the post-flood period (September to December). Although precipitation during this time remained unchanged between P1 and P2, discharge in P2 continued to exceed that of P1, indicating that the cumulative effect of prior heavy rainfall can sustain elevated discharge even after precipitation levels normalize.
Additionally, the distribution of daily discharge grouped by month (Figure 5b) provides further insight. During the dry season, the interquartile ranges of daily discharge were comparable across all scenarios. In the wet season, however, scenarios P2 and P3 exhibited similarly expanded box lengths, both significantly larger than those in P1. This indicates that increasing total precipitation—without altering rainfall frequency—can substantially enhance daily runoff. Notably, the increase remained consistent and did not significantly widen the variability of daily discharge. While the boxplots for P3 were positioned higher than those for P2, reflecting elevated overall discharge, the lengths of the boxes and the positions of the medians remained similar. This suggests that runoff increases proportionally with precipitation, without introducing greater instability.

3.4. Impact of Increased Precipitation on Total Phosphorus Concentration

Field investigations revealed that phosphorus sources in the Ju River are relatively simple, primarily originating from municipal wastewater and agricultural nonpoint source pollution. During the non-cultivation period (August to February), mean total phosphorus (TP) concentrations in the river remained relatively stable at below 0.04 mg/L. In contrast, during the cultivation season (March to July), the concentrations exhibited pronounced fluctuations (ranging from 0.01 to 0.15 mg/L), with more than 80% of the phosphorus present in particulate form.
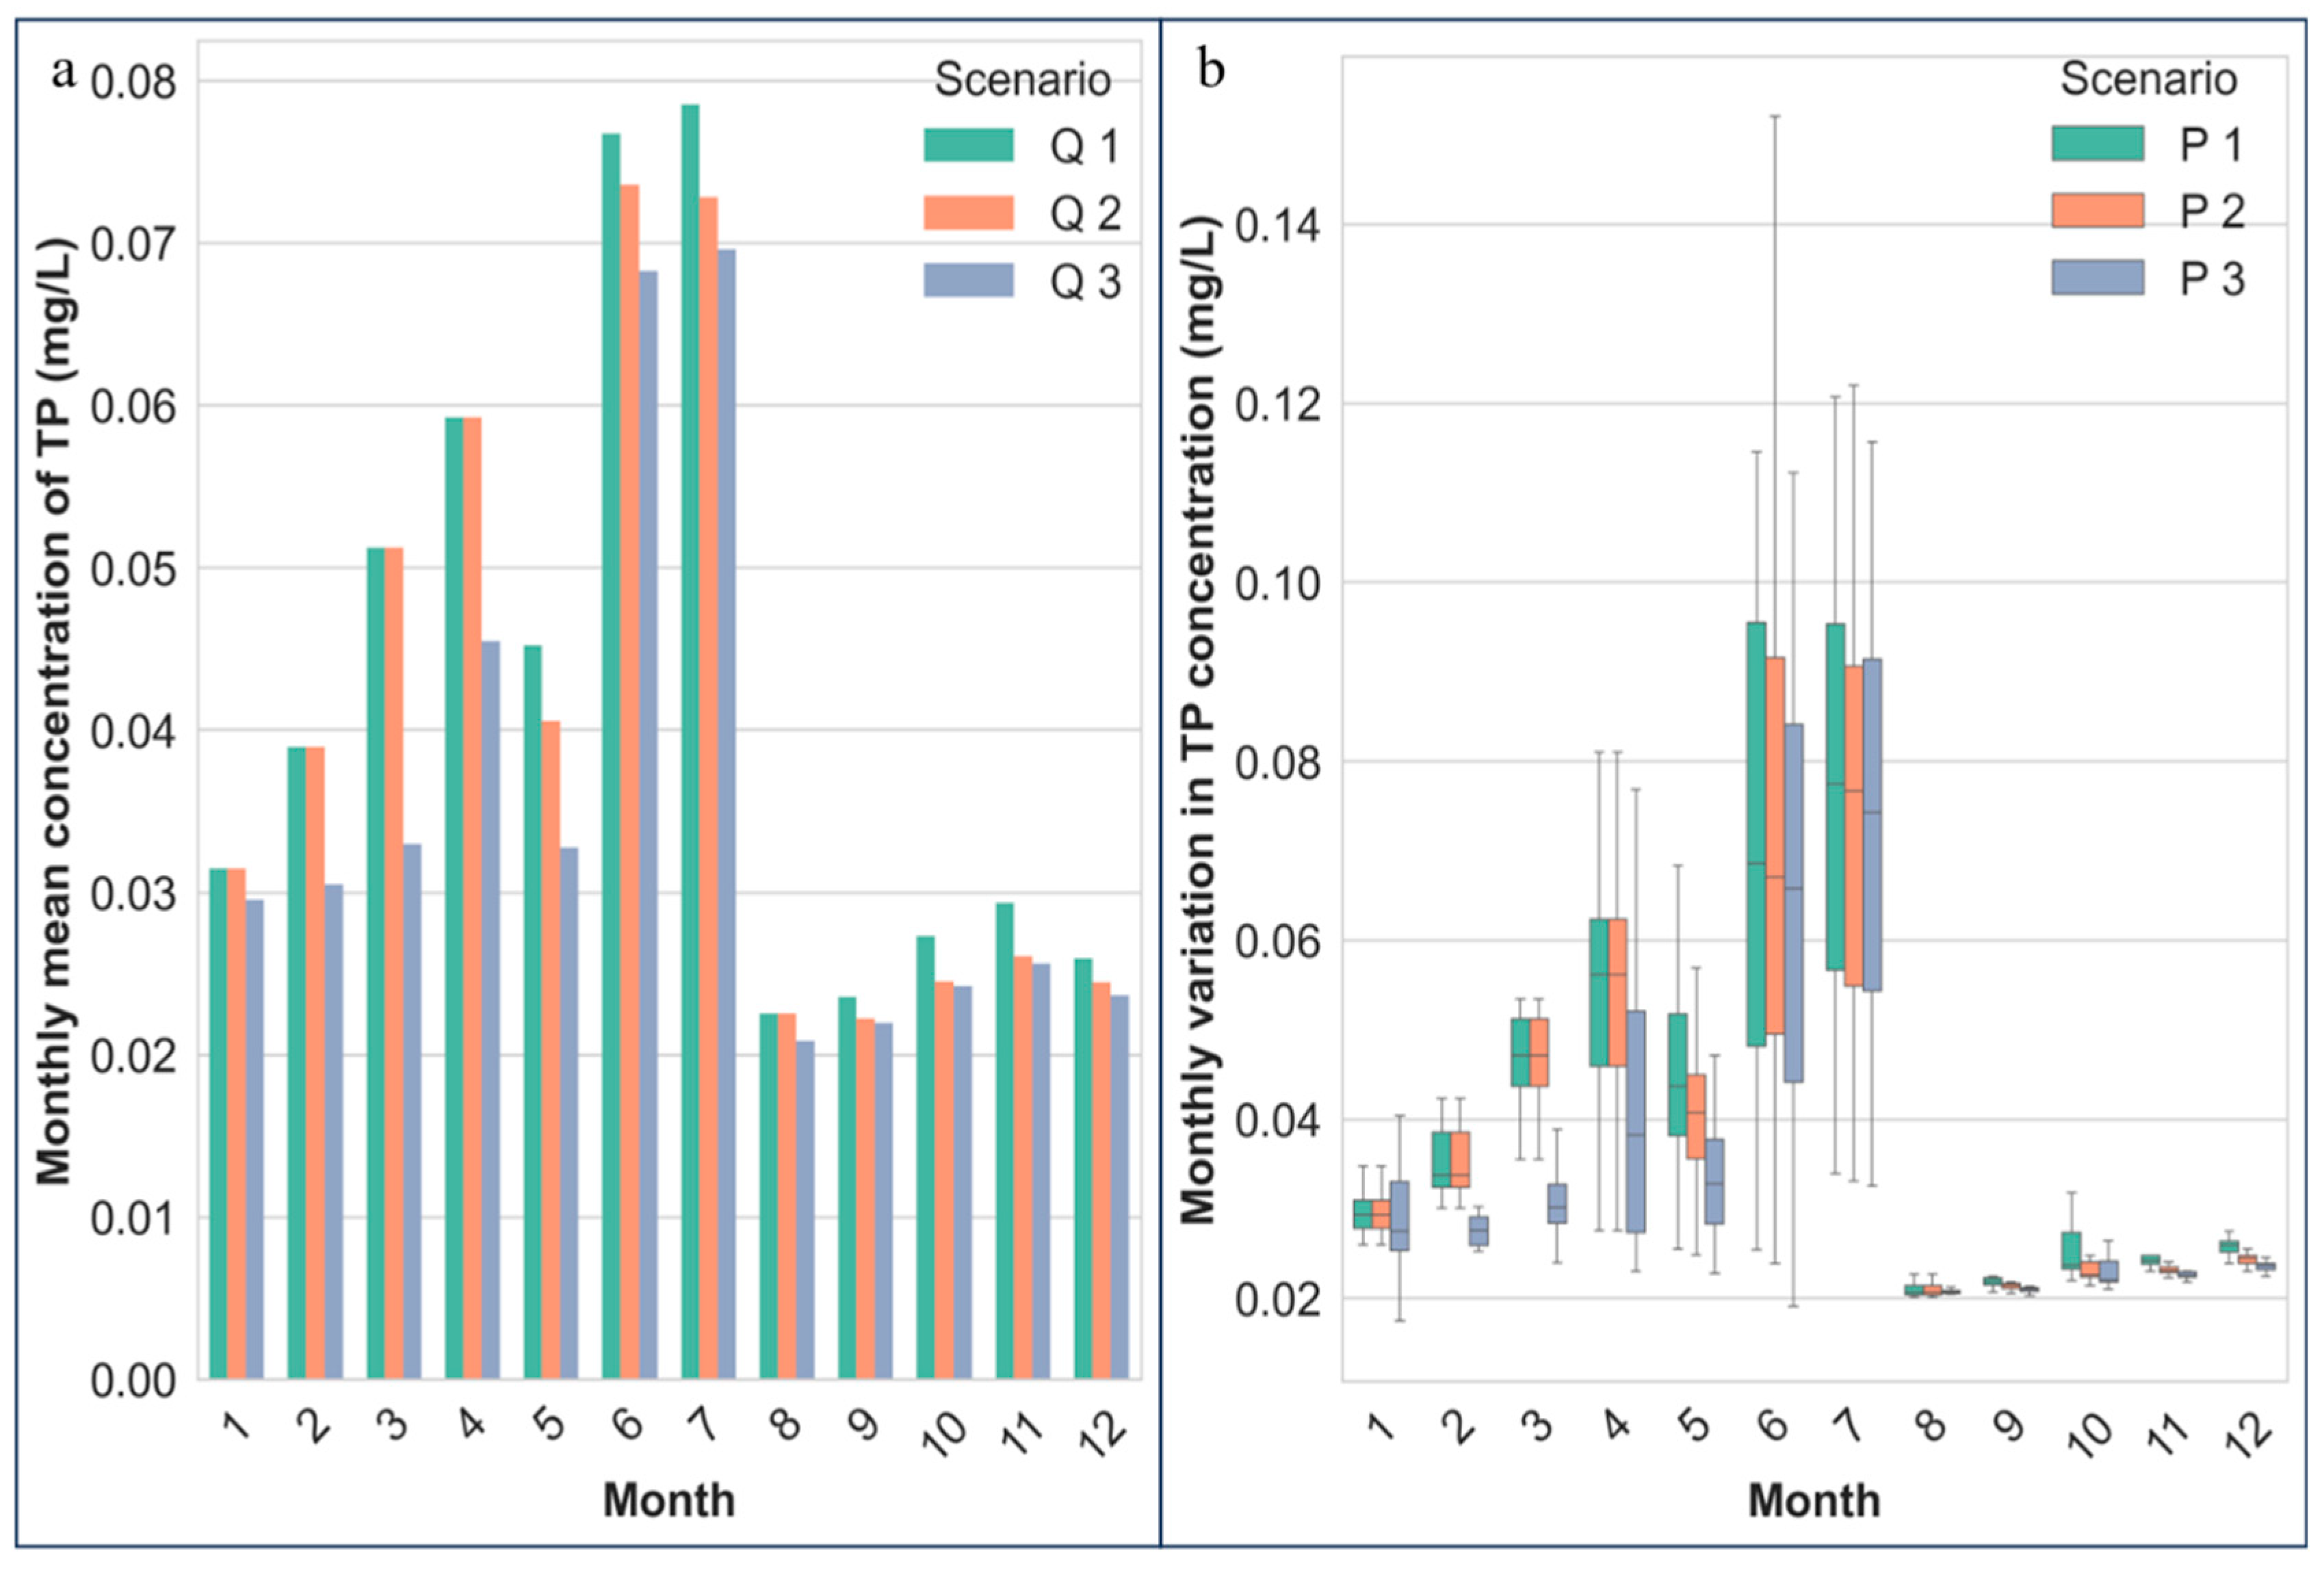
The simulation results indicate that under the P3 precipitation enhancement scenario, both the monthly mean total phosphorus (TP) concentrations (Figure 6a) and the monthly grouped daily medians (Figure 6b) in the Ju River Basin exhibit a decreasing trend with increasing precipitation. This suggests a dilution effect of increased precipitation on TP concentrations, assuming constant land use. Specifically, during the low-precipitation period from January to April, runoff in the P3 scenario increased by approximately 20% compared to P1, while TP concentrations decreased by about 10–22%. In contrast, during the high-precipitation period from June to July, despite a 65% increase in runoff under the P3 scenario, TP concentrations declined by only ~5.5%. These findings indicate that while intense precipitation contributes to the dilution of phosphorus concentrations, it also exacerbates phosphorus leaching from soils.
Moreover, across all three precipitation scenarios, TP concentrations from January to July exhibit an overall upward trend, further highlighting that agricultural non-point source pollution remains the dominant contributor to phosphorus loads in the Ju River Basin—exceeding those from industrial and domestic wastewater sources.

3.5. Variations in Phosphorus Loads Under Different Scenarios

Monthly phosphorus load data (Table 4) indicate that phosphorus export in the Ju River peaks in June across all scenarios, followed by July, with the lowest values observed in February. Under scenarios P1–P5, the phosphorus load in June–July accounted for 72.66%, 72.05%, 70.89%, 69.76%, and 67.06% of the annual total, respectively. In scenarios Q1–Q3, the corresponding proportions were 72.66%, 75.53%, and 74.64%. These results highlight that nonpoint source pollution during the overlapping window of the agricultural busy season and precipitation peak (June–July) is the dominant contributor to phosphorus pollution in the Ju River basin. The gradual decline in the June–July contribution under scenarios P1–P5 suggests that urban expansion (i.e., cropland reduction) in this specific region can effectively mitigate phosphorus pollution. Furthermore, the higher June–July proportion in Q3 compared to Q1 but lower than Q2 indicates that increased precipitation during the agricultural busy season exerts the strongest enhancement effect on phosphorus loss. Notably, during the non-farming season, increased precipitation can dilute in-stream TP concentrations but simultaneously exacerbate phosphorus loss. For example, in Scenario Q2, the proportion of annual phosphorus load during June-July was 1% higher than that in Q3, while the total annual phosphorus load was 3% lower compared to Scenario Q3.

4. Discussion

4.1. Amplifying Effects of Urbanization on Extreme Hydrological Responses

We found that urban expansion significantly intensifies hydrological responses during extreme precipitation events. Under the Q5 scenario, a 500 m urban expansion led to a 224% increase in daily peak discharge during a single storm event in August. This amplification is primarily attributed to the replacement of permeable land cover—such as cropland and forest—with impervious surfaces, which drastically reduce infiltration, shorten runoff concentration time, and elevate flow peaks. These findings are consistent with previous studies [26,27] but provide new evidence for small catchments, where limited buffering capacity further magnifies the response.
Moreover, the results suggest that hydrological impacts of urbanization are not limited to annual or seasonal discharge trends but are most pronounced during short-duration, high-intensity events. This nonlinear response pattern indicates that traditional land use planning—which often relies on mean annual rainfall-runoff estimates—may systematically underestimate flood risks in rapidly urbanizing small watersheds [28,29,30]. Therefore, urban development policies should incorporate fine-scale hydrological modeling and prioritize low-impact development strategies such as permeable pavements, rain gardens, and vegetated swales to attenuate surface runoff and delay flow peaks [31,32].

4.2. Agricultural Dominance and Temporal Shifts in Phosphorus Sources

The seasonal trajectory of total phosphorus (TP) concentrations in the Ju River provides compelling evidence that agricultural non-point sources dominate phosphorus pollution, particularly during the peak growing season (June–July). Even with high rainfall, which should dilute pollutant concentrations, TP levels doubled compared to non-agricultural months. This suggests that rainfall primarily acts as a mobilizing agent, transferring legacy phosphorus accumulated in soils into nearby waterways via overland flow [33,34,35]. Fertilizer-induced phosphorus saturation and poorly timed applications further exacerbate this problem [36,37].
Importantly, the simulations also reveal a shift in dominant pollution sources across seasons. During the non-growing season (e.g., winter), when fertilizer application and precipitation are minimal, TP concentrations increase in tandem with urban expansion, indicating a growing influence of point-source pollution such as domestic wastewater. This source-shifting dynamic underscores the need for season-specific pollution control strategies. Agricultural interventions such as precision fertilization and vegetative buffer strips should be prioritized in spring and summer [38,39,40], whereas enhanced wastewater treatment and stormwater retention systems are essential during the rest of the year [41,42].
Furthermore, the observed “dilution–leaching paradox” under increased precipitation scenarios—where TP concentrations decline but total export rises—highlights the need to move beyond concentration-based assessments toward load-based water quality evaluations. This shift in perspective is crucial for aligning watershed management with ecological risk thresholds [2].

4.3. Broader Implications for Eutrophication Control in Small Catchments

The Ju River case exemplifies the complex interplay between land use change, climate variability, and nutrient cycling in small watersheds—hydrologic units that are often neglected in global-scale phosphorus models but are disproportionately important for downstream water quality. Due to their long residence times and high edge-to-area ratios, small catchments are hotspots for phosphorus retention, transformation, and release [7].
By integrating high-resolution field data with process-based modeling under multiple scenarios, this study presents a replicable framework for small-catchment phosphorus assessment that can inform targeted interventions under both current and future conditions. The scenario-based approach enhances our capacity to anticipate “tipping points” under compounding stressors such as urbanization and extreme precipitation—factors that are expected to become more frequent under ongoing climate change [43].
In this context, policymakers should consider implementing adaptive watershed governance strategies that couple land use zoning with real-time environmental monitoring [44]. Such systems could allow for seasonal restrictions on fertilizer application, dynamic stormwater controls, and data-driven prioritization of conservation investments [45]. Moreover, given the growing frequency of extreme events, phosphorus management should incorporate climate-resilient infrastructure capable of handling abrupt hydrological shocks [46].

4.4. Impacts on Downstream Ecosystems

The results of this study demonstrate that the combined effects of urban expansion and increased precipitation substantially exacerbate phosphorus loss in the Ju River basin, thereby elevating nutrient loads to downstream waters. Numerous studies have confirmed that external phosphorus inputs are a primary driver of eutrophication in river–lake systems, with direct consequences including increased frequency and intensity of algal blooms, reduced water transparency, and intensified hypoxia in bottom waters [7,16]. Such changes not only threaten drinking water safety but also result in ecosystem degradation and fisheries decline [47,48]. Notably, the expansion of impervious surfaces during urbanization shortens rainfall retention time, allowing runoff to reach river channels more rapidly during storm events and accelerating nutrient pulse transport, thereby exposing downstream ecosystems to greater nutrient shocks over short time periods.
In addition to phosphorus, pulsed high-flow events may also exert significant influences on the transport of other nutrients. Agricultural fertilization typically involves combined applications of nitrogen (N), phosphorus (P), and potassium (K). Among them, nitrogen is highly soluble and thus more easily mobilized into rivers during runoff [49]. When heavy precipitation coincides with the agricultural busy season, not only phosphorus but also nitrogen losses increase dramatically, leading to fluctuations in total nitrogen (TN) concentrations and N:P ratios, which can alter algal community composition and dominance [50]. Similarly, potassium inputs, although more readily diluted in aquatic systems, may still disturb nutrient balance when introduced repeatedly through runoff pulses. While this study simulated only TP dynamics, previous evidence suggests that coupled transport of multiple nutrients may amplify downstream water quality deterioration [2,14].
These findings have important implications for downstream ecosystem management. On the one hand, urban expansion combined with more frequent precipitation extremes under climate change scenarios may greatly increase the risk of nutrient inputs exceeding ecological thresholds. On the other hand, future studies should adopt an integrated nutrient perspective, developing simulation frameworks that encompass N, P, and K dynamics simultaneously to better assess the long-term impacts of watershed-scale nutrient export on downstream ecosystems. Particularly under the overlap of the agricultural busy season and extreme rainfall events, the joint export of N, P, and K may represent a critical mechanism driving regional water quality degradation. Cross-nutrient, multi-process modeling and monitoring will therefore provide a stronger scientific basis for the formulation of comprehensive watershed management and ecological protection strategies.

4.5. Limitations and Future Research Directions

Basic research often prioritizes high-profile topics and regions with significant economic or ecological importance, resulting in data scarcity for small- and medium-sized watersheds. In this study, the Ju River Basin spans five county-level cities but is served by only a single hydrological monitoring station, which limits the ability to conduct real-time, spatially representative observations. To address this, water samples were collected at multiple points and time intervals; however, this approach is insufficient for capturing the full temporal dynamics of the watershed. Furthermore, due to the lack of detailed data on urban development and population growth at the county level, it was not feasible to model future scenarios using natural growth rates. As a result, the model was restricted to manually defined scenarios, which limited its ability to forecast future phosphorus concentrations in the basin. This constraint reduces the generalizability and practical utility of the simulation results.
Future research should integrate multi-source data—such as remote sensing, distributed sensors, and socio-economic indicators—to improve spatial detail and scenario realism. Coupling hydrological models with biogeochemical and land use forecasting modules would enhance the ability to simulate phosphorus fate under complex environmental and human-driven changes.

5. Conclusions

This study demonstrates that urban expansion significantly amplifies peak runoff during extreme rainfall, while agricultural non-point sources remain the main driver of total phosphorus (TP) pollution, especially in summer season. Increased precipitation exerts a dilution effect on TP concentrations but accelerates overall phosphorus export. By integrating field observations with scenario-based HSPF modeling, this research provides a practical framework for assessing nutrient dynamics in small catchments and offers insights for targeted, climate-resilient phosphorus management under land use and climate change.

Supplementary Materials

The following supporting information can be downloaded at https://www.mdpi.com/article/10.3390/w17182771/s1: Figure S1: Simulated TP Values; Figure S2: Measured Runoff During Calibration and Validation Periods; Table S1: Polluting Enterprises Information; Figure S3: Hourly precipitation animation; Supplementary File: HSPF_Config_Ju_River.txt.

Author Contributions

Conceptualization, J.Z. and Q.X. (Qinxue Xiong); methodology, J.Z.; software, Q.X. (Qian Xiang); validation, Q.X. (Qian Xiang), Q.X. (Qinxue Xiong) and C.D.; formal analysis, Q.X. (Qian Xiang) and F.X.; investigation, Q.X. (Qian Xiang) and S.J.; resources, L.L.; data curation, Q.X. (Qian Xiang) and Y.Z.; writing—original draft preparation, Q.X. (Qian Xiang) and C.D.; writing—review and editing, C.D.; visualization, C.D.; supervision, J.Z.; project administration, J.Z.; funding acquisition, J.Z. All authors have read and agreed to the published version of the manuscript.

Funding

This research was funded by the National Natural Science Foundation of China (Grant No. U21A2039).

Data Availability Statement

The data supporting this study are available upon reasonable request from institution. Restrictions apply due to legal and commercial considerations.

Acknowledgments

We sincerely acknowledge Engineer Anurag Mishra for his professional guidance and valuable support during the modeling process of this study.

Conflicts of Interest

The authors declare no conflicts of interest.

References

  1. MacDonald, G.K.; Bennett, E.M.; Potter, P.A.; Ramankutty, N. Agronomic phosphorus imbalances across the world’s croplands. Proc. Natl. Acad. Sci. USA 2011, 108, 3086–3091. [Google Scholar] [CrossRef]
  2. Sharpley, A.N.; Bergström, L.; Aronsson, H.; Bechmann, M.; Bolster, C.H.; Börling, K.; Djodjic, F.; Jarvie, H.P.; Schoumans, O.F.; Stamm, C.; et al. Future agriculture with minimized phosphorus losses to waters: Research needs and direction. Ambio 2015, 44, 163–179. [Google Scholar] [CrossRef]
  3. Veneklaas, E.J.; Lambers, H.; Bragg, J.; Finnegan, P.M.; Lovelock, C.E.; Plaxton, W.C.; Price, C.A.; Scheible, W.-R.; Shane, M.W.; White, P.J.; et al. Opportunities for improving phosphorus-use efficiency in crop plants. New Phytol. 2012, 195, 306–320. [Google Scholar] [CrossRef]
  4. Hartmann, J.; Moosdorf, N.; Lauerwald, R.; Hinderer, M.; West, A.J. Global chemical weathering and associated P-release—The role of lithology, temperature and soil properties. Chem. Geol. 2014, 363, 145–163. [Google Scholar] [CrossRef]
  5. Filippelli, G.M. The global phosphorus cycle: Past, present, and future. Elements 2008, 4, 89–95. [Google Scholar] [CrossRef]
  6. FAO. FAO World Fertilizer Trends and Outlook to 2022. FAO: Rome, Italy, 2020. [Google Scholar] [CrossRef]
  7. Withers, P.J.; Neal, C.; Jarvie, H.P.; Doody, D.G. Agriculture and eutrophication: Where do we go from here? Sustainability 2014, 6, 5853–5875. [Google Scholar] [CrossRef]
  8. Tipping, E.; Benham, S.; Boyle, J.F.; Crow, P.; Davies, J.; Fischer, U.; Guyatt, H.; Helliwell, R.; Jackson-Blake, L.; Lawlor, A.J.; et al. Atmospheric deposition of phosphorus to land and freshwater. Environ. Sci. Process. Impacts 2014, 16, 1608–1617. [Google Scholar] [CrossRef] [PubMed]
  9. Hao, L.; Sun, G.; Liu, Y.; Wan, J.; Qin, M.; Qian, H.; Liu, C.; Zheng, J.; John, R.; Fan, P.; et al. Urbanization dramatically altered the water balances of a paddy field-dominated basin in southern China. Hydrol. Earth Syst. Sci. 2015, 19, 3319–3331. [Google Scholar] [CrossRef]
  10. Sharpley, A.N.; Kleinman, P.J.; McDowell, R.W.; Gitau, M.; Bryant, R.B. Modeling phosphorus transport in agricultural watersheds: Processes and possibilities. J. Soil Water Conserv. 2002, 57, 425–439. [Google Scholar] [CrossRef]
  11. Wu, H.; Jiao, X.; Wang, Y.; Wang, M.; Zhou, J.; Wu, K.; Chen, D. Influence of climate and land use on watershed anthropogenic phosphorus inputs and riverine phosphorus export dynamics: A global analysis. Sci. Total Environ. 2024, 933, 172991. [Google Scholar] [CrossRef]
  12. Bian, Z.; Pan, S.; Wang, Z.; Yao, Y.; Xu, R.; Shi, H.; Kalin, L.; Anderson, C.; Justic, D.; Lohrenz, S.; et al. A century-long trajectory of phosphorus loading and export from Mississippi River Basin to the Gulf of Mexico: Contributions of multiple environmental changes. Glob. Biogeochem. Cycles 2022, 36, e2022GB007347. [Google Scholar] [CrossRef]
  13. Yin, S.; Gao, G.; Li, Y.; Xu, Y.J.; Turner, R.E.; Ran, L.; Wang, X.; Fu, B. Long-term trends of streamflow, sediment load and nutrient fluxes from the Mississippi River Basin: Impacts of climate change and human activities. J. Hydrol. 2023, 616, 128822. [Google Scholar] [CrossRef]
  14. Lucas, E.; Kennedy, B.; Roswall, T.; Burgis, C.; Toor, G.S. Climate change effects on phosphorus loss from agricultural land to water: A review. Curr. Pollut. Rep. 2023, 9, 623–645. [Google Scholar] [CrossRef]
  15. Menge, D.N.; Kou-Giesbrecht, S.; Taylor, B.N.; Akana, P.R.; Butler, A.; Carreras Pereira, K.A.; Cooley, S.S.; Lau, V.M.; Lauterbach, E.L. Terrestrial phosphorus cycling: Responses to climatic change. Annu. Rev. Ecol. Evol. Syst. 2023, 54, 429–449. [Google Scholar] [CrossRef]
  16. Jarvie, H.P.; Sharpley, A.N.; Spears, B.; Buda, A.R.; May, L.; Kleinman, P.J. Water quality remediation faces unprecedented challenges from “legacy phosphorus”. ACS Publ. 2013, 47, 8991–8998. [Google Scholar] [CrossRef]
  17. Kang, L.; Zhu, G.; Zhu, M.; Xu, H.; Zou, W.; Xiao, M.; Zhang, Y.; Qin, B. Bloom-induced internal release controlling phosphorus dynamics in large shallow eutrophic Lake Taihu, China. Environ. Res. 2023, 231, 116251. [Google Scholar] [CrossRef]
  18. Tao, Y.; Dan, D.; Xuejiao, H.; Changda, H.; Guo, F.; Fengchang, W. Characterization of phosphorus accumulation and release using diffusive gradients in thin films (DGT)-linking the watershed to Taihu Lake China. Sci. Total Environ. 2019, 673, 347–356. [Google Scholar] [CrossRef]
  19. Dupas, R.; Delmas, M.; Dorioz, J.-M.; Garnier, J.; Moatar, F.; Gascuel-Odoux, C. Assessing the impact of agricultural pressures on N and P loads and eutrophication risk. Ecol. Indic. 2015, 48, 396–407. [Google Scholar] [CrossRef]
  20. Khan, S.; Wang, Y.; Milham, P.J.; Lin, Z.; Qi, X.; Gao, H.; Duan, Y.; Shi, J.; Oduro, C.; Ullah, H.; et al. Effect of stormwater and land use on biogeochemical transformations of dissolved and particulate phosphorus in freshwater systems. Water Res. 2025, 284, 124007. [Google Scholar] [CrossRef] [PubMed]
  21. Tang, H.; Wang, Z.; Tang, B.; Ma, Y.; Pei, L.; Tian, F.; Wang, J.; Nanding, N.; Sparrow, S.; Tett, S.; et al. Reduced probability of 2020 June–July persistent heavy Meiyu rainfall event in the mid-lower reaches of the Yangtze River basin under anthropogenic forcing. Bull. Am. Meteorol. Soc. 2022, 103, 83–89. [Google Scholar] [CrossRef]
  22. Zhou, S.; Williams, A.P.; Berg, A.M.; Cook, B.I.; Zhang, Y.; Hagemann, S.; Lorenz, R.; Seneviratne, S.I.; Gentine, P. Land–atmosphere feedbacks exacerbate concurrent soil drought and atmospheric aridity. Proc. Natl. Acad. Sci. USA 2019, 116, 18848–18853. [Google Scholar] [CrossRef]
  23. GB 11893-89; Water Quality-Determination of Total Phosphorus-Ammonium Molybdate Spectrophotometric Method. State Administration for Market Regulation: Beijing, China, 1989.
  24. Lin, Z. Estimating Water Budgets and Vertical Leakages for Karst Lakes in North-Central Florida (United States) Via Hydrological Modeling 1. J. Am. Water Resour. Assoc. 2011, 47, 287–302. [Google Scholar] [CrossRef]
  25. Liu, Z.; Tong, S.T.Y. Using HSPF to Model the Hydrologic and Water Quality Impacts of Riparian Land-Use Change in a Small Watershed. J. Environ. Inform. 2011, 17, 15–24. [Google Scholar] [CrossRef]
  26. Jacobson, C.R. Identification and quantification of the hydrological impacts of imperviousness in urban catchments: A review. J. Environ. Manag. 2011, 92, 1438–1448. [Google Scholar] [CrossRef]
  27. Wang, Z.; Zhang, S.; Peng, Y.; Wu, C.; Lv, Y.; Xiao, K.; Zhao, J.; Qian, G. Impact of rapid urbanization on the threshold effect in the relationship between impervious surfaces and water quality in shanghai China. Environ. Pollut. 2020, 267, 115569. [Google Scholar] [CrossRef] [PubMed]
  28. Yang, L.; Smith, J.A.; Baeck, M.L.; Zhang, Y. Flash flooding in small urban watersheds: Storm event hydrologic response. Water Resour. Res. 2016, 52, 4571–4589. [Google Scholar] [CrossRef]
  29. Zhou, Z.; Smith, J.A.; Baeck, M.L.; Wright, D.B.; Smith, B.K.; Liu, S. The impact of spatiotemporal structure of rainfall on flood frequency over a small urban watershed: An approach coupling stochastic storm transposition and hydrologic modeling. Hydrol. Earth Syst. Sci. Discuss. 2021, 2021, 4701–4717. [Google Scholar] [CrossRef]
  30. Feng, B.; Zhang, Y.; Bourke, R. Urbanization impacts on flood risks based on urban growth data and coupled flood models. Nat. Hazards 2021, 106, 613–627. [Google Scholar] [CrossRef]
  31. Alamdari, N.; Hogue, T.S. Assessing the effects of climate change on urban watersheds: A review and call for future research. Environ. Rev. 2022, 30, 61–71. [Google Scholar] [CrossRef]
  32. Weng, Q. Remote sensing of impervious surfaces in the urban areas: Requirements, methods, and trends. Remote Sens. Environ. 2012, 117, 34–49. [Google Scholar] [CrossRef]
  33. Osterholz, W.R.; Hanrahan, B.R.; King, K.W. Legacy phosphorus concentration–discharge relationships in surface runoff and tile drainage from Ohio crop fields. J. Environ. Qual. 2020, 49, 675–687. [Google Scholar] [CrossRef]
  34. Stackpoole, S.M.; Stets, E.G.; Sprague, L.A. Variable impacts of contemporary versus legacy agricultural phosphorus on US river water quality. Proc. Natl. Acad. Sci. USA 2019, 116, 20562–20567. [Google Scholar] [CrossRef] [PubMed]
  35. Tilahun, A.B.; Dürr, H.H.; Schweden, K.; Flörke, M. Perspectives on total phosphorus response in rivers: Examining the influence of rainfall extremes and post-dry rainfall. Sci. Total Environ. 2024, 940, 173677. [Google Scholar] [CrossRef]
  36. Liu, J.; Han, C.; Zhao, Y.; Yang, J.; Cade-Menun, B.J.; Hu, Y.; Li, J.; Liu, H.; Sui, P.; Chen, Y.; et al. The chemical nature of soil phosphorus in response to long-term fertilization practices: Implications for sustainable phosphorus management. J. Clean. Prod. 2020, 272, 123093. [Google Scholar] [CrossRef]
  37. Wang, J.; Qi, Z.; Wang, C. Phosphorus loss management and crop yields: A global meta-analysis. Agric. Ecosyst. Environ. 2023, 357, 108683. [Google Scholar] [CrossRef]
  38. Deng, C.; Xiong, Q.; Harrison, M.T.; Xu, F.; Xiang, Q.; Li, L.; Liu, K. Declining frequency yet increasing intensity of crop waterlogging events under future climates. J. Hydrol. 2025, 663, 134178. [Google Scholar] [CrossRef]
  39. Bai, Z.; Liu, L.; Kroeze, C.; Strokal, M.; Chen, X.; Yuan, Z.; Ma, L. Optimizing phosphorus fertilizer use to enhance water quality, food security and social equality. Resour. Conserv. Recycl. 2024, 203, 107400. [Google Scholar] [CrossRef]
  40. Xia, Y.; Zhang, M.; Tsang, D.C.; Geng, N.; Lu, D.; Zhu, L.; Igalavithana, A.D.; Dissanayake, P.D.; Rinklebe, J.; Yang, X. Recent advances in control technologies for non-point source pollution with nitrogen and phosphorous from agricultural runoff: Current practices and future prospects. Appl. Biol. Chem. 2020, 63, 8. [Google Scholar] [CrossRef]
  41. Yang, Y.-Y.; Toor, G.S. Sources and mechanisms of nitrate and orthophosphate transport in urban stormwater runoff from residential catchments. Water Res. 2017, 112, 176–184. [Google Scholar] [CrossRef] [PubMed]
  42. Yang, Y.-Y.; Toor, G.S. Stormwater runoff driven phosphorus transport in an urban residential catchment: Implications for protecting water quality in urban watersheds. Sci. Rep. 2018, 8, 11681. [Google Scholar] [CrossRef] [PubMed]
  43. Whitehead, P.G.; Wilby, R.L.; Battarbee, R.W.; Kernan, M.; Wade, A.J. A review of the potential impacts of climate change on surface water quality. Hydrol. Sci. J. 2009, 54, 101–123. [Google Scholar] [CrossRef]
  44. Sudriani, Y.; Sebestyén, V.; Abonyi, J. Surface water monitoring systems—The importance of integrating information sources for sustainable watershed management. IEEE Access 2023, 11, 36421–36451. [Google Scholar] [CrossRef]
  45. Sharma-Wallace, L.; Velarde, S.J.; Wreford, A. Adaptive governance good practice: Show me the evidence! J. Environ. Manag. 2018, 222, 174–184. [Google Scholar] [CrossRef]
  46. Chaffin, B.C.; Garmestani, A.S.; Gunderson, L.H.; Benson, M.H.; Angeler, D.G.; Arnold, C.A.; Cosens, B.; Craig, R.K.; Ruhl, J.B.; Allen, C.R. Transformative environmental governance. Annu. Rev. Environ. Resour. 2016, 41, 399–423. [Google Scholar] [CrossRef]
  47. Amorim, C.A.; do Nascimento Moura, A. Ecological impacts of freshwater algal blooms on water quality, plankton biodiversity, structure, and ecosystem functioning. Sci. Total Environ. 2021, 758, 143605. [Google Scholar] [CrossRef]
  48. Boubacar, I.; Pindilli, E.; Brown, E.; Simon, B.; Skrabis, K.; Luby, I. Societal Benefits of Cyanobacteria Harmful Algal Bloom Management in Lake Okeechobee in Florida—Potential Damages Avoided During the 2018 Event Under US Army Corps of Engineers Harmful Algal Bloom Interception, Treatment, and Transformation System Scenarios; No. 2024-5091; US Geological Survey: Reston, VA, USA, 2024.
  49. Wang, C.; Huang, C.; Zhang, S.; Zhang, L.; Li, T.; Peng, J.; Zhang, L. Research Progress on Nitrogen and Phosphorus Loss in Small Watersheds: A Regional Review. Water 2023, 15, 2894. [Google Scholar] [CrossRef]
  50. Paerl, H.W.; Scott, J.T.; McCarthy, M.J.; Newell, S.E.; Gardner, W.S.; Havens, K.E.; Hoffman, D.K.; Wilhelm, S.W.; Wurtsbaugh, W.A. It takes two to tango: When and where dual nutrient (N & P) reductions are needed to protect lakes and downstream ecosystems. Environ. Sci. Technol. 2016, 50, 10805–10813. [Google Scholar] [CrossRef] [PubMed]
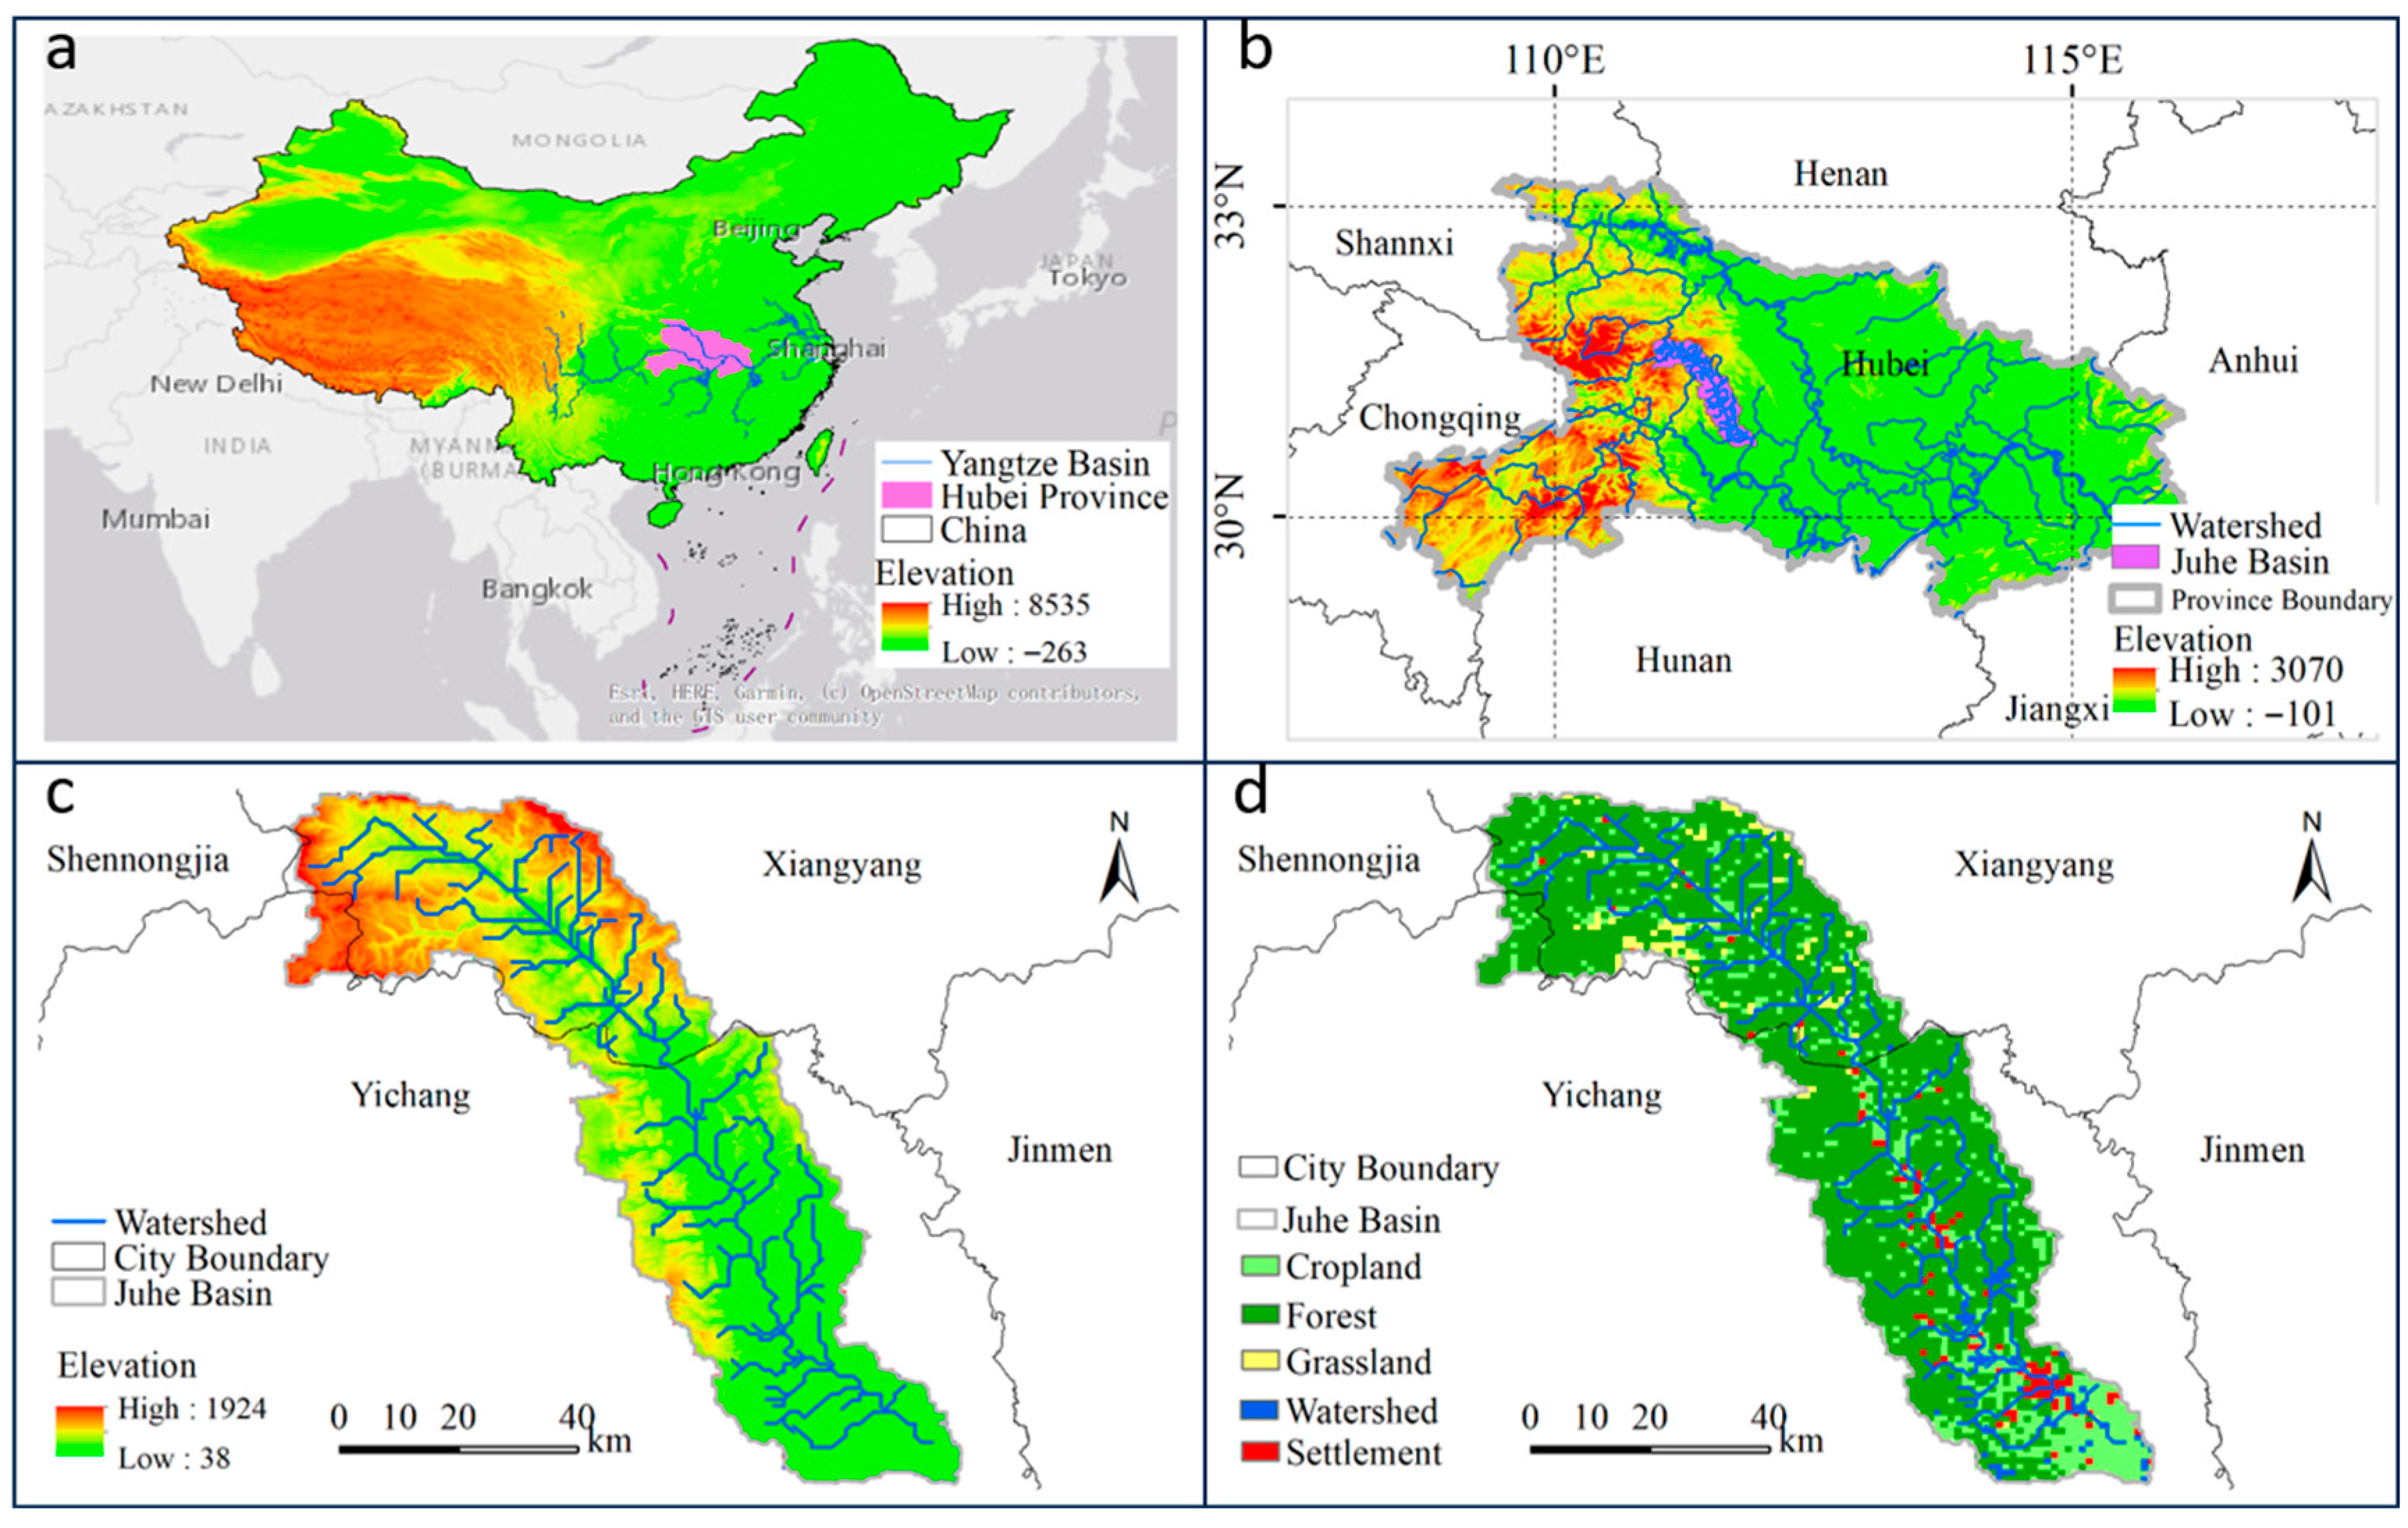
Figure 1. (a) Geographical location of Hubei Province and the Yangtze River Basin in China. The magenta area represents Hubei Province, the blue area indicates the Yangtze River Basin, and the background color gradient from green to red depicts elevation across China. (b) Location of the Ju River Basin within Hubei Province. The purple area indicates the Ju River Basin, blue lines represent the provincial river network, gray lines denote provincial boundaries, and the background gradient shows elevation variation across Hubei Province. (c) Topography and river network of the Ju River Basin. The blue lines represent the Ju River network, gray lines indicate urban boundaries, and the green-to-red color gradient represents elevation. (d) Land use distribution in the Ju River Basin. Light green indicates cropland, dark green denotes forest, light yellow represents grassland, and red indicates residential areas.
Water 17 02771 g001
Figure 2. Overall research framework. In the diagram, DEM represents the digital elevation model, and TP denotes total phosphorus concentration. Key parameters in the HSPF model include: LZSN (lower zone nominal storage), UZSN (upper zone nominal storage), LZETP (lower zone evapotranspiration parameter), INFILT (infiltration rate), INTFW (interflow inflow parameter), AGWRC (groundwater recession constant), and IRC (interflow recession constant).
Water 17 02771 g002
Figure 3. (a) Monthly average discharge of the Ju River in 2023 under different urban expansion scenarios, with bar colors indicating different scenarios. (b) Distribution of daily discharge grouped by month under each scenario, with boxplot colors representing different levels of urban expansion. The x-axis represents months, and the y-axis represents discharge (m3/s). Q1 denotes the baseline scenario with no urban expansion, while Q2–Q5 represent urban expansions of 100 m, 200 m, 300 m, and 500 m, respectively.
Water 17 02771 g003
Figure 4. (a) Monthly average total phosphorus (TP) concentrations in the Ju River under different urban expansion scenarios in 2023, with bar colors indicating each scenario. (b) Distribution of daily TP concentrations grouped by month under each scenario, with boxplot colors representing different levels of urban expansion. The x-axis represents months, and the y-axis represents TP concentration (mg/L). Q1 denotes the baseline scenario (no urban expansion), while Q2–Q5 represent urban expansion of 100 m, 200 m, 300 m, and 500 m, respectively.
Water 17 02771 g004
Figure 5. (a) Monthly average discharge of the Ju River in 2023 under different precipitation increase scenarios, with bar colors representing each scenario. (b) Distribution of daily discharge grouped by month under each scenario, with boxplot colors indicating different precipitation treatments. The x-axis denotes the month, and the y-axis represents discharge. P1 represents the baseline scenario using observed 2023 precipitation; P2 simulates a 30% increase in precipitation during the wet season (May–August); P3 simulates a 30% increase in precipitation throughout the entire year. In both P2 and P3, the increase was applied to each observed rainfall event, without altering the frequency of rainfall occurrences.
Water 17 02771 g005
Figure 6. (a) Monthly average total phosphorus (TP) concentrations in the Ju River in 2023 under different precipitation increase scenarios, with bar colors indicating each scenario; (b) Distribution of daily TP concentrations grouped by month under the three scenarios, with boxplot colors representing different precipitation inputs. The x-axis represents the month, and the y-axis represents total phosphorus concentration. P1 corresponds to the baseline scenario using observed 2023 precipitation; P2 represents a 30% increase in precipitation during the wet season (May–August); P3 represents a 30% increase in precipitation throughout the entire year. In both P2 and P3, the increase was applied to each observed rainfall event without changing the frequency of rainfall occurrences.
Water 17 02771 g006
Table 1. Summary of data sources and associated parameter information.
DataFormatResolutionYearSource
DEMimg30 m2022https://www.resdc.cn/data.aspx?DATAID=217 (accessed on 18 July 2022)
Land Usetiff1 km2023https://www.resdc.cn/DOI/DOI.aspx?DOIid=54 (accessed on 21 June 2022)
Hydrological Datawdmmonth2022–2023Herong Hydrological Station (30.62° N, 112.07° E)
Meteorological Datawdm1 h2022–2023https://data.cma.cn/ (accessed on 23 June 2022)
Soil Typetif1 km1995https://www.resdc.cn/data.aspx?DATAID=145 (accessed on 29 June 2022)
Pollution Sourceshp-2022Yichang municipal bureau of ecology and environment
Table 2. Model parameters requiring calibration and their final calibrated values in this study.
ParametersImplicationUnitValues
LZSNLower zone nominal storageIn3.5
UZSNupper zone nominal storageIn1
LZETPlower zone E-T parameterNone0.1
INFILTinfiltration rateIn/hr0.25
INTFWinterflow inflow parameterNon0.75
AGWRCgroundwater recession constant1/day0.99
IRCinterflow recession constant1/day0.5
Table 3. Model validation results based on simulated and observed discharge and total phosphorus (TP) concentrations, NSE represents the Nash–Sutcliffe efficiency coefficient; R2 represents the coefficient of determination; Re represents the relative error.
DateTypeReR2NSE
12 January 2022Flow rate (m3/s)−3.4%0.870.75
8 January 2023Flow rate (m3/s)1.4%0.980.96
14 July 2022TP (mg/L)−7.28%0.980.86
24 February 2023TP (mg/L)7.4%0.940.89
12 May 2023TP (mg/L)−8.65%0.990.91
5 July 2023TP (mg/L)17.46%0.980.82
Table 4. Monthly total phosphorus loads in the Ju River across different scenarios (kg).
MonthP1P2P3P4P5Q1Q2Q3
January543.66555.15555.50573.48614.70543.66543.66785.74
February443.43470.96480.91514.43582.73443.43443.43526.58
March496.74590.42678.35796.321036.63496.74496.74468.43
April977.951202.931510.011864.092608.28977.95977.951552.04
May1787.631953.172234.102638.773340.071787.631977.212205.99
June18,647.3718,600.0219,830.1620,913.8323,250.1918,647.3729,749.5730,919.88
July11,777.2913,351.9112,996.3613,621.0213,250.0811,777.2917,619.8917,504.90
August2838.413039.713330.353601.784136.672838.415832.505187.54
September1355.551361.941354.631370.091411.651355.551657.691868.15
October1334.071465.051536.831695.092022.721334.071500.931695.78
November1042.191147.261207.011339.431623.661042.191152.261307.60
December624.88605.81595.10580.21555.48624.88763.67851.86
Disclaimer/Publisher’s Note: The statements, opinions and data contained in all publications are solely those of the individual author(s) and contributor(s) and not of MDPI and/or the editor(s). MDPI and/or the editor(s) disclaim responsibility for any injury to people or property resulting from any ideas, methods, instructions or products referred to in the content.