Article

Quantitative Analysis of Hydraulic Fracture Geometry and Its Relationship with Key Water Hammer Pressure Features

1
Shale Gas Exploration and Development Department, CNPC Chuanqing Drilling Engineering Co., Ltd., Chengdu 610051, China
2
College of Energy, Chengdu University of Technology, Chengdu 610059, China
*
Author to whom correspondence should be addressed.
Water 2025, 17(18), 2741; https://doi.org/10.3390/w17182741
Submission received: 26 July 2025 / Revised: 11 September 2025 / Accepted: 11 September 2025 / Published: 16 September 2025

Abstract

Hydraulic fracturing technology is crucial for promoting oil and gas resource development. In recent years, water hammer fracture diagnostic techniques, derived from the water hammer effect in hydraulic fracturing, have garnered significant attention due to their low cost and ease of operation. The characteristic parameters of water hammer pressure are closely related to fracture geometry parameters. Monitoring the characteristics of water hammer pressure at the wellhead allows for rapid assessment of fracturing effectiveness. This study comprehensively considers wellbore friction, perforation friction, and the fluid loss effect within hydraulic fractures, establishing a mathematical model for the evolution of water hammer pressure during multi-cluster staged fracturing in horizontal wells. Based on field-monitored water hammer data from multiple stages, this study employed water hammer fracture diagnostics to inversely determine the geometric parameters of fractures in different fracturing stages. Characteristic parameters of the water hammer pressure, including the initial amplitude, number of oscillations, oscillation duration, and attenuation rate, were calculated for different well sections. Furthermore, the correlations between these water hammer characteristics and the fracture geometric parameters were analyzed. The correlation analysis between characteristic parameters of water hammer pressure and geometric parameters of hydraulic fractures indicates that under conditions of longer fracture half-length and smaller fracture height, the generated water hammer pressure exhibits a higher initial amplitude, fewer oscillations, a shorter oscillation duration, and a larger attenuation rate. The research findings can facilitate rapid estimation of fracture geometry using water hammer pressure, thereby optimizing fracturing design and enhancing fracturing effectiveness.

1. Introduction

With the rapid development of fracturing technology, the extraction of oil and gas resources has been significantly facilitated [1,2,3,4]. During the shut-in phase of hydraulic fracturing operations, an abrupt change in fluid flow velocity generates pressure pulses that propagate back and forth between the wellhead and the bottomhole. This phenomenon is known as the water hammer effect [5,6,7]. Pressure gauges installed at the wellhead can capture the series of pressure pulses generated during shut-in. In recent years, water hammer fracture diagnostic techniques, which leverage this water hammer effect, have garnered significant attention due to their advantages of low cost, ease of operation, and real-time monitoring capability [8,9].
Substantial research has been conducted on water hammer pressure analysis. Holzhausen et al. [10] were the first to propose utilizing water hammer signals for assessing fracture geometry. Subsequently, some researchers established water hammer models based on the equivalent circuit principle, thereby enabling the rapid evaluation of fracture geometry using water hammer pressure [11,12,13]. Meanwhile, other studies have revealed that water hammer pressure can reflect information related to subsurface formations and the wellbore. Consequently, leveraging surface-monitored water hammer pressure data and employing signal processing methodologies, researchers have analyzed downhole events such as fluid entry points and casing leaks [14,15,16,17]. These studies demonstrate that analyzing water hammer pressure can effectively identify fracture parameters and locate wellbore failures. This capability has stimulated significant scholarly interest in the characteristic parameters of water hammer pressure. Ciezobka et al. [18] established a water hammer pressure attenuation model based on characteristic parameters such as period, amplitude, and phase. By analyzing the water hammer attenuation rate across multiple fracturing stages, they postulated that a higher attenuation rate corresponds to a more complex fracture network. Separately, Iriarte et al. [19] utilized multi-well fracturing datasets to investigate the influence of operational parameters, wellbore parameters, and completion types on water hammer characteristics—including period, amplitude, duration, and attenuation rate. Their findings similarly confirmed a strong correlation between water hammer attenuation rate and fracture network complexity. Dung et al. [20] developed a numerical simulator for water hammer pressure response to evaluate its characteristics under various operational conditions. Concurrently, Luo et al. [21] established a novel computational model for water hammer attenuation rate. Through simulations and experimental data analysis, they investigated the influence of parameters including perforation cluster count, fracture count, and breakdown pressure on the attenuation rate. Complementing this, Teng et al. [22] analyzed the relationship between water hammer attenuation rate and daily oil production rate using fiber-optic sensing data from individual fracturing stages. Their results demonstrate that higher attenuation rates correspond to more complex fracture networks, which in turn contribute to higher production rates. Extensive research by numerous scholars confirms a strong correlation between water hammer response characteristics and fracture systems. However, these studies have not further investigated the relationships between water hammer characteristic parameters and downhole fractures. Water hammer pressure, formed through the combined effect of the wellbore and fractures, can reflect fracturing effectiveness. Analyzing the relationships between water hammer pressure response characteristics and downhole fracture geometric parameters can assist developers in rapidly evaluating fracturing effectiveness, thereby optimizing fracturing treatment designs and improving fracturing efficiency.
This study establishes a mathematical model for the evolution of water hammer pressure during multi-cluster staged fracturing in horizontal wells by comprehensively considering wellbore friction, perforation friction, and fluid loss effects within the fractures. The model is used to evaluate the geometric parameters of the fractures in each stage after fracturing. Based on the measured water hammer pressure data, an in-depth investigation was conducted into the correlation between the characteristics of the water hammer pressure response and the geometric parameters of the fracture. Firstly, a mathematical model for the evolution of water hammer pressure during multi-cluster staged fracturing in horizontal wells was established, comprehensively accounting for wellbore friction, perforation friction, and fluid filtration effects within the fractures. Furthermore, based on actual fracturing parameters, the fracture geometry for different fracturing stages was obtained utilizing water hammer diagnostic technology. Secondly, multi-stage field measurements of water-hammer pressure were analyzed (Pressure Monitor: Shanghai Ming-Control Sensing Technology Co., Ltd., Shanghai, China). From these data, the initial amplitude, oscillation count, oscillation duration, and attenuation rate of the pressure wave were extracted for each fracturing stage. Finally, the relationships between water hammer pressure response characteristics and downhole fracture geometric parameters were thoroughly examined. The research findings can provide a scientific basis for evaluating hydraulic fracturing effectiveness and optimizing treatment parameters.

2. Water Hammer Model

2.1. Mathematical Model of Water Hammer Pressure Evolution

During fracturing pump shutdown, abrupt flow velocity changes cause rapid pressure variations in the pipeline, generating a series of pressure pulses. Pressure monitoring gauges installed at the wellhead capture these pulses, known as water hammer pressure. Figure 1 shows the wellhead water hammer pressure monitoring configuration. To diagnose fracture parameters using water hammer pressure, a mathematical model was developed for water hammer pressure evolution in multi-cluster staged fracturing of horizontal wells [23]. This model considers wellbore friction, perforation friction, and fluid loss effects within fractures. The model consists of three parts: a wellbore flow model, initial conditions, and boundary conditions.

2.1.1. Pressure Propagation Model

The flow models in a wellbore consist of a continuity equation and a motion equation. The continuity and motion equations for water hammer can be described as follows [11]:
H t + Q A sin θ + a 2 g A Q x = 0
Q t + g A H x + f Q | Q | 2 D A = 0
In the formula, Q is the flow rate in the wellbore, m3/s; H is the water head in the wellbore, m; A is the cross-sectional area of the wellbore, m2; a is the speed of the pressure wave propagation in the wellbore, m/s; g is the acceleration due to gravity, m/s2; θ is the angle between the wellbore and the horizontal direction; t is the fracturing construction time, s.
The method of characteristics is routinely employed to recast the continuity and momentum equations into ordinary differential equations for solution. The resulting characteristic equations are given by Equations (3) and (4):
C + : d Q d t + g A a d H d t + f 2 D A Q | Q | Q g a A sin θ = 0 d x d t = a
C : d Q d t g A a d H d t + f 2 D A Q | Q | + Q g a A sin θ = 0 d x d t = a
Numerical discretization of the transformed characteristic equations using the finite difference method yields solution schemes for water head and flow rate at different wellbore nodes:
H i t + Δ t = C P B M + C M B P B P + B M
Q i t + Δ t = C P C M B P + B M
where C P = H i 1 t + B Q i 1 t , B P = B + R Q i 1 t , C M = H i + 1 t B Q i + 1 t , B M = B + R Q i + 1 t , B = a g A , R = f Δ x 2 g D A 2 , Δ t = Δ x a .
In the formula, CP and CM are equation coefficients in the solution scheme, m; BP and BM are equation coefficients in the solution scheme, s/m2; R is the wellbore resistance coefficient, s2/m5; B is the wellbore characteristic impedance, s/m2.

2.1.2. Initial Conditions

At the initial moment of pump shutdown, the flow in the wellbore is commonly regarded as steady-state. The initial water head at the wellhead is known and the water head distribution in the wellbore can be calculated using the Darcy–Weisbach formula [24]:
Q i 0 = Q 0
H 1 0 = H 0 , Δ H = f Δ L Q 2 2 g D A 2
In the formula, Q0 is the initial flow rate in the wellbore, m3/s; H0 is the initial head at the wellhead, m; ΔH is the head loss over the wellbore section, m; f is the friction factor along the wellbore, dimensionless.

2.1.3. Boundary Conditions

At the wellhead boundary, during the shutdown of fracturing pumps, a stepwise reduction in flow rate is adopted to prevent damage from water hammer effects caused by instantaneous pump stoppage. The wellhead flow boundary can be expressed by the following equation:
Q 1 t = Q t
For the bottomhole boundary, the bottomhole perforation friction and fluid mass conservation in the fracture are considered, and the bottomhole boundary is described by the following equation:
P w P f = 8 ρ Q 2 π 2 N p 2 d 4 C D 2
2 N f h f l f d w f d t = Q Q l e a k
In the formula, Pw is the bottomhole pressure, Pa; Pf is the fracture pressure, Pa; d is the perforation diameter, m; CD is the flow coefficient, dimensionless; Np is the number of open perforations, dimensionless; Nf is the number of open clusters, dimensionless; hf is the fracture height, m; lf is the fracture half-length, m; wf is the fracture aperture, m; Qleak is the fluid leak-off rate from the fracture, m3/s.
The fracture width and fluid loss volume are calculated by the following equations [25,26]:
w f = 2 P f σ min h f 1 ν π G α s
Q l e a k = 2 N f h f l f C L t f
In the formula, σmin is the minimum horizontal in situ stress, Pa; ν is the Poisson’s ratio of the formation rock, dimensionless; G is the shear modulus of the formation rock, Pa; αs is the fracture shape factor, dimensionless; CL is the leak-off coefficient, m/s0.5; tf is the leak-off reference time, s.
The finite difference method can be employed to solve the water head and flow rate at both the wellhead and bottomhole boundaries, respectively. From the flow rate boundary condition at the wellhead, the solution scheme for the water head and flow rate at the wellhead node can be derived as follows:
H 1 t + Δ t = C M + B M Q 1 t + Δ t , Q 1 t + Δ t = Q t + Δ t
For the bottomhole boundary, the solution scheme for the water head and flow rate at the bottomhole node can be derived by simultaneously solving Equations (5), (10), (11)–(13):
H n t + Δ t = C P B P Q n t + Δ t P n t + Δ t P f t + Δ t = 8 ρ π 2 N p 2 d 4 C D 2 Q n t + Δ t 2 2 N f h f l f w f t + Δ t w f t = Q n t + Δ t Q l e a k Δ t
Based on the actual fracturing parameters of each stage, this method was employed to iteratively adjust the fracture half-length, fracture height, number of clusters, and number of perforations to match the measured water hammer pressure curve, thereby enabling the analysis and determination of the fracture geometry parameters for different fracturing stages.

2.1.4. Model Validation

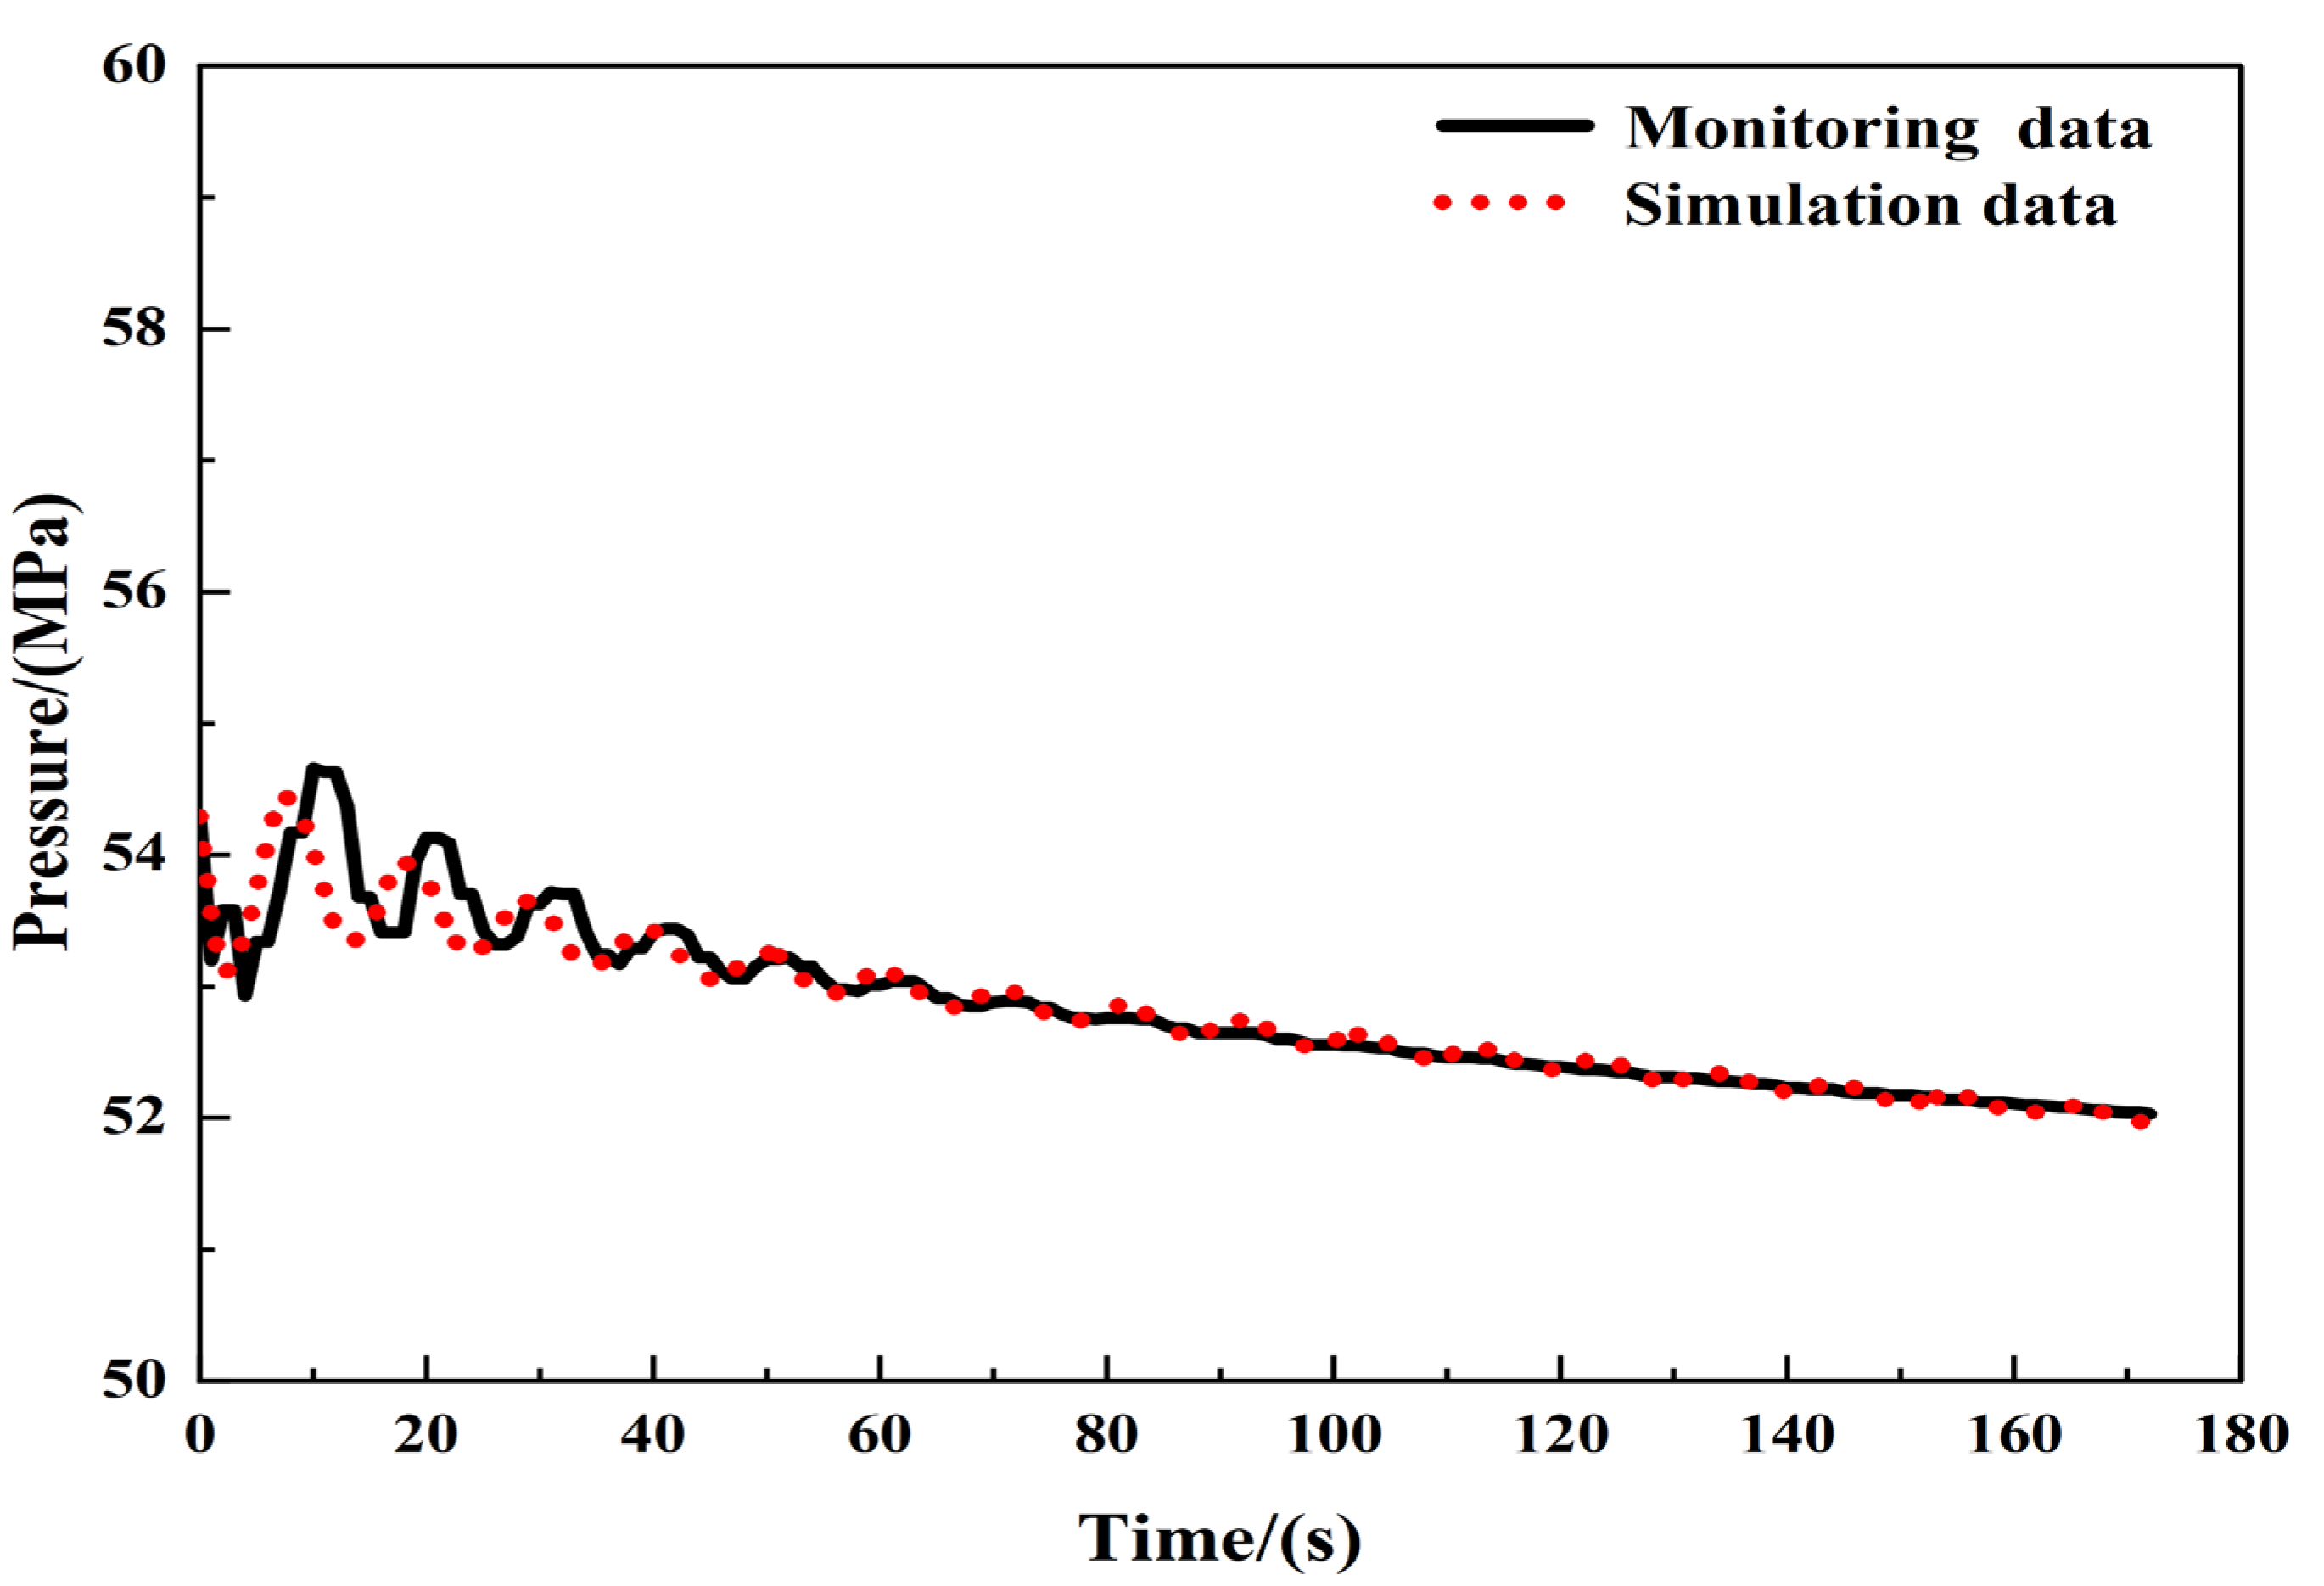
To validate the effectiveness of the method, a simulation of water hammer pressure was conducted using the aforementioned approach based on the fundamental data of a fracturing stage from a horizontal well in the Sichuan Basin. The vertical section length of the well is 2950 m, the horizontal section length is 644.5 m, the inner diameter of the wellbore is 114.6 mm, the pipe wall thickness is 10.54 mm, the rock’s Young’s modulus is 41.16 GPa, and the Poisson’s ratio of the rock is 0.25. The fracture geometry parameters of this fracturing stage were obtained by matching the simulated pressure data with the measured pressure data. Figure 2 shows the matching result between the simulated and measured pressure, demonstrating good agreement. The fitted fracture half-length and height for this stage are 174.37 m and 22.25 m, respectively. The microseismic interpretation for this stage indicates a fracture half-length of 162 m and a fracture height of 19 m. The relative error between the fracture half-length derived from water hammer diagnostics and that from microseismic interpretation is 7.6%, while the relative error for the fracture height is 17.1%. The good agreement between the two sets of results provides a certain level of validation for the reliability of the interpreted outcomes.

3. Characteristics of Water Hammer Pressure Response

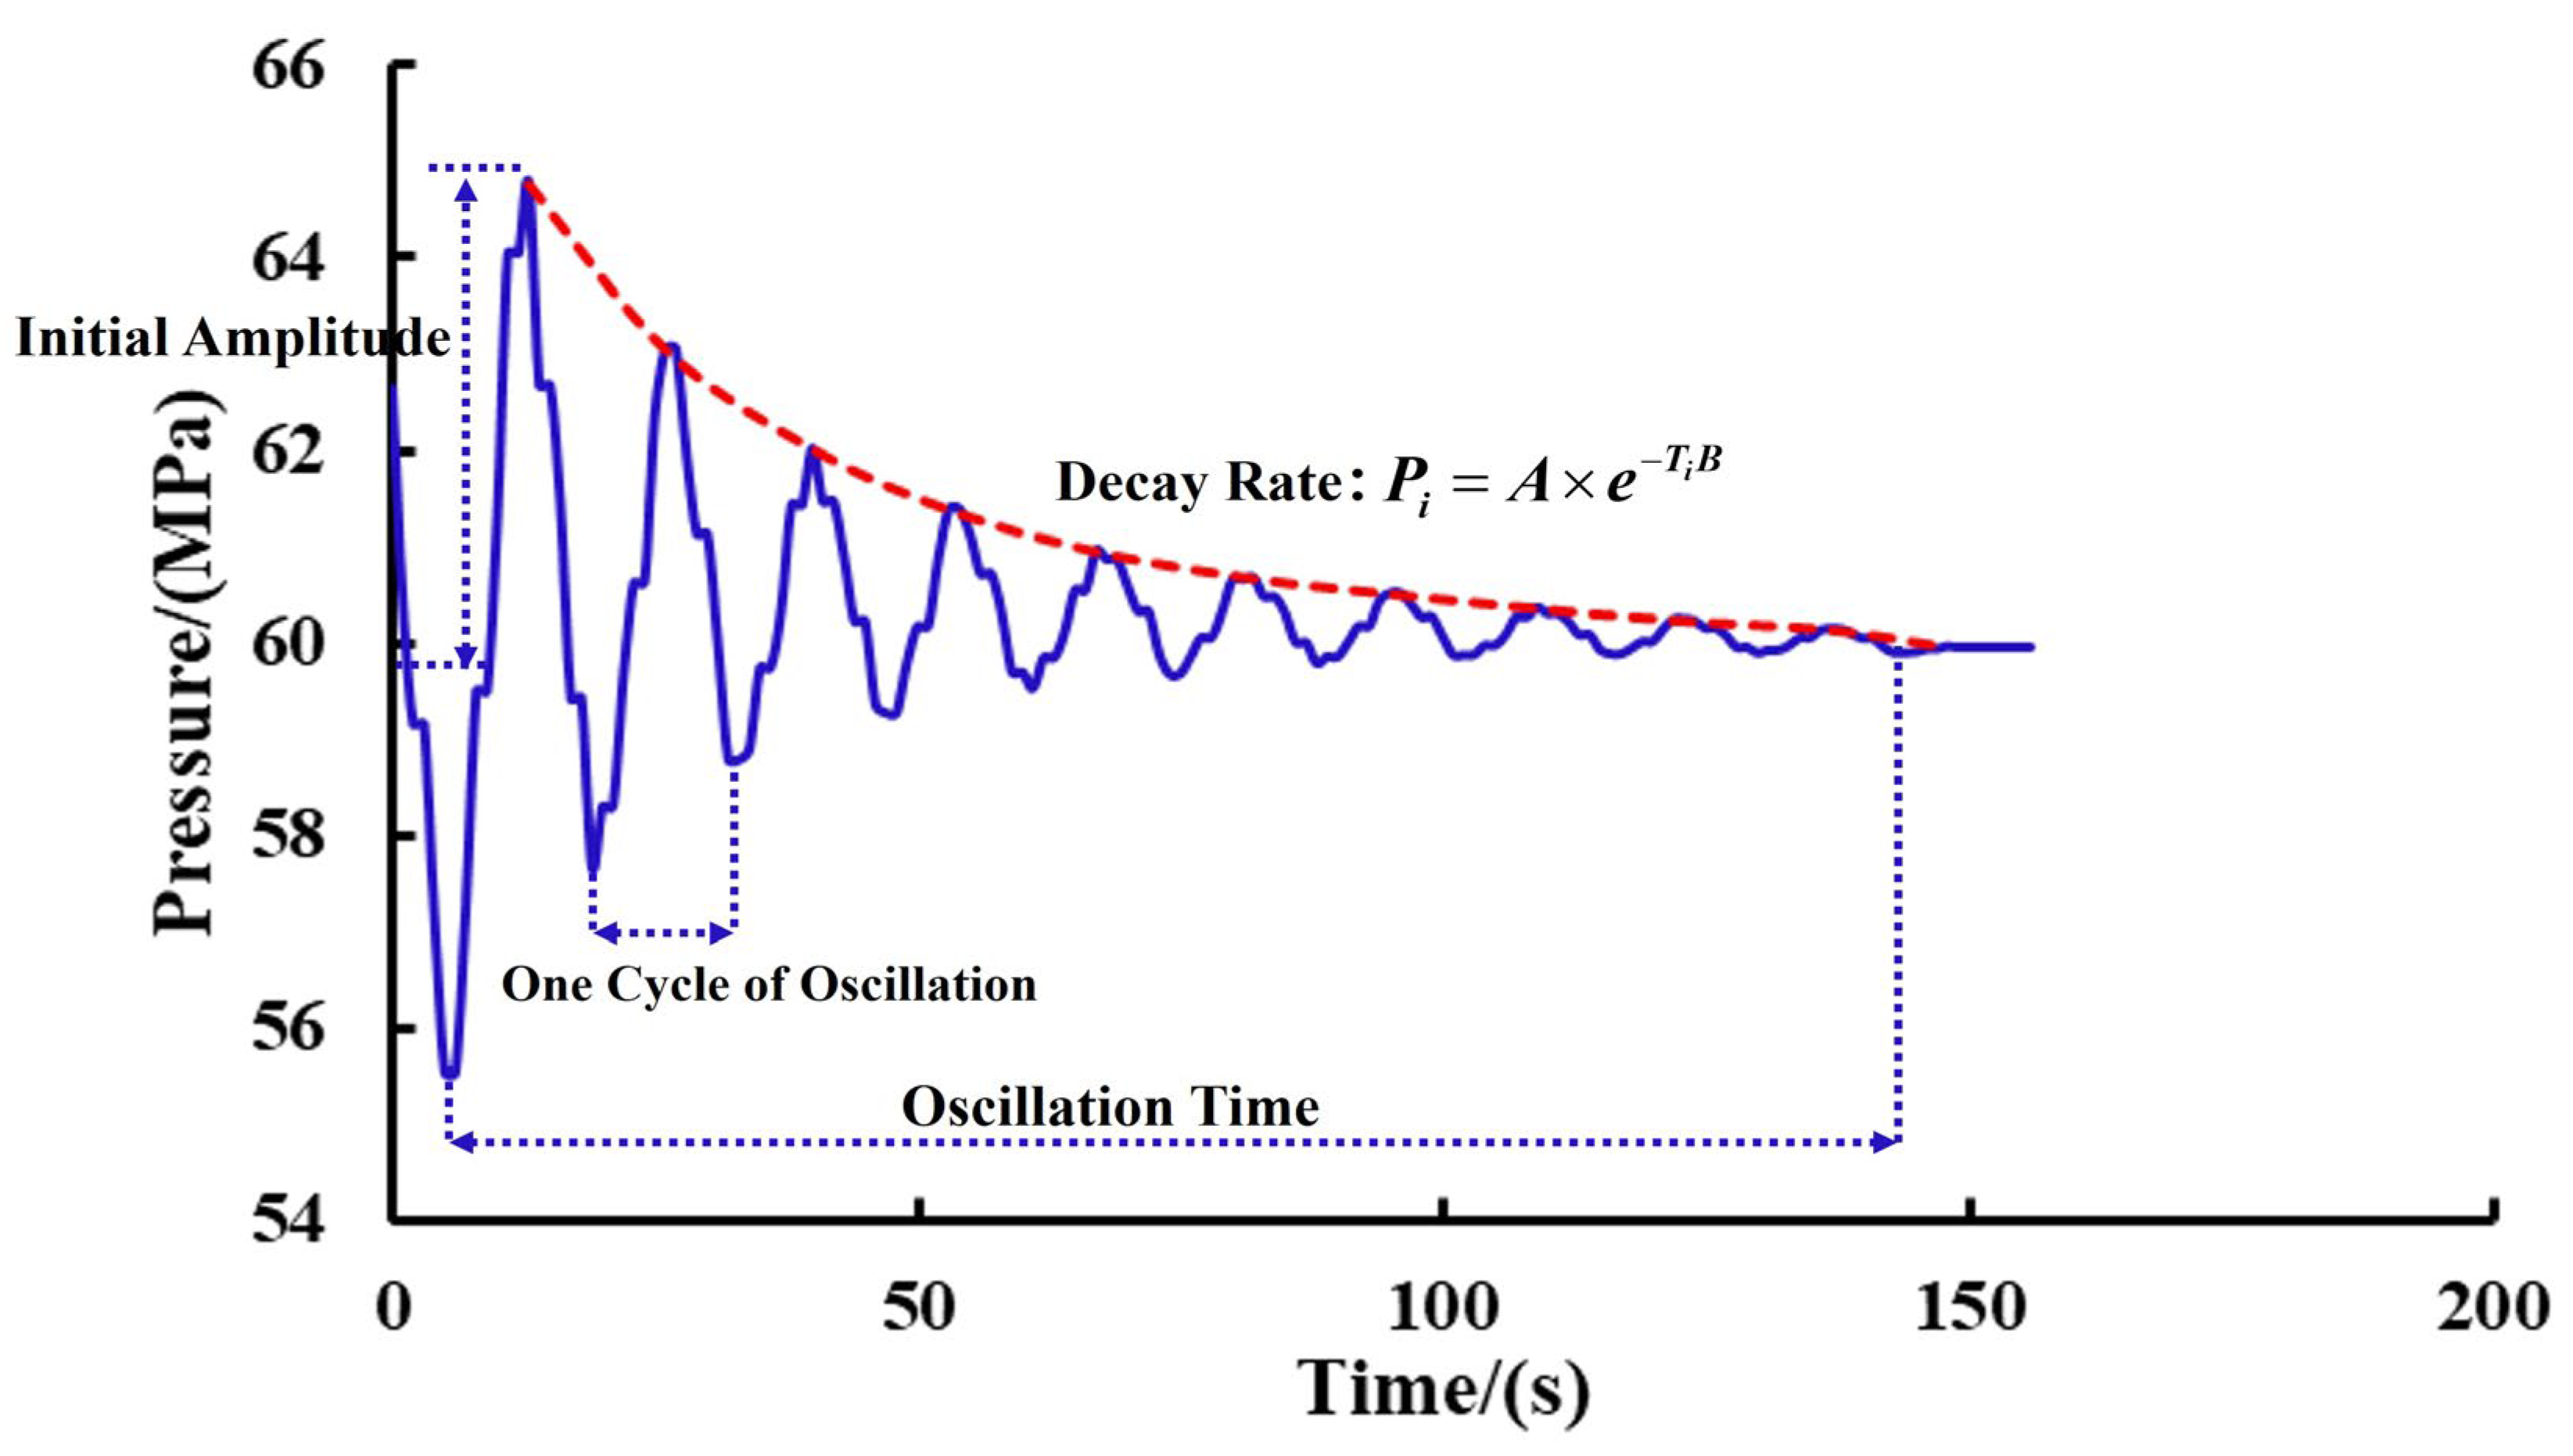
The water hammer response characteristics are closely associated with the fracture network formed at the wellbore bottom. For detailed illustration of the water hammer response parameters, refer to Figure 3. This study primarily delves into the relationship between water hammer pressure characteristics, such as initial amplitude, number of oscillations, oscillation time, and attenuation rate, and fracture parameters like half-length and height. The initial amplitude refers to half the pressure difference between the first pressure trough and the subsequent peak. A complete oscillation is defined as the cycle from a preceding trough to a peak and back to the next trough. The oscillation count represents the number of such complete oscillations observed in the water hammer pressure curve. The oscillation duration is the time elapsed from the start of the first oscillation to the end of the last oscillation. The water hammer decay rate denotes the attenuation rate of the water hammer pressure peaks. Analyzing the correlation between water hammer characteristic parameters and downhole fracture geometry can assist developers in rapidly evaluating fracturing effectiveness and optimizing fracturing operations.
The water hammer decay rate is a key characteristic parameter of water hammer pressure. Luo et al. [21] proposed a method for calculating this decay rate by extracting peak point data from the water hammer curve, followed by normalization and fitting of the extracted data. This method first extracts the peak point data for each water hammer cycle, recording the time (Ti, where i = 1, 2, 3, …, n) and pressure (PTi, where i = 1, 2, 3, …, n) of each peak. Subsequently, time is reset by defining the time of the first peak as the starting point (time zero) and adjusting the times of subsequent peaks accordingly. Finally, the average pressure after water hammer cessation is defined as the water hammer stop pressure (Ps). The extracted water hammer pressures are then normalized against Ps. The calculation formula is as follows:
T i = T i T 1
P i = ( P i P s ) / ( P 1 P s )
In the formula: P1 is the first maximum peak pressure point, MPa; T1 is the time corresponding to the first maximum peak pressure point, s; Ps is the water hammer cessation pressure, MPa.
Following data extraction and normalization of the monitored water hammer pressure, the processed data is fitted using a power-law function to obtain the water hammer decay rate. The formula is expressed as follows:
P i = A × e T i B

4. Results and Discussion

Based on multi-stage fracturing data from a shale gas horizontal well in the Sichuan Basin, fracture geometric parameters and water hammer characteristic parameters were analyzed for each stage. The well has a horizontal section length of 2850 m and a vertical section length of 2525 m. It was designed with 3–9 perforation clusters per stage. The formation Young’s modulus is 41.16 GPa, and the Poisson’s ratio is 0.25. First, water hammer fracture diagnostic technology was utilized to determine the fracture geometric parameters for each fracturing stage. Subsequently, the initial amplitude, oscillation count, and oscillation duration of the water hammer pressure for each stage were statistically analyzed. The water hammer pressure data monitored for each stage were then processed using the method proposed by Luo et al. [21] to fit and calculate the water hammer decay rate for each stage. Finally, the relationships between water hammer characteristic parameters and fracture half-length as well as fracture height were analyzed, thereby guiding the implementation of on-site fracturing operations.

4.1. Hydraulic Fracture Parameters and Water Hammer Characteristic Parameters

4.1.1. Fracture Geometric Parameters

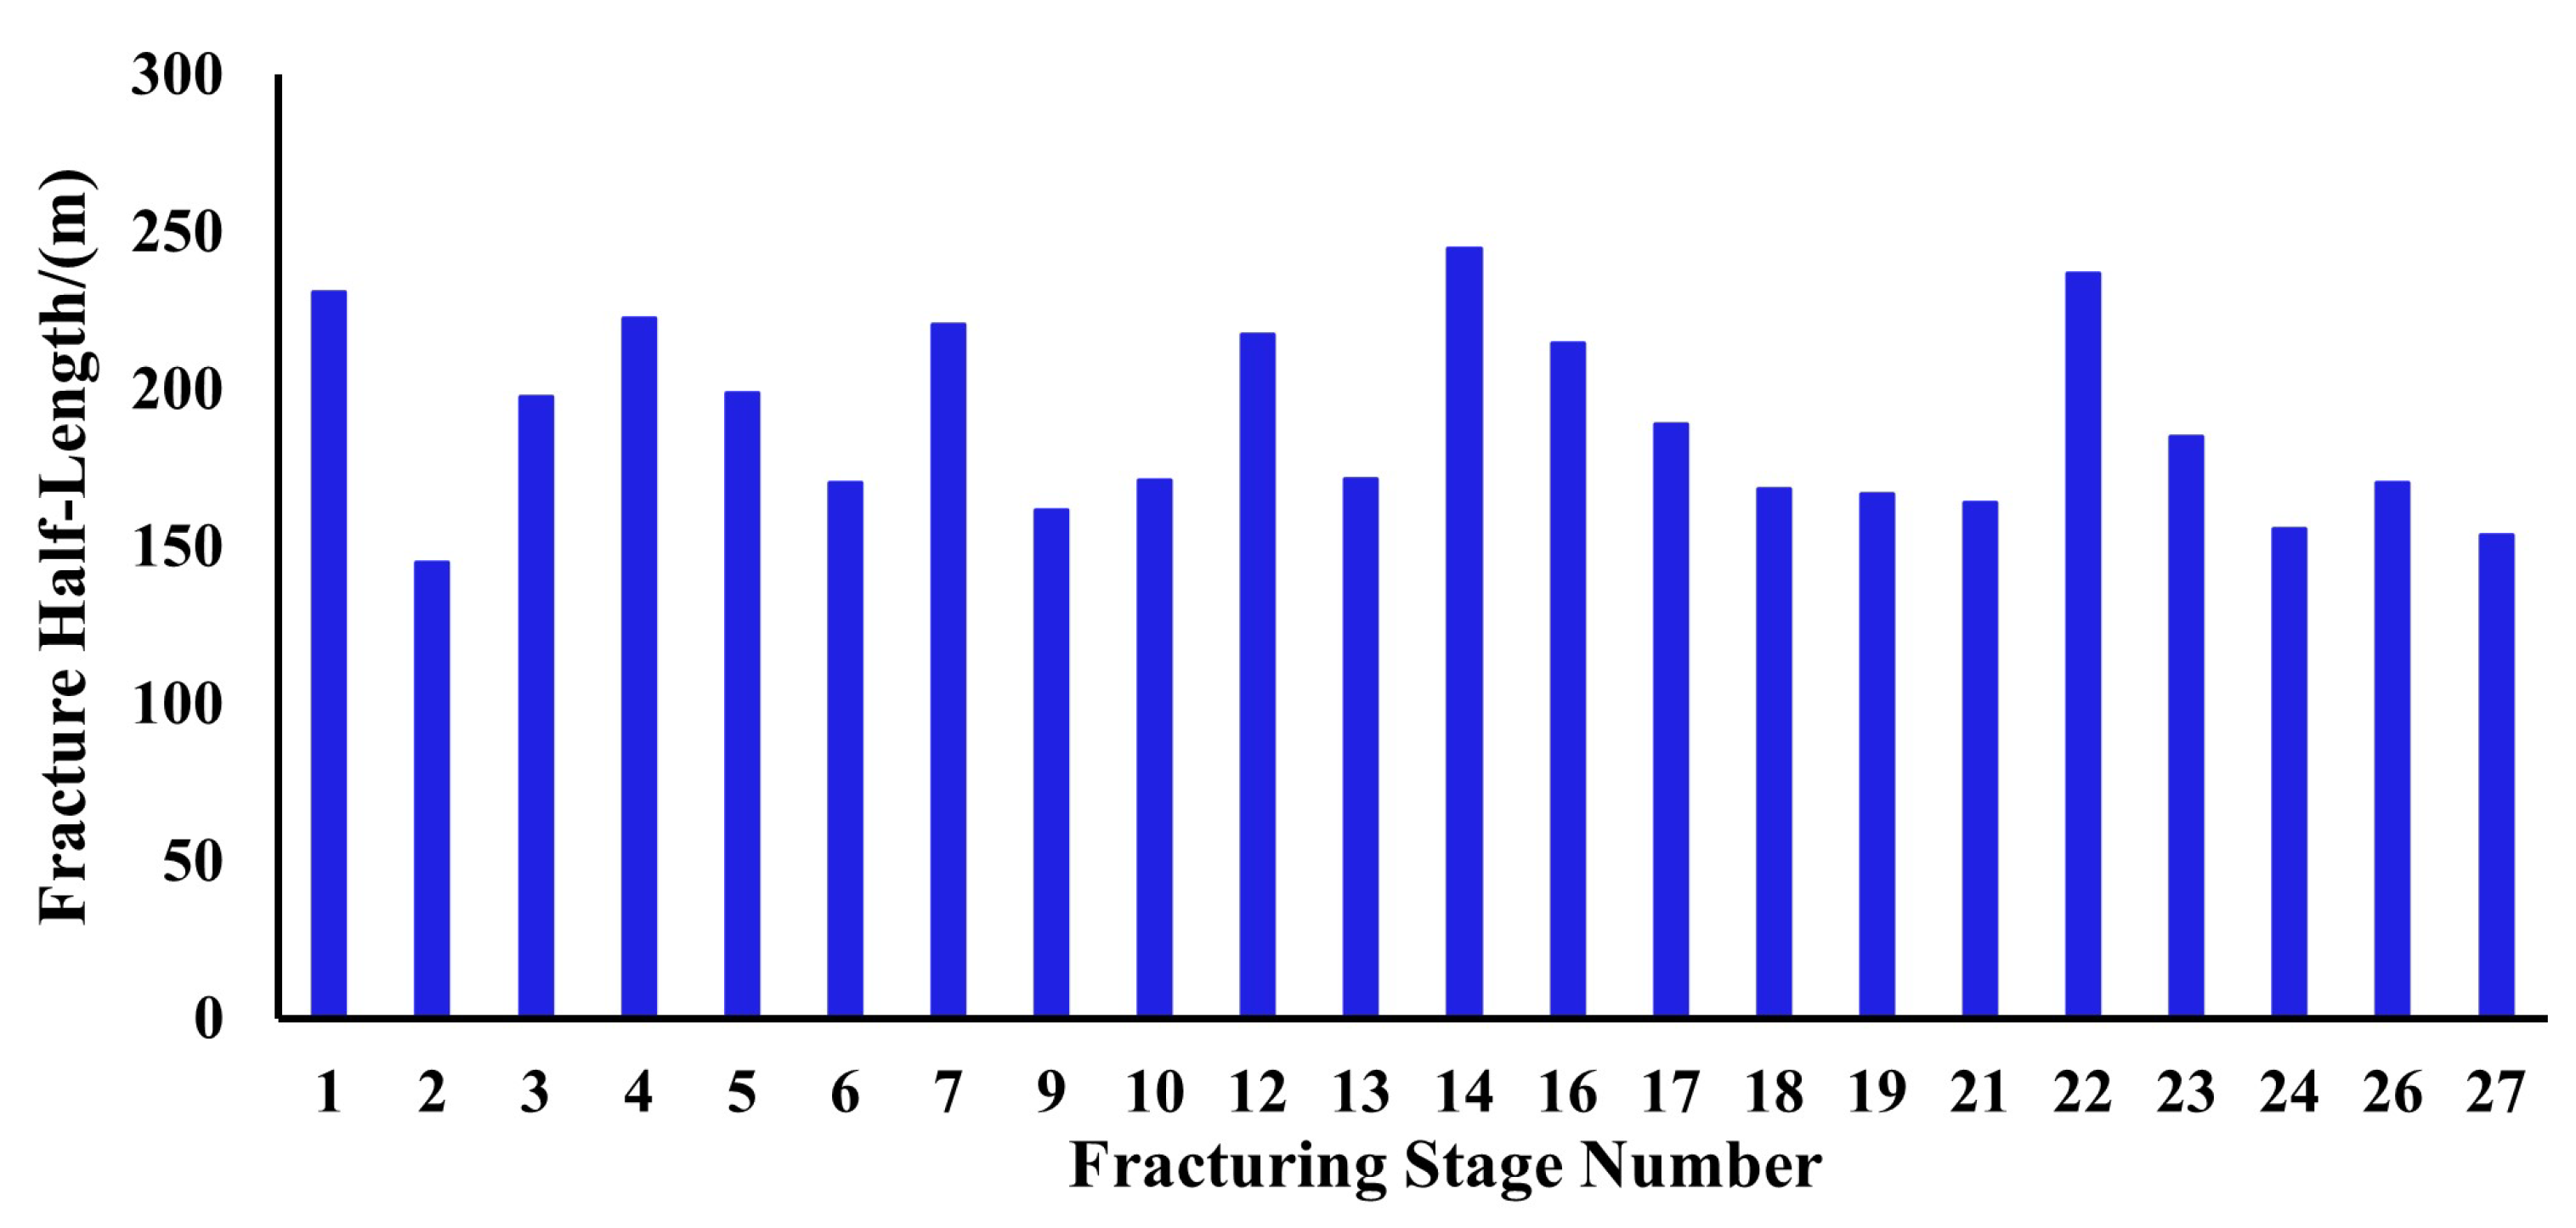
Based on the fundamental parameters for each stage, fracture geometric parameters were inverted for each fracturing stage using water hammer fracture diagnostic technology. The analyzed fracture half-lengths per stage are presented in Figure 4, and the fracture heights are presented in Figure 5.
Figure 4 and Figure 5 present the fracture half-length and fracture height data for each fracturing stage. As the fracturing operation progressed, the effective horizontal wellbore length corresponding to each stage gradually decreased due to the effect of bridge plugs or packers. The inverted fracture half-length for the stages ranges from 144.77 m to 244.68 m, with an average of 188.80 m. The fracture height ranges from 12.31 m to 22.24 m, with an average of 16.26 m.

4.1.2. Water Hammer Characteristic Parameters

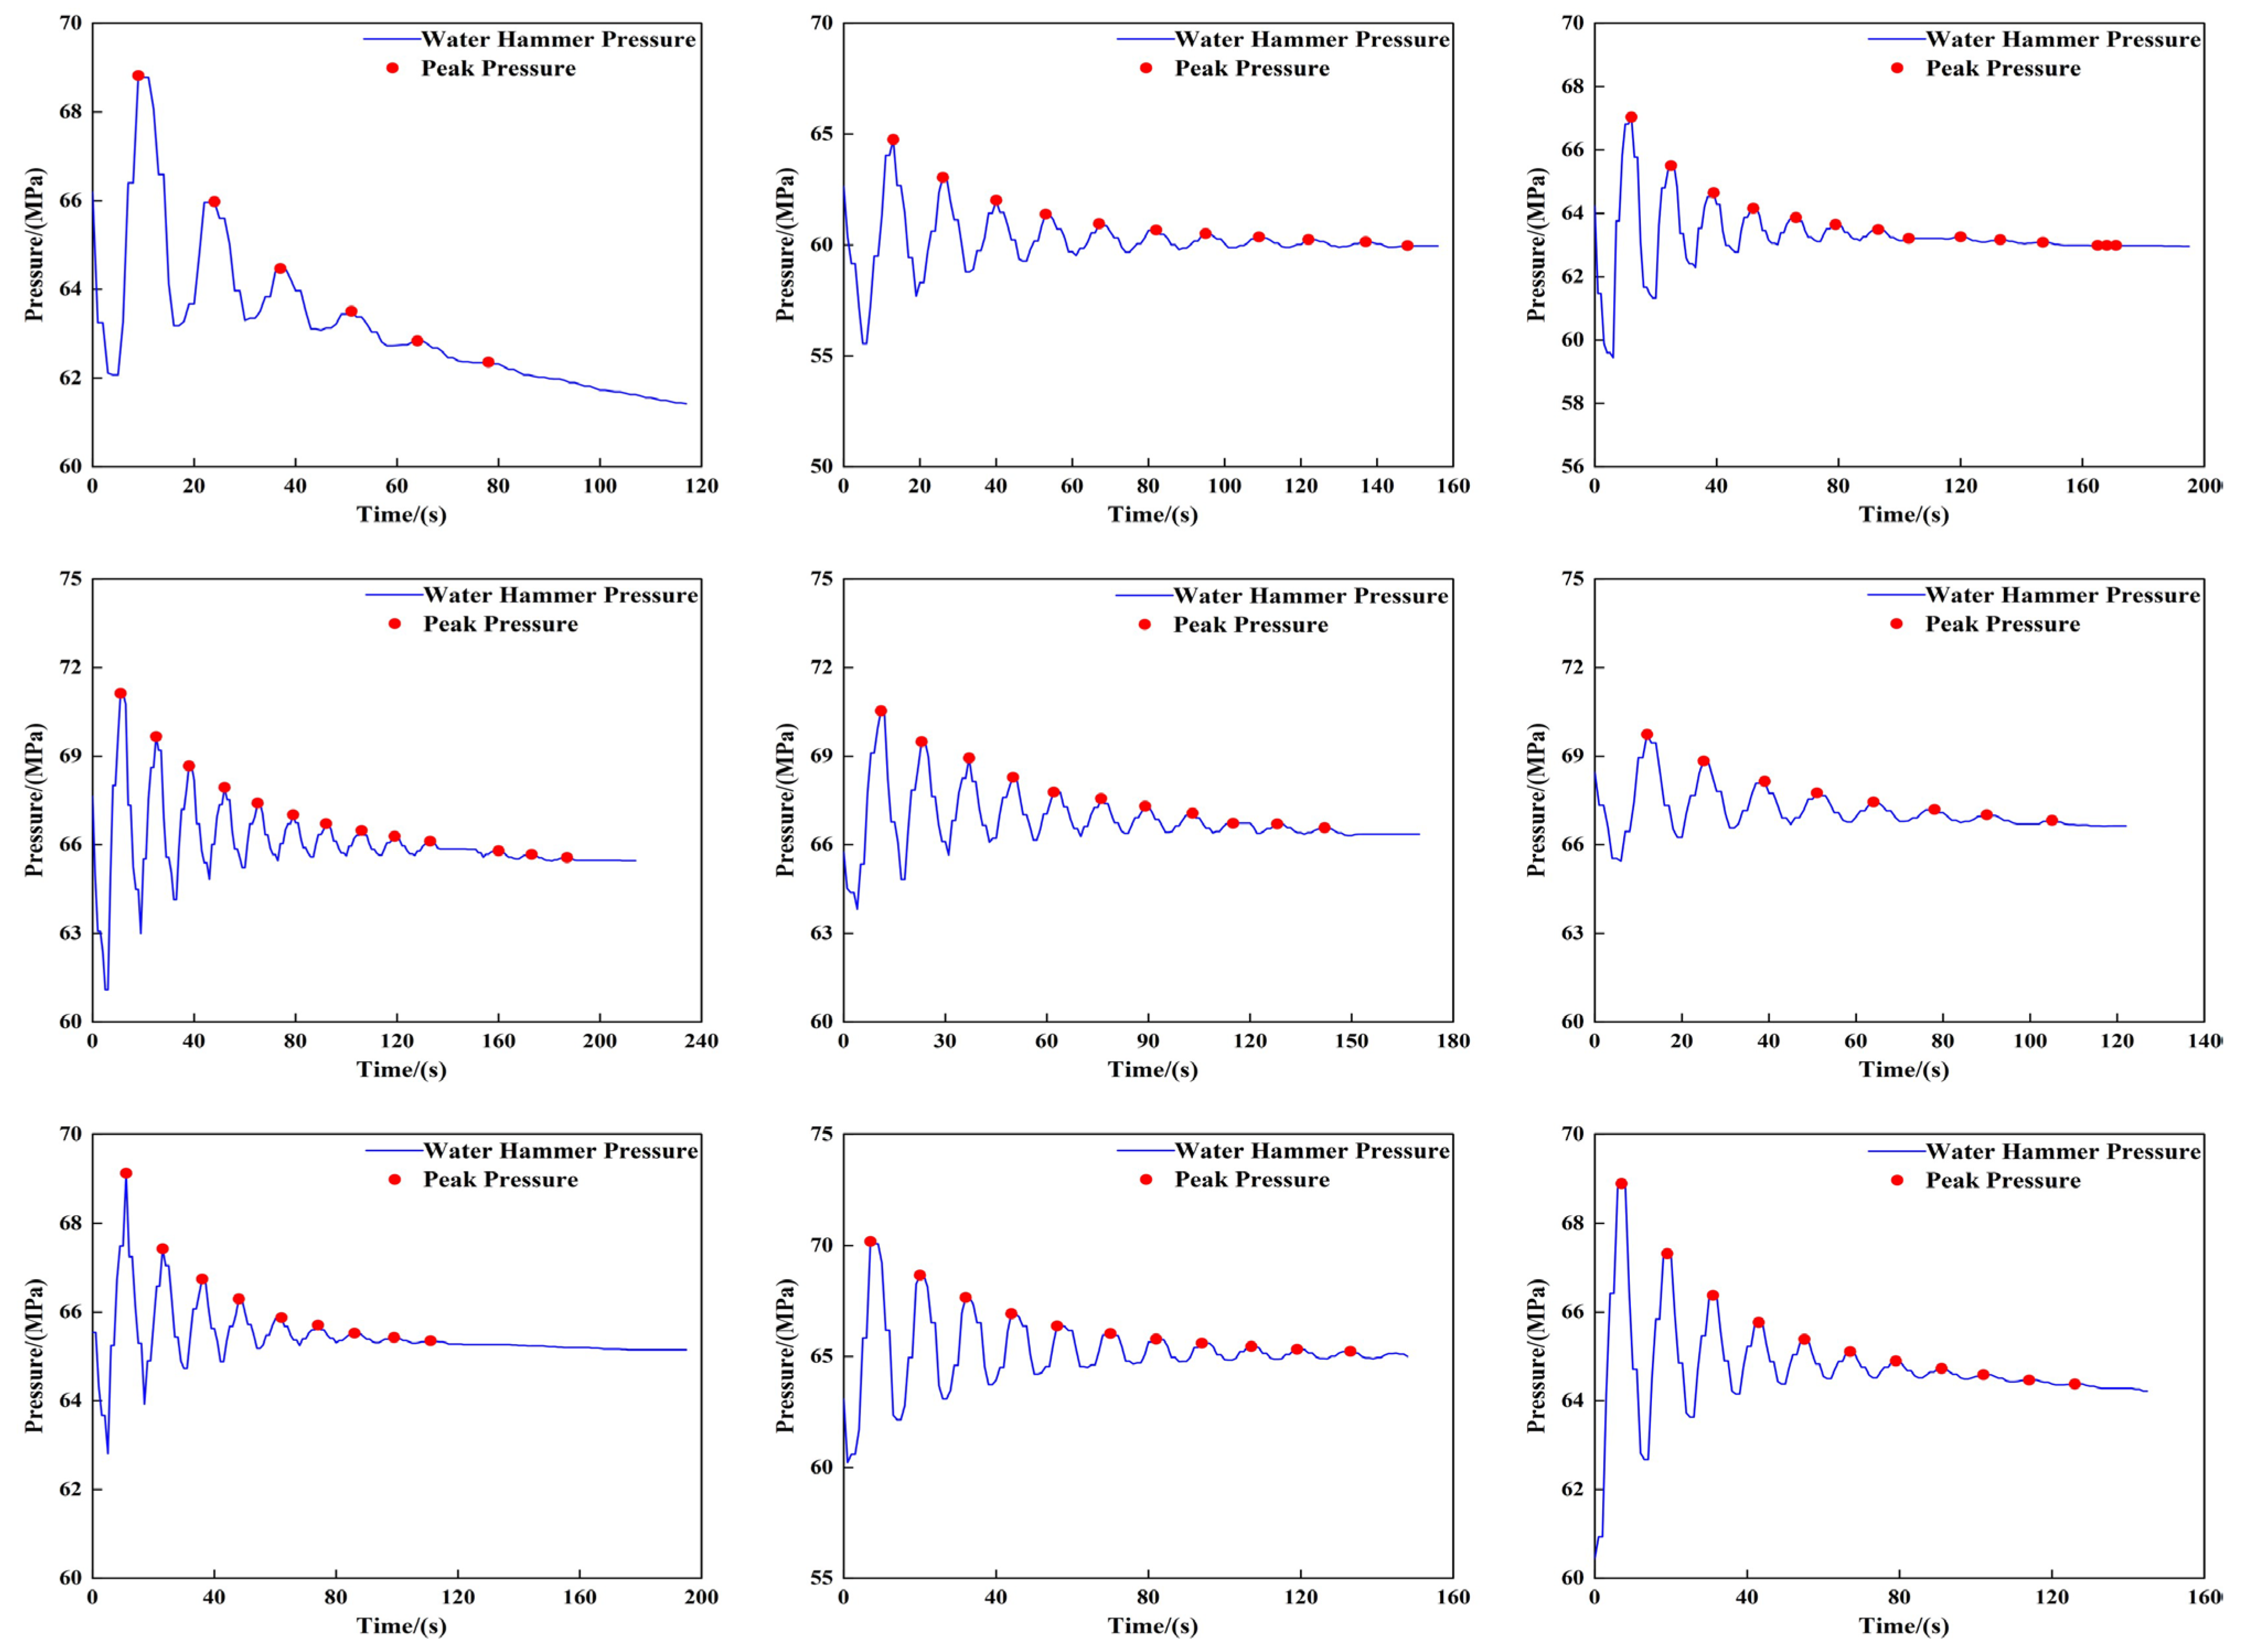
Water hammer pressure arises from the coupling between the wellbore and fractures, with its characteristics closely related to the downhole fracture network. Figure 6 displays representative water hammer pressure data and the peak pressures used to analyze the water hammer decay rate. The quality of the monitored water hammer data for each fracturing stage in this well is good, effectively capturing the pressure fluctuations during the shut-in water hammer effect for each stage.
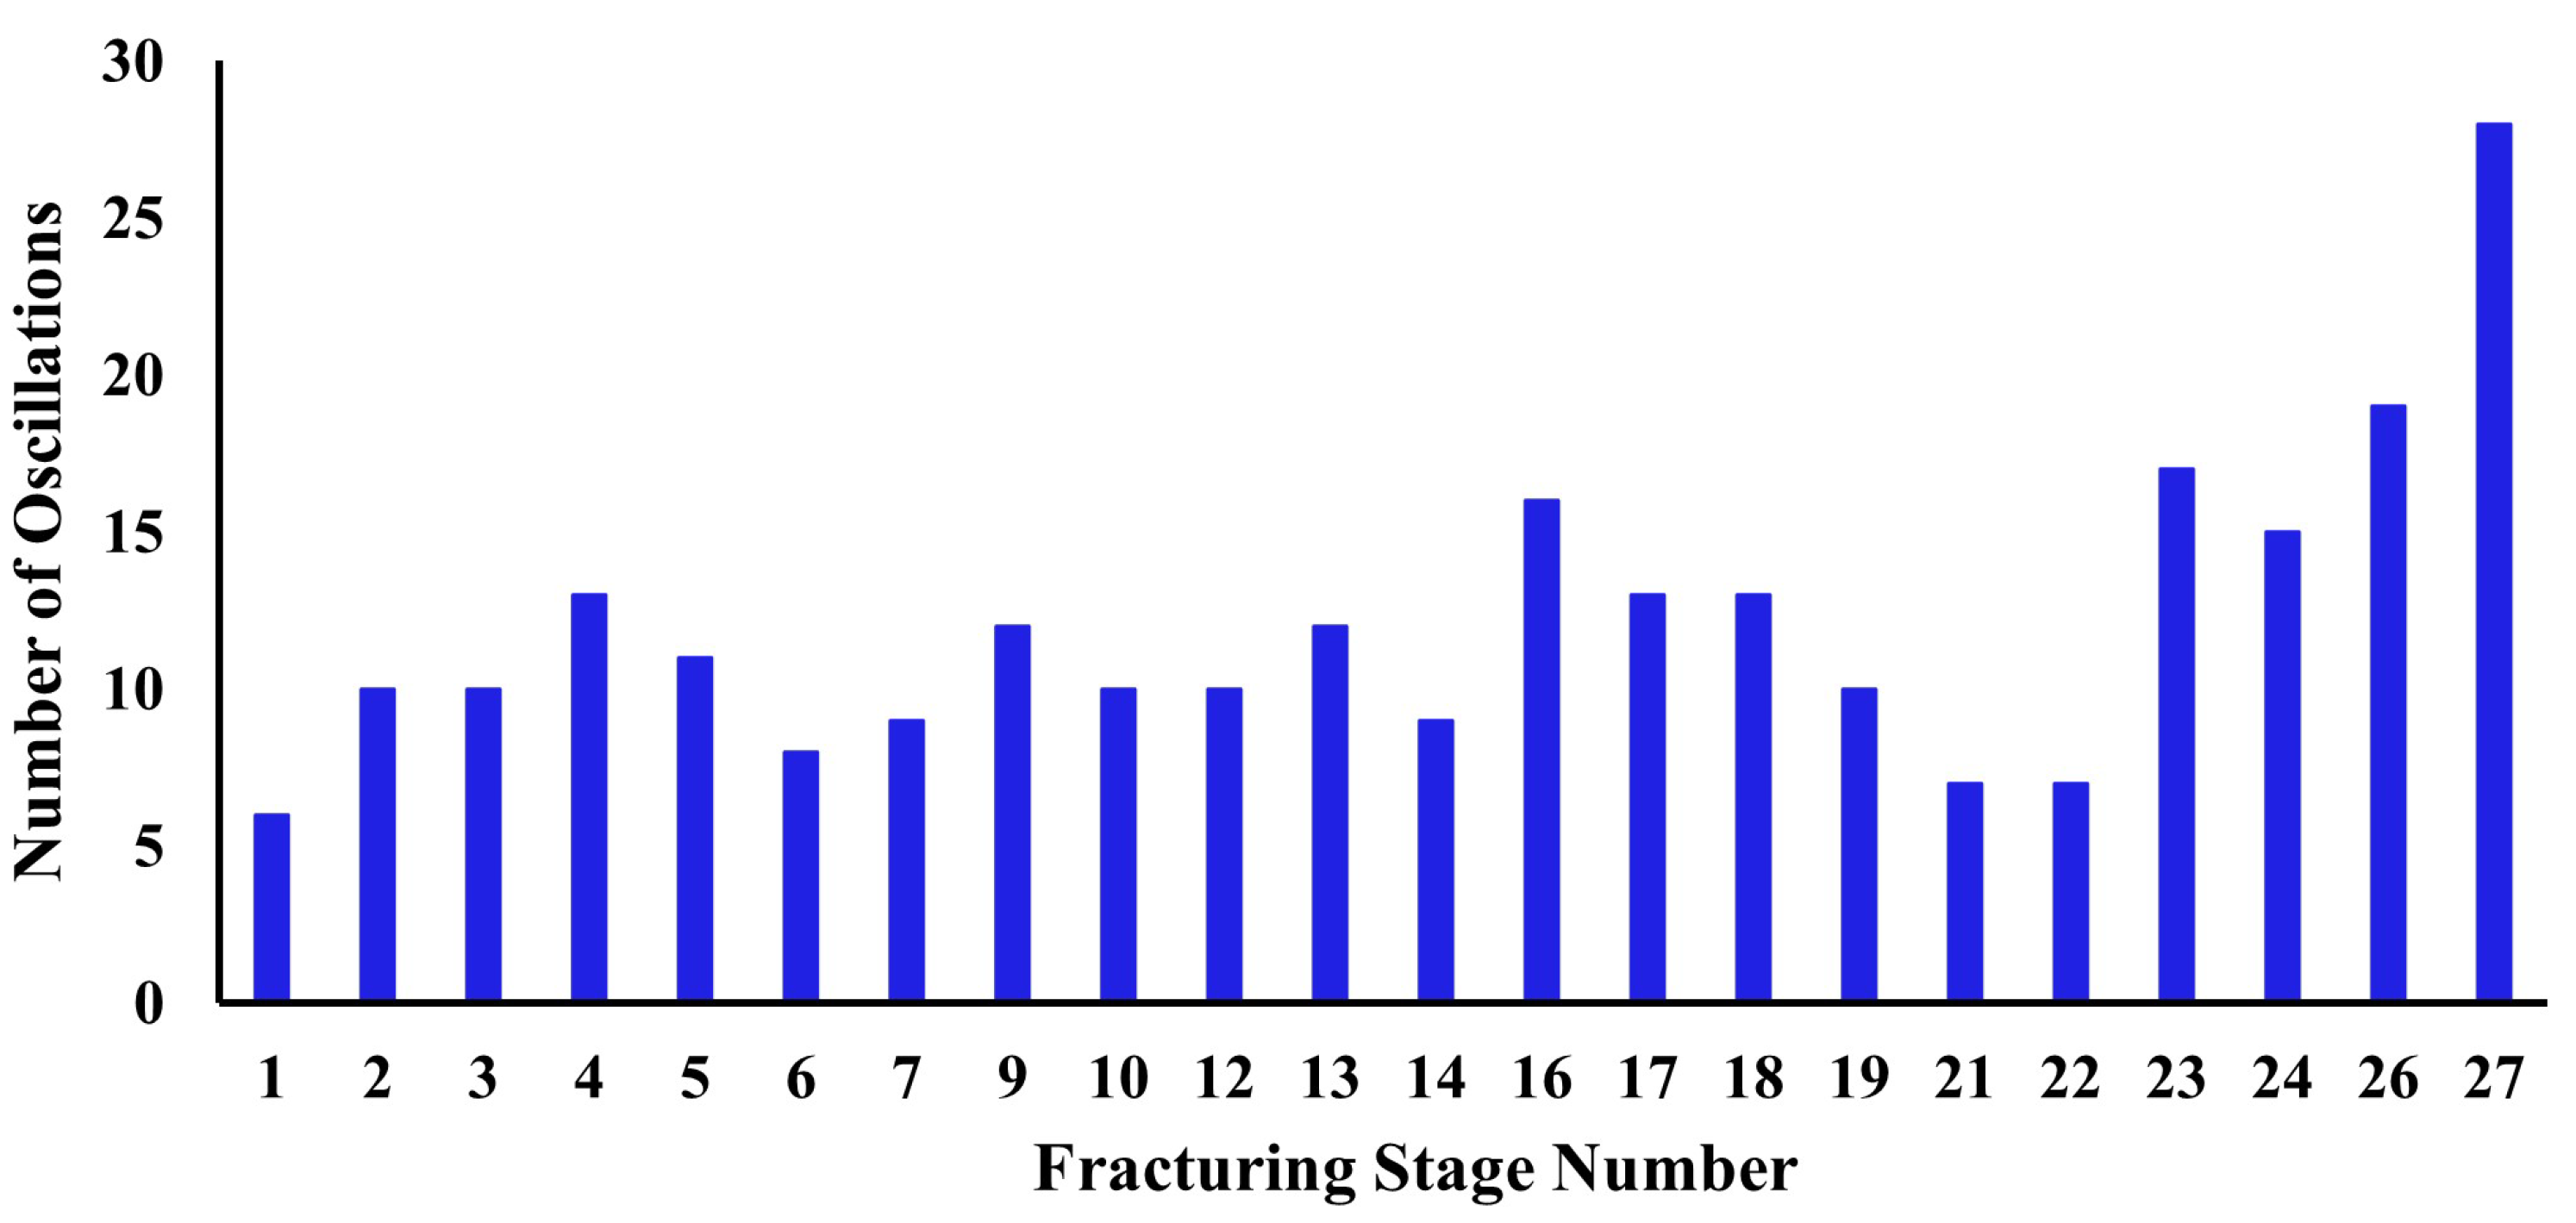
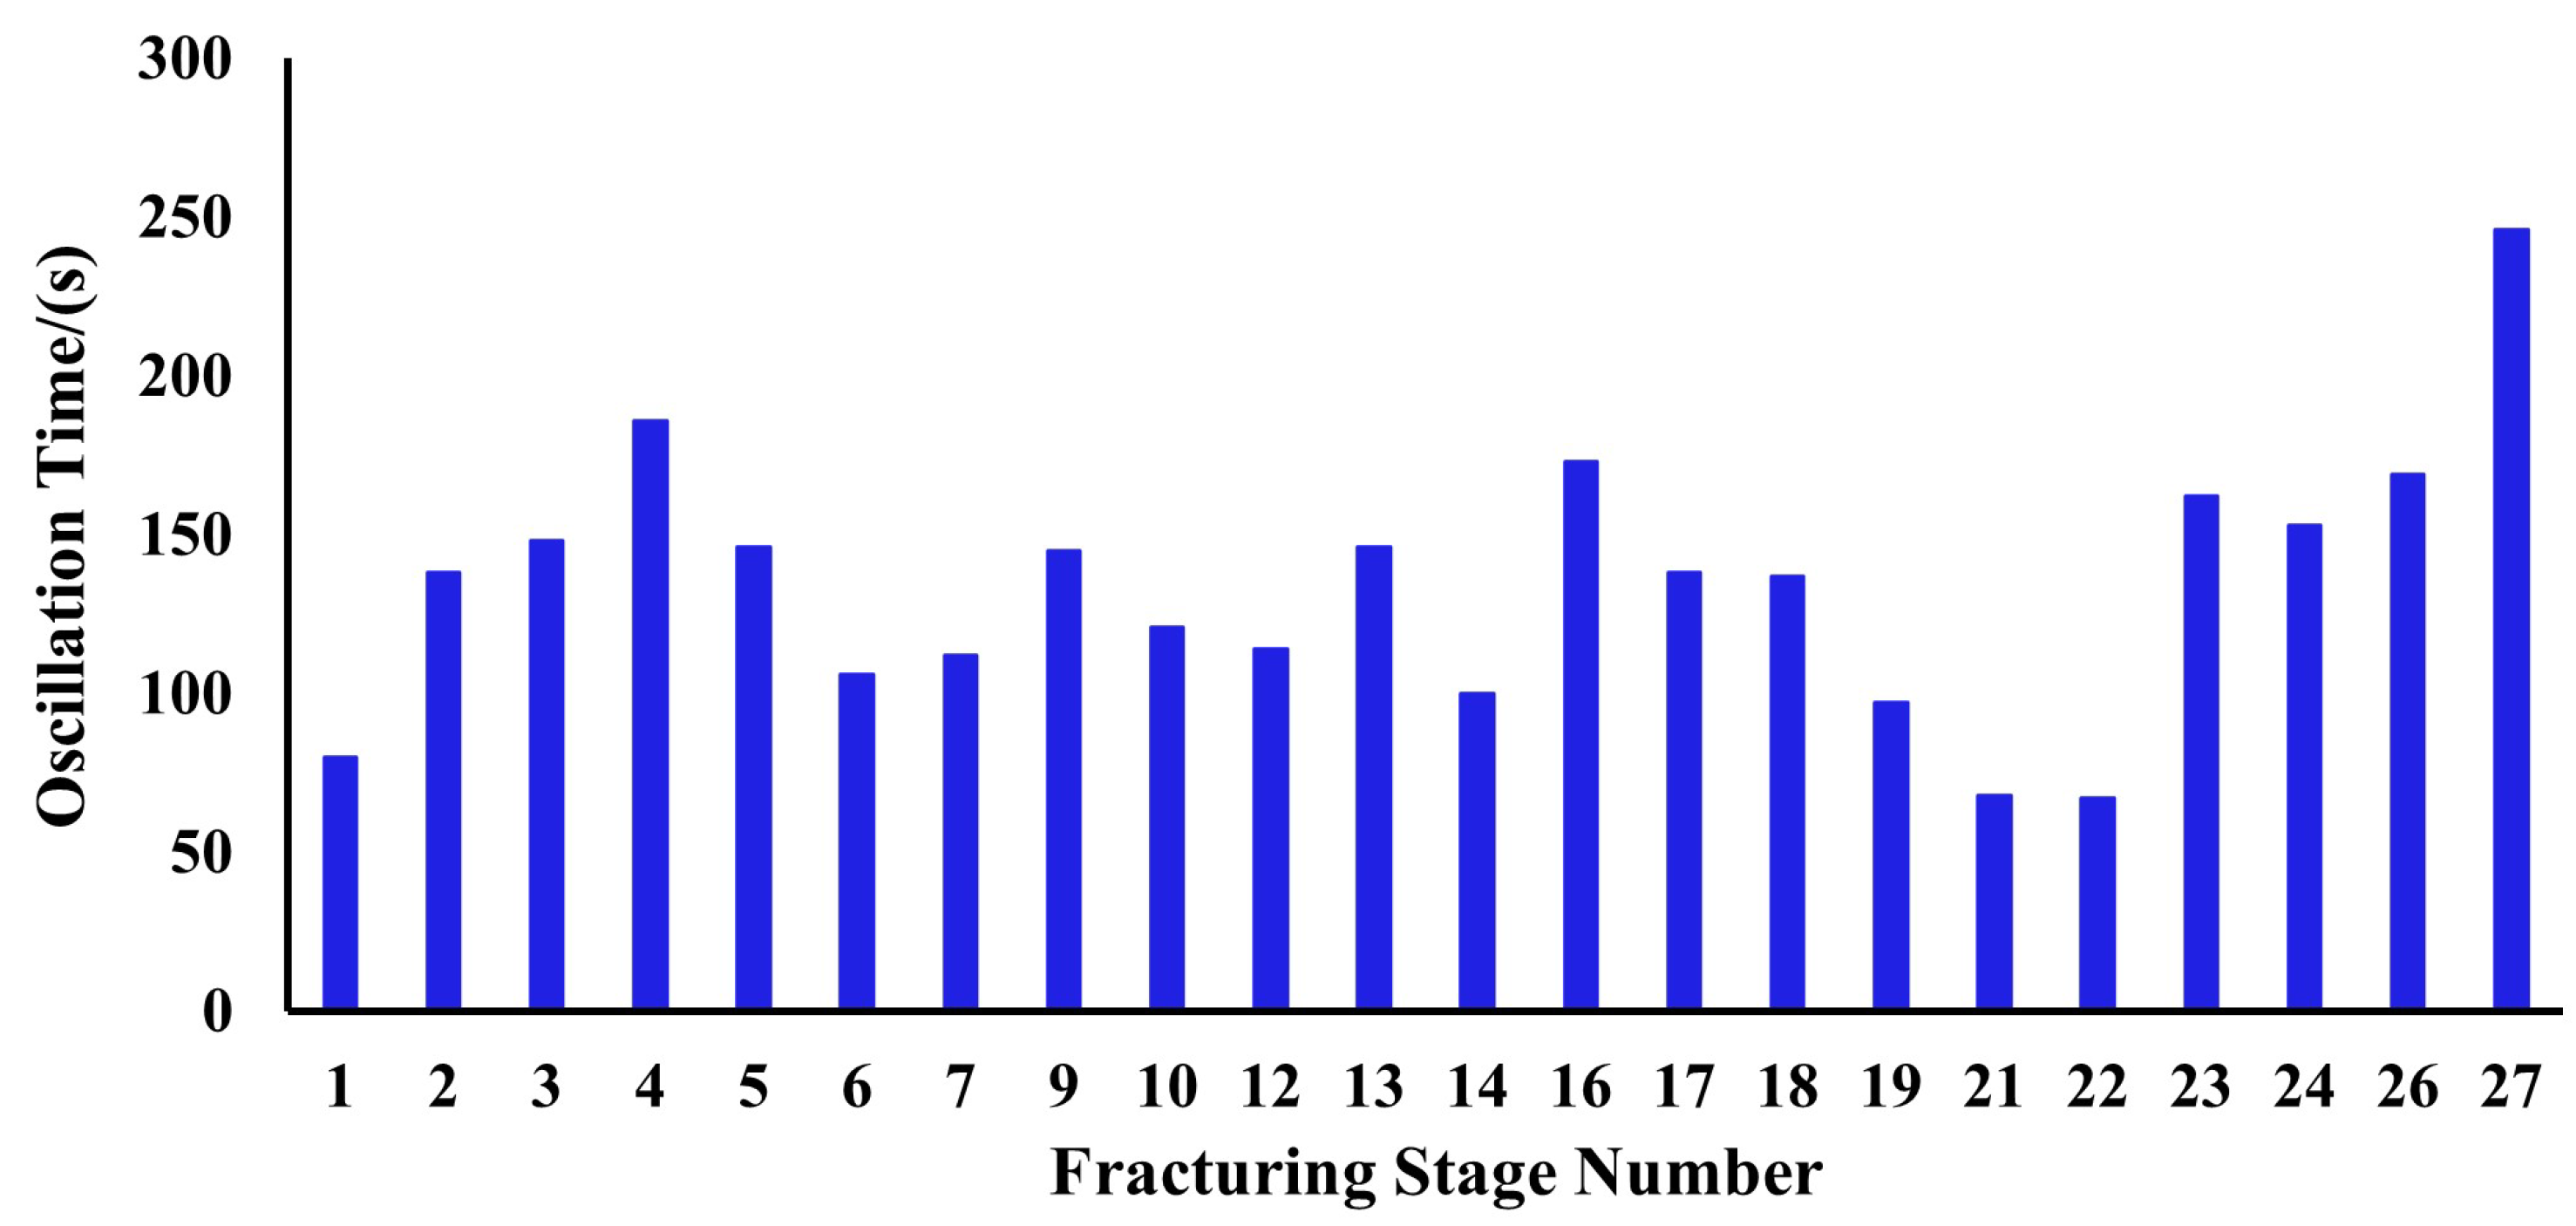
Based on the monitored water hammer pressure data from each fracturing stage, characteristic parameters including initial amplitude, oscillation count, oscillation duration, and decay rate were analyzed for each stage. The water hammer characteristic parameters for the stages are presented in Figure 7, Figure 8, Figure 9 and Figure 10. Figure 7 summarizes the initial amplitude per stage, ranging from 0.74 MPa to 5.02 MPa, with an average of 3.08 MPa. Figure 8 shows the oscillation count per stage, ranging from 6 to 28 oscillations, with an average of 12 oscillations. Figure 9 presents the oscillation duration per stage, ranging from 67 s to 246 s, with an average of 134.18 s. Figure 10 shows the water hammer decay rate for different stages, obtained by fitting the water hammer pressure peak data using the calculation method proposed by Luo et al. [21]. Analysis indicates that the water hammer decay rate for this well ranges from 0.0139 to 0.0412, with an average of 0.0262.

4.2. Correlation Analysis of Water Hammer Characteristics and Fracture Parameters

During hydraulic fracturing shut-in, water hammer pressure originates from sudden flow rate changes and is generated through the coupling between the wellbore and downhole fractures. This pressure contains critical downhole fracture information. The characteristic parameters of water hammer pressure are closely related to downhole fracture geometry. Thoroughly analyzing the correlation between water hammer characteristics and induced fracture parameters is essential for rapidly evaluating fracturing effectiveness, developing and optimizing fracturing designs, and enhancing fracturing outcomes. Therefore, based on fracture geometric parameters and water hammer characteristic parameters obtained from analyzing field-measured water hammer pressure data, correlations between various water hammer characteristics and fracture geometry were investigated.
(1)
Initial Amplitude
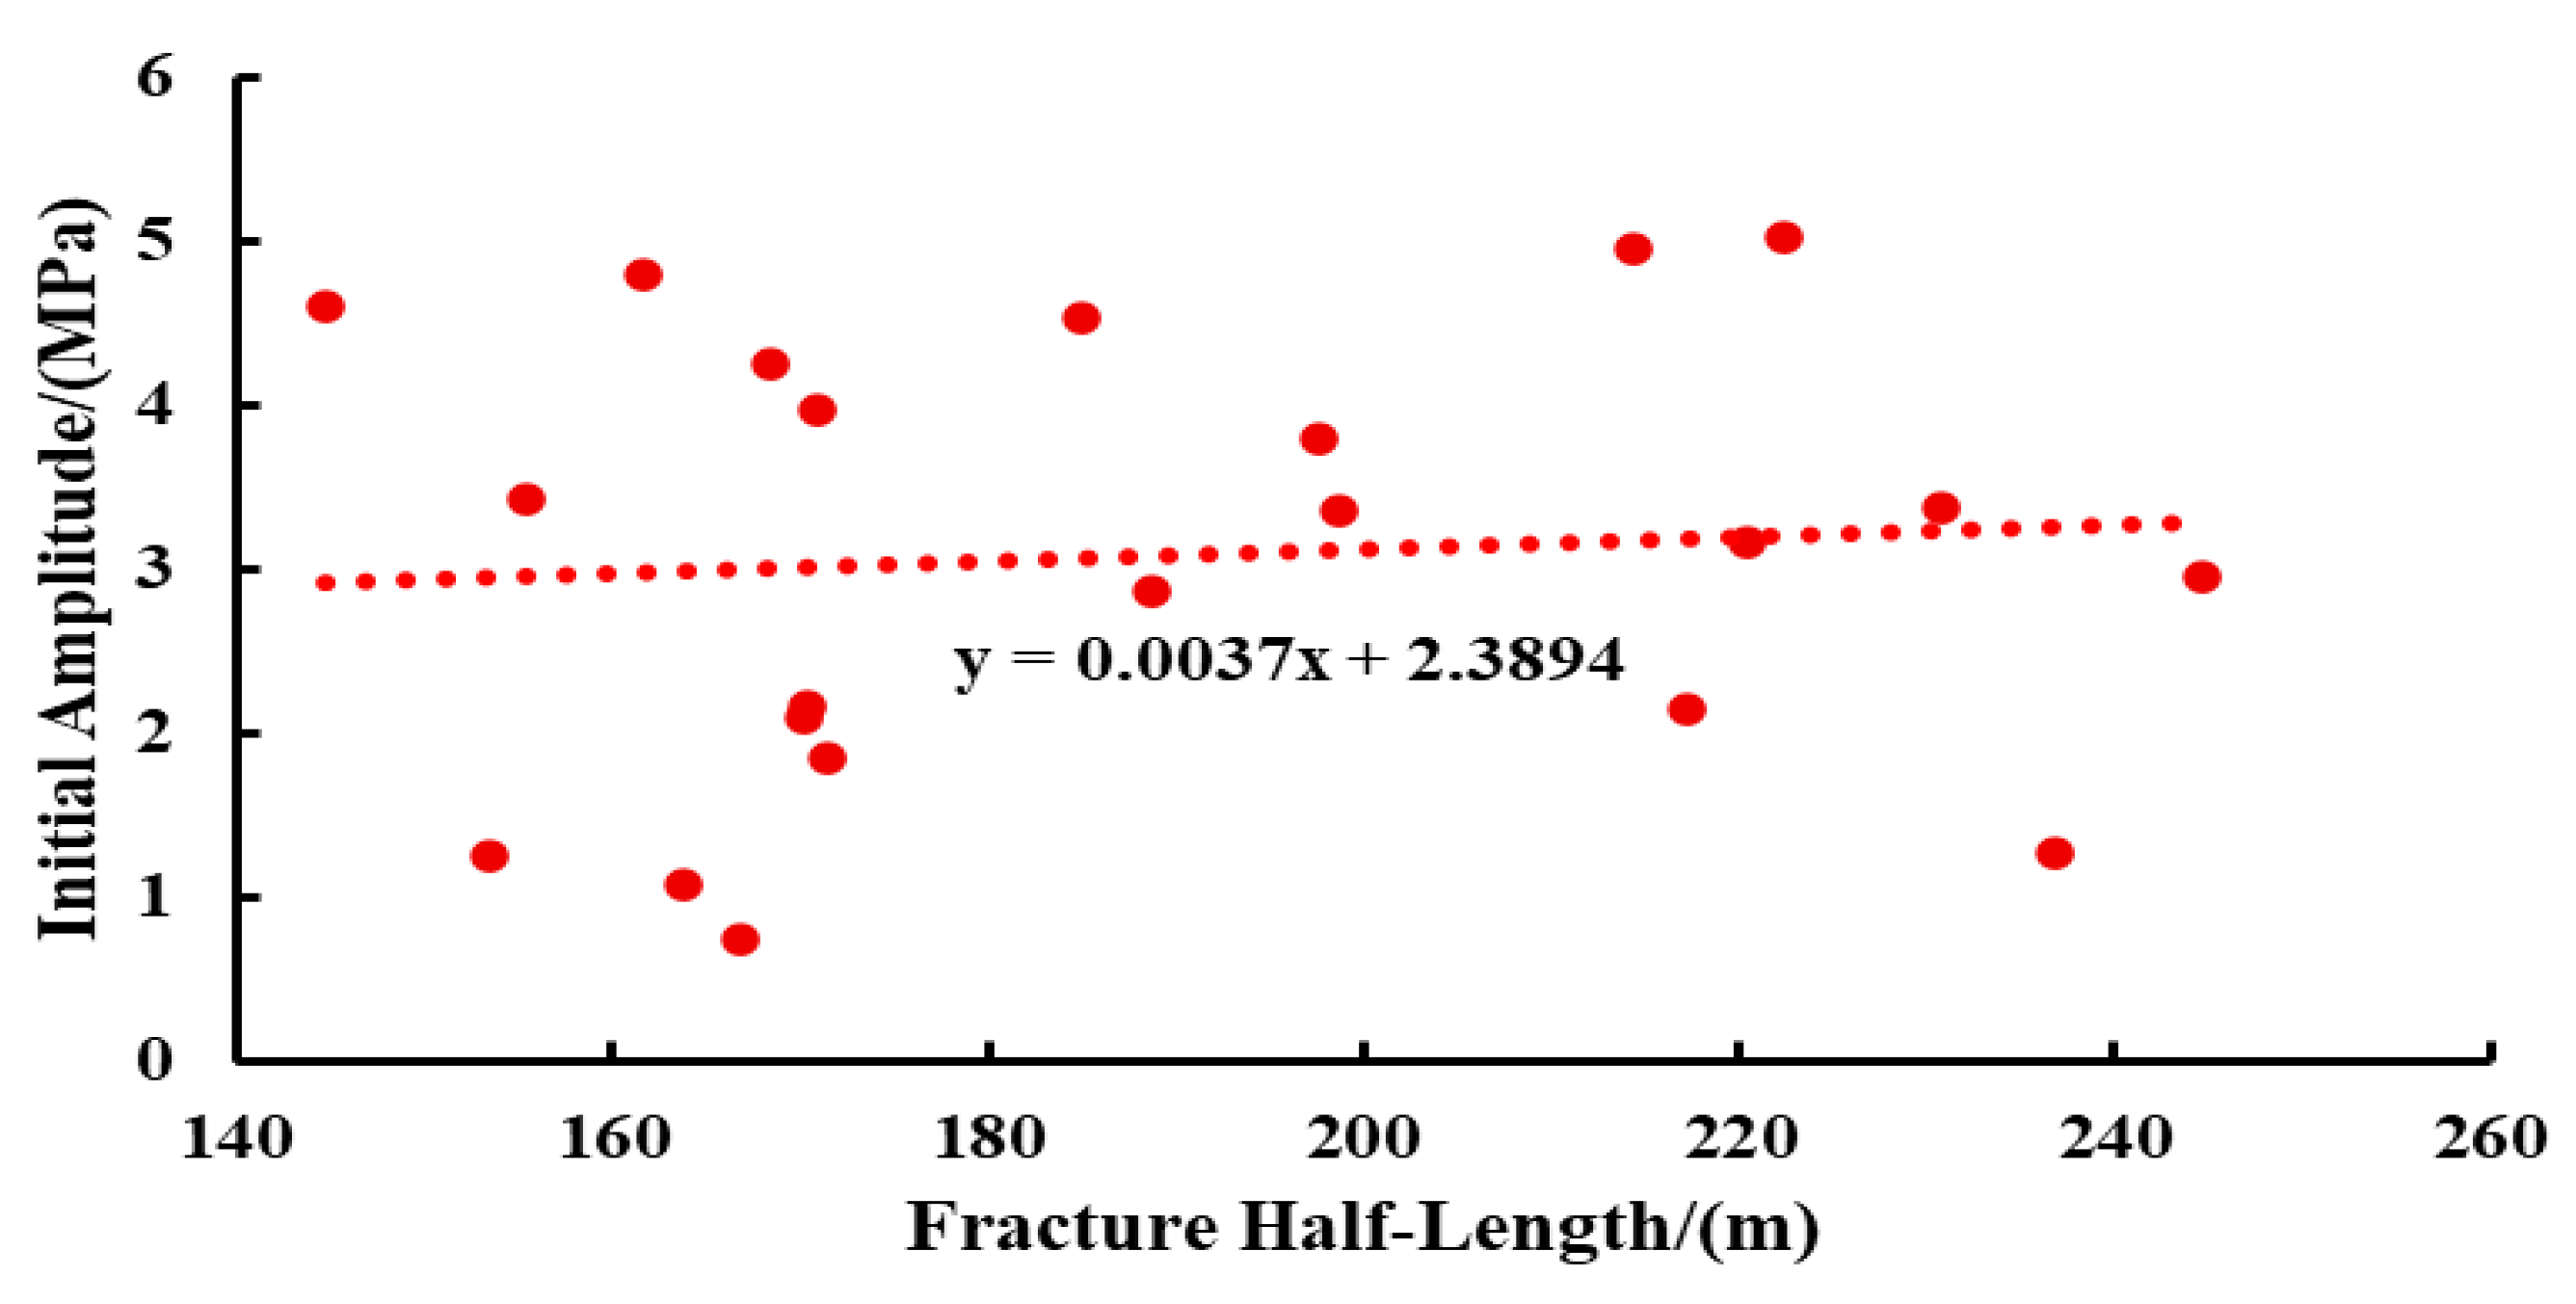
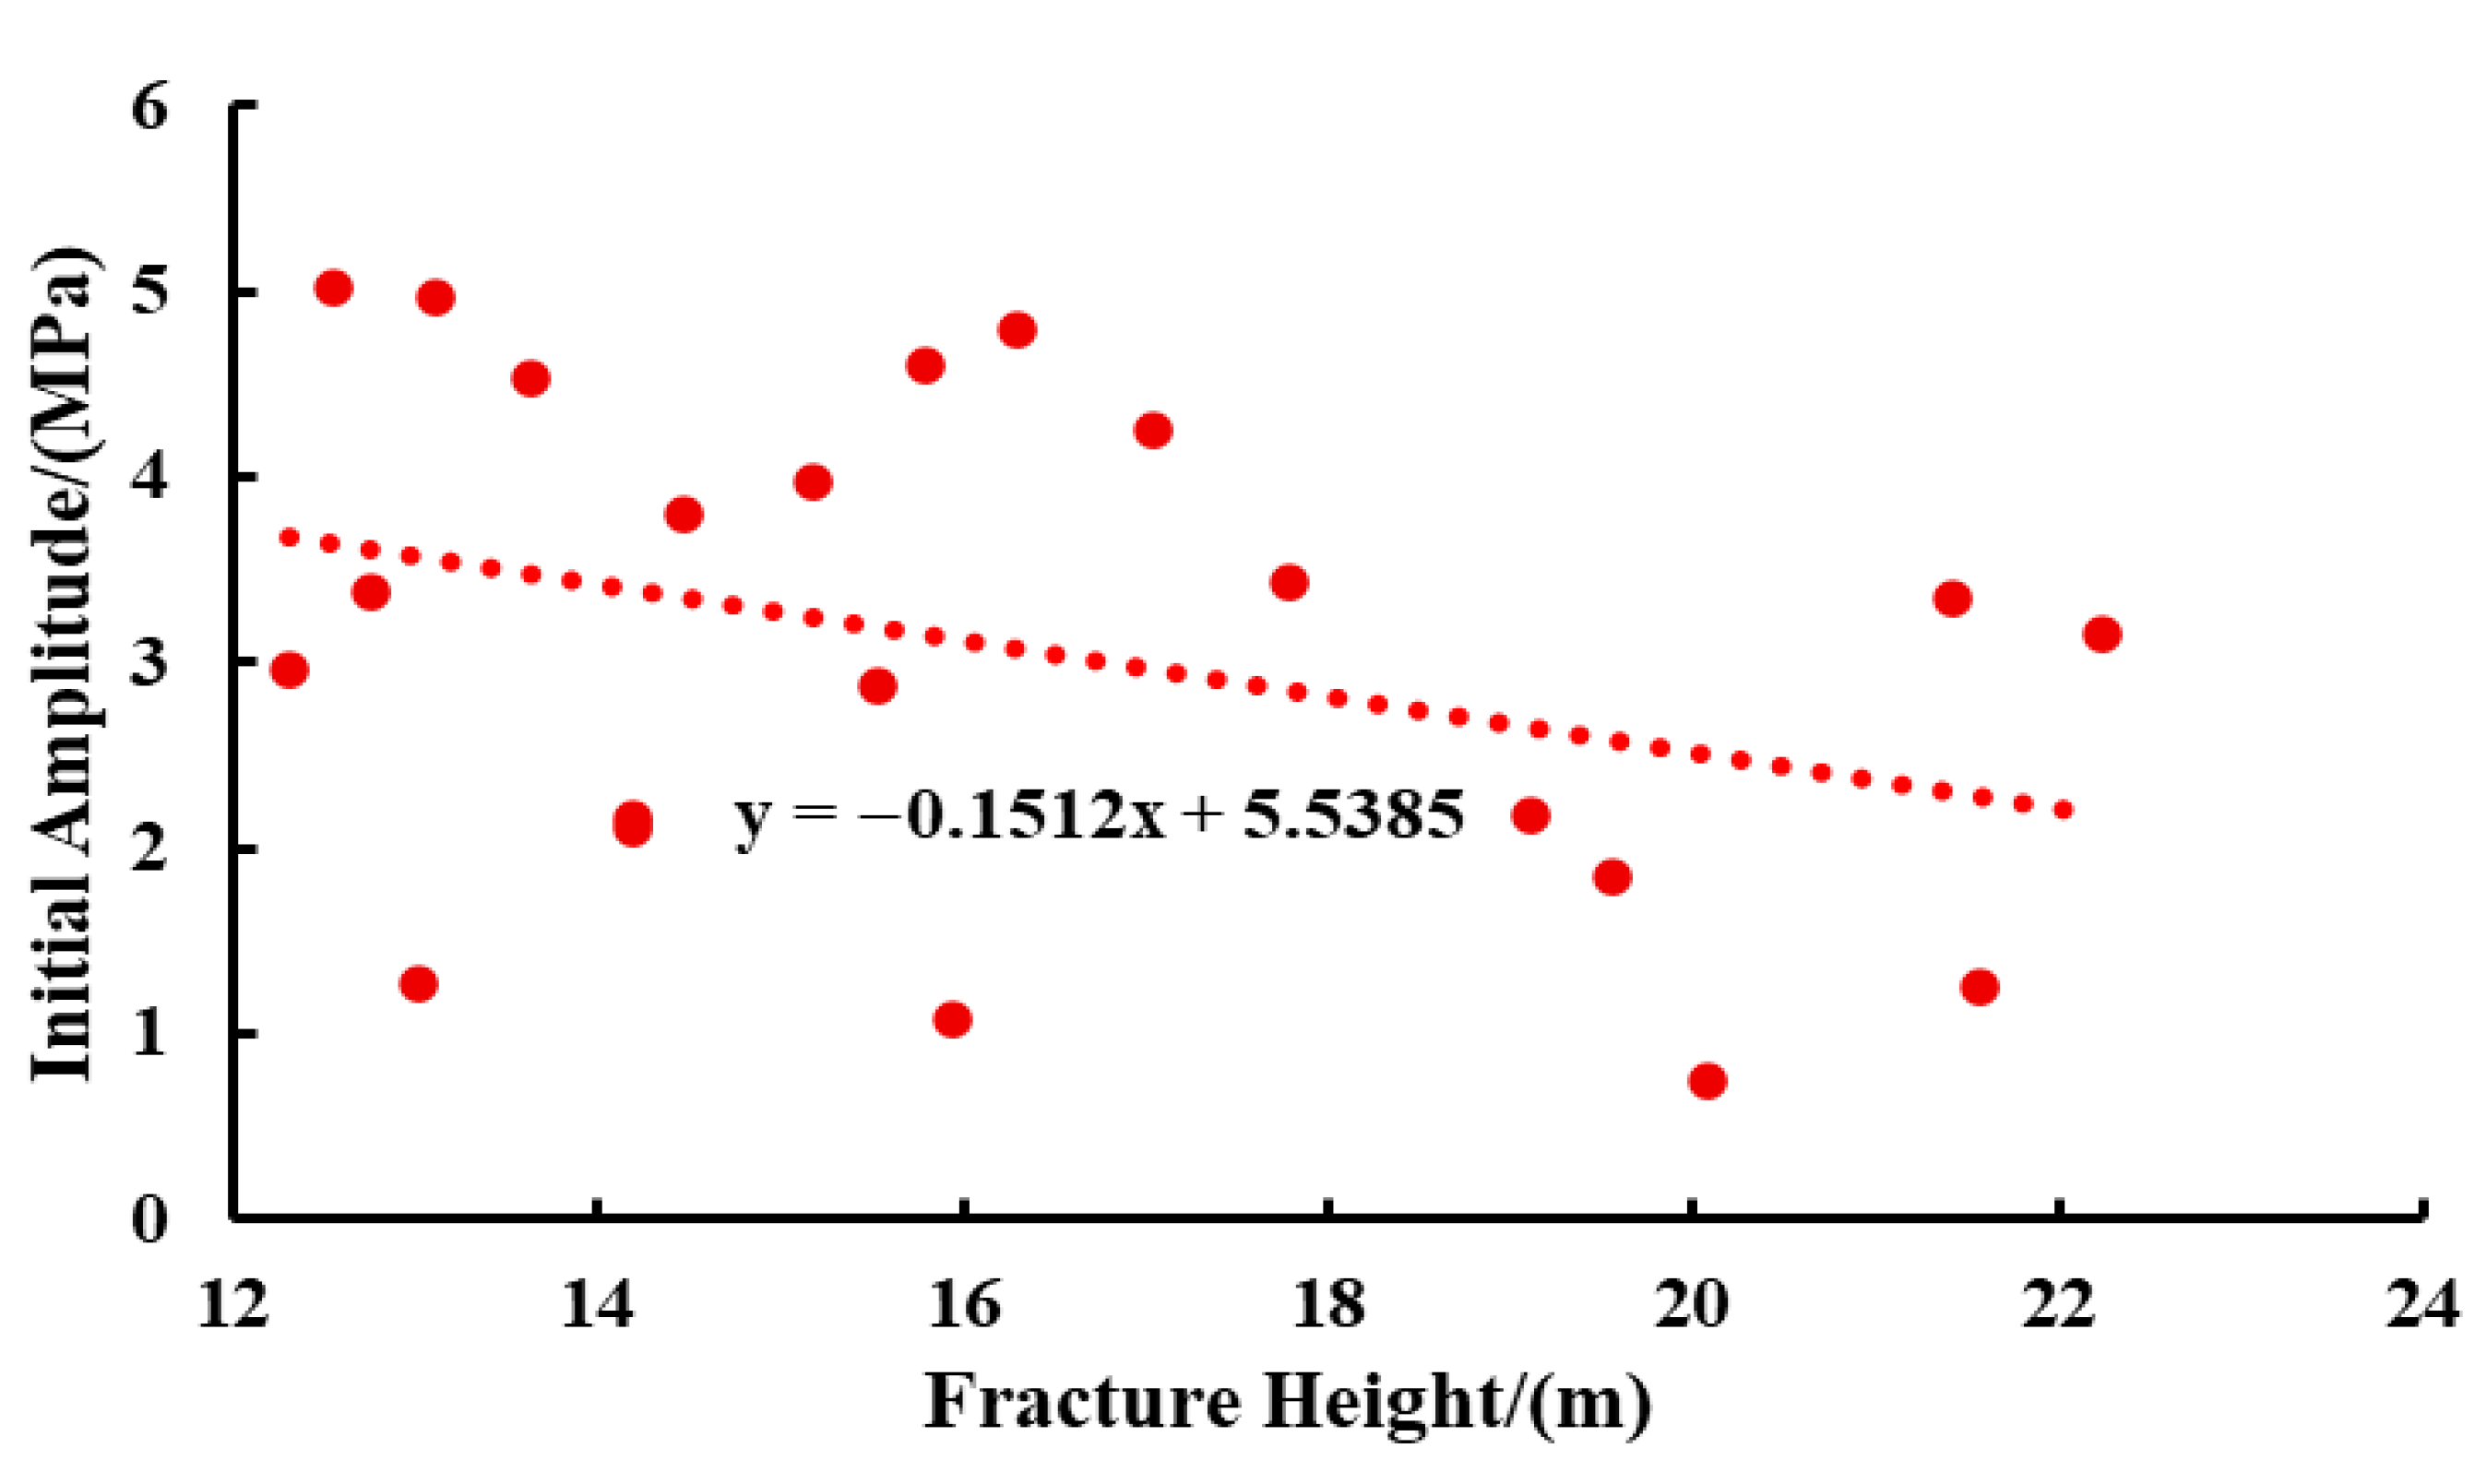
Figure 11 and Figure 12 illustrate the correlations between the initial amplitude of water hammer pressure and fracture half-length/height. Analysis of these figures reveals higher initial amplitudes under conditions of greater fracture half-length and smaller fracture height. This phenomenon occurs due to increased reflection and superposition of water hammer pressure waves in fractures with extended half-lengths and reduced heights. Furthermore, smaller fracture heights correspond to diminished cross-sectional areas, resulting in elevated fluid flow velocities. The intensified fluid-wall interactions at higher velocities excite higher-energy pressure waves, thereby generating increased initial amplitudes.
(2)
Number of Oscillations
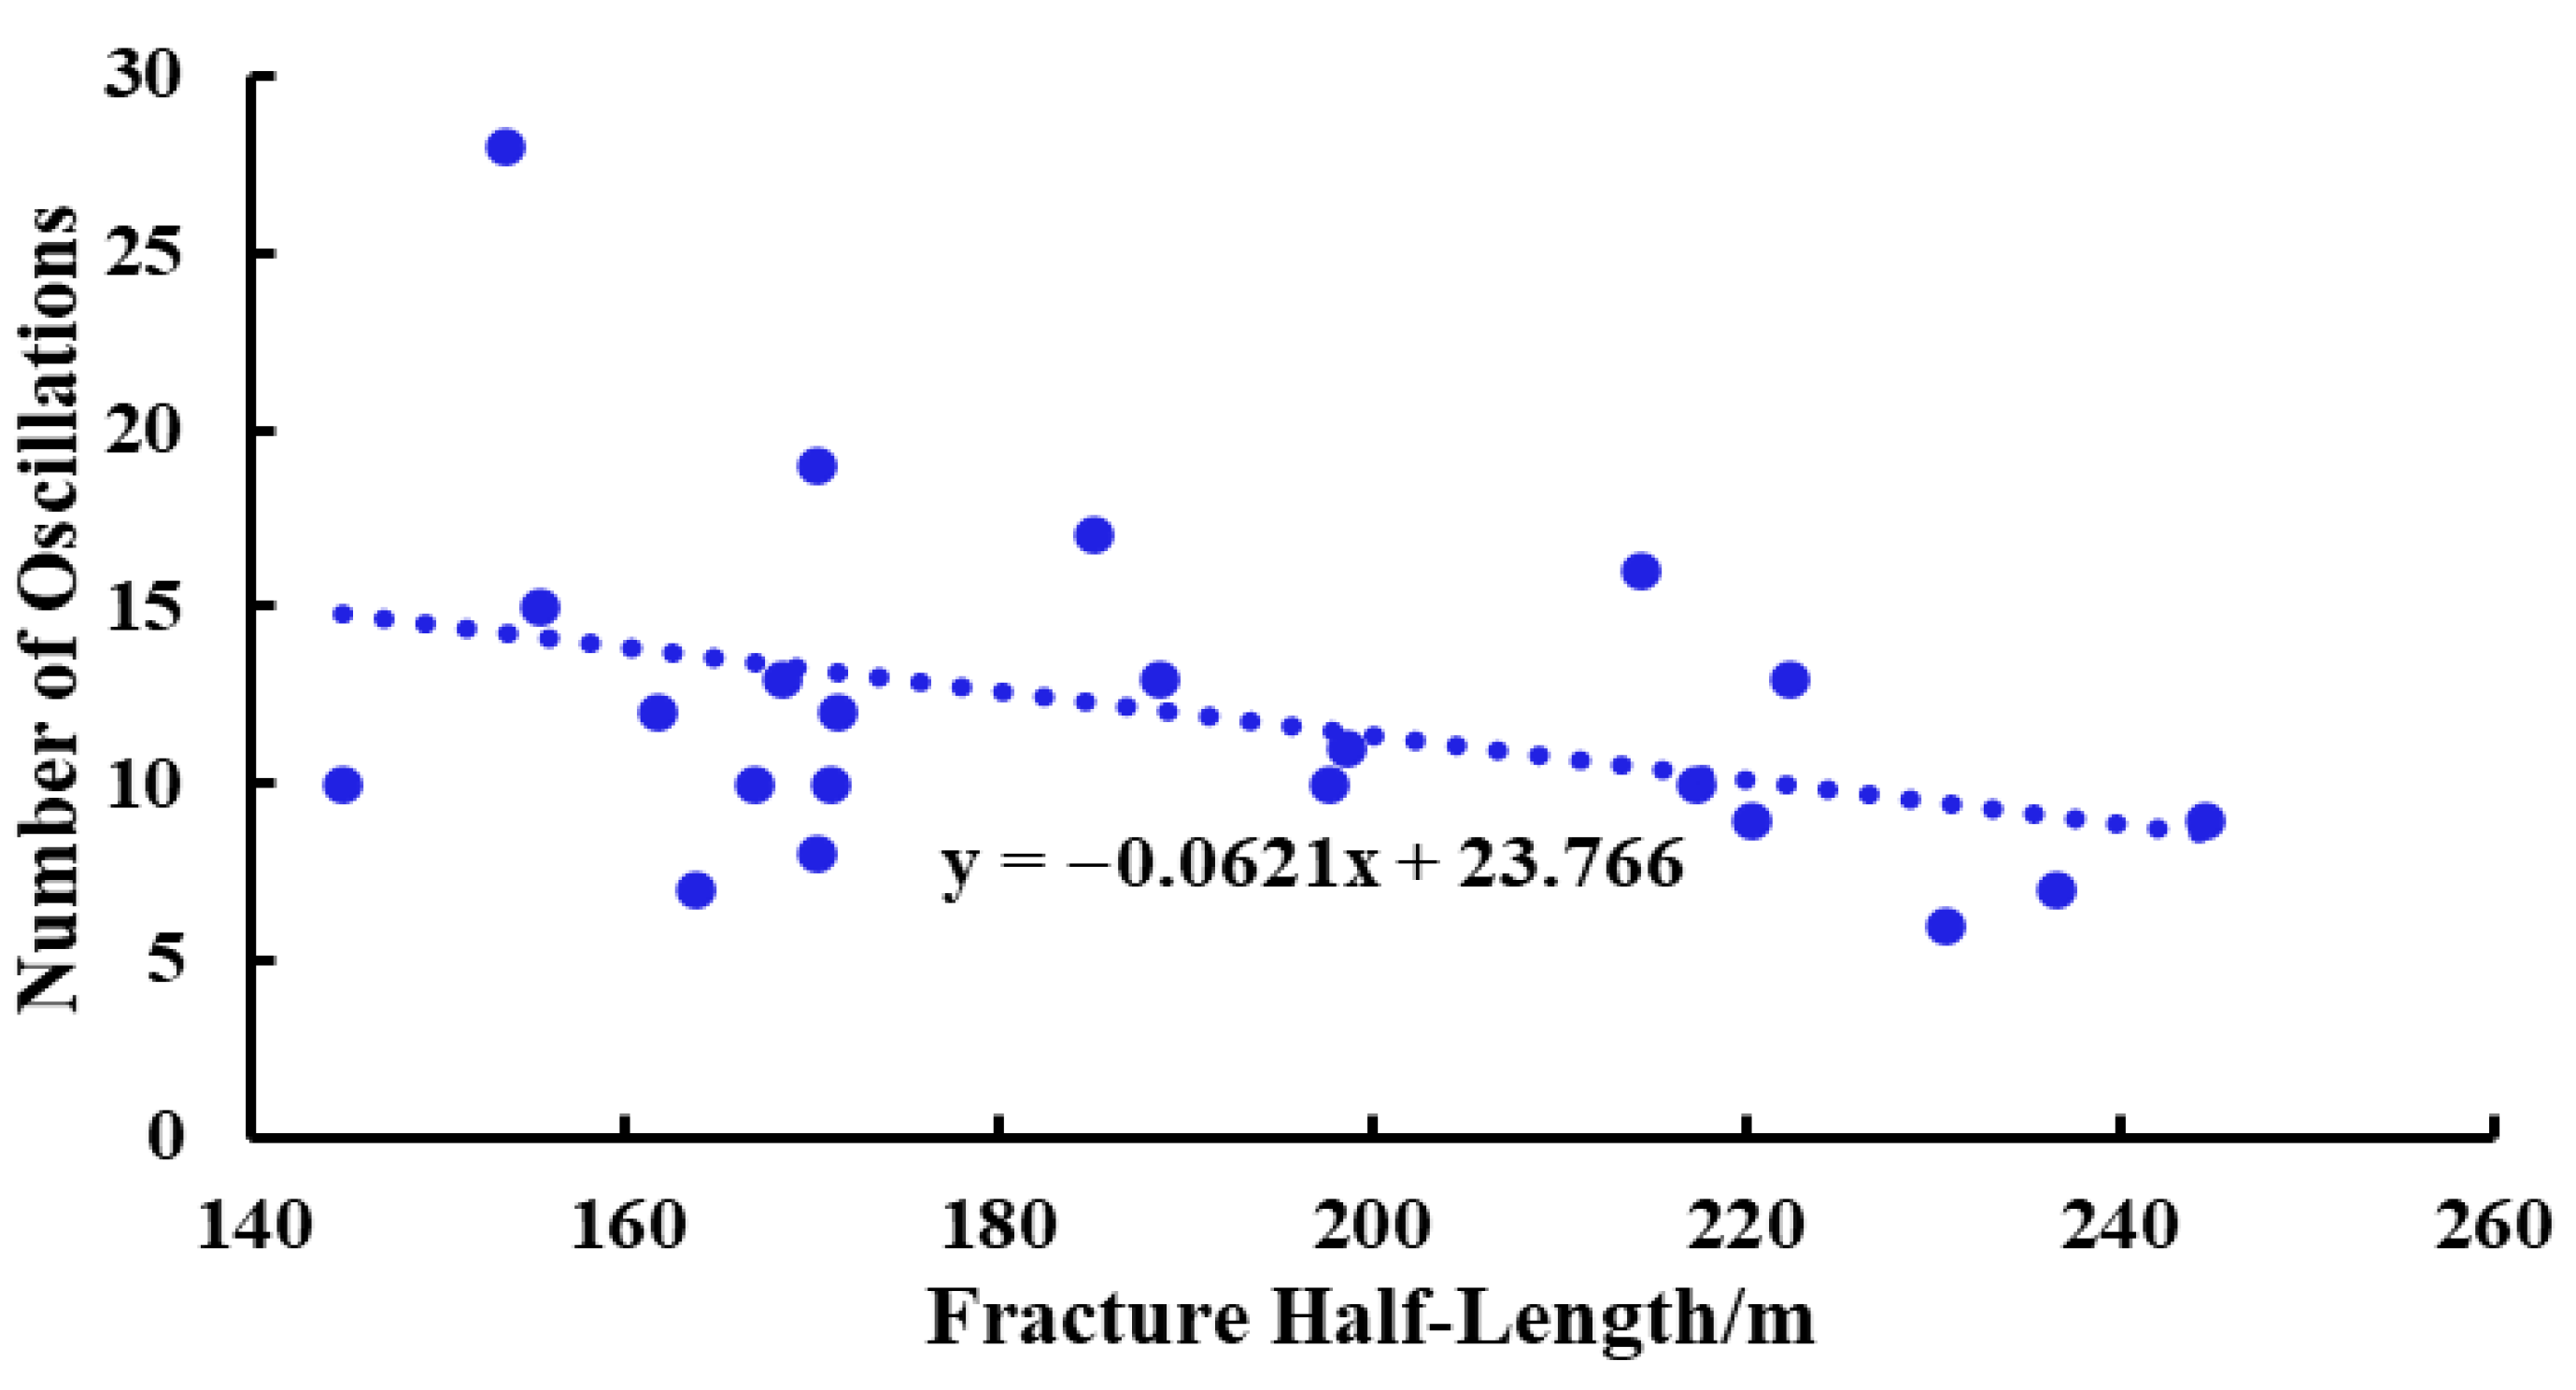
Figure 13 and Figure 14 illustrate the correlations between water hammer oscillation count and fracture half-length/height. These figures indicate fewer water hammer oscillations under conditions of greater fracture half-length and smaller fracture height. Extended fracture half-lengths create longer pressure wave propagation paths, resulting in increased resistance that accelerates pressure wave attenuation. Concurrently, reduced fracture heights cause greater energy dissipation during fracture fluid injection and discharge. This rapid energy loss diminishes pressure wave intensity, collectively reducing oscillation counts.
(3)
Oscillation Duration
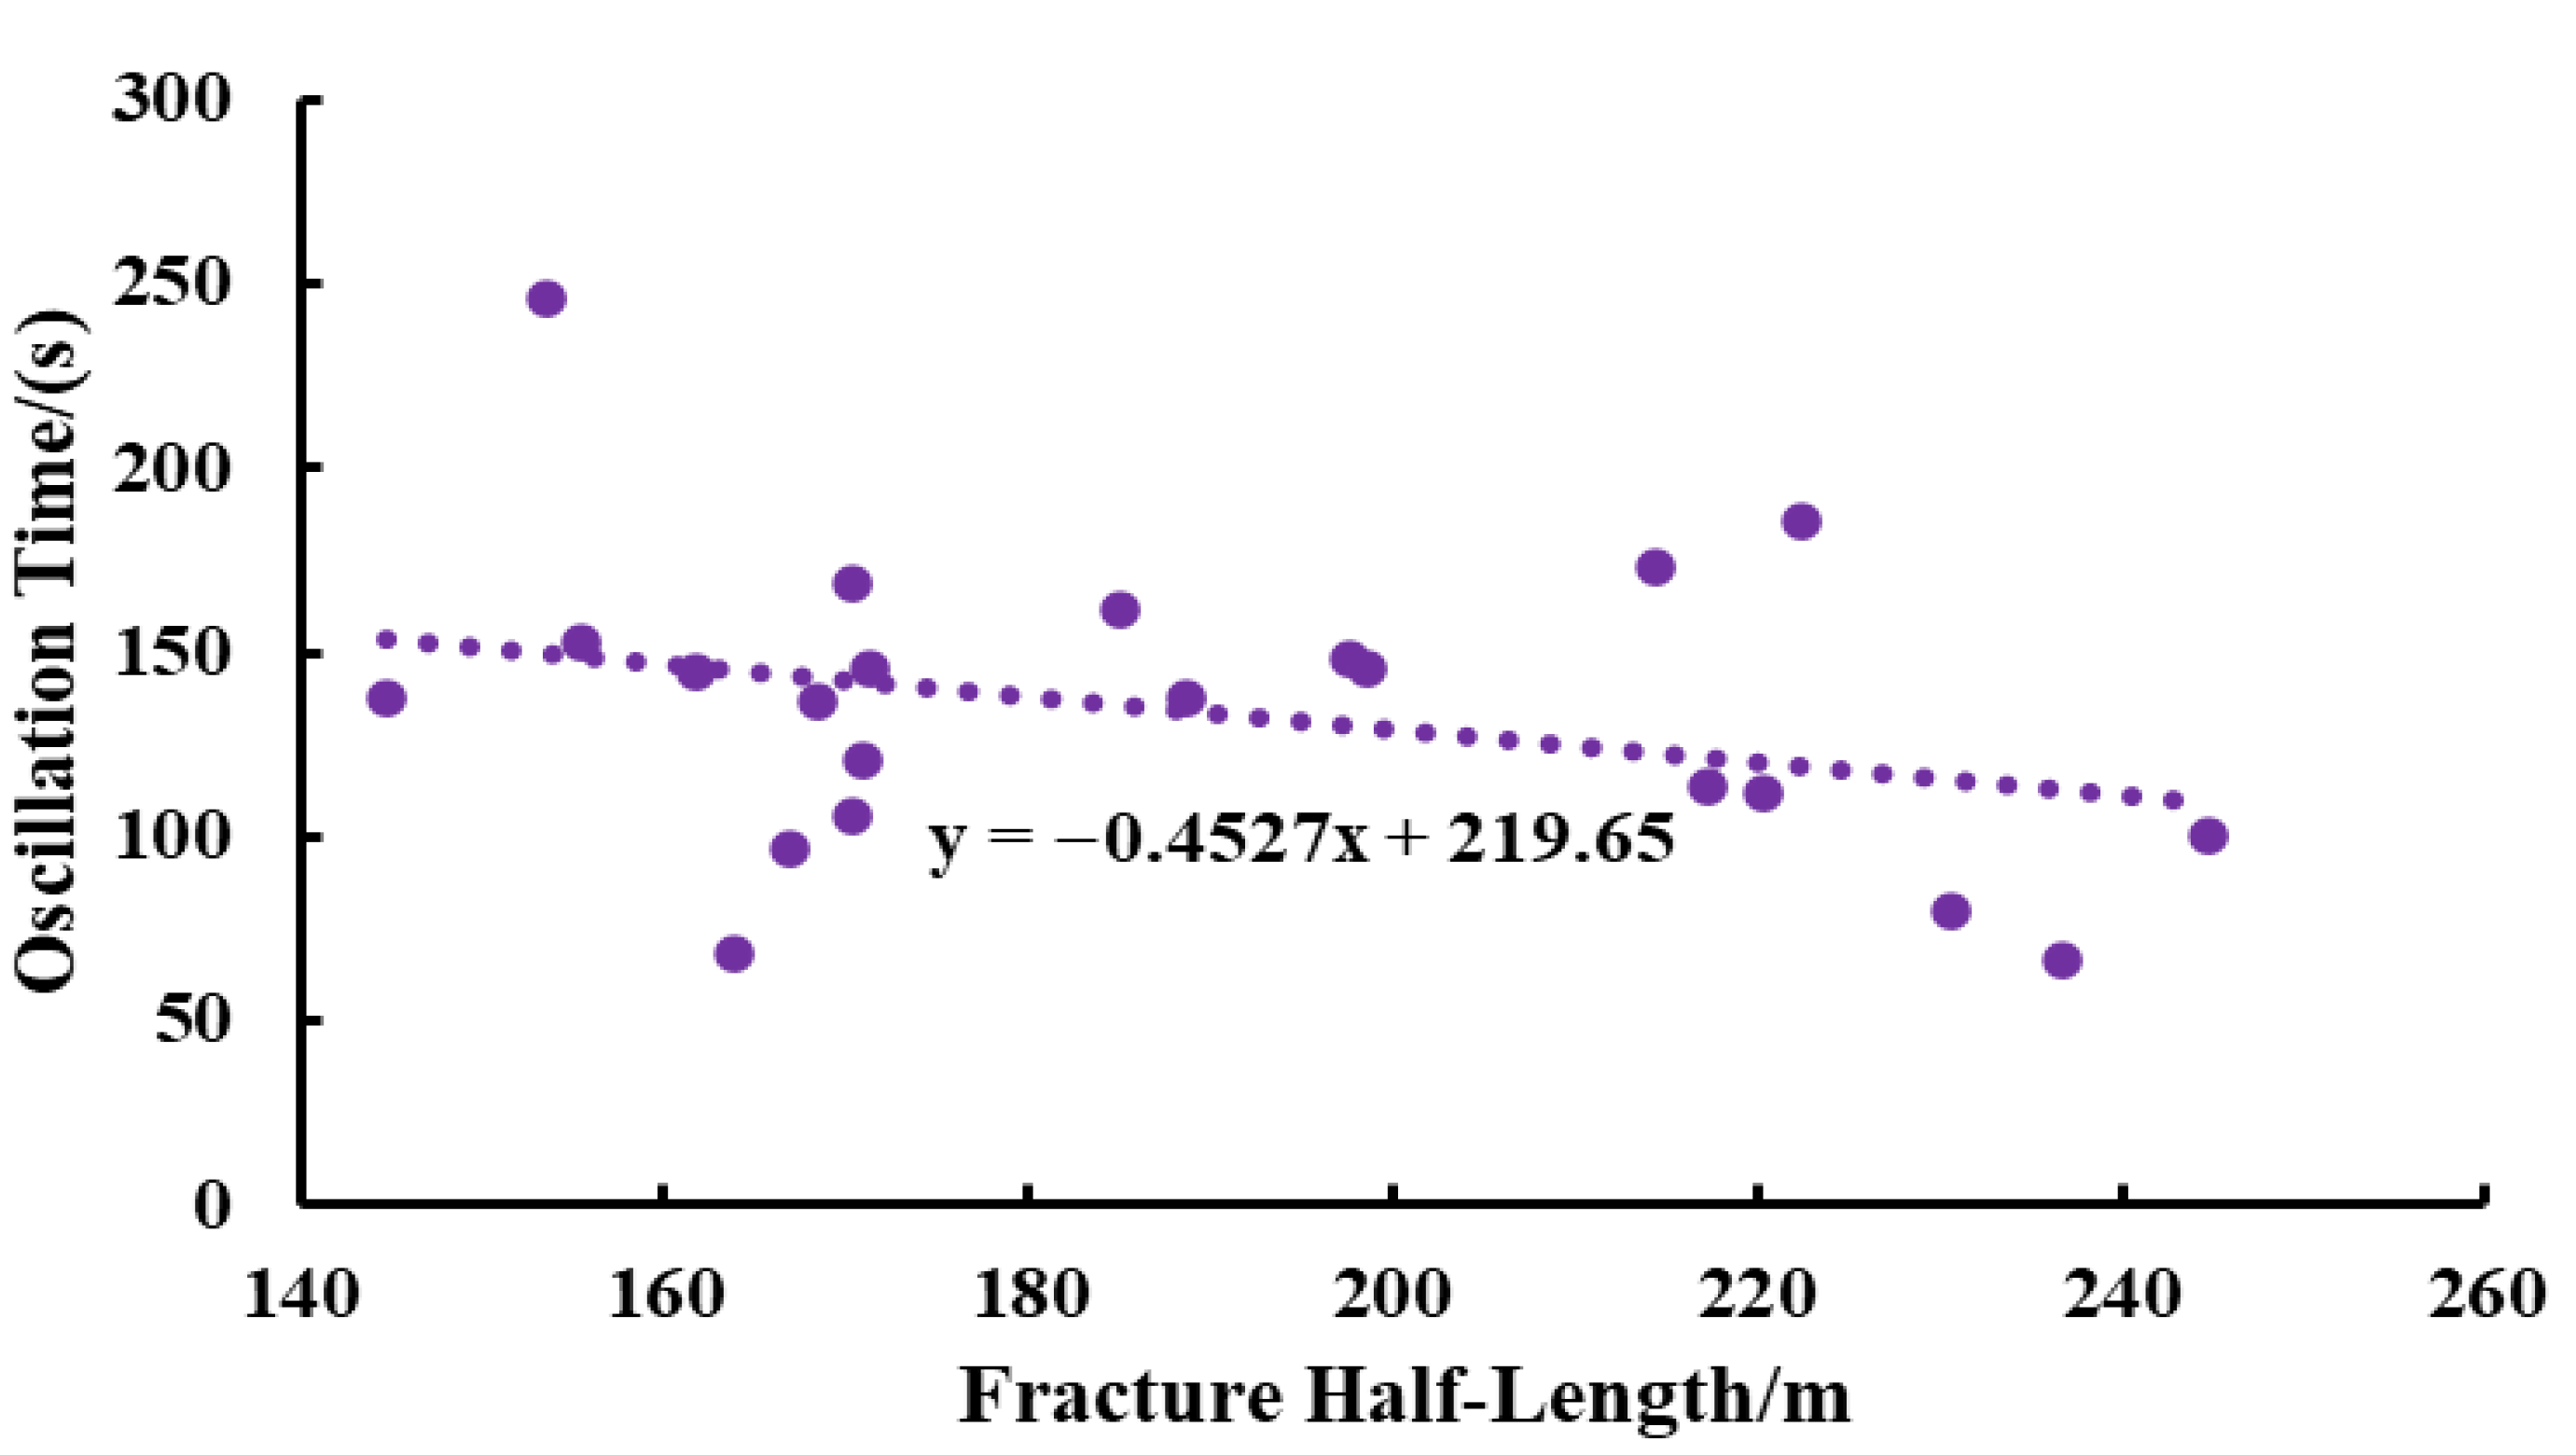
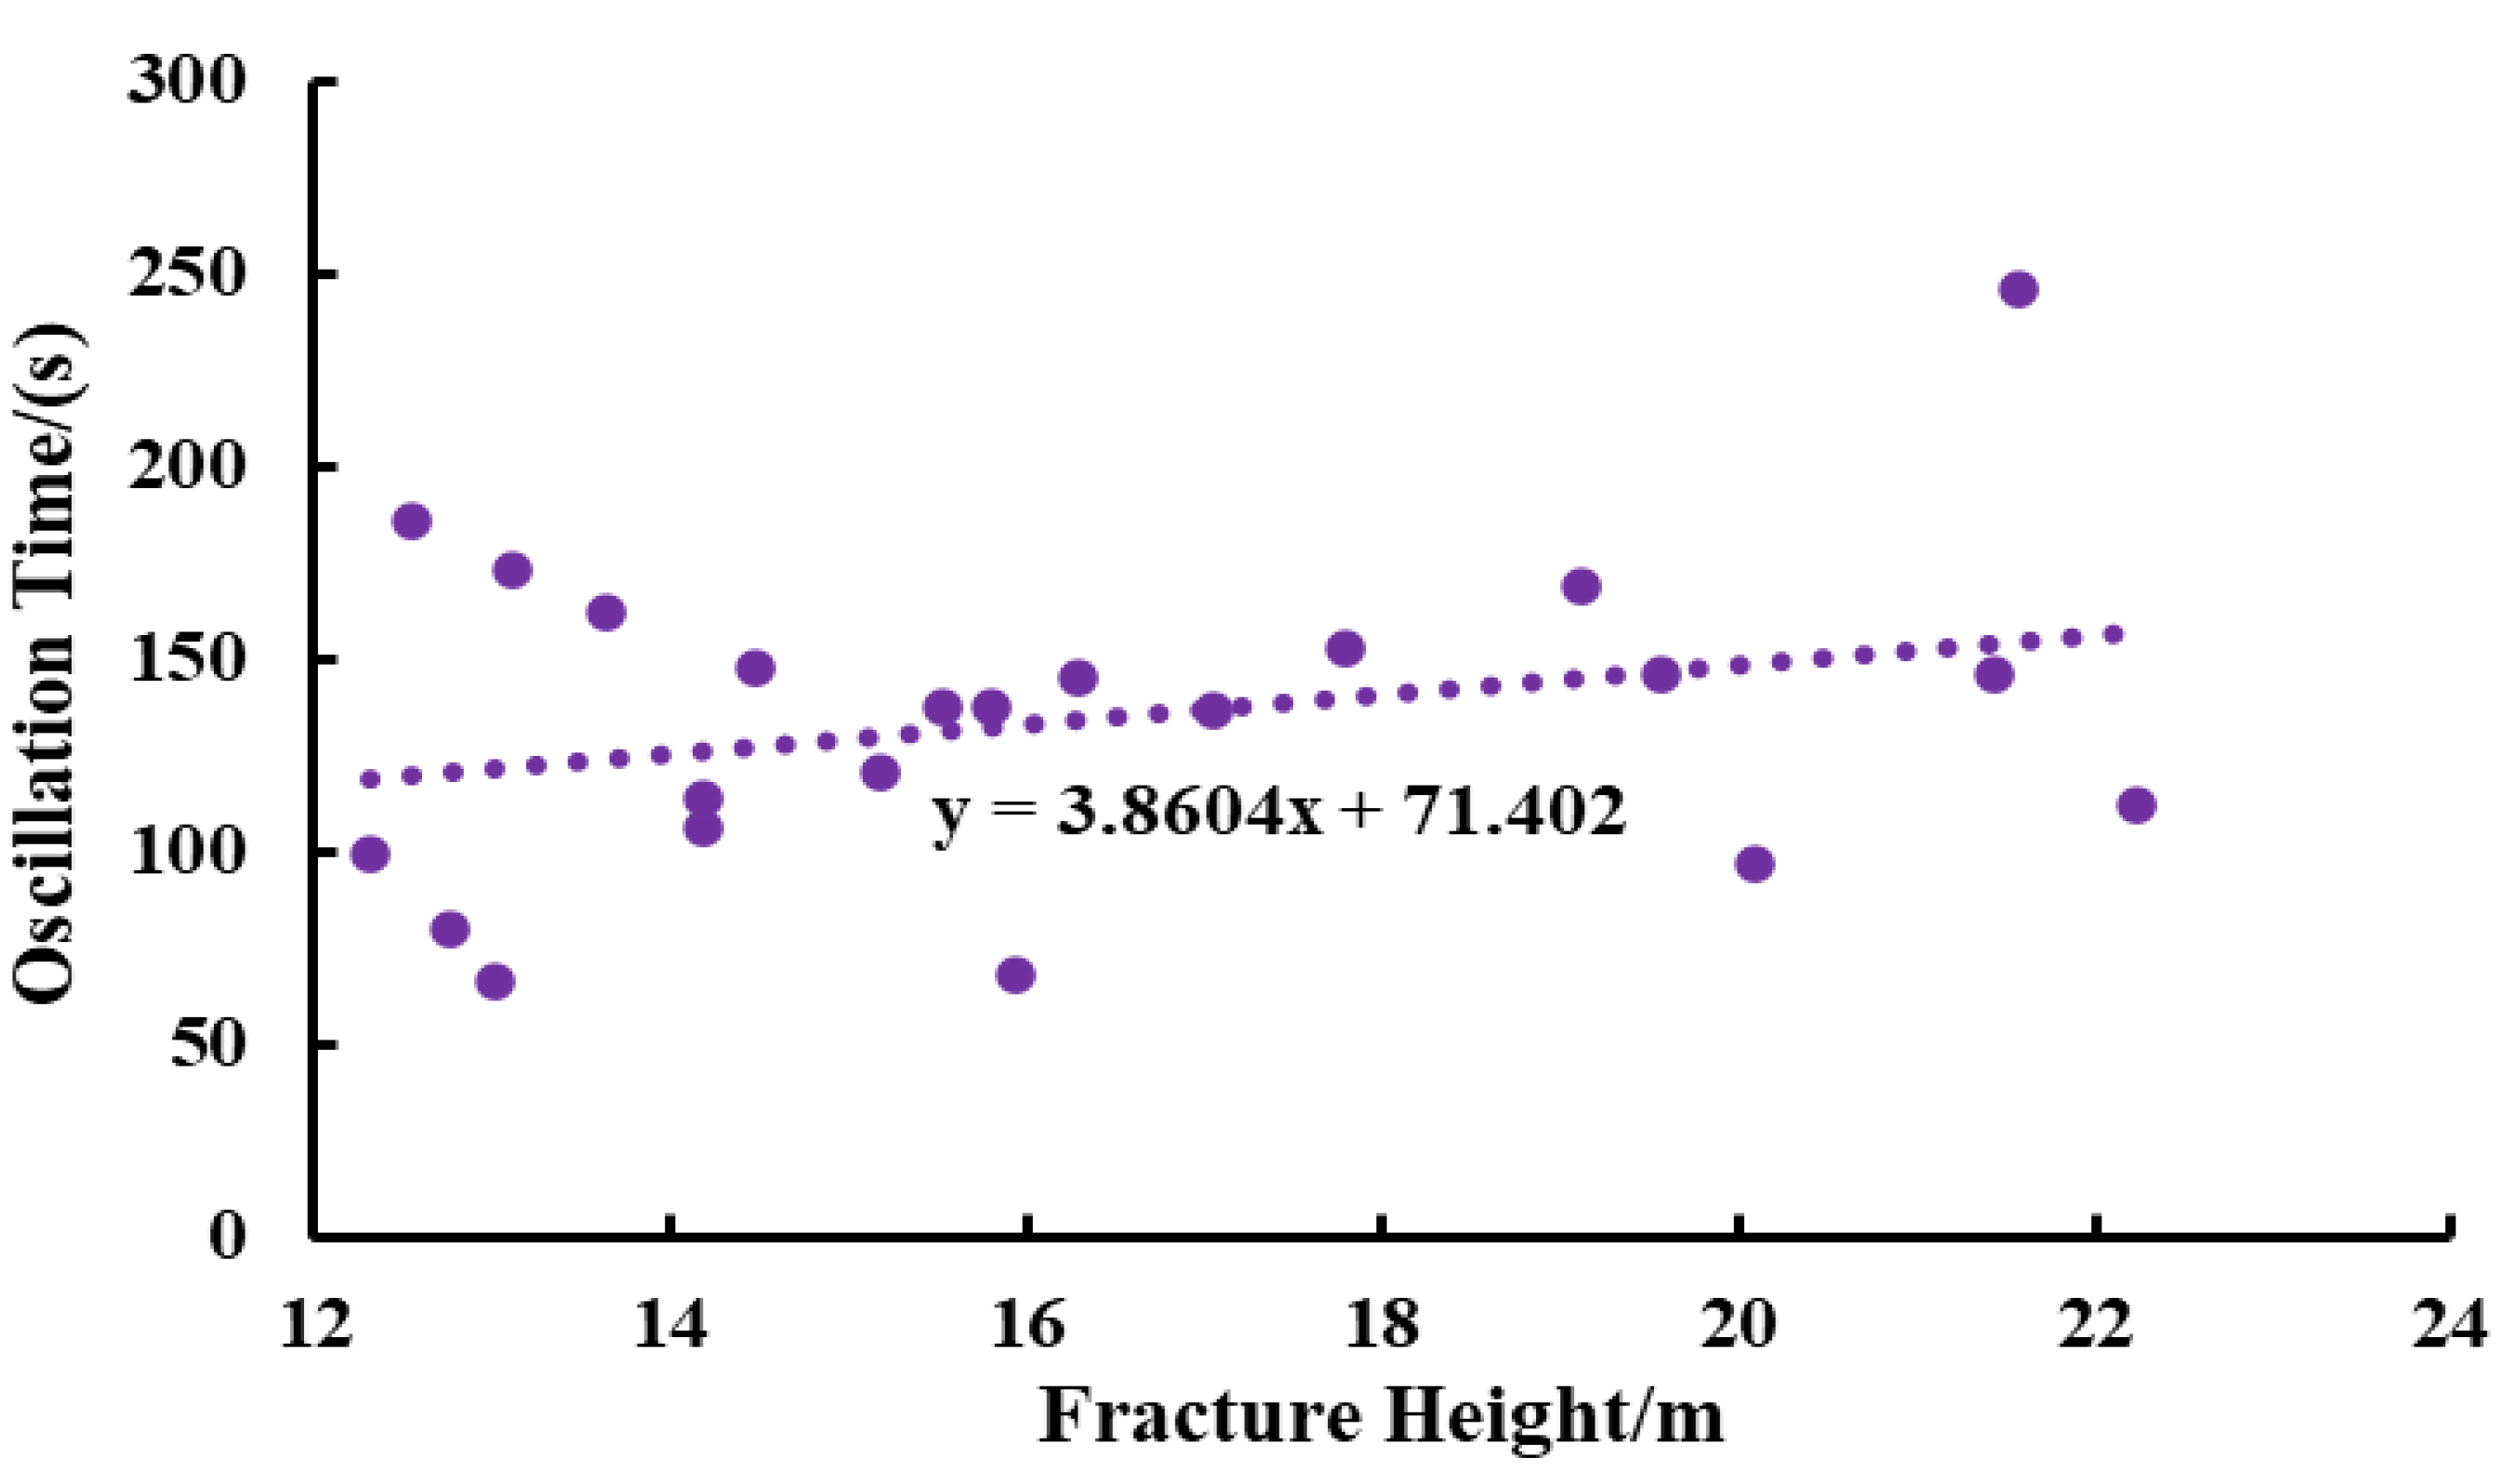
Figure 15 and Figure 16 illustrate the relationship between the water hammer pressure oscillation duration and both the fracture half-length and fracture height. Figure 14 and Figure 15 indicate that shorter water hammer pressure oscillation times occur under conditions of longer fracture half-lengths and smaller fracture heights. While a longer fracture half-length extends the wave propagation path, thereby increasing the propagation period of the water hammer pressure wave at a constant wave speed, the energy dissipation mechanism plays a critical role. Specifically, the combination of a long fracture half-length and a small fracture height enhances the energy dissipation of the water hammer pressure wave. Consequently, the water hammer pressure wave rapidly decays to a stable state, leading to a reduction in the water hammer pressure oscillation time.
(4)
Water Hammer Pressure Attenuation Rate
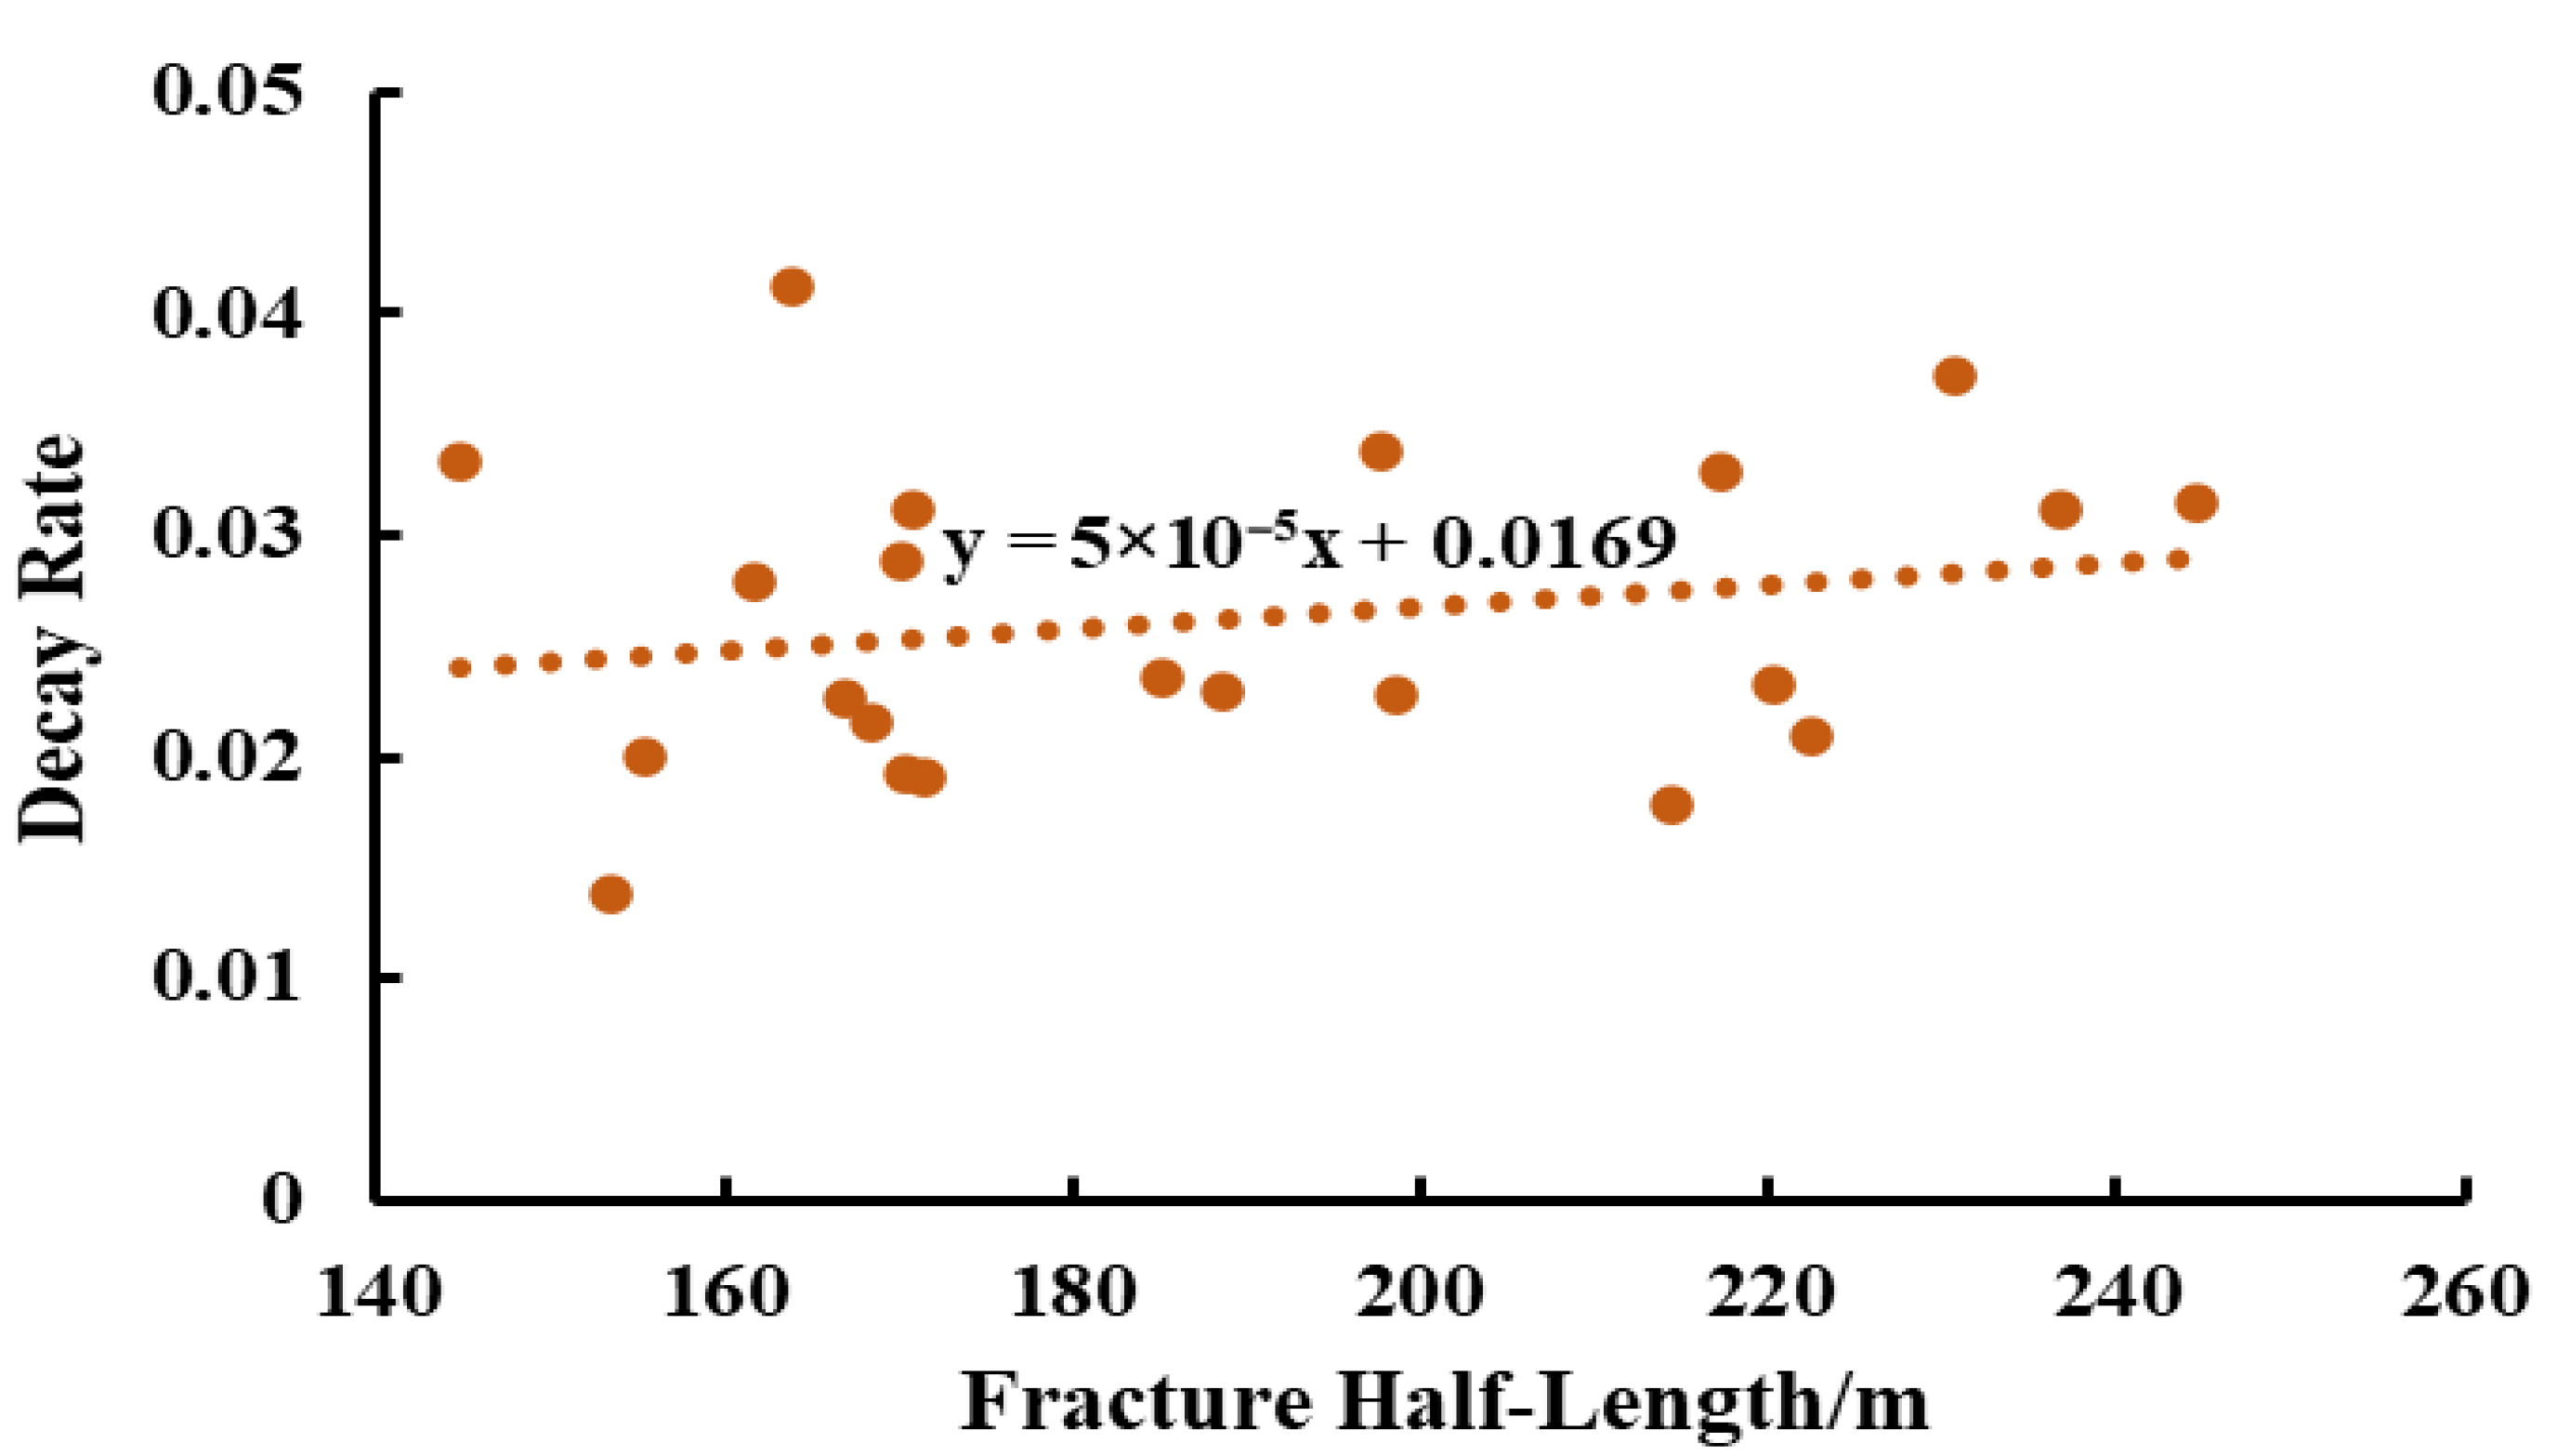
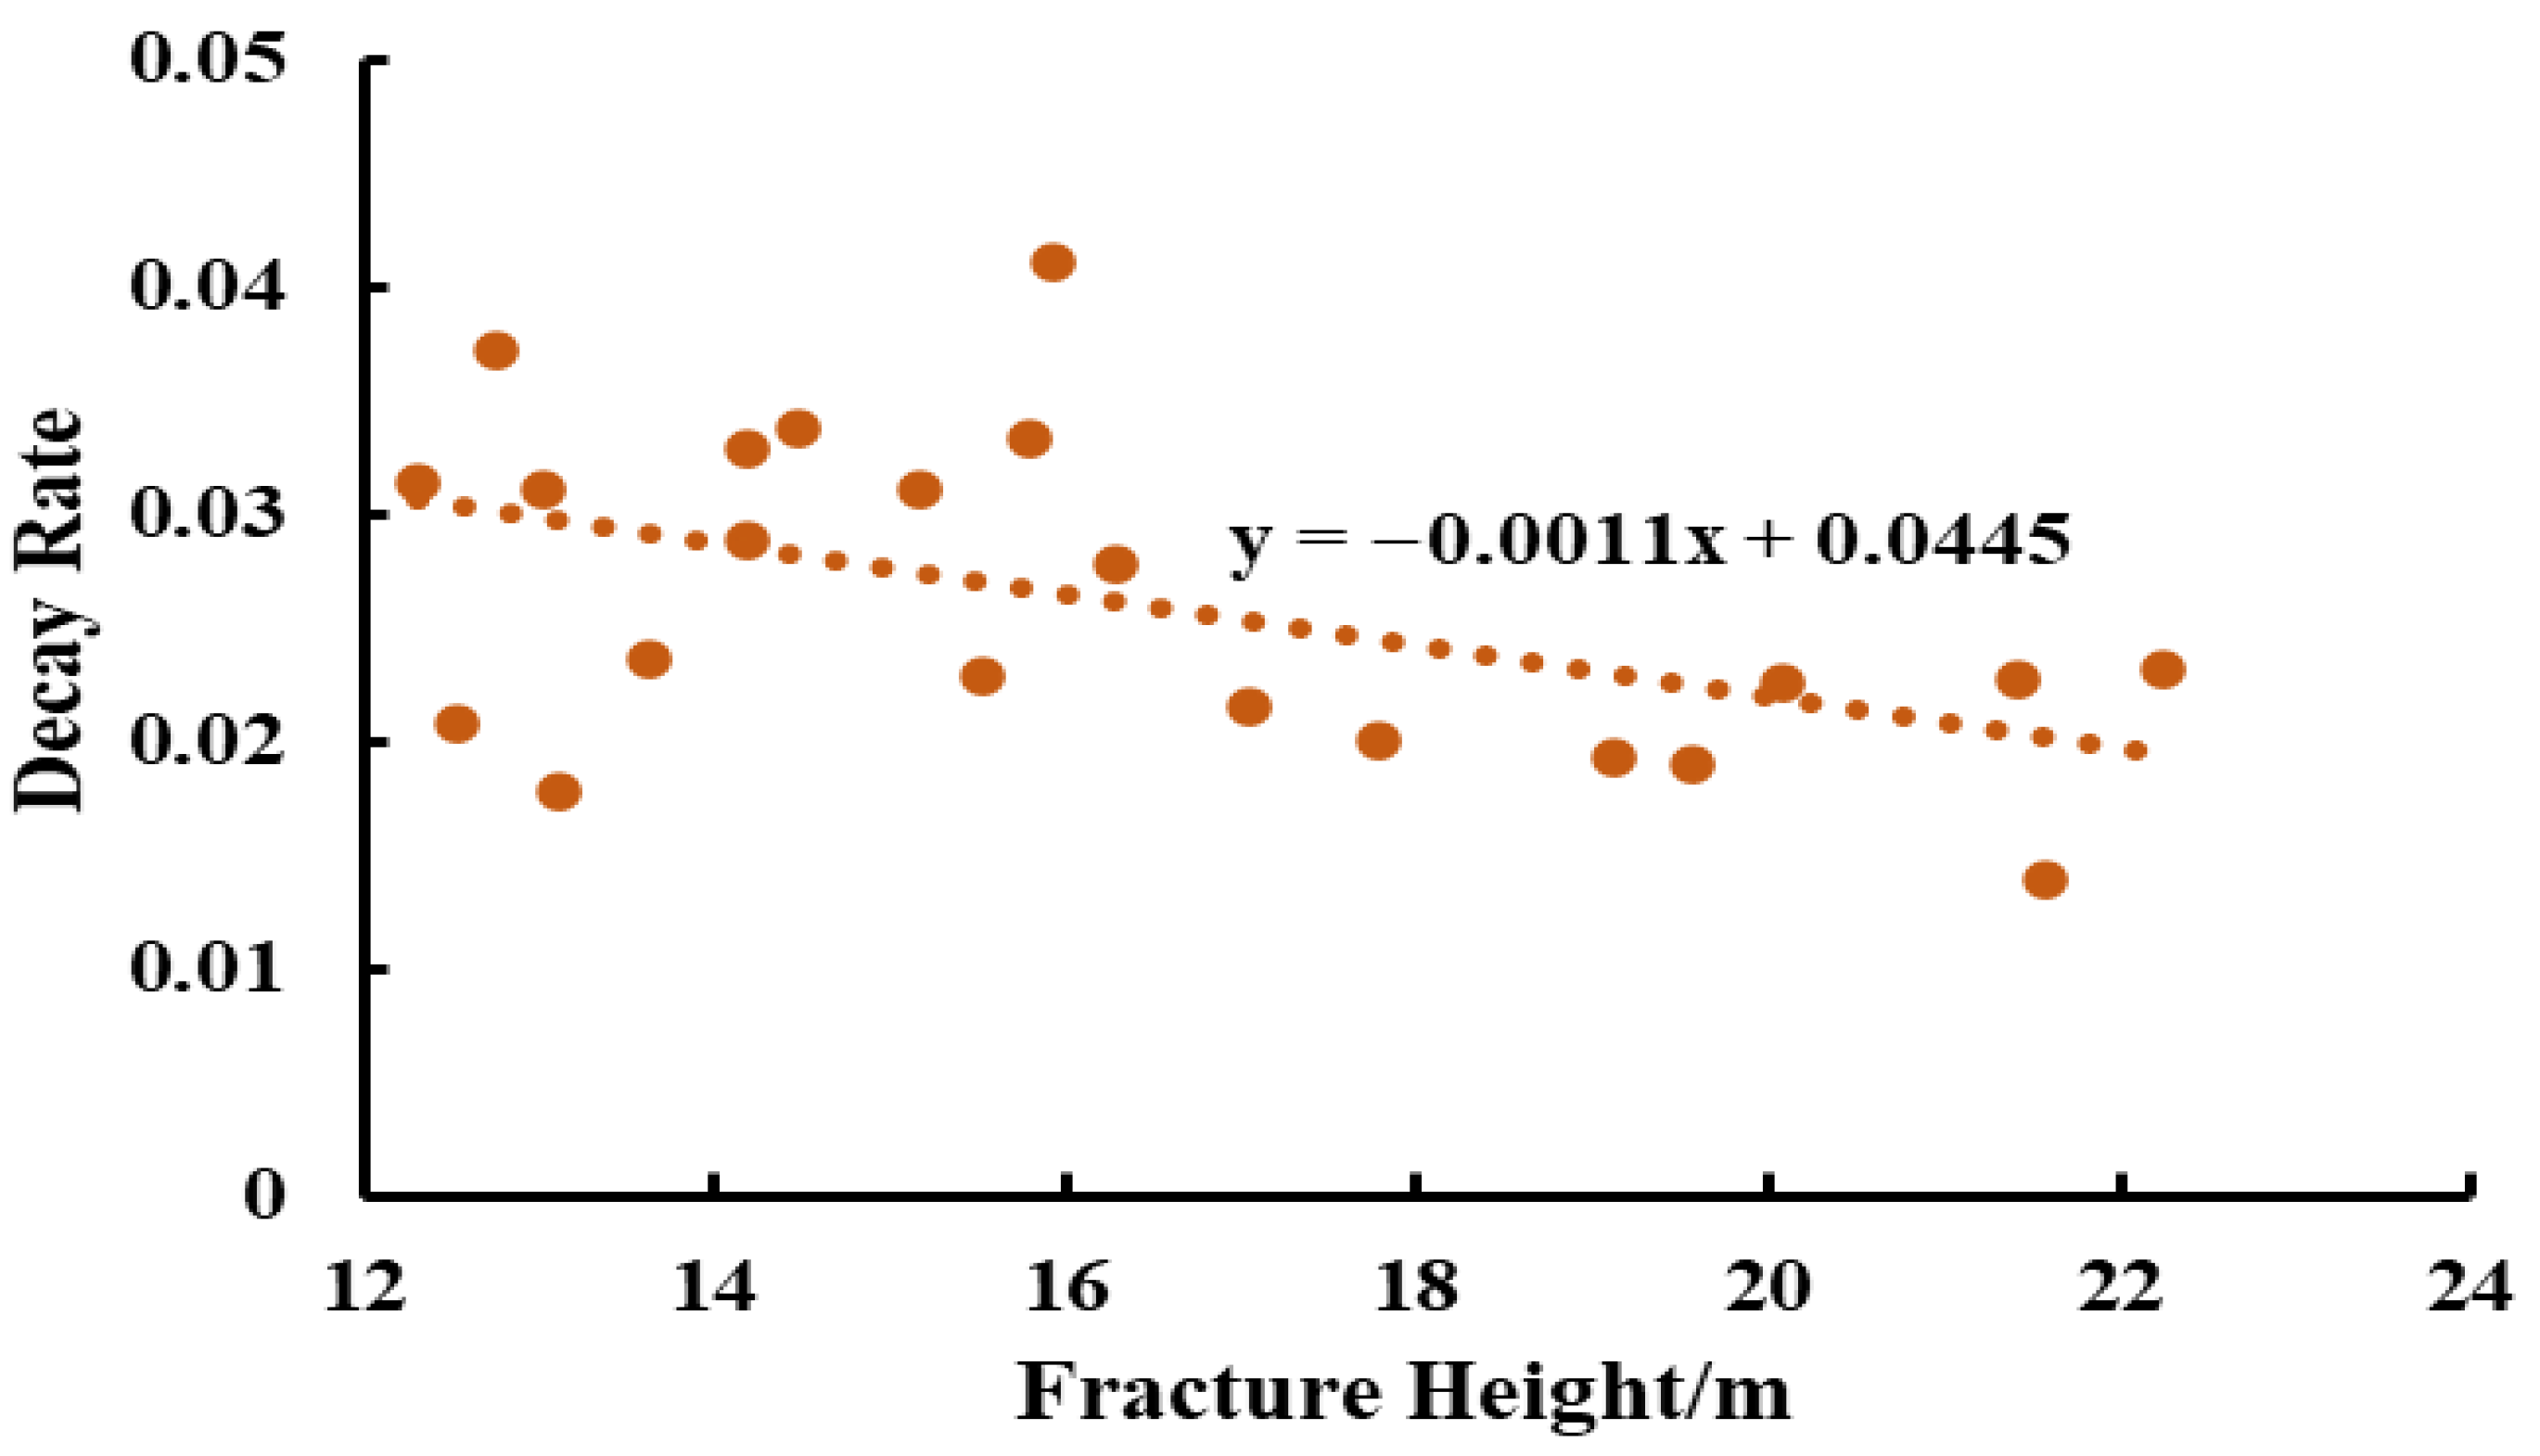
Figure 17 and Figure 18 illustrate the correlation between fracture half-length/fracture height and the water hammer attenuation rate. Figure 16 demonstrates that as fracture half-length increases, the water hammer attenuation rate exhibits an increasing trend, indicating accelerated pressure decay. An increase in fracture half-length not only extends the pressure wave propagation path but also enlarges the fracture’s filtration area. This accelerates energy dissipation within the water hammer wave, thereby hastening pressure attenuation and increasing the water hammer attenuation rate. Analysis of Figure 17 reveals that fracture height exerts the opposite effect on water hammer attenuation compared to fracture half-length. Larger fracture heights correspond to a relatively lower water hammer attenuation rate. As fracture height increases, the attenuation rate shows a decreasing trend. The increased fracture height enhances the fracture’s elastic storage capacity, reducing energy losses during fluid intake and release processes. Consequently, pressure attenuation occurs more gradually, resulting in a comparatively lower water hammer attenuation rate.

4.3. Discussion

The characteristic parameters of water hammer pressure are influenced by multiple factors. This study focuses specifically on the correlation between these parameters and fracture morphology, thereby assisting developers in rapidly evaluating fracturing effectiveness and optimizing fracturing designs. This study employed measured water hammer pressure data from over 20 stages in a single case well to statistically analyze correlations between characteristic parameters and fracture geometric parameters. The examined characteristic parameters include initial amplitude, oscillation count, oscillation duration, and water hammer attenuation rate. Results demonstrate that fractures with longer half-lengths and smaller heights yield water hammer pressures exhibiting higher initial amplitudes, fewer oscillations, shorter oscillation durations, and faster attenuation. Owing to the relatively small sample size, the correlation patterns obtained by the statistical analysis conducted in this study are subject to certain limitations. To further elucidate the relationship between water hammer pressure response characteristics and fracturing effectiveness, the sample size will be increased in future research for an in-depth investigation into the correlation between water hammer pressure characteristic parameters and fracturing effectiveness.

5. Conclusions

(1)
A mathematical model for the evolution of water hammer pressure during multi-cluster staged fracturing in horizontal wells was established, comprehensively incorporating wellbore friction, perforation friction, and fluid filtration effects within the fractures. Fracture parameters at different fracturing stages were diagnostically analyzed. The inversion results show that the fracture half-length ranges from 144.77 m to 244.68 m, with an average of 188.80 m, while the fracture height varies between 12.31 m and 22.24 m, with an average of 16.26 m.
(2)
Based on the measured water hammer pressure data of each fracturing stage, it is found that the initial amplitude of water hammer pressure in this well ranges from 0.74 to 5.02 MPa, with an average value of 3.08 MPa. The number of oscillations varies between 6 and 28, and the average is 12. The oscillation time is between 67 and 246 s, with an average of 134.18 s. The water hammer attenuation rate is in the range of 0.0139 to 0.0412, and the average water hammer attenuation rate is 0.0262.
(3)
Correlation analysis between water hammer pressure characteristics and fracture parameters indicates that, under conditions of longer fracture half-length and smaller fracture height, the resulting water hammer pressure exhibits a higher initial amplitude, fewer oscillations, shorter oscillation duration, and a larger attenuation rate.

Author Contributions

Conceptualization, Y.L. and H.S.; methodology, Y.L., H.S., and W.L.; validation, Y.L.; formal analysis, Y.L.; investigation, Y.L.; resources, Y.L., H.S., W.L., L.Z., S.S., and L.Y.; data curation, Y.L. and S.S.; writing—original draft preparation, Y.L., K.W., and S.S.; writing—review and editing, Y.L., H.S., W.L., L.Z., L.Y., K.W., S.S., and L.L.; visualization, Y.L.; supervision, Y.L., H.S., and S.S.; project administration, Y.L. All authors have read and agreed to the published version of the manuscript.

Funding

This research received no external funding.

Data Availability Statement

Data supporting the reported results are presented within the article.

Conflicts of Interest

Authors Yanchao Li, Hu Sun, Wei Liu, Longqing Zou, Liang Yang and Kai Wu were employed by the Shale Gas Exploration and Development Department, CNPC Chuanqing Drilling Engineering Co., Ltd. The remaining authors declare that the research was conducted in the absence of any commercial or financial relationships that could be construed as a potential conflict of interest.

References

  1. Li, Y.; Zhang, Q.; Shen, J.; Xu, Y.; He, F.; Deng, C.; Xiao, J. volumetric stimulation technology of long-section multi-cluster temporary plugging in shale gas reservoirs. Nat. Gas Ind. 2022, 42, 143–150. [Google Scholar] [CrossRef]
  2. He, Y.; Huang, H.; Tang, M.; Ni, J.; Li, H.; Babadagli, T.; Zhang, X. Influence mechanisms of pressure difference in fracture ends on dynamic imbibition and displacement in shale reservoirs. J. China Univ. Pet. (Ed. Nat. Sci.) 2024, 48, 114–122. [Google Scholar] [CrossRef]
  3. Lei, Q.; Weng, D.; Xiong, S.; Liu, H.; Guan, B.; Deng, Q.; Yan, X.; Liang, H.; Ma, Z. Progress and development directions of shale oil reservoir stimulation technology of China National Petroleum Corporation. Pet. Explor. Dev. 2021, 48, 1035–1042. [Google Scholar] [CrossRef]
  4. Zhao, W.; Jia, A.; Wei, Y.; Wang, J.; Zhu, H. Progress in shale gas exploration in China and prospects for future development. China Pet. Explor. 2020, 25, 31–44. [Google Scholar] [CrossRef]
  5. Zhu, Z.; Dai, D.; Lu, W.; Wang, S.; Liu, W.; Xiao, J. Numerical Fracture Diagnosis Method for Horizontal Well Fracturing Based on Water Hammer. Chin. J. Comput. Phys. 2023, 40, 735–741. [Google Scholar] [CrossRef]
  6. Parkhonyuk, S.; Fedorov, A.; Kabannik, A.; Korkin, R.; Nikolaev, M.; Tsygulev, I. Measurements while fracturing: Nonintrusive method of hydraulic fracturing monitoring. In Proceedings of the SPE Hydraulic Fracturing Technology Conference and Exhibition, Woodlands, TX, USA, 23–25 January 2018; p. D031S007R005. [Google Scholar] [CrossRef]
  7. Haustveit, K.; Dahlgren, K.; Greenwood, H.; Peryam, T.; Kennedy, B.; Dawson, M. New age fracture mapping diagnostic tools-A STACK case study. In Proceedings of the SPE Hydraulic Fracturing Technology Conference and Exhibition, 24–26 January 2017; p. D011S001R002. [Google Scholar] [CrossRef]
  8. Qiu, Y.; Hu, X.; Zhou, F.; Jiang, Z.; Wang, Y.; Lu, X.; Li, J.; Yi, P. Study on Influence Factors of Wellhead Water Hammer Response Characteristics after Fracturing Pumps Shutdown. Chin. J. Hydrodyn. 2023, 38, 965–973. [Google Scholar] [CrossRef]
  9. Yong, R.; Qiu, Y.; Zhou, F.; Hu, X.; Song, Y.; Zhou, X. The evaluation of temporary plugging effect in shale gas wells based on high-frequency water hammer pressure. Pet. Sci. Bull. 2024, 09, 789–797. [Google Scholar] [CrossRef]
  10. Holzhausen, G.R.; Gooch, R.P. Impedance of hydraulic fractures: Its measurement and use for estimating fracture closure pressure and dimensions. In Proceedings of the SPE Rocky Mountain Petroleum Technology Conference/Low-Permeability Reservoirs Symposium, Denver, CO, USA, 19–22 May 1985; p. SPE-13892-MS. [Google Scholar] [CrossRef]
  11. Hu, X.; Luo, Y.; Zhou, F.; Qiu, Y.; Li, Z.; Li, Y. Evaluation of multi-fractures geometry based on water hammer signals: A new comprehensive model and field application. J. Hydrol. 2022, 612, 128240. [Google Scholar] [CrossRef]
  12. Qiu, Y.; Hu, X.; Zhou, F.; Li, Z.; Li, Y.; Luo, Y. Water hammer response characteristics of wellbore-fracture system: Multi-dimensional analysis in time, frequency and quefrency domain. J. Pet. Sci. Eng. 2022, 213, 110425. [Google Scholar] [CrossRef]
  13. Carey, M.A.; Mondal, S.; Sharma, M.M. Analysis of water hammer signatures for fracture diagnostics. In Proceedings of the SPE Annual Technical Conference and Exhibition, Houston, TX, USA, 18–30 September 2015; p. D031S034R003. [Google Scholar] [CrossRef]
  14. Korkin, R.; Parkhonyuk, S.; Fedorov, A.; Badazhkov, D.; Kabannik, A. High frequency pressure monitoring and data analytics for stimulation efficiency determination: New perspectives or potential limits. In Proceedings of the SPE Hydraulic Fracturing Technology Conference and Exhibition, Woodlands, TX, USA, 4–6 February 2020; p. D031S008R006. [Google Scholar] [CrossRef]
  15. Panjaitan, M.L.; Moriyama, A.; McMillan, D.; Dunaeva, A.; Rutledge, L.; Xu, J.; Parkhonyuk, S.; Kabannik, A.; Korkin, R.; Warren, M.; et al. Qualifying diversion in multi clusters horizontal well hydraulic fracturing in haynesville shale using water hammer analysis, step-down test and microseismic data. In Proceedings of the SPE Hydraulic Fracturing Technology Conference and Exhibition, Woodlands, TX, USA, 16–18 October 2018; p. D031S007R006. [Google Scholar] [CrossRef]
  16. Bogdan, A.V.; Keilers, A.; Oussoltsev, D.; Lecerf, B. Real-time interpretation of leak isolation with degradable diverter using high frequency pressure monitoring. In Proceedings of the SPE Asia Pacific Oil and Gas Conference and Exhibition, Perth, Australia, 25–27 October 2016; p. SPE-182451-MS. [Google Scholar] [CrossRef]
  17. Kabannik, A.; Parkhonyuk, S.; Korkin, R.; Litvinets, F.; Dunaeva, A.; Nikolaev, M.; Usoltsev, D. Can we trust the diversion pressure as a decision-making tool: Novel technique reveals the truth. In Proceedings of the Abu Dhabi International Petroleum Exhibition and Conference, Abu Dhabi, United Arab Emirates, 11–15 November 2018; p. D021S050R003. [Google Scholar] [CrossRef]
  18. Ciezobka, J.; Maity, D.; Salehi, I. Variable pump rate fracturing leads to improved production in the marcellus shale. In Proceedings of the SPE Hydraulic Fracturing Technology Conference and Exhibition, Woodlands, TX, USA, 9–11 February 2016; p. D031S008R003. [Google Scholar] [CrossRef]
  19. Iriarte, J.; Merritt, J.; Kreyche, B. Using water hammer characteristics as a fracture treatment diagnostic. In Proceedings of the SPE Oklahoma City Oil and Gas Symposium/Production and Operations Symposium, Oklahoma City, OK, USA, 27–31 March 2017; p. D031S007R004. [Google Scholar] [CrossRef]
  20. Dung, N.; David, C.; Tom, D.; Jon, S.; Nico, R.; Annie, O. Practical applications of water hammer analysis from hydraulic fracturing treatments. In Proceedings of the SPE Hydraulic Fracturing Technology Conference and Exhibition, Virtual, 4–6 May 2021; p. D011S002R009. [Google Scholar] [CrossRef]
  21. Luo, Y.; Hu, X.; Zhou, F.; Qiu, Y.; Lu, X.; Li, J.; Wang, Y. A new water hammer decay model: Analyzing the interference of multiple fractures and perforations on decay rate. SPE J. 2023, 28, 1973–1985. [Google Scholar] [CrossRef]
  22. Teng, H.; Tang, H.; Ding, Y.; Qin, J.; Cui, E.; Zhang, J.; Niu, Y. Fracture geometry analysis method based on pumping curves: A case study of m well block in Mahu tight conglomerate reservoir. Sci. Technol. Eng. 2024, 24, 14205–14215. [Google Scholar] [CrossRef]
  23. He, H.; Zou, L.; Li, Y.; Wang, Y.; Li, J.; Wen, H.; Chang, B.; Liu, L. Simulation Method and Feature Analysis of Shutdown Pressure Evolution During Multi-Cluster Fracturing Stimulation. Energy Eng. 2024, 121, 111. [Google Scholar] [CrossRef]
  24. Brown, G.O. The history of the Darcy-Weisbach equation for pipe flow resistance. In Environmental and Water Resources History; ASCE: New York City, NY, USA, 2002; pp. 34–43. [Google Scholar] [CrossRef]
  25. Paige, R.W.; Murray, L.R.; Roberts, J.D.M. Field application of hydraulic impedance testing for fracture measurement. SPE Prod. Facil. 1995, 10, 7–12. [Google Scholar] [CrossRef]
  26. Carter, R. Appendix to Optimum Fluid Characteristics for Fracture Extension; Drilling and Production Practice; Howard, G.C., Fast, C.R., Eds.; American Petroleum Institute: New York, NY, USA, 1957; Volume 267. [Google Scholar]
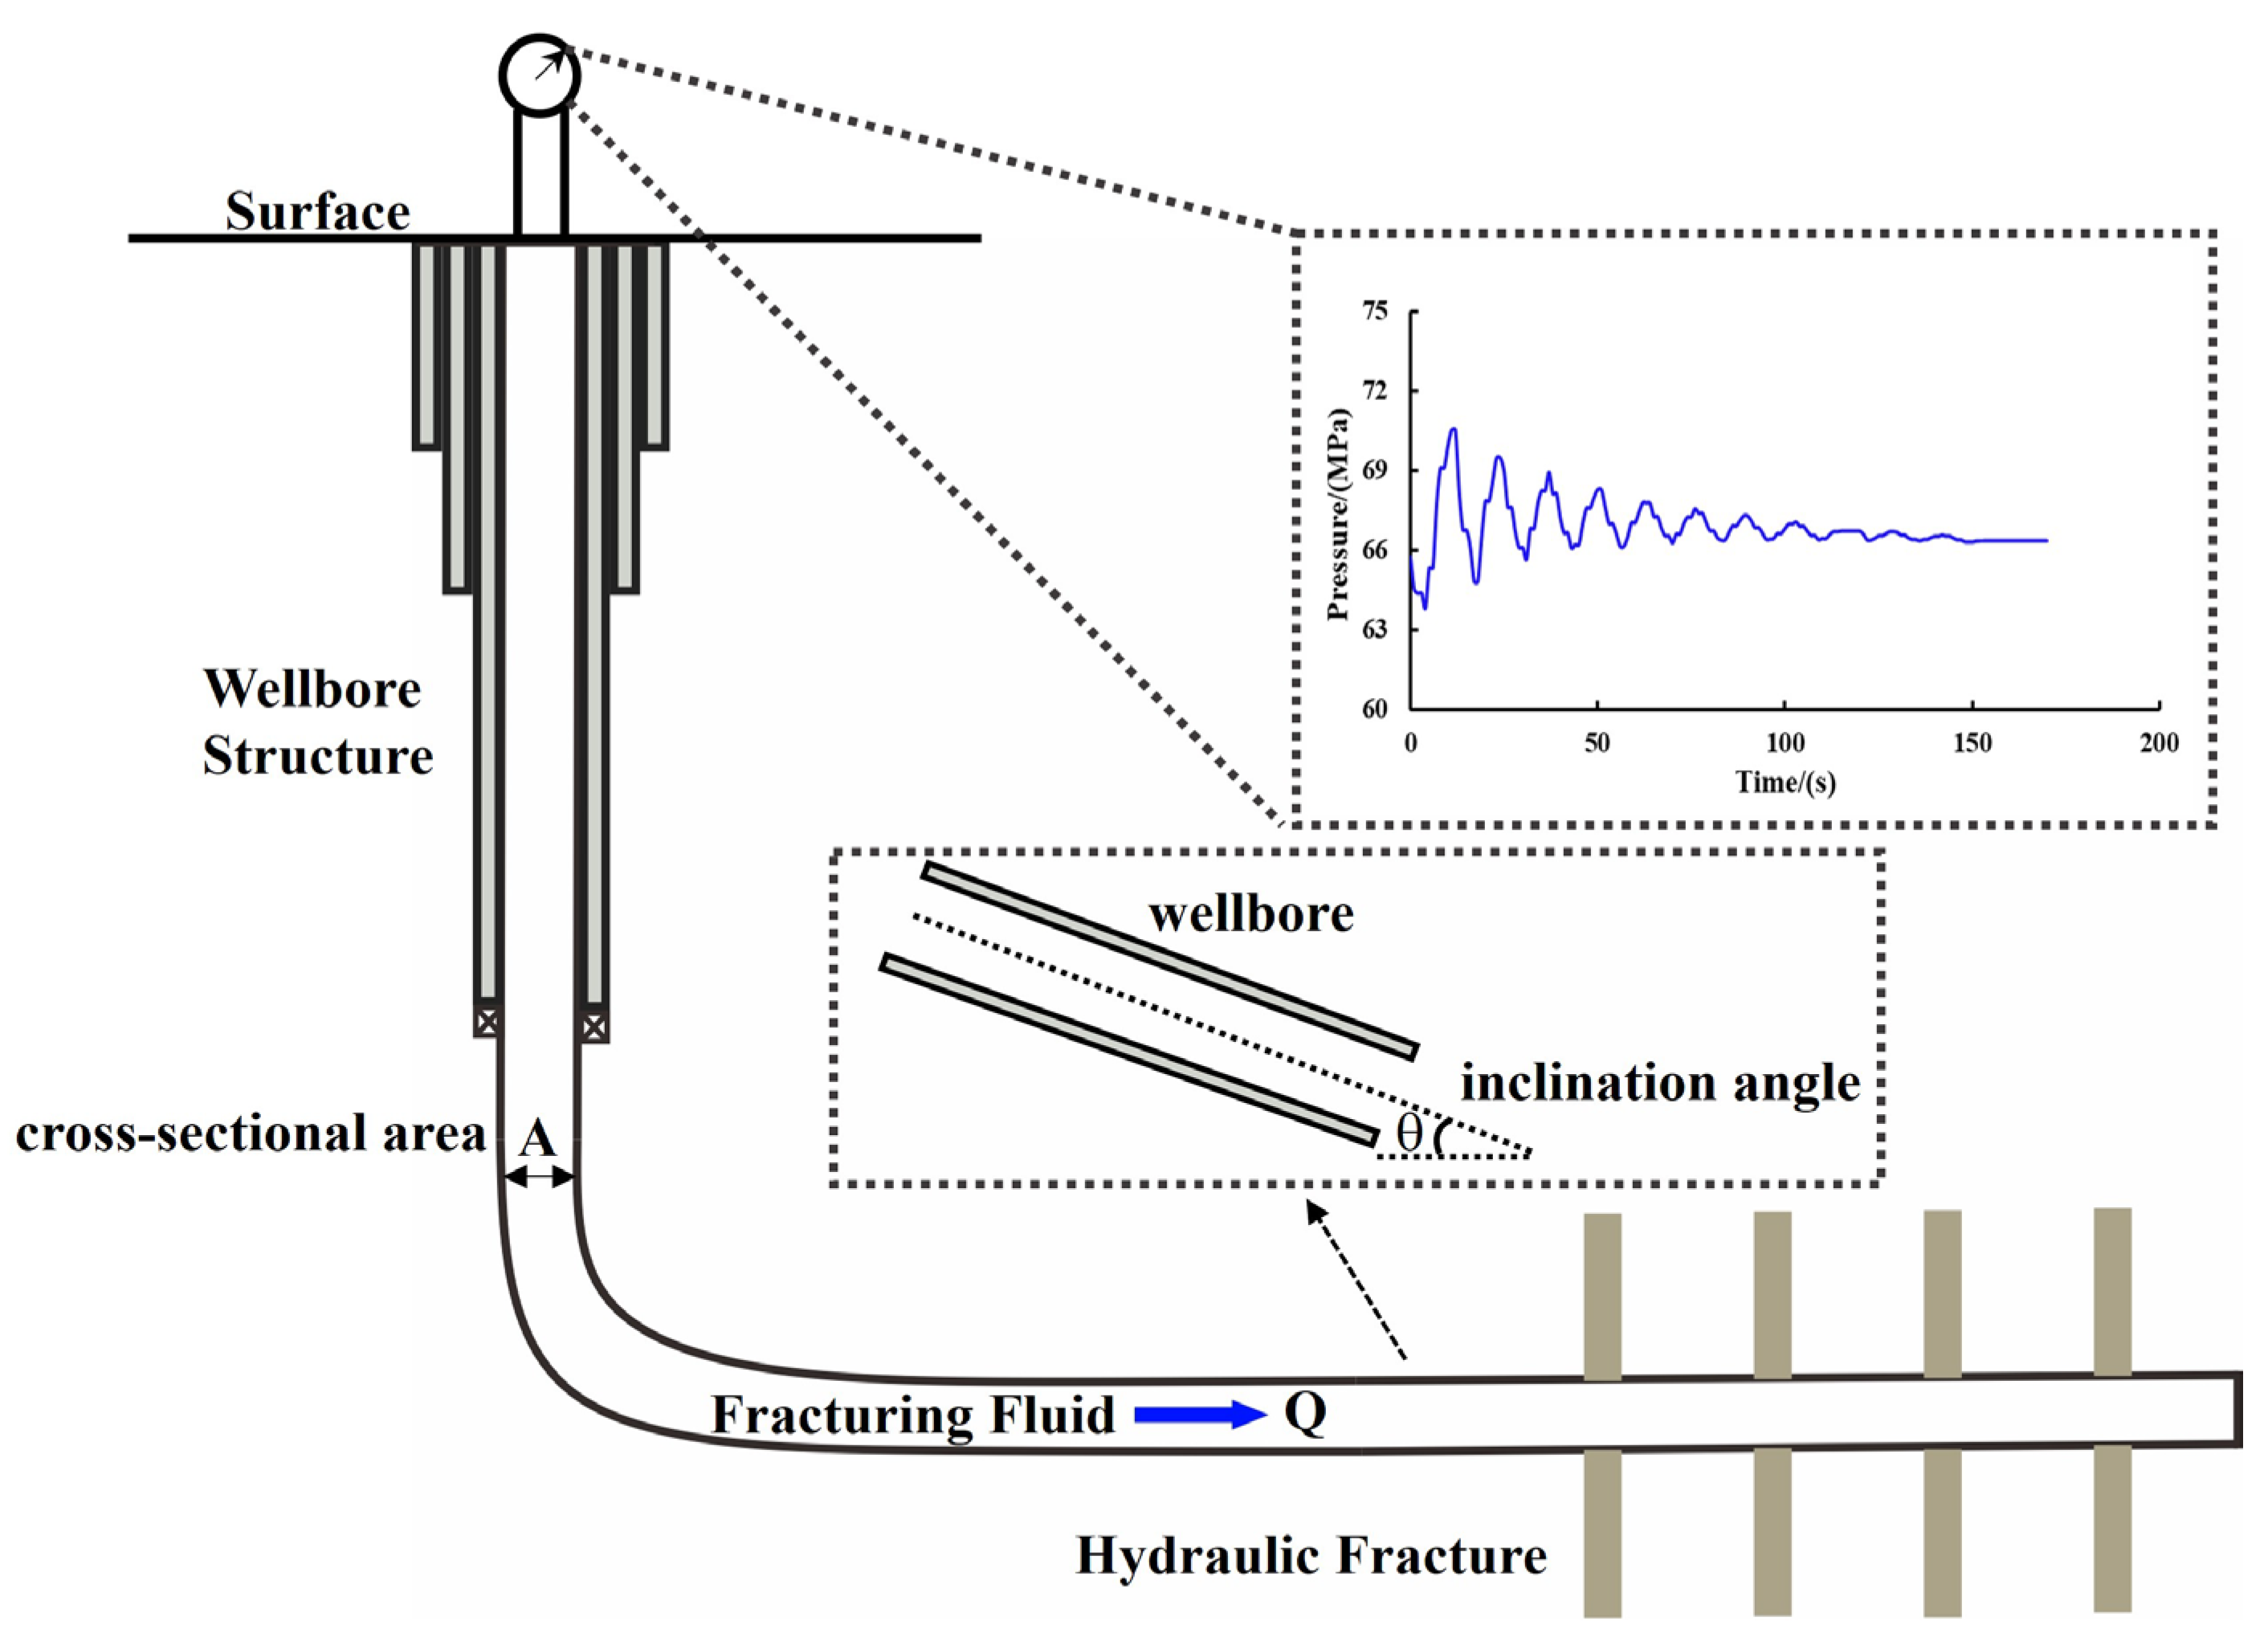
Figure 1. Schematic Diagram of Water Hammer Pressure Monitoring.
Water 17 02741 g001
Figure 2. Comparison of simulated and monitoring data.
Water 17 02741 g002
Figure 3. Schematic Diagram of Water Hammer Characteristic Parameters.
Water 17 02741 g003
Figure 4. Fracture Half-Lengths of Each Fracturing Stage.
Water 17 02741 g004
Figure 5. Fracture Heights of Each Fracturing Stage.
Water 17 02741 g005
Figure 6. Water Hammer Pressure Curves and Their Peak Pressures.
Water 17 02741 g006
Figure 7. Initial Amplitudes of Each Fracturing Stage.
Water 17 02741 g007
Figure 8. Number of Oscillations for Each Fracturing Stage.
Water 17 02741 g008
Figure 9. Oscillation Time of Each Fracturing Stage.
Water 17 02741 g009
Figure 10. Decay Rates of Each Fracturing Stage.
Water 17 02741 g010
Figure 11. Fracture Half-Lengths and Initial Amplitudes.
Water 17 02741 g011
Figure 12. Fracture Heights and Initial Amplitudes.
Water 17 02741 g012
Figure 13. Fracture Half-Lengths and Number of Oscillations.
Water 17 02741 g013
Figure 14. Fracture Heights and Number of Oscillations.
Water 17 02741 g014
Figure 15. Fracture Half-Lengths and Oscillation Time.
Water 17 02741 g015
Figure 16. Fracture Heights and Oscillation Time.
Water 17 02741 g016
Figure 17. Fracture Half-Lengths and Water Hammer Decay Rates.
Water 17 02741 g017
Figure 18. Fracture Heights and Water Hammer Decay Rates.
Water 17 02741 g018
Disclaimer/Publisher’s Note: The statements, opinions and data contained in all publications are solely those of the individual author(s) and contributor(s) and not of MDPI and/or the editor(s). MDPI and/or the editor(s) disclaim responsibility for any injury to people or property resulting from any ideas, methods, instructions or products referred to in the content.