Article

A Novel Multimodal Large Language Model-Based Approach for Urban Flood Detection Using Open-Access Closed Circuit Television in Bandung, Indonesia

by
Tsun-Hua Yang
1,
Obaja Triputera Wijaya
2,*,
Sandy Ardianto
3 and
Albert Budi Christian
4
1
Department of Civil Engineering, National Yang Ming Chiao Tung University, Hsinchu 30010, Taiwan
2
Department of Civil Engineering, Parahyangan Catholic University, Bandung 40141, Indonesia
3
Faculty of Science and Engineering, Institut Sains dan Teknologi Terpadu Surabaya, Surabaya 60248, Indonesia
4
Faculty of Engineering and Informatics, AKI University, Semarang 50173, Indonesia
*
Author to whom correspondence should be addressed.
Water 2025, 17(18), 2739; https://doi.org/10.3390/w17182739
Submission received: 8 August 2025 / Revised: 12 September 2025 / Accepted: 15 September 2025 / Published: 16 September 2025

Abstract

Monitoring urban pluvial floods remains a challenge, particularly in dense city environments where drainage overflows are localized, and sensor-based systems are often impractical. Physical sensors can be costly, prone to theft, and difficult to maintain in areas with high human activity. To address this, we developed an innovative flood detection framework that utilizes publicly accessible CCTV imagery and large language models (LLMs) to classify flooding conditions directly from images using natural language prompts. The system was tested in Bandung, Indonesia, across 340 CCTV locations over a one-year period. Four multimodal LLMs, ChatGPT-4.1, Gemini 2.5 Pro, Mistral Pixtral, and DeepSeek-VL Janus, were evaluated based on classification accuracy and operational cost. ChatGPT-4.1 achieved the highest overall accuracy at 85%, with higher performance during the daytime (89%) and lower accuracy at night (78%). A cost analysis showed that deploying GPT-4.1 every 15 min across all locations would require approximately USD 59,568 per year. However, using compact models like GPT-4 nano could reduce costs by up to seven times, with minimal loss of accuracy. These results highlight the trade-off between performance and affordability, especially in developing regions. This approach offers a scalable, passive flood monitoring solution that can be integrated into early warning systems. Future improvements may include multi-frame image analysis, automated confidence filtering, and multi-level flood classification for enhanced situational awareness.

1. Introduction

Floods in urban areas are commonly caused by high-intensity rainfall that exceeds the capacity of the drainage system. When the system overflows, water inundates roads and surrounding areas. Moreover, the impacts of urbanization and climate change are expected to increase the frequency and severity of urban flooding. Therefore, urban flood assessment and prevention are crucial to minimizing its impacts [1,2,3,4].
To manage urban flood risk effectively, stakeholders must understand the characteristics and long-term trends of flooding in urban areas before making informed decisions. Mathematical or numerical models are commonly used tools to provide such insights. However, these models require substantial data for calibration, specifically, flood depth at specific locations. Additionally, trained personnel and significant computational resources are necessary for model validation, which is often limited in many applications [5,6,7,8]. For fluvial floods, a set of sensors can be easily installed to measure and record water levels in rivers. In contrast, deploying sensors in urban environments is much more challenging due to the complex terrain, which includes roads, buildings, vehicles, and pedestrian activity. Furthermore, urban sensors are vulnerable to human activities, including vandalism and theft. The most common method to gauge flood depth in urban areas involves community testimonies or estimating depth based on flood marks left on buildings. However, these approaches are often inaccurate due to many uncertainties and subjective interpretation [9,10].
Closed Circuit Television (CCTV) is a television system in which signals are not publicly distributed but are monitored primarily for surveillance and security purposes [11,12,13,14]. However, the applications of CCTV have expanded beyond security. For instance, in the transportation sector, CCTV is integrated into Advanced Transportation Management Systems (ATMS) to reduce traffic congestion by providing real-time monitoring and data acquisition [15,16,17,18]. In the context of flood studies, CCTV has been increasingly applied, particularly for fluvial flood monitoring [19,20,21]. In such applications, CCTV is commonly combined with sensors that measure flow velocity and/or water levels in rivers. Additionally, CCTV footage has been integrated with artificial intelligence techniques to estimate water levels from image data [19] and connected to web-based platforms or Internet of Things (IoT) frameworks for real-time flood information dissemination [20,21]. Krzhizhanovskaya et al. [22] combined surveillance camera data with sensor networks installed on flood defense structures (e.g., dikes, dams, and embankments) to detect and simulate flood propagation in the event of structural failures. Although the use of CCTV in flood-related applications has been widely explored, it has mainly focused on fluvial flood monitoring. In contrast, the utilization of CCTV in urban areas to monitor pluvial floods remains limited and underdeveloped. Deploying physical sensors in urban environments is often impractical due to infrastructure complexity and vulnerability to vandalism. Thus, the potential of CCTV as a passive, non-intrusive data source for monitoring urban flood detection and pluvial flooding warrants further exploration.
In general, CCTV image or video data can be used alongside traditional image recognition techniques such as image/video segmentations [23,24,25,26] and object detections [27,28,29,30] to identify the presence of flooding within the captured scenes. However, these models often require large training datasets, substantial computational resources, and a significant amount of development time. In real-world urban environments, the number of CCTV cameras required can be very high, making it both costly and complex to implement and maintain traditional image recognition systems on a large scale. Conventional computer vision approaches are often not practical for widespread deployment, especially in cities with many cameras and large volumes of data. Methods based on convolutional neural networks or other deep learning architectures typically demand intensive computing power during both the training and prediction stages. When applied across an entire city, each CCTV feed must be processed continuously, which requires powerful servers or clusters of graphical processing units. This increases operational costs and adds layers of technical complexity. Furthermore, these models usually depend on large datasets with labeled images for training. Such datasets are often unavailable for urban flood monitoring, especially in areas where flooding is rare or poorly documented. The diverse nature of urban environments, including changes in lighting, moving vehicles, and visual obstructions such as buildings or trees further challenges the accuracy and reliability of conventional models. As a result, implementing and maintaining these systems across an entire city becomes both technically demanding and economically inefficient, emphasizing the need for more flexible and lightweight alternatives.
Recent advancements in multimodal large language models (LLMs), such as ChatGPT, Gemini, and DeepSeek, have introduced the ability to process visual inputs alongside natural language. These models can interpret image content, identify objects, and answer questions related to visual scenes without the need for extensive retraining or labeled datasets. The innovation of this study is to develop an innovative flood monitoring framework by integrating open-access CCTV data with the visual recognition capabilities of LLMs. Unlike traditional flood monitoring systems, which require substantial investments in physical infrastructure and trained personnel, the proposed method offers a cost-effective and scalable solution for detecting flood events, supporting real-time surveillance and early warning systems. To our knowledge, no prior studies have employed LLMs for detecting fluvial or pluvial flooding. Meanwhile, instead of traditional image-based methods that depend on large, often unavailable training datasets, we investigate the use of LLMs as a lightweight and scalable alternative for flood detection using imagery. This approach is particularly valuable in regions where conventional sensor-based data are limited or unavailable.

2. Materials and Methods

2.1. Study Area

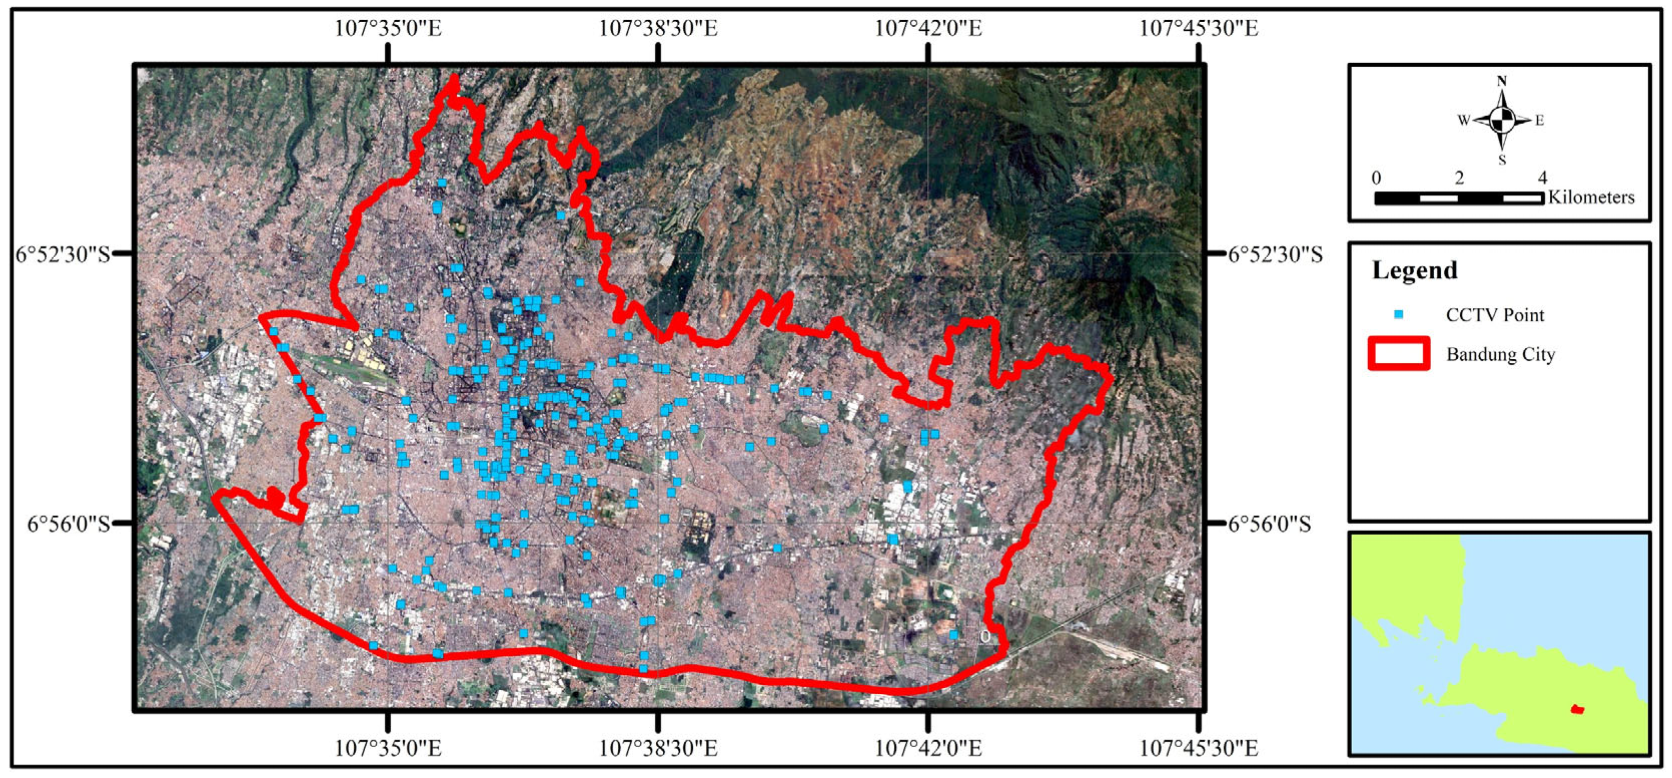
This study was conducted in Bandung, the capital city of West Java Province, Indonesia. Geographically, Bandung is located within a tectonic basin surrounded by volcanic highlands, creating a topographical structure that resembles a large bowl or basin. This natural bowl-shaped formation causes water from the surrounding uplands to flow and accumulate toward the city center during periods of heavy rainfall. As a result, Bandung is highly susceptible to urban flooding, particularly in low-lying areas where drainage is inadequate. The city also experiences high rainfall intensity, especially during the monsoon season, which further exacerbates flood risk. Combined with rapid urbanization and the expansion of impervious surfaces, the natural topography significantly contributes to the frequency and severity of localized inundation in Bandung. Figure 1 illustrates the administrative boundary of the study area, covering the urban extent of Bandung City.

2.2. CCTV Data

Since 2021, a public service (Dinas Komunikasi Dan Informatika Kota Bandung, Bandung, Indonesia) has been launched allowing 24 h live access to CCTV feeds operated by several government agencies in the city of Bandung. As of the time of this study, approximately 340 CCTV observation points are available citywide, with the number steadily increasing each year. These CCTV systems are primarily used for monitoring traffic congestion and surrounding weather conditions. In addition, several CCTV units are already integrated with advanced technologies such as vehicle counting algorithms, facial recognition systems, Network Video Recorders (NVR), and Pan–Tilt–Zoom (PTZ) features, enabling full 360-degree field coverage. The spatial distribution of CCTV observation points across Bandung City is presented in Figure 2.
For analysis, image data were collected at 15 min intervals over a full one-year period, from 1 October 2023 to 30 September 2024. This approach was adopted to capture a comprehensive representation of both hydrological conditions in Indonesia, which has only two distinct seasons: the rainy season and the dry season. By covering an entire year, the dataset includes flood-prone conditions typically observed during the rainy season, as well as dry conditions during the dry season. This temporal coverage ensures that the model can be evaluated under both flood and non-flood scenarios.

2.3. Model Framework

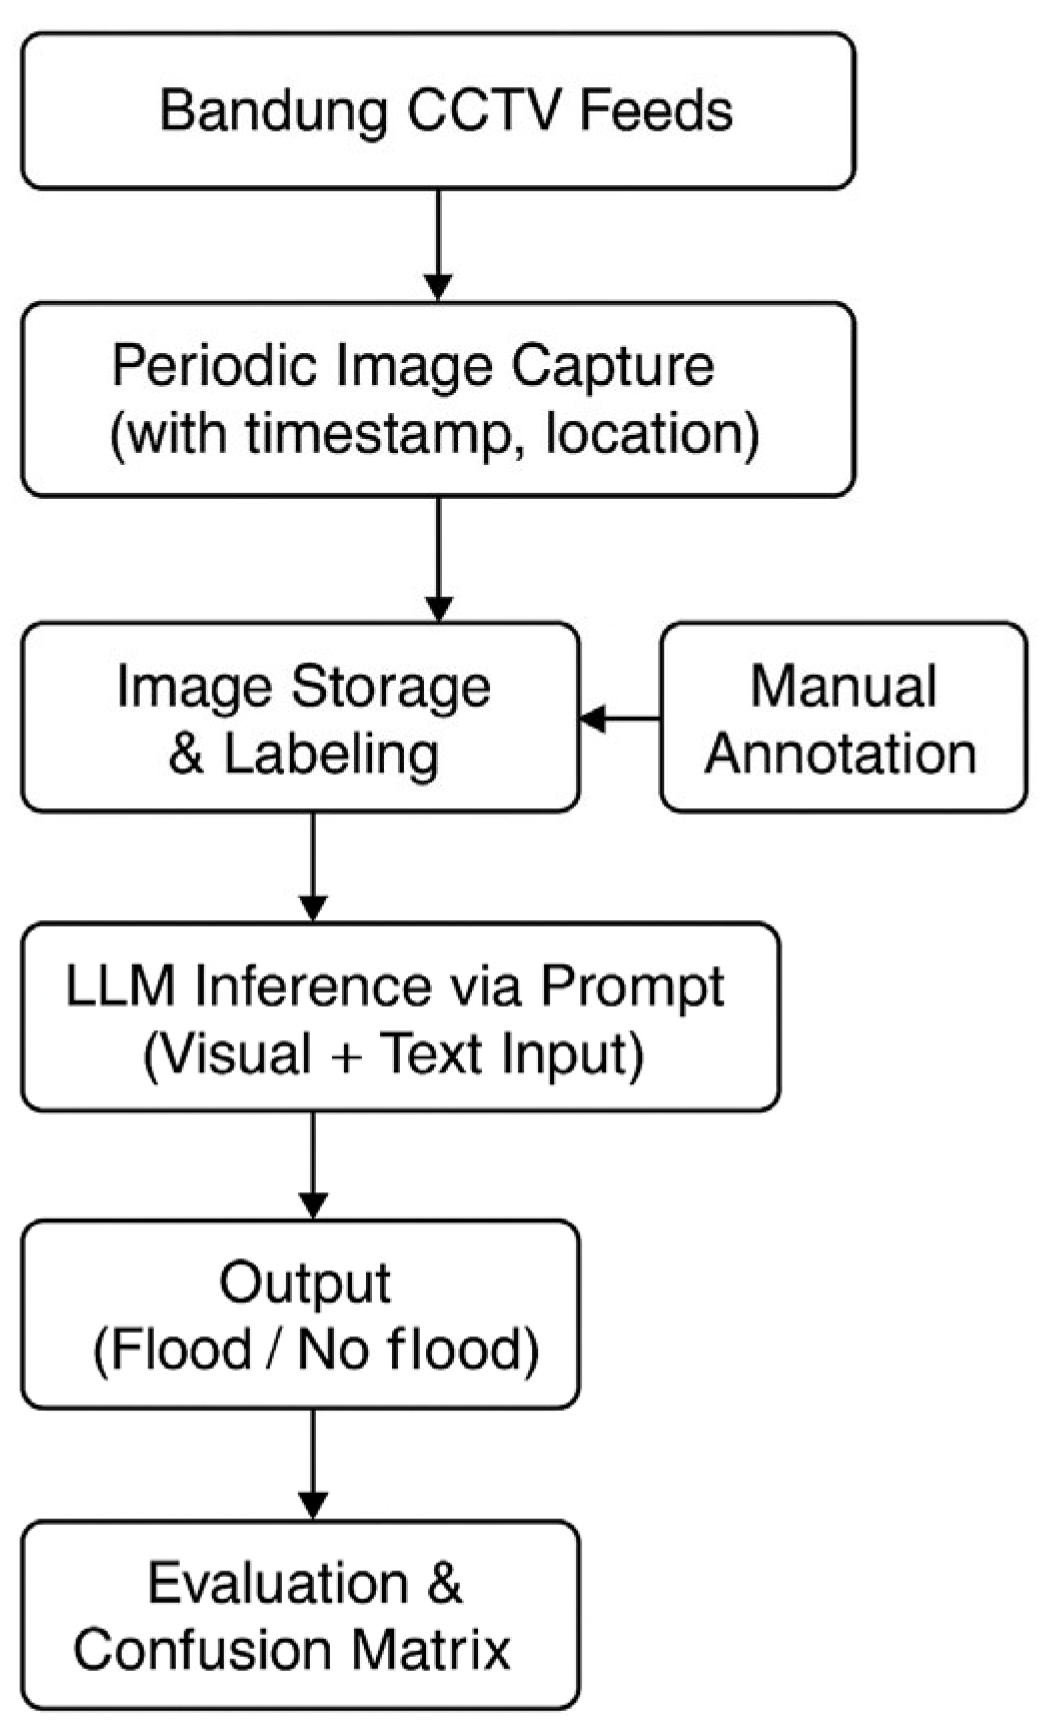
This study proposes a novel framework for urban flood detection by leveraging open-access CCTV data in combination with the visual recognition capabilities of multimodal LLMs. The method comprises three steps: image acquisition, manual labeling, and LLM-based prediction. Each step is designed to ensure a scalable, low-overhead approach suitable for real-world urban flood surveillance in data-constrained environments.
The general overall workflow of this model can be seen in the Figure 3.
  • Step 1. Image Acquisition from Open-Access CCTV
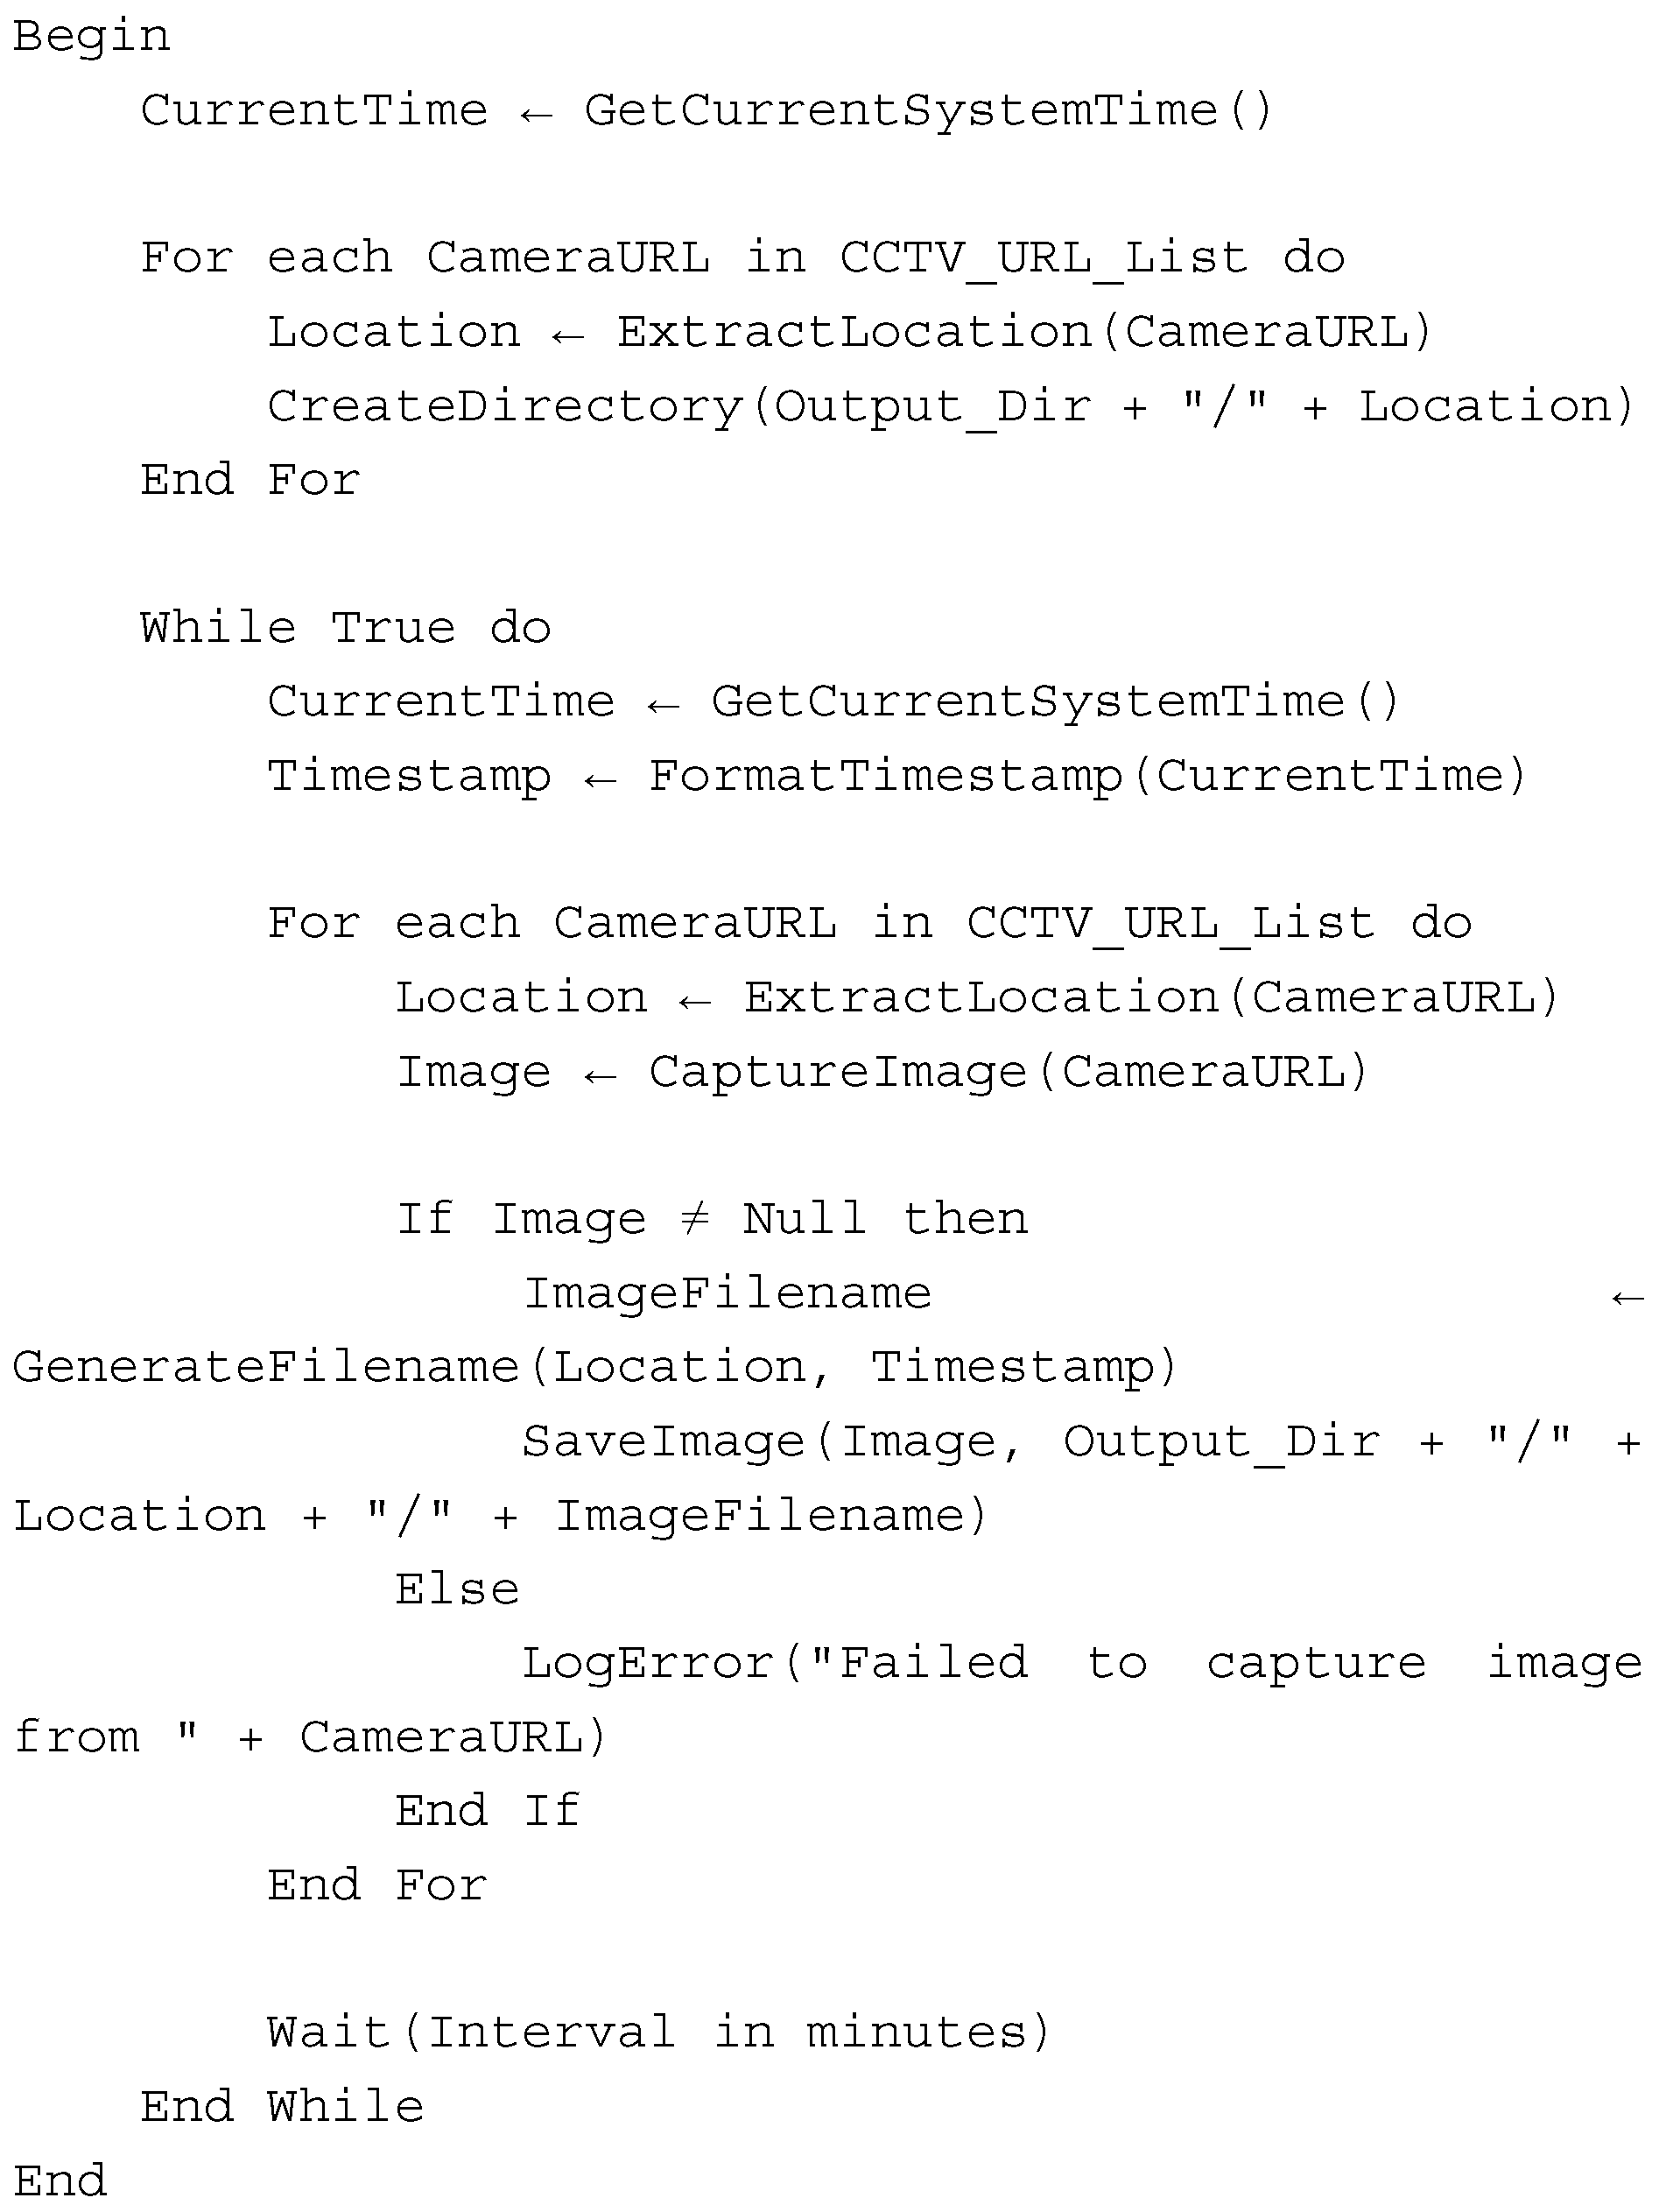
The first stage involves collecting visual data from publicly accessible CCTV feeds operated by the city of Bandung, Indonesia. These feeds are available through the online municipal monitoring portal, https://pelindung.bandung.go.id/ (accessed on 1 October 2023). A set of strategically selected CCTV cameras was targeted, particularly those located along flood-prone roads or intersections. At regular intervals, an HTTP request was initiated to capture still images from these feeds. For each image, metadata such as the timestamp and the geographical coordinates of the camera location were recorded. The images were then organized into a structured dataset, which served as the foundation for the subsequent analysis. Figure 4 illustrates the pseudocode used to systematically acquire images from all CCTV sources.
  • Step 2. Labeling of Visual Conditions
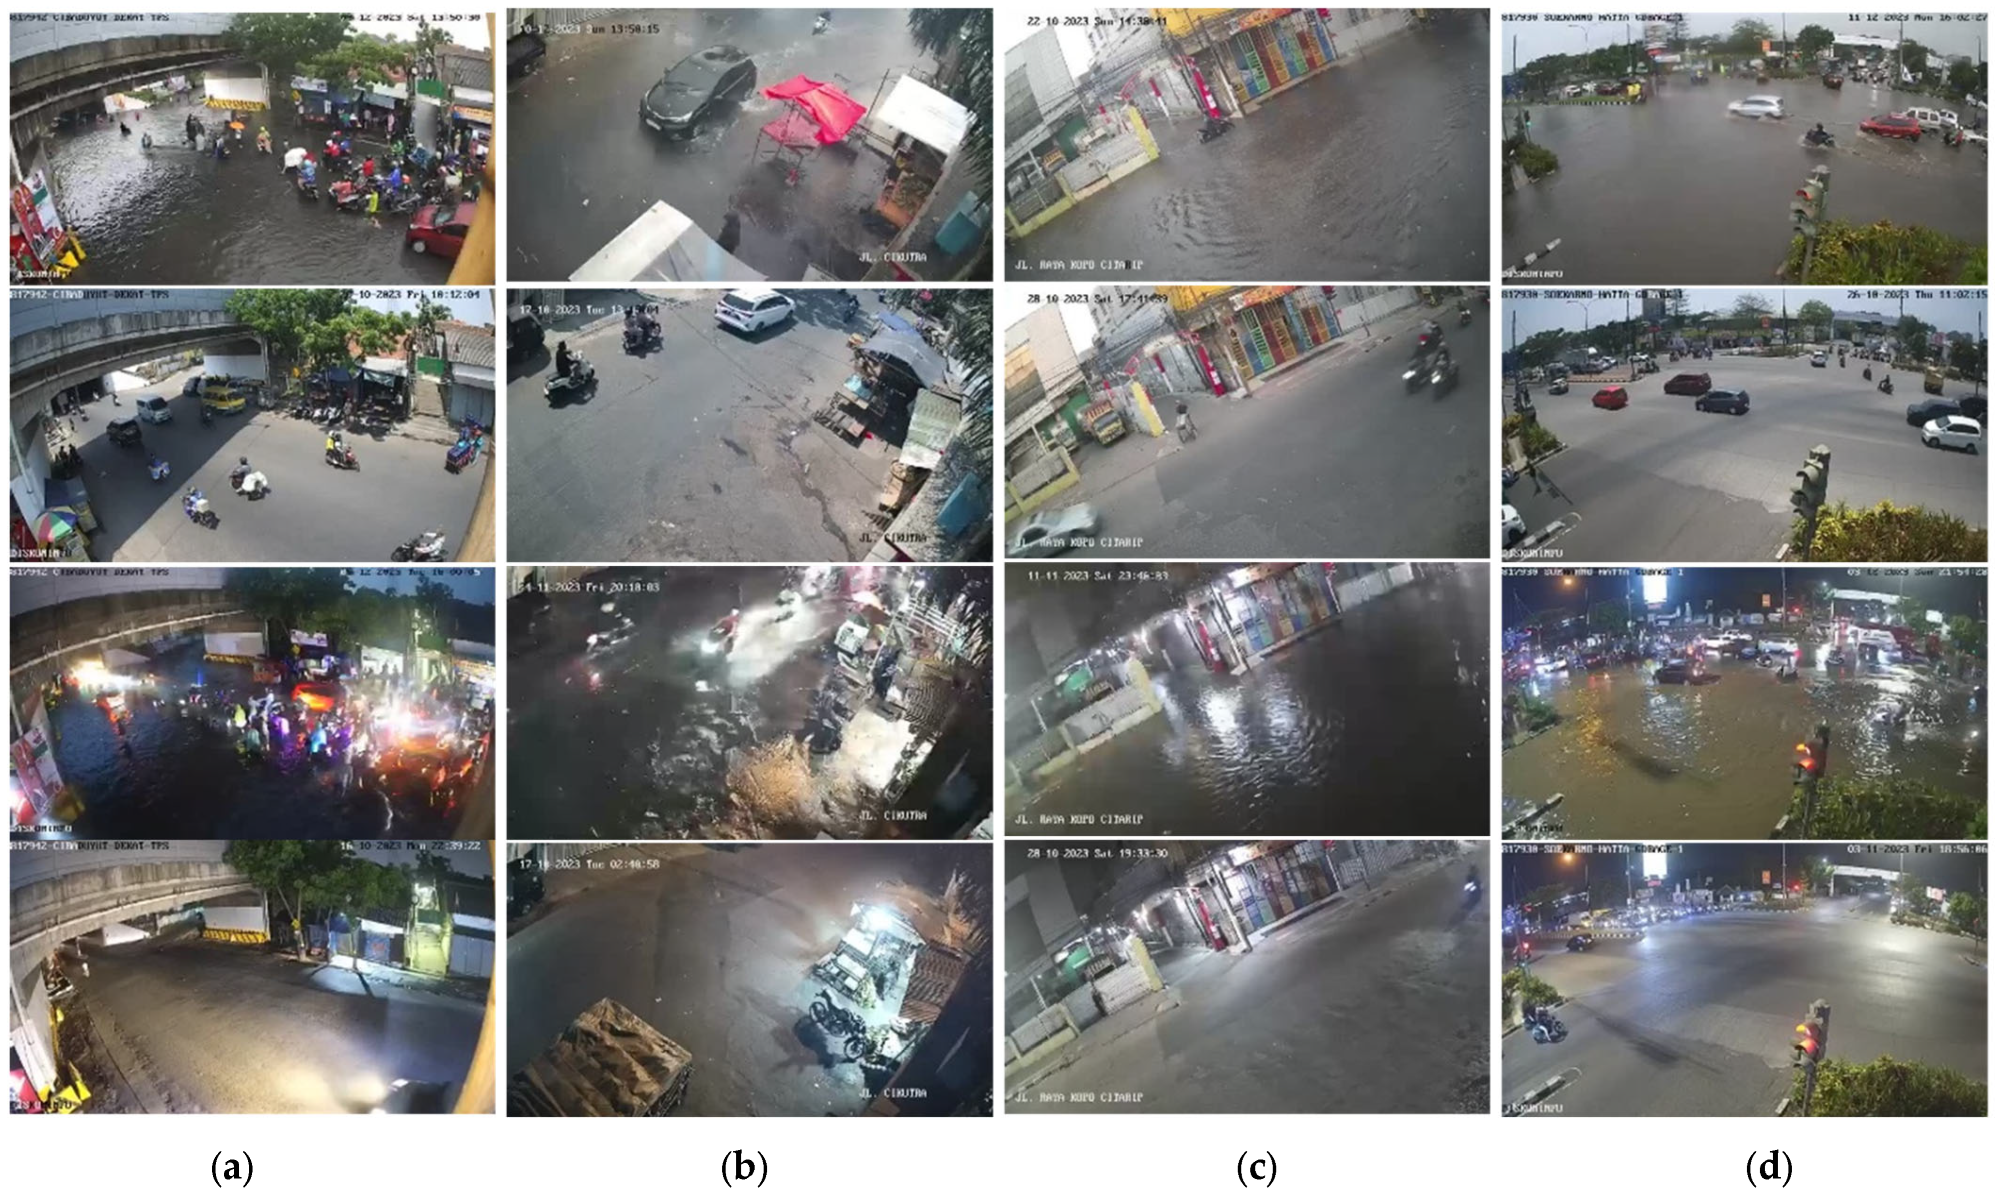
To establish a baseline for model evaluation, a manual labeling process was conducted on a representative sample of images. The dataset was curated to include four distinct environmental conditions: (1) daytime with flood, (2) nighttime with flood, (3) dry daytime, and (4) dry nighttime. Human annotators reviewed each image and assigned binary labels indicating the presence or absence of inundation. The labeling process was performed by referencing contextual visual cues such as inundated pavement, vehicle headlights reflecting on water surfaces, presence of raindrops or spray, and overall scene visibility. This manually labeled subset serves as ground truth for evaluating the performance of the LLM-based predictions.
  • Step 3. Visual Prediction using LLMs
The third step uses a prompt-based approach, where an LLM is asked to interpret flooding conditions directly from CCTV images. The CCTV data collected during the previous stage is uploaded to the LLM as visual input, accompanied by a predefined prompt written in natural language—such as “Does this image show signs of flooding?” or “Is the road flooded?” The model then generates a natural language response, which is translated into a simple binary output: flood or no flood. While this upload can be performed manually, automating the process typically requires sending requests via an Application Programming Interface (API)—a standardized protocol that allows different software systems to communicate with each other. Through the API, images and prompts can be programmatically submitted to the LLM, and responses can be retrieved automatically. It is important to note that the cost of uploading and processing images varies across different LLM platforms.
The design of the prompts in this study followed a stepwise logical framework. The first consideration was the goal of the task, which is to classify CCTV images into flood or no-flood conditions. At its most basic level, this requires only a binary decision. From this reasoning, the simple prompt was formulated, directly asking the model to decide whether flooding is present in the image. This represents the most minimal and efficient approach. However, relying solely on binary answers presents limitations. The results provide no insight into why the model made a certain decision, nor do they indicate the level of certainty behind the classification. In real-world flood monitoring, such information can be valuable for evaluating the reliability of automated detection. To address this gap, the complex prompt was designed, requiring the model to output three components in a structured JSON format: (i) a binary flood classification, (ii) a numerical confidence score between 0 and 1, and (iii) a short reasoning statement.
Therefore, for the simplified prompt, we used the following design:
Based on this road CCTV image, analyze if there is a flood or not. Just reply with a YES or NO.
And for the more complex prompt we use:
Based on this road CCTV image, analyze if there is a flood or not. Use this JSON example format:
{
      “flood”: true,
      “confidence”: 0.95,
      “reasoning”: “The road is submerged in water, indicating a flood.”
}
If there is a flood, set “flood” to true; otherwise, set it to false. The “confidence” should be a float between 0 and 1, indicating your confidence in the prediction. The “reasoning” should be a short explanation of your decision.
For the image analysis, each CCTV frame was submitted to the model together with the designated prompt (either simple or complex). The requests were made through the standard chat/completions endpoint, with decoding parameters set to temperature = 0, and top-p = 1. In LLM, decoding parameters such as temperature and top-p strongly influence the stability of the predictions. The temperature parameter regulates how “random” the model’s outputs are: a high temperature encourages the model to explore less probable options, which can lead to varied answers, even for the same image input, while a low temperature reduces variability and makes the model’s responses more consistent. At the extreme, setting the temperature to zero makes the model always select the most likely option, ensuring stable predictions across repeated queries. Similarly, the top-p parameter (nucleus sampling) controls how much of the probability distribution is considered when generating outputs. A smaller top-p value restricts the choice to only the most likely tokens, while higher values expand the selection. Setting top-p = 1 means the model considers the full distribution without truncation, allowing the decision-making process to fully rely on the temperature setting.
In the context of this study, we intentionally set temperature = 0 and top-p = 1 across all LLMs. This combination reduces the effect of randomness in classification and ensures that the same image input yields consistent outputs. For flood detection tasks, this stability is important because the goal is to evaluate how well the models can distinguish flooded versus non-flooded scenes, not to assess the diversity of their possible answers. Choosing these values also helps highlight the effect of prompt design rather than causing confounding through variability in the decoding process. For example, if the temperature were set higher, the same CCTV frame could be labeled differently across repeated runs, introducing uncertainty unrelated to the underlying model capability. By fixing temperature = 0 and top-p = 1, the experimental results directly reflect the strengths and limitations of the models and prompts under evaluation.
While traditional object detection models have proven effective for visual flood detection tasks, the decision to use LLMs in this study is motivated by several key advantages. First, multimodal LLMs support zero-shot classification using natural language prompts, which eliminates the need for training labeled datasets or fine-tuning. Second, the urban flood scenes captured by city-wide CCTV cameras exhibit significant variability in scale, viewing angle, and object occlusion conditions under which bounding-box-based object detectors may require extensive retraining and adaptation. Third, LLMs provide high flexibility in design through prompt engineering. Additional tasks—such as accident detection or traffic congestion analysis—can be incorporated simply by extending the output prompt (e.g., by adding keys like “is_there_accident” or “is_traffic_jam” to a JSON response), without any changes to the model weights or structure. Traditional object detection pipelines, by comparison, would require new datasets, retraining, and re-optimization for each added task. Thus, although object detection methods may be more efficient for well-defined tasks with consistent visual features, this study focuses on evaluating LLMs as a lightweight and adaptive alternative for scalable urban flood monitoring.

2.4. Objective Functions

In this study, the F1 score is employed as the primary objective function to evaluate the performance of the LLM in predicting a flood event from visual imagery. Since flood classification from images often involves imbalanced datasets—where flooded areas may occupy only a small fraction of the total region—the F1 score offers a more informative and balanced metric compared to overall accuracy [25,32]. The F1 score could be defined as
F 1   S c o r e = 2 × P r e c i s i o n × R e c a l l P r e c i s i o n + R e c a l l
P r e c i s i o n = T P T P + F P
R e c a l l = T P T P + F N
where TP (true positive) denotes the number of flood images that are correctly identified as flood, FP (false positive) denotes the number of non-flood images that are incorrectly classified as flood, and FN (false negative) denotes the number of flood images that are incorrectly classified as non-flood.
The F1 score is a widely adopted performance metric that balances precision and recall, which is particularly useful in binary classification tasks where class imbalance may be present. In the context of flood prediction, it quantifies the model’s ability to correctly identify flooded and non-flooded images. The value of the F1 score ranges from 0 to 1, where 1 indicates perfect precision and recall, and 0 represents complete misclassification. In practical applications, an F1 score above 0.90 is considered excellent, indicating highly accurate predictions. Scores between 0.80 and 0.90 are regarded as good, while scores in the range of 0.70 to 0.80 are generally acceptable for early-stage models or under conditions with limited data quality. Values below 0.70 suggest that the model may require further refinement, either through additional data, improved feature engineering, or alternative model architectures.

3. Results

3.1. Overall Accuracy

As described in Section 2, we collected CCTV image data from 340 locations over a 365-day period at 15 min intervals. From this dataset, the images were categorized using four labels: flood—day, flood—night, no flood—day, and no flood—night. Although the CCTV network consists of 340 observation points, not all locations experienced flooding during the study period, and the frequency and intensity of flooding at many sites were relatively low. As a result, not all CCTV locations were suitable for inclusion in the accuracy testing, as the number of usable flood images at these points was insufficient. Based on the sorting process, we identified eight locations with relatively high flood frequency and intensity that were suitable for analysis. We tested the LLMs using labeled images captured at these eight locations, selecting 100 images for each label category. In total, 3200 images were used in this evaluation to assess model performance. Figure 5 presents several examples of images that were sorted according to the labeling criteria at different locations.
In the initial phase of this study, four LLMs were used: ChatGPT, Gemini, Mistral, and DeepSeek. The selected models were chosen because they can process images and text, as well as for their market visibility. Table 1 presents the specifications of the LLMs used in this study. The models evaluated include OpenAI GPT-4.1., Gemini 2.5 Pro, Mistral Pixtral Large, and DeepSeek Janus. Each model differs in size, as indicated by the number of parameters, ranging from approximately 124 billion parameters in Mistral Pixtral Large to an estimated 1.76 trillion parameters in GPT-4.1 and Gemini 2.5 Pro. It should be noted that the exact number of parameters for GPT-4.1 and Gemini 2.5 Pro remains undisclosed by their developers; the figures presented here are estimates based on their reported performance relative to prior models with known sizes.
The LLMs employed in this study are multimodal models, capable of jointly processing visual and textual inputs. Upon receiving a CCTV image, these models utilize an internal vision encoder—typically based on transformer or convolutional architectures—to extract spatial and object-level features from the image. These features are subsequently integrated into the language reasoning component of the model, which interprets them in conjunction with prior learned knowledge, including common flood indicators and contextual visual patterns associated with urban street environments. It is important to emphasize that the specific internal architectures and training mechanisms of these models are not publicly disclosed, as they are proprietary. Consequently, this study does not seek to analyze the models’ internal structures in detail. Rather, the focus lies on evaluating their practical performance for flood detection using visual data, particularly in terms of accuracy, computational cost, and responsiveness under different prompt formulations and image conditions.
Table 2 shows the results of the accuracy analysis for each LLM in predicting floods from CCTV images. Note that in this part of the analysis, the complex prompts were used. As previously mentioned, the performance metric used for this comparison is the F1 score, as stated in Equation (1), which is referred to as accuracy in the table. Among the models tested, GPT-4.1 achieved the highest accuracy of 85.06%, followed closely by Gemini 2.5 Pro at 84.13%. Mistral Pixtral Large and DeepSeek Janus attained accuracies of 83.22% and 79.18%, respectively. In terms of processing speed per image, it was comparable across models, with GPT-4.1 and Gemini 2.5 Pro requiring approximately 3 s per image, DeepSeek JANUS averaging 2 s, and Mistral Pixtral Large performing the fastest at 1 s per image.
Further analysis showed significant differences in average expenses per image when using the evaluated LLMs. Among these four models, DeepSeek JANUS provided the most cost-effective solution, with an average cost of approximately USD 0.0019 per image. Gemini 2.5 Pro also offered a relatively low cost at around USD 0.0047 per image, slightly lower than that of OpenAI GPT-4.1, which incurred a cost of about USD 0.005 per image. In contrast, Mistral Pixtral Large resulted in the highest average cost per image, at approximately USD 0.0067. These results highlight the trade-offs between cost and model performance, where larger or more complex models are not always the most economical options. The cost figures were obtained by averaging the cost of the processing of standardized images (600 × 360 pixels) across 100 images for each category.

3.2. Various Image Setting Analyses

In the initial evaluation, we compared four different LLMs based on their overall performance in classifying flood and non-flood images, without distinguishing between daytime and nighttime conditions. Among these models, ChatGPT (GPT-4.1) demonstrated the highest F1 score, achieving an overall accuracy of 85.06%, indicating its superior capability for general flood classification tasks.
Building on this result, we conducted a more detailed analysis focused specifically on different variants of the GPT-4.1 architecture to explore potential trade-offs between model size, cost, and performance under varying lighting conditions. We evaluated the full-sized GPT-4.1, as well as its smaller counterparts, GPT-4.1-mini and GPT-4.1 nano, using the same dataset and classification protocol. In this phase, the flood image classification results were disaggregated into daytime and nighttime categories to assess how lighting conditions influence model accuracy.
Table 3 summarizes the classification performance of three GPT-4.1 model variants—GPT-4.1 nano, GPT-4.1-mini, and the full-sized GPT-4.1—under different image settings (day and night), along with their corresponding average inferred cost per image. The results indicate that image lighting conditions play a significant role in model accuracy, with all models performing substantially better for daytime images compared to nighttime images. For instance, the full GPT-4.1 model achieved the highest accuracy during the day, at 96.79%, whereas its accuracy dropped to 73.32% at night. A similar trend is observed in the GPT-4.1 mini and nano variants, with daytime accuracy reaching 95.53% and 91.28%, respectively, while nighttime accuracy fell to 72.98% and 69.72%. When evaluating overall accuracy, the full GPT-4.1 model maintained the best performance (85.06%), followed by GPT-4.1-mini (84.26%) and GPT-4.1 nano (80.50%). However, this improved performance comes with a higher computational cost. The average cost per image inference for GPT-4.1 is approximately USD 0.005, while the more compact GPT-4.1-mini and GPT-4.1 nano are considerably cheaper at USD 0.0026 and USD 0.00068, respectively.
These findings reveal a clear trade-off between model complexity, cost-efficiency, and prediction accuracy. While the full GPT-4.1 model offers the best overall and daytime performance, the mini and nano versions present viable alternatives in scenarios where computational resources or operational costs are constrained. For city-wide deployments involving hundreds of cameras with high-frequency image capture, this cost difference becomes a critical factor. Therefore, in cost-sensitive scenarios or for edge computing applications, GPT-4.1 nano offers a compelling balance, particularly when monitoring during daylight hours.
Moreover, smaller models require less bandwidth, storage, and computational overhead, which simplifies deployment on local servers or low-power devices. This trade-off between performance and cost enables stakeholders (e.g., municipal agencies or disaster management units) to tailor the solution to specific budget and infrastructure constraints.

3.3. Detailed Prompt Analysis

In this subsection, we investigate whether the complexity of the prompt affects the flood classification accuracy of the LLMs. In the previous evaluation (Section 3.1), the models were tested using a structured prompt that required a detailed JSON-formatted output, including binary classification (flood or no flood), confidence score, and brief reasoning. To evaluate the model’s sensitivity to prompt structure and response format, a simplified version of the prompt was tested in this section. By comparing model performance across these two prompt styles, we aim to understand whether reducing the prompt complexity—thereby reducing cognitive or processing demand on the model—affects its classification accuracy. This analysis is particularly relevant for practical deployments, where simpler prompts may reduce latency and cost and prove more robust in lightweight environments.
Table 4 compares the classification accuracy of three GPT-4.1 model variants when tested with two different prompt styles. The full-sized GPT-4.1 model achieved an accuracy of 78.94% with the simplified prompt and 85.06% with the detailed type. Similar improvements were observed in the smaller variants: GPT-4.1-mini improved from 75.23% to 84.26% and GPT-4.1 nano from 72.69% to 80.50%. Interestingly, the improvement in accuracy does not come at a significant computational cost. The additional text token cost incurred by the detailed prompt is minimal compared to the accuracy gain. For example, in the GPT-4.1 nano model, the accuracy improved by approximately 10%, while the cost increased by only around USD 0.00001 per image, or USD 1 for every 100,000 images. Moreover, there was no observable change in response time, making the detailed prompt not only more effective but also practical and efficient.

4. Discussion

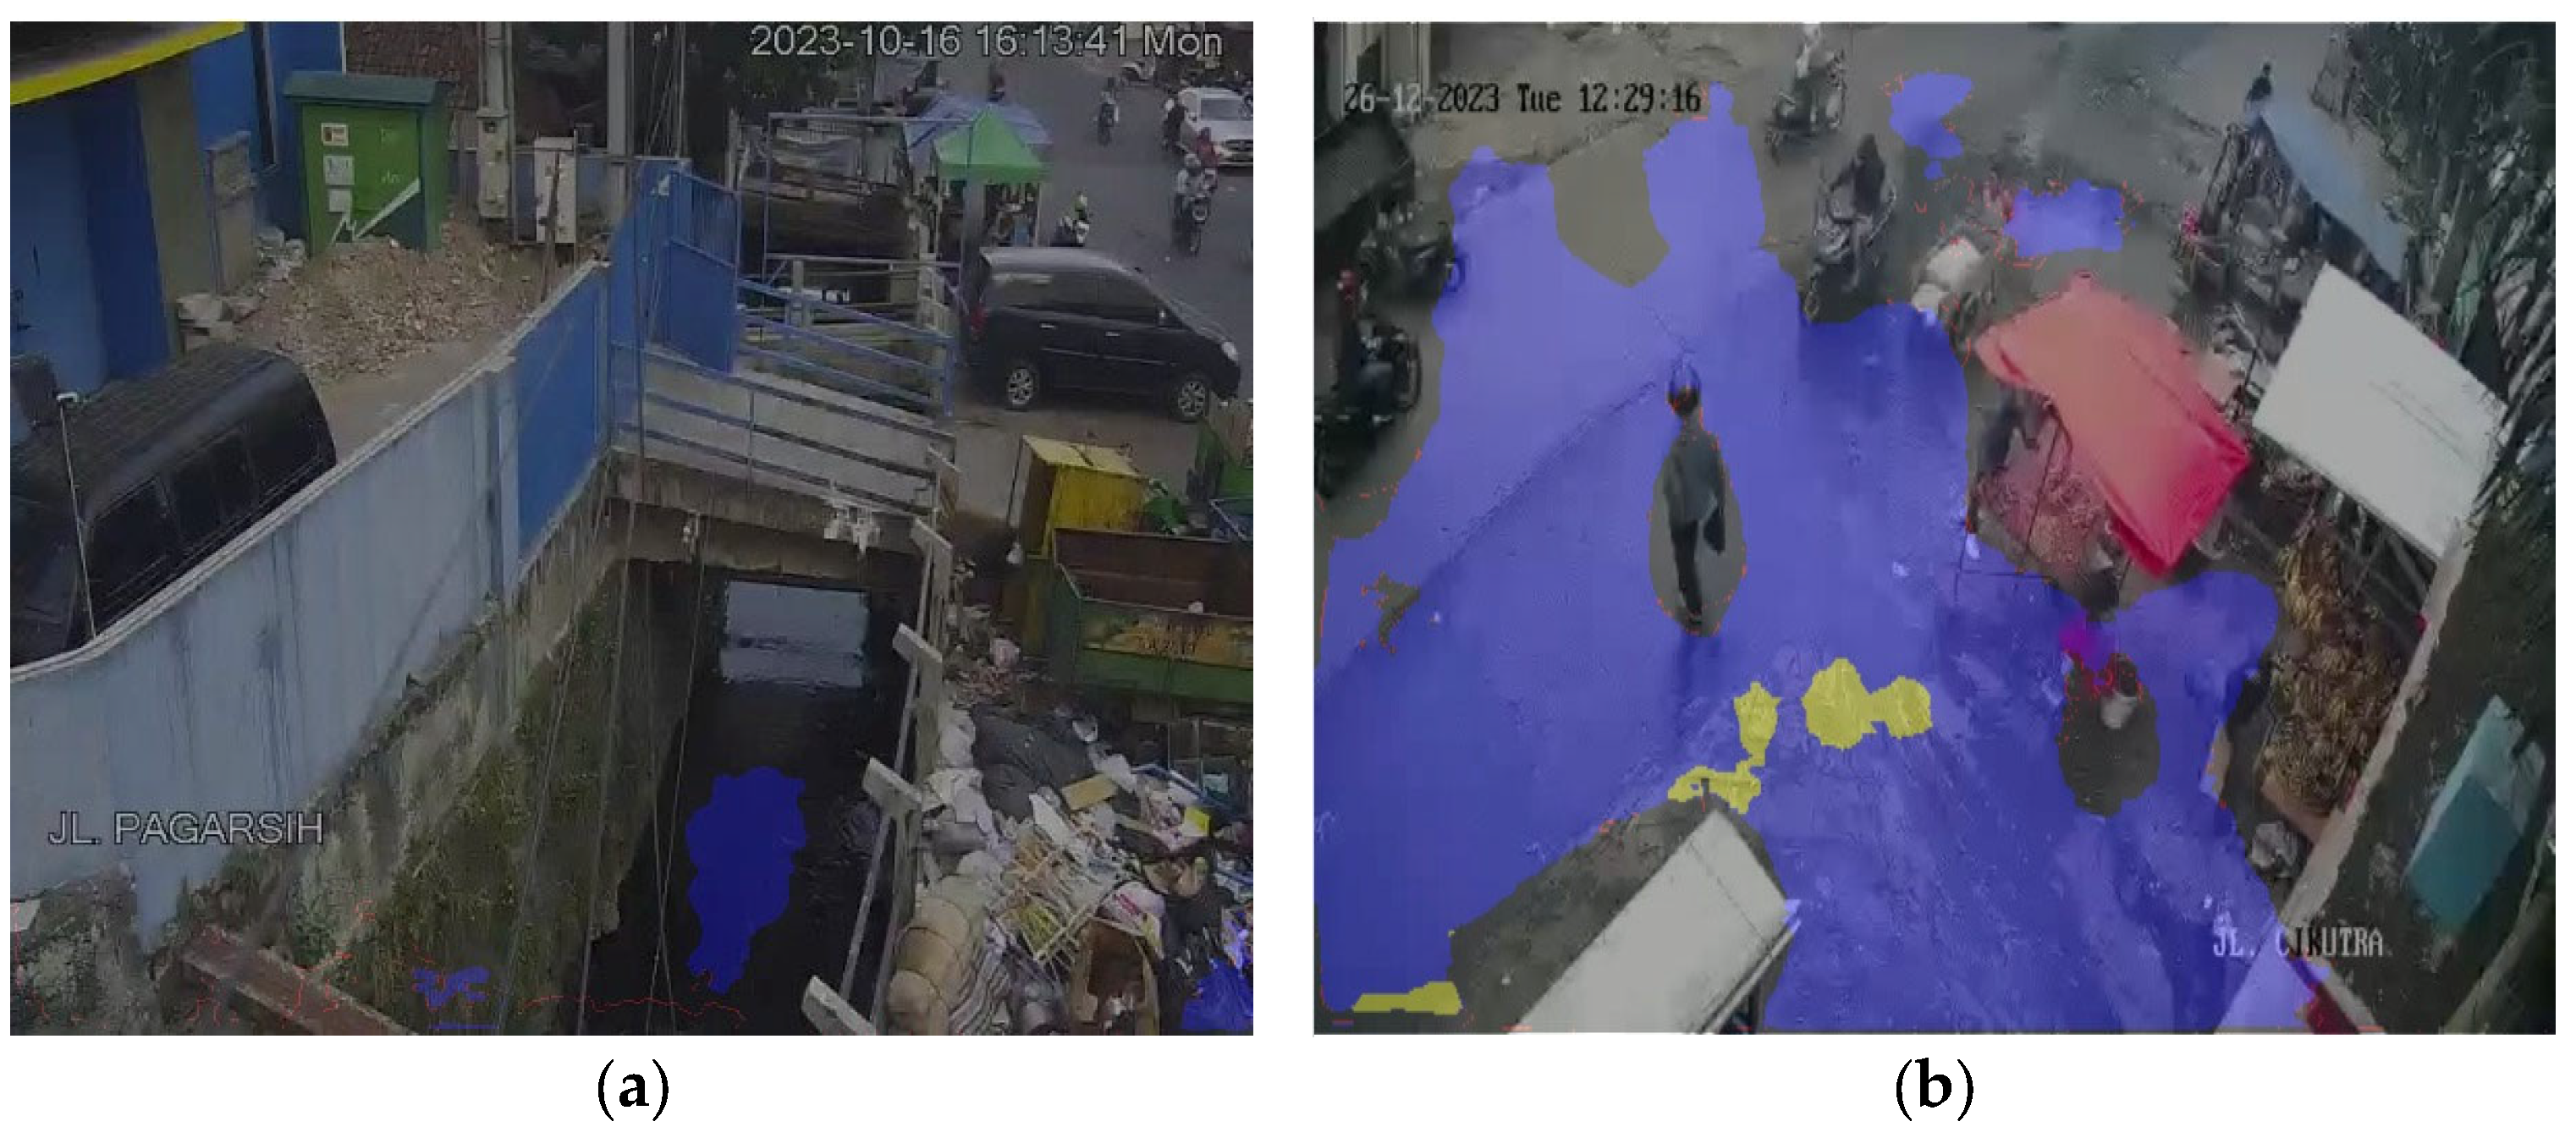
As part of a preliminary comparison, we are using DeepLabv3+, a benchmark deep learning image segmentation model, to assess its applicability for flood detection from CCTV images. The DeepLabv3+ model was trained on the flood image segmentation dataset [37], which was specifically designed to address the challenges of classifying heterogeneous flood-related scenes. This dataset includes five distinct semantic classes: background, dry regions (annotated in red), environment, flood areas (annotated in blue), and wet surfaces (annotated in yellow). By incorporating both hydrological features (flood, wet, dry) and contextual surroundings (environment, background), the dataset enables the model to learn nuanced spatial and spectral differences essential for accurate flood mapping.
While DeepLabv3+ demonstrated strong performance in segmenting water pixels, it frequently produced misclassifications when applied to real-world urban scenes. This difference is further illustrated in Figure 6, where DeepLabv3+ incorrectly identified the water within the drainage channel as flooding, and the wet road surface as flooded. The LLM, in this case, ChatGPT 4.1., not only classified the image as “no flood”, with high confidence (0.90), but also provided a reasoning output: “The water level in the canal is normal and below the bridge, and the road appears dry and clear of water” for Figure 6a, and “The road appears wet but not submerged; there is no visible standing water indicating a flood” for Figure 6b. These examples highlight the advantage of LLMs in combining visual recognition with contextual reasoning. Rather than relying solely on pixel-level water detection, the LLM understood the spatial relationship between the canal, the bridge, and the road surface, thereby avoiding a false positive flood classification. Such reasoning capability demonstrates how LLMs can reduce misinterpretations that are common in conventional segmentation-based methods.
It should be noted that models such as DeepLabv3+ are computationally efficient once trained and can achieve high accuracy for well-defined tasks. However, they require large annotated datasets and fine-tuning to generalize effectively across new urban environments. By contrast, LLMs achieve comparable or better robustness without retraining, relying instead on prompt-based zero-shot classification. This trade-off underscores the unique value of LLMs for data-scarce urban settings, where collecting and labeling extensive flood imagery is often impractical. While more comprehensive benchmarking with multiple deep learning models (e.g., ResNet, EfficientNet) could further extend this analysis, our preliminary findings suggest that LLMs provide clear advantages in terms of flexibility, contextual accuracy, and scalability for urban flood monitoring. Of course, the comparison between conventional deep learning models and LLMs in this study is still limited, and a more comprehensive evaluation will be conducted in future work.

4.1. Challenges

The developed system was tested by collecting images through various CCTV feeds in Bandung City. Over the course of 365 days of continuous operation, several challenges were encountered in acquiring flood-related images and footage. The first issue involved connectivity problems, where CCTV cameras at several locations became temporarily inaccessible. This could be attributed to various causes, such as physical damage to the cameras (e.g., severed cables or impacts from falling objects) or unstable internet connections, particularly during periods of extreme rainfall. These disruptions varied in duration, lasting from a few hours to several days depending on the severity and underlying cause.
The second issue stemmed from the multipurpose nature of the CCTV infrastructure. Since these cameras are also used for traffic monitoring and public safety, their placement is often not optimized for flood detection. Many cameras are positioned discreetly, resulting in frequent visual occlusions from nearby objects such as cables, signage, or trees. The third challenge concerns the inconsistent quality of images captured by different CCTV units. Not all cameras are manufactured or maintained to the same technical standards, leading to substantial variation in image clarity. This issue is often compounded by the two previously mentioned factors—poor placement and unstable connectivity—which further degrade the footage quality. For example, in locations with suboptimal positioning, heavy rainfall may strike the camera lens directly, causing the images to appear blurry or distorted. This problem becomes especially severe at night, when vehicle headlights reflect off water droplets on the lens surface, reducing visibility and complicating scene interpretation.
To illustrate the practical implications of these challenges on model performance, Table 5 presents representative examples of both success and failure cases across all evaluated LLMs. The images are grouped into two categories: standard cases and hard cases. The standard cases consist of images with sufficient clarity under normal conditions, evenly distributed across the four labeling classes: flood—day, no flood—day, flood—night, and no flood—night. In these cases, all LLMs generally performed well, although minor misclassifications were observed—for instance, GPT-4.1 nano occasionally failed to correctly identify flooding in clear flood—day images.
In contrast, the hard cases highlight scenarios where visual interpretation is significantly challenged due to image obstructions, blurring, or lighting issues, all stemming from the technical limitations. Under such conditions, classification accuracy dropped markedly for all models, with frequent mispredictions observed. GPT-4.1 stood out as the most consistent performer, maintaining relatively high accuracy even under visually ambiguous inputs.

4.2. Opportunities

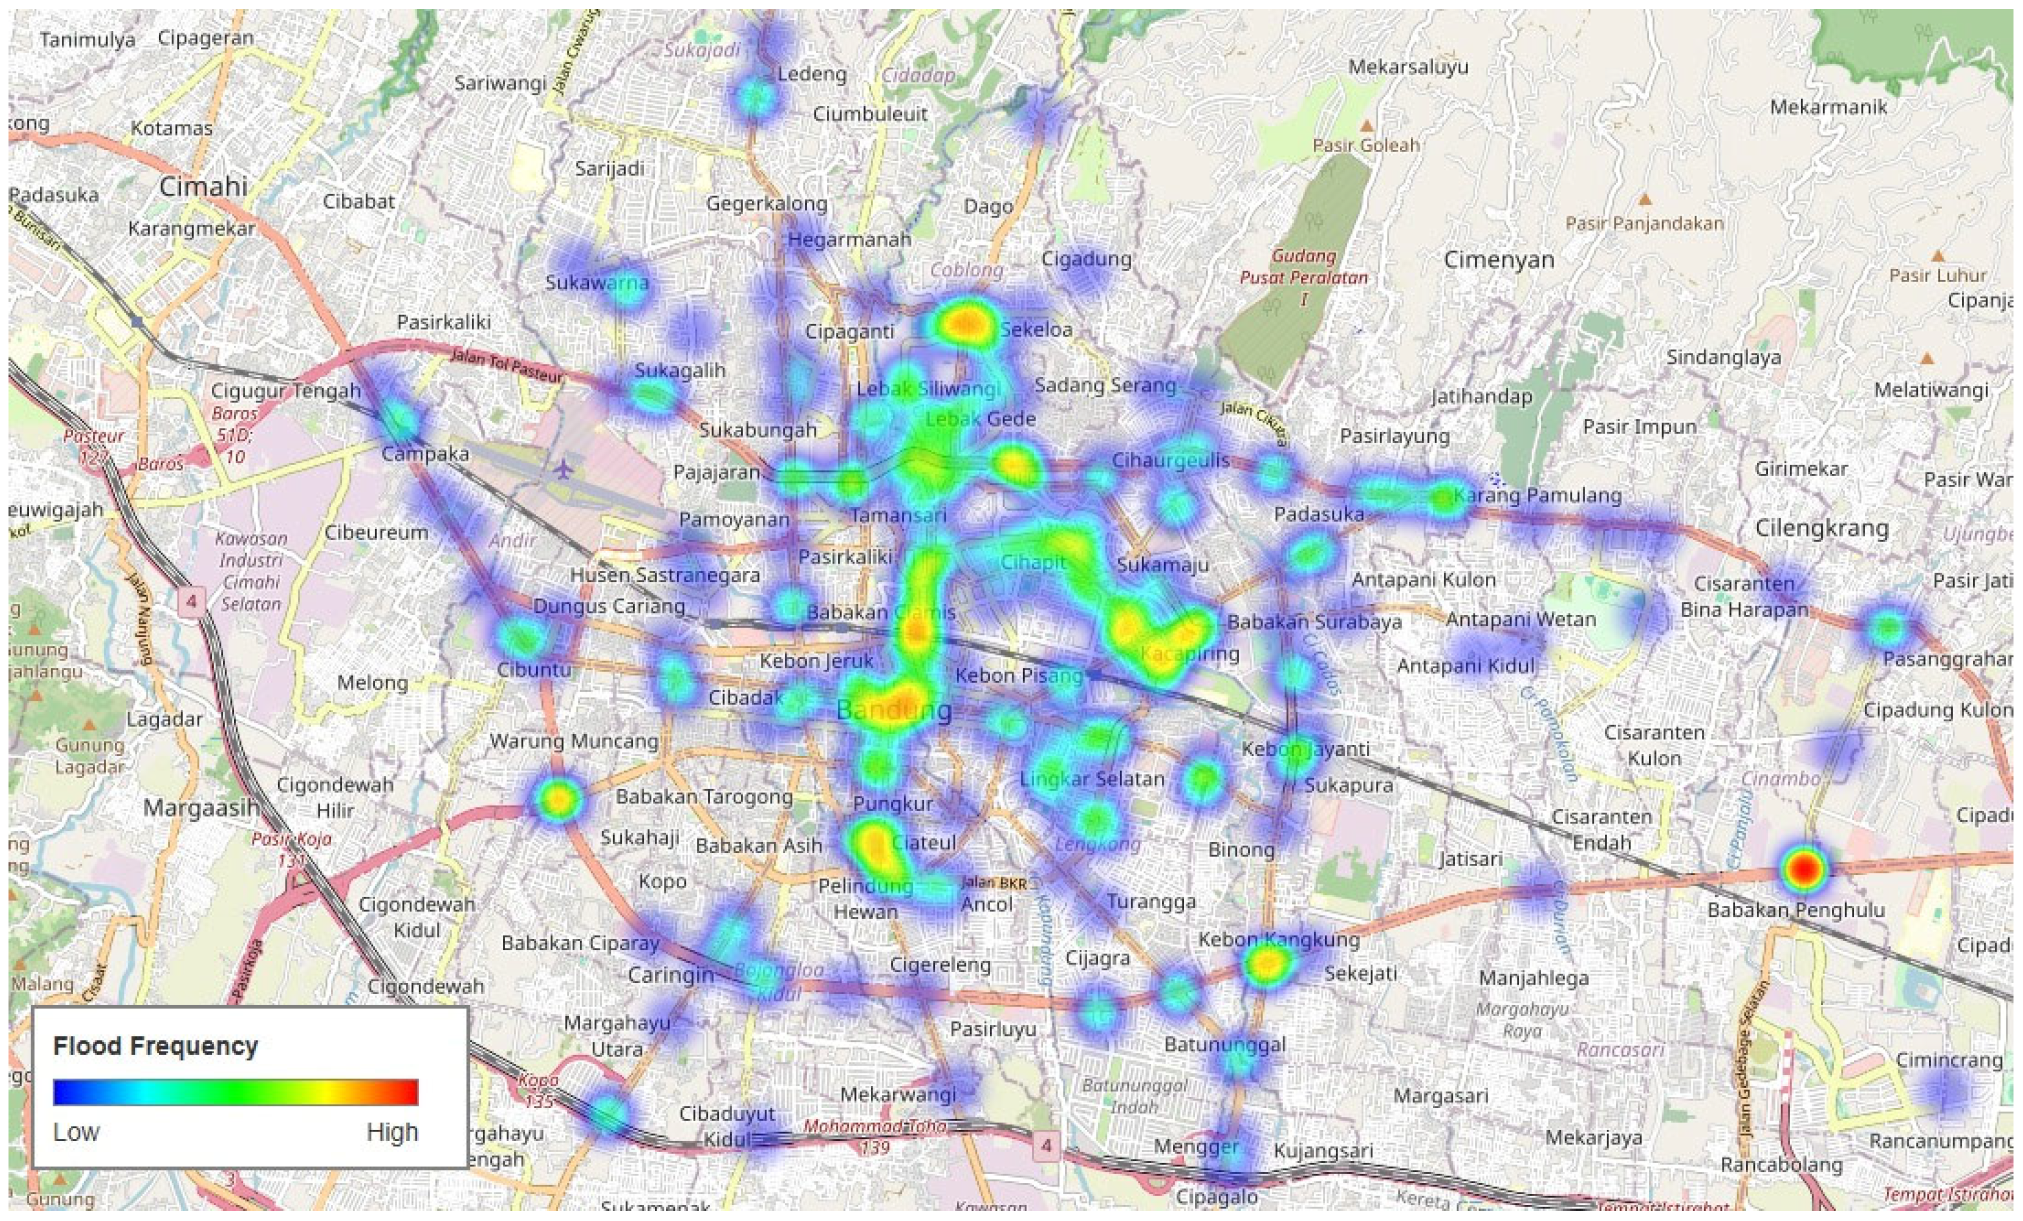
Despite the current limitations, the system developed in this study presents several promising opportunities. First, although the system currently only classifies images as either “flooded” or “not flooded”, it can still serve as a useful validation source for urban flood models. While the estimation of water depth using LLMs has not been tested in this study, the binary outputs provide valuable spatiotemporal data regarding flood presence and duration. From this information, it is possible to estimate the persistence of surface flooding at specific locations over time. An example of this potential is illustrated in the generated heat map, see Figure 7, which was produced using image classification results from 340 CCTV points across the study area. The heat map reflects the frequency of flood detections over the monitoring period. Although this frequency does not represent distinct flood events, but rather the total number of flood-labeled images, it still provides insights into spatial flood exposure and identifies locations that are frequently inundated. It is important to acknowledge that the accuracy of the LLM used in this process is approximately 85%, leaving a 15% margin of classification error. Therefore, the current heat map should be considered a preliminary representation, subject to refinement through improved model accuracy and future validation efforts. The flood occurrence information derived from CCTV classification results provides several practical benefits. First, it enables decision makers to quickly identify areas that are frequently inundated, thereby supporting more effective flood response and resource allocation. Second, the spatial and temporal patterns revealed by this information can serve as valuable input for the calibration and validation of hydrodynamic or flood forecasting models, particularly in data-scarce urban environments. Third, by leveraging existing CCTV infrastructure, the information enhances situational awareness and supports continuous urban flood monitoring without the need for costly new sensor deployments.
Second, the system’s use of LLMs introduces an adaptable and scalable approach but also brings with it variability in both performance and operational cost. For example, based on current API pricing, the average cost of processing a single image with ChatGPT 4.1. is approximately USD 0.005. Operating the system at 15 min intervals across 340 CCTV locations for an entire year would require around USD 59,568—an amount that may be considered significant for certain government agencies or institutions in developing countries. However, the rapid advancement of AI technologies is expected to bring more affordable and efficient solutions in the near future. As competition among LLM providers increases, future models are likely to offer higher accuracy at significantly lower cost. One potential alternative is the use of compact LLMs, such as GPT-4 nano, which are approximately seven times cheaper (estimated at ~USD 8000 per year for the same scale) and have demonstrated performance comparable to that of the standard ChatGPT-4.1 for flood classification tasks.
Third, in this study, the maximum accuracy achieved was about 85%. Fine-tuning the models for specific regions could be one way to increase reliability, but at the current stage, such an effort would be premature, as region-specific datasets are not yet sufficient. For now, fine-tuning would bring little benefit compared to its cost, but it remains an important consideration for future research once more comprehensive local datasets become available. Finally, maintaining a consistent internet connection or power supply can be a concern during extreme weather events such as typhoons and thunderstorms. This issue can be mitigated by implementing a backup power system or deploying a standalone LLM setup on-site.

5. Conclusions

This study introduced a prompt-based flood detection framework that combines open-access CCTV imagery with the visual reasoning capabilities of LLMs. The system was tested over a one-year period using data from 340 CCTV locations, demonstrating the feasibility of using language models to classify flood conditions without requiring model retraining or labeled datasets. With an average classification accuracy of approximately 85%, the system can generate real-time binary flood alerts and spatial heatmaps, offering valuable information for early warning systems and acting as a supporting tool for validating urban flood models.
Although the system encountered several challenges such as unstable internet connections, less-than-ideal camera placement, and poor image quality during heavy rain, it offers meaningful opportunities. One of the key advantages is the ability to generate flood exposure heatmaps across a large area, allowing for the identification of locations that are frequently affected by surface flooding. In addition, the flexible use of different LLMs—each with varying levels of performance and cost—makes the system adaptable to a wide range of use cases, including those with limited resources.
Feeding a series of images into the model may help improve classification accuracy, although this approach could reduce processing speed and increase computational demand. This method may be best applied in situations where the model produces low confidence scores or in combination with real-time assessments of image quality. Moreover, introducing more detailed classification levels such as dry, wet, or flooded road conditions could further enhance the model’s ability to assess situations accurately.
In conclusion, the framework presented in this study demonstrates a practical and scalable approach for monitoring urban floods using publicly available data and AI tools. As language models continue to evolve, future versions are likely to provide better performance at lower cost, which will further improve the efficiency and impact of flood monitoring systems in urban environments.

Author Contributions

Conceptualization, O.T.W., S.A. and A.B.C.; methodology, O.T.W., S.A. and A.B.C.; formal analysis, O.T.W. and S.A.; software, O.T.W. and S.A.; writing—original draft preparation, O.T.W. and A.B.C.; visualization, S.A.; writing—review and editing, O.T.W. and T.-H.Y.; funding acquisition, T.-H.Y. All authors have read and agreed to the published version of the manuscript.

Funding

This study was supported by the National Science and Technology Council of Taiwan under Research Grant MOST 113-2625-M-A49-003.

Data Availability Statement

The data that support the findings of this study are available from the corresponding author, O.T.W., upon reasonable request.

Acknowledgments

The authors would like to thank the Dinas Komunikasi dan Informatika Kota Bandung and the Bandung Command Center for the CCTV data.

Conflicts of Interest

The authors declare no conflicts of interest.

References

  1. Rincón, D.; Khan, U.T.; Armenakis, C. Flood risk mapping using GIS and multi-criteria analysis: A greater toronto area case study. Geosciences 2018, 8, 275. [Google Scholar] [CrossRef]
  2. de Moel, H.; Jongman, B.; Kreibich, H.; Merz, B.; Penning-Rowsell, E.; Ward, P.J. Flood risk assessments at different spatial scales. Mitig. Adapt. Strateg. Glob. Chang. 2015, 20, 865–890. [Google Scholar] [CrossRef] [PubMed]
  3. Chan, S.W.; Abid, S.K.; Sulaiman, N.; Nazir, U.; Azam, K. A systematic review of the flood vulnerability using geographic information system. Heliyon 2022, 8, e09075. [Google Scholar] [CrossRef]
  4. Yuan, F.; Yang, Y.; Li, Q.; Mostafavi, A. Unraveling the Temporal Importance of Community-Scale Human Activity Features for Rapid Assessment of Flood Impacts. IEEE Access 2022, 10, 1138–1150. [Google Scholar] [CrossRef]
  5. Scarpino, S.; Albano, R.; Cantisani, A.; Mancusi, L.; Sole, A.; Milillo, G. Article multitemporal SAR data and 2D hydrodynamic model flood scenario dynamics assessment. ISPRS Int. J. Geoinf. 2018, 7, 105. [Google Scholar] [CrossRef]
  6. Abedin, S.J.H.; Stephen, H. GIS framework for spatiotemporal mapping of urban flooding. Geosciences 2019, 9, 77. [Google Scholar] [CrossRef]
  7. Tamiru, H.; Dinka, M.O. Application of ANN and HEC-RAS model for flood inundation mapping in lower Baro Akobo River Basin, Ethiopia. J. Hydrol. Reg. Stud. 2021, 36, 100855. [Google Scholar] [CrossRef]
  8. Manyangadze, T.; Mavhura, E.; Mudavanhu, C.; Pedzisai, E. Flood inundation mapping in data-scarce areas: A case of Mbire District, Zimbabwe. Geo 2022, 9, e105. [Google Scholar] [CrossRef]
  9. Wijaya, O.T.; Yang, T.H. A novel hybrid approach based on cellular automata and a digital elevation model for rapid flood assessment. Water 2021, 13, 1311. [Google Scholar] [CrossRef]
  10. Wijaya, O.T.; Yang, T.H.; Hsu, H.M.; Gourbesville, P. A rapid flood inundation model for urban flood analyses. Methods X 2023, 10, 102202. [Google Scholar] [CrossRef]
  11. Lawson, T.; Rogerson, R.; Barnacle, M. A comparison between the cost effectiveness of CCTV and improved street lighting as a means of crime reduction. Comput. Environ. Urban Syst. 2018, 68, 17–25. [Google Scholar] [CrossRef]
  12. Ashby, M.P.J. The Value of CCTV Surveillance Cameras as an Investigative Tool: An Empirical Analysis. Eur. J. Crim. Pol. Res. 2017, 23, 441–459. [Google Scholar] [CrossRef]
  13. Welsh, B.C.; Piza, E.L.; Thomas, A.L.; Farrington, D.P. Private Security and Closed-Circuit Television (CCTV) Surveillance: A Systematic Review of Function and Performance. J. Contemp. Crim. Justice 2020, 36, 56–69. [Google Scholar] [CrossRef]
  14. Piza, E.L.; Welsh, B.C.; Farrington, D.P.; Thomas, A.L. CCTV surveillance for crime prevention: A 40-year systematic review with meta-analysis. Criminol. Public Policy 2019, 18, 135–159. [Google Scholar] [CrossRef]
  15. Leem, Y.; Lee, S.H.; Yoon, J. Linking Data and Converging Systems for Smarter Urban Services: Two Cases of U-City Service in Korea. Procedia Environ. Sci. 2014, 22, 89–100. [Google Scholar] [CrossRef]
  16. Hadi, M.; Shen, L.; Zhan, C.; Xiao, Y.; Corbin, S.; Chen, D. Operation data for evaluating benefits and costs of advanced traffic management components. Transp. Res. Rec. 2008, 2086, 48–55. [Google Scholar] [CrossRef]
  17. Bhokarkar Vaidya, R.; Kulkarni, S.; Didore, V. Intelligent transportation system using IOT: A Review. Int. J. Res. Trends Innov. 2021, 6, 80–87. [Google Scholar]
  18. Rezaei, M.; Azarmi, M.; Mohammad Pour Mir, F. 3D-Net: Monocular 3D object recognition for traffic monitoring. Expert Syst. Appl. 2023, 227, 120253. [Google Scholar] [CrossRef]
  19. Chen, J.F.; Liao, Y.T.; Wang, P.C. Development and Deployment of a Virtual Water Gauge System Utilizing the ResNet-50 Convolutional Neural Network for Real-Time River Water Level Monitoring: A Case Study of the Keelung River in Taiwan. Water 2024, 16, 158. [Google Scholar] [CrossRef]
  20. Park, D.S.; You, H. A Digital Twin Dam and Watershed Management Platform. Water 2023, 15, 2106. [Google Scholar] [CrossRef]
  21. Lin, Y.-B.; Lee, F.-Z.; Chang, K.-C.; Lai, J.-S.; Lo, S.-W.; Wu, J.-H.; Lin, T.-K. The Artificial Intelligence of Things Sensing System of Real-Time Bridge Scour Monitoring for Early Warning during Floods. Sensors 2021, 21, 4942. [Google Scholar] [CrossRef]
  22. Krzhizhanovskaya, V.V.; Shirshov, G.S.; Melnikova, N.B.; Belleman, R.G.; Rusadi, F.I.; Broekhuijsen, B.J.; Gouldby, B.P.; Lhomme, J.; Balis, B. Bubak, Flood early warning system: Design, implementation and computational modules. Procedia Comput. Sci. 2011, 4, 106–115. [Google Scholar] [CrossRef]
  23. Muhadi, N.A.; Abdullah, A.F.; Bejo, S.K.; Mahadi, M.R.; Mijic, A. Image segmentation methods for flood monitoring system. Water 2020, 12, 1825. [Google Scholar] [CrossRef]
  24. Li, J.; Cai, R.; Tan, Y.; Zhou, H.; Sadick, A.-M.; Shou, W.; Wang, X. Automatic detection of actual water depth of urban floods from social media images. Measurement 2023, 216, 112891. [Google Scholar] [CrossRef]
  25. Wang, Y.; Shen, Y.; Salahshour, B.; Cetin, M.; Iftekharuddin, K.; Tahvildari, N.; Huang, G.; Harris, D.K.; Ampofo, K.; Goodall, J.L. Urban flood extent segmentation and evaluation from real-world surveillance camera images using deep convolutional neural network. Environ. Model. Softw. 2024, 173, 105939. [Google Scholar] [CrossRef]
  26. Pally, R.J.; Samadi, S. Application of image processing and convolutional neural networks for flood image classification and semantic segmentation. Environ. Model. Softw. 2022, 148, 105285. [Google Scholar] [CrossRef]
  27. Quang, N.H.; Lee, H.; Kim, N.; Kim, G. Real-time flash flood detection employing the YOLOv8 model. Earth Sci. Inform. 2024, 17, 4809–4829. [Google Scholar] [CrossRef]
  28. Utomo, S.B.; Irawan, J.F.; Alinra, R.R. Early warning flood detector adopting camera by Sobel Canny edge detection algorithm method. Indones. J. Electr. Eng. Comput. Sci. 2021, 22, 1796–1802. [Google Scholar] [CrossRef]
  29. Huang, M.; Jin, S. Rapid flood mapping and evaluation with a supervised classifier and change detection in Shouguang using Sentinel-1 SAR and Sentinel-2 optical data. Remote Sens. 2020, 12, 2073. [Google Scholar] [CrossRef]
  30. Humaira, N.; Samadi, V.S.; Hubig, N.C. DX-FloodLine: End-To-End Deep Explainable Pipeline for Real Time Flood Scene Object Detection from Multimedia Images. IEEE Access 2023, 11, 110644–110655. [Google Scholar] [CrossRef]
  31. Pelindung—Pemantauan Lingkungan Kota Bandung [Internet]. Available online: https://pelindung.bandung.go.id/ (accessed on 1 October 2023).
  32. Tanim, A.H.; McRae, C.B.; Tavakol-davani, H.; Goharian, E. Flood Detection in Urban Areas Using Satellite Imagery and Machine Learning. Water 2022, 14, 1140. [Google Scholar] [CrossRef]
  33. ChatGPT|OpenAI [Internet]. Available online: https://openai.com/chatgpt/overview/ (accessed on 1 July 2025).
  34. Gemini API|Google AI for Developers [Internet]. Available online: https://ai.google.dev/gemini-api/docs (accessed on 1 July 2025).
  35. Frontier AI LLMs, Assistants, Agents, Services|Mistral AI [Internet]. Available online: https://mistral.ai/ (accessed on 1 July 2025).
  36. Janus Pro AI [Internet]. Available online: https://janusai.pro/#google_vignette (accessed on 1 July 2025).
  37. Roboflow [Internet]. Available online: https://universe.roboflow.com/alumatngdetect/flood-iqlub/dataset/1 (accessed on 22 August 2025).
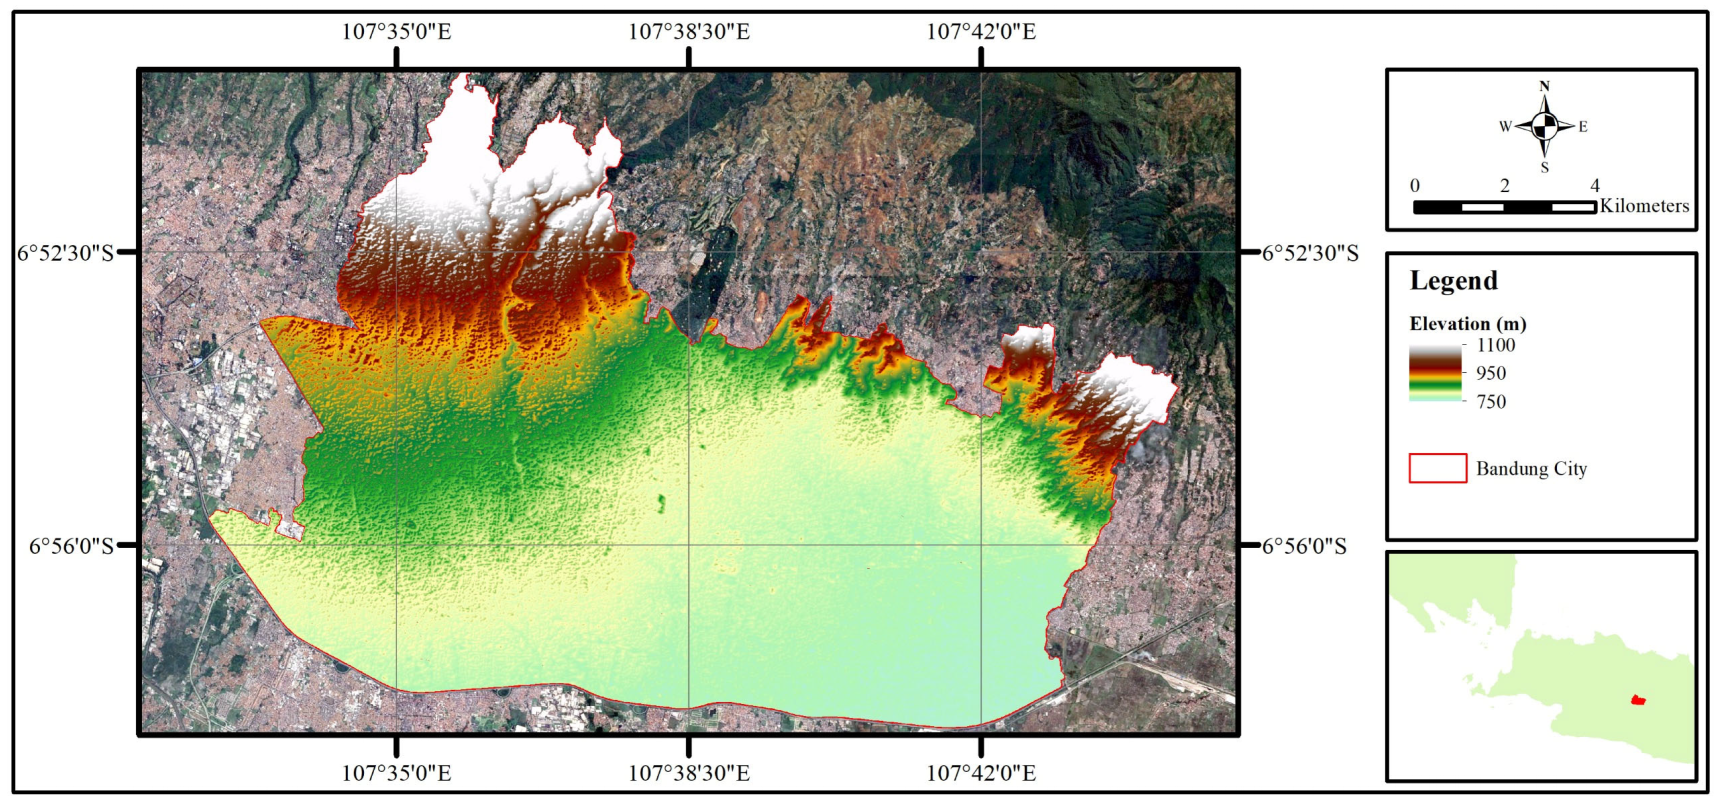
Figure 1. Topographic map and administrative boundary of Bandung City. The city lies within a tectonic basin surrounded by volcanic highlands, forming a bowl-shaped terrain. This unique topography causes water from surrounding uplands to flow toward the city center, increasing the risk of flooding in low-lying urban areas.
Water 17 02739 g001
Figure 2. CCTV point location derived from reference [31].
Water 17 02739 g002
Figure 3. Overall workflow of the flood detection model.
Water 17 02739 g003
Figure 4. Pseudocode for Automated Image Acquisition from CCTV Feeds. The algorithm initializes time and camera directories, then continuously captures and stores images from each CCTV URL at 15 min intervals using location and timestamp-based filenames. Capture errors are logged.
Water 17 02739 g004
Figure 5. Example of labeled CCTV images used in this study. (a) The first row shows flood—day conditions, (b) the second row shows no flood—day conditions, (c) the third row shows flood—night conditions, and (d) the fourth row shows no flood—night conditions.
Water 17 02739 g005
Figure 6. Example of misclassification by DeepLabv3+ (a) Pagarsih St. (b) Cikutra St. Dry regions (annotated in red), environment, flood areas (annotated in blue), and wet surfaces (annotated in yellow).
Water 17 02739 g006
Figure 7. Heatmap of flood frequency across 340 CCTV locations based on ChatGPT 4.1. High-frequency areas (more than 400 flood-labeled images) are shown in red, while low-frequency areas (1–20 images) appear in blue.
Water 17 02739 g007
Table 1. LLMs’ total parameter comparison.
LLM ModelVersionTotal Parameters
ChatGPT [33]OpenAI GPT-4.1~1.76T *
Gemini [34]Gemini 2.5 Pro~1.76T *
Mistral [35]Mistral Pixtral Large124B
DeepSeek [36]DeepSeek Janus671B
Note(s): * ChatGPT and Gemini total parameters are undisclosed; the number of parameters shown are estimated based on their performance compared to that of their disclosed previous models.
Table 2. Comparison of LLMs in terms of accuracy, cost, and speed for flood identification. The best performance among these four models is presented in bold.
LLM ModelOverall AccuracyAvg. Cost/ImageAvg. Speed/Image
OpenAI GPT-4.10.8506~USD 0.00503 s
Gemini 2.5 Pro0.8413~USD 0.00473 s
Mistral P. Large0.8322~USD 0.00671 s
DeepSeek JANUS0.7918~USD 0.00192 s
Table 3. Day, night, and overall accuracy comparison for GPT-4.1 variants.
Image SettingGPT-4.1-NanoGPT-4.1-MiniGPT-4.1
Day0.91280.95530.9679
Night0.69720.72980.7332
Overall0.80500.84260.8506
Avg. Cost/Image~USD 0.00068~USD 0.0026~USD 0.0050
Table 4. Simplified and detailed prompt comparison for GPT-4.1 variants.
PromptsGPT-4.1 NanoGPT-4.1 MiniGPT-4.1
Simplified0.72690.75230.7894
Detailed0.80500.84260.8506
Table 5. Successful and failed cases.
Test ImageDeepSeek
Janus
Mistral
P Large
Gemini
2.5. Pro
ChatGPT 4.1.
NanoMiniStandard
Standard Case
Water 17 02739 i001
Day (NF)
Water 17 02739 i002
Day (F)
Water 17 02739 i003
Night (NF)
Water 17 02739 i004
Night (F)
Hard Case
Water 17 02739 i005
Light Obstruction (F)
Water 17 02739 i006
Partial Image Defect (NF)
Water 17 02739 i007
Blurred Image
Note(s): F = flood. ✖ = wrong prediction. NF = no flood. = correct prediction.
Disclaimer/Publisher’s Note: The statements, opinions and data contained in all publications are solely those of the individual author(s) and contributor(s) and not of MDPI and/or the editor(s). MDPI and/or the editor(s) disclaim responsibility for any injury to people or property resulting from any ideas, methods, instructions or products referred to in the content.