Article

Numerical Study on the Hydrodynamic Force on Submarine Pipeline Considering the Influence of Local Scour Under Unidirectional Flow

1
Central Southern China Electric Power Design Institute Co., Ltd. of China Power Engineering Consulting Group, Wuhan 430071, China
2
State Key Laboratory of Coastal and Offshore Engineering, Dalian University of Technology, Dalian 116024, China
*
Author to whom correspondence should be addressed.
Water 2025, 17(18), 2737; https://doi.org/10.3390/w17182737
Submission received: 5 August 2025 / Revised: 10 September 2025 / Accepted: 13 September 2025 / Published: 16 September 2025

Abstract

The effect of local scour on the hydrodynamic force upon a submarine pipeline under unidirectional flow has been numerically investigated. The flow field around the pipeline is obtained using the Navier–Stokes equations with the SST k-ω turbulence model, and the sediment transport model, considering suspended load and bed load, is accounted for. Firstly, the influences of the Reynolds number (1 × 10⁴Re ≤ 1 × 10⁵) and Shields number (1.2 ≤ θ/θcr ≤ 2.5) on the scour below the pipeline are analyzed; then, the effect of local scour on the hydrodynamic force upon the pipeline is examined by comparing with the condition that the pipeline is put on the flat seabed. It is found that the presence of local scour leads to a significant effect on the hydrodynamic force acting on the pipeline. Additionally, the Reynolds number affects the hydrodynamic force significantly, while the Shields number has a relatively low effect. The reduction coefficient (λ) is adopted to quantify the influence of the local scour around the pipeline on the hydrodynamic force. According to the reduction coefficient, the presence of local scour increases the drag coefficient by about 10% when the Reynolds number is 1 × 10⁴, while it decreases the drag coefficient significantly when the Reynolds number is larger than 2 × 10⁴, and the reduction coefficient trends towards a constant value with the increase in the Reynolds number.

1. Introduction

Subsea pipelines are widely used for transporting oil and gas, controlling subsea production systems, as well as the utilization of clean energy (e.g., offshore wind power, photovoltaics, and wave energy) with high engineering costs. In the complex marine dynamic environments, subsea pipelines are prone to in situ instability failure, causing significant economic losses and potentially irreparable marine ecological disasters. Currently, the in-situ stability design of subsea pipelines is based solely on the DNV-RP-F109 [1] standard (established by DET NORSKE VERITAS). The core of the in-situ stability design is how to calculate the forces on the pipelines. The current DNV-RP-F109 [1] standard primarily assumes a rigid flat seabed and obtains the hydrodynamic load acting on the pipeline by conducting experiments, leading to the completion of the hydrodynamic in situ stability design. However, for the pipeline on the seabed, local scour phenomena may occur due to the fluid force, causing certain sections of the pipeline to be suspended and altering the force acting on the pipeline. Additionally, local scour topography also significantly changes the force on the pipeline, thus affecting its in situ stability. Currently, there is little reporting on the force upon the pipeline considering local scour topography.
Previous studies on the force acting on the pipeline were primarily based on the assumption of a smooth and flat seabed, focusing on the influence of the suspended height on the force acting on the pipeline. Bearman and Zdravkovich [2] conducted experiments to study the effect of the gap ratio G/D (where G is the suspended height of the cylinder and the wall, and D is the cylinder diameter) on the vortex shedding. They found that, when G/D is less than 0.3, the vortex shedding is suppressed by the wall, and when G/D is larger than 0.3, the non-dimensional vortex shedding frequency, i.e., the Strouhal number St (St = fD/U0; f is the vortex shedding frequency, U0 is the reference flow velocity, and, in the present study, it is the mean flow velocity along the depth) remains around 0.2. Lei et al. [3] found that the critical gap ratio for suppressing the vortex shedding varies in the range of 0.2–0.3, according to the experimental data, and the specific value is closely related to the boundary layer thickness δ, i.e., the larger the boundary layer thickness, the lower the critical gap ratio for controlling vortex shedding. For a cylinder completely outside the boundary layer, its drag coefficient is almost independent of the gap ratio. For cylinders that are either fully or partially within the boundary layer, the drag coefficient CD increases with the increase in the ratio of gap to boundary layer thickness G/δ. When the gap ratio G/D is larger than 2.0, the influence of the wall on the force acting on the cylinder and vortex shedding can be neglected. Oner et al. [4] found that, when the gap ratio G/D varies from 0 to 0.3, the flow field changes dramatically. When G/D is larger than 0.3, the flow field changes slowly, and, when G/D is larger than 1.0, the effect of the wall on the flow field is minimal. Buresti and Lanciotti [5] studied the effect of the wall on the drag coefficient and lift coefficient of a cylinder, finding that, with the gap ratio G/D increasing, the average lift coefficient C ¯ L decreases, and, the thicker the boundary layer, the more severe the decrease, and its value remains larger than zero. The average drag coefficient C ¯ D does not have a completely monotonic relationship with the gap ratio, and it is significantly influenced by the boundary layer thickness and Reynolds number Re (in the present study, Re = U0D/υ; υ is the kinematic viscosity of the fluid). Liu et al. [6] studied the effect of the pipeline roughness on the force acting on the pipeline and found that, with the pipeline roughness increasing from zero, the drag force decreases, and the lift force decreases first and increases later. Huang et al. [7] compared the dimensionless hydrodynamic coefficients calculated using the free stream velocity and the velocity at the center of the pipeline, respectively, finding that the latter can approximately eliminate the effect of the boundary layer thickness, and a formula for describing the relationship between the gap ratio G/D and the hydrodynamic coefficients was proposed. Akoz [8] studied the flow characteristics around a partially buried cylinder, and found the separation point of the boundary layer on the pipeline moves upward with an increasing Reynolds number and a decreasing B/D (B is the burial depth).
With the continuous research on the force acting on the subsea pipeline, the scour pit below the pipeline is considered to have a larger effect on the force on the pipeline, and some research related to the effects of local scour has been conducted. Jensen et al. [9] conducted experiments on the change of force acting on the pipeline during the scour process under unidirectional flow conditions. The study selected five instantaneous scour topographies as the boundary conditions for the seabed beneath the pipeline, examining the change in the flow field at different scour times, as well as the variations in various hydrodynamic coefficients (Strouhal number, lift coefficient, and drag coefficient) with scour depth. It was found that the variation in hydrodynamic coefficients with suspended height on a scoured seabed was opposite to that of a pipeline at the same suspended height on a flat seabed, and the average lift coefficient C ¯ L remains less than zero, which is in contrast to the conclusion obtained from the study on a flat wall by Buresti and Lanciotti [5]. Chen et al. [10] built a numerical model using the fully developed scour pit as the seabed boundary below the pipeline, studying the effect of inflow boundary layer thickness on the hydrodynamic coefficients of the pipeline. They found that all hydrodynamic coefficients (drag coefficient, lift coefficient, and Strouhal number) decrease with an increase in boundary layer thickness. Additionally, compared to a flat seabed at the same suspended height, the flow velocity near the pipeline under scour conditions is lower, leading to a smaller drag coefficient and root mean square lift coefficient for the pipeline. Liu et al. [6] studied the effect of the pipeline roughness on the force acting on the pipeline, considering the seabed scour, finding that, with the pipeline roughness increasing from zero, both the drag force and the lift force increase first and decrease later, which is different from the condition when the pipeline is put on the flat seabed. Jo et al. [11] conducted research into the hydrodynamic force acting on the pipeline in the trench, finding that the opening length ratio (W/H: W is the opening length of the trench, H is the depth of the trench) dominates the mean drag force, while the cover depth ratio (H/D) affects the mean lift force significantly. In addition, some scholars (Sumer et al. [12], Zhang et al. [13]) have studied the impact of pipeline vibration on scour, finding that both the vibration frequency and amplitude of the pipeline can exacerbate the local scour action of the seabed, with the influence of vibration amplitude being more significant. Sumer et al. [12] conducted an experiment to study the effect of scour pit on pipeline vibration, and the results showed that the scour pit had a significant impact on both the frequency and amplitude of the vibration.
The above research indicates that the presence of a scour pit significantly alters the hydrodynamic characteristics of a subsea pipeline, but the related studies used a fixed smooth wall with a scour pit to simulate the scoured seabed, without considering the impact of flow field change on the local scour. Thus, there is still a lack of discussion on the influence of scour topography variation due to flow field change on the force acting on the pipeline. Therefore, it is necessary to conduct an analysis of the influencing patterns of the Shields number on the force on the pipeline. Additionally, according to the existing research, whether or not the wall was considered, the force upon the pipeline is closely related to the Reynolds number, Re, but the relationship between the force and the Reynolds number is not clear when the scour is considered. Thus, the present study will focus on the effect of Reynolds number and Shields number on the force on the pipeline.

2. Establishment and Validation of Numerical Model

2.1. Establishment of Numerical Model

2.1.1. Governing Equations of Flow Model

The governing equations for a two-dimensional viscous incompressible fluid consist of the continuity equation and the momentum equation, which are shown below:
u i x i = 0
u i t + u j u j m u i x j = 1 ρ p x i + x j 2 υ S i j u i u j ¯
where x1 = x and x2 = y correspond to the components of the Cartesian coordinate system, ui represents the velocity components in the i-th coordinate direction (u1 = u, u2 = v), t is time, ρ is the density of the fluid, p is pressure, υ is the kinematic viscosity of the fluid, ujm is the movement speed of a computational node, Sij is the average stress tensor, defined as Sij = (∂ui/∂xj + ∂uj/xj)/2, and u i , u j , ¯ is the Reynolds stress, computed by the following:
u i u j ¯ = υ t u i x j + u j x i + 2 3 k δ i j
where υt is the turbulent eddy viscosity, k is the turbulence kinetic energy, and δij is the Kronecker operator. In order to close the above governing equations, a turbulence model is needed. The SST (Shear-Stress Transport) k-ω turbulence model [14,15] combines the advantages of the k-ω model and the k-ε model through a blending function, while the former is applicable to boundary layer flow and the latter is applicable to the region outside the boundary layer. Additionally, the SST k-ω has been widely employed in many studies about pipelines, including the local scour beneath the pipeline [6,16] and the hydrodynamic force on the pipeline [17]. Thus, it is also adopted in the present study, and the equations for turbulence kinetic energy k and its dissipation rate ω are as follows:
k t + u j u j m k x j = x j υ + σ k υ t k x j + P k β ω k
ω t + u j u j m ω x j = x j υ + σ ω υ t ω x j + α S 2 β ω 2 + 2 1 F 1 σ ω 2 1 ω k x j ω x j
among them,
P k = min υ t u j x i u j x i + u i x j , 10 β k ω
υ t = α 1 k m a x α 1 ω , S F 2
F 1 = tanh min max k β ω y + , 500 υ y + 2 ω , 4 ρ σ ω 2 k D k ω y + 2 4
where S is the invariant measure of the strain rate, y+ is the distance to the nearest wall, F2 and D are represented as follows:
F 2 = tanh max 2 k β ω y , 500 υ y 2 ω 2
D k ω = max 2 σ ω 2 ρ 1 ω k x j ω x j , 10 10
The other parameters in the above equations can be obtained by using F1: σ k = F 1 σ k 1 + 1 F 1 σ k 2 , σ ω = F 1 σ ω 1 + 1 F 1 σ ω 2 , α = F 1 α 1 + 1 F 1 α 2 , β = F 1 β 1 + 1 F 1 β 2 . The constant parameters used in the SST k-ω turbulence model are shown in Table 1.
The governing equations of the present model are discretized by the Petrov–Galerkin finite element method (PG-FEM) [18].

2.1.2. Sediment Transport Equations

The sediment transport includes bed load and suspended load, and both of them are considered in the present model. The suspended load transport rate can be calculated by using the following formula:
q s = y a + y b y s c u d y
where qs represents the suspended load sediment transport rate, ys is the upper boundary of the computational domain, c is the concentration of the suspended sediment, yb is the bed elevation, and ya is the elevation below which the sediment transports as the bed load, above which it transports as a suspended load. Additionally, ya = 2.0d50, where d50 is the median sediment grain size. The concentration of the suspended sediment c is obtained through the following transport equation:
c t + u j u j m w s j c x j = x j υ t σ c c x j
where the Schmidt number σc for turbulence is taken as 1.0, wsj is the settling velocity of the sediment, ws1 is taken as 0 in the x direction, and, for the settling velocity ws2 in the y direction, the formula proposed by Richardson and Zaki [19] is used for calculation:
w s 2 = w s 0 1 c m
where m is taken as 5.0, and ws0 can be obtained from the empirical formula proposed by Soulsby [20]:
w s 0 = υ d 50 10.36 2 + 1.049 D 3 1 / 2 10.36
where D* is a dimensionless sediment particle size, which can be obtained from the following equation:
D = g s 1 υ 2 1 / 3 d 50
where g is the gravitational acceleration, and s is the specific gravity of the sediment.
The bed load transport rate is calculated by using the formula proposed by Van Rijn [21]:
q b = 0.053 s 1 g 0.5 d 50 1.5 T 0 2.1 D 0.3 , 0 , T 0 > 0 T 0 0
where qb represents the bed load transport rate, and the definition of parameter T0 is as follows:
T 0 = θ θ c r θ c r
where θ = τ0/[gd50/(ρsρ)] is the Shields number, τ0 is the seabed shear stress, ρs is the sediment density, and ρ is the fluid density. θcr is the critical Shields number, which can be obtained by using the following formula proposed by Soulsby and Whitehouse [22]:
θ c r = 0.3 1 + 1.2 D + 0.055 [ 1 exp 0.02 D ]
The seabed profile evolution caused by sediment transport is solved by the following conservation equation of the sediment mass:
y b t = 1 1 λ s x q s + q b
where λs is the sediment porosity.
Under the action of fluid, the cylinder is subjected to a drag force in the flow direction and a lift force in the transverse direction, represented by FD and FL, respectively. Based on the dimensionless analysis by using Equation (20), the drag coefficient CD and lift coefficient CL can be obtained.
C D = F D ρ U 0 2 D / 2 , C L = F L ρ U 0 2 D / 2
The time-averaged pressure coefficient C ¯ p of the cylinder surface can be calculated by using the following formula:
C ¯ p = p ¯ ( ρ U 0 2 ) / 2
where U0 represents the mean flow velocity along the depth, D is the diameter of the cylinder, and p ¯ is the time-averaged pressure on the surface of the cylinder.
The time-averaged drag and lift coefficients are defined as follows:
C ¯ D = 1 N i = 1 N C D i , C ¯ L = 1 N i = 1 N C L i
where N is the number of samples.

2.1.3. Boundary Conditions

The computational domain of the numerical model is shown in Figure 1, where the left boundary is the inlet boundary and the right boundary is the outlet boundary. The computational domain is 40D × 15D, with the origin of the Cartesian coordinate system located on the bottom boundary (20D from the left boundary). The center of the cylinder is positioned D/2 above the origin. The distance from the seabed to the upper boundary of the computational domain is 15D. To reduce the effects of the inlet boundary and the outlet boundary on the field around the cylinder, the inlet and outlet are located 20D upstream and downstream of the cylinder, respectively.
For the inlet boundary, the velocity distribution along the water depth obeying logarithmic law is adopted, and the relevant parameters are set as follows, u = u(y), v = 0, ∂p/∂n = 0, ∂k/∂n = 0, and ∂ω/∂n = 0, for the outlet boundary, u/∂n = 0, p = 0, ∂k/∂n = 0, and ∂ω/∂n = 0, at the upper boundary, the symmetry boundary is adopted, i.e., v = 0, ∂u/∂n = 0, ∂p/∂n = 0, ∂k/∂n = 0, and ∂ω/∂n = 0, the cylinder surface is assumed to be smooth and no-slip, i.e., u = 0, v = 0, ∂p/∂n = 0, k = 0, and ω = 6v/0.075Δ12, and the lower boundary is assumed to be a rough boundary, i.e., u = v = 0, ∂p/∂n = 0, k = uf 2/Cμ0.5, and ω = uf/(Cμ0.5κΔ1). In the above expressions, uf is the friction velocity, ĸ is the Karman constant, taken as 0.4, Cμ is 0.09, and Δ1 is the height of the first-layer grid on the seabed or the surface of the cylinder. The inlet flow velocity follows the logarithmic distribution below:
u ( y ) = u f κ In y Δ b
where Δb is the seabed roughness length, taken as d50/12.
The initial conditions of the computational domain are as follows: the pressure, flow velocity, turbulence parameters, and sediment concentration within the computational domain are all zero.
The mesh around the pipeline is shown in Figure 2. The mesh used in this work is composed of four-node quadrilateral elements. To ensure the quality of the mesh beneath the pipeline, an initial gap of 0.1D in height is set up below the pipeline. This method has been widely used in past studies (Brørs [23]; Liang et al. [24]; Zhao and Cheng [25]), and the initial gap has almost no impact on the development of scour. For pipelines laid on a flat seabed without considering scouring effects, in order to ensure mesh quality, a small gap is also set between the pipeline and the seabed, but the symmetry boundary in the gap is set to prevent water from passing. This approach has also been widely used in previous studies (Brørs [23] and Tang et al. [17]).

2.2. Convergence and Accuracy Validation of Numerical Model

In order to ensure the convergence and accuracy of the present model, the validation of the convergence and accuracy of the numerical model is performed here. In this work, four sets of meshes with different densities are employed, i.e., coarse mesh, medium mesh, fine mesh, and finest mesh. The relevant parameters of the meshes with different densities are shown in Table 2, where Nt represents the total number of grid cells, Np represents the number of the first layer of mesh on the pipeline, and Δ1 represents the thickness of the first mesh layer on the pipeline.
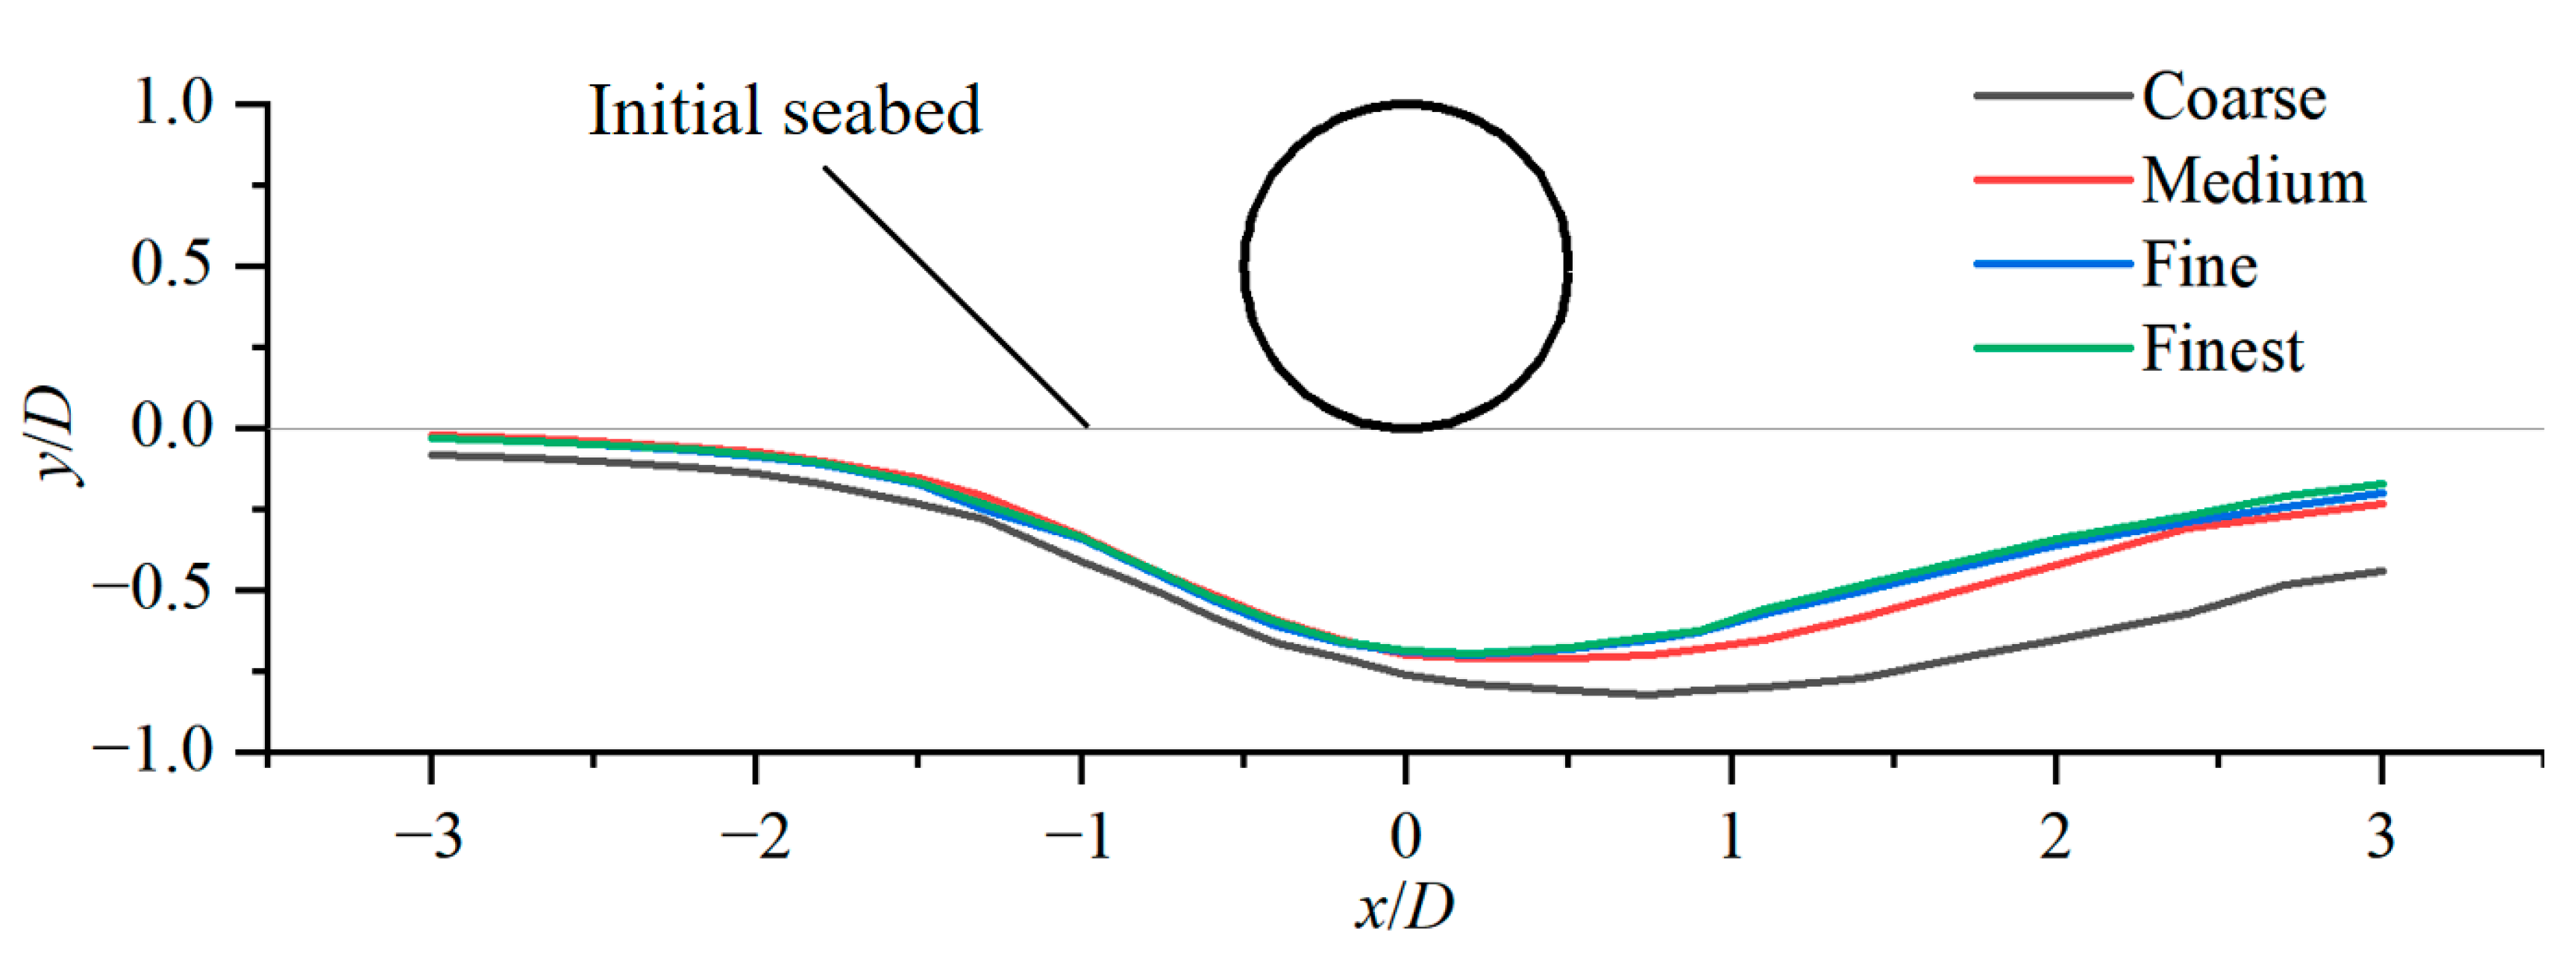
The shape of the scour pit obtained by using meshes with different densities is shown in Figure 3. The difference in the scour pits obtained from the coarse mesh and medium mesh is obvious, while the difference between the fine mesh and the finest mesh is minimal and has reached the convergence requirement. Therefore, the fine mesh is used in the following computation.
The convergence analysis on the time step was performed by using three values, and the simulation results with specific time steps are shown in Table 3. Table 3 shows the mean drag force coefficient C ¯ D , mean lift coefficient C ¯ L , and Strouhal number St of the pipeline when the scour reaches equilibrium under different time steps. It is found that results calculated based on Δt = 0.00075 s are very close to the results generated by the time step Δt = 0.0005 s; the maximum relative error is less than 0.4% for all the hydrodynamic force coefficients, hence Δt = 0.00075 s is used in the following computation.
The computation accuracy for the local scour of the present model is validated by using numerical results of Zhao and Cheng [25] and experimental results of Mao [26]. Additionally, the computation accuracy for the hydrodynamic force acting on the pipeline is validated by using the numerical results of Zhao and Cheng [25] and the experimental results of Jensen et al. [9], which considered a fully developed scour topography. The parameters for these cases are shown in Table 4. In Figure 4, the scour topography obtained by the present model shows good agreement with the results of Mao [26] and Zhao and Cheng [25]. In Table 5, the hydrodynamic force coefficients of the pipeline calculated by the present model are basically consistent with those in Zhao and Cheng [25] and Jensen et al. [9]. In summary, the scour topography and the forces acting on the pipelines obtained from this model are reliable.
The present study assumes the actual situation to be in a two-dimensional model. Thus, the three-dimensional effect of the vortex around the pipeline will be ignored. However, previous studies [6,16,17] and present research indicate that the two-dimensional hydrodynamic model using the turbulence model can obtain the force on the pipeline and the scour topography below the pipeline.

3. Results and Discussions

Considering that the Reynolds number and the Shields number are the key factors affecting the flow field around the submarine pipeline as well as the seabed topography, this work mainly focuses on the influences of the Reynolds number Re and the Shields number θ on the local scour and the force acting on the submarine pipeline. The values of the relevant parameters are 1 × 10⁴Re ≤ 1 × 10⁵, 1.2θcrθ ≤ 2.5θcr, with the specific gravity of sediment taken as 2.65, the median particle size of sediment taken as 0.36 mm, and the critical Shields number taken as 0.04. The undisturbed Shields numbers θ in the present study are all greater than the critical value; thus, the scour is all under live-bed conditions. The live-bed scour will not be discussed in detail because a comprehensive analysis of it is beyond the scope of this investigation. The specific cases in the present study are shown in Table 6, in which the data in the leftmost column represent the Reynolds number, the top row shows the Shields number, the second row gives the mean velocity corresponding to the Shields number, and the remaining data represent the pipeline diameter calculated according to the formula Re = U0D/υ. The parameter ranges (Re, θ/θcr) of the present study are similar to those of previous studies [23,27]. Apart from the data in Table 6, all other parameters remain unchanged, such as the sediment parameters. The pipeline diameters in the present study may be relatively smaller than the actual condition; thus, the results of this study can, to some extent, reflect the changing pattern of the force on the pipeline, but the specific values may be affected by the scale effect.

3.1. The Effect of Shields Number and Reynolds Number on Scour Topography

Previous studies (Jensen et al. [9]; Chen et al. [10]) have shown that the presence of scour topography significantly affects the hydrodynamic force on pipelines. The present section analyzes the influences of the Shields number and Reynolds number on scour topography, respectively. At Re = 5 × 10⁴, the scour depth below the pipeline is shown in Table 7, with the corresponding seabed profile illustrated in Figure 5. From Table 7 and Figure 5, it can be concluded that, when the Reynolds number Re remains constant, as the dimensionless shear stress Shields number θ increases, although the equilibrium scour depth Se does not change significantly, the relative scour depth Se/D increases significantly. It can also be observed that, when the Shields number is relatively small, the maximum scour depth is located directly below the pipeline, whereas, as the shear stress increases, the maximum scour depth moves downstream, and the scour area extends downstream. Thus, under the same Reynolds number Re, it can be inferred that the topography of the seabed beneath the pipeline may undergo significant change due to the variation in shear stress, and this topographic difference may affect the force on the pipeline, indicating that the influence of the Shields number θ needs to be considered when studying the force acting on the pipeline.
When the Shields number θ remains constant, changing the diameter of the pipeline will affect the Reynolds number Re, and the flow field will change, causing a change in scour topography. To study the effect of Reynolds number on the scour topography, we take the case of θ = 2θcr as an example. The equilibrium scour depths in this case are shown in Table 8, and the corresponding seabed profiles are illustrated in Figure 6. From Table 8 and Figure 6, it can be seen that, when the Shields number is constant, as the Reynolds number increases, the equilibrium scour depth Se gradually increases, while the dimensionless maximum scour depth Se/D gradually decreases, and the downstream extension of the scour pit also becomes smaller. This is because a larger diameter of pipeline has a stronger blocking effect on the fluid, leading to more water flow beneath the pipeline, which intensifies the scouring action on the sediment below the pipeline, thus resulting in an increase in the equilibrium scour depth Se. However, the increase in scour depth is relatively small compared to the increase in diameter, so the relative scour depth Se/D decreases as diameter D increases. Therefore, even with the same value of the Shields number θ, the key factor influencing the scour pit, it cannot be ensured that the scour topography remains unchanged. In summary, the variations in the Shields number and Reynolds number affect the scour topography significantly and further affect the hydrodynamic force on the pipeline. Thus, when studying the influence of topographic change of the seabed on the force on the pipeline, the effects of the Shields number and the Reynolds number need to be considered. It should be noted that, regardless of whether the terrain changes or not, the Reynolds number already has a significant impact on the force acting on the pipeline. However, when considering the scour pit, the specific influence pattern of the Reynolds number on the force is currently unclear.

3.2. The Effects of the Shields Number and Reynolds Number on the Force Acting on the Pipeline

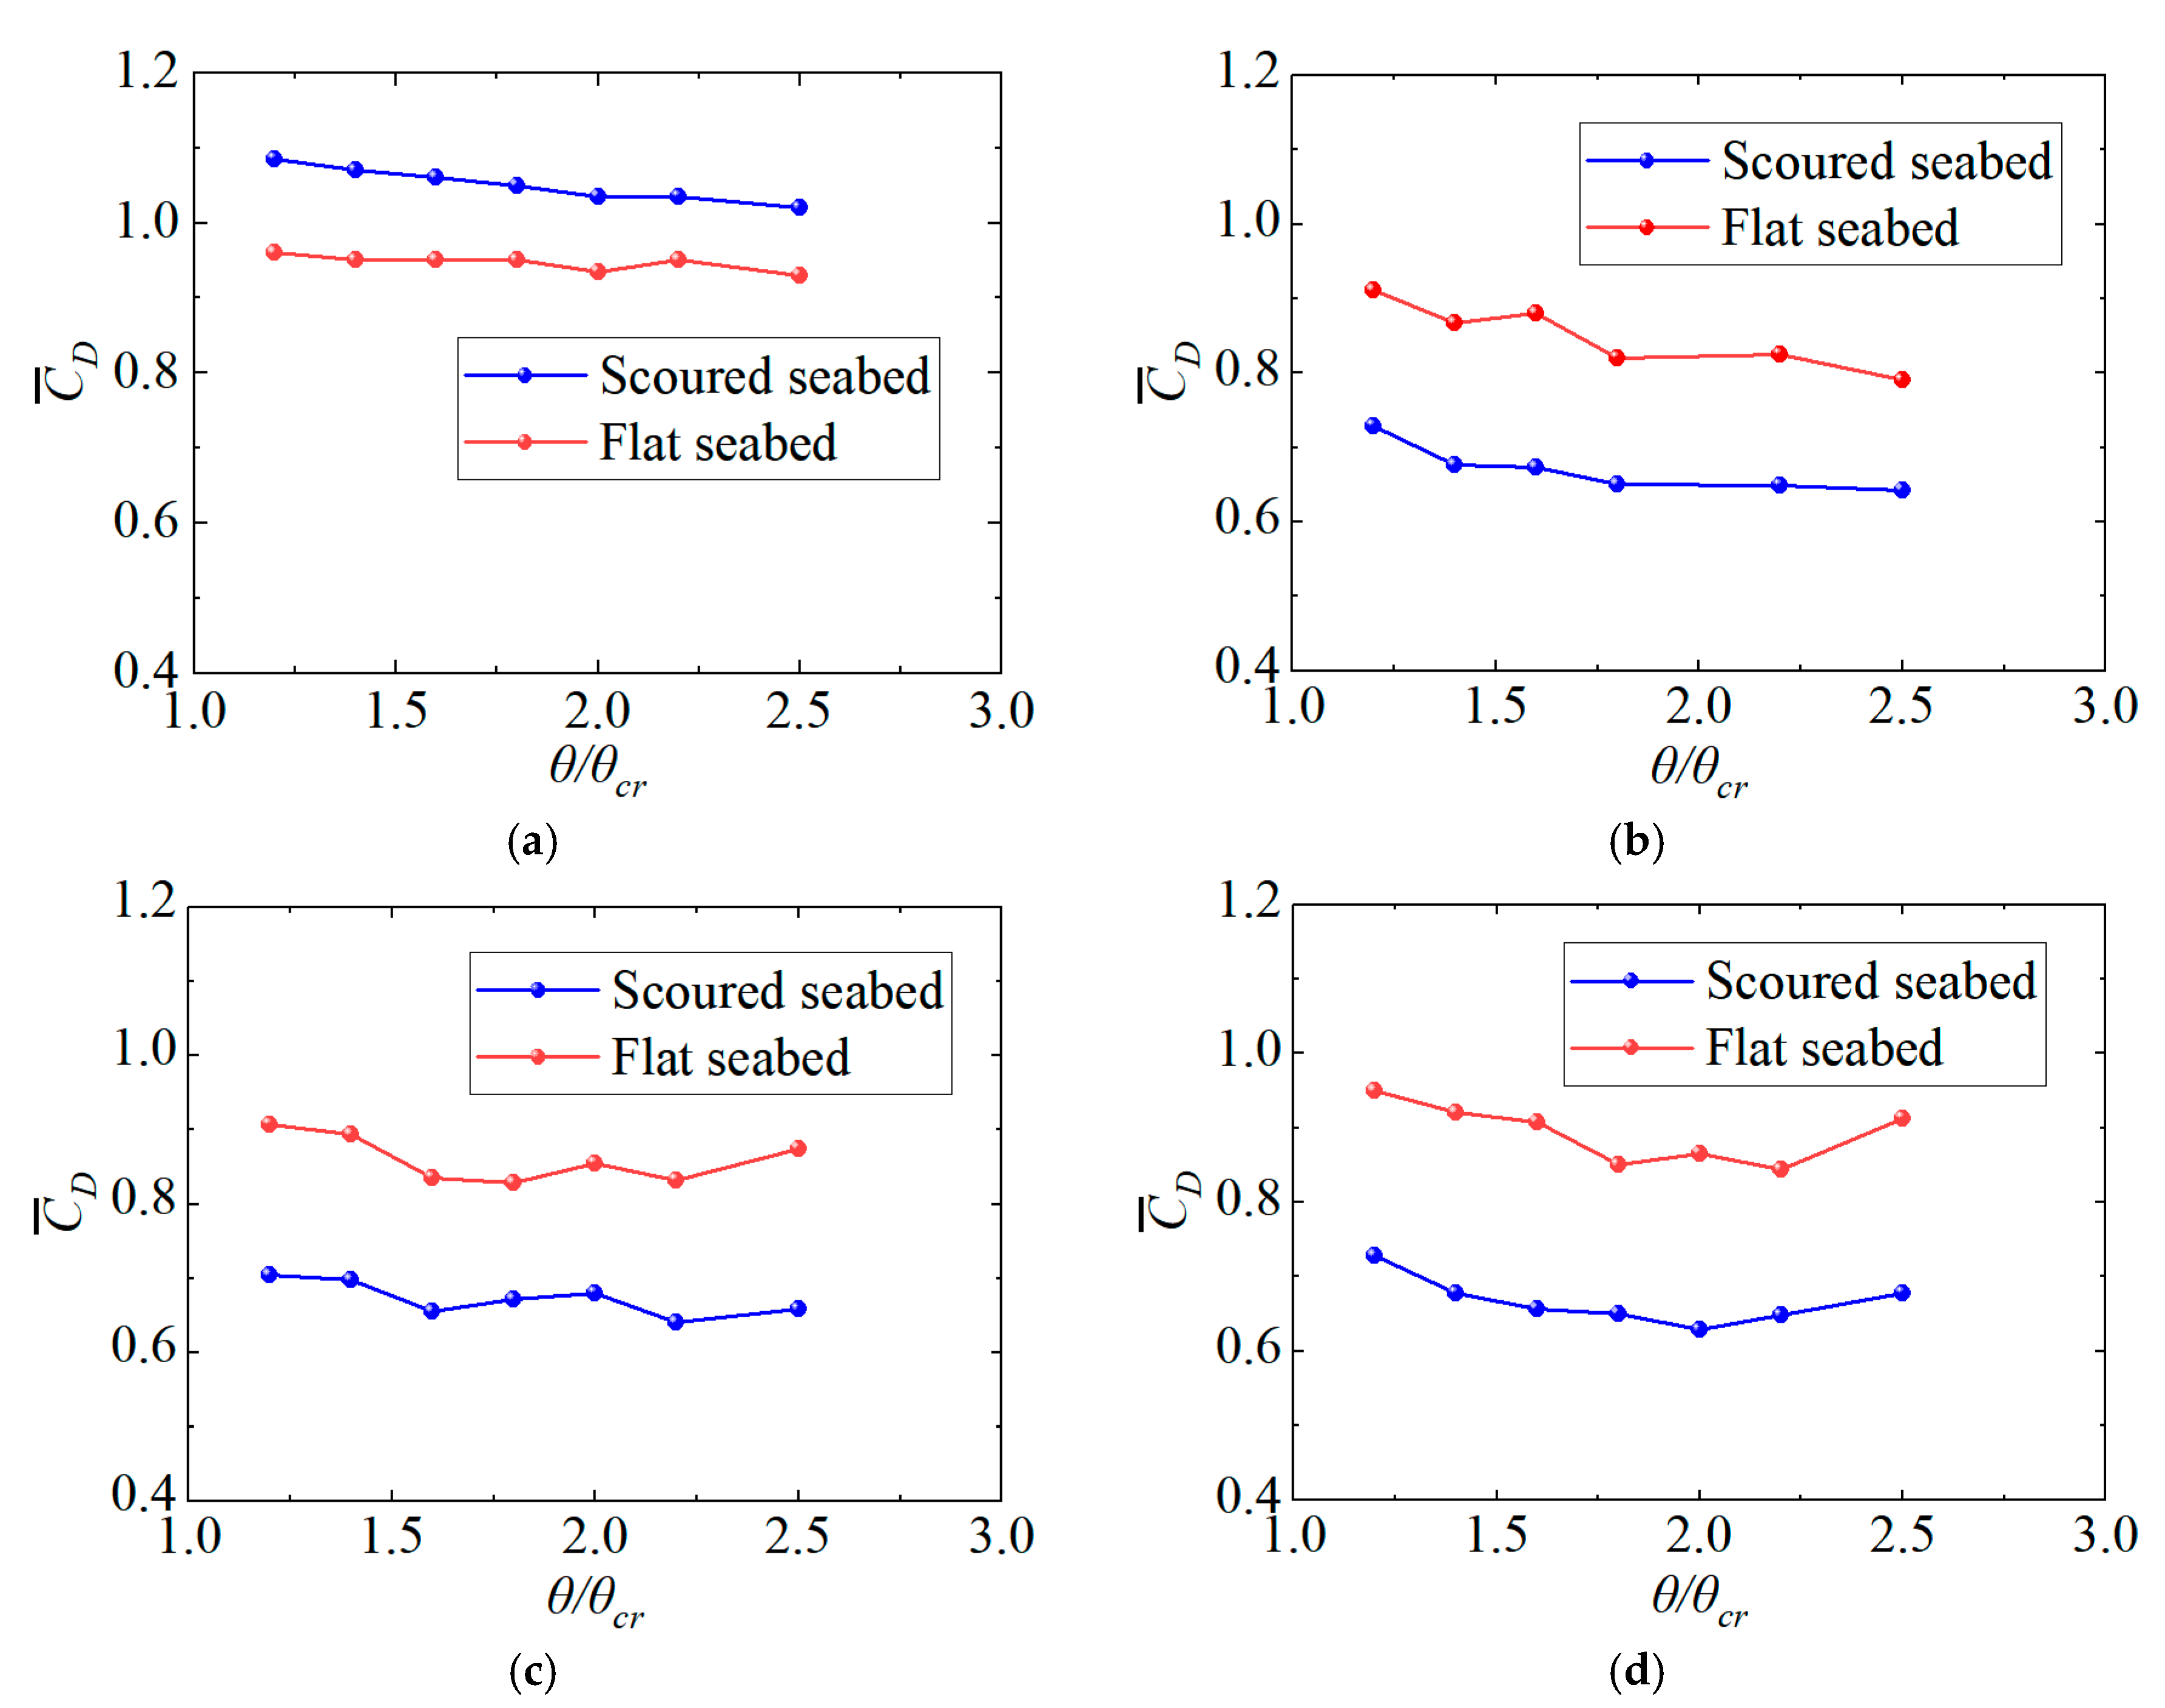
The variations in the time-averaged drag coefficient C ¯ D with the Shields number under different Reynolds numbers are shown in Figure 7. It can be seen that, when the Reynolds number Re remains constant, with the Shields number increasing, the time-averaged drag coefficient of the pipeline on a flat seabed and equilibrium scour seabed both show a general downward trend, although the fluctuation is relatively small, around 0.1. When the Reynolds number Re = 1 × 10⁴, the drag coefficient of the pipeline in the equilibrium scour seabed is greater than that on the flat seabed, but, as the Reynolds number increases, the time-averaged drag coefficient of the pipeline in the equilibrium scour seabed becomes less than that of the flat seabed. In other words, the existence of the scour pit does not simply increase or decrease the force acting on the pipeline; rather, both situations are possible.
The above phenomenon indicates that the change in Reynolds number can significantly alter the time-averaged drag coefficient of the pipeline. To further explore the influence of Reynolds number on the time-averaged drag coefficient of the pipeline on flat seabed and equilibrium scour seabed, Figure 8 shows how the average drag coefficient of the pipeline varies with the Reynolds number under different Shields numbers. It can be seen that, when the Shields number θ is constant, as the Reynolds number increases from 1 × 10⁴ to 2 × 10⁴, the time-averaged drag coefficient of the pipeline on both the flat seabed and equilibrium scour seabed shows a noticeable decreasing trend. Moreover, the drag coefficient of the pipeline on the equilibrium scour seabed is relatively more sensitive to the change in the Reynolds number. In the scope of the present study, the Reynolds number-induced variation in drag force coefficient for the flat seabed is less than 0.2, while it is more than 0.4 for the scoured seabed. The drag coefficient for the equilibrium scour seabed at Re = 1 × 10⁴ is greater than that for the flat seabed, but it becomes less than that for the flat seabed when Re ≥ 2 × 10⁴. For the flat seabed, when the Reynolds number increases, there is an upward trend in the time-averaged drag coefficient, while, under the condition of an equilibrium scour seabed, the time-averaged drag coefficient of the pipeline still decreases as the Reynolds number increases, and ultimately tends toward stability. This phenomenon is similar to a previous study on a suspended cylinder near a flat wall (Buresti and Lanciotti [5]). In conclusion, under the scope of the present investigation, compared to the effect of the Shields number, the effect of the Reynolds number on the time-averaged drag coefficient is more significant.
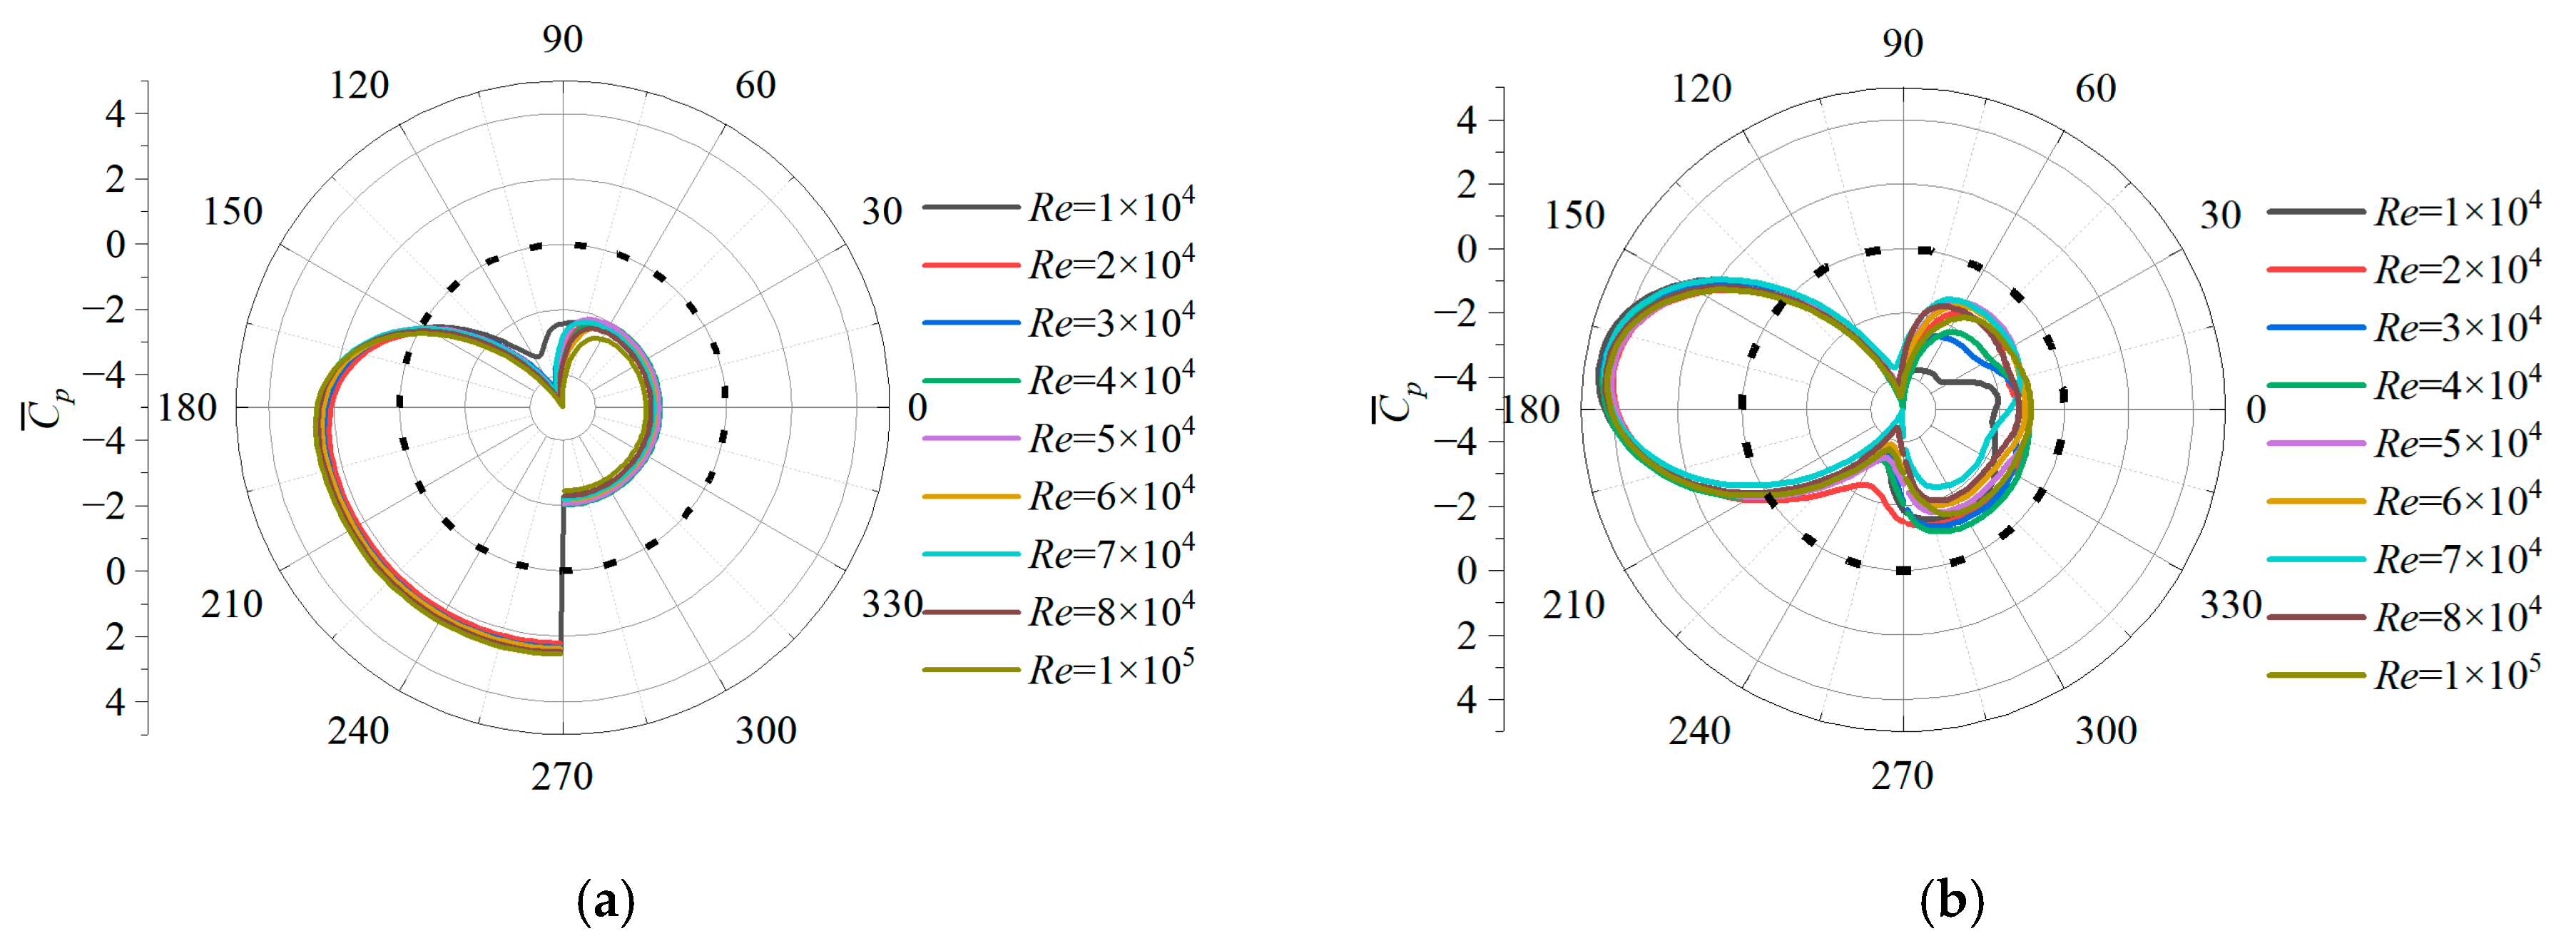
For the purpose of exploring the cause of the difference in the forces on the pipelines on the flat seabed and equilibrium scour seabed, the time-averaged pressure coefficient C ¯ p of the pipeline surface corresponding to the cases in Figure 8b is calculated by using Equation (21), and Figure 9 shows the relevant results, where 0° corresponds to directly behind the pipeline (backflow side), 90° corresponds to directly above the pipeline, 180° corresponds to directly in front of the pipeline (incoming flow side), and 270° corresponds to directly below the pipeline. As shown in Figure 9a, for the pipeline placed on a flat seabed, under unidirectional flow, the pressure coefficient on the upstream side of the pipeline ranges from 150° to 270° and is positive, while those on the downstream side from 270° to 90° are negative. The drag force acting on the pipeline is primarily generated by the pressure difference between its upstream and downstream sides. Moreover, the variation in the pressure coefficient on the pipeline surface with the Reynolds number in Figure 9a is not significant, which, to some extent, explains why the average drag force coefficient of the pipeline on a flat seabed in Figure 8b is not sensitive to the variation in the Reynolds number.
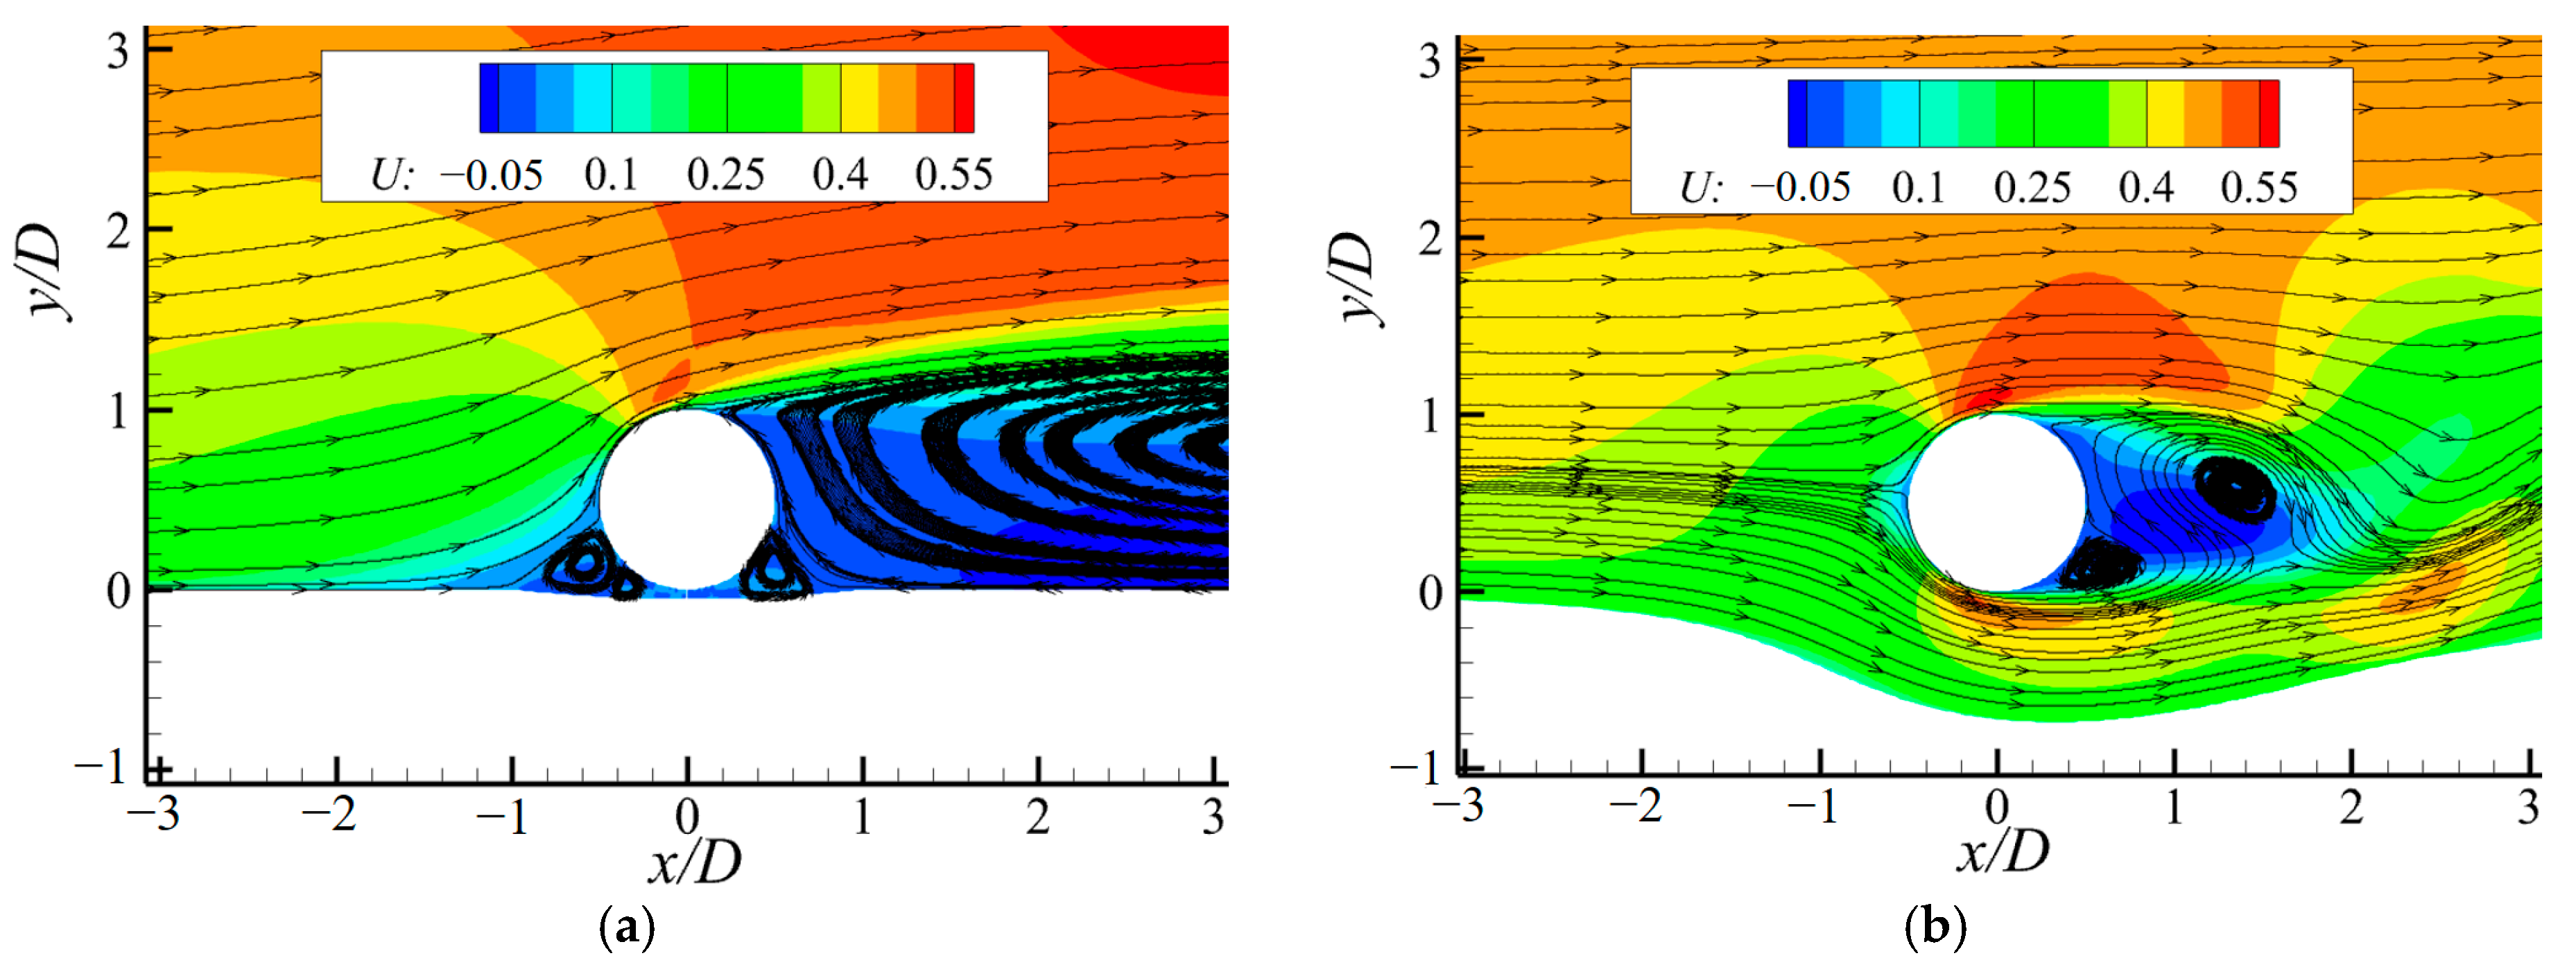
In Figure 9b, the pressure coefficient of the pipeline on the equilibrium scour seabed in the range of 135–210° is positive, while, in the other range, it is negative. Moreover, when the seabed shear stress remains constant, with the Reynolds number continuously increasing, the pressure coefficient in the positive pressure zone of the pipeline does not show a significant change, whereas the variation in the pressure coefficient in the negative pressure zone is quite noticeable. This indicates that the phenomenon observed in Figure 8, where the drag coefficient of the pipeline on the equilibrium scour seabed decreases with increasing Reynolds number, is mainly caused by the change in the negative pressure zone. By comparing Figure 9a,b, it can be observed that the maximum positive pressure on the incoming flow side of the flat seabed is lower than that on the equilibrium scour seabed. This is due to the presence of a scour pit, which allows the incoming flow to pass beneath the pipeline (as shown in Figure 10b), resulting in less obstruction for flow. Therefore, the flow velocity in front of the pipeline is relatively larger, leading to greater hydrodynamic pressure acting on the front of the pipeline. The positive pressure distribution range of the pipeline on a flat seabed is wider and more uniform than that on an equilibrium scour seabed, because the fluid beneath the pipeline on a flat seabed cannot flow away, and keeps a slow velocity, directly transmitting the incoming flow pressure to the pipeline. The absolute value of the negative pressure on the backflow side of the pipeline on the flat seabed is generally greater than that on the equilibrium scour seabed, but, when Re = 1 × 10⁴, the absolute value of the negative pressure of the pipeline on the equilibrium scour seabed is significantly greater within the range of 15–60° compared to that on the flat seabed. This results in the mean drag coefficient of the pipeline on the flat seabed being less than that on the equilibrium scour seabed in the case of Re = 1 × 10⁴, as shown in Figure 8b, while it is the opposite for the larger Reynolds numbers.

3.3. Quantification of the Effect of Scour on the Force Acting on the Pipeline

In order to quantify the influence of scour on the force acting on the pipeline, the hydrodynamic reduction coefficient λ is used here to describe the effect of the scour topography on the force acting on the pipeline. The method for calculating the drag force reduction coefficient is λCD = (CDaCD0)/CD0, where CD0 represents the drag coefficient of the pipeline on a flat seabed, and CDa represents the drag coefficient of the pipeline in an equilibrium scour seabed.
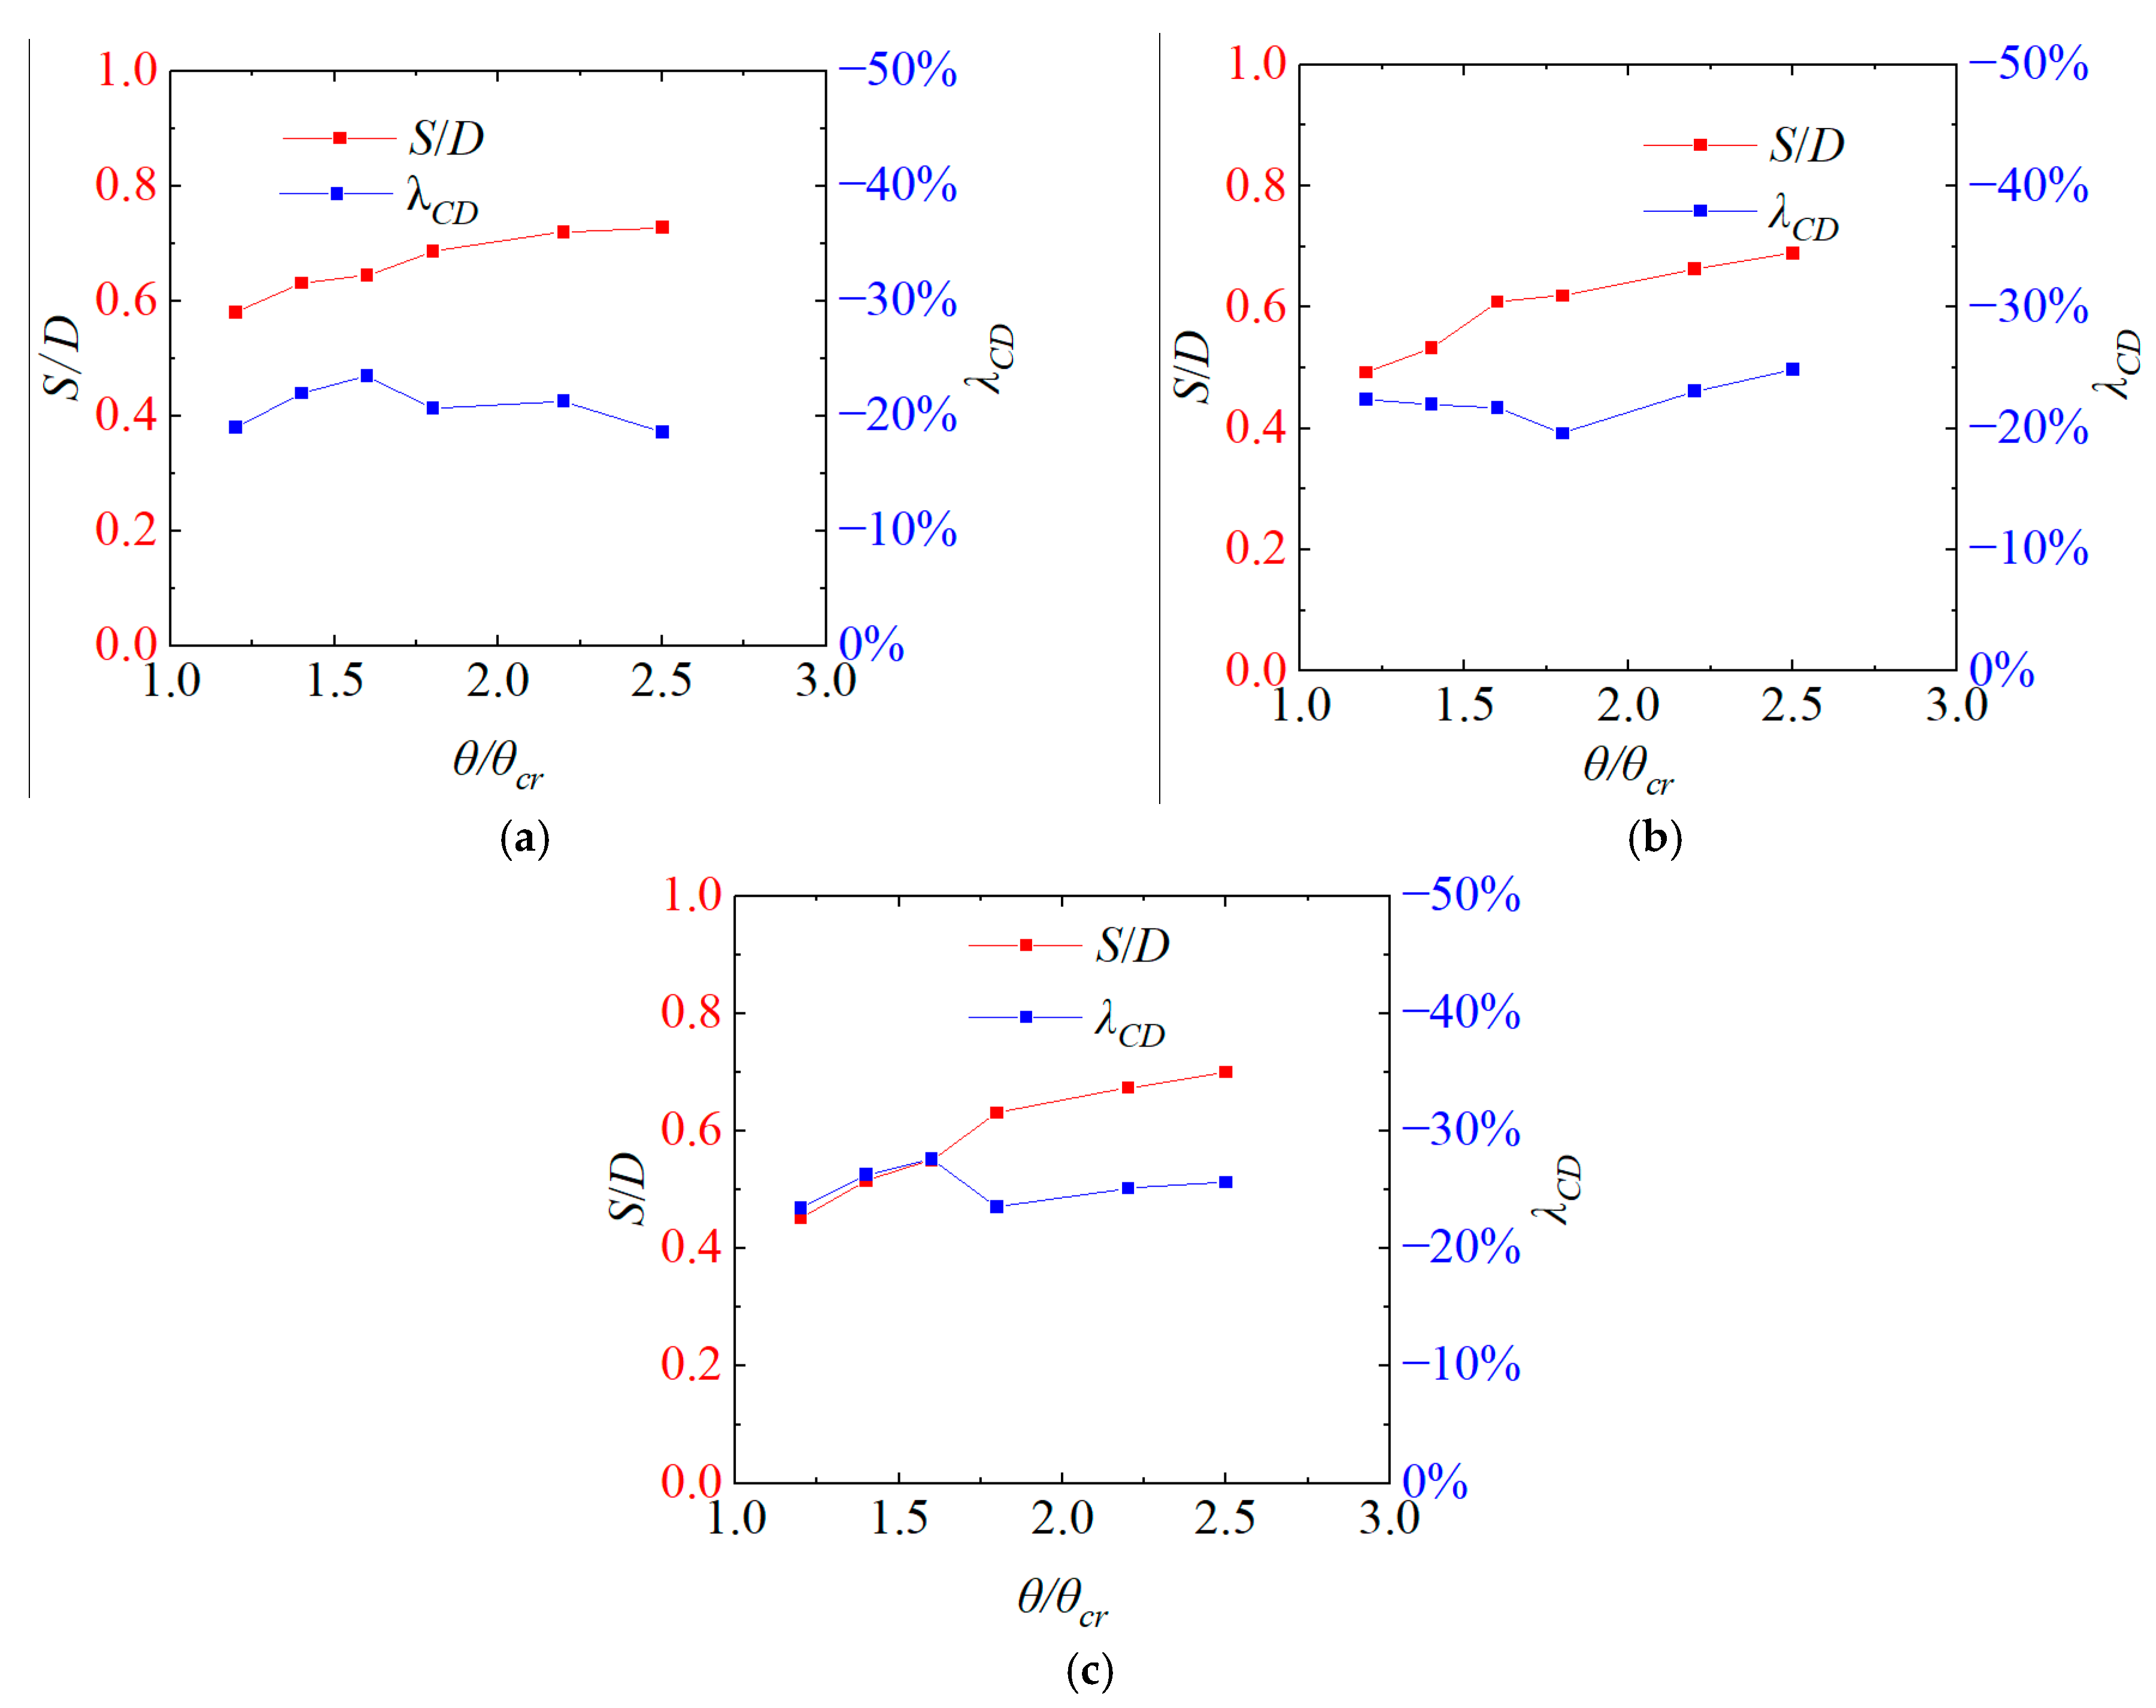
Figure 11 shows the variations in the maximum scour depth Se/D and the drag force reduction coefficient λCD at different Reynolds numbers with respect to the Shields number. It can be observed that at the same Reynolds number, the maximum scour depth Se/D increases with the increase in the Shields number, and the increase rate also increases as the Reynolds number increases. Additionally, there is no uniform change pattern for the variation in the drag force reduction coefficient under different Reynolds numbers, and the difference in λCD at different Shields numbers is small (i.e., the maximum difference is around 5%). This phenomenon reflects a potentially existing rule, namely, that, although the presence of a scour pit has a significant impact on the time-averaged drag force coefficient, once the depth of the scour pit reaches a certain level, its influence does not deepen further. This phenomenon can also be observed in the study of Jensen et al. [9], which indicated that when the scour depth Se/D exceeds 0.4, the mean drag force coefficient remains nearly unchanged, and all scour depths Se/D in the present study are greater than 0.4.
Table 9 shows the drag force reduction coefficient at different Shields numbers, with Reynolds numbers in the range of 1 × 10⁴Re ≤ 1 × 10⁵. It can be seen that, except for the case of Re = 1 × 10⁴, all reduction coefficients remain negative, and their absolute values increase with the increase in the Reynolds number, while the increase rate gradually slows down. It is expected that the reduction coefficients will tend towards a stable value as the Reynolds number increases. Within the scope of this work, compared to the condition of a flat seabed, the impact of the scour pit on the time-averaged drag force can reach up to about 30%.

4. Conclusions

Considering the scour effect of flow on the seabed, this work investigated the effects of the Reynolds number and Shields number on the scour pit below the pipeline, as well as the force on the pipeline. The influence of scour on the force acting on the pipeline was quantified using a drag force reduction coefficient. The conclusions are as follows:
(1)
When the Reynolds number is small (i.e., Re = 1 × 10⁴), compared with the flat seabed condition, the presence of a scour pit increases the time-averaged drag coefficient, while it reduces the time-averaged drag coefficient of the pipeline significantly when the Reynolds number is relatively large (i.e., Re > 1 × 10⁴).
(2)
Compared to a flat seabed, the variation in the time-averaged drag coefficient of the pipeline in an equilibrium scour seabed is more sensitive to Reynolds number. Additionally, regardless of whether the scour is considered, the sensitivity of the time-averaged drag coefficient to the Shields number is the same and low.
(3)
Although the local scour pit can significantly affect the time-averaged drag coefficient of the pipeline, in the scope of the present study, the depth of the scour pit is not closely related to the force acting on the pipeline.
(4)
The drag force reduction coefficient is used to quantify the effect of the scour pit on the drag force, which shows that the effect of the scour pit increases as the Reynolds number increases, while it does not show an obvious pattern as the Shields number changes.

Author Contributions

Conceptualization, Y.W. and S.Y.; methodology, S.W. and G.T.; software, Y.J. and B.Z.; validation, Y.W., S.Y. and Y.J.; formal analysis, B.Z. and S.W.; investigation, Y.J. and G.T.; resources, Y.W.; data curation, S.W.; writing—original draft preparation, Y.J.; writing—review and editing, B.Z.; visualization, S.Y.; supervision, G.T.; project administration, Y.W.; funding acquisition, G.T. All authors have read and agreed to the published version of the manuscript.

Funding

This research was funded by National Nature Science Foundation of China, grant number 52371262.

Data Availability Statement

The original contributions presented in this study are included in the article. Further inquiries can be directed to the corresponding author.

Conflicts of Interest

Authors Yadong Wang, Songsong Yu, and Siyu Wang were employed by the company Central Southern China Electric Power Design Institute Co., Ltd. of China Power Engineering Consulting Group. The remaining authors declare that the research was conducted in the absence of any commercial or financial relationships that could be construed as a potential conflict of interest.

References

  1. DNV-RP-F109; On-Bottom Stability Design of Submarine Pipelines, Cables and Umbilical. Det Norske Veritas: Bærum, Norway, 2021.
  2. Bearman, P.W.; Zdravkovich, M.M. Flow around a circular cylinder near a plane boundary. J. Fluid Mech. 1978, 89, 33–47. [Google Scholar] [CrossRef]
  3. Lei, C.; Cheng, L.; Kavanagh, K. Re-examination of the effect of a plane boundary on force and vortex shedding of a circular cylinder. J. Wind Eng. Ind. Aerodyn. 1999, 80, 263–286. [Google Scholar] [CrossRef]
  4. Oner, A.A.; Kirkgoz, M.S.; Akoz, M.S. Interaction of a current with a circular cylinder near a rigid bed. Ocean Eng. 2008, 35, 1492–1504. [Google Scholar] [CrossRef]
  5. Buresti, G.; Lanciotti, A. Mean and fluctuating forces on a circular cylinder in cross-flow near a plane surface. J. Wind Eng. Ind. Aerodyn. 1992, 41, 639–650. [Google Scholar] [CrossRef]
  6. Liu, M.; Tang, G.; Zhang, Q.; Jin, X. Numerical investigate of the effects of surface roughness on local scour around pipeline under steady current condition. Ocean Eng. 2023, 290, 116077. [Google Scholar] [CrossRef]
  7. Huang, X.; Zhao, D.; Zuo, G.; Ren, J.; Tang, G. Numerical investigation on the hydrodynamic coefficients of subsea suspended pipelines under unidirectional currents. Water 2025, 17, 1382. [Google Scholar] [CrossRef]
  8. Akoz, M.S. Investigation of vortical flow characteristics around a partially buried circular cylinder. Ocean Eng. 2012, 52, 35–51. [Google Scholar] [CrossRef]
  9. Jensen, B.L.; Sumer, B.M.; Jensen, H.R.; Fredsøe, J. Flow around and forces on a pipeline near a scoured bed in steady current. J. Offshore Mech. Arct. 1990, 112, 206–213. [Google Scholar] [CrossRef]
  10. Chen, L.; Wang, Y.; Sun, S.; Wang, S. The effect of boundary shear flow on hydrodynamic forces of a pipeline over a fully scoured seabed. Ocean Eng. 2020, 206, 107326. [Google Scholar] [CrossRef]
  11. Jo, C.H.; Lee, S.B.; Shin, Y.S.; Hong, S.G.; Min, K.H. Numerical and experimental study of offshore pipeline stability in trench. J. Waterw. Port Coast. Ocean Eng. 2002, 128, 258–270. [Google Scholar] [CrossRef]
  12. Sumer, B.M.; Mao, Y.; Fredsøe, J. Interaction between vibrating pipe and erodible bed. J. Waterw. Port Coast. 1988, 114, 81–92. [Google Scholar] [CrossRef]
  13. Zhang, Z.; Chiew, Y.M.; Ji, C. Experimental study on local scour around a forced vibrating pipeline in unidirectional flows. Coast. Eng. 2022, 176, 104162. [Google Scholar] [CrossRef]
  14. Menter, F.R. Two-equation eddy-viscosity turbulence models for engineering applications. AIAA J. 1994, 32, 1598–1605. [Google Scholar] [CrossRef]
  15. Menter, F.R.; Kuntz, M.; Langtry, R. Ten years of industrial experience with the SST turbulence model. Heat Mass Transf. 2003, 4, 625–632. [Google Scholar]
  16. Lee, J.Y.; Hardjanto, F.A.; Cossu, R.; Chai, S.; Leong, Z.Q.; Forresta, A.L. Current-induced scour beneath initially elevated subsea pipelines. Appl. Ocean Res. 2019, 82, 309–324. [Google Scholar] [CrossRef]
  17. Tang, G.; Cheng, L.; Lu, L.; Teng, Y.; Zhao, M.; An, H. Effect of oscillatory boundary layer on hydrodynamic forces on pipelines. Coast. Eng. 2018, 140, 114–123. [Google Scholar] [CrossRef]
  18. Zhao, M.; Cheng, L.; Teng, B.; Dong, G. Hydrodynamic forces on dual cylinders of different diameters in steady currents. J. Fluid Struct. 2007, 23, 59–83. [Google Scholar] [CrossRef]
  19. Richardson, J.F.; Zaki, W.N. Sedimentation and fluidization, part I. Trans. Inst. Chem. Eng. 1954, 32, 35–53. [Google Scholar]
  20. Soulsby, R. Dynamics of Marine Sands; Tomas Telford: London, UK, 1997. [Google Scholar]
  21. Van Rijn, L.C. Mathematical modeling of morphological processes in the case of suspended sediment transport. Delft Hydraul. Commun. 1987, 382, 44–48. [Google Scholar]
  22. Soulsby, R.; Whitehouse, R. Threshold of sediment motion in coastal environments. In Pacific Coasts and Ports ’97: Proceedings of the 13th Australasian Coastal and Ocean Engineering Conference and the 6th Australasian Port and Harbour Conference; University of Canterbury: Christchurch, New Zealand, 1997; Volume 1, pp. 149–154. [Google Scholar]
  23. Brørs, B. Numerical modeling of flow and scour at pipelines. J. Hydraul. Eng. 1999, 125, 511–523. [Google Scholar] [CrossRef]
  24. Liang, D.; Cheng, L.; Li, F. Numerical modeling of flow and scour below a pipeline in currents. Coast. Eng. 2005, 52, 43–62. [Google Scholar] [PubMed]
  25. Zhao, M.; Cheng, L. Numerical modeling of local scour below a piggyback pipeline in currents. J. Hydraul. Eng. 2008, 134, 1452–1463. [Google Scholar] [CrossRef]
  26. Mao, Y. The Interaction Between a Pipeline and an Erodible Bed. Ph.D. Thesis, Technical University of Denmark, Lyngby, Denmark, 1986. [Google Scholar]
  27. Cheng, L.; Yeow, K.; Zhang, Z.; Teng, B. Three-dimensional scour below offshore pipelines in steady currents. Coast. Eng. 2009, 56, 577–590. [Google Scholar] [CrossRef]
Figure 1. Sketch of the computational domain.
Water 17 02737 g001
Figure 2. Mesh around the pipeline.
Water 17 02737 g002
Figure 3. Seabed profiles with different mesh densities.
Water 17 02737 g003
Figure 4. Comparison between the present model and the available numerical and experimental results (Zhao and Cheng (2008) [25], Mao (1986) [26]).
Water 17 02737 g004
Figure 5. Seabed profiles with different Shields numbers at Re = 5 × 10⁴.
Water 17 02737 g005
Figure 6. Seabed profiles with different Reynolds numbers at θ/θcr = 2.
Water 17 02737 g006
Figure 7. Variation in time-averaged drag coefficient with Shields number at the same Reynolds number: (a) Re = 1 × 10⁴; (b) Re = 4 × 10⁴; (c) Re = 5 × 10⁴; (d) Re = 8 × 10⁴.
Water 17 02737 g007
Figure 8. Variation in time-averaged drag coefficient with the Reynolds number at the same Shields number: (a) θ/θcr = 1.8; (b) θ/θcr = 2; (c) θ/θcr = 2.2.
Water 17 02737 g008
Figure 9. Distribution of time-averaged pressure coefficient of pipeline under two kinds of seabed conditions at θ/θcr = 2: (a) flat seabed; (b) scoured seabed.
Water 17 02737 g009
Figure 10. Flow field around the pipelines under two kinds of seabed conditions: (a) flat seabed; (b) scoured seabed.
Water 17 02737 g010
Figure 11. Variation in the scour depth and the reduction coefficient of time-averaged drag force at the same Reynolds number: (a) Re = 4 × 10⁴; (b) Re = 5 × 10⁴; (c) Re = 8 × 10⁴.
Water 17 02737 g011
Table 1. Values of the model constants in the SST k-ω turbulence model.
β*α1β1σk1σω1α2β2σk2σω2
0.095/93/400.850.50.440.08281.00.856
Table 2. Mesh parameters at different densities.
NtNpΔ1
Coarse11,123600.01D
Medium15,9881000.005D
Fine25,4441400.0025D
Finest35,0781800.0015D
Table 3. Results at different time steps.
t (s) C ¯ D C ¯ L St
0.00050.32−0.09080.251
0.000750.321−0.09080.250
0.0010.324−0.0910.252
Table 4. Validation case for model accuracy.
LiteratureParameterValue
Zhao and Cheng [25] and Mao [26]Depth of water (d)0.65 m
Diameter of pipeline (D)0.1 m
Median particle size of sediment (d50)0.36 mm
Shields number (θ)0.1
Jensen et al. [9]Depth of water (d)0.23 m
Diameter of pipeline (D)0.03 m
Reynolds number (Re)1 × 10⁴
Table 5. Comparison between the present model and the available numerical results.
C ¯ D C ¯ L St
Num., Zhao and Cheng [25]0.34−0.0830.242
Num., Present0.32−0.0910.251
Exp., Jensen et al. [9]0.96−0.210.17
Num., Present0.97−0.180.17
Table 6. Cases in the present study.
θ/θcr1.21.41.61.822.22.5
Re0.390.420.450.480.50.530.56
U0
1 × 1040.0260.0240.0220.0210.020.0190.018
2 × 1040.0510.0480.0440.0420.040.0380.036
3 × 1040.0750.070.0670.0630.060.0570.054
4 × 1040.10.0950.090.0830.080.0750.07
5 × 1040.130.120.110.1050.10.0950.09
6 × 1040.150.140.130.1250.120.1150.11
7 × 1040.180.1650.1550.1450.140.130.125
8 × 1040.210.190.180.1650.160.150.14
1 × 1050.250.240.220.210.20.190.18
Note(s): The values in the table represent the diameter of the pipeline at different Reynolds numbers and Shields numbers.
Table 7. Numerical results of the cases at Re = 5 × 10⁴.
U00.560.530.50.480.450.420.39
D0.090.0950.10.1050.110.120.13
θ/θcr2.52.221.81.61.41.2
Se0.0620.0630.0630.0650.0670.0640.064
Se/D0.690.670.630.620.610.530.49
Table 8. Numerical results of the cases at θ/θcr = 2.
U00.50.50.50.50.50.5
D0.060.080.10.120.140.16
Re3 × 1044 × 1045 × 1046 × 1047 × 1048 × 104
Se0.0400.0550.0680.0790.0870.093
Se/D0.6850.6830.6810.6550.6210.582
Table 9. Numerical results for different Reynolds number and Shields number.
θ/θcrReλCD
1.81 × 10410.2%
1.82 × 10⁴−9.5%
1.83 × 10⁴−11.9%
1.84 × 10⁴−20.7%
1.85 × 10⁴−19.6%
1.86 × 10⁴−24.8%
1.87 × 10⁴−25.6%
1.88 × 10⁴−23.5%
1.81 × 10⁵−26.6%
2.01 × 10410.5%
2.02 × 10⁴−4.2%
2.03 × 10⁴−8.6%
2.04 × 10⁴−13.4%
2.05 × 10⁴−20.4%
2.06 × 10⁴−23.6%
2.07 × 10⁴−28.3%
2.08 × 10⁴−27.5%
2.01 × 10⁵−30.0%
2.21 × 1048.1%
2.22 × 10⁴−16.3%
2.23 × 10⁴−18.3%
2.24 × 10⁴−22.4%
2.25 × 10⁴−23.1%
2.26 × 10⁴−24.8%
2.27 × 10⁴−23.7%
2.28 × 10⁴−25.1%
2.21 × 10⁵−29.8%
Disclaimer/Publisher’s Note: The statements, opinions and data contained in all publications are solely those of the individual author(s) and contributor(s) and not of MDPI and/or the editor(s). MDPI and/or the editor(s) disclaim responsibility for any injury to people or property resulting from any ideas, methods, instructions or products referred to in the content.