Article

Spatiotemporal Monitoring of the Effects of Climate Change on the Water Surface Area of Sidi Salem Dam, Northern Tunisia

1
International Association of Water Resources in the Southern Mediterranean Basin, Gafsa 2112, Tunisia
2
Laboratory for the Application of Materials to the Environment, Water and Energy (LAM3E), University of Gafsa, Gafsa 2112, Tunisia
3
Institute of Hydro-Meteorological of Training and Research of Oran, P.O. Box 7019, Seddikia, Oran 31025, Algeria
4
School of Science and Technology, Geology Division, University of Camerino, 62032 Camerino, Italy
5
Department of Earth and Atmospheric Sciences, Science and Research Building 1, University of Houston, 3507 Cullen Blvd, Room 312, Houston, TX 77204, USA
*
Author to whom correspondence should be addressed.
Water 2025, 17(18), 2738; https://doi.org/10.3390/w17182738
Submission received: 7 August 2025 / Revised: 3 September 2025 / Accepted: 11 September 2025 / Published: 16 September 2025
(This article belongs to the Section Water and Climate Change)

Abstract

This research presents a comprehensive spatiotemporal assessment of the effects of climate change and anthropogenic pressures on the water surface area and quality of the Sidi Salem Dam, the largest reservoir in Northern Tunisia. Located within a sub-humid to Mediterranean humid bioclimatic zone, the dam plays a vital role in regional water supply, irrigation, and flood control. Utilizing a 40-year dataset (1985–2025), this study integrates multi-temporal satellite imagery and geospatial analysis using Geographic Information System (GIS) and remote sensing (RS) techniques. The temporal variability of the dam’s surface water extent was monitored through indices such as the Normalized Difference Water Index (NDWI). The analysis was further supported by climate data, including records of precipitation, temperature, and evapotranspiration, to assess correlations with observed hydrological changes. The findings revealed a significant reduction in the dam’s surface area, from approximately 37.8 km2 in 1985 to 19.8 km2 in 2025, indicating a net loss of 18 km2 (47.6%). The Mann–Kendall trend test confirmed a significant long-term increase in annual precipitation, while annual temperature showed no significant trend. Nevertheless, recent observations indicate a decline in precipitation during the most recent period. Furthermore, Pearson correlation analysis revealed a significant negative relationship between precipitation and temperature, suggesting that wet years are generally associated with cooler conditions, whereas dry years coincide with warmer conditions. This hydroclimatic interplay underscores the complex dynamics driving reservoir fluctuations. Simultaneously, land use changes in the catchment area, particularly the expansion of agriculture, urban development, and deforestation have led to increased surface runoff and soil erosion, intensifying sediment deposition in the reservoir. This has progressively reduced the dam’s storage capacity, further diminishing its water storage efficiency. This study also investigates the degradation of water quality associated with declining water levels and climatic stress. Indicators such as turbidity and salinity were evaluated, showing clear signs of deterioration resulting from both natural and human-induced processes. Increased salinity and pollutant concentrations are primarily linked to reduced dilution capacity, intensified evaporation, and agrochemical runoff containing fertilizers and other contaminants.

1. Introduction

Droughts and other natural disasters continue to place increasing pressure on global water resources [1,2]. In response, many countries, including Tunisia, have constructed dams and reservoirs to meet the growing demand for water [3,4,5,6,7]. These stored water resources are vital for various sectors, including agriculture, domestic use, tourism, industry, and hydropower generation. Reservoirs also serve as essential buffers during periods of water scarcity [8,9,10,11,12].
In northern Tunisia, water resources face significant challenges due to the impacts of climate change, leading to fluctuating water levels, particularly in major reservoirs such as the Sidi Salem Dam [11,12]. As the largest dam in Tunisia, it is a key hydraulic structure built on the Medjerda River and completed in the early 1980s. It plays a crucial role in regulating the river’s flow, mitigating floods, and supplying water to major areas, including Tunis, Cap Bon, and the Sahel. It also supports irrigation in the fertile Medjerda Valley, making it indispensable for both urban and agricultural water supply [13,14]. In addition, declining rainfall and rising temperatures associated with climate change have contributed to a noticeable decrease in water levels, further threatening the dam’s ability to meet growing water demands.
Given its strategic importance, monitoring the water levels and surface area of the Sidi Salem Dam is critical for sustainable water resource management. Traditional field-based monitoring methods, while accurate, can be time-consuming, costly, and limited in spatial and temporal coverage. In contrast, remote sensing (RS) and Geographic Information System (GIS) technologies offer efficient and scalable solutions for monitoring long-term changes in reservoir water bodies. This integrated approach is essential for assessing the effects of climate change and land use transformations, as well as for informing water allocation and management strategies.
This study examines long-term changes in the water surface area of the Sidi Salem Dam over a 40-year period (1985–2025) using satellite imagery. It also incorporates meteorological data such as rainfall and temperature trends to assess their influence on water level fluctuations. The findings highlight the impacts of both environmental and anthropogenic factors on water availability. The integration of RS and GIS technologies proves to be a reliable and cost-effective approach for supporting informed decision-making in water resource planning and management.

2. Description of the Study Area

The study area is centered on the Sidi Salem Dam, located in the northern region, approximately 70 km west-southwest of Tunis and about 4.5 km northwest of the town Testour, positioned at 36.590499° N latitude and 9.396948° E longitude (Figure 1). This strategic dam is built on the Medjerda River, Tunisia’s longest and most important river, which originates in Algeria and flows eastward across northern Tunisia before emptying into the Gulf of Tunis [11,12].
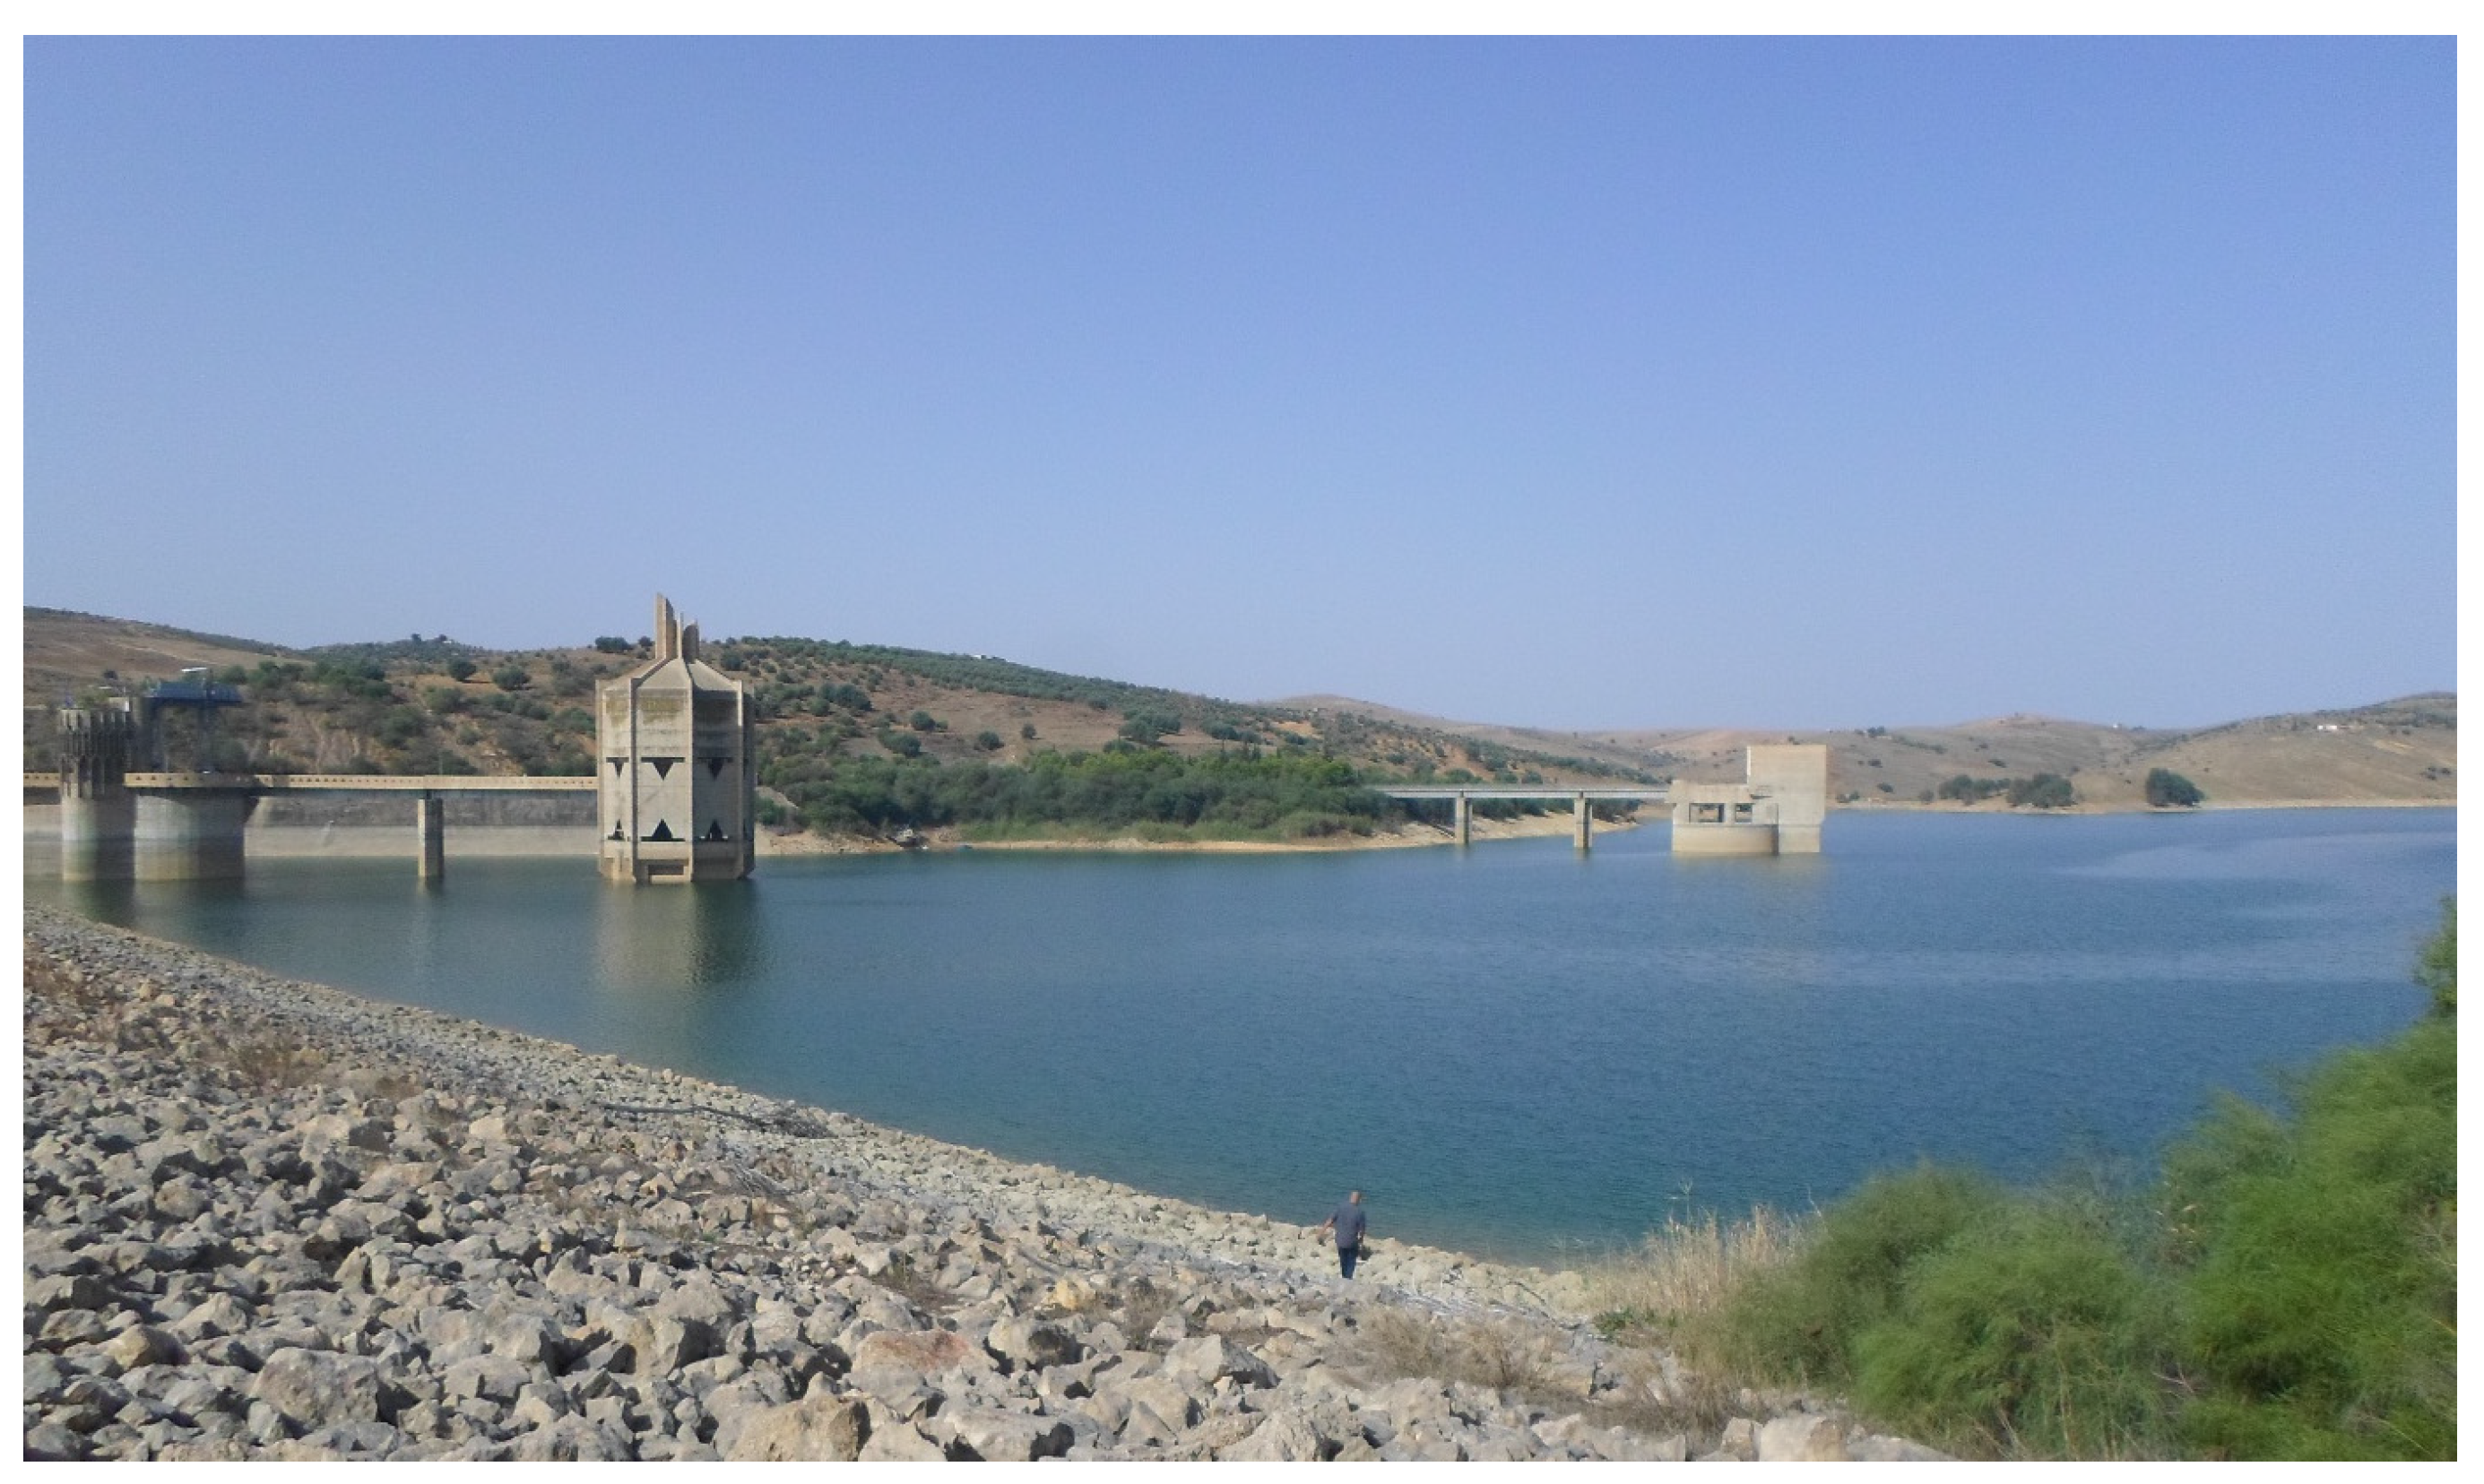
The dam has a reservoir surface area of approximately 90 km2, a total storage capacity of 980 million m3, and a contributing watershed area of about 18,000 km2 [13,14] (Figure 2). However, about 20% (190 million m3) of the initial water storage capacity has been lost due to sedimentation over the past 36 years, reducing the current effective storage capacity to around 790 million m3 [13].
The Sidi Salem reservoir, located in Tunisia’s Great Plains, lies mainly within a narrow valley and extends up to 50 km when full. Its morphology results in a larger epilimnion (surface water layer) compared to the hypolimnion (deep water layer), especially at lower water levels. At 100 m NGT, the epilimnion volume is 2.6 times greater than the hypolimnion; this ratio decreases to 1.3 at 110 m NGT due to the widening of the valley. Since algae grow in the epilimnion and decompose in the hypolimnion, this imbalance may lead to oxygen depletion in deep waters during summer stagnation, increasing the risk of eutrophication [14,16].
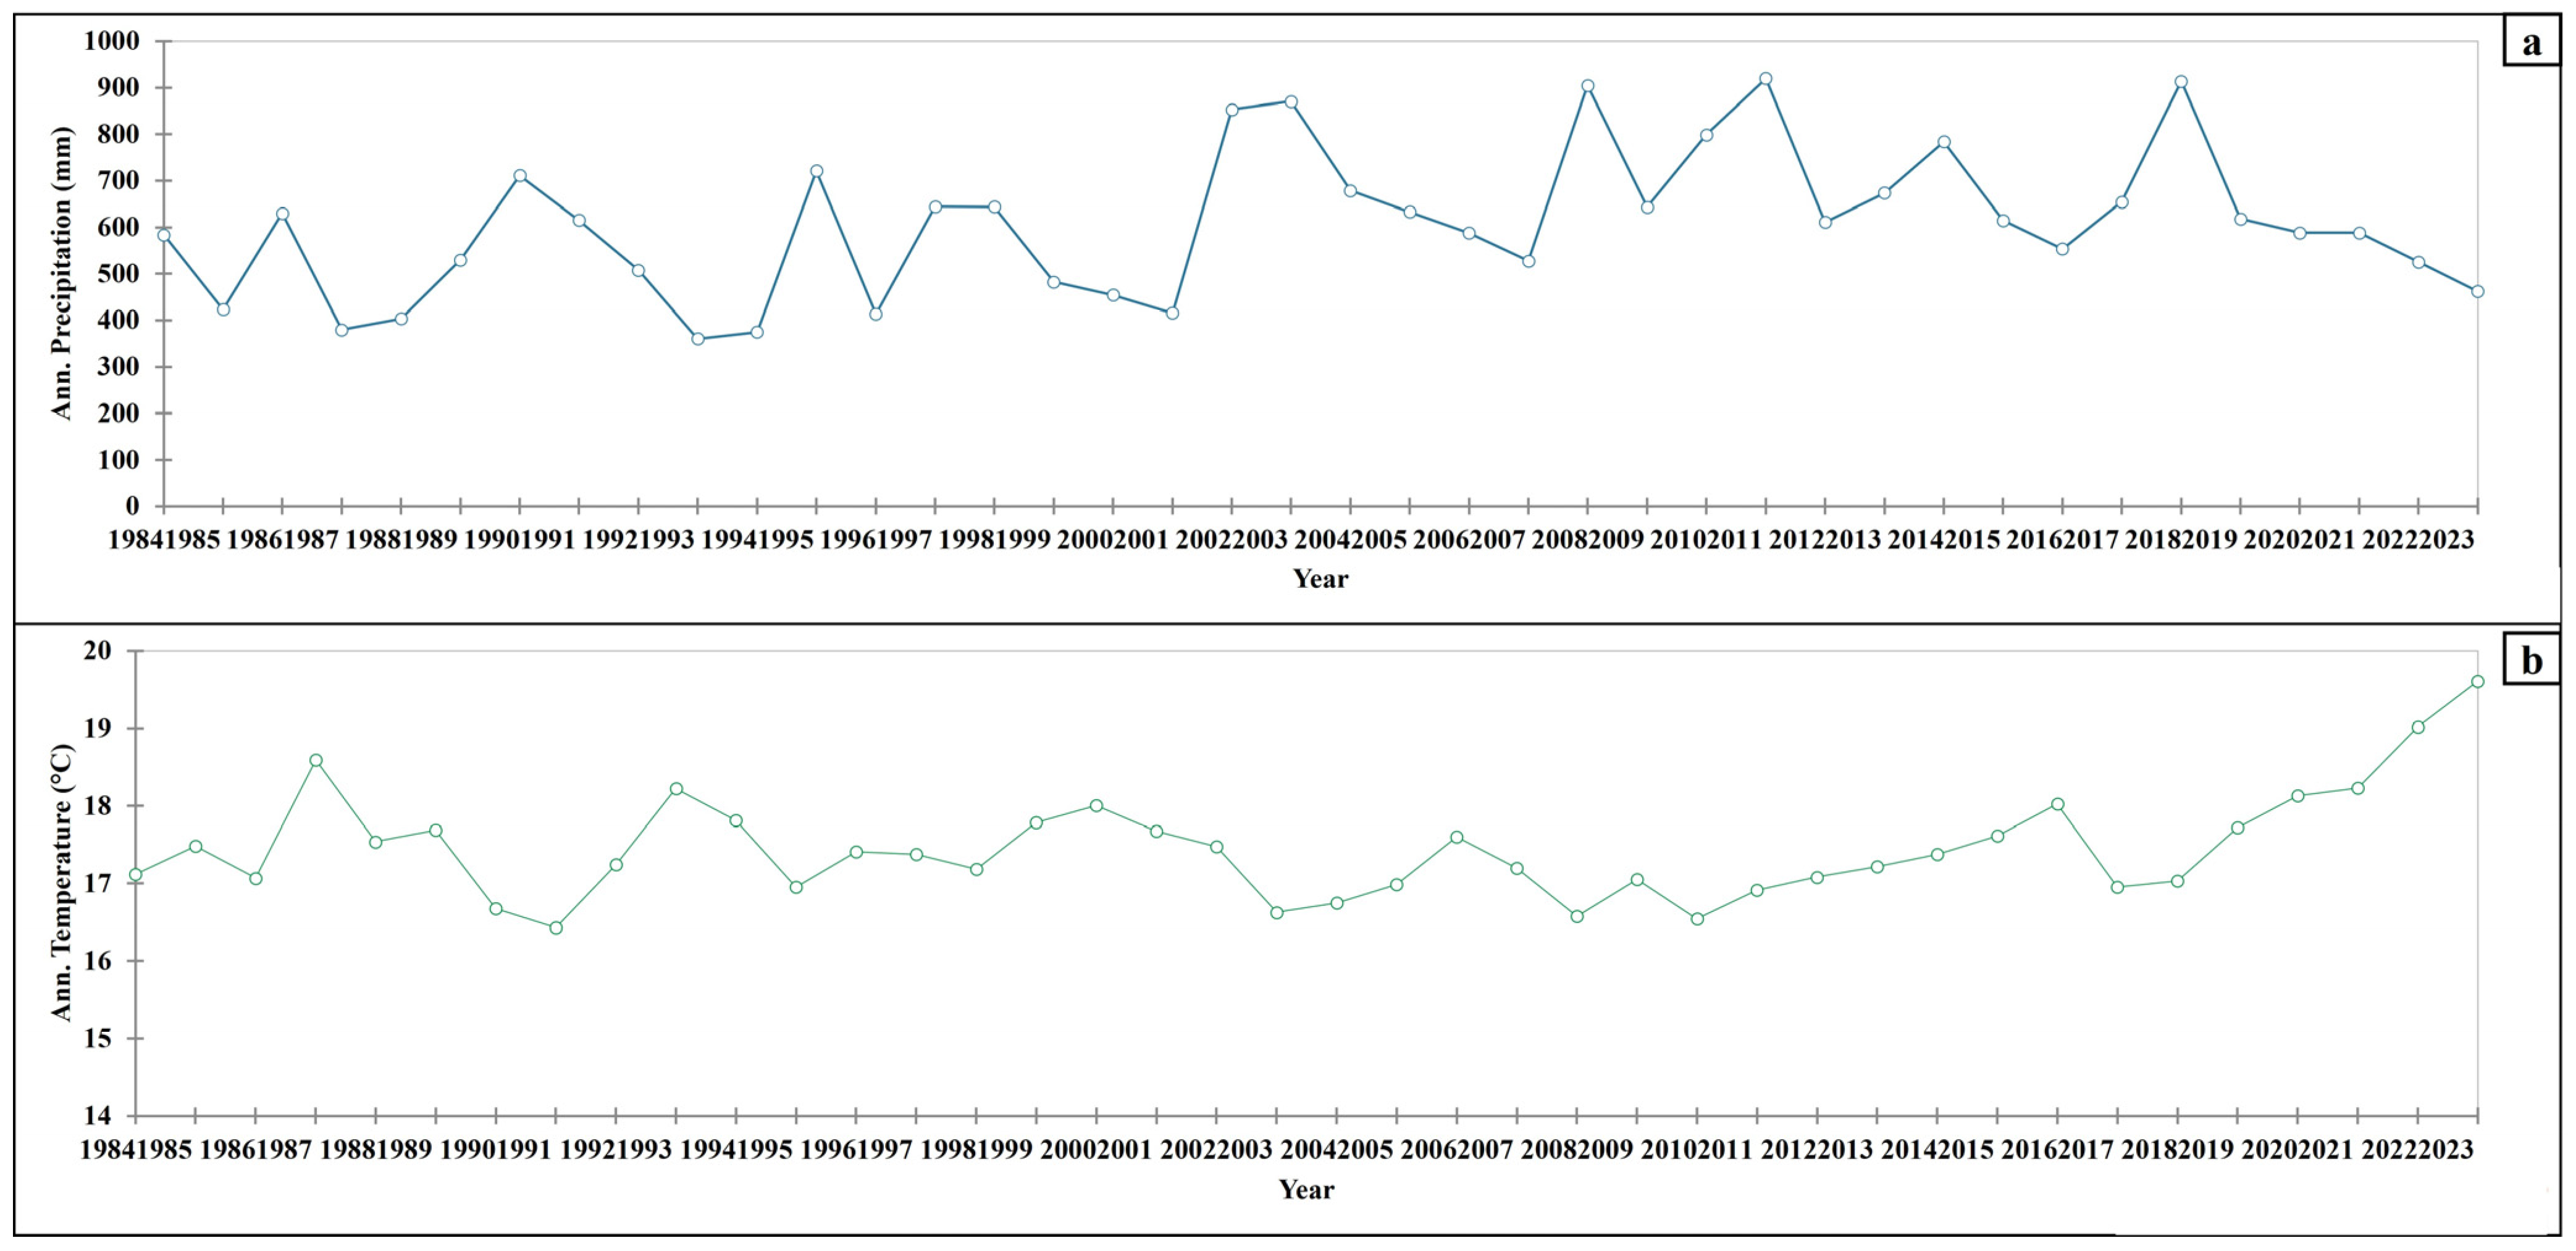
According to climatic data obtained from NASA [17], Figure 3 presents the characteristics of the study area, which exhibits a typical Mediterranean climate [18], with wet winters and hot, dry summers. Annual rainfall in the area typically ranges between 360 and 920 mm. For the period of 1984–2024, an annual precipitation was 607 mm, with monthly values ranging from 7 mm in July to 83 mm in January. The rainy season lasts from September to May, followed by the dry season from June to August. The average annual temperature is 17.5 °C, ranging between 16.4 °C and 19.6 °C, with highs of up to 27.7 °C in August and lows of 8.7 °C in January. The relative humidity is highest in January (97.3%) and lowest in July (48%).
The Sidi Salem Dam is located in the Medjerda Valley, a Neogene basin primarily composed of continental deposits such as conglomerates, sandstones, and clays. The basin is overlain by Quaternary sediments, while older rock formations from the Paleogene, Cretaceous, and Triassic periods outcrop along a southwest–northeast alignment. A key geological feature of the area is the presence of Triassic diapiric structures, dome formations that began to emerge at the end of the Lower Cretaceous and continued through the Tertiary. These structures include clays, sandstones, dolomites, and gypsum and are associated with tectonic sills aligned in the same direction [10,11,19,20,21,22].
Erosion is a major concern throughout the Medjerda watershed. Soil degradation is primarily influenced by the nature of the terrain and the intensity of rainfall. Due to the dominance of sedimentary rocks and the presence of metamorphic and volcanic rocks, heavy winter precipitation leads to significant erosion [14]. Additionally, the presence of Triassic gypsum deposits, which dissolve over time, likely contributes to the high salinity observed in the Medjerda River [22].
In addition to its hydrological and ecological functions, the Sidi Salem Dam plays a central role in Tunisia’s national water management strategy, serving multiple purposes, including irrigation, urban supply, industry, and inter-basin transfers. Irrigation is the dominant use, consuming nearly 65–70% of the reservoir’s resources, with demand increasing from about 700 to 800 million m3/year in the 1990s to more than 1000 million m3/year by 2020 as irrigated perimeters expanded in the Lower Medjerda Valley and the Cap Bon Peninsula [13,23,24,25,26].
The dam is also the main source of drinking water for northern and coastal Tunisia, supplying major urban centers such as Greater Tunis, Bizerte, Nabeul, Sousse, and Sfax through the Medjerda–Cap Bon transfer system. Allocations for domestic use rose from roughly 350 million m3/year in 2000 to around 500 million m3/year in 2020, serving over five million inhabitants. Industrial demand, though comparatively small, has grown from nearly 50 million m3/year in 1990 to about 120 million m3/year in 2020, mainly supporting agro-industrial and chemical activities in the Medjerda Valley and Bizerte [13,25].
Furthermore, the dam regulates the Medjerda River’s flow, reduces flood risks, and contributes modestly to hydropower production. Its strategic role in water transfer projects allows the redistribution of up to 400 million m3/year from the relatively water-rich north toward the central and coastal regions of Tunisia. Overall, the total annual water demand linked to the Sidi Salem system rose from around 1100 million m3 in 1990 to 1850 million m3 in 2020, with projections indicating that requirements could exceed 2100 million m3/year by 2030 [27].

3. Materials and Methods

3.1. Data Collection

This study used a combination of satellite images to monitor changes in the water surface area of the Sidi Salem Dam between 1985 and 2025. The main remote sensing data came from the Landsat satellite series (TM, and OLI/TIRS), with images from the years 1985 and 2025 (Figure 4).
Both images were acquired in March, at the end of the humid (wet) season in the Mediterranean climate. Specifically, the Landsat-5 TM image was taken on 18 April 1985, and the Landsat-9 OLI/TIRS image on 10 April 2025. This period was deliberately selected to minimize seasonal variability in precipitation and evaporation, thereby ensuring comparability between the two datasets.
These images, provided by the USGS Earth Explorer platform [28], have a spatial resolution of 30 m and were used to detect changes in the reservoir’s water surface over time. The selected images were mostly cloud-free. The spectral and technical characteristics of both Landsat-5 and Landsat-9 sensors, including their wavelength ranges and sensor types, are presented in Table 1 [29].

3.2. Satellite Image Processing

The satellite images in this study were processed using ENVI (version 4.7) and ArcGIS pro (version 3.5.2). The processing involved two main steps: geometric correction and atmospheric correction. For geometric correction, the Landsat images were aligned with topographic maps at a scale of 1:80,000 using the UTM Zone 32 North projection and the WGS 84 datum. The first-order polynomial transformation and nearest neighbor method were applied to keep the original pixel values, with a final image resolution of 30 m. For atmospheric correction, the Darkest Pixel method was used to reduce the effects of the atmosphere, especially for cloud-free images. A relative radiometric normalization was also performed to make sure all the images looked similar, as if taken under the same conditions.

3.3. Multivariate Analysis

Radiometric indices are a type of multivariate analysis derived from combining spectral bands. They are widely used to simplify satellite data and emphasize specific environmental features such as water, salinity, turbidity, and vegetation health. In this study, four key indices were calculated to support the assessment of surface water and drought conditions at the Sidi Salem Dam:

3.3.1. Normalized Difference Water Index (NDWI)

The NDWI is used to detect surface water features by enhancing water reflectance while minimizing the influence of vegetation and soil. The formula is [30,31,32]
NDWI = G r e e n N I R G r e e n + N I R
Value range interpretation:
  • Values close to +1 indicate open water;
  • Values near 0 suggest bare soil or vegetation;
  • Negative values represent dense vegetation or built-up areas.
It should be noted that the spectral ranges of the Landsat-5 TM and Landsat-9 OLI/TIRS sensors are not identical, with the green band covering 0.52–0.60 µm for Landsat-5 and 0.53–0.59 µm for Landsat-9, while the NIR band spans 0.76–0.90 µm and 0.85–0.88 µm, respectively. These slight differences may introduce potential variability in NDWI values. However, previous studies have confirmed the overall compatibility of NDWI calculations between different Landsat sensors, particularly for water surface extraction. To minimize bias, images were acquired during the same season and underwent atmospheric correction, ensuring that the results are comparable across both datasets [33,34,35].

3.3.2. Normalized Difference Vegetation Index (NDVI)

The NDVI is used to measure vegetation health and density by comparing the reflectance of red and NIR bands. The formula is [31,32]
NDVI = N I R R e d N I R + R e d
Value range interpretation:
  • Dense vegetation: 0.6;
  • Moderate vegetation: 0.2 to 0.5;
  • Sparse or no vegetation (bare soil, water): <0.1.

3.3.3. Normalized Difference Drought Index (NDDI)

The NDDI is used to monitor drought conditions by analyzing water and vegetation stress. The formula is [32]
NDDI = N D V I N D W I N D V I + N D W I
Value range interpretation:
  • Higher values (>0.5) indicate severe drought or vegetation under water stress;
  • Lower values (<0.2) suggest healthy vegetation and adequate moisture.

3.3.4. Normalized Difference Salinity Index (NDSI)

The NDSI is used to detect salinity levels in soil or water by leveraging the spectral contrast between green and shortwave infrared (SWIR) bands. The formula is [36]
NDSI = G r e e n S W I R G r e e n + S W I R
Value range interpretation:
  • Higher values suggest saline surfaces or soil;
  • Lower values are typical of non-saline and vegetated areas.

3.3.5. Normalized Difference Turbidity Index (NDTI)

The NDTI is sed to measure water turbidity or sediment concentration by comparing the red and green bands, since suspended particles increase red reflectance. The formula is [37]
NDTI = R e d G r e e n R e d + G r e e n
Value range interpretation:
  • Higher values indicate turbid;
  • Lower or negative values indicate clear water.

3.3.6. Trend and Correlation Analysis

To investigate climatic variability in the study area, both the Mann–Kendall (MK) trend test and the Pearson correlation coefficient (r) were applied to rainfall and temperature time series using the XLSTAT add-in in Microsoft Excel. This combined methodology enables the detection of long-term trends and the quantification of inter-variable relationships, providing a comprehensive understanding of climatic variations in the study area.
The Mann–Kendall (MK) test
The MK test is a non-parametric method widely used to detect monotonic trends in hydroclimatic data [38,39]. The test statistic is calculated as follows:
S = k = 1 n 1 j = k + 1 n s i g n X j X k
where
n is number of data points; and Xj and Xk are the annual values in years j and k, j > k, respectively.
s i g n X j X k = 1          i f    X j X k > 0 0         i f    X j X k = 0 1      i f    X j X k < 0
Positive S values show an increasing or upward trend, and negative values of S indicate a decreasing or downward trend in the time series data.
The variance of test statistics VAR(S) can be achieved by the equation:
V a r S = n n 1 2 n + 5 i = 1 m t i   ( t i   1 ) ( 2 t i + 5 ) 18
where m = number of tied groups having similar values for a data group, and ti = number of data in the ith tied group.
The Z statistics (standard normal deviate) is calculated by
Z = S 1 V a r   ( S )   i f   S > 0 0   i f    S = 0 S + 1 V a r   ( S )    i f   S < 0
A positive Z indicates an upward trend, a negative Z a downward trend, and the significance of the trend is determined using the p-value, with results considered significant at p < 0.05.
The Pearson correlation coefficient
The Pearson correlation coefficient [40] (r) is the most widely used method to measure the linear correlation between two variables. It takes values between −1 and +1, indicating both the strength and direction of the relationship. Positive values indicate a direct relationship, negative values indicate an inverse relationship, and values near zero suggest little or no linear relationship. In this study, the Pearson correlation coefficient was calculated to assess the linear relationship between rainfall (x) and temperature (y) using the following formula:
r = n i = 1 n X i Y i   i = 1 n X i i = 1 n Y i n i = 1 n X i 2 ( i = 1 n X i ) 2 n i = 1 n Y i 2 ( i = 1 n Y i ) 2

4. Results and Discussion

The multivariate analysis using radiometric indices provided valuable insights into the environmental changes at the Sidi Salem Dam between 1985 and 2025:

4.1. Normalized Difference Water Index (NDWI)

The NDWI proved highly effective in identifying and delineating the spatial extent of surface water in the Sidi Salem Dam area. The index enabled a clear assessment of water distribution and its temporal variation between the years 1985 and 2025, particularly in relation to climatic stress and drought effects.
In 1985, the NDWI map (Figure 5a) revealed extensive water coverage, with the surface area reaching approximately 37.8 km2. This peak corresponds to a period of relatively stable hydrological input and favorable climatic conditions, characterized by higher precipitation and effective catchment runoff. The NDWI values were uniformly high across the reservoir, especially in the central and deeper zones, confirming the dam’s full storage capacity at that time.
By contrast, the 2025 NDWI map (Figure 5b) illustrates a dramatic shrinkage of the water body. The total surface area dropped to just 19.8 km2, indicating a net reduction of 18 km2, equivalent to 47.6% of the dam’s previous extent. This substantial decline is primarily attributed to intensified drought periods, reduced inflow, and possibly increased evaporation. The NDWI values in 2025 were significantly lower near the periphery and upstream zones, highlighting areas where the reservoir has receded most severely.
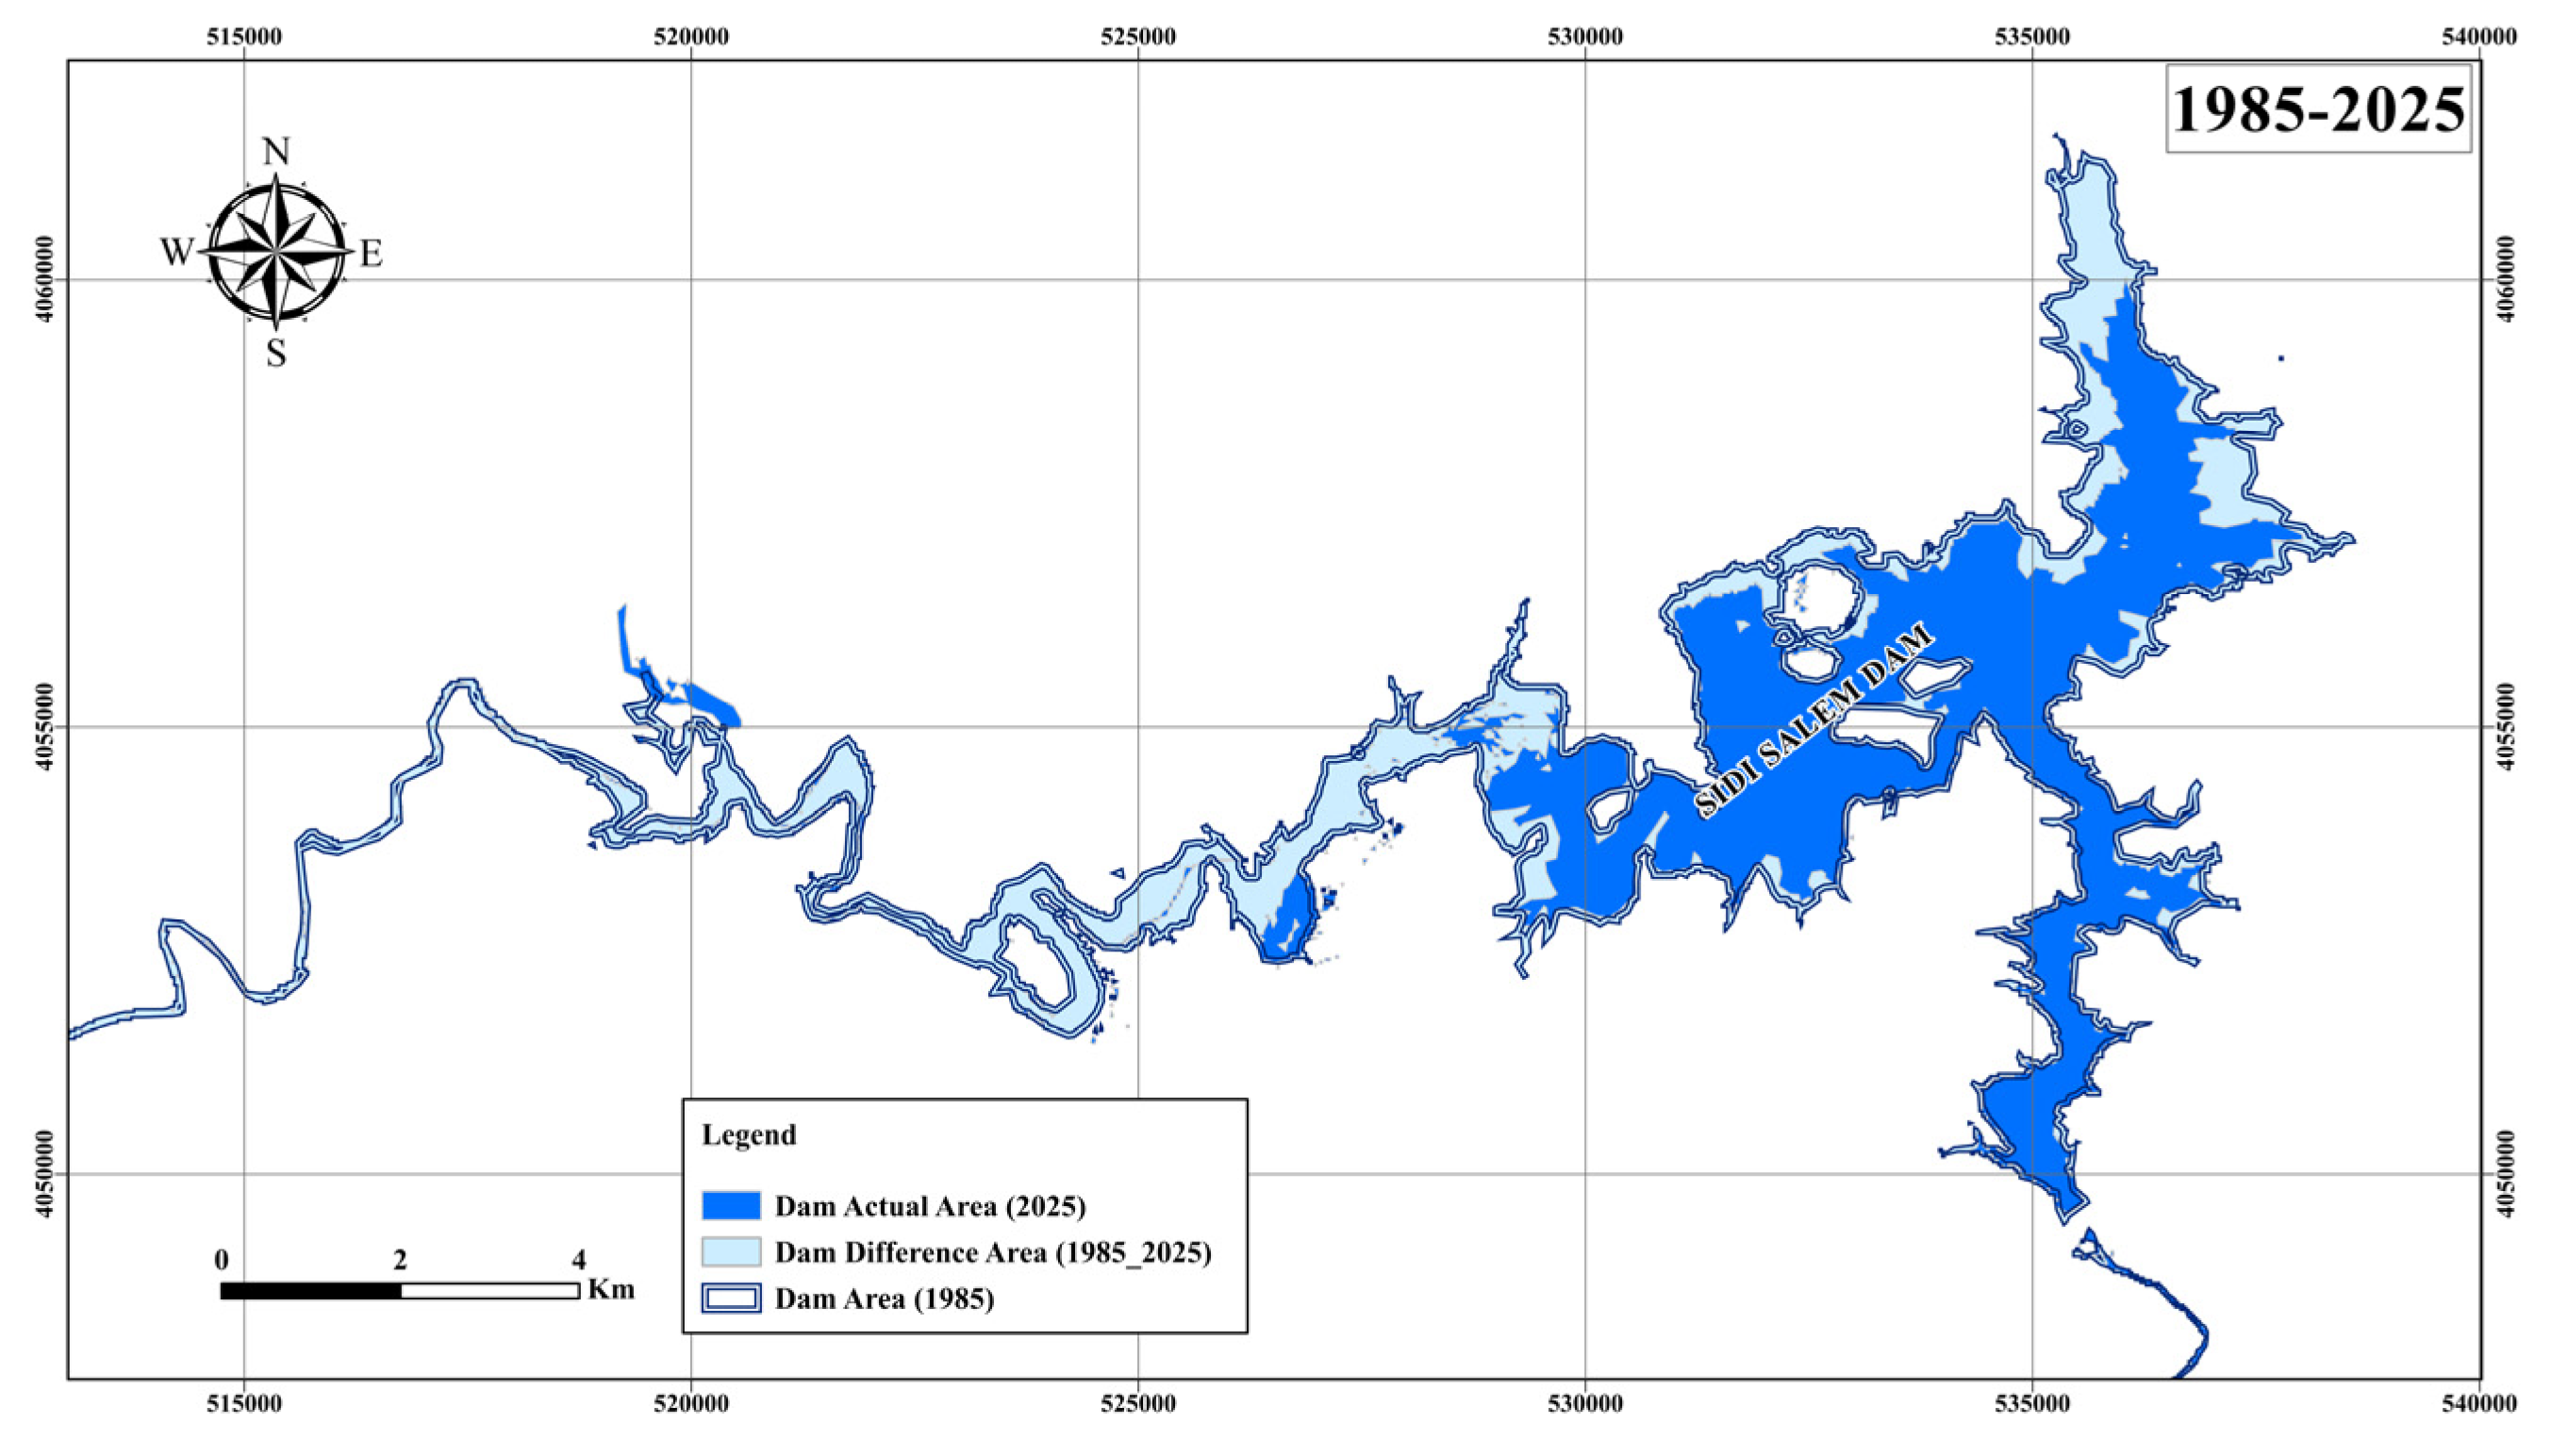
The spatial difference between the two periods is clearly visualized in Figure 6, which shows the subtraction of the NDWI values between 1985 and 2025. It emphasizes the zones of greatest loss, particularly in shallow regions, and helps identify the morphological transformation of the water body over time. These findings underscore the dam’s vulnerability to long-term climatic variability and support the importance of the NDWI as a tool for monitoring surface water dynamics under drought pressure.

4.2. Normalized Difference Vegetation Index (NDVI)

The NDVI analysis showed that the vegetation cover around the Sidi Salem Dam was generally lower in 1985 compared to 2025. In 1985, many areas exhibited low NDVI values, corresponding largely to water bodies and regions with sparse or no vegetation. This is consistent with the NDWI results, which indicated a larger water surface area during that year. Since water bodies typically register very low or negative NDVI values, these areas contributed to the overall lower NDVI in 1985 (Figure 7a). By 2025, although the water surface area had decreased significantly, Ω increased, reflecting some recovery or expansion of vegetation cover outside the reduced water extent (Figure 7b).
The field-based land use data indicate that the areas surrounding the dam are predominantly cultivated with cereal crops such as wheat and barley, which account for approximately 72–73% of the total agricultural land, along with irrigated crops, olive groves, vineyards, and small pasture areas [41]. The observed increase in NDVI from 1985 to 2025 likely reflects a combination of two processes: (a) the conversion of newly exposed land to cropland due to agricultural expansion; and (b) recolonization of previously shallow water areas by natural vegetation, indicating an adaptive ecological response. However, this greening trend should be interpreted with caution, as agricultural intensification may increase irrigation demands and pressure on water resources, whereas the recovery of natural vegetation highlights ecological resilience and potential support for local biodiversity. Overall, the NDVI increase from 1985 to 2025 appears linked to the decrease in water surface, illustrating a shift in land cover classes from water-dominated to more vegetated surfaces around the dam.

4.3. Normalized Difference Water Index (NDDI)

The analysis of the NDDI values over the Sidi Salem Dam basin reveals a marked intensification of drought conditions between 1985 and 2025, strongly influenced by the impacts of climate change. In 1985, the NDDI values were relatively low (ranging from 0.1 to 0.3), reflecting balanced hydrological conditions with adequate surface moisture and vegetation coverage. These values were consistent with a large water surface area (~37.8 km2) and favorable vegetation indices (NDVI), indicating a relatively stable environment with regular precipitation patterns (Figure 8a).
By contrast, in 2025, the NDDI values rose significantly (mostly between 0.5 and 0.8), indicating widespread and intensified drought across the watershed. This increase is directly linked to the ongoing effects of climate change, including reduced rainfall, higher temperatures, and increased evapotranspiration. These climatic shifts have led to a 47.6% decline in water surface area (reduced to ~19.8 km2), along with deteriorating vegetative health, especially in peripheral and agricultural zones (Figure 8b).
The spatial pattern of high NDDI values in 2025 reflects regions suffering from compounded stress due to both natural and anthropogenic factors, such as upstream water withdrawals, land degradation, and poor irrigation practices. However, the overarching driver remains climate change, which has altered precipitation regimes and prolonged dry seasons. These shifts are manifesting in lower soil moisture, diminished aquifer recharge, and reduced resilience of ecosystems to drought. The temporal comparison highlights a critical environmental transition in the basin and underscores the urgent need for climate-resilient water resource management strategies, sustainable land use planning, and early-warning systems to mitigate the increasing risks associated with climate-induced droughts.

4.4. Normalized Difference Turbidity Index (NDTI)

The NDTI analysis reveals a notable increase in turbidity levels in 2025 compared to 1985, especially in several distinct zones of the Sidi Salem Dam (Figure 9). In 1985, turbidity was relatively low and spatially confined, indicating stable sedimentation dynamics and limited inflow of suspended particles. By contrast, the 2025 map shows a significant expansion in areas with higher NDTI values, reflecting an overall rise in water turbidity.
This spatial shift suggests increased sediment inflow, likely driven by land degradation, intensified soil erosion, and reduced vegetation cover in the upstream watershed. Human activities such as construction and agriculture within the catchment area have contributed to more surface runoff, transporting sediments into the reservoir. Additionally, fluctuating rainfall patterns and extreme weather events, exacerbated by climate change, have further accelerated erosion processes and flood-driven sediment transport.
The highest turbidity levels are concentrated along inflow channels and near the dam structure, where suspended materials tend to accumulate. Elevated turbidity negatively impacts aquatic ecosystems by reducing light penetration, altering algal growth, and deteriorating water quality. Over time, continuous sedimentation can also reduce the reservoir’s storage capacity and impair hydraulic efficiency.
The clear differences between 1985 and 2025 underscore the urgent need for sustainable watershed management strategies, including soil conservation practices and systematic monitoring of sediment dynamics, to mitigate the adverse effects of turbidity on dam operations and ecosystem health.

4.5. Normalized Difference Salinity Index (NDSI)

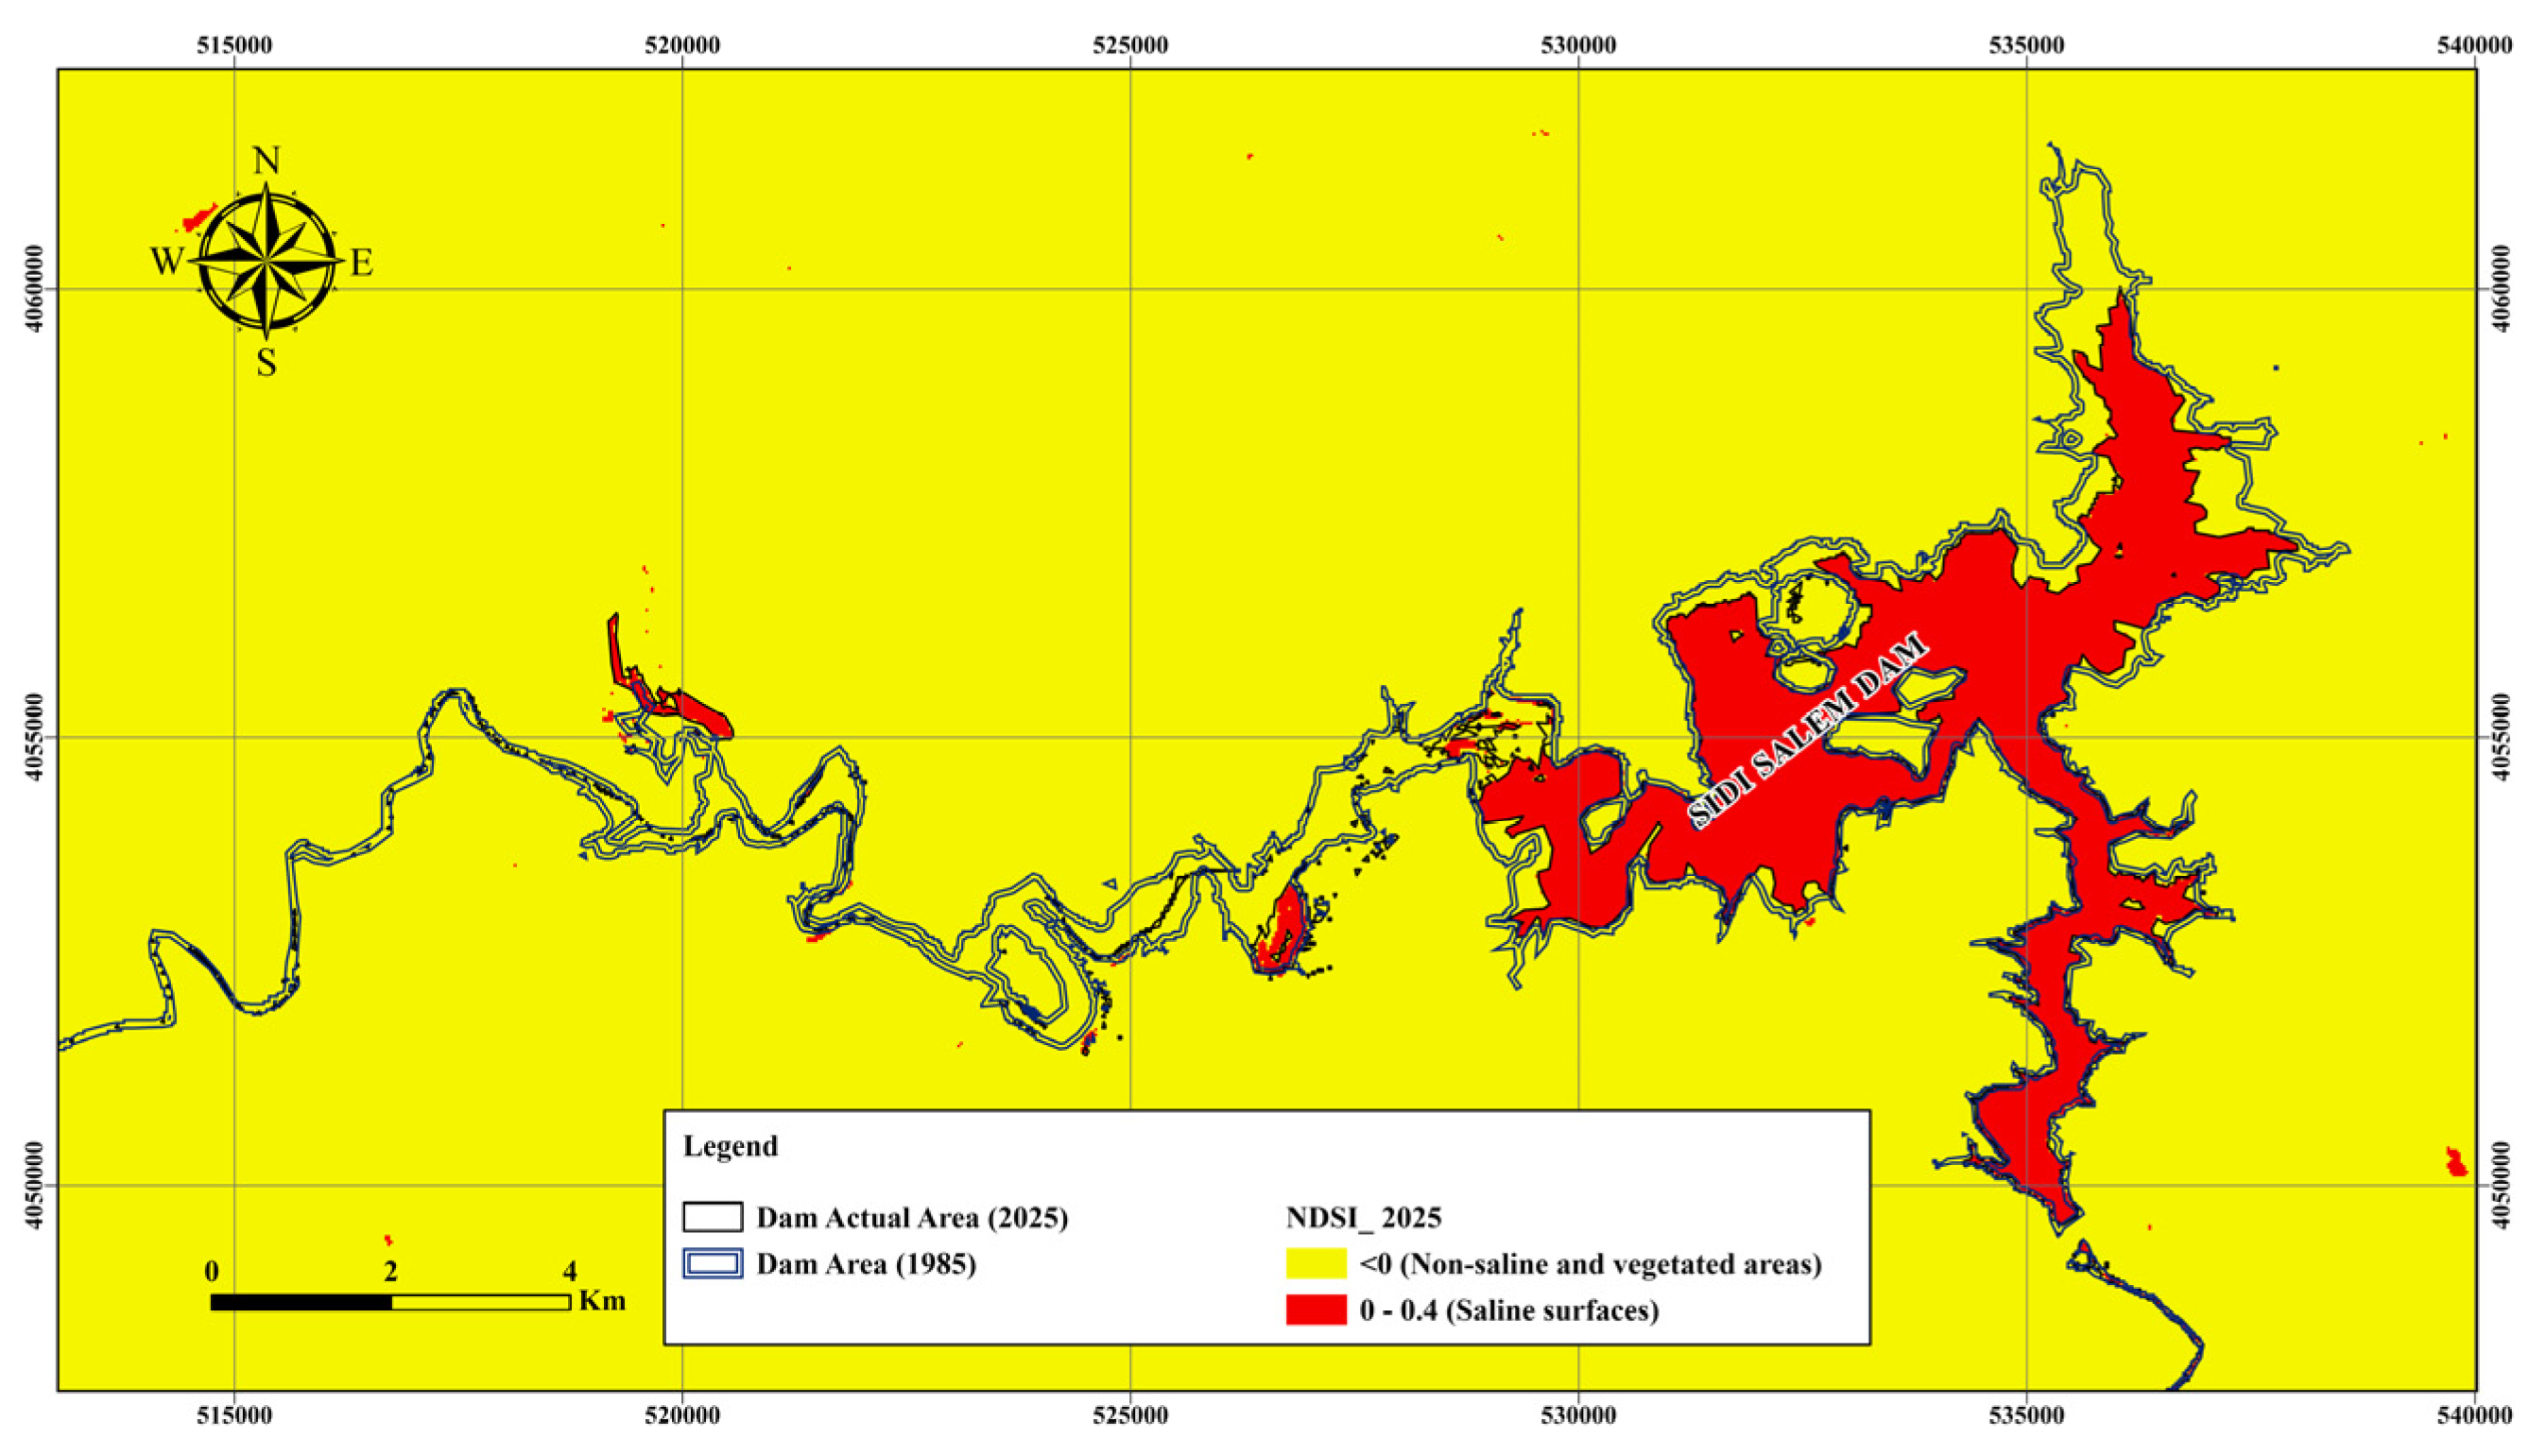
The NDSI map for the year 2025 shows that the highest salinity values are localized within the main water body of the Sidi Salem Dam (Figure 10), indicating a significant increase in surface water salinity. This high salinity can be explained by a combination of climatic and geological factors, as well as anthropogenic pressures.
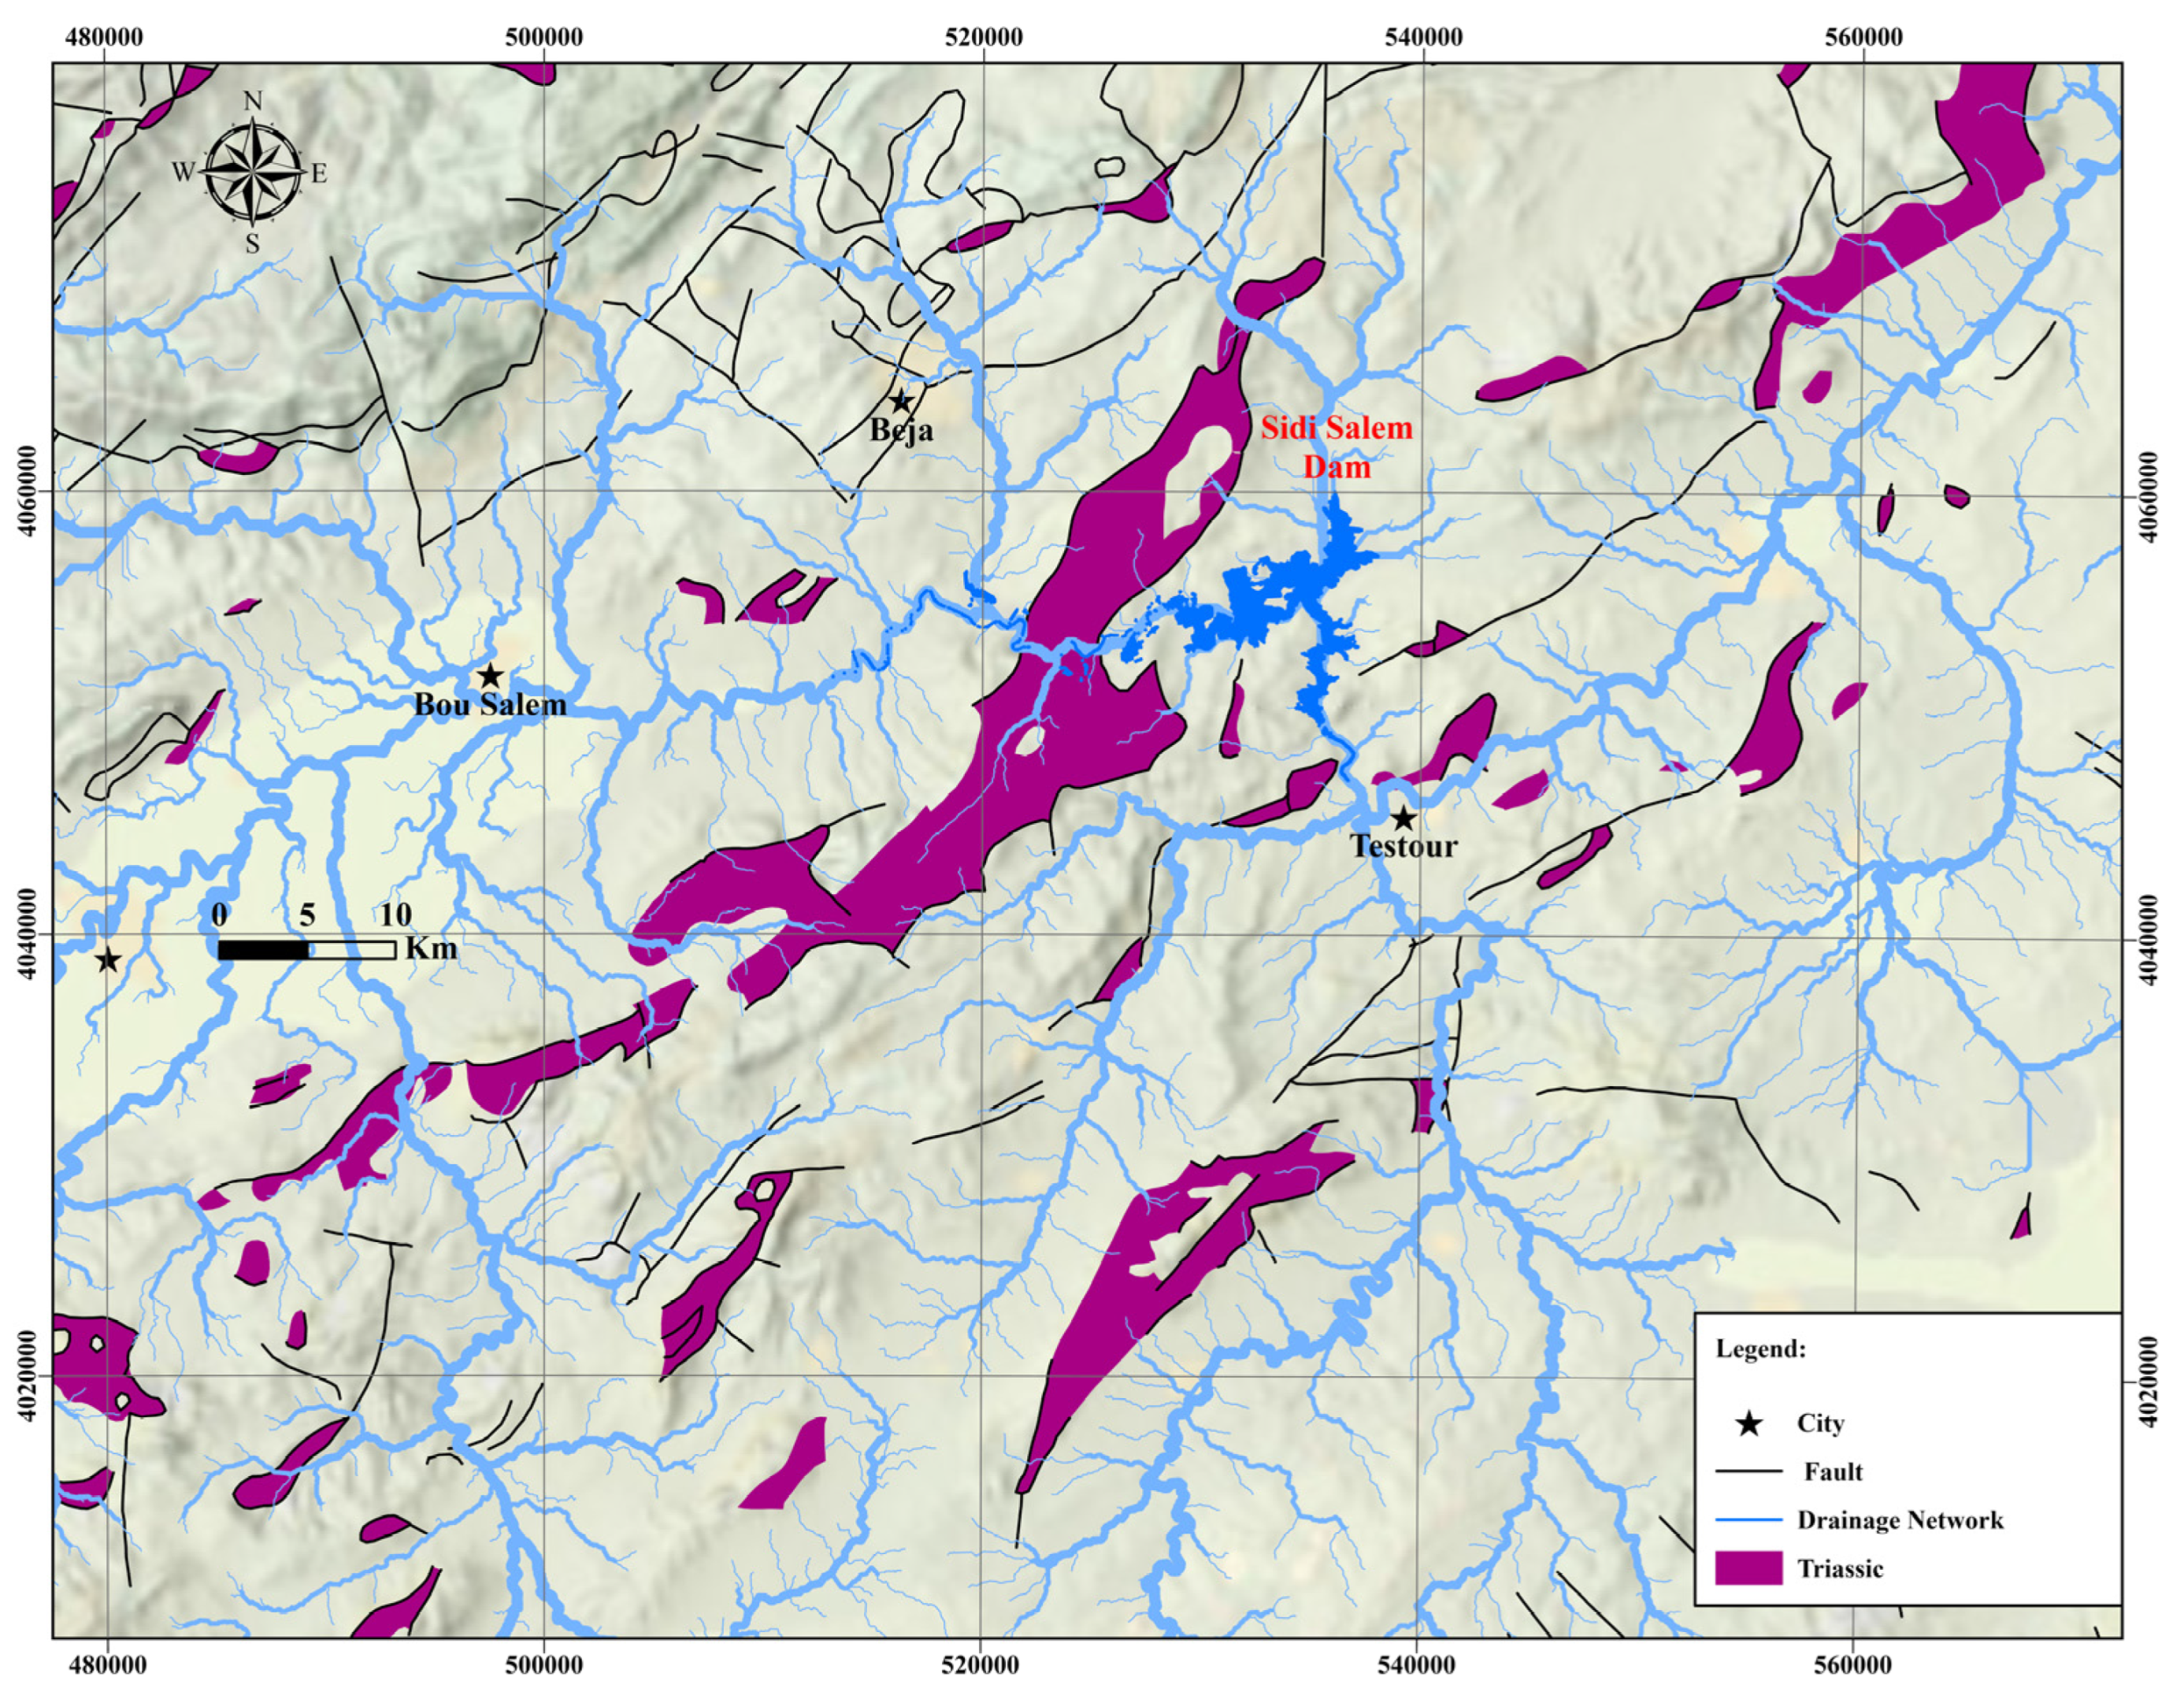
One of the key geological influences is the presence of a Triassic salt outcrop (diapir zone) in the area. This geological structure contributes to the natural salinization of surface and subsurface water through the dissolution of evaporitic deposits. As water interacts with salt-bearing formations, it becomes enriched in dissolved salts, which are then concentrated in the dam reservoir, especially under conditions of reduced water volume.
In addition, climate change has intensified this salinization process. The region has faced increased temperatures and prolonged droughts, leading to higher evaporation rates and a reduction in freshwater inflows. Between 1985 and 2025, the surface area of the dam decreased significantly, reducing the dilution capacity and allowing salinity to build up. Agricultural runoff, irrigation return flows, and limited drainage further exacerbate the salinity levels.
The implications are critical: elevated salinity impairs water quality, threatens aquatic ecosystems, and limits the use of water for agriculture and domestic purposes. It also poses a risk to groundwater resources due to the potential for saline intrusion. Understanding the influence of both geological formations (such as the Triassic salt dome) and climate variability is essential for implementing effective water management and mitigation strategies in this vulnerable zone in northwestern Tunisia.
The extensive research and monitoring across the Medjerda River and the Sidi Salem Dam highlight two primary drivers affecting water quality [10,11,14,15,42,43,44,45,46,47]: anthropogenic pollution from agriculture, industry (Fe, Pb, Zn…mines), urbanization, and natural contamination linked to elevated salinity caused by the basin’s geology and sediment transport [43]. Agriculture is the dominant economic activity and water consumer in the region, contributing to significant pollution through runoff containing fertilizers, pesticides, and herbicides [43]. Livestock farming, particularly in the governorates of Beja and Jendouba, adds to nutrient loads.
Agro-industrial operations—such as the sugar factories in Beja and Ben Bechir and the canneries in Testour—discharge organic-rich and occasionally acidic effluents. Urban centers, including Beja, Boussalem, Jendouba, and El Kef, release untreated or partially treated domestic wastewater, high in nitrogen compounds, which exacerbates eutrophication risks [46]. Furthermore, erosion and sediment transport are severe across the basin, leading to considerable sedimentation in dams [14]. Based on the bathymetric surveys conducted in the Sidi Salem reservoir in 1987, 1989, 1991, 1998, and 2025, the annual sedimentation rate is approximately 0.8%, equivalent to 5 million m3 per year [15,47].
The increase in salinity in the Sidi Salem Dam is closely linked to the presence of Triassic salt domes within the watershed [11]. These evaporitic formations constitute a major source of dissolved salts through both surface and subsurface processes [11,18,21,22]. Water percolating through fractured zones and faults dissolves halite and gypsum layers, transporting saline water toward the dam, while surface runoff during rainfall events accelerates the dissolution of exposed Triassic outcrops (Figure 11). The spatial relationship between the Triassic outcrops, the drainage network, and fault systems highlights the hydrological/hydrogeological pathways through which salts are introduced into the reservoir [10,11]. Moreover, historical records from 1950 to 1969 indicate an average inflow salinity of 1.13 g/L, while the reservoir’s salinity at normal water levels ranged between 0.36 and 0.53 g/L [15]. As Tunisia’s largest reservoir, Sidi Salem has a storage capacity of 762 million m3 and supplies nearly 50% of its water for irrigation and about 25% for drinking purposes. During heavy rainfall events, diffuse pollution intensifies as nitrogen and phosphorus are washed into the reservoir, while industrial and urban tributaries contribute additional nutrient loads, heightening the threat of eutrophication.
As Tunisia’s largest reservoir, Sidi Salem has a storage capacity of 762 million m3 and provides nearly 50% of its water for irrigation and about 25% for drinking purposes, making it a strategic resource for both agriculture and domestic supply [10,14,15,42,43,44,45,46,47]. However, during periods of heavy rainfall, diffuse pollution increases as nitrogen and phosphorus from surrounding agricultural fields are transported into the reservoir [10,14,15,43,45]. In addition, industrial discharges and untreated urban wastewater contribute further nutrient inputs, which, combined with the reduced water flow during dry seasons, intensify the risk of eutrophication [10,14,15]. This process not only deteriorates water quality but also leads to algal blooms, oxygen depletion, and subsequent impacts on aquatic ecosystems and fisheries [44,47]. The cumulative pressures of nutrient loading and fluctuating hydrological conditions highlight the vulnerability of the reservoir and reinforce the need for integrated watershed management practices to balance water supply with ecosystem health [10,14,15,42,43,44,45,46,47]. These findings underscore the urgent need for integrated watershed management strategies to safeguard water quality and maintain the reservoir’s critical functions.

4.6. Trend and Correlation Analysis

The Mann–Kendall (MK) test was applied to the annual precipitation and temperature series over the period 1984–2024. The results revealed a significant increasing trend in annual precipitation (Kendall’s tau = 0.500, p = 0.010 < 0.05), confirming rejection of the null hypothesis (H0: no trend). The estimated Sen’s slope of +94.035 mm/year indicates a substantial upward tendency in precipitation, suggesting that the study area has experienced a notable increase in annual rainfall during the observation period (Table 2).
In contrast, annual temperature did not exhibit a statistically significant trend. Although Kendall’s tau was negative (−0.278), the associated p = 0.175 > 0.05 indicates that the null hypothesis cannot be rejected. Sen’s slope (−0.233 °C/year) points toward a slight decreasing tendency, but it remains statistically insignificant. This implies that while precipitation has undergone a significant upward shift, temperature has remained relatively stable, without a clear long-term trend.
The Pearson correlation coefficient (r) was calculated to assess the relationship between annual precipitation and temperature (Table 3). The results revealed a moderate negative correlation (r = −0.601, p < 0.0001), which was statistically significant at the 5% level. This suggests that years with higher precipitation tend to coincide with lower temperatures, whereas drier years are generally associated with warmer conditions. The coefficient of determination (R2 = 0.361) further indicates that approximately 36.1% of the variability in temperature can be explained by variations in precipitation.
The analysis of the precipitation time series (1984–2021) shows marked interannual variability, with alternating wet and dry years (Figure 12a). Between the mid-1980s and early 2000s, rainfall fluctuated considerably, generally ranging between 400 and 700 mm, with only a few exceptional peaks. From the early 2000s onward, however, precipitation intensity increased, with several years exceeding 800–900 mm (2003–2009 and 2012–2013), marking some of the wettest years in the dataset and reinforcing the MK trend results. Focusing on the most recent period (2015–2024), precipitation again shows strong variability, with a very wet year in 2018 (above 900 mm), followed by a marked decline. After 2018, the series exhibits a general downward tendency, with values stabilizing near 500–600 mm and dropping below 500 mm in 2021. Thus, although the long-term trend indicates an upward shift, the last five years have been characterized by reduced precipitation levels compared to the exceptionally wet period of the 2000s and early 2010s.
In contrast, annual temperature exhibits opposite behavior (Figure 12b). Wet years (2003, 2009, 2011, 2018) are generally associated with relatively cooler conditions, while dry years tend to coincide with warmer conditions. This inverse hydroclimatic relationship is consistent with the significant negative Pearson correlation, suggesting that reduced rainfall amplifies warming, whereas abundant rainfall mitigates temperature increases. These findings are in line with previous studies in Mediterranean and semi-arid regions, which documented similar precipitation–temperature interactions. Overall, the combined application of the Mann–Kendall trend test and Pearson correlation provides a comprehensive understanding of the climatic dynamics in the study area.

5. Conclusions

This study utilized remote sensing and GIS/remote sensing technologies to analyze the long-term hydrological and environmental changes in the Sidi Salem Dam basin over a 40-year period (1985–2025). By applying radiometric indices such as NDWI, NDVI, NDDI, NDSI, and NDTI, the research provided a comprehensive assessment of the dynamics affecting water surface extent, vegetation health, drought severity, salinity levels, and turbidity trends.
The results revealed a significant reduction in the water surface area of the Sidi Salem Dam, decreasing by nearly 47.6% from 1985 to 2025. This contraction is closely linked to intensifying drought conditions, declining precipitation, and increased evapotranspiration—clear indicators of climate change impacts. The Mann–Kendall analysis indicated a significant upward trend in annual precipitation over the study period, though recent observations reflect a decline. Annual temperature, however, showed no statistically significant long-term change. Pearson correlation results further revealed a strong inverse relationship between precipitation and temperature, emphasizing that wetter years are generally associated with cooler conditions, while drier years correspond to warmer ones.
In parallel, the rise in NDDI values highlighted escalating drought stress, while the increase in NDVI values in previously submerged areas pointed to vegetation colonization following water retreat. The NDTI and NDSI analyses exposed growing concerns over water quality. Higher turbidity levels suggest rising sedimentation from upstream erosion and anthropogenic activities, while the elevated salinity, exacerbated by geological formations such as the Triassic salt dome and heightened evaporation, poses threats to aquatic life and the dam’s usability for irrigation and domestic use.
These findings emphasize the urgent need for integrated watershed management and climate-adaptive strategies to safeguard this critical water resource. Effective land use planning, reforestation, erosion control, and sediment monitoring should be prioritized. Moreover, reducing pollution inputs and managing salinity through improved drainage and irrigation techniques will be essential for maintaining water quality.
Looking forward, several avenues should be pursued to enhance understanding and improve the management of the Sidi Salem Dam and similar reservoirs:
  • Climate modeling integration: coupling hydrological models with future climate scenarios can help predict long-term changes and support proactive decision-making.
  • Socioeconomic impact analysis: future research should incorporate the socioeconomic impacts of dam shrinkage, especially on agriculture, drinking water supply, and local livelihoods.
  • Restoration and resilience programs: encouraging ecosystem restoration in degraded upstream areas and investing in drought-resilient infrastructure will strengthen long-term water security.
  • By combining remote sensing technology with sustainable planning, Tunisia can better navigate the challenges of climate change and ensure the resilience of its most important hydraulic assets, including the Sidi Salem Dam.
  • Water quality monitoring: future studies should include measured salinity values and compare them with international (WHO) and national standards to provide a more practical evaluation of water quality degradation.
  • Seasonal analysis: the monitoring of surface water during wet and dry seasons to assess changes in water levels, turbidity, and the dam’s regulation capacity.

Author Contributions

Conceptualization, Y.A. and Y.H.; methodology, Y.A.; software, Y.A.; validation, Y.A., Y.H., M.A. and M.G.; formal analysis, Y.A.; investigation, Y.H.; resources, Y.A.; data curation, Y.A.; writing—original draft preparation, Y.A.; writing—review and editing, M.G. and Y.H.; visualization, Y.A.; supervision, Y.H. All authors have read and agreed to the published version of the manuscript.

Funding

This research received no external funding.

Data Availability Statement

The data presented in this study are available in the article.

Acknowledgments

The authors express their sincere appreciation to the International Association of Water Resources in the Southern Mediterranean Basin, Gafsa, Tunisia, for their valuable contributions. We also extend our gratitude to the dedicated teams at the LAM3E laboratory, Gafsa, Tunisia. Finally, we thank the editor and the anonymous reviewers for their thoughtful critiques, which have significantly strengthened this article.

Conflicts of Interest

The authors declare no conflicts of interest.

References

  1. Wilhite, D.A. Drought as a Natural Hazard: Concepts and Definitions. In Drought: A Global Assessment; Wilhite, D., Ed.; Routledge: London, UK, 2000; Volume 1, pp. 3–18. [Google Scholar]
  2. Wilhite, D.A. Integrated drought management: Moving from managing disasters to managing risk. In Integrated Drought Management; CRC Press: Boca Raton, FL, USA, 2023; Volume 2, pp. 507–514. [Google Scholar]
  3. Khlifi, S.; Ameur, M.; Mtimet, N.; Ghazouani, N.; Belhadj, N. Impacts of small hill dams on agricultural development of hilly land in the Jendouba region of northwestern Tunisia. Agric. Water Manag. 2010, 97, 50–56. [Google Scholar] [CrossRef]
  4. Gader, K.; Gara, A.; Vanclooster, M.; Khlifi, S.; Slimani, M. Drought assessment in a south Mediterranean transboundary catchment. Hydrol. Sci. J. 2020, 65, 1300–1315. [Google Scholar] [CrossRef]
  5. Allani, M.; Mezzi, R.; Zouabi, A.; Béji, R.; Joumade-Mansouri, F.; Hamza, M.E.; Sahli, A. Impact of future climate change on water supply and irrigation demand in a small Mediterranean catchment. Case study: Nebhana dam system, Tunisia. J. Water Clim. Change 2020, 11, 1724–1747. [Google Scholar] [CrossRef]
  6. Mouelhi, S.; Kanzari, S.; Ben Mariem, S.; Zemni, N. Towards a Classification of Tunisian Dams for Enhanced Water Scarcity Governance: Parametric or Non-Parametric Approaches? Hydrology 2025, 12, 96. [Google Scholar] [CrossRef]
  7. Hill, J.; Woodland, W. Contrasting water management techniques in Tunisia: Towards sustainable agricultural use. Geogr. J. 2003, 169, 342–357. [Google Scholar] [CrossRef]
  8. Horchani, A. Water in Tunisia: A national perspective. In Agricultural Water Management: Proceedings of a Workshop in Tunisia; National Academies Press: Washington, DC, USA, 2007; p. 88. [Google Scholar]
  9. Gaaloul, N. Water resources and management in Tunisia. Int. J. Water 2011, 6, 92–116. [Google Scholar] [CrossRef]
  10. Hamed, Y.; Ayadi, Y.; Hadji, R.; Ben Saad, A.; Gentilucci, M.; Elaloui, E. Environmental Radioactivity, Ecotoxicology (238U, 232Th and 40K) and Potentially Toxic Elements in Water and Sediments from North Africa Dams. Sustainability 2024, 16, 490. [Google Scholar] [CrossRef]
  11. Ayadi, Y.; Gentilucci, M.; Ncibi, K.; Hadji, R.; Hamed, Y. Assessment of a Groundwater Potential Zone Using Geospatial Artificial Intelligence (Geo-AI), Remote Sensing (RS), and GIS Tools in Majerda Transboundary Basin (North Africa). Water 2025, 17, 331. [Google Scholar] [CrossRef]
  12. Zahar, Y.; Ghorbel, A.; Albergel, J. Impacts of large dams on downstream flow conditions of rivers: Aggradation and reduction of the Medjerda channel capacity downstream of the Sidi Salem dam (Tunisia). J. Hydrol. 2008, 351, 318–330. [Google Scholar] [CrossRef]
  13. Japan International Cooperation Agency (JICA). Republic of Tunisia the Preparatory Survey on Sidi Salem Multi-Purpose Dam Comprehensive Sedimentation Management Project. Final Report. 2023, p. 251. Available online: https://openjicareport.jica.go.jp/pdf/12385266.pdf (accessed on 6 August 2025).
  14. Bernhardt, H. Pronostics sur la Qualité de l’eau Dans le Barrage de Sidi Salem, Tunisie. Deuxième Partie; Coopération Technique Tuniso-Allemande: Tunis, Tunisia, 1978; 237p. [Google Scholar]
  15. World Imagery, Esri, DigitalGlobe, GeoEye, I-Cubed, USDA FSA, USGS, AEX, Getmapping, Aerogrid, IGN, IGP, Swisstopo, and the GIS User Community. Available online: https://www.arcgis.com/home/item.html?id=10df2279f9684e4a9f6a7f08febac2a9 (accessed on 12 December 2009).
  16. Hentati, A. Modélisation de la qualité des eaux de Sidi Salem. Master Thesis, National School of Engineering of Tunisia (ENIT), Tunis, Tunisia, 2003; 120p. [Google Scholar] [CrossRef]
  17. National Aeronautics and Space Administration (NASA). POWER Data Access Viewer, Single Point Data Access. 2025. Available online: https://power.larc.nasa.gov/data-access-viewer/ (accessed on 1 March 2025).
  18. Ayadi, Y.; Mokadem, N.; Besser, H.; Khelifi, F.; Harabi, S.; Hamad, A.; Boyce, A.; Laouar, R.; Hamed, Y. Hydrochemistry and stable isotopes (δ18O and δ2H) applied to the study of karst aquifers in the Southern Mediterranean Basin (Teboursouk area, NW Tunisia). J. Afr. Earth Sci. 2017, 137, 208–217. [Google Scholar] [CrossRef]
  19. Bannour, H.; Bonvallot, J. Les dépôts quaternaires de la vallée de la Medjerda dans la «zone des diapirs», témoins de déformations quaternaires continues. Méditerranée 1988, 64, 7–11. [Google Scholar] [CrossRef]
  20. El Ouardi, H. Origine des variations latérales des dépôts yprésiens dans la zone des dômes en Tunisie septentrionale. Comptes Rendus. Géoscience 2002, 334, 141–146. [Google Scholar] [CrossRef]
  21. Ayadi, Y.; Mokadem, N.; Khelifi, F.; Khalil, R.; Dhawadi, L.; Hamed, Y. Groundwater potential recharge assessment in Southern Mediterranean basin using GIS and remote sensing tools: Case of Khalled Teboursouk basin, karst aquifer. Appl. Geomat. 2024, 16, 677–693. [Google Scholar] [CrossRef]
  22. Ayadi, Y.; Mokadem, N.; Besser, H.; Redhaounia, B.; Khelifi, F.; Harabi, S.; Nasri, T.; Hamed, Y. Statistical and geochemical assessment of groundwater quality in the Teboursouk area (Northwestern Tunisian Atlas). Environ. Earth Sci. 2018, 77, 349. [Google Scholar] [CrossRef]
  23. Mattoussi, W.; Mattoussi, F.; Zeddini, Y. Does dam-based irrigation affect the sustainability of natural capital?: A doubly robust analysis. J. Clean. Prod. 2024, 450, 141764. [Google Scholar] [CrossRef]
  24. ONAGRI. National Water Sector Report; Ministry of Agriculture, Water Resources and Fisheries, internal report; ONAGRI: Tunis, Tunisia, 2020. [Google Scholar]
  25. Sawassi, A.; Khadra, R.; Crookston, B. Water Banking as a Strategy for the Management and Conservation of a Critical Resource: A Case Study from Tunisia’s Medjerda River Basin (MRB). Sustainability 2024, 16, 3875. [Google Scholar] [CrossRef]
  26. Rhili, H. The World Bank’s Water and Sanitation Policies in Tunisia. Transnational Institute. 2024. Available online: https://www.tni.org/en/article/the-world-banks-water-and-sanitation-policies-in-tunisia (accessed on 1 March 2025).
  27. Chebil, A.; Souissi, A.; Frija, A.; Stambouli, T. Estimation of the economic loss due to irrigation water use inefficiency in Tunisia. Environ. Sci. Pollut. Res. 2019, 26, 11261–11268. [Google Scholar] [CrossRef]
  28. U.S. Geological Survey, Earth Explorer. Satellite Data. 2025. Available online: https://earthexplorer.usgs.gov/ (accessed on 1 March 2025).
  29. U.S. Geological Survey, Landsat Satellite Missions. 2025. Available online: https://www.usgs.gov/landsat-missions/landsat-satellite-missions (accessed on 1 March 2025).
  30. Gao, B.C. NDWI—A normalized difference water index for remote sensing of vegetation liquid water from space. Rem. Sens. Environ. 1998, 58, 257–266. [Google Scholar] [CrossRef]
  31. Tucker, C.J. Red and Photographic Infrared Linear Combinations for Monitoring Vegetation. Rem. Sens. Environ. 1979, 8, 127–150. [Google Scholar] [CrossRef]
  32. Gu, Y.; Brown, J.F.; Verdin, J.P.; Wardlow, B. A five-year analysis of Modis Ndvi and NDWI for grassland drought assessment over the central Great Plains of the United States. Geophys. Res. Lett. 2007, 34, 6. [Google Scholar] [CrossRef]
  33. McFEETERS, S.K. The use of the Normalized Difference Water Index (NDWI) in the delineation of open water features. Int. J. Remote Sens. 1996, 17, 1425–1432. [Google Scholar] [CrossRef]
  34. Du, Z.; Li, W.; Zhou, D.; Tian, L.; Ling, F.; Wang, H.; Gui, Y.; Sun, B. Analysis of Landsat-8 OLI imagery for land surface water mapping. Remote Sens. Lett. 2024, 5, 672–681. [Google Scholar] [CrossRef]
  35. Ashok, A.; Rani, H.P.; Jayakumar, K.V. Monitoring of dynamic wetland changes using NDVI and NDWI based landsat imagery. Remote Sens. Appl. Soc. Environ. 2021, 23, 100547. [Google Scholar] [CrossRef]
  36. Khan, N.M.; Rastoskuev, V.V.; Sato, Y.; Shiozawa, S. Assessment of hydrosaline land degradation by using a simple approach of remote sensing indicators. Agric. Water Manag. 2005, 77, 96–109. [Google Scholar] [CrossRef]
  37. Bid, S.; Siddique, G. Identification of seasonal variation of water turbidity using NDTI method in Panchet Hill Dam, India. Model. Earth Syst. Environ. 2019, 5, 1179–1200. [Google Scholar] [CrossRef]
  38. Mann, B.H. Nonparametric Tests Against Trend. Econometrica 1945, 13, 245–259. [Google Scholar] [CrossRef]
  39. Kendall, M.G. Rank Correlation Measures; Charles Griffin: London, UK, 1975. [Google Scholar]
  40. Profillidis, V.A.; Botzoris, G.N. Chapter 5—Statistical Methods for Transport Demand Modeling. Model. Transp. Demand 2019, 1, 163–224. [Google Scholar] [CrossRef]
  41. Lahmar, L. Approche multi-temporelle et systémique du risque d’inondation dans le bassin fluvial moyen de l’oued Medjerda (Tunisie septentrionale). Ph.D. Thesis, Université Paris Cité, Paris, France, 2021. [Google Scholar]
  42. Mammou, A.B.; Louati, M.H. Évolution temporelle de l’envasement des retenues de barrages de Tunisie. Rev. Des Sci. De L’eau 2007, 20, 201–210. [Google Scholar]
  43. Mlayah, A.; Da Silva, E.F.; Rocha, F.; Hamza, C.B.; Charef, A.; Noronha, F. The Oued Mellègue: Mining activity, stream sediments and dispersion of base metals in natural environments, North-western Tunisia. J. Geochem. Explor. 2009, 102, 27–36. [Google Scholar] [CrossRef]
  44. Romdhane, S.B.; El Bour, M.; Hamza, A.; Akrout, F.; Kraiem, M.M.; Jacquet, S. Seasonal patterns of viral, microbial and planktonic communities in Sidi Salem: A freshwater reservoir (North of Tunisia). In Annales de Limnologie-International Journal of Limnology; EDP Sciences: Les Ulis, France, 2014; Volume 50, pp. 299–314. [Google Scholar]
  45. Mili, S.; Ennouri, R.; Laouar, H.; Romdhane, N.B.; Missaoui, H.; Daaloul-Jedidi, M.; Soudani, A.; Messadi, L. Etude des peuplements piscicoles de la retenue du barrage de Sidi Salem. J. New Sci. 2016, 27, 1. [Google Scholar]
  46. Kotti, F.; Dezileau, L.; Mahé, G.; Habaieb, H.; Benabdallah, S.; Bentkaya, M.; Calvez, R.; Dieulin, C. Impact of dams and climate on the evolution of the sediment loads to the sea by the Mejerda River (Golf of Tunis) using a paleo-hydrological approach. J. Afr. Sci. 2018, 142, 226–233. [Google Scholar] [CrossRef]
  47. Helali, M.A.; Ouameni, I.; Ben Mna, H.; Mesnage, V.; Souissi, R.; Kouka, A.; Oueslati, W. Assessing porewater and sediment quality in the Sidi Salem Dam: Insights from an artificial aquatic geosystem in Tunisia. J. Sediment. Environ. 2025, 10, 373–385. [Google Scholar] [CrossRef]
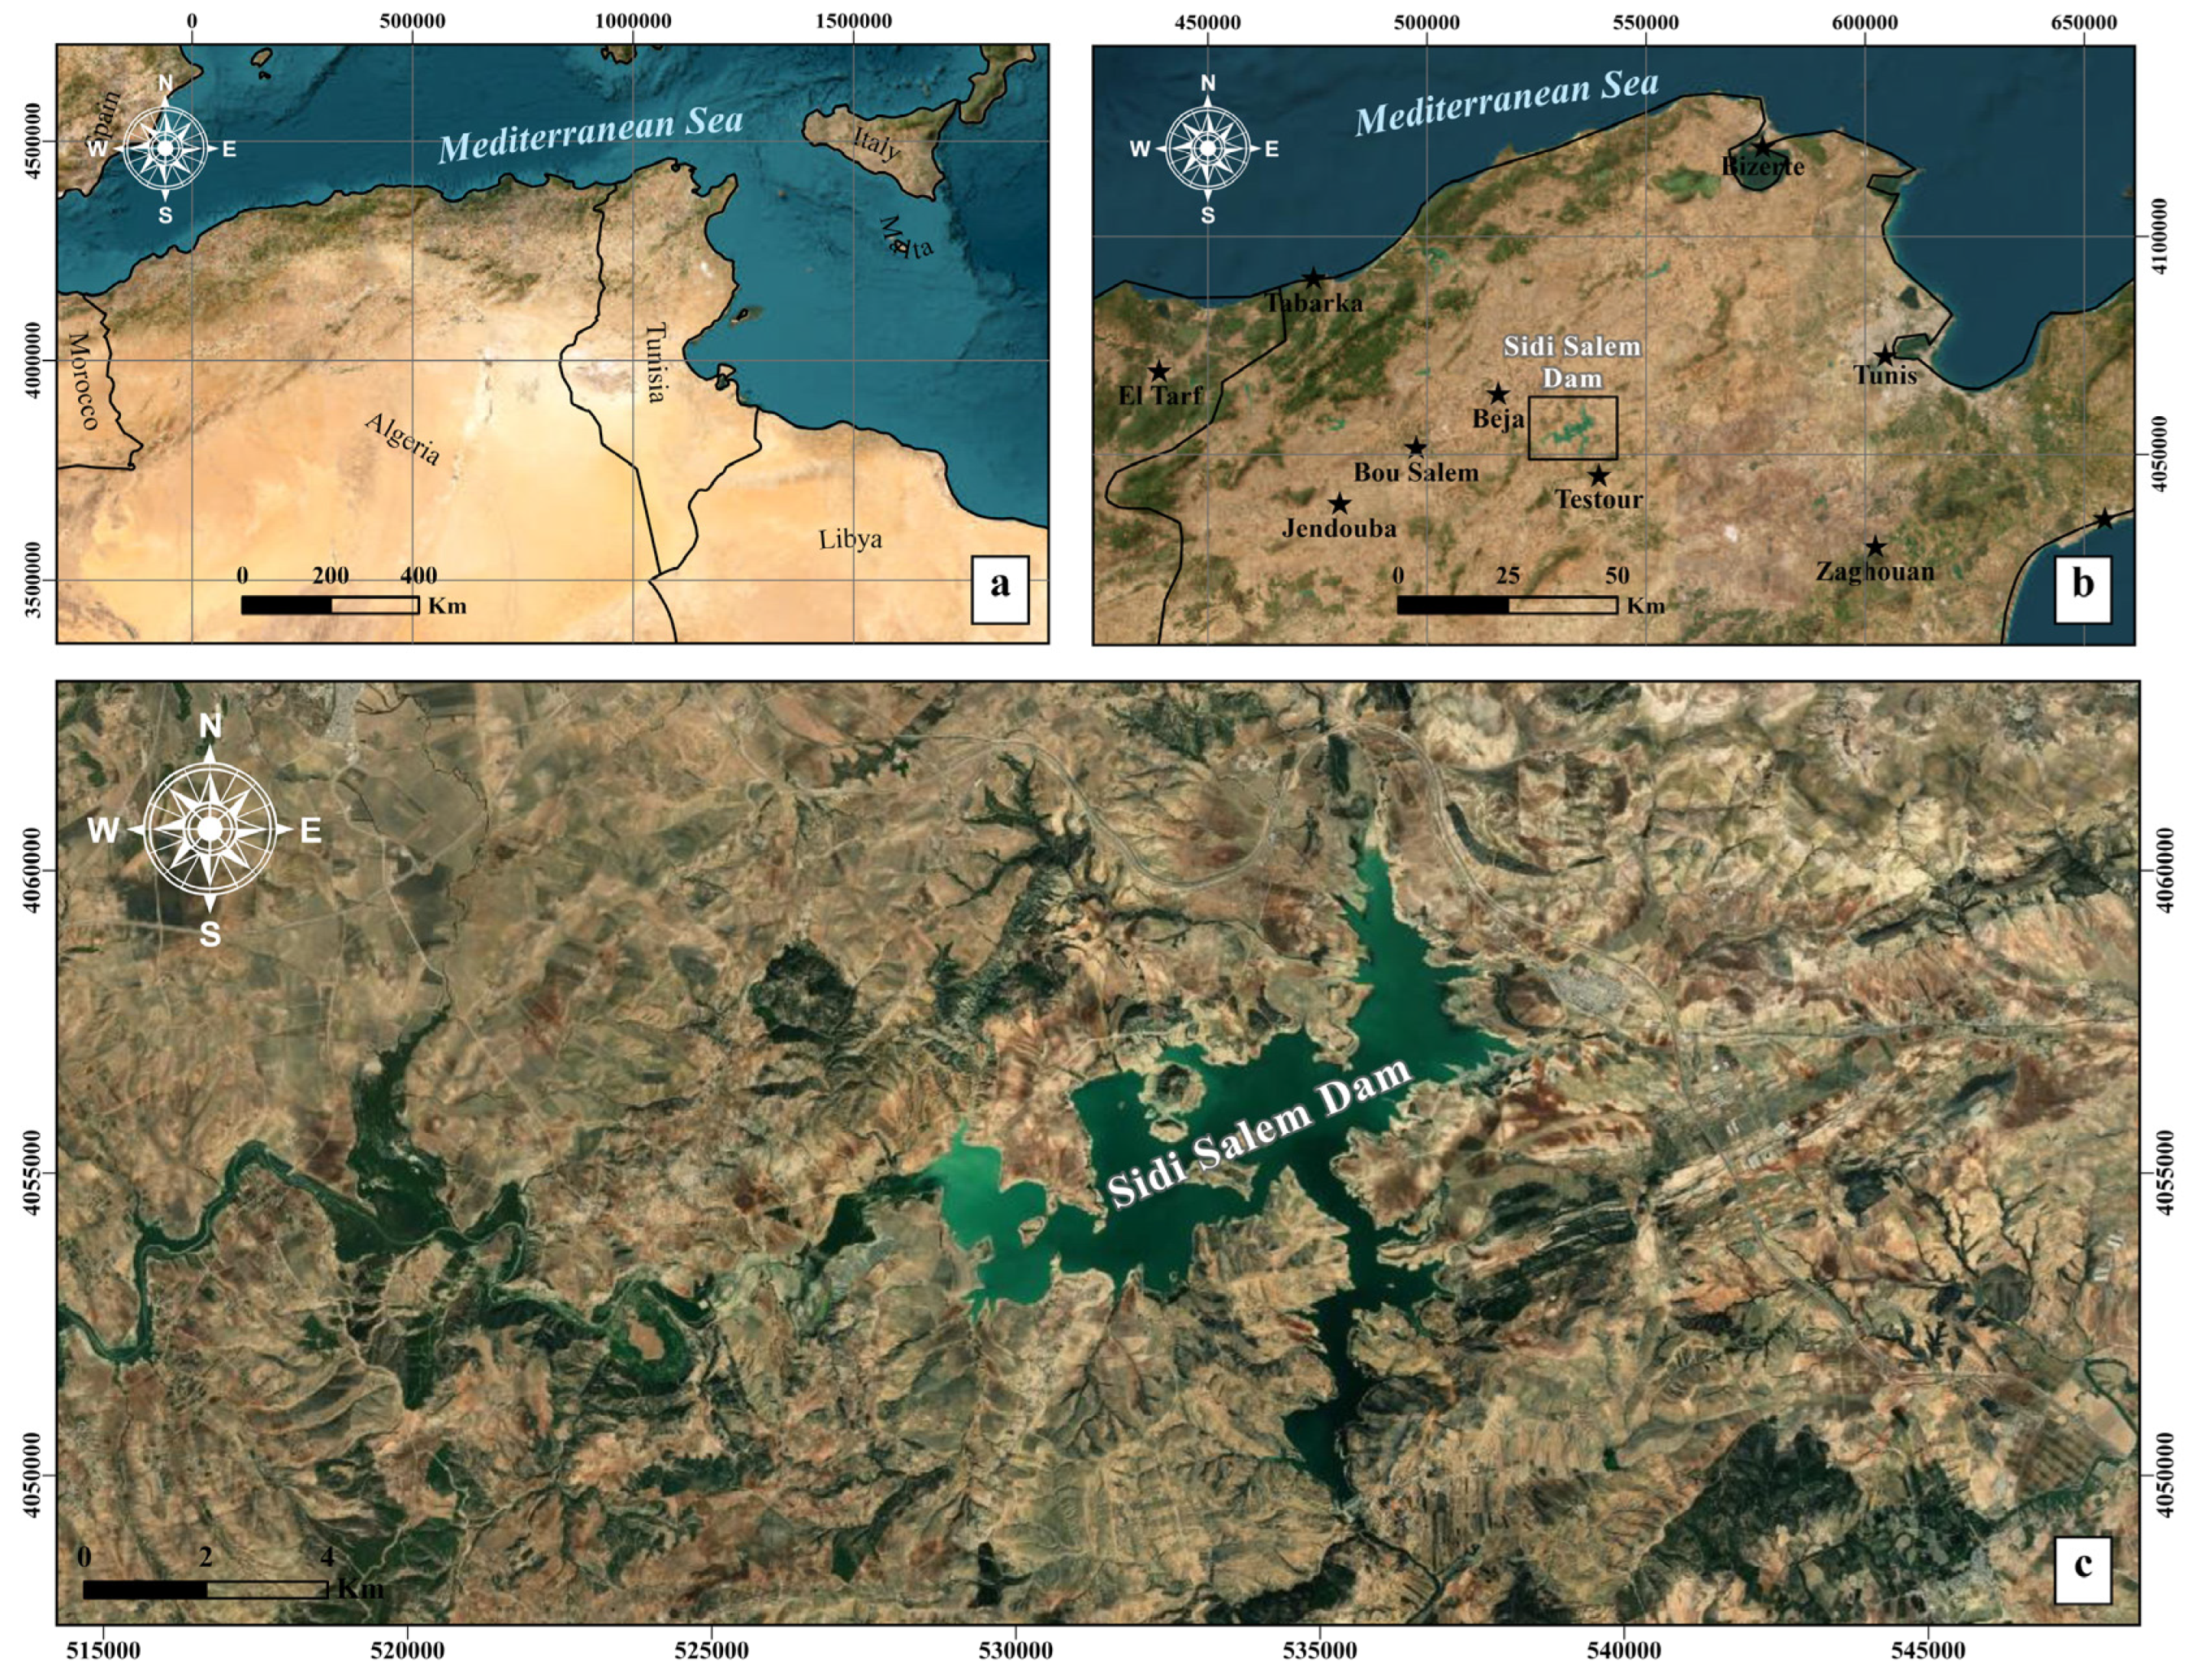
Figure 1. Site map of the Sidi Salem Dam: (a) in Mediterranean basin; (b) in Northern Tunisia; (c) in Majerda basin [15].
Water 17 02738 g001
Figure 2. View of the Sidi Salem Dam.
Water 17 02738 g002
Figure 3. Climatological data of the Sidi Salem Dam (1984–2024): (a) annual values; (b) monthly average values.
Water 17 02738 g003
Figure 4. Landsat satellite images from the years 1985 and 2025: (a) Landsat-5 TM; (b) Landsat-9 OLI/TIRS.
Water 17 02738 g004
Figure 5. NDWI maps of the Sidi Salem Dam: (a) 1985; (b) 2025.
Water 17 02738 g005
Figure 6. Spatial change detection map of water body surface in the Sidi Salem Dam area between 1985 and 2025.
Water 17 02738 g006
Figure 7. NDVI maps of the Sidi Salem Dam: (a) 1985; (b) 2025.
Water 17 02738 g007
Figure 8. NDDI maps of the Sidi Salem Dam: (a) 1985; (b) 2025.
Water 17 02738 g008
Figure 9. NDTI maps of the Sidi Salem Dam: (a) 1985; (b) 2025.
Water 17 02738 g009
Figure 10. NDSI maps of the Sidi Salem Dam for the year 2025.
Water 17 02738 g010
Figure 11. Triassic outcrops maps of the Sidi Salem Dam.
Water 17 02738 g011
Figure 12. (a) Annual precipitation trend in the Sidi Salem Dam (1984–2024); (b) Annual temperature trend in the Sidi Salem Dam (1984–2024).
Water 17 02738 g012
Table 1. Spectral and technical specifications of Landsat-5 and Landsat-9 sensors [29].
SatelliteDate Path/RowWavelengths (μm)
Landsat-5 TM18 April 1985192/035Band 1 Visible Blue (0.45–0.52 µm)
Band 2 Visible Green (0.52–0.60 µm)
Band 3 Visible Red (0.63–0.69 µm)
Band 4 Near-Infrared (0.76–0.90 µm)
Band 5 Near-Infrared (1.55–1.75 µm)
Band 6 Thermal (10.40–12.50 µm)
Band 7 Mid-Infrared (2.08–2.35 µm)
Landsat-9 OLI/TIRS10 April 2025192/035Band 1 Visible Coastal Aerosol (0.43–0.45 µm)
Band 2 Visible Blue (0.450–0.51 µm)
Band 3 Visible Green (0.53–0.59 µm)
Band 4 Red (0.64–0.67 µm)
Band 5 Near-Infrared (0.85–0.88 µm)
Band 6 SWIR 1(1.57–1.65 µm)
Band 7 SWIR 2 (2.11–2.29 µm)
Band 8 Panchromatic (PAN) (0.50–0.68 µm)
Band 9 Cirrus (1.36–1.38 µm)
Band 10 TIRS 1 (10.6–11.19 µm)
Band 11 TIRS 2 (11.5–12.51 µm)
Table 2. The Mann–Kendall (MK) test results.
Series\TestKendall’s TauS’Var(S’)p-ValueAlphaSen’s Slope
Ann. Precipitation0.5001844.0000.0100.0594.035
Ann. Temperature−0.278−1044.0000.1750.05−0.233
Table 3. The Pearson correlation coefficient (r) results: correlation matrix.
VariablesAnn. PrecipitationAnn. Temperature
Ann. Precipitation1−0.601
Ann. Temperature−0.6011
Disclaimer/Publisher’s Note: The statements, opinions and data contained in all publications are solely those of the individual author(s) and contributor(s) and not of MDPI and/or the editor(s). MDPI and/or the editor(s) disclaim responsibility for any injury to people or property resulting from any ideas, methods, instructions or products referred to in the content.