Article

Air Entrainment of Chute Aerators Under Different Atmospheric Pressures

1
China Construction Third Bureau Green Industry Investment Co., Ltd., Wuhan 430074, China
2
State Key Laboratory of Hydraulics and Mountain River Engineering, Sichuan University, Chengdu 610065, China
*
Author to whom correspondence should be addressed.
Water 2025, 17(18), 2734; https://doi.org/10.3390/w17182734
Submission received: 12 August 2025 / Revised: 7 September 2025 / Accepted: 10 September 2025 / Published: 16 September 2025
(This article belongs to the Special Issue Advanced Numerical Approaches for Multiphase and Cavitating Flows)

Abstract

In high-altitude regions, the influence of atmospheric pressure on the air entrainment capacity of chute aerators remains inadequately quantified. This study characterizes aerator efficiency through the air entrainment coefficient under variable atmospheric pressures. Systematic physical modeling was employed to investigate air transport downstream of chute aerators. The results demonstrate that the air entrainment coefficient decreases with reduced atmospheric pressure, manifested by declining air concentrations, particularly in the bottom flow layer. Downstream of the aerator, both the average and bottom air concentrations exhibit diminished streamwise development under lower pressures. Specifically, a 100 hPa reduction in atmospheric pressure corresponds to a 0.69–0.93% decrease in the air entrainment coefficient, accompanied by a 3.16% reduction in the regionally averaged air concentration downstream of the impact zone. For the first time, a comprehensive formula of the air entrainment coefficient expressed by basic parameters and an empirical formula of the bottom air concentration under different atmospheric pressures was established based on extensive tests, with results in good agreement. Based on the present experimental results, the atmospheric pressure can significantly affect the air intake of the aerator. Consequently, the atmospheric pressure should be considered as an important parameter in hydraulic aeration design.

1. Introduction

Spillways constitute essential structural components in high dam and large reservoir systems, typically employed for high-head flood discharge operations. As flow velocity increases, so does the risk of cavitation erosion [1]. During the mid-20th century (1960–1980), multiple spillways experienced severe cavitation damage in regions where local static pressure falls below the liquid vapor pressure (often occurring in zones of high velocity and/or sharp pressure gradients), resulting in the destruction of concrete surfaces and foundation elements. To mitigate cavitation risks, modern spillway designs incorporate chute aerators. The collapse of cavitation bubbles generates extremely high local temperatures and pressures, causing severe damage to structural surfaces. Ge et al. [2] analyzed key geometric parameters affecting cavitation in Venturi-type reactors, providing valuable guidance for cavitation suppression. Furthermore, studies have shown that aerated flows can mitigate cavitation damage by cushioning the collapse energy through the presence of entrained air bubbles. This approach represents the most efficient technical countermeasure against cavitation damage due to its operational simplicity and economic viability [3]. Extensive evidence from both physical modeling and prototype observations confirms that aerator-induced air entrainment in high-velocity flows effectively prevents or substantially reduces cavitation damage [4].
Previous research on chute aerators has extensively documented air–water phase flow characteristics [5,6]. Chanson [7,8] systematically analyzed distributions of bubble void fractions and air discharge, proposing differential equations to solve air concentration and velocity profiles downstream of aerators. Rutschmann and Hager [9] examined variations in air entrainment coefficients under diverse inflow conditions. Subsequent investigations by Kramer et al. [10,11] quantified partial streamwise air transport in far field flow zones, while Pfister and Hager [12,13] categorized downstream air transport into three distinct regions based on flow characteristics. Notably, shallow water depths in these studies resulted in either absence or rapid dissipation of non-aerated flow regions following jet impingement on the chute bottom.
Chanson [7] analyzed aerator air concentration distributions and categorized six flow regions based on aeration characteristics. Building upon this framework, Pfister and Hager [12] detailed aerator air concentration profiles and segmented downstream air transport into three distinct zones: (1) jet zone, (2) reattachment spray zone, and (3) far field zone. Their experimental work established characteristic patterns of key parameters, including average and bottom air concentrations, under varying atmospheric pressures. Concurrently, Bai et al. [14,15] investigated bottom airflow dynamics at significant water depths, revealing how non-aerated zones suppress air entrainment in upper jet regions. This research proposed three mechanistic processes governing bottom air transport. Kramer et al. [16] subsequently reformulated two-phase open channel flow equations incorporating variable density, identifying bottom air concentration as a critical drag reduction parameter. Complementary work by Pfister quantified deflector-induced air entrainment variations and analyzed cavity subpressure effects on aeration efficiency. Foundational research by Peterka [17] quantitatively established that aeration eliminates cavitation erosion at average air concentrations of 1–6%, a threshold range remaining fundamental to contemporary design practice.
It should be noted that the air concentration near the wall is the primary condition in preventing cavitation erosion. Previous investigations on chute aerators have been conducted primarily under standard atmospheric pressure conditions [4,5,12,13,14,15,16], with limited attention to the influence of atmospheric pressure variations on aeration performance. For high-altitude dams (Table 1), it is essential to specifically investigate the effects of reduced pressure on air entrainment in high-velocity flows. While select major projects have implemented decompression model testing, the consequent alterations in streamwise air entrainment characteristics remain largely unexamined. Reduced atmospheric pressure diminishes air density, thereby fundamentally altering chute aerator entrainment efficiency.
This study systematically investigates chute aerator air entrainment efficiency and transport characteristics under varying atmospheric pressures. Comprehensive measurements of the air entrainment coefficient, spatial air concentration distributions, and the average air concentration of streamwise and bottom air concentrations were taken across diverse atmospheric conditions and approach flows. Through systematic parameter variation, the air transportation patterns were generalized. Subsequent analysis focused on air–water characteristics within critical flow regions: the impact zone (1 < x/L < 1.2) and evolution zone (1.2 ≤ x/L ≤ 3.0), leveraging experimental data to decode atmospheric pressure effects on entrainment evolution. x/L represents the relative position within the analysis region, where x denotes the distance from the aerator step edge, and L refers to the jet length. These findings advance fundamental understanding of high-velocity air–water phase flows under altitude induced pressure variations.

2. Experimental Setup and Flow Conditions

Experiments were conducted in a 6.0 m × 0.3 m rectangular chute housed within a pressure reducing tank at Sichuan University’s State Key Laboratory of Hydraulics and Mountain River Engineering, where internal air pressure was precisely regulated in this sealed chamber. The chute comprised a pressure outlet, a step, and a downstream chute (Figure 1). The aerator height was d = 5 cm, air holes were located on both sides of the deflector, and the size of the air holes was 3 × 5 cm. The downstream chute slope was α = 6.84°. The Froude number F0 was controlled by various water depths and approach flow velocities, F0 = V/(gh)0.5, where 3.76 ≤ F0 ≤ 8.92, V = the approach flow velocity, h = the approach flow depth, and g = gravitational acceleration. The Reynolds number was within the range of 2.0 × 10⁵Re ≤ 6.1 × 10⁵, where Re = Vh/υ, and υ = the kinematic water viscosity.
The bottom cavity air intake volume was quantified as Qa = VaA, where Va = the air velocity in the shaft, and A = the cross-sectional area of the shaft. Air velocity Va in the shaft was measured using a Fluke 922 Micromanometer (Fluke, America). Atmospheric pressure was systematically reduced in 100 hPa controlled increments from 960 hPa to 60 hPa, yielding ten experimental pressure groups. The reference atmospheric pressure outside the pressure-reducing tank was P0 = 960 hPa, with vacuum degree defined as η = (P0Pa)/P0, 0 ≤ η ≤ 0.94, where P0 represents the atmospheric pressure outside the pressure-reducing tank and Pa represents the ambient pressure inside the pressure-reducing tank. The parameter η is used to quantify the relative pressure difference between the interior and exterior of the pressure-reduction tank.
Air concentration measurements employed a CQY-SCU-FZ1.0 aeration current meter (Chengdu, China) with 0.1 mm minimum bubble resolution [18]. Many studies have shown that the phase detection probe is a very effective device for measuring air–water two-phase flows [19]. The measurement principle exploited differential voltage indices at the platinum tip between air and water phases. Data acquisition occurred at 200 kHz frequency over 20 s intervals exclusively along the chute centerline, with a streamwise translation error less than 1 mm. Vertical measurements employed a 3 mm grid spacing perpendicular to flow depth, where the near chute bed measurement defined the bottom air concentration Cb. Based on a comprehensive consideration of typical high-dam discharge scenarios and experimental constraints, the test conditions were designed as cataloged in Table 2 [20]. The series S1 and S6 were excluded from the analysis of air concentration.

3. Results and Discussion

3.1. Air Entrainment Coefficients
Within the region 1.0 ≤ x/L < 1.2, complex flow patterns and air detrainment caused unstable air concentrations. At x/L = 1.2, air entrainment counteracted detrainment effects, enabling stable downstream transport of bottom flow air concentration. This relatively stable location (x/L = 1.2) was therefore selected for bottom air entrainment analysis.
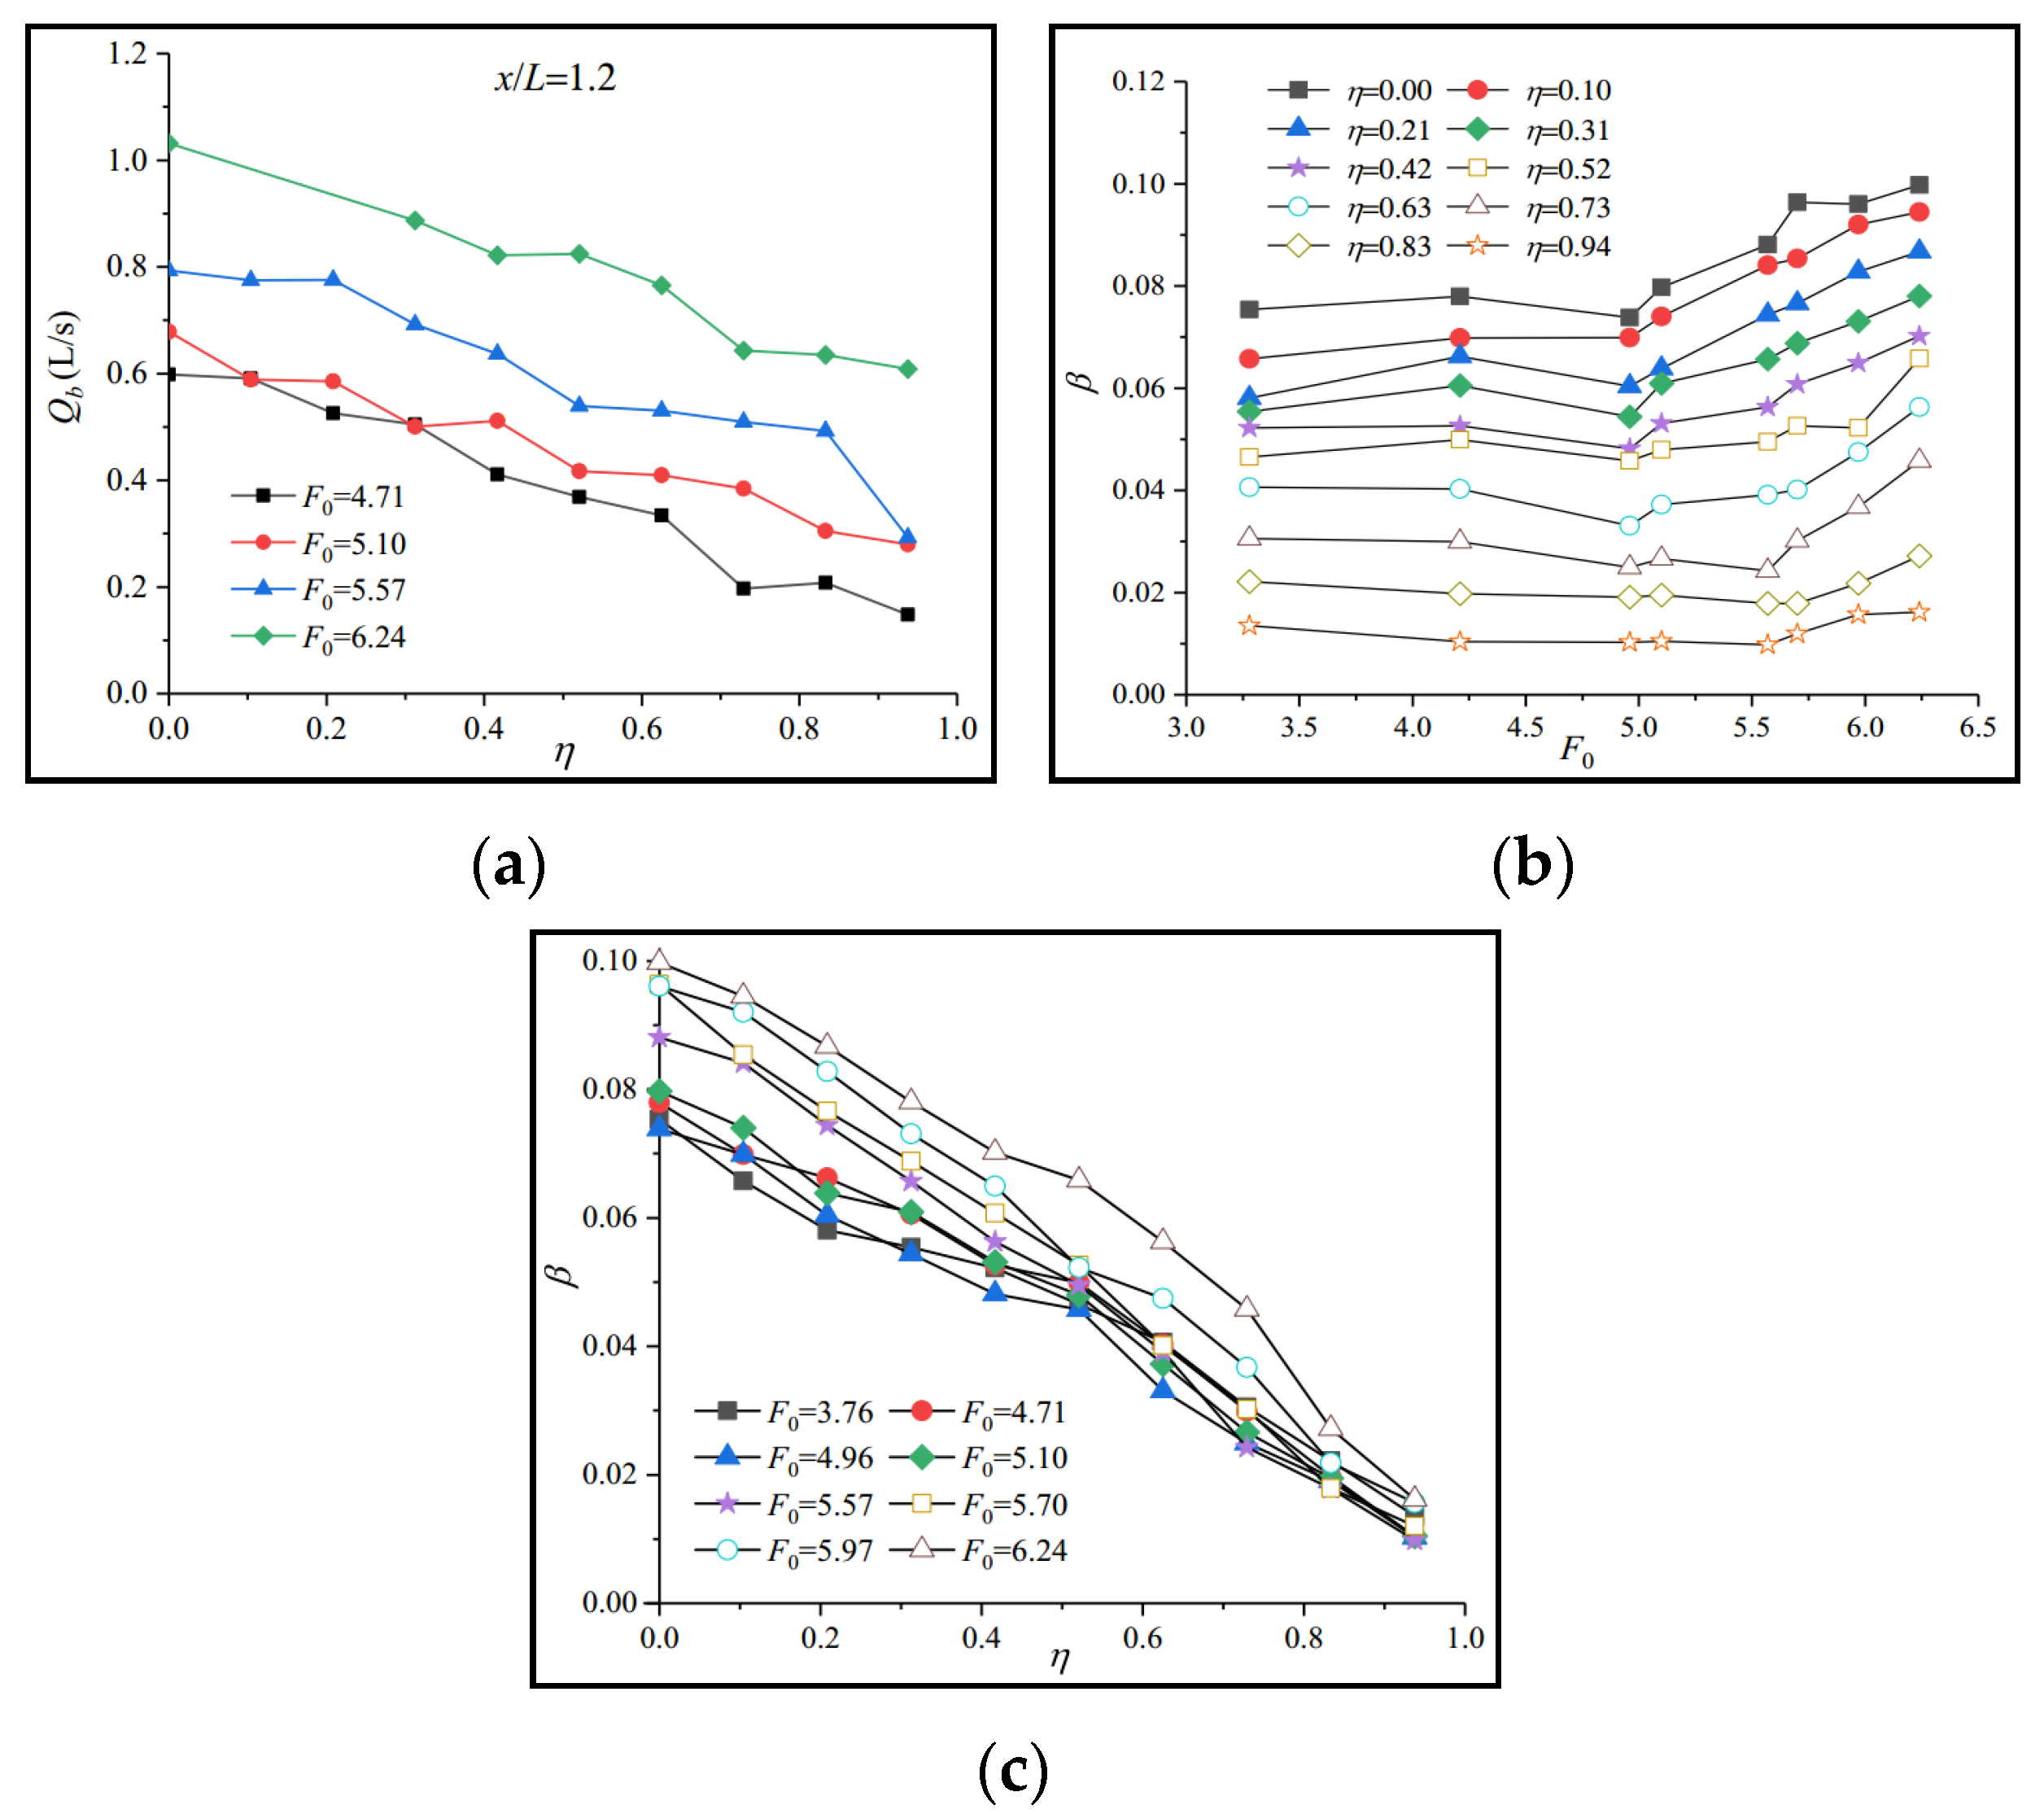
Figure 2a shows the Qb at the bottom flow transported downstream under different atmospheric pressures at x/L = 1.2, where Qb values reflect pressure-induced changes in bottom air entrainment. The cross-sectional average velocity is adopted in the calculation as a simplified treatment of the complex velocity distribution for practical estimation purposes. The value of Qb was defined as the air concentration integral between y = 0 and y = h1 (h1 is the position below the blackwater area C = 0 or C < 0.02):
Q b = V B 0 h 1 C ( y ) d y
V represents the average velocity of the cross-section, and B represents the width of the chute.
Figure 2a demonstrates a decreasing trend in Qb with reducing atmospheric pressure, indicating diminished bottom air entrainment and reduced aerator efficiency. As pressure decreased from 960 hPa to 60 hPa, Qb declined by approximately 50%. This variation aligned with reduced shaft air velocities under constant flow conditions [20]. The attenuation mechanism arises from pressure-dependent air density reduction, which diminishes the flow’s capacity to entrain air. Under identical flow velocity conditions, the amount of air captured by the flow decreases, resulting in a reduction in the cavity subpressure. Externally, this is manifested as a decrease in both air intake velocity and air intake volume.
Atmospheric pressure significantly influences aerator performance, as evidenced by the Qb analysis in Figure 2a. The air entrainment coefficient is a common index used to evaluate the aeration performance of aerators [7,9,15,21]. The air entrainment coefficient β = Qa/Qw describes the air discharge entrained through the shaft relative to the water discharge [5]. In this equation, Qw = the water discharge, and Qa = the ventilation volume in the shaft. The air was entrained into the flow along the jet trajectory of the lower edge cavity, specifying the local air entrainment between x = 0 and the jet terminus without information relating to its distribution or streamwise detrainment. We systematically varied the governing parameter η to examine its effect on β, with the results presented in Figure 2b,c. Testing employed controlled parameter variation methodology, generating multiple test series per boundary condition configuration.
Figure 2. The bottom air entrainment under different atmospheric pressures: (a) the bottom air entrainment at x/L = 1.2; (b) the relation between β and F0; (c) the relation between β and η.
Water 17 02734 g002
Figure 2b demonstrates the influence of independently varied F0 on aeration coefficient β for deflector-free conditions at approach depth h = 0.1 m, revealing F0 = 5.0 as a critical threshold. For F0 ≤ 5.0, β exhibited minimal sensitivity with relatively constant values, whereas beyond this threshold (F0 > 5.0), β increased progressively with higher F0 values and greater curve sensitivity. Correspondingly, Figure 2c shows β decreasing linearly with increasing η, indicating reduced aeration under lower atmospheric pressures. Quantitatively, each 100 hPa pressure reduction decreased β by 0.69–0.93%, with the reduction magnitude exhibiting a positive Froude number dependence: higher F0 values amplified pressure-induced β reductions.
Pfister and Hager [13] examined air entrainment coefficient variations through parameters including F0, α, θ, d/h, and other parameters, and the results confirmed F0 as the dominant control variable for β, but the other parameters did not [9,22,23,24]. Crucially, Figure 2 data reveal significant η and β interdependence, demonstrating vacuum degree as an additional governing factor for aeration performance. The relationship between β and F0 under normal atmospheric pressure can be expressed as follows (R2 = 0.93) [13]:
β = 0.0028 F 0 2 1 + F 0 tan φ 0.1 , for   0 < β < 0.8
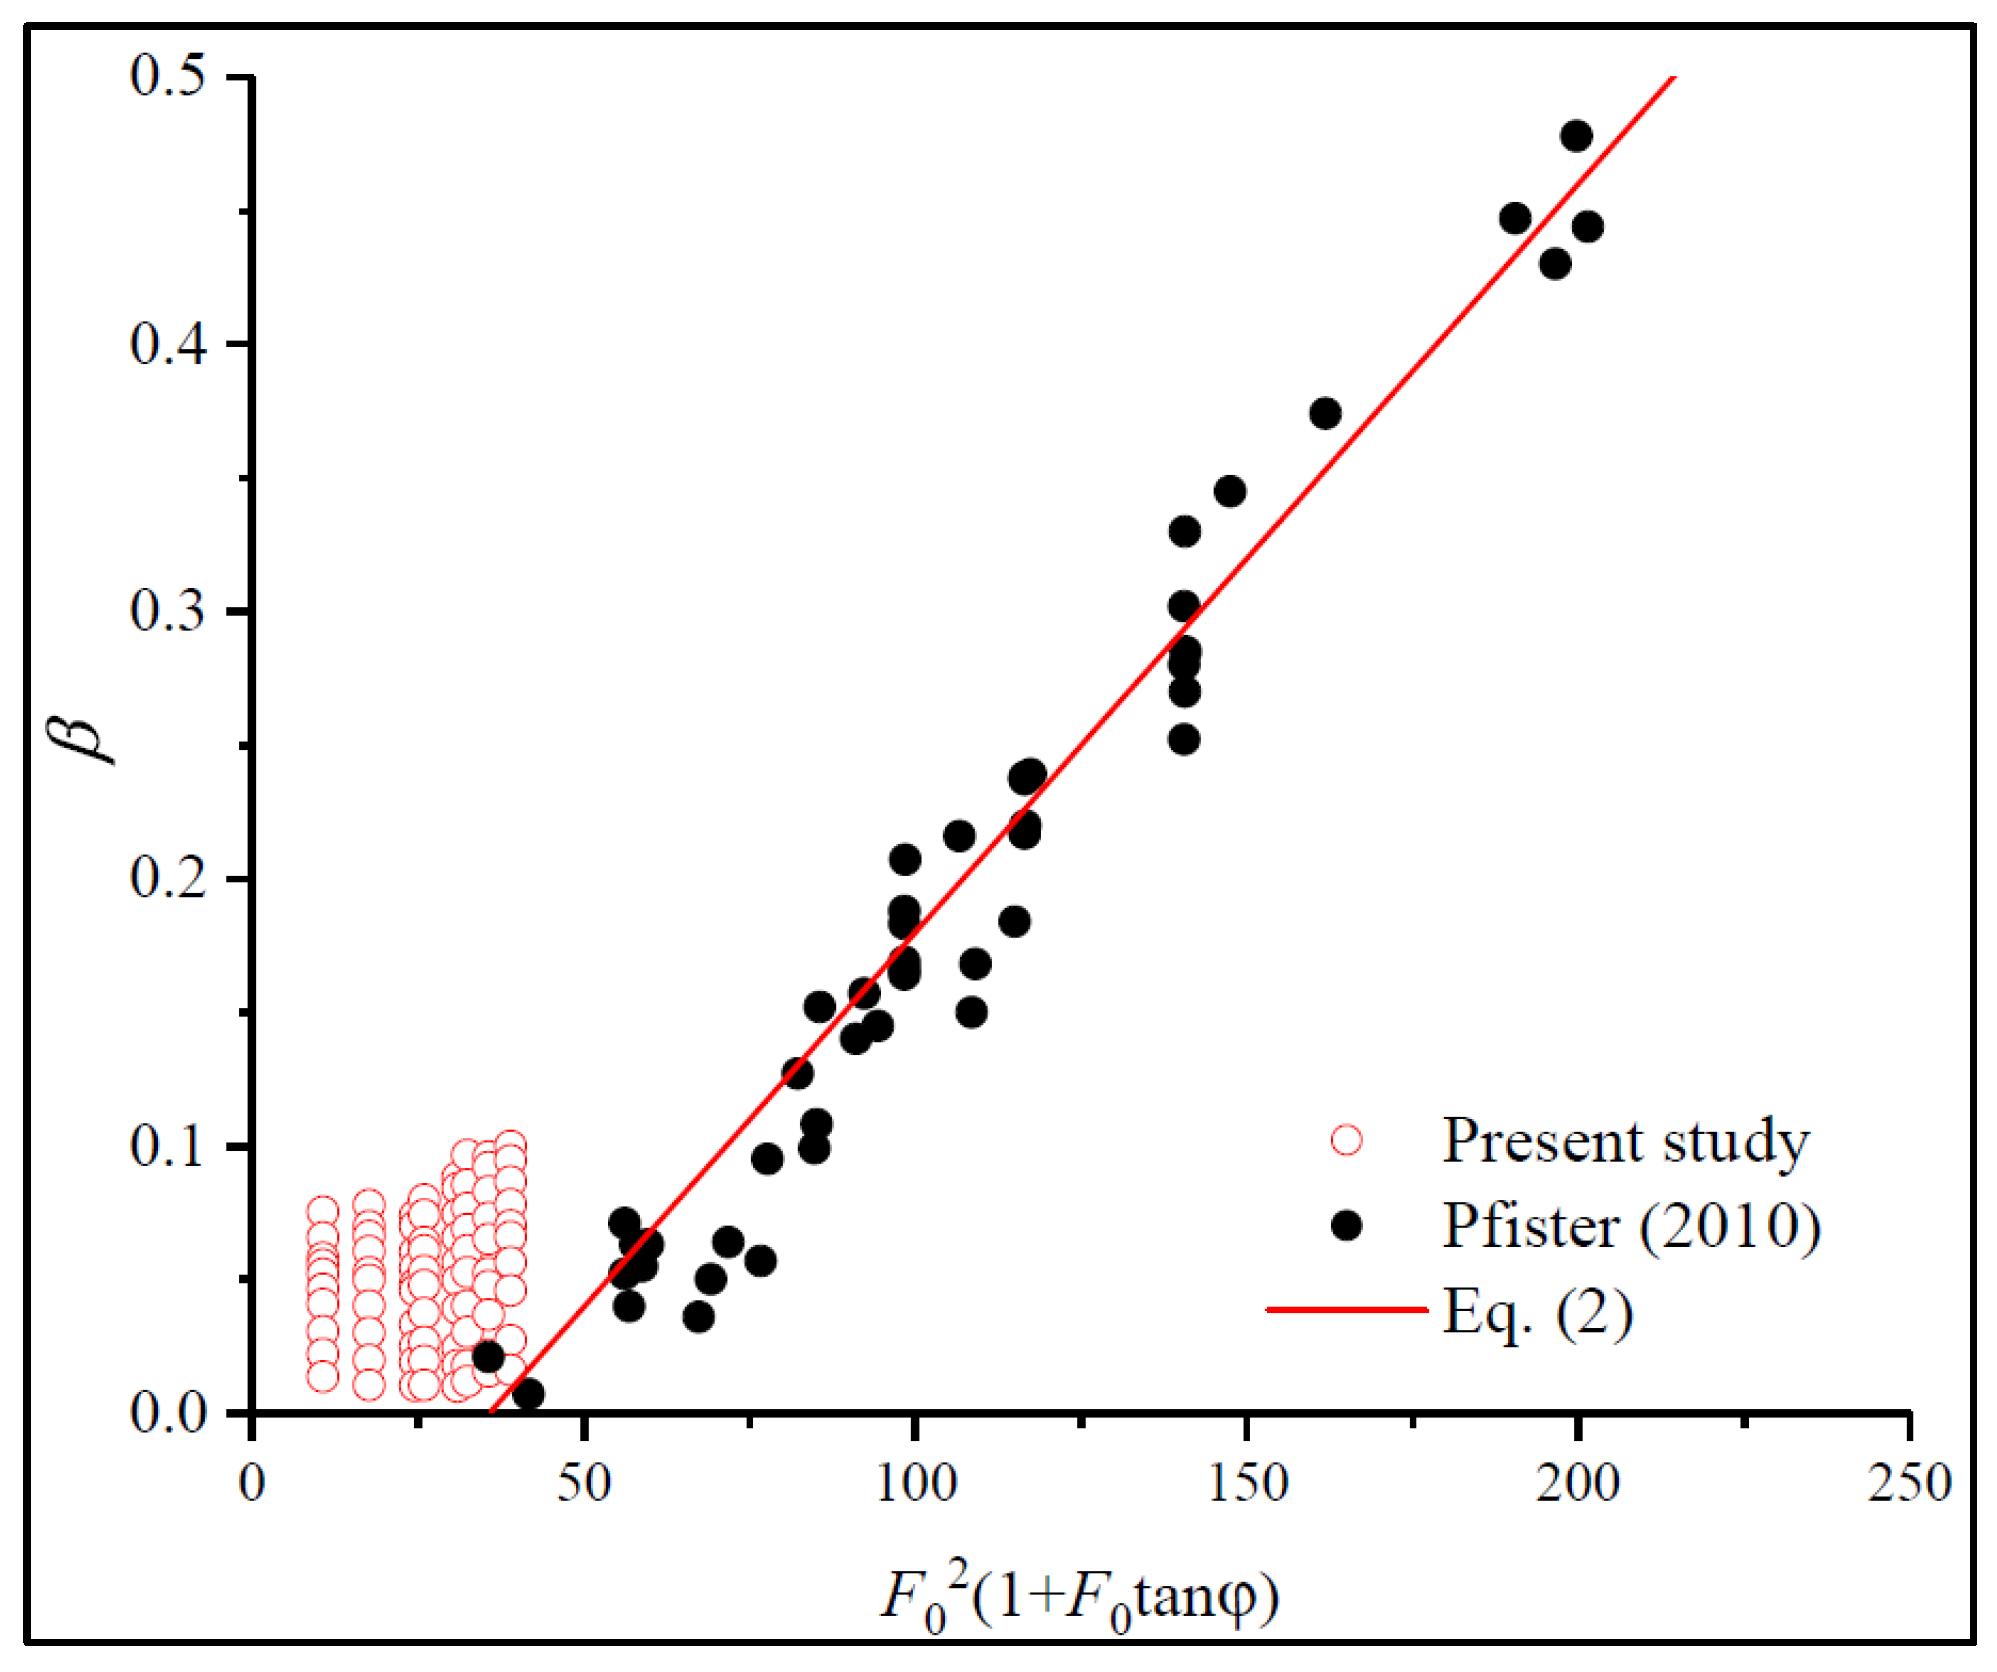
Equation (2) was suitable for the deflector, a step, or combined forms, hs ≈ 0, φ ≥ 0. φ represents the deflector angle, and hs represents the cavity subpressure head. However, this formulation neglects atmospheric pressure effects on β, rendering it inapplicable for variable pressure conditions, as demonstrated in Figure 3. Its validated domain is constrained to 0 < hs/h < 0.1, 0 < β < 0.8, 5.8 ≤ F0 ≤ 16.1, 0° ≤ φ ≤ 11.3°, and 0° ≤ α ≤ 50°. Experimental β values obtained at 4.71 ≤ F0 ≤ 6.64 were compared against the function Φ = [F0 (1 + F0tanφ) (1 − η)]0.5 from Equation (3), with results presented in Figure 4. Based on the dimensional analysis in Figure 4, the results yielded a coefficient of determination R2 = 0.88.
β = 0.00963 × 2.2 6 Φ ,   Φ = F 0 ( 1 + F 0 tan φ ) ( 1 η )
The data in Figure 4 show a good correlation, and the curve intersects the abscissa β ≈ 0 at Φ ≈ 0. Forced aeration occurs through two distinct mechanisms: (1) interfacial aeration along the jet trajectory’s lower surface where turbulent air–water contact entrains air, and (2) impact-driven aeration where flow impingement and turbulent fragmentation dominate air entrainment, which was the primary aeration mechanism.
Figure 4 indicates that β approaches zero when Φ = 2.5 due to the oversized shaft cross-sections relative to flow aeration demand. For F0 < 6.0, self-aeration along the jet trajectory’s lower surface becomes negligible, with primary entrainment occurring during flow impingement on the chute bed where bulk air incorporation transpires. Measured cavity subpressure hs = 0 confirms sufficient shaft dimensions providing surplus airflow, yielding near-zero measured shaft velocities (Va ≈ 0). Low-Froude scenarios exhibited cavity blockage by tailwater, particularly on mild chute slopes. Engineering practice ensures cavity subpressure remains below safe thresholds to optimize cost efficiency. Under unblocked conditions with adequate cavity length, β increased with the value of Φ. The test conditions were limited to 3.28 ≤ F0 ≤ 6.24, φ = 0, α = 6.23°, PN < 0.06, and PN = ρghs/ρgh = hs/h, where PN represents the cavity subpressure index and ρ represents the density of water. The test results in Figure 4 show that β was a function of the parameters F0, φ, and η. When the vacuum degree η > 0.9, the air entrainment volume of the aerator was approximately zero. Equation (3) was extended to 0 < hs/h < 0.1, 0 < β < 0.8, 3.28 ≤ F0 ≤ 16.1, 0° ≤ φ ≤ 11.3°, and 0° ≤ α ≤ 50°.

3.2. Air Concentration Distribution

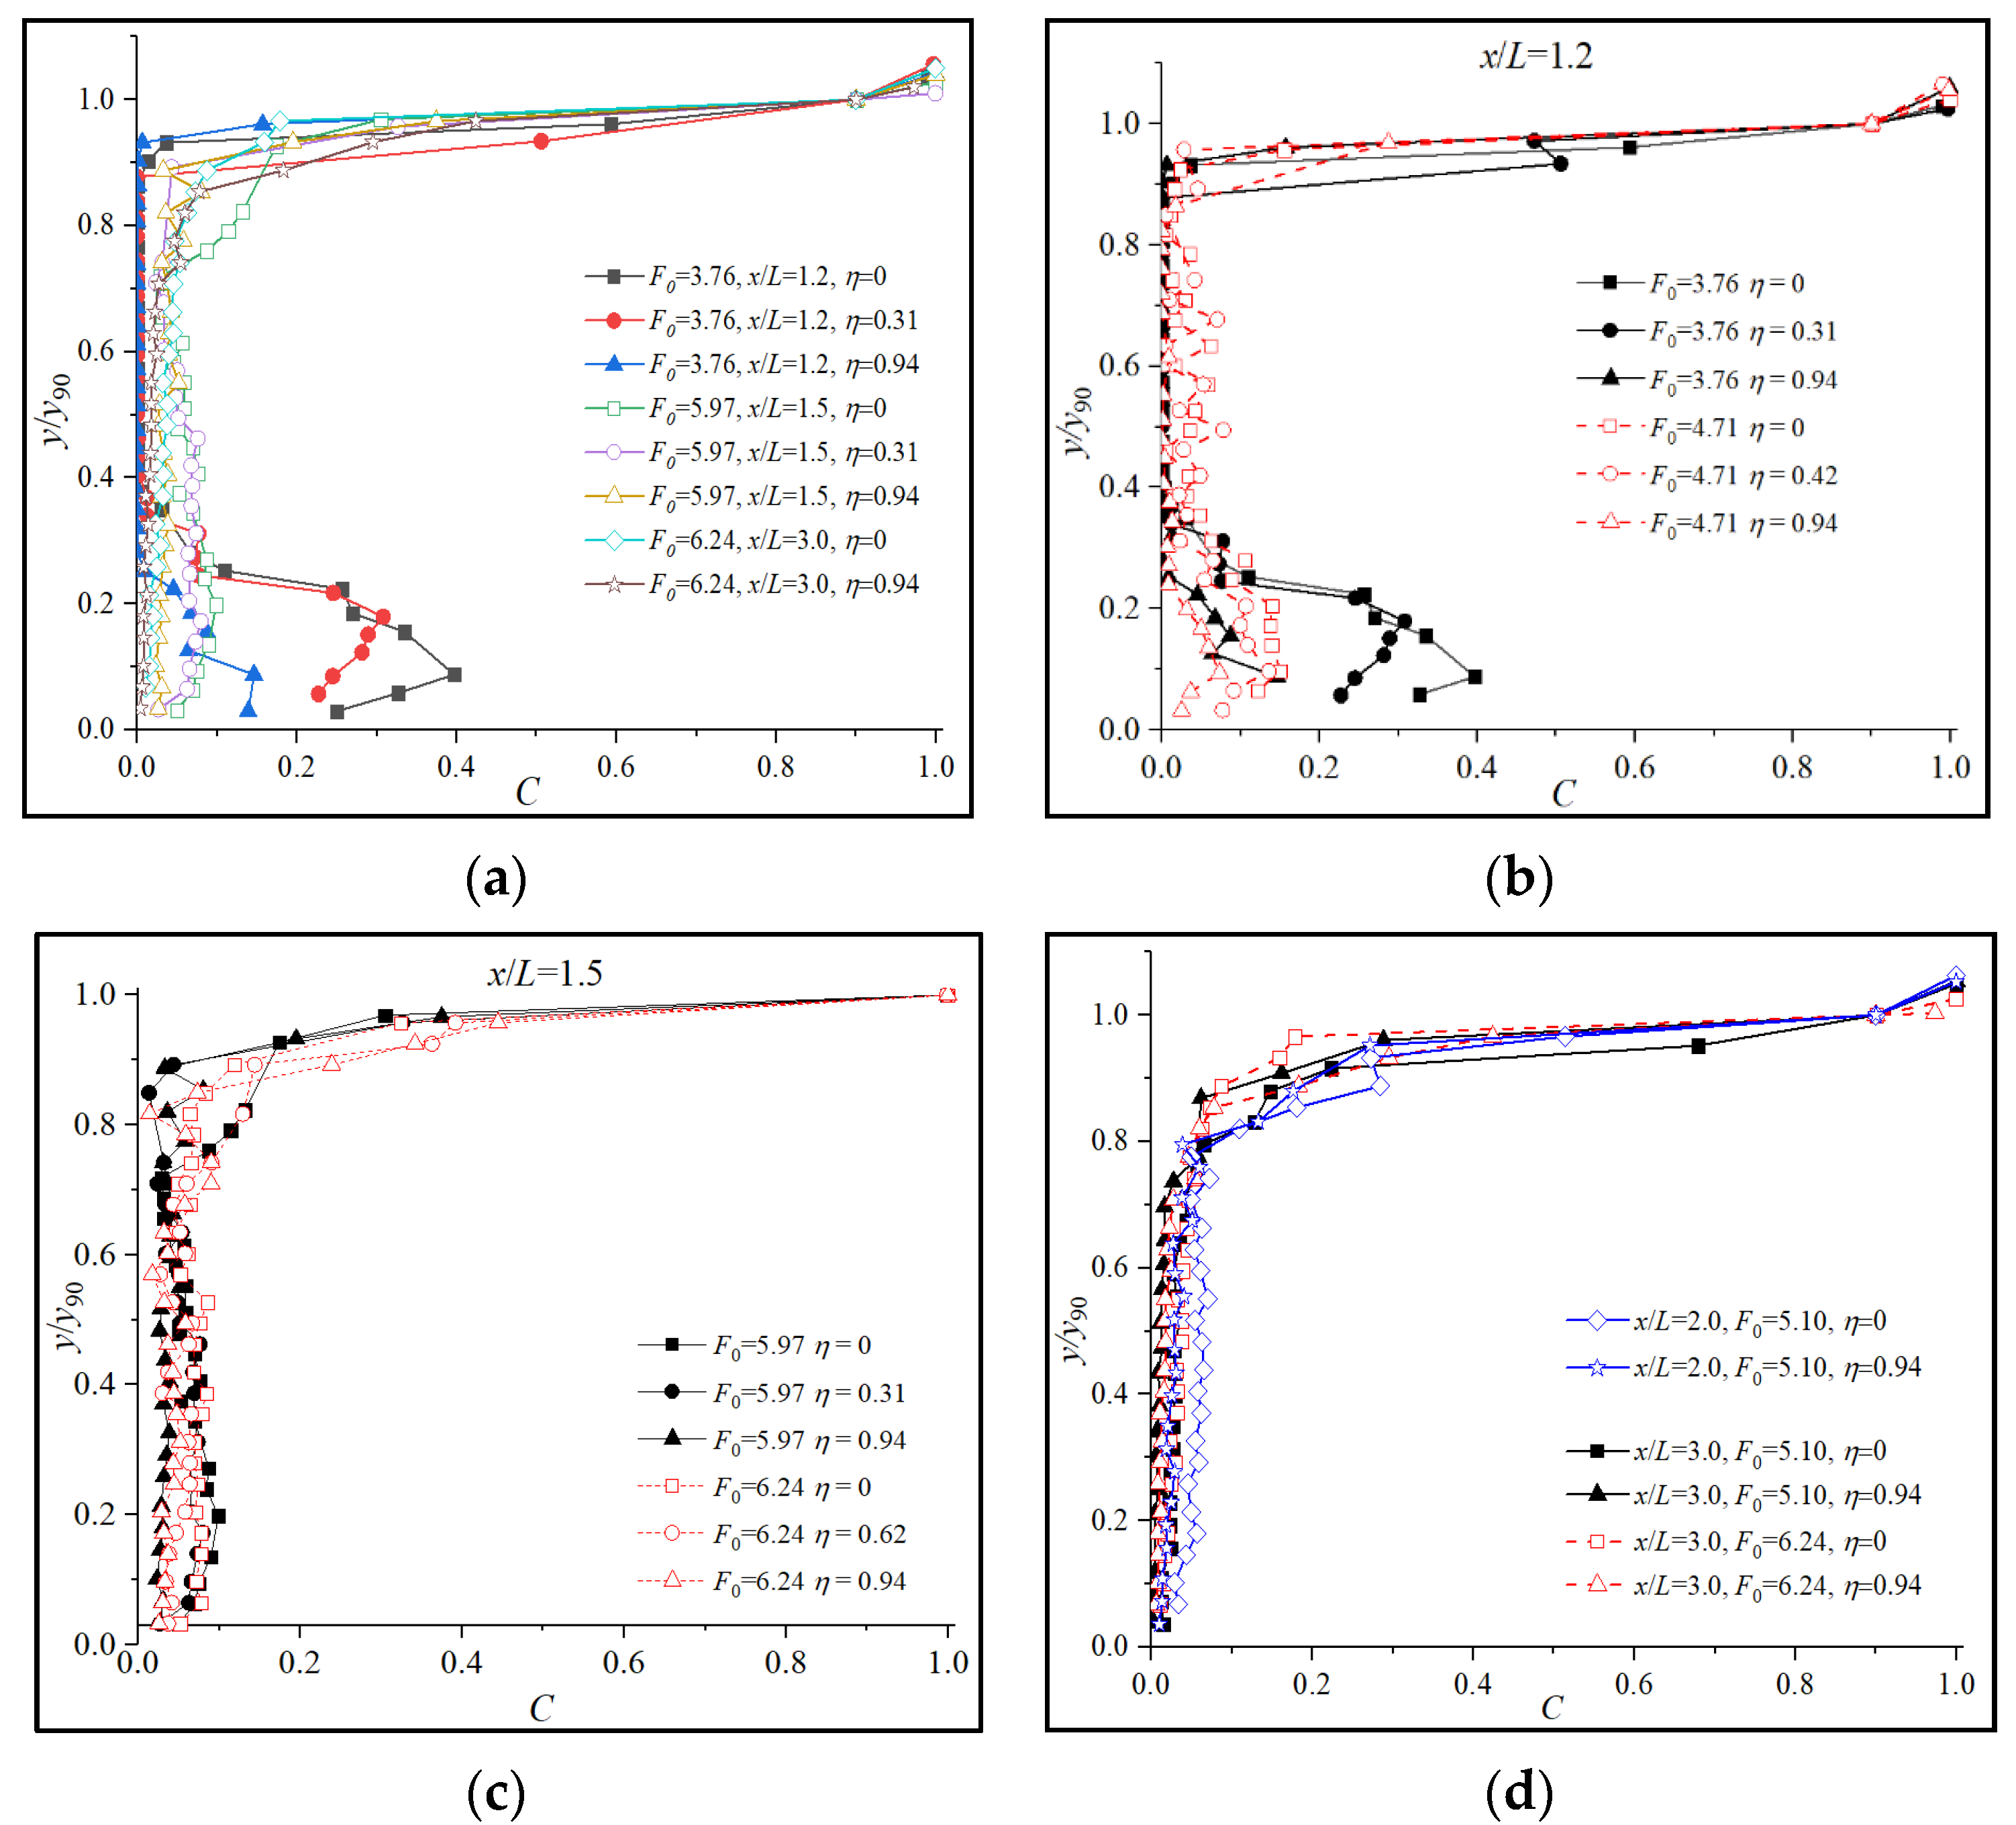
This study systematically characterizes air concentration distributions downstream of typical aerators under varying atmospheric pressures, extending previous research through comprehensive experimental validation. Figure 5 demonstrates these pressure-dependent distribution patterns, with focused analysis on the evolution zone (1.2 ≤ x/L ≤ 3.0). The air concentration distribution in all section profiles conform to the typical air concentration distribution of aerators, confirming that fundamental transport mechanisms persist across pressure conditions [27,28,29,30,31].
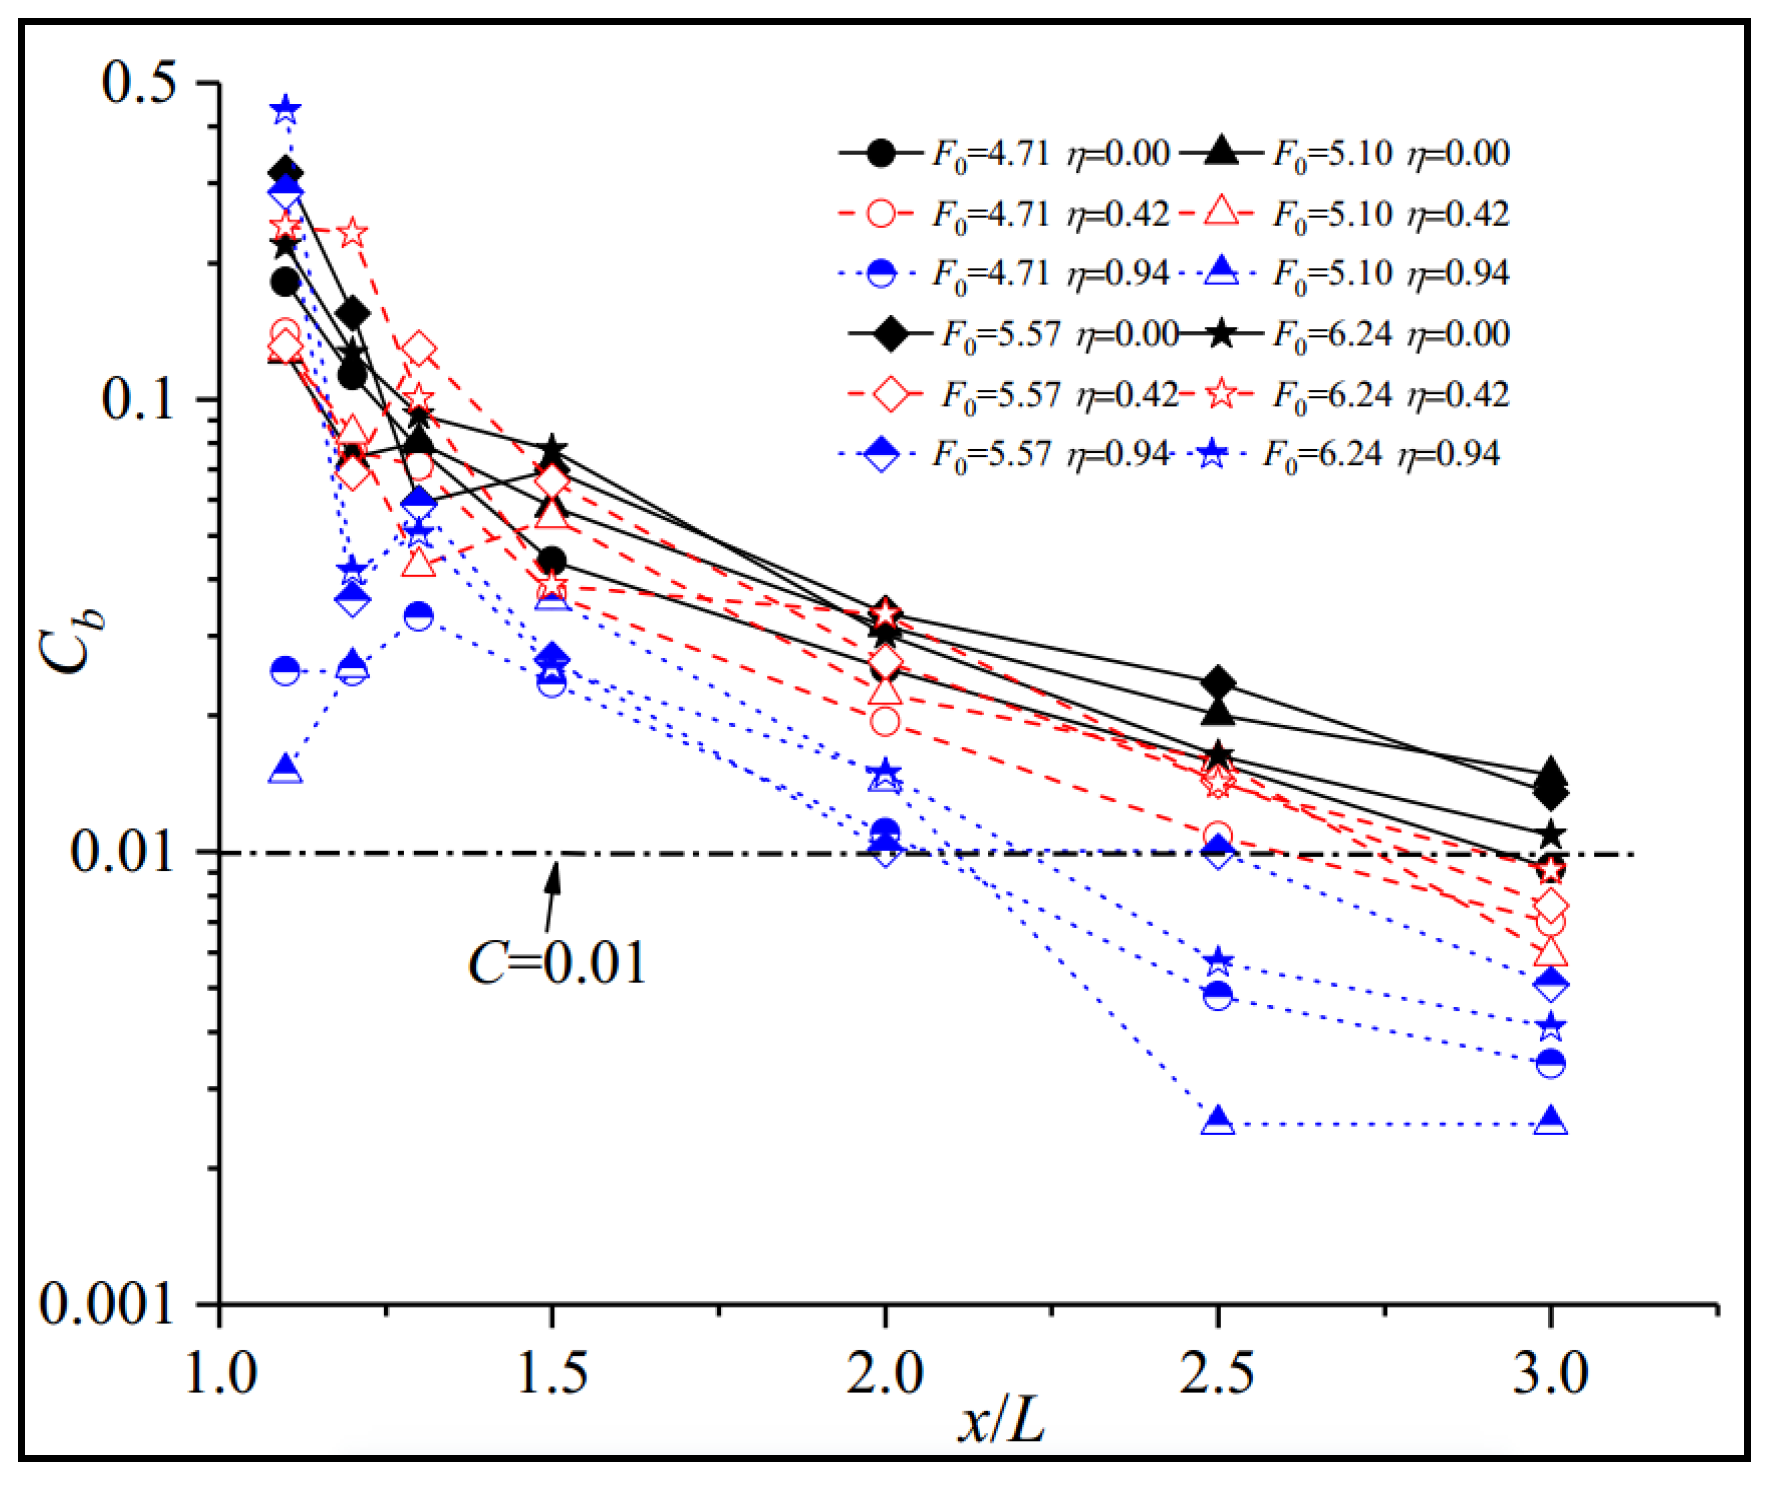
Figure 5a demonstrates reduced bottom air concentrations under decreasing atmospheric pressures, attributable to diminished aeration diffusion within 1.2 ≤ x/L < 3.0. Surface self-aeration remained pressure insensitive, and bottom concentrations exhibited heightened pressure sensitivity due to limited surface aeration influence. Crucially, blackwater areas expanded with pressure reduction. The blackwater disappeared quickly over a short distance at the beginning of the evolution zone, enabling air mixture convergence. Bottom air diffused toward the surface in the evolution zone (1.2 ≤ x/L ≤ 3.0, Figure 5b–d). At x/L = 3.0, the air concentration profile exhibits a quasi-linear bottom-to-surface distribution, with atmospheric pressure variations exerting negligible influence on diffusion trends (Figure 5d). At x/L ≥ 3.0, the air entrainment of the flow was dominated by free surface air entrainment and developed along with the water depth to the chute bed. Atmospheric pressure primarily influenced 1.0 < x/L < 3.0 regions, causing significant bottom concentration variations. Notably, cavitation erosion often occurred at Cb < 0.01 under a normal atmospheric pressure. Therefore, cavitation damage near x/L > 3.0 should be paid more attention at lower pressure.

3.3. Average Air Concentration

The average air concentration Ca at the jet terminus serves as a key index for evaluating atmospheric pressure effects on aerator performance, defined as the depth integrated air concentration between y = 0 and y = y90 (y90 represents the location of C = 0.9):
C a = 1 y 90 0 y 90 C ( y ) d y
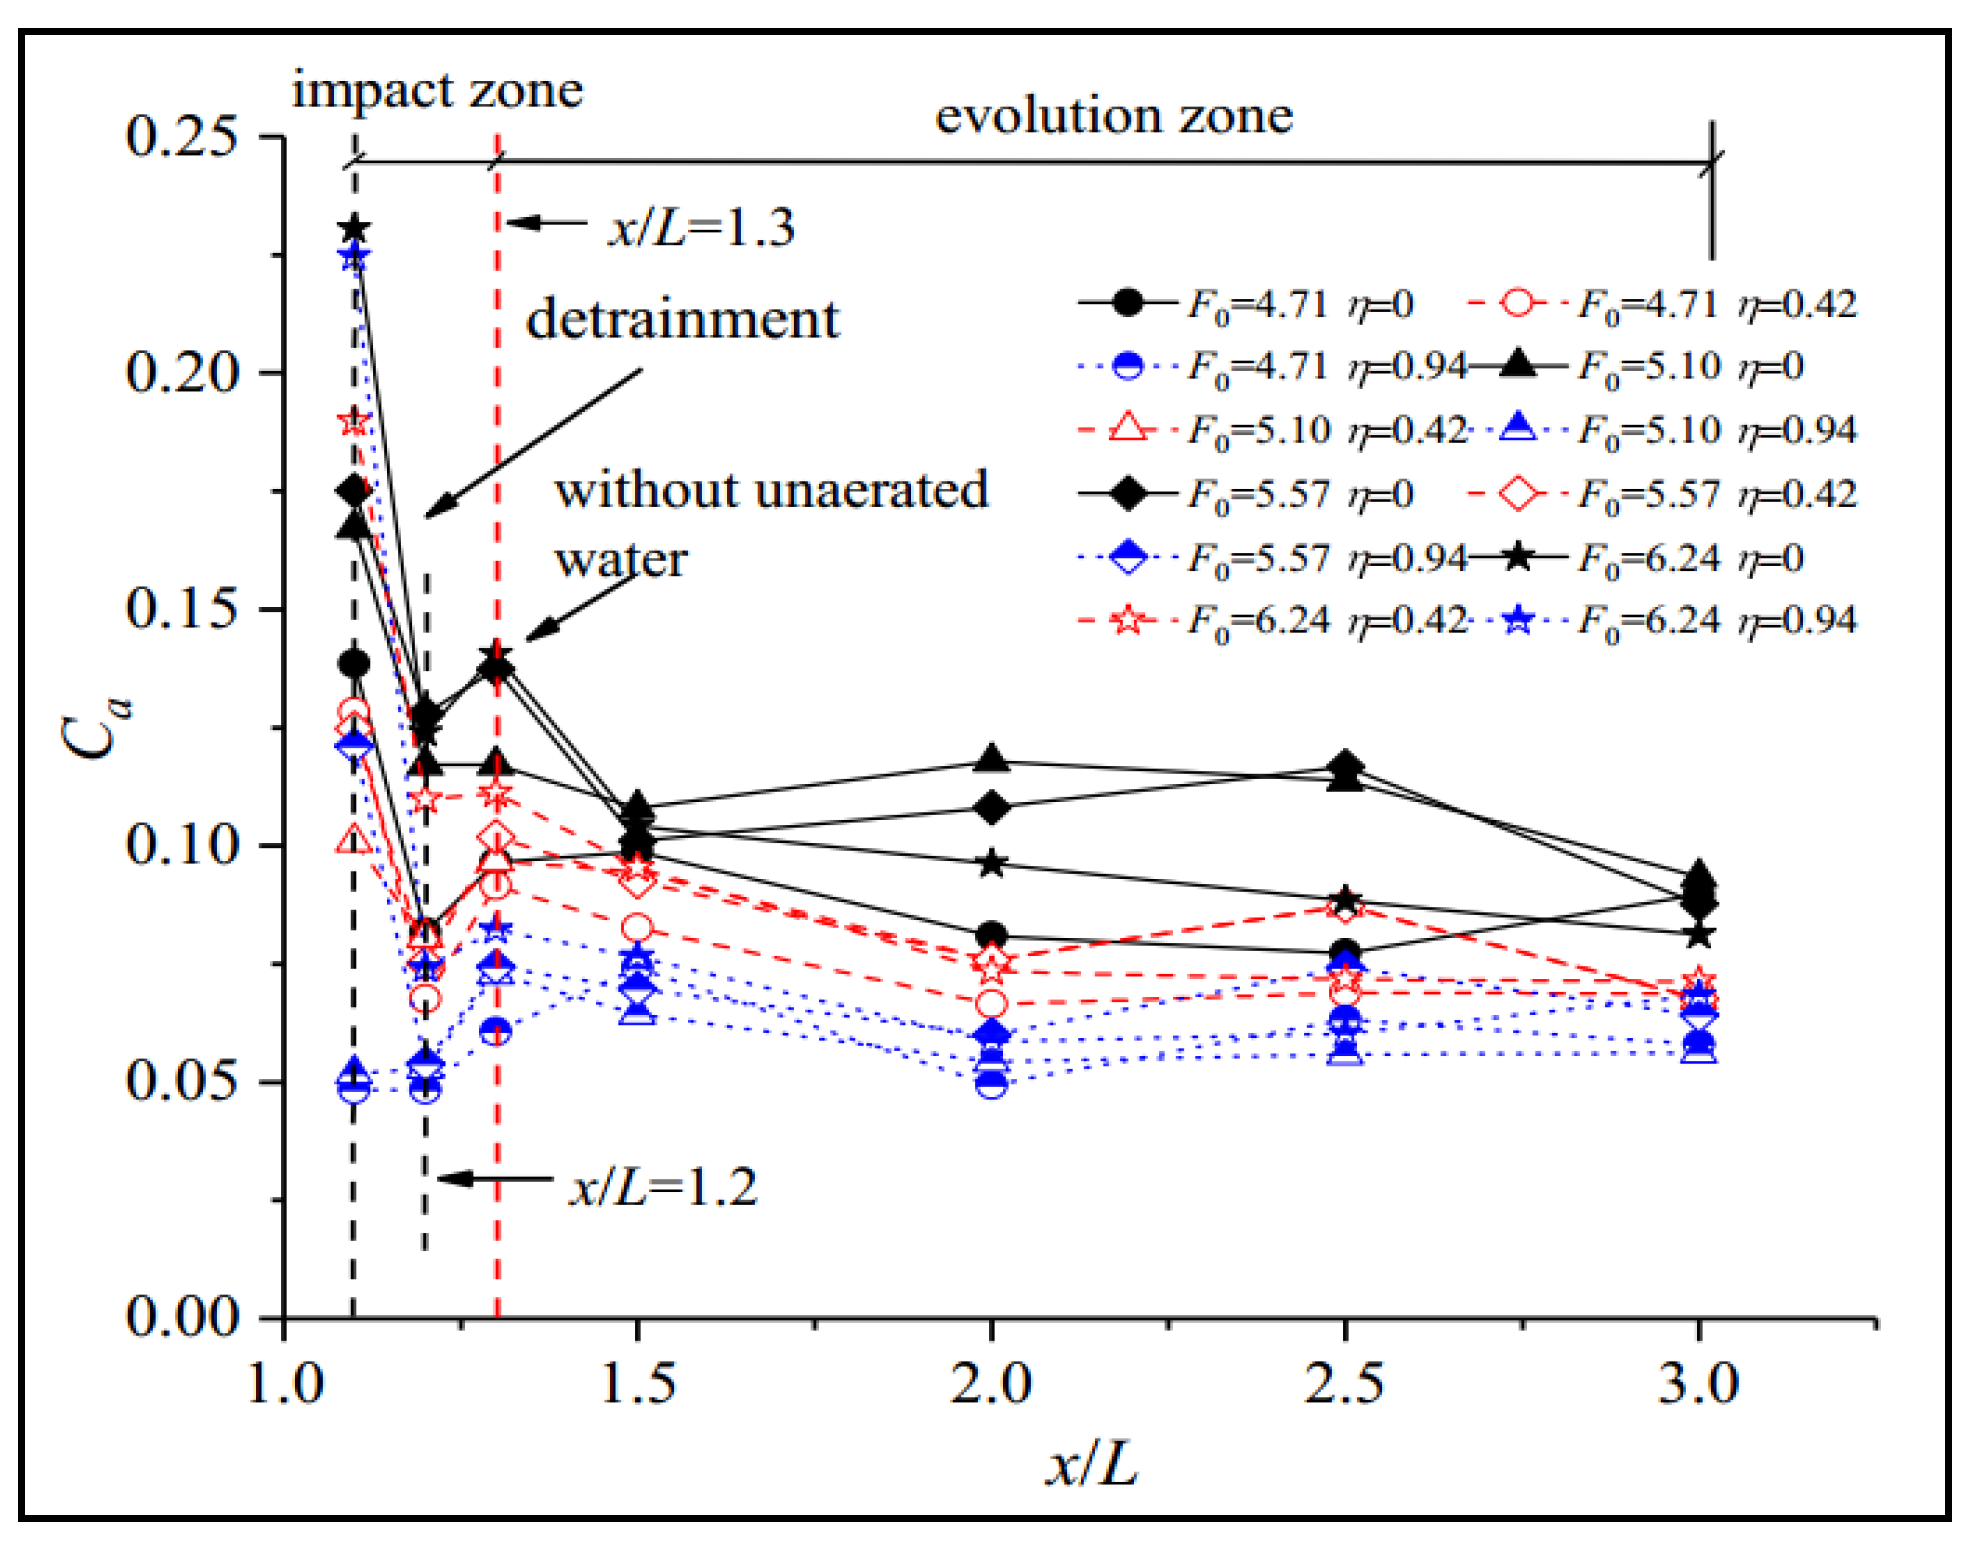
Figure 6 measurements reveal decreasing average air concentration Ca in the impact zone (1.0 < x/L < 1.2), consistent with Pfister and Hager’s [13] observation of 60–90% reduction within 0.25 L downstream. This phenomenon, experimentally confirmed by Bai et al. [15], arises from impact angle-dependent detrainment [28]: low impact angles facilitate efficient air transport, while steeper angles cause bubble dispersion and entrainment reduction. At F0 = 4.71 and 6.24, downstream Ca values were, respectively, 41% and 46% below maximums at x/L = 1.1 (Figure 6), demonstrating enhanced air loss under low pressures. Minimum Ca occurred at x/L = 1.2, where flow stratification created non-aerated zones separating surface and bottom aeration, and bottom air entrainment subsequently transported downstream. Therefore, the value of Qb can be used to evaluate the bottom air entrainment volume. Meanwhile, surface self-aeration at x/L = 1.3 increased Ca through spray generation. Throughout the 1.2 ≤ x/L ≤ 3.0 region, Ca decreased linearly with atmospheric pressure at a rate of 3.16% per 100 hPa reduction. This reduction was primarily driven by pressure-dependent bottom air entrainment, not air detrainment. Increasing vacuum intensification from η = 0 to η = 0.94 reduced Ca by 32.1% within the same region, with consistent trends observed across all tested pressure conditions.
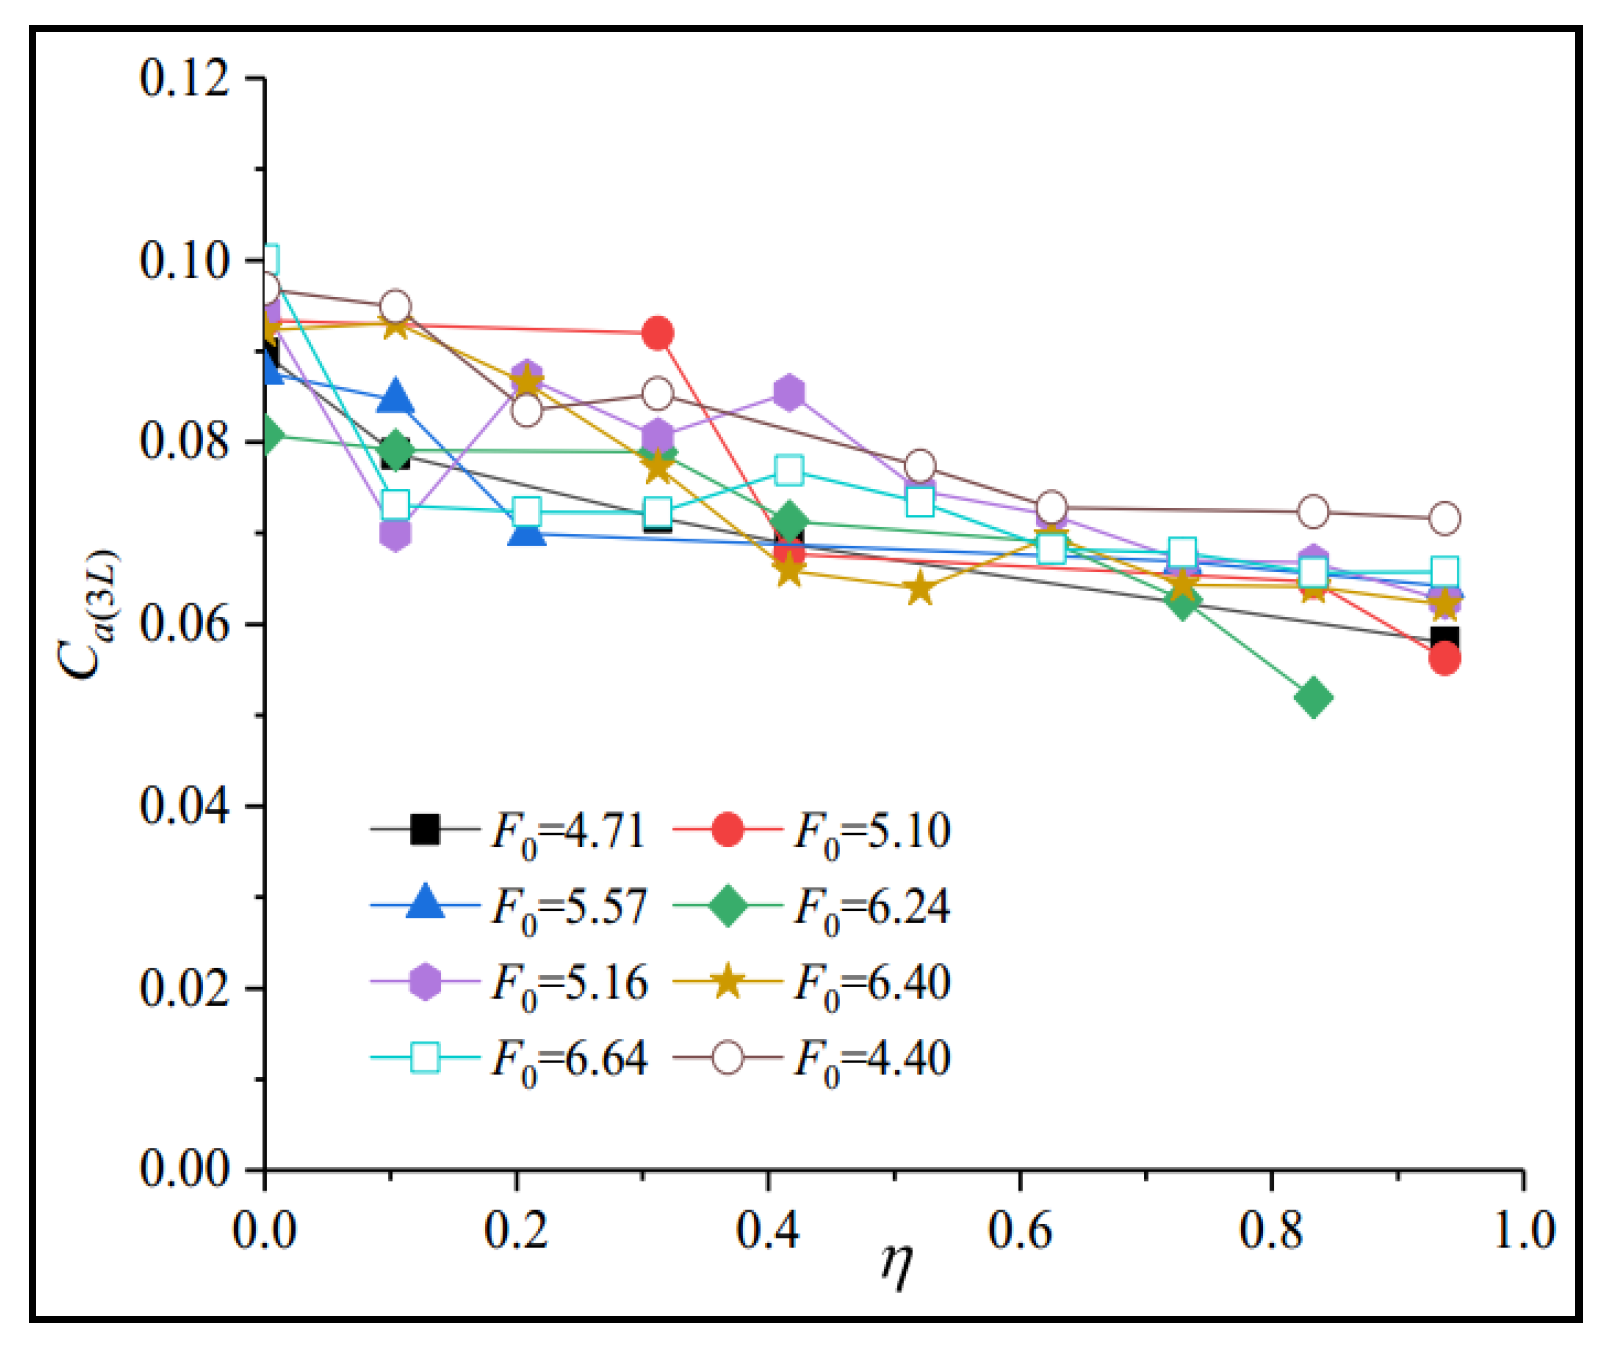
Figure 7 demonstrates atmospheric pressure’s significant influence on the Ca at x/L = 3.0, where Ca(3L) decreased systematically with pressure reduction. While surface self-aeration remained pressure insensitive, the observed Ca(3L) variations primarily stemmed from pressure-dependent bottom air transport. It is worth noting that Ca(3L) ≥ 0.06. Peterka [17] proposed that the value of the average air concentration at 0.01 < Ca < 0.06 can avoid cavitation damage. However, this average concentration predominantly reflects surface self-aeration incapable of protecting the chute bed. Near the chute bed, air concentrations remained significantly lower than Ca, particularly beyond x/L > 3.0. This high-risk zone consequently experiences frequent severe cavitation damage in engineering practice.

3.4. Bottom Air Concentration

To safeguard the chute bed downstream of aerators, the post jet air concentrations were the primary focus. Near bed air concentration Cb directly determines cavitation protection efficacy, measured within less than 3 mm near the chute bed (Figure 8). Analysis reveals Cb decreases streamwise and responds critically to atmospheric pressure, each 100 hPa decrease at x/L = 2.5 reduces Cb exceeding 0.12%. In addition, Cb < 0.01 at x/L > 2.5 under lower atmospheric pressure, posing significant cavitation risk. Peterka [17] proposed that the concrete surface can be completely protected from cavitation damage when the air concentration near the bottom of the chute reaches 5–8%. Rasmussen [32] found that small bubbles of 0.8–1.0% in the water flow can effectively protect the concrete surface based on experiments. Because of the scale effect, the air concentration in a model will be lower than that in a prototype [25,33]. Spillway designs in high-altitude regions require particular attention to cavitation damage at chute bed locations beyond x/L > 2.5.
Pfister and Hager [13] proposed a formula for calculating the Cb of the aerator without a deflector:
f D = x L 1 F 0 2 ( h h + d ) 1.3 ( sin α ) 0.4 , 0 f D 0.2
C b = 1 tanh ( 4.8 f D 0.2 ) , R 2 = 0.74
Equation (6) is strictly applicable only for Cb calculations under normal atmospheric pressure conditions. As evidenced by Figure 8 data, reduced pressures significantly alter Cb values. The vacuum parameter η therefore critically governs Cb through the functional relationship [(1 + η)/(1 − η)]0.25. Consequently, the function fD is expressed as follows:
f D = ( x L 1 ) F 0 2 ( h h + d ) 1.3 ( sin α ) 0.4 ( 1 + η 1 η ) 0.25 , 0 f D 0.2
Figure 9 compares measured Cb (fD) values against Equation (8) for the aerator without a deflector. Data within 1.0 < x/L < 1.2 were excluded due to significant air detrainment errors. The Cb distribution follows Cb = 1 − tanh(5.6fD0.26), R2 = 0.90. Thus, for the aerator without a deflector under variable atmospheric pressures, Cb is given by the following:
C b = 1 tanh ( 5.6 ( x L 1 ) 0.26 F 0 0.52 h h + d 0.338 sin α 0.104 1 + η 1 η 0.065 )
Accordingly, bottom air concentration initiated at x/L = 1.0 (fD = 0) with Cb = 1.0 and plummeted streamwise. By x/L > 3.0, the blackwater emerged at the chute bed and spread continuously. At shallower depths, downward developing surface self-aeration augmented bottom concentrations. Beyond η, the other parameters in Equation (8) significantly influenced jet length. Pfister and Hager [13] pointed out that Cb is mainly affected by F0 and h, while d and α are edge parameters. Figure 9 confirms η’s comparatively modest influence relative to F0 and h.
For economic and design efficiency, spillway aerators prioritize parameters F0, h, and α, where extending the jet trajectory significantly enhances downstream Cb. Under low atmospheric pressures, increasing aerator height d and channel slope α within practical ranges modestly elevates Cb. In addition, an aerator with a deflector can significantly increase the jet length and the bottom air concentration [13]. The bottom air concentration Cb(3L) at x/L = 3.0 can be calculated by Equation (8), and substituting x/L = 3.0 yields the following:
C b 3 L = 1 tanh ( 6.71 F 0 0.52 h h + d 0.338 sin α 0.104 1 + η 1 η 0.065 )
Under low atmospheric pressures, minimal air transports downstream to x/L = 3.0. At significant water depths, surface self-aeration fails to penetrate the chute bed, resulting in Cb < 0.01 at x/L = 3.0. Conversely, shallower flows achieve Cb > 0.01 through surface air entrainment. Consequently, cavitation damage is absent in high-velocity zones at shallow depths, with this inflow condition providing increased safety margins under reduced-pressure operation.

4. Discussion

This investigation examined Weber number influences on water aeration, defining (We)0.5 = V/(σw/ρwLref)0.5 where σw represents the surface tension of water; Lref represents the reference length, and Lref was often replaced by h and L. Since σw depends solely on temperature while h and L remain pressure invariant, We(h) and We(L) are atmosphere independent. Pfister and Hager [12] established negligible scale effects for air entrainment coefficients and two-phase flow characteristics when We(h) > 110 and Re > 1.0 × 10⁵, consistent with scale limitation recommendations [34,35,36]. Below We(h) < 140, downstream bottom air concentrations are systematically underestimated. Although most data satisfied scale criteria, supplementary low Weber tests revealed bottom air concentration overestimation due to backwater effects or reduced depths, and such outliers were excluded from analysis.
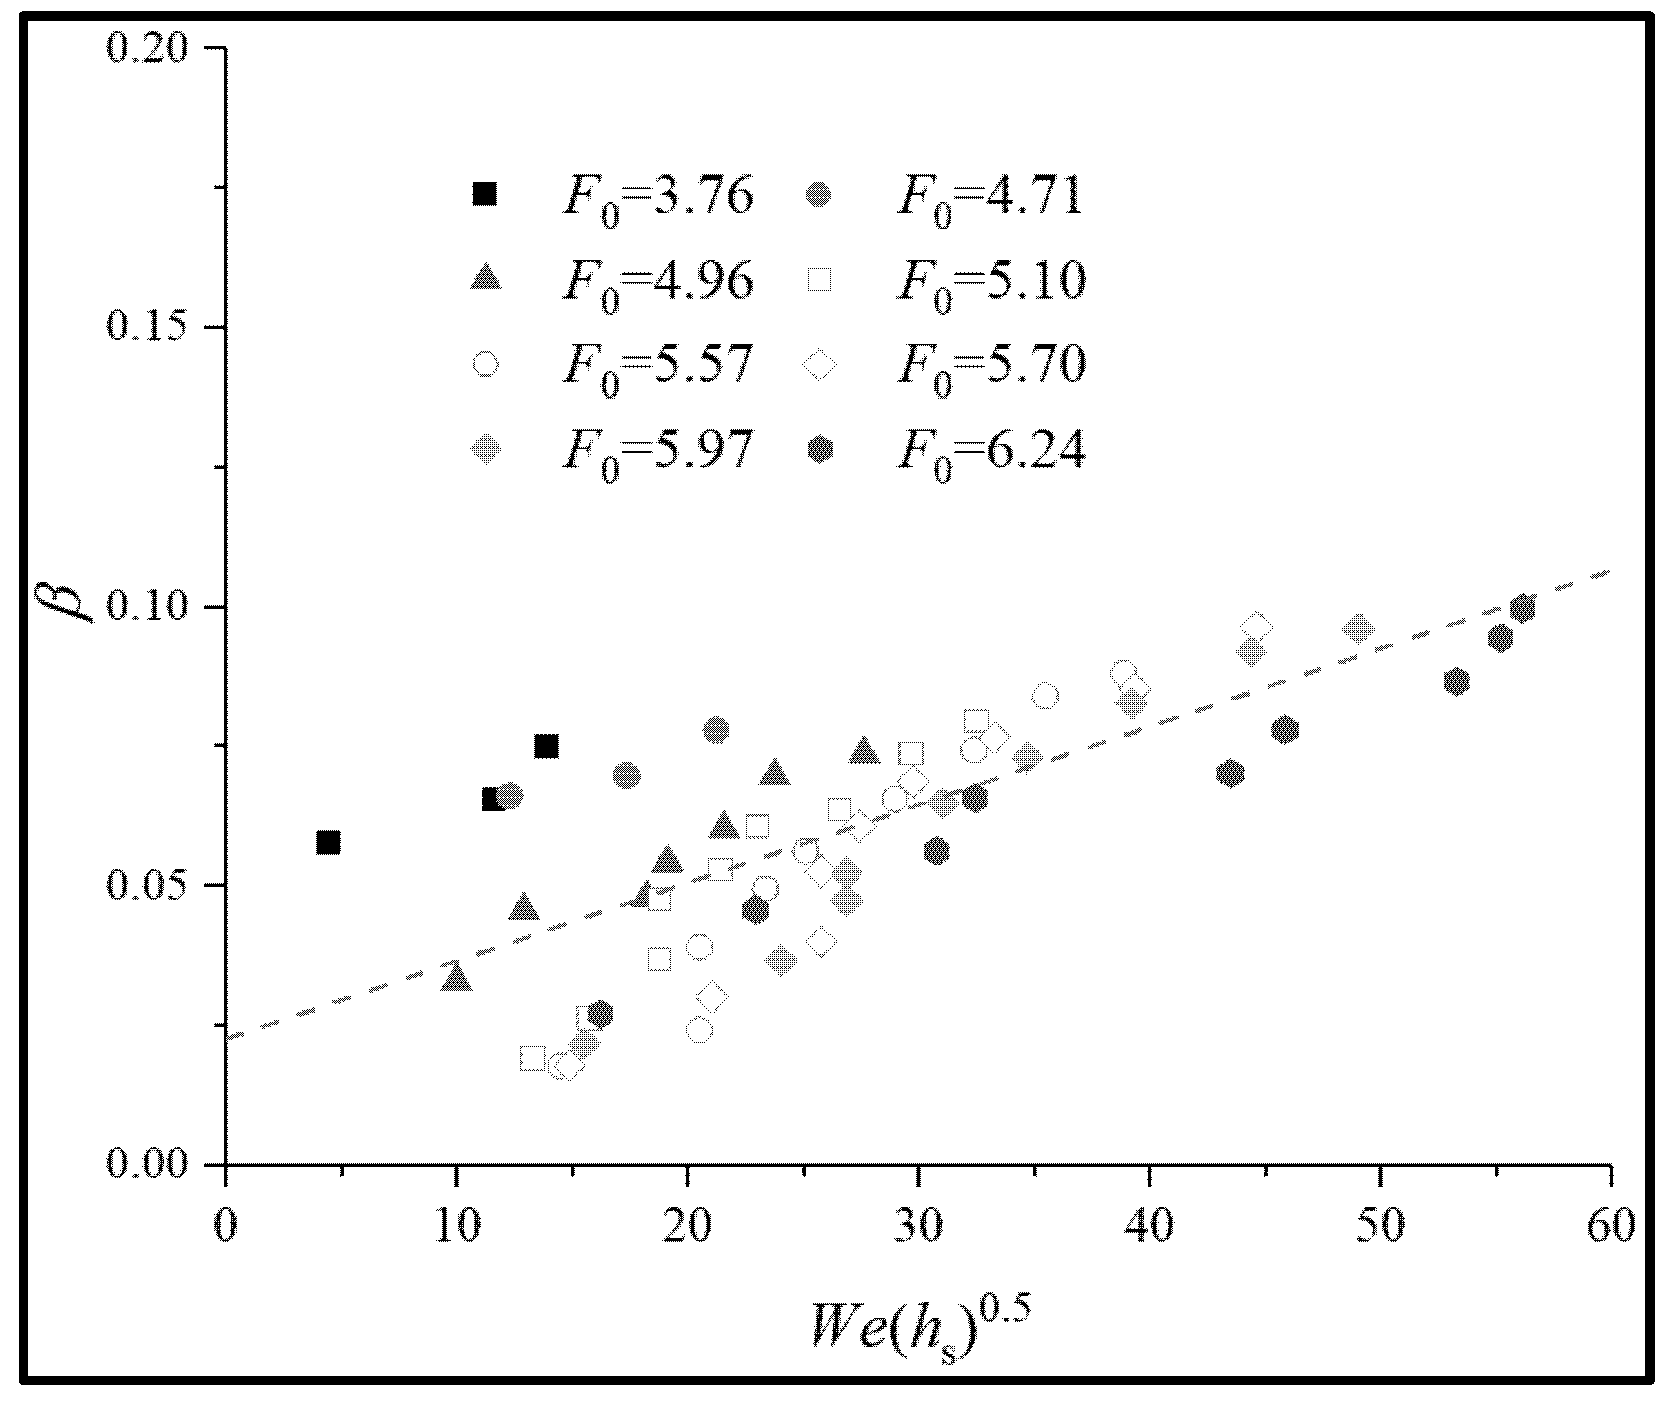
Crucially, experiments revealed significant atmospheric pressure effects on cavity air entrainment under identical inflow conditions; decreasing pressure reduces air entrainment, which is manifested as a decrease in hs. This aligns with Pfister and Hager’s [12,13] observation that air entrainment scales positively with hs. We therefore propose the modified Weber number We(hs)0.5 = V/(σw/ρw hs)0.5 to characterize pressure-dependent aeration. As shown in Figure 10, β increases linearly with We(hs)0.5, though data dispersion intensifies below We(hs)0.5 < 20.
Kramer et al. [16] established that reduced bottom air concentration Cb decreases flow friction and increases velocity, a critical factor for cavitation analysis near chute beds under varying atmospheric pressures. Lower pressures combined with Cb-induced velocity elevation reduce cavitation numbers, necessitating enhanced protection in high-altitude high-velocity flows. Diminished aeration at altitude exacerbates cavitation risk, particularly beyond x/L > 2.5, where Cb < 0.01 further decreases under low pressures. This zone constitutes a primary cavitation hazard requiring prioritized attention. As in JiaCha and LiangHeKou Hydropower Stations, the altitude reached 3000 m, bottom air concentrations decrease over 20% compared to normal atmosphere pressure conditions, potentially triggering altitude-specific cavitation absent at normal pressure. Consequently, high-head, high-velocity discharge structures in high-altitude regions (the actual altitude is difficult to reach 4000 m) demand vigilant monitoring of reduced air entrainment capacity, prolongation of aeration protection distances, and targeted safeguards for regions beyond x/L > 2.5 during design and operation phases.
The conductivity probe used in this study has certain limitations in characterizing bubble movement behaviors. Future research could consider employing synchrotron X-ray-based PIV techniques to more clearly reveal the mechanisms of bubble coalescence, breakup, and transport in multiphase flows [37].

5. Conclusions

Systematic measurements of air entrainment coefficients and streamwise air concentration distributions reveal key mechanisms governing atmospheric pressure effects on chute aerator performance. Experimental data confirm the air concentration distribution’s adherence to established typical concentration profiles across all flow regions. Analysis qualitatively characterizes atmospheric pressure impacts on concentration evolution within the impact zone (1.0 < x/L < 1.2) and evolution zone (1.2 ≤ x/L ≤ 3.0), while quantitatively demonstrating significant pressure dependence in both streamwise averaged and near-bed air concentrations.
This research demonstrates reduced air entrainment in the impact zone under decreasing atmospheric pressures, establishing atmospheric pressure as a critical control parameter for aerator performance. Jet zone analysis confirms a consistent pressure-dependent reduction in entrainment, excluding the effects of bottom cavity backwater. Validated predictive formulas were proposed for air entrainment coefficients across pressure conditions, revealing that lower pressures necessitate greater cavity air intake, which demands optimized aerator and ventilation systems. Crucially, diminishing bottom air concentrations (Cb) under reduced pressure directly compromises cavitation protection in high-velocity flows. The empirical model relating streamwise Cb to atmospheric pressure shows strong agreement with experimental data, capturing the complex air–water interactions governing aerator performance. This pressure sensitive transport mechanism establishes a new theoretical framework for aerated channel flow, providing actionable design principles for high-altitude spillways and aeration facilities.

Author Contributions

Conceptualization and funding acquisition, J.D.; investigation, Y.W. and T.S.; writing, Y.W.; writing—review and supervision, W.W. All authors have read and agreed to the published version of the manuscript.

Funding

This research was supported by the National Natural Science Foundation of China grant number [51939007]; the Joint Funds of the National Natural Science Foundation of China [U23A20668]; the Sichuan Natural Science Foundation of China [23NSFSC3768]; Regional Innovation and Development Joint Funds of National Natural Science Foundation of China [U23A20668].

Data Availability Statement

The data presented in this study are available on request from the corresponding author.

Conflicts of Interest

Author Yameng Wang was employed by the company China Construction Third Bureau Green Industry Investment Co., Ltd. The remaining authors declare that the research was conducted in the absence of any commercial or financial relationships that could be construed as a potential conflict of interest.

Abbreviations

The following abbreviations are used in this manuscript:
Athe cross-sectional area of the shaft (m2)
Bchute width (m)
Cthe air concentration (-)
Cathe average air concentration (-)
Cbthe bottom air concentration (-)
Ca(3L)the average air concentration at x = 3L (-)
Cb(3L)the bottom air concentration at x = 3L (-)
ddeflector high (m)
Fsamplethe sampling frequency (kHz)
ggravitational acceleration (m/s2)
Hthe upstream head (m)
hthe approach flow depth (m)
h1h1 is the position below the blackwater area C = 0 or C < 0.02 (m)
hsthe cavity subpressure head (m)
Lthe jet length (m)
Lrefreference length (m)
P0the atmosphere pressure outside the depression tank (P0 = 960 hPa)
Pathe ambient pressure inside the depression tank (hPa)
PNcavity subpressure index (-)
Qathe ventilation volume in the shaft (m3/s)
Qbair entrainment volume in the bottom water flow (L/s)
Qwwater discharge (m3/s)
tsampling time (s)
Vthe approach flow velocity (m/s)
Vathe air velocity in the shaft (m/s)
F0Froude number (-)
ReReynolds number (-)
We(h)Weber number, Lref = h (-)
We(L)Weber number, Lref = L (-)
We(hs)Weber number, Lref = hs (-)
xthe length of the direction of the flow (m)
ythe height of perpendicular to the chute (m)
y90the height of air-water interface C = 0.9 (m)
σwthe surface tension (N/m)
αdownstream chute angle (°)
βair entrainment coefficient (-)
ηvacuum degree (-)
φdeflect angle (°)
ρwwater density (kg/m3)

References

  1. Falvey, H.T. Cavitation in chutes and spillways. In Engineering Monograph; No. 42; United States Department of the Interior: Washington, DC, USA, 1990. [Google Scholar]
  2. Ge, M.M.; Sun, C.Y.; Zhang, G.J.; Coutier-Delgosha, O.; Fan, D. Combined suppression effects on hydrodynamic cavitation performance in Venturi-type reactor for process intensification. Ultrason. Sonochem. 2022, 86, 106035. [Google Scholar] [CrossRef] [PubMed]
  3. Wilhelms, S.C.; Gulliver, J.S.; Ling, J.T.; Ling, R.S. Gas transfer, cavitation, and bulking in self–aerated spillway flow. J. Hydraul. Res. 2005, 45, 532–539. [Google Scholar] [CrossRef]
  4. Pfister, M.; Hager, W.H. Self–entrainment of air on stepped spillways. Int. J. Multiph. Flow 2011, 37, 99–107. [Google Scholar] [CrossRef]
  5. Pfister, M. Chute aerators: Steep deflectors and cavity subpressure. J. Hydraul. Eng. 2011, 137, 1208–1215. [Google Scholar] [CrossRef]
  6. Brujan, E.A.; Matsumoto, Y. Collapse of micrometer–sized cavitation bubbles near a rigid boundary. Microfluid. Nanofluid. 2012, 13, 957–966. [Google Scholar] [CrossRef]
  7. Chanson, H. Study of air entrainment and aeration devices. J. Hydraul. Res. 1989, 27, 301–319. [Google Scholar] [CrossRef]
  8. Chanson, H. Flow downstream of an aerator−Aerator spacing. J. Hydraul. Res. 1989, 27, 519–536. [Google Scholar] [CrossRef]
  9. Rutschmann, P.; Hager, W.H. Air entrainment by spillway aerators. J. Hydraul. Eng. 1990, 116, 765–782. [Google Scholar] [CrossRef]
  10. Kramer, K.; Hager, W.H. Air transport in chute flows. Int. J. Multiph. Flow 2005, 31, 1181–1197. [Google Scholar] [CrossRef]
  11. Kramer, K.; Hager, W.H.; Minor, H.E. Development of air concentration on chute spillways. J. Hydraul. Eng. 2006, 132, 908–915. [Google Scholar] [CrossRef]
  12. Pfister, M.; Hager, W.H. Chute aerators I: Air transport characteristics. J. Hydraul. Eng. 2010, 136, 352–359. [Google Scholar] [CrossRef]
  13. Pfister, M.; Hager, W.H. Chute aerators II: Hydraulic design. J. Hydraul. Eng. 2010, 136, 360–367. [Google Scholar] [CrossRef]
  14. Bai, R.D.; Zhang, F.X.; Wang, W.; Liu, S.J. Air entrainment and detrainment downstream of a chute aerator. J. Hydrodyn. 2019, 31, 76–82. [Google Scholar] [CrossRef]
  15. Bai, R.D.; Liu, S.J.; Tian, Z.; Wang, W.; Zhang, F. Experimental investigation of bubbly flow and air entrainment discharge downstream of chute aerators. Environ. Fluid Mech. 2019, 19, 1455–1468. [Google Scholar] [CrossRef]
  16. Kramer, M.; Felder, S.; Hohermuth, B.; Valero, D. Drag reduction in aerated chute flow: Role of bottom air concentration. J. Hydraul. Eng. 2021, 147, 04021041. [Google Scholar] [CrossRef]
  17. Peterka, A.J. The effect of entrained air on cavitation pitting. In International Hydraulics Convention, Minneapolis; American Society of Civil Engineers: New York, NY, USA, 1953; pp. 507–518. [Google Scholar]
  18. Chen, X.P.; Deng, J.; Wei, W.R. Development and Application of the velocimeter using air concentration probe of needle–type. In Proceedings of the 16th National Conference of Hydrodynamics/The 32nd National Conference on Hydrodynamics, Wuxi, China, 30 October 2021; pp. 629–635. (In Chinese). [Google Scholar]
  19. Wei, W.R.; Xu, W.L.; Deng, J.; Guo, Y. Free surface air entrainment and single–bubble movement in supercritical open–channel flow. J. Hydraul. Eng. 2020, 146, 04020050. [Google Scholar] [CrossRef]
  20. Wang, Y.M.; Deng, J.; Wei, W.R. Investigation on the cavity backwater of chute aerators under various atmospheric pressures. Water 2022, 14, 1513. [Google Scholar] [CrossRef]
  21. Wu, J.H.; Zhou, Y.; Ma, F. Air entrainment of hydraulic jump aeration basin. J. Hydrodyn. 2019, 30, 962–965. [Google Scholar] [CrossRef]
  22. Rutschmann, P. Belüftungseinbauten in Schussrinnen [Chute Additions for Air Entrainment]; Mitteilung, D.V., Ed.; ETH–Laboratory of Hydraulics, Hydrology and Glaciology (VAW): Zurich, Switzerland, 1988; p. 97. (In German) [Google Scholar]
  23. Chanson, H. Study of Air Entrainment and Aeration Devices on Spillway Model. Ph.D. Thesis, University of Canterbury, Christchurch, New Zealand, 1988. [Google Scholar]
  24. Kökpınar, M.A.; Göğüş, M. High–speed jet flows over spillway aerators. Can. J. Civ. Eng. 2002, 29, 885–898. [Google Scholar] [CrossRef]
  25. Wei, W.R.; Deng, J.; Zhang, F.X.; Tian, Z. A numerical model for air concentration distribution in self−aerated open channel flows. J. Hydrodyn. 2015, 27, 394–402. [Google Scholar] [CrossRef]
  26. Aydin, M.C. Aeration efficiency of bottom-inlet aerators for spilways. ISH J. Hydraul. Eng. 2017, 24, 330–336. [Google Scholar] [CrossRef]
  27. Pfister, M.; Chanson, H. Discussion of scale effects in physical hydraulic engineering models. J. Hydraul. Res. 2012, 50, 244–246. [Google Scholar] [CrossRef]
  28. Wang, H.; Liu, X.C.; Bai, R.D.; Liu, S. Modified bottom air entrainment estimate by chute offset aerator. J. Hydraul. Eng. 2020, 146, 06020016. [Google Scholar] [CrossRef]
  29. Wang, H.; Liu, X.; Bai, R.; Liu, S. Bubble characteristics affecting air−water exchange in open–channel flow with a jet forming over a sudden bottom drop. Exp. Therm. Fluid Sci. 2021, 124, 110366. [Google Scholar] [CrossRef]
  30. Luo, J.; Xu, W.L.; Khoo, B. Stratification effect of air bubble on the shock wave from the collapse of cavitation bubble. J. Fluid Mech. 2021, 919, A16. [Google Scholar] [CrossRef]
  31. Wei, W.R.; Xu, W.L.; Deng, J.; Tian, Z.; Zhang, F.X. Experimental study of air−water interface properties in self−aerated flows. J. Hydrodyn. 2019, 31, 940–948. [Google Scholar] [CrossRef]
  32. Rasmussen, R.E.H. Some experiments on cavitation erosion in water mixed with air. In Proceedings of the International Symposium on Cavitation in Hydrodynamics; National Physical Laboratory: London, UK, 1956; pp. 1–25. [Google Scholar]
  33. Wang, X.; Hu, Y.A.; Zhang, J.M. Experimental study on anti−cavitation mechanism of valve lintel natural aeration of high head lock. J. Hydrodyn. 2019, 32, 337–344. [Google Scholar] [CrossRef]
  34. Chanson, H. Turbulent air–water flows in hydraulic structures: Dynamic similarity and scale effects. Environ. Fluid Mech. 2009, 9, 125–142. [Google Scholar] [CrossRef]
  35. Boes, R.M. Scale effects in modelling two−phase stepped spillway flow. In Hydraulics of Stepped Spillways; Minor, H.E., Hager, W.H., Eds.; Balkema: Rotterdam, The Netherlands, 2000; pp. 53–60. [Google Scholar]
  36. Pinto, N.L. Model evaluation of aerators in shooting flow. In Scale Effects in Modelling Hydraulic Structures; Kobus, H., Ed.; Technische Akademie: Esslingen, Germany, 1984; Volume 4, pp. 1–6. [Google Scholar]
  37. Ge, M.M.; Sun, C.Y.; Zhang, X.L.; Coutier-Delgosha, O.; Zhang, G. Synchrotron X-ray based particle image velocimetry to measure multiphase streamflow and densitometry. Radiat. Phys. Chem. 2022, 200, 110395. [Google Scholar] [CrossRef]
Figure 1. The experiment equipment: (a) the layout of aeration current meter; (b) the schematic diagram of chute aerator flow.
Water 17 02734 g001
Figure 3. The calculated value β for Equation (2) with the measured data [13].
Water 17 02734 g003
Figure 4. The relationship between air entrainment coefficient β and Φ [13,22,25,26].
Water 17 02734 g004
Figure 5. Air concentration distribution: (a) Air concentration under different atmospheric pressures; (b) x/L = 1.2; (c) x/L = 1.5; (d) x/L = 2.0 and x/L = 3.0.
Water 17 02734 g005
Figure 6. The variation in Ca along the flow direction under different atmospheric pressures.
Water 17 02734 g006
Figure 7. Ca at x/L = 3.0 under different atmospheric pressures.
Water 17 02734 g007
Figure 8. The variation in Cb streamwise under different atmospheric pressures; the axes are in logarithmic coordinates: y = log10().
Water 17 02734 g008
Figure 9. Semilogarithmic streamwise development Cb(fD) of test data and Equation (8) [13]; the axes are in logarithmic coordinates: y = log10().
Water 17 02734 g009
Figure 10. Relationship between We (hs)0.5 and β.
Water 17 02734 g010
Table 1. Elevations table of the dams.
NameElevation (m)Dam Height (m)Atmospheric Pressure (hPa)η (%)Country
Three Gorges Hydroelectric Power Station185.001759912.5China
Xiluodu Hydropower Plant380.00285.59685China
Diga del Vajont722.502629299.3Italy
Nuozhadu Hydropower Station812.00261.591910.4China
Tehri Dam815.00260.591910.4India
Baihetan Hydropower Station834.0028991710.7China
Nurek Dams855.0030491410.9Tajikistan
Xiaowan Hydropower Station1240.00294.587315.5China
Jinping-i Hydropower Station1880.0030580722.8China
The Grande Dixence Dam2364.0028575927.9The Swiss
Banduo Hydropower Station2760.0079.772231.8China
Lianghekou Hydropower Station2865.0029571332.9China
Jiacha Hydropower Station3249.0045.570134.2China
Note(s): η = (P1P2)/P1, P2 = local atmospheric pressure; P1 = 1013 hPa.
Table 2. Test program and parameters.
SeriesV [m/s]H [m]F0h [m]ReWe (h)Pa [hPa]
S13.721.003.760.13.7 × 105138.0260~960
S24.671.504.710.14.6 × 105172.9060~960
S35.051.805.100.15.0 × 105187.2160~960
S45.522.005.570.15.5 × 105204.4760~960
S56.182.406.240.16.1 × 105229.0660~960
S63.901.004.400.083.1 × 105129.2160~960
S74.571.505.160.083.6 × 105151.5360~960
S85.672.006.400.084.5 × 105187.9560~960
S95.882.406.640.084.7 × 105195.0060~960
Note(s): H = the upstream head; We(h) = V/(σw/ρwh)0.5, σw = the surface tension; ρw = water density.
Disclaimer/Publisher’s Note: The statements, opinions and data contained in all publications are solely those of the individual author(s) and contributor(s) and not of MDPI and/or the editor(s). MDPI and/or the editor(s) disclaim responsibility for any injury to people or property resulting from any ideas, methods, instructions or products referred to in the content.