Article

Deformation and Stress of a Runner in Large Francis Turbines Under Wide-Load Operating Conditions

1
Key Laboratory of Fluid and Power Machinery, Ministry of Education, Xihua University, Chengdu 610039, China
2
School of Civil and Hydraulic Engineering, Huazhong University of Science and Technology, Wuhan 430074, China
3
China Gezhouba Group Mechanical & Electrical Construction Co., Ltd., Chengdu 610091, China
4
College of Water Resources and Civil Engineering, China Agricultural University, Beijing 100083, China
*
Author to whom correspondence should be addressed.
Water 2025, 17(16), 2374; https://doi.org/10.3390/w17162374
Submission received: 8 July 2025 / Revised: 25 July 2025 / Accepted: 7 August 2025 / Published: 11 August 2025
(This article belongs to the Special Issue Advanced Numerical Approaches for Multiphase and Cavitating Flows)

Abstract

During partial-load operation, hydroelectric units are frequently subjected to hydraulic vibrations caused by pressure fluctuations within the turbine. These vibrations can result in deformation of the runner blades and, in severe instances, lead to crack formation. Over the years, research efforts have primarily focused on specific operating conditions, with relatively insufficient attention paid to the study of operational stability under broad-load operation. This study investigates the recurrent occurrence of crack damage in the runner blades of a Francis turbine installed at a major hydropower station. The issue emerges in response to the operational requirements of a modern power system, which mandates wide-load operation across varying heads (154.6 m, 197 m, 229.4 m) and guide vane openings (10%, 25%, 50%, 70%, 100%). To inform the development of optimized operational control strategies, this work examines the deformation and von Mises stress distribution patterns on the runner blades under these wide-load conditions. The findings reveal that the maximum blade deformation predominantly occurs in the mid-section of the trailing edge under most operating scenarios, while the peak von Mises stress consistently appears near the band at the trailing edge. Both peak deformation (1.99 mm) and peak von Mises stress (170.92 MPa) were observed at the maximum head (229.4 m) under 100% guide vane opening. Notably, significant deformation and stress levels were also encountered at openings below 25% under low-head conditions. On the basis of the research results, suggestions for ensuring the safe and stable operation of power station units under wide-load conditions were proposed.

1. Introduction

New power systems often require hydropower units to operate under wide loads. When hydropower units operate under eccentric load conditions, their turbines often experience hydraulic vibration due to pressure pulsation and other reasons, which can even cause deformation of the turbine runner blades. In severe cases, cracks and other damage may occur. In recent years, research on the stability of the wide-load operation of related hydroelectric units has attracted considerable attention from industry. Many scholars have revealed the flow characteristics of hydroelectric turbines under eccentric conditions through numerical simulations and experimental studies, thereby further analyzing the stability of the units. In terms of the evolution of the internal flow structure of the turbine, the generation of vortices, and the correlation mechanism of pressure pulsation, Iliescu et al. [1] researched the flow characteristics of the turbine under non-design conditions through advanced flow field measurement technology. They used three-dimensional particle image velocimetry (3D-PIV) to measure the cavitation flow precisely under partial flow conditions of a turbine. The intricate relationship between the vortex system structure in the runner region and cavitation development has been identified. Wang et al. [2] employed numerical simulation to explore the pressure pulsation patterns in a large mixed-flow turbine runner, uncovering a nonlinear interaction between the internal flow dynamics and pressure pulsations under high-head conditions. Their findings offer a theoretical basis for minimizing hydraulic vibrations and improving runner structural design. Likewise, Chen et al. [3] investigated how variations in blade load distribution affect both model performance and internal flow behavior in an axial-flow turbine. Their research demonstrated a nonlinear link between the blade load gradient and changes in vortex formation and pressure pulsation intensity, providing essential theoretical guidance for enhancing hydraulic design and managing flow instability under high-load operations. Liu Xiaowei et al. [4] revealed the distribution law and causes of pressure pulsation within a flow channel through full-flow channel numerical simulation. Tian Chang’ an et al. [5] conducted a numerical simulation of the internal flow of a turbine runner using the k-ɛ turbulence model and analyzed the flow field and pressure distribution of the turbine. Through a numerical simulation system, Song Han et al. [6] revealed the evolution laws of internal flow instability and pressure pulsation in medium-head mixed-flow turbines and reported that the opening degree of guide vanes has a significant regulatory effect on the vortex band of the tail water pipe and the amplitude of low-frequency pressure pulsation. Through numerical simulation, Tang Wen et al. [7] systematically revealed the dynamic influence law of guide vane opening on the internal flow state of a runner in a mixed-flow turbine and confirmed the significant correlation between vortex separation on the suction surface of the blade and the amplitude of pressure pulsation under low-opening conditions. Xu et al. [8] employed the entropy generation method to examine the link between vortex structure evolution and energy dissipation across all operating conditions, highlighting a clear association between vortex behavior and energy loss. Xu T et al. [9] performed Large-Eddy Simulation (LES) on the full-flow passage of a Francis turbine, conducting three-dimensional unsteady turbulent numerical simulations across multiple operating conditions. They systematically analyzed the flow field characteristics and hydraulic performance of each component under varying guide vane openings. Pang et al. [10] carried out an in-depth study on how different guide vane openings impact vortex dynamics and pressure pulsation patterns within the Francis turbine runner. Their research identified a consistent relationship between the adjustment of guide vane angles and changes in vortex development and pressure pulsation intensity, offering key insights for improving the turbine’s operational stability. Ji R et al. [11] developed and validated a Lagrangian framework-based Actuator Line–Dynamic Large-Eddy Simulation (AL-DLES) coupling method, employing the next-generation vortex identification technique (Omega(new)). This approach effectively addresses the limitations of conventional numerical simulations, including challenging turbine meshing, excessive wake dissipation, and insufficient flow field fidelity. Wang et al. [12] systematically quantified the low-frequency pressure oscillation characteristics caused by interference between the vortex band of the tail water pipe and the runner blade under low-load conditions through full-flow channel transient simulation and modal analysis. Xu L et al. [13] investigated the operational characteristics of a pump–turbine within the hump region through combined physical model testing and computational fluid dynamics (CFD) simulations. Their analysis revealed that energy losses predominantly occur within the guide vane (GV) passages and draft tube (DT), exhibiting pronounced intensification with decreasing flow rate. The underlying vortex dynamics governing these losses demonstrate distinct spatial distributions: shear vorticity dominates within the vaneless space, whereas rigid vorticity prevails in the GV passages and DT. Furthermore, the study identified the pseudo-Lamb vector term as the governing factor influencing vortex evolution. Subsequently, Xu et al. [14] employed combined experimental modeling (incorporating PIV) and CFD simulations (utilizing the Rortex method and RANS equations) to demonstrate that within the S-characteristic region of pump–turbines, energy losses predominantly concentrate in the guide vane passages and vaneless space. Critically, rigidly rotating vortices within the guide vane passages trigger high-amplitude pressure pulsations. Furthermore, vortex evolution in this regime is primarily governed by shear effects and the pseudo-Lamb term, both induced by velocity gradients.
In terms of the stress–strain distribution, deformation characteristics, and fatigue damage mechanisms of the runner, Feng Jinhai et al. [15] demonstrated through a combination of experimental and simulation methods that the low-frequency vortex band generated under eccentric loading conditions induces periodic alternating stress. They proposed the implementation of an asymmetric guide vane arrangement to mitigate the intensity of the vortex band. Liao Weili et al. [16] highlighted the pronounced impact of runner blade deformation on the local pressure field under partial-load conditions and emphasized the importance of incorporating mechanical–hydraulic coupling analysis in design optimization. Xu Bin et al. [17] conducted a systematic investigation of the dynamic response characteristics of a runner subjected to complex loading using a fluid–structure coupling approach. Xiao Ruofu et al. [18] quantified the static stress concentration phenomenon in the middle of the water outlet edge of a runner blade for the first time on the basis of the unidirectional fluid–structure coupling method and noted that this area is the potential germination zone of fatigue cracks. Wang WQ et al. [19] explored the fluid–structure interaction characteristics of mixed-flow turbines using a tightly coupled numerical approach. Their research identified asymmetric stress distributions and localized stress concentrations in the runner under dynamic loading conditions, offering essential theoretical insights for precision structural optimization. In a related study, Wang Zhengwei et al. [20] developed a method to classify turbine operating zones based on analyses of unsteady flow patterns and structural responses. This approach revealed the interplay between internal flow features and dynamic loads under varying conditions, contributing valuable theoretical support for turbine performance evaluation and fatigue damage analysis. Thibault D et al. [21] proposed a reliability modeling method based on a physical mechanism to analyze the sensitivity of material properties to fatigue reliability to solve the problems of the low failure probability of hydraulic turbine runners and the difficulty in evaluating reliability via traditional statistical methods. Presas A et al. [22] systematically analyzed the stress characteristics under different working conditions and their influence on fatigue damage on the basis of the measured data of runner strain. Julian U et al. [23] analyzed field data from multiple hydropower stations to quantify how specific speed influences fatigue damage in turbine runners, uncovering a clear correlation between key design parameters and the operational lifespan of the runner. Through prototype testing and fluid–structure interaction analysis, Zhu D et al. [24] identified significant stress concentration at the junction of the runner blade trailing edge and lower band in Francis turbines under partial-gate-opening conditions and low-head/high-load operations. The crack issue was successfully resolved by implementing welded triangular filler blocks to eliminate static stress concentration, combined with precision surface finishing to mitigate residual stresses—notably without compromising turbine efficiency. Shi Guangtai et al. [25] examined the effect of guide vane openings on runner stress and strain in a Francis turbine, revealing notable variations in force distribution depending on the vane position. Their study also indicated that excessively large openings can lead to localized stress concentrations. Liu Demin et al. [26] conducted synchronized measurements of dynamic stress and pressure pulsation in large-scale mixed-flow turbine models under high-head conditions, demonstrating a strong relationship between runner blade stress and vortex-induced pulsations in the draft tube. Alexandre P [27] proposed an innovative neural network-based methodology to predict stress distribution on turbine blades using stationary sensor measurements. This approach serves as a cost-effective alternative to complex strain gauge testing, enabling continuous fatigue risk monitoring. Zhao Yaping et al. [28] revealed the influence mechanism of hydrostatic pressure caused by the free liquid surface and water body gravity on the periodic stress fluctuations of tubular turbine blades through fluid–structure coupling numerical simulation and quantified the stress–strain distribution law of the blades. Hua, HC et al. [29] employed a coupled FAST-to-AQWA simulation framework to analyze the response of a semi-submersible offshore wind turbine platform integrated with a Wave Energy Converter (WEC) under single-mooring-line failure scenarios during both rated and extreme environmental conditions. Their analysis revealed that failure of the upwind mooring line presents the most critical hazard, inducing significant platform surge displacements (up to 3.3 times the rotor diameter) and causing the turbine power output to plummet by 80%. Furthermore, intact mooring lines exhibit heightened susceptibility to fatigue under extreme conditions.
In the context of structural enhancement, operational strategy refinement, and fracture behavior control, Vantadori et al. [30] developed a simplified analytical model based on the semi-elliptical crack assumption to examine fracture behavior at the welded joints of mixed-flow turbine blades. They calculated the stress intensity factor along the crack front using an improved numerical approach and validated the model’s accuracy by comparing the results with the existing literature. Georgievskaia et al. [31], to address the problem of crack prediction in critical turbine components, established an analytical framework grounded in fracture mechanics. By quantifying the relationship between crack growth driving force and the material’s fracture toughness threshold under off-design conditions, their approach addresses the limitations of conventional diagnostic methods in detecting early-stage fatigue cracks. Seydoux M et al. [32] integrated strain gauges and telemetry systems on the runner blades of a model turbine and used Voronoi element subdivision technology to splice steady-state data to construct a dynamic stress prediction model during the start-up process. This approach quantified the fatigue life loss of the runner and provided a technical basis for the optimization of the start-up stress, thereby extending the operating life of the unit.
Against the background of the new power system, large hydropower station units often operate under wide-load conditions, and cracks have occurred in the turbine runner blades many times. Over the years, research efforts have primarily focused on specific operating conditions, with relatively insufficient attention paid to the study of operational stability under broad-load operation. This study addresses the recurrent crack damage observed in the runner blades of a Francis turbine at a large hydropower station. Through numerical simulations, we systematically analyzed deformation patterns and von Mises equivalent stress distributions across broad-load operating conditions under varying heads and guide vane openings. Crucially, this work establishes the first quantitative evaluation of maximum blade deformation and equivalent stress for each operational point during broad-load operation. These findings directly enable the power station to proactively avoid damage-prone operating regimes, thereby facilitating the development of optimized operational control strategies. This research resolves the critical challenge of ensuring safe broad-load operation in actual units and provides fundamental technical support for sustained stable operation of the station’s turbine generator sets.

2. Materials and Methods

2.1. Three-Dimensional Geometric Model

The mixed-flow turbine model of the hydropower station is HLD522-LJ-740. The basic design parameters of the turbine are shown in Table 1.
The three-dimensional geometric model was constructed on the basis of the design data of the flow-through components of the power station’s mixed-flow turbine via UG 3D modeling software NX 12.0.2.9. The three-dimensional water body model of the entire flow channel of the turbine and the runner structure model is shown in Figure 1.

2.2. Mathematical Model

(1)
Turbulence model
In the internal flow calculation of the mixed-flow turbine in this study, the relationship between the flow field around the runner blades and the runner structure is studied. The SST k-ω turbulence model, which is suitable for the stability and high accuracy of the internal turbulence field of the turbine, is selected. Its expression is as follows:
k t + ( k u ˙ i ) x i = x j Γ k k x j + G k Y k + S k
ω t + ( ω u ˙ i ) x i = x j Γ ω ω x j + G ω Y ω + D ω + S ω
where k is the kinetic energy of turbulence; ω is the frequency of turbulent eddy currents; t is time; u ˙ is the fluid velocity; x is the coordinate; Gk and Gω are the generating terms of k and ω, respectively; Yk and Yω are the effective diffusion terms of k and ω, respectively; Dω is an orthogonal divergence term; Sk and Sω are user-defined source terms; and Γk = µ + μtk, Γω = µ + μt, where µ is the hydrodynamic viscosity coefficient, where μt is the turbulent vortex dynamic viscosity coefficient; σk and σω are the turbulent Prant numbers of k and ω, respectively; and the subscripts i and j are tensor coordinates.
(2)
Fluid–structure coupling model
The coupling control equation between the fluid domain and the solid domain is as follows:
[ M ]      [ 0 ] [ M f s ]   [ M p ] u ¨ P ¨ + [ C ]   [ 0 ] [ 0 ]   [ C p ] u ˙ P ˙ + [ K ]   [ K f s ] [ 0 ]   [ K p ] u P = F Q 0
where [M] is the overall mass matrix of the structure and [Mfs] is the equivalent coupled mass matrix, where [Mfs] = ρ[R]T, ρ is the density of the fluid, [ R ] = S [ N ] [ N ] T n d S , [N] is the structural element shape function matrix, and S is the coupling interface between the fluid and solid structures; [Mp] is the mass matrix of the fluid; [C] is the damping matrix of the structure; [Cp] is the damping matrix of the fluid; u is the displacement component of the fluid particle along the x, y and z directions; P is the hydrodynamic pressure; [K] is the total stiffness matrix of the structure; [Kfs] is the equivalent coupling stiffness matrix, where [Kfs] = [R]; [Kp] is the stiffness matrix of the fluid; {F} is the vector of the external load acting on the node; and {Q0} represents the external force acting on the fluid.

2.3. Grid Division

On the basis of the structure of the turbine’s flow passage and the mathematical model adopted, this study uses a structured grid system to implement regional grid optimization and local encryption for key flow components such as the volute, fixed guide vanes, movable guide vanes, runner, and tail water pipe, as shown in Figure 2.
The dimensionless wall distance y+ is defined as follows:
y + = y u T ν
where y+ is the distance to the nearest wall, u T = τ ω ρ is the friction velocity, τ ω is the wall shear stress, and ν is the kinematic viscosity. It characterizes the resolution of boundary layer mesh and determines the applicability of wall functions in turbulence modeling. The present work focuses on the runner as the primary research subject, and the y+ value of the model’s grid of the runner is shown in Figure 3.
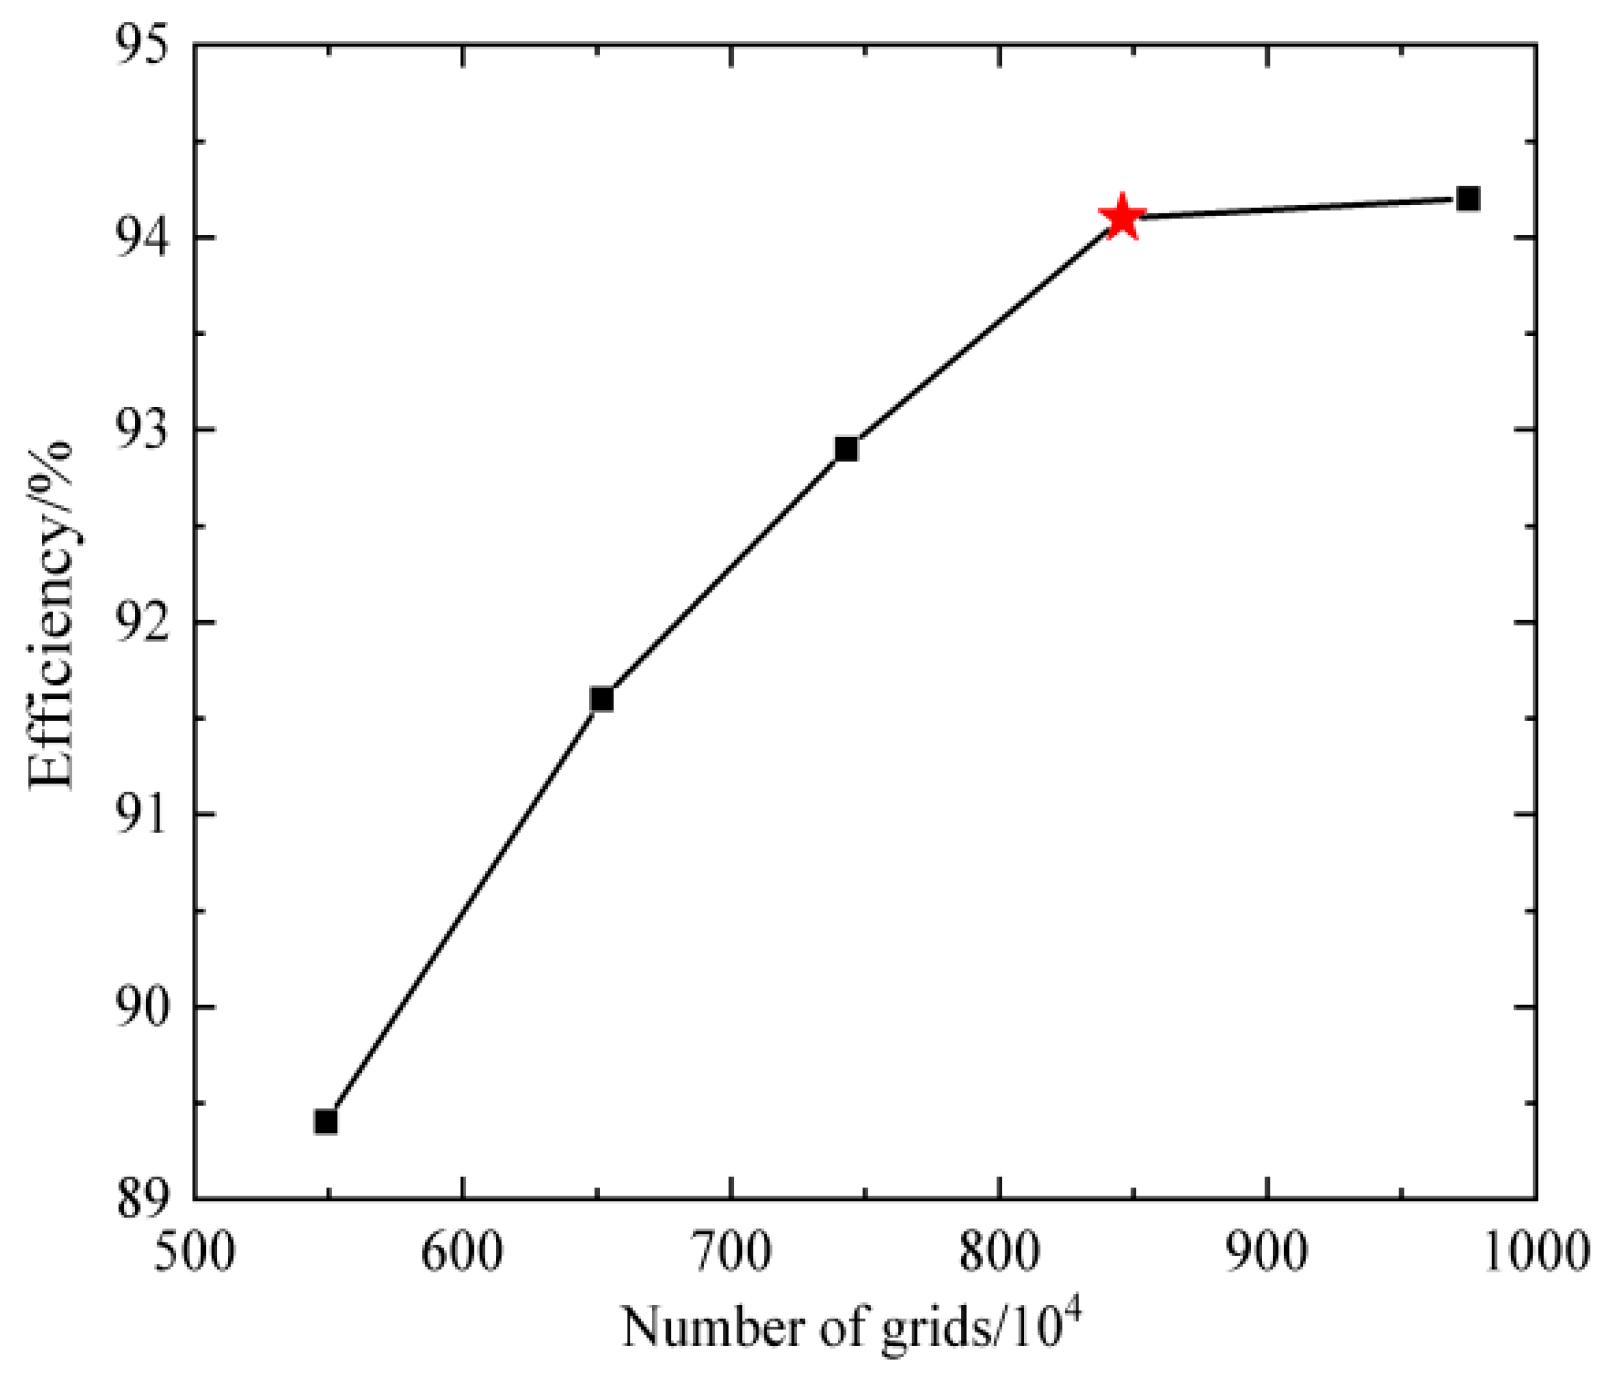
Grid independence verification utilizes five groups of grid models, each with a different number of grids, for numerical calculations. The unit efficiency under rated working conditions is adopted as the evaluation and verification criterion. When the grid number increased to 8.46 million, the relative errors of efficiency were all controlled within 0.05%, thus meeting the accuracy requirements for engineering calculations. The verification results of grid independence are illustrated in Figure 3. Grid independence verification utilizes five groups of grid models, each with a different number of grids, for numerical calculations. The unit efficiency under rated working conditions is adopted as the evaluation and verification criterion. When the grid number increased to 8.46 million, the relative errors of efficiency were all controlled within 0.05%, thus meeting the accuracy requirements for engineering calculations. The verification results of grid independence are illustrated in Figure 4.

2.4. Boundary Condition Setting

The CFD simulation was performed using ANSYS CFX 2022 R1. The volute inlet was selected as the inlet boundary of the full-flow passage domain, configured as a pressure inlet. The draft tube outlet served as the outlet boundary, set to a relative static pressure of 0 Pa. All solid walls employed the no-slip wall boundary condition, with near-wall treatment handled by the standard wall function. For interface connections between components, the General Grid Interface (GGI) method was applied. Regarding interface type specification, none was selected for stationary–stationary interfaces, while the frozen rotor model was applied to the rotor–stator (rotating–stationary) interfaces.
According to the operation log of the power station unit, the unit usually operates within a wide-load range. In this study, operating conditions corresponding to guide vane openings of 10%, 25%, 50%, 70%, and 100% were selected for numerical simulation under minimum (154.6 m), rated (197 m), and maximum (229.4 m) water head conditions. These selected conditions are detailed in Table 2. The turbine runner is made of ZG06Cr13Ni4Mo, possessing a density of 7.9 g/cm3, a Young’s modulus of 200 GPa, a thermal conductivity of 34.3 W/(m·K), a specific heat capacity of 442 J/(kg·K), a tensile strength of no less than 790 MPa, a yield strength of no less than 650 MPa, and a Poisson’s ratio of 0.30.

2.5. Verification of Numerical Computation Accuracy

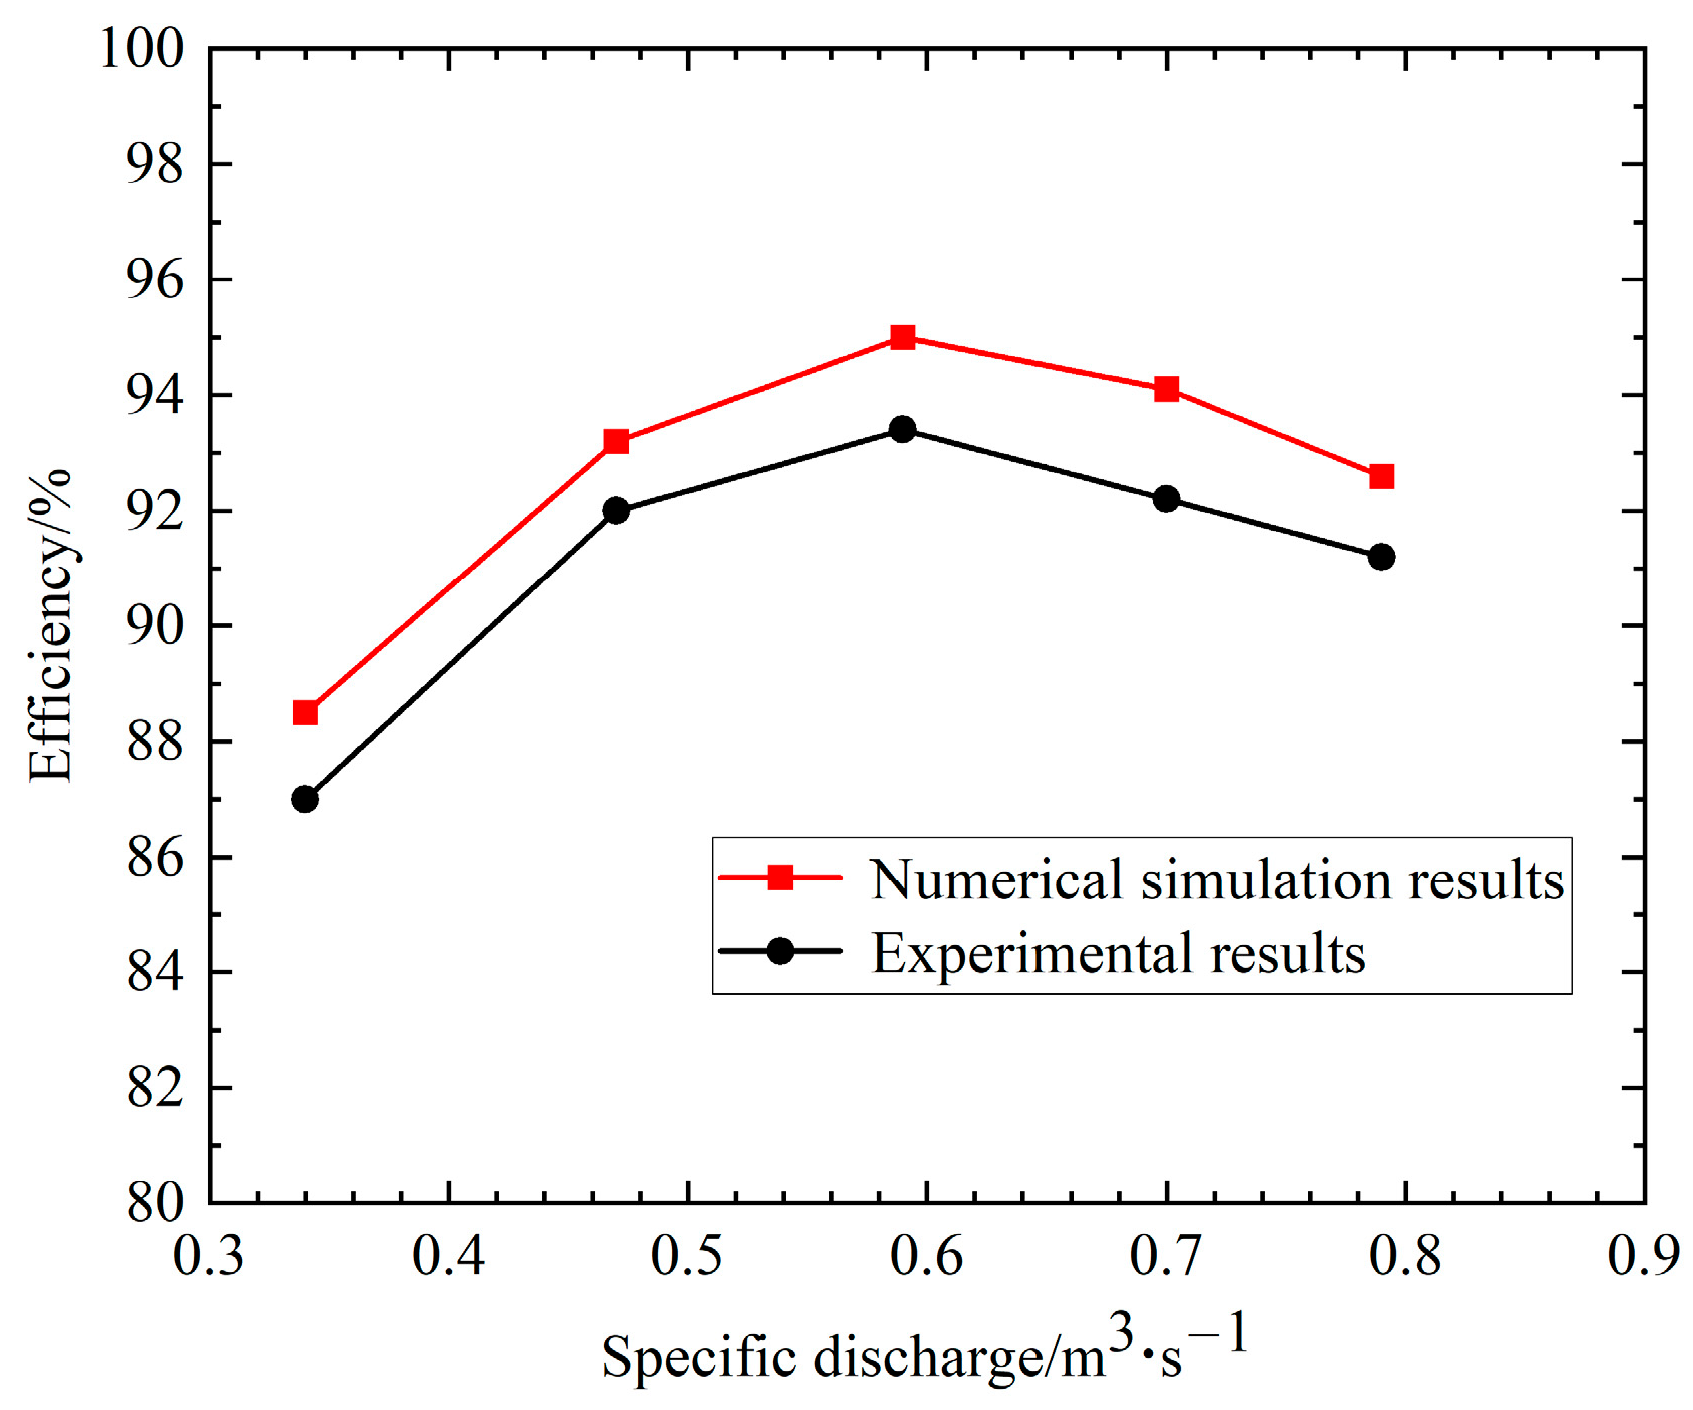
To ensure a requisite level of accuracy in the numerical computations, model tests were conducted and compared against computational results for the prototype turbine. The geometric scale ratio of the model turbine to the prototype was 1:21.14. Both testing and simulations were performed at a unit speed (n11) of 53.8 r/min across five operating points with unit flows (Q11) of 0.34 m3/s, 0.47 m3/s, 0.59 m3/s, 0.70 m3/s, and 0.79 m3/s. These flow conditions corresponded to guide vane opening angles of 12° (35%), 16° (47%), 20° (59%), 24° (70%), and 28° (82%), respectively. As evidenced in Figure 5, the computational results show good agreement with the experimental data, with the maximum deviation of 1.9% observed at the 24° guide vane opening angle.

3. Results and Analysis

3.1. Deformation Law of the Runner

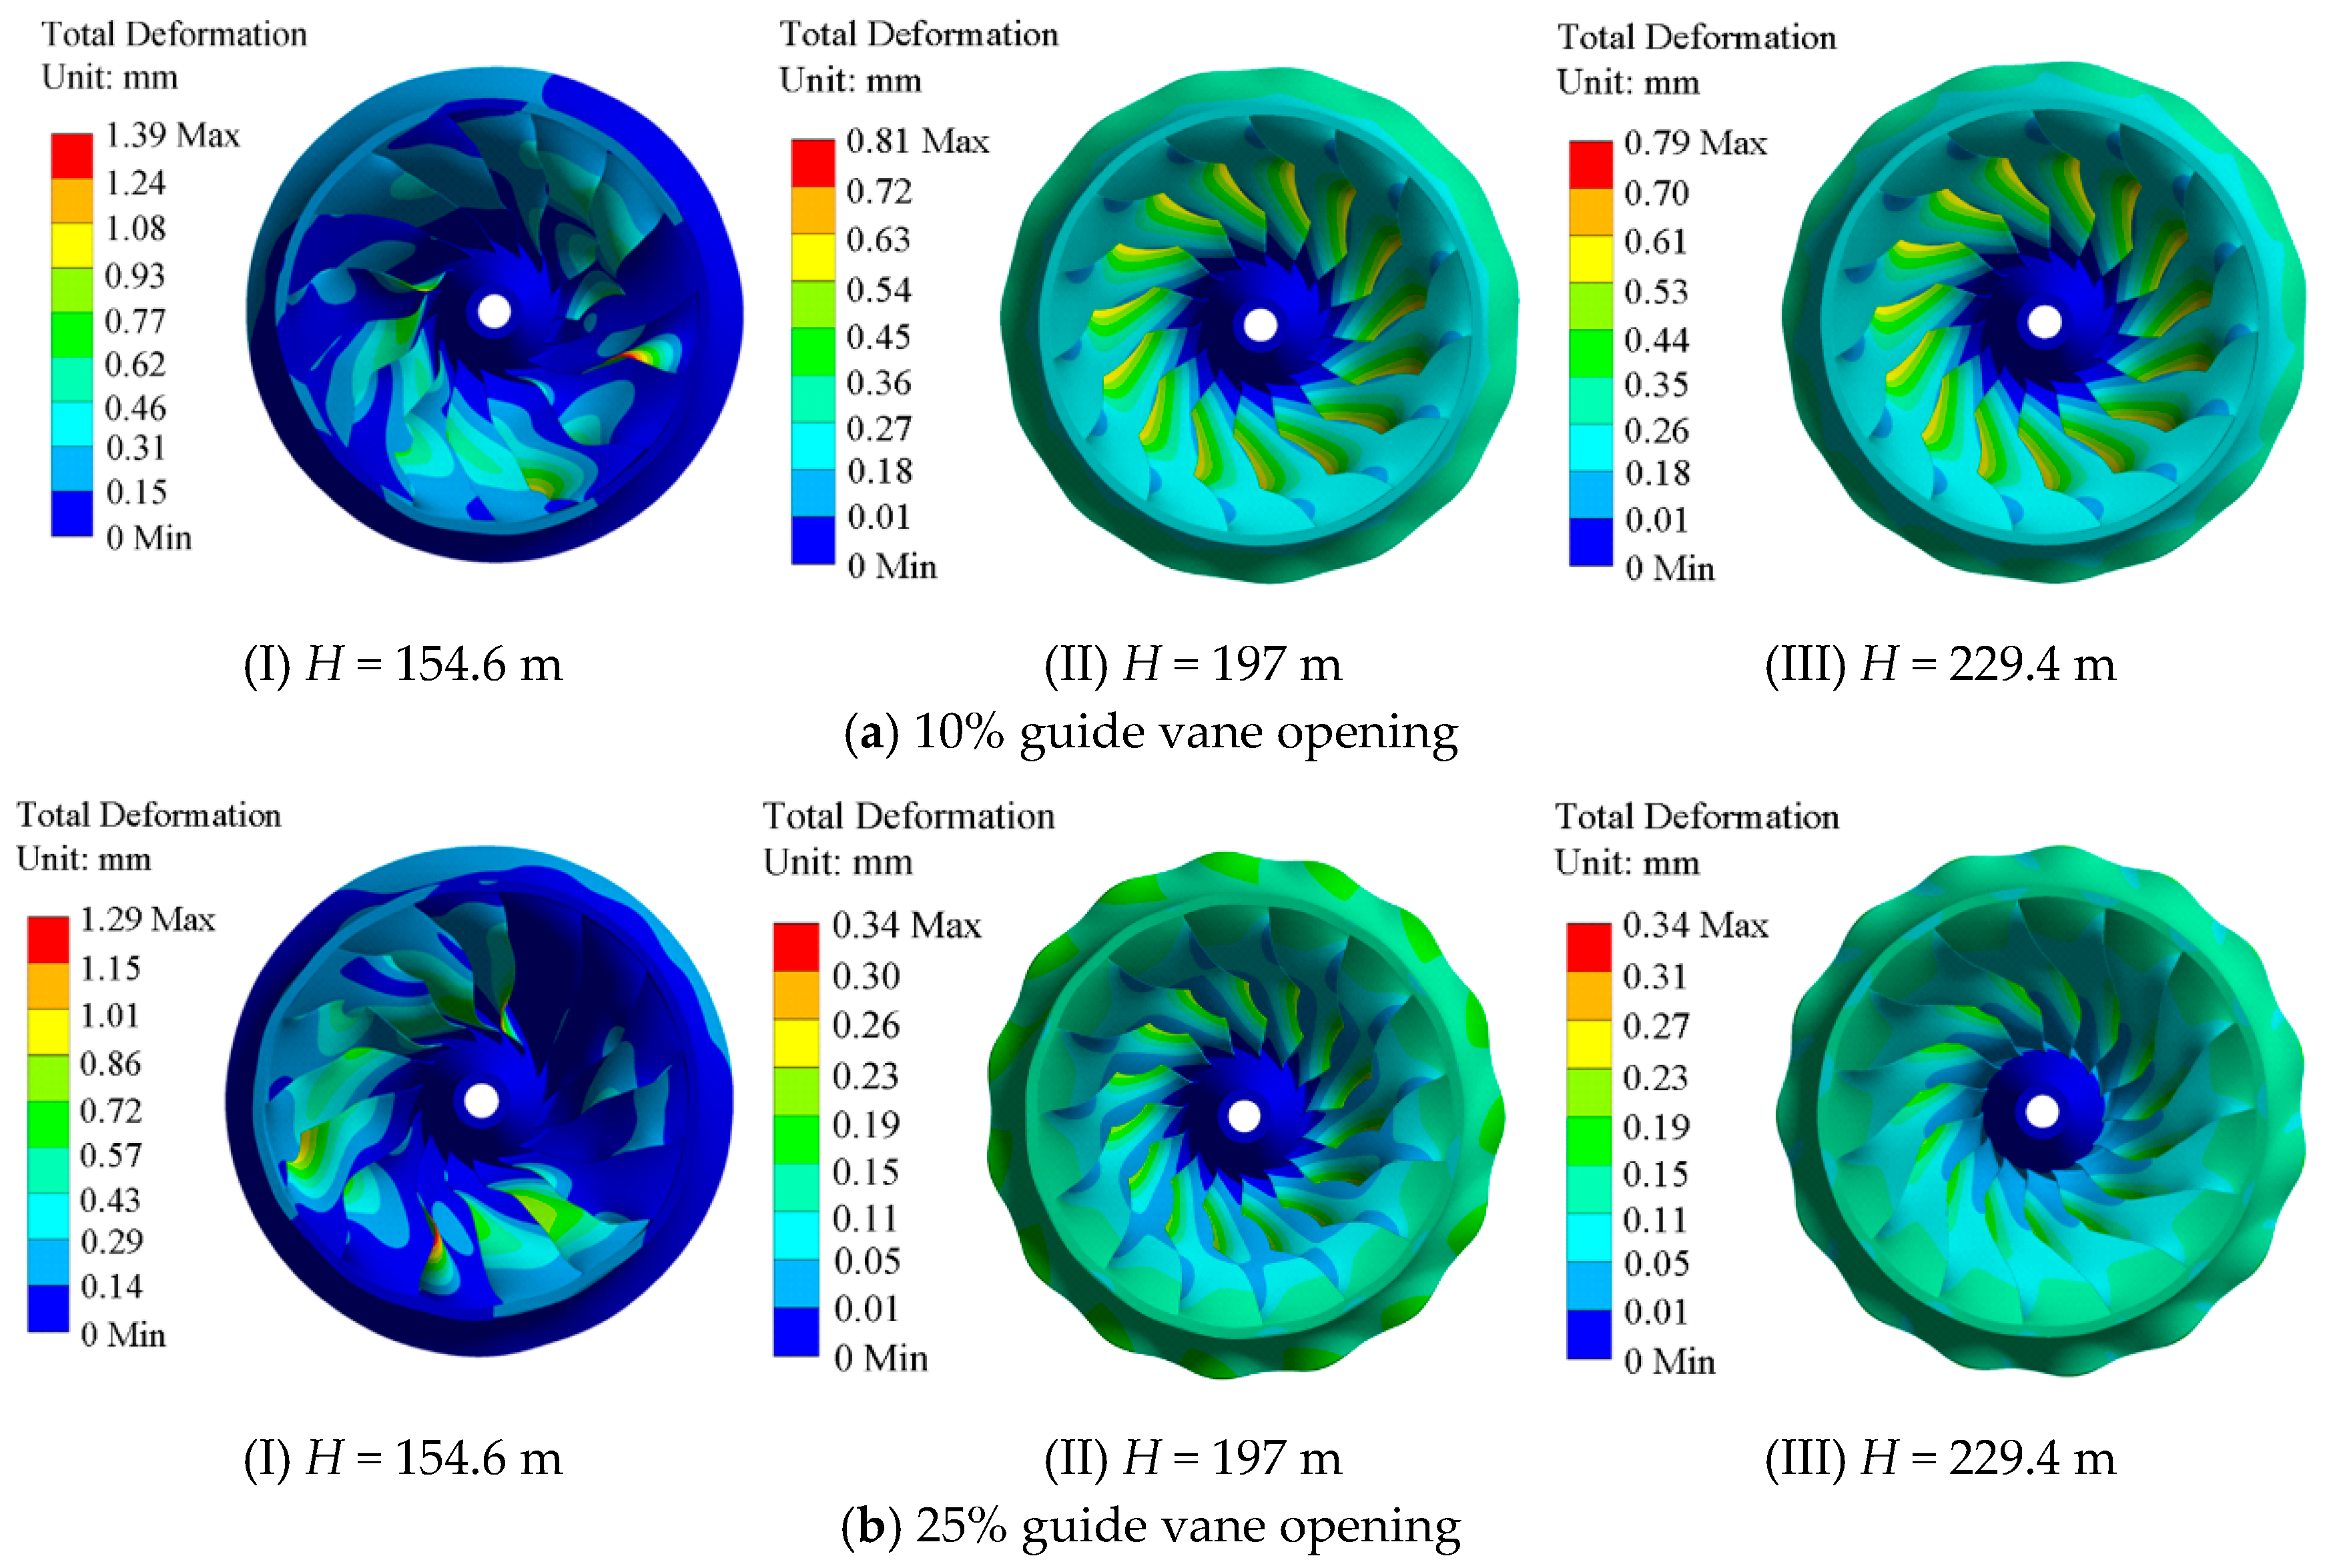
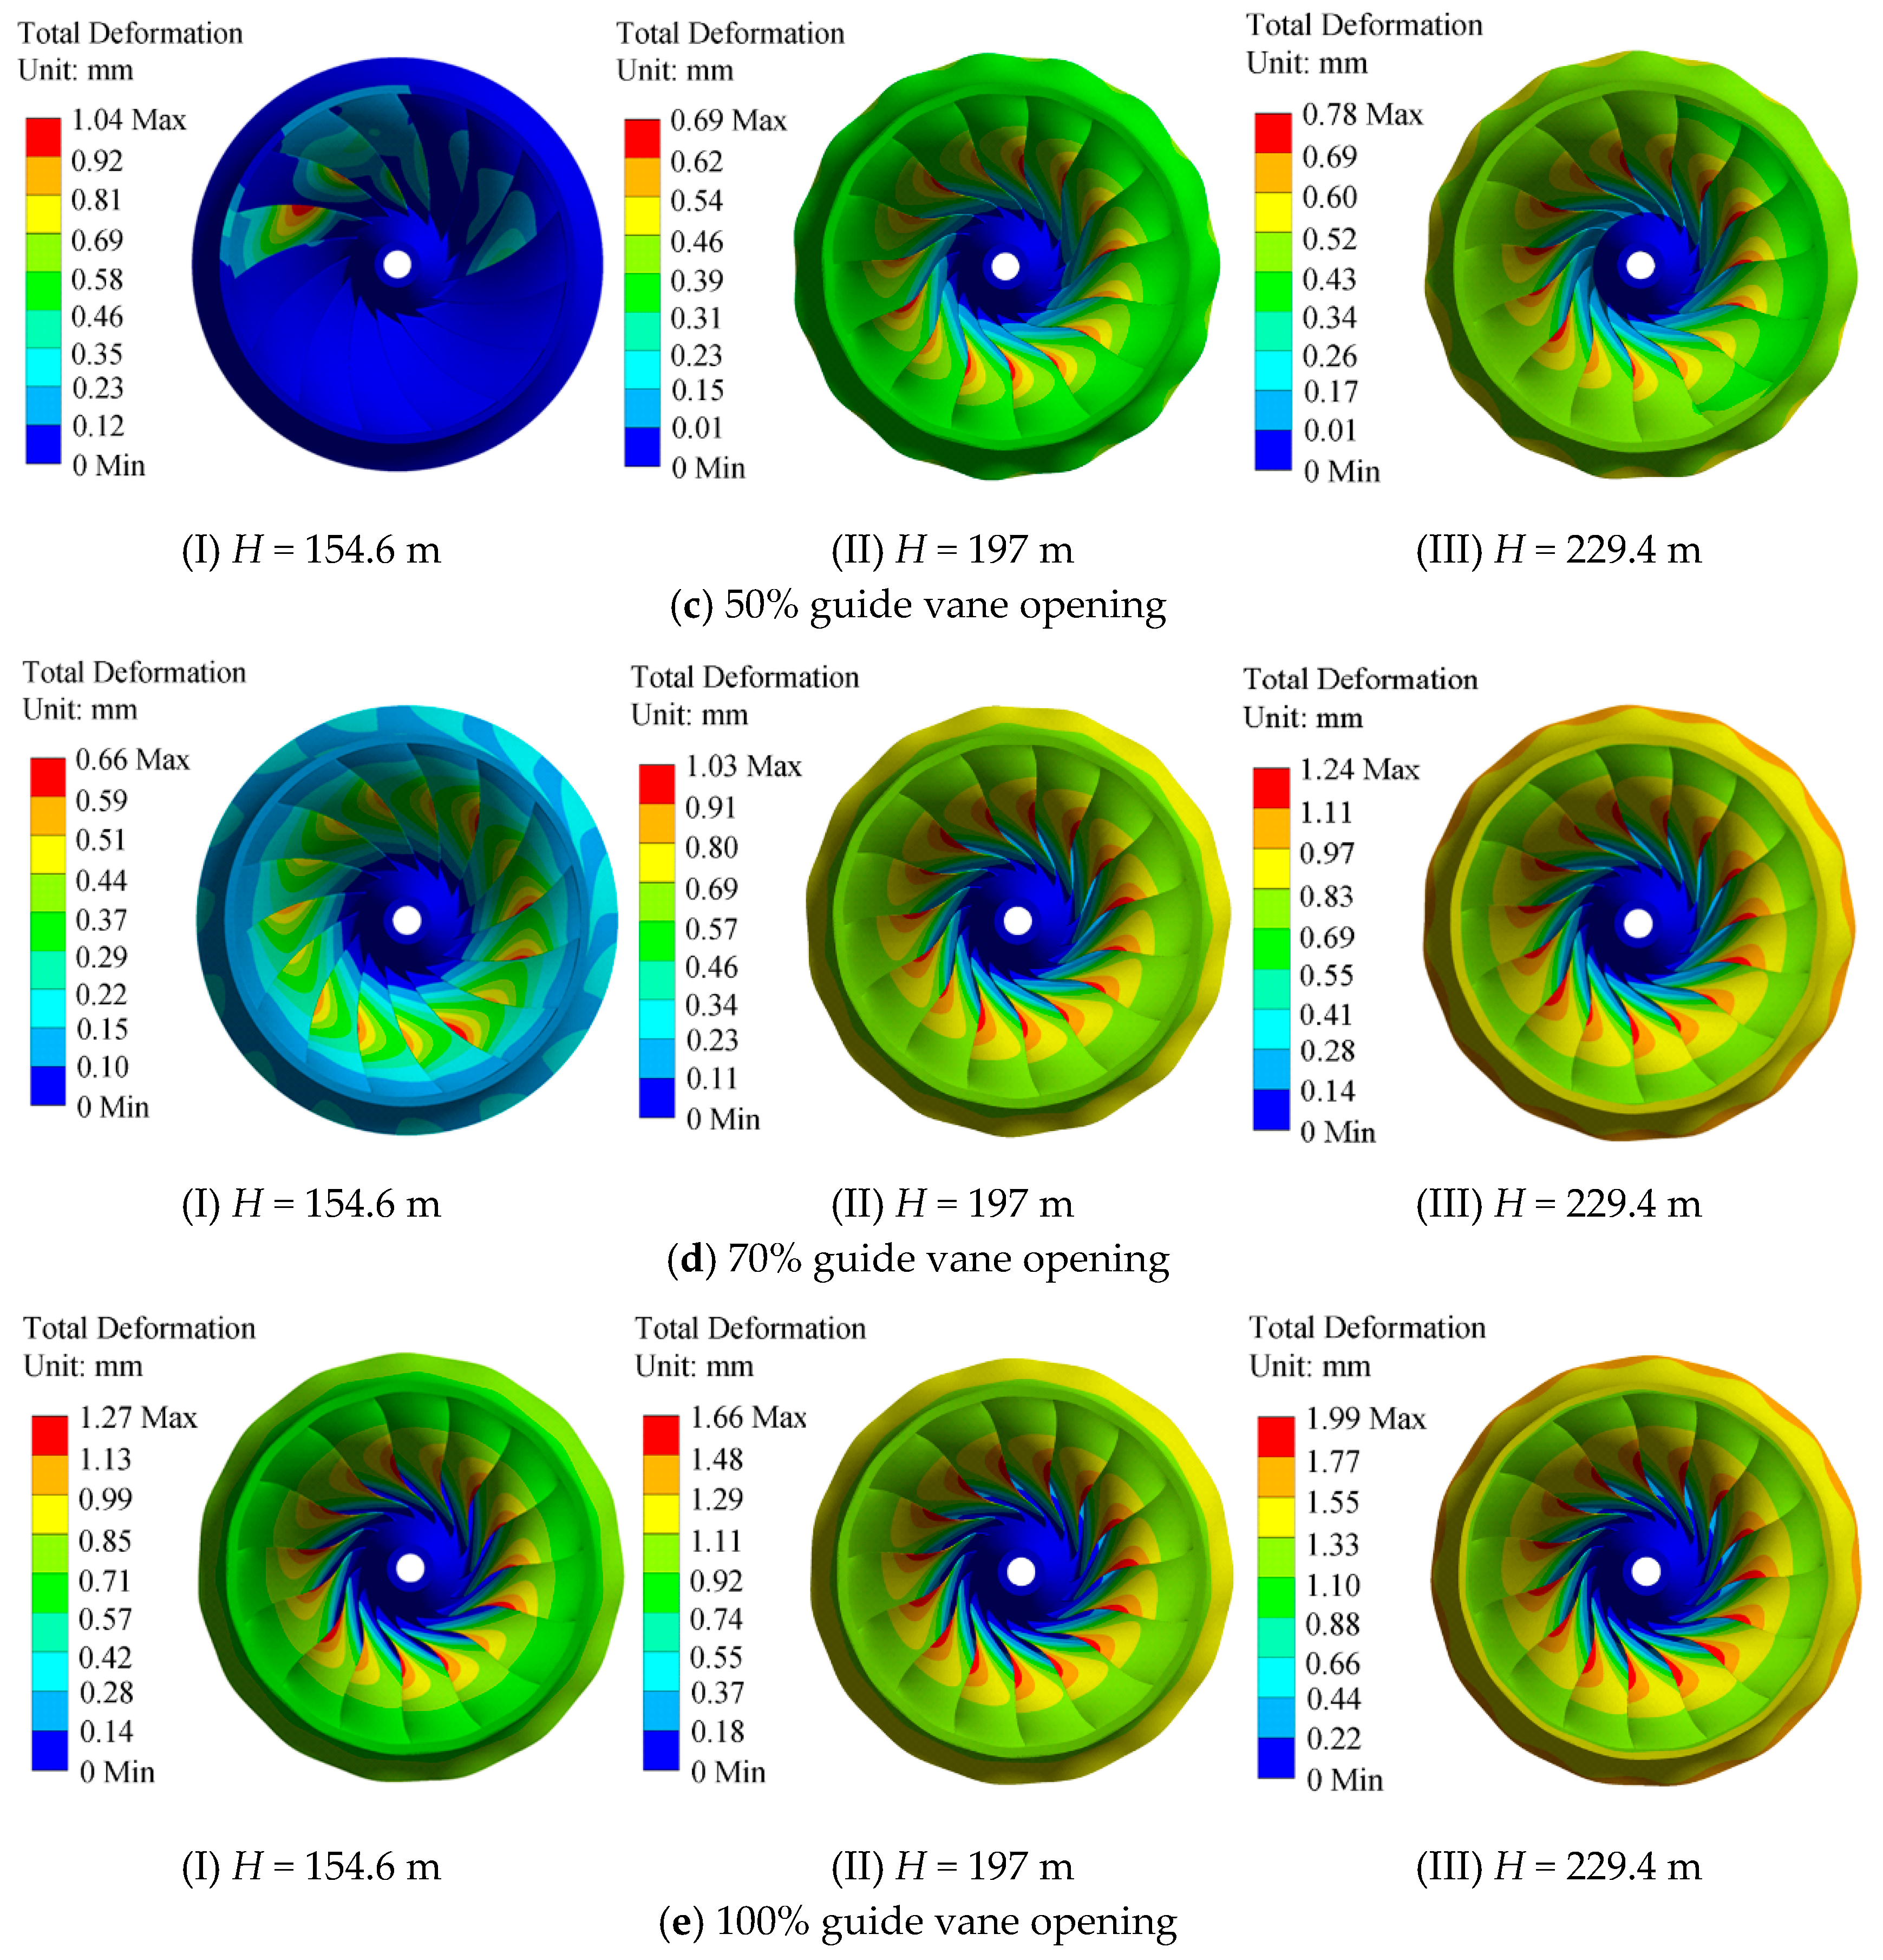
The deformation distribution of the runner under different working conditions is shown in Figure 6. The middle part of the outlet edge of the runner blade at the minimum water head is the maximum deformation area. When the opening percentage is 10–50%, there are significant differences in the deformation distributions among the runner blades. The deformation amounts of different blades of the same runner vary greatly. This is due to the small flow rate and the mismatch between the jet angle at the outlet of the guide vane and the geometric angle at the inlet of the runner, resulting in asymmetry of the attack angle of the water flow at the inlet of each blade. Under these operating conditions, alternating low-speed vortices and high-speed jet zones are observed within the runner channel, resulting in an uneven flow field distribution and noticeable pressure disparities among adjacent blades. This non-uniform pressure distribution is transmitted to the structure through fluid–structure interaction, leading to discrete deformation patterns across the blades. When the guide vane opening ranges from 70% to 100%, the flow field becomes more uniform, and the variation in blade deformation progressively decreases. This behavior suggests that flow field asymmetry under low-opening and low-water-head conditions is the primary factor contributing to blade deformation discrepancies. As the opening increases to 70% or above, the water flow at the guide vane outlet increasingly aligns with the runner’s designed streamline, reducing pressure distribution differences among the blades and enhancing deformation consistency. Under the rated water head and the maximum water head, the deformation law of the runner shows rather complex spatial distribution characteristics. When the opening ratio is 10–25%, the maximum deformation position starts from the middle of the water outlet edge and extends along the direction of the blade’s water outlet edge toward the drainage cone, forming a large banded deformation zone. When the opening ratio is 50–100%, the large deformation zone is concentrated mainly in the middle of the water outlet edge.
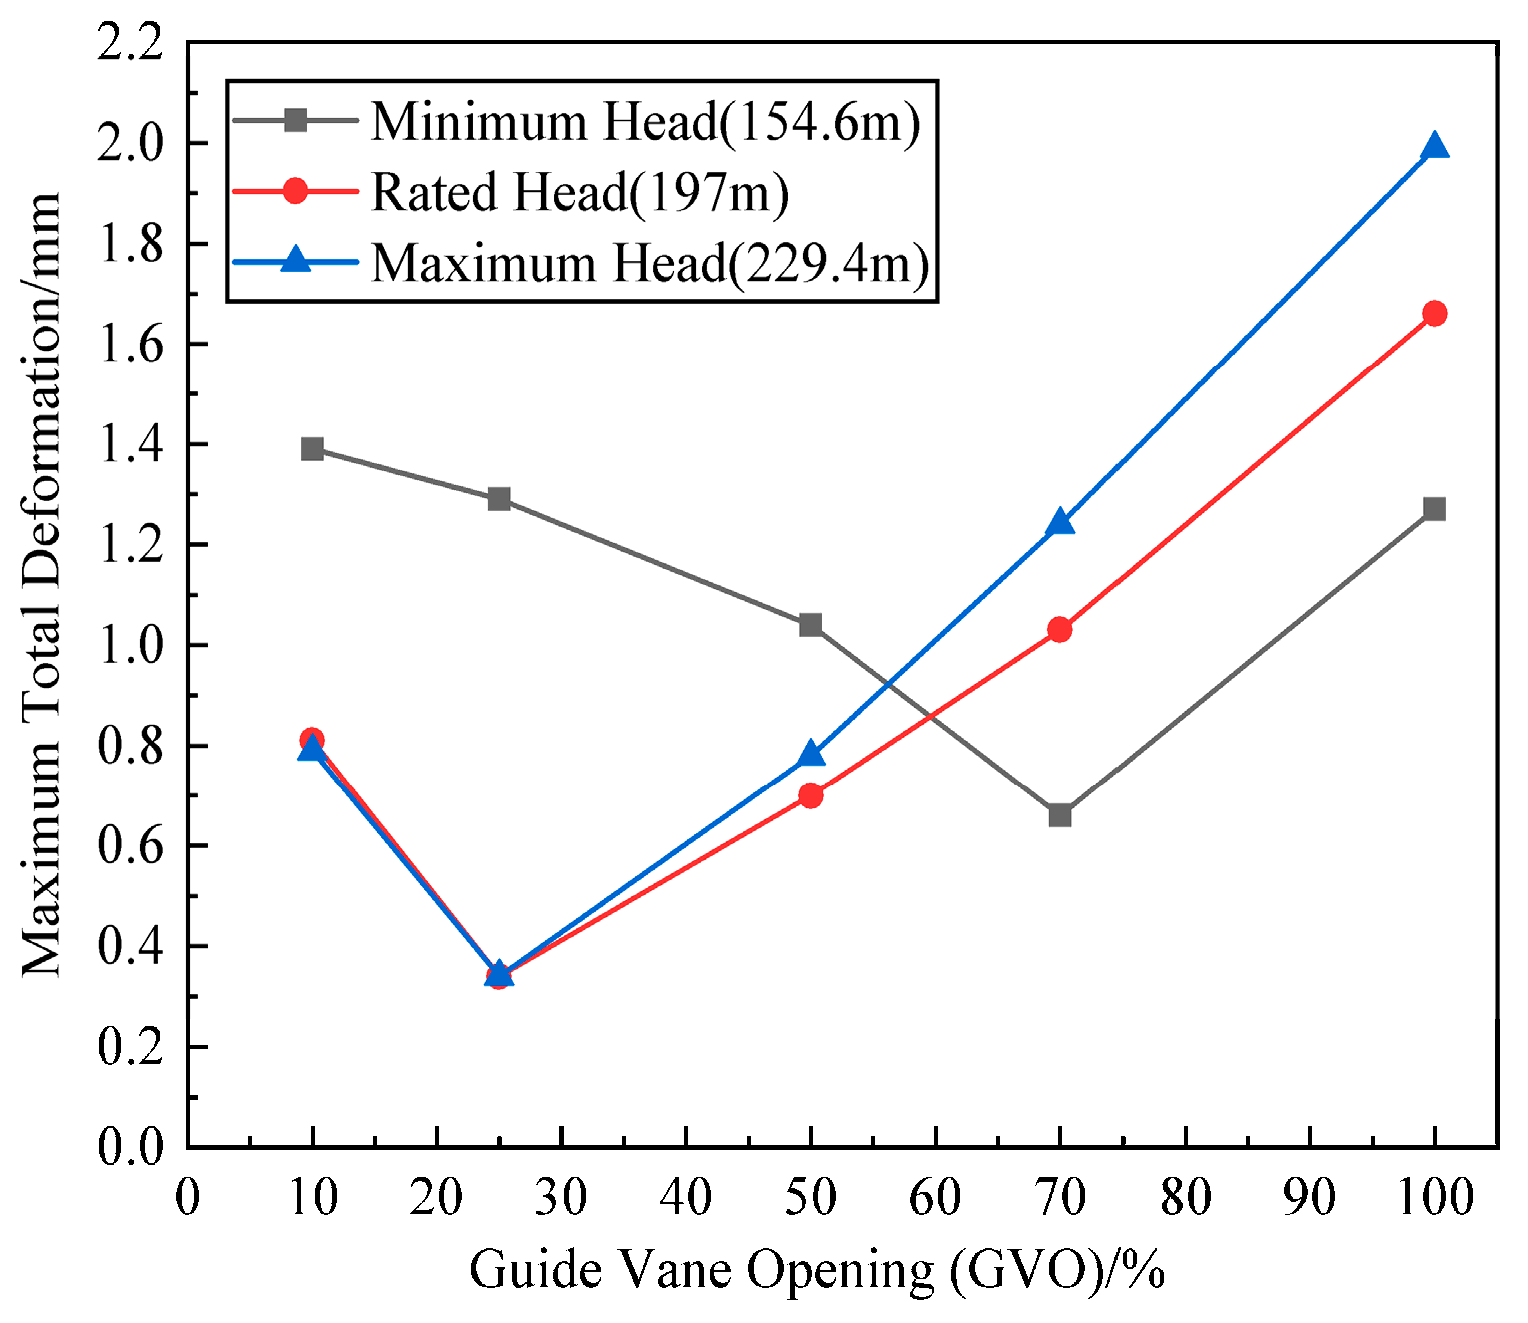
The variation trends of the maximum deformation of the runner under each working condition are shown in Figure 7. The water head influences the deformation of the runner. Under the condition of the minimum water head (154.6 m), the maximum deformation first decreases but then increases with increasing guide vane opening. When the opening degree is 10%, the maximum deformation reaches 1.39 mm; when the opening degree is 25%, it decreases to 1.29 mm; when the opening degree is 50%, it further decreases to 1.04 mm; when the opening degree is 70%, it significantly decreases to 0.66 mm; however, when the opening degree is 100%, it rebounds to 1.27 mm. Within the guide vane opening range of 10% to 70%, the flow field progressively stabilizes, accompanied by a decreasing trend in blade deformation. However, when the opening increases from 70% to 100%, the abrupt rise in flow rate leads to a sharp acceleration of water velocity in the blade’s outlet region, intensifying the local pressure gradient and triggering a rebound in deformation. Additionally, an increase in water head amplifies the sensitivity of runner blade deformation to variations in opening. Under rated and maximum water head conditions, increasing the opening from 10% to 25% results in a pronounced reduction in maximum blade deformation, from 0.81 mm and 0.79 mm to 0.34 mm, respectively. This is because moderately increasing the opening of the guide vanes effectively improves the uniformity of the flow field and reduces the local dynamic stress. When the opening degree is 25–100%, the deformation tends to increase with increasing opening degree, which is closely related to the higher flow velocity at the water outlet edge of the blade under a high flow rate.

3.2. Equivalent Stress Distribution Law of the Runner

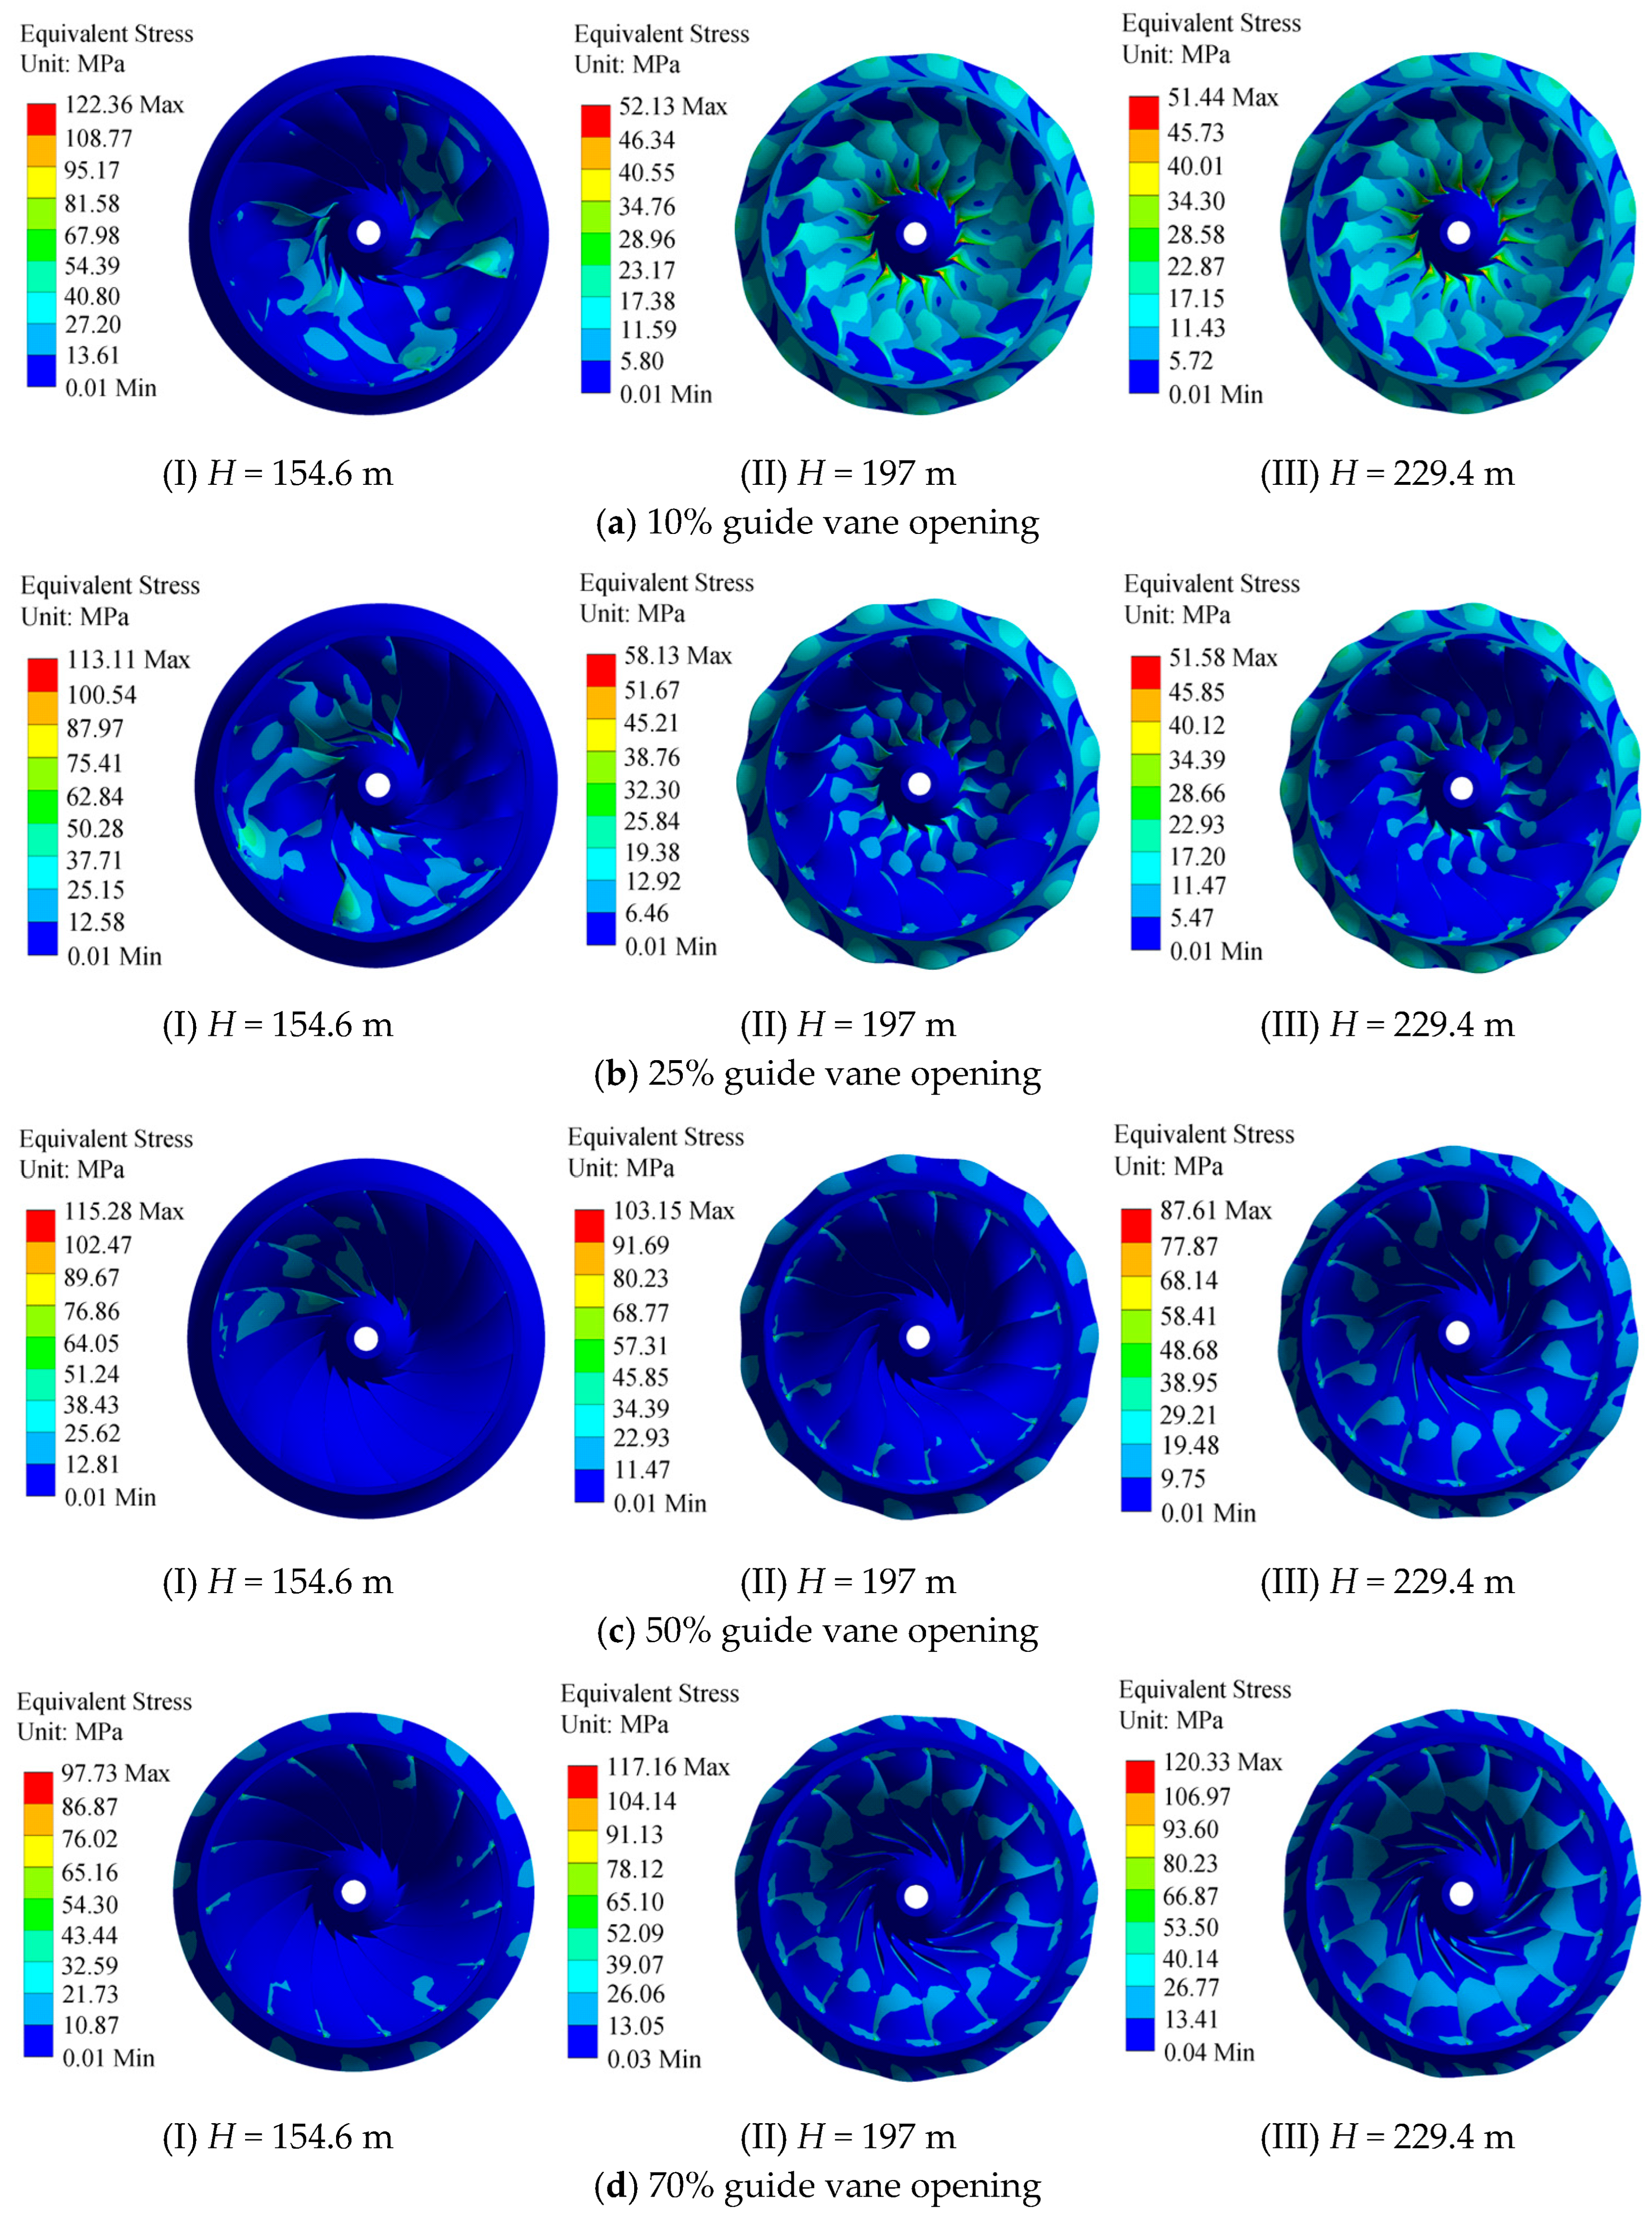
The equivalent stress distributions of the runner under different working conditions are shown in Figure 8. Under the minimum water head condition, when the guide vane opening ranges from 10% to 50%, the maximum equivalent stress is observed at the junction between the blade’s outlet edge and the lower ring, with notable stress also occurring at the connection between the outlet edge and the draft cone. However, as the opening increases to 70–100%, the maximum stress remains concentrated at the junction with the lower ring, while the previously significant stress at the connection with the draft cone decreases and eventually disappears. Under this water head with an opening of 10% to 50%, the equivalent stress distribution of each blade shows significant non-uniformity, which is directly related to the uneven flow field distribution under the conditions of a low water head and medium to low opening. At low guide vane openings, the water flow exiting the guide vanes enters the runner inlet asymmetrically, leading to variations in the flow attack angle at the runner inlet. This asymmetry causes an uneven load distribution among the blades. As the opening increases beyond 70%, the flow rate rises, the flow field becomes more uniform, and the stress differentials between the blades are significantly reduced. Under the conditions of the rated water head and maximum water head, the equivalent stress distributions of the runner blades exhibit strong spatial consistency. When the opening degree is lower than 25%, the maximum equivalent stress is concentrated at the connection between the water outlet edge and the drainage cone. However, as the degree of opening increases to more than 25%, the stress peak shifts to the connection between the water outlet edge and the lower ring. At a 25% opening degree, there is still a relatively large equivalent stress at the connection between the water outlet edge and the drainage cone. The transfer of the stress peak occurs because when the degree of opening is low, the upper crown connection generates the maximum stress because of the large radius and high centrifugal stress. At medium to high guide vane openings, the lower ring area experiences increased water pressure due to the high-speed impact of the flow and the contraction effect of the flow channel. This elevated pressure is transmitted through fluid–structure interaction to the junction between the blade’s outlet edge and the lower ring, resulting in maximum stress concentration in this region. The guide vane opening exerts a significant influence on the equivalent stress experienced by the runner blades. As the opening increases, the flow rate correspondingly rises, transitioning the internal flow velocity distribution within the runner from an impact-dominated pattern at low openings to a flow-dominated pattern at high openings.
As shown in Figure 9, during the maintenance of the 17F unit of the power station, a penetrating crack was found in the body of the No. 7 blade at the water outlet edge during the inspection of the runner. The crack is about 660 mm away from the lower ring. The crack on the positive pressure surface is about 200 mm long, and the crack on the negative pressure surface is about 140 mm long. There are bifurcation signs at the end of the crack on the negative pressure surface along the water inlet direction of the blade. This is because the stress near the lower ring at the water outlet edge of the runner blade is relatively high, and this area is thinner than those at other positions. When operating under conditions with a large equivalent stress, the large stress acts on the weak points resistant to deformation, which increases the likelihood that cracks and fractures will occur, which is unfavorable for the normal operation of the turbine.
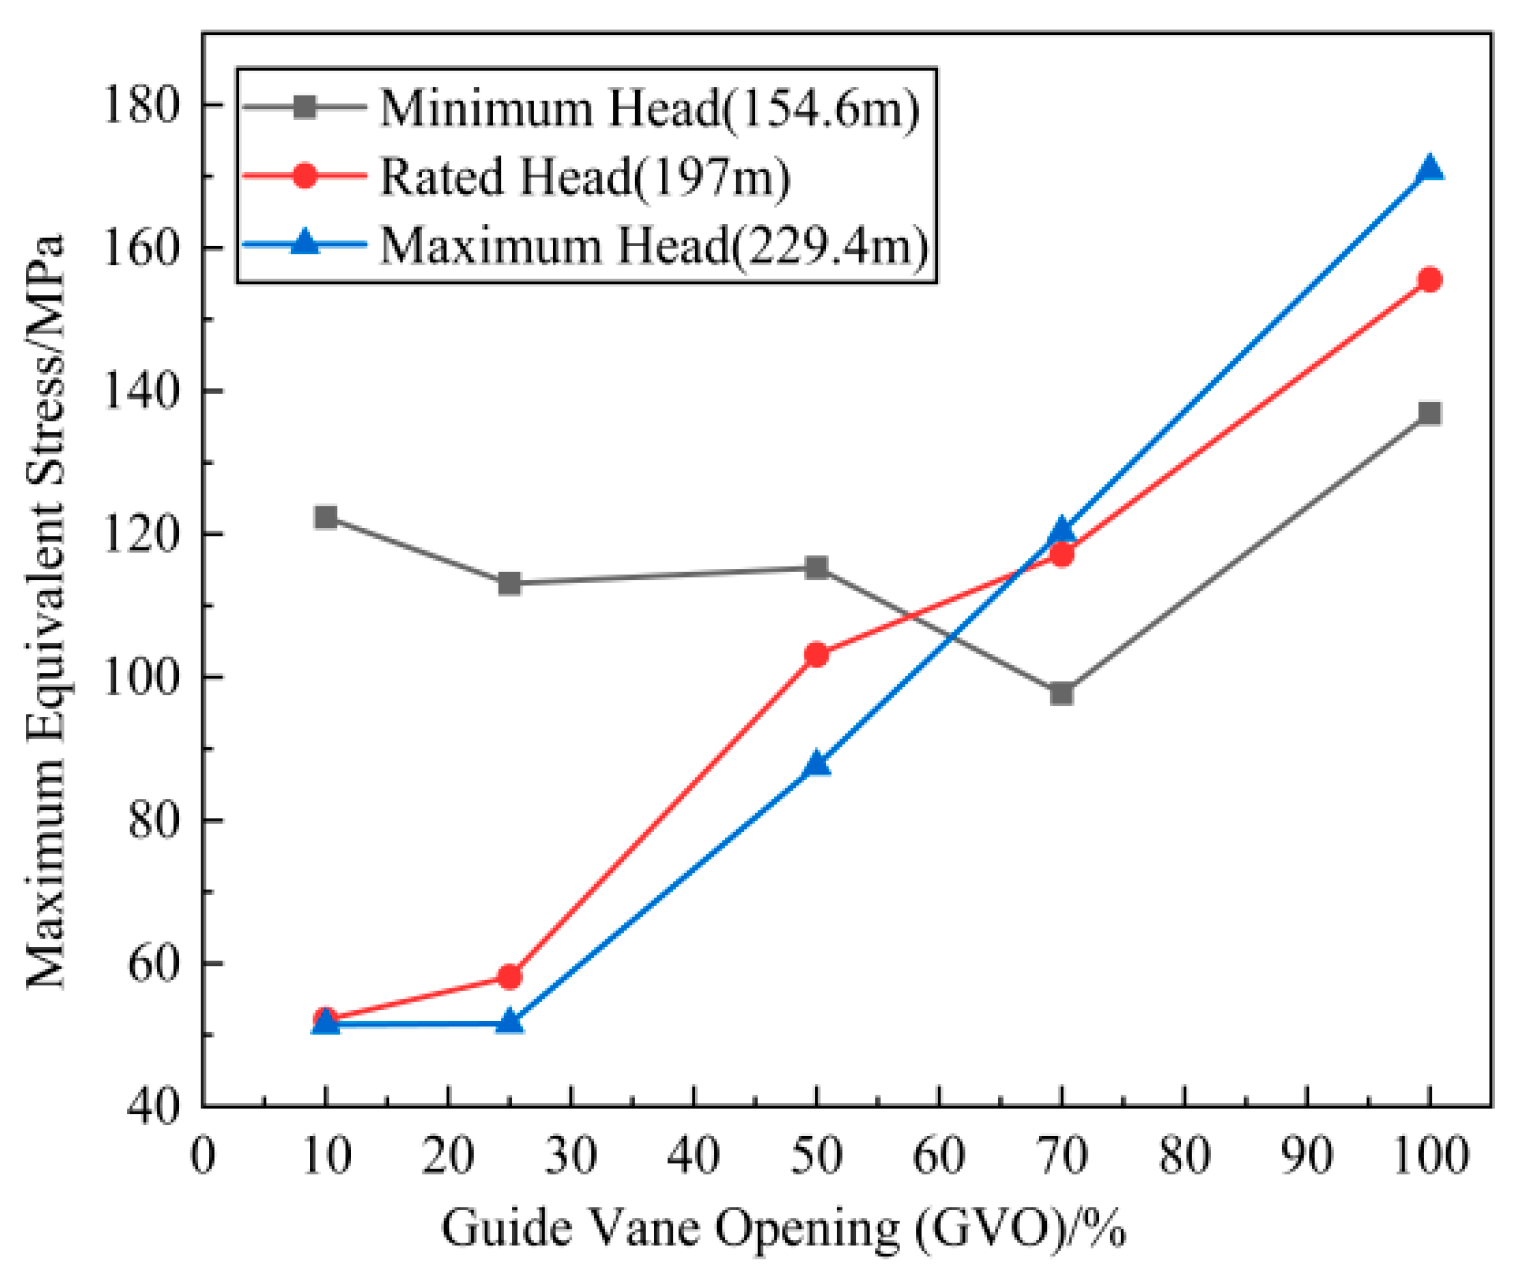
The variation trends of the maximum equivalent stress of the runner under each working condition are shown in Figure 10. At the minimum water head, the maximum equivalent stress of the runner blade first decreases but then increases with increasing guide vane opening. At openings of 10–70%, the maximum equivalent stress tends to decrease, and at openings of 70–100%, the maximum equivalent stress increases. Across all guide vane opening conditions at this water head, the variation in the maximum equivalent stress of the runner blades remains limited. When the opening increases from 10% to 25% under rated (197 m) and maximum (229.4 m) water heads, the maximum equivalent stress shows a slight increase at the rated head, while it remains nearly unchanged at the maximum head. This indicates that, under low opening conditions, the flow field exhibits greater stability at the maximum water head than at the rated water head. When the opening of the guide vanes increases by 100% from 25%, the maximum equivalent stress continues to rise, and the maximum equivalent stress is very sensitive to the change in opening.
To ensure that the runner is not damaged under normal operating conditions, it is necessary to conduct a strength check on the runner. The tensile strength σb of the material used for the turbine runner is 790 MPa. The calculation formula for the maximum allowable stress of the runner is as follows:
[ σ ] = σ b / n b
In the formula, σb represents the tensile strength of the material, in MPa, and nb represents the safety factor.
Taking the safety factor as 1.5, the maximum allowable stress of the runner is 526.67 MPa. As shown in Figure 10, at the maximum water head and 100% guide vane opening, the equivalent stress value is the largest, which is 170.92 MPa, which is far lower than the maximum allowable stress. It is in the elastic deformation zone and does not experience plastic yielding or even brittle fracture. This meets the strength requirements of the material.

4. Conclusions

While extensive studies exist for specific operating conditions, understanding of operational stability across wide-load ranges remains limited. In this study, through numerical simulation, the runner deformation and equivalent stress distribution law of the mixed-flow turbine of a Large hydropower station under wide-load operation conditions were systematically analyzed. The main conclusions are as follows:
(1) At low heads and small openings, the uneven flow field leads to an uneven distribution of deformation between the blades. As the water head and guide vane opening increase, the corresponding rise in flow rate leads to improved flow field uniformity and a more even distribution of blade deformation. Under these conditions, the maximum deformation typically occurs near the mid-section of the blade’s outlet edge. At the minimum water head, when the guide vane opening is below 25%, the runner blades exhibit relatively larger maximum deformation. Under the rated water head and the maximum water head, when the opening is 10% to 25%, the maximum deformation of the blade tends to decrease. When the opening ratio increases to 25% or more, the maximum deformation continues to increase.
(2) Under the conditions of a low head and a small opening of the turbine, the equivalent stress distribution between the blades is significantly uneven because of the poor uniformity of the flow field. With increasing water head and opening degree, an increase in the flow rate through the machine improves the uniformity of the flow field, making the equivalent stress distribution of the blades tend to be uniform. Under most working conditions, the maximum equivalent stress of the runner blades occurs near the lower ring at the water outlet edge. At the minimum water head, when the opening percentage is 10–70%, the maximum equivalent stress of the blade tends to decrease. When the opening ratio increases to 70% or more, the maximum equivalent stress tends to increase. Under the rated water head and the maximum water head, when the opening exceeds 25%, the maximum equivalent stress of the blade continues to rise. After calculation, the maximum equivalent stress of the runner blade is much lower than the maximum allowable stress. The runner blade is in the elastic deformation zone and does not yield plastic or even undergo brittle fracture, which meets the strength requirements of the material.
(3) Based on the research findings, to ensure the safe and stable operation of hydropower units under wide-load conditions, the following recommendations are proposed. First, without altering the existing equipment, the turbine’s operational strategy should be optimized: under low-head conditions, the guide vane opening should be restricted to below 25%; for medium- and high-head conditions, the opening should not exceed 50%; and under maximum head conditions, the opening should be maintained above 70%. Second, it is advisable to implement a technological upgrade of the turbine runner to better accommodate the long-term safe and stable operation of the unit under genuinely wide-load scenarios.

Author Contributions

Conceptualization, J.P.; Methodology, L.L.; Formal analysis, Y.X.; Investigation, W.D.; Resources, S.W.; Writing—original draft, X.D.; Writing—review and editing, X.L.; Supervision, Z.Y.; Project administration, C.L.; Funding acquisition, H.H. All authors have read and agreed to the published version of the manuscript.

Funding

This research was supported by the Key Program of National Natural Science Foundation of China (No: U23A20669) and the Open Research Subject of Key Laboratory of Fluid and Power Machinery (Xihua University), Ministry of Education (grant number szjj2024-LTDL-2024010).

Data Availability Statement

Data are contained within the article.

Conflicts of Interest

Author Shuman Wei was employed by the company China Gezhouba Group Mechanical & Electrical Construction Co., Ltd. The remaining authors declare that the research was conducted in the absence of any commercial or financial relationships that could be construed as a potential conflict of interest.

References

  1. Iliescu, M.; Houde, S.; Deschenes, C.; Lemay, S. Investigations of the cavitational behavior of an axial hydraulic turbine operating at partial discharge by 3D-PIV. In Proceedings of the International Symposium on Particle Image Velocimetry-PIV, Kobe, Japan, 21–23 July 2011. [Google Scholar]
  2. Wang, F.; Liao, C.; Tang, X. Numerical simulation of pressure fluctuations in a large Francis turbine runner. Chin. J. Mech. Eng. 2012, 25, 1198–1204. [Google Scholar] [CrossRef]
  3. Chen, Z.; Singh, P.M.; Choi, Y.-D. The effect of runner blade loading on the performance and internal flow of a Francis hydro turbine model. J. Mech. Sci. Technol. 2016, 30, 1617–1623. [Google Scholar] [CrossRef]
  4. Liu, X. Simulation Research on Full Flow Channel of Mixed-Flow Turbine and Pressure Pulsation Analysis. Master’s Thesis, Kunming University of Science and Technology, Kunming, China, 2017. [Google Scholar]
  5. Tian, C.; Yuan, S.; Wang, J.; Liu, X. Numerical Simulation of Internal Flow of Turbine Runner in Hydropower Station on Sediment River. Hydropower Energy Sci. 2020, 38, 163–166. [Google Scholar]
  6. Song, H. Numerical Simulation Study on the Internal Flow and Pressure Pulsation Characteristics of Medium-Head Mixed-Flow Turbines. Master’s Thesis, Xihua University, Chengdu, China, 2021. [Google Scholar]
  7. Tang, W.; Liu, X.; He, L.; Ma, T. The influence of guide vane opening on the internal flow state of the runner in a mixed-flow turbine. J. Eng. Therm. Energy Power/Reneng Dongli Gongcheng 2022, 37, 40–47+76. [Google Scholar]
  8. Xu, L.H.; Guo, T.; Wang, W.Q. Effects of vortex structure on hydraulic loss in a low head Francis turbine under overall operating conditions base on entropy production method. Renew. Energy 2022, 198, 367–379. [Google Scholar] [CrossRef]
  9. Xu, T.; Cheng, Q.; Lin, C.; Yu, Q.; Hu, X. Study on Flow Characteristics of Francis Turbine Based on Large-Eddy Simulation. Water 2023, 15, 3372. [Google Scholar] [CrossRef]
  10. Pang, J.; Yao, B.; Liu, X.; Li, J.; Xiao, M.; Jiang, D.; Tang, W.; Zhou, L.; Lai, Z. Influence of guide vane opening on channel vortex and pressure pulsation in Francis turbine runners. Phys. Fluids 2024, 36, 043325. [Google Scholar] [CrossRef]
  11. Ji, R.; Zheng, J.; Xue, M.-A.; Sun, K.; Ye, Y.; Zhu, R.; Fernandez-Rodriguez, E.; Zhang, Y. Investigations on the performance and wake dynamics of a tidal stream turbine under different yaw-offset conditions. Phys. Fluids 2025, 37, 015192. [Google Scholar] [CrossRef]
  12. Wang, H.; Pang, J.; Lai, Z.; Gan, L.; Huang, D.; Hua, H.; Yu, Z.; Liu, X. Internal flow stability of a Francis turbine under wide load operating range. Phys. Fluids 2025, 37, 023346. [Google Scholar] [CrossRef]
  13. Xu, L.; Zhang, Y.; Xu, J.; Zhang, D.; Feng, C.; Zhang, Z.; Zheng, Y. Vortex and energy characteristics in the hump region of pump-turbines based on the rigid vorticity and local hydraulic loss method. Phys. Fluids 2025, 37, 35194. [Google Scholar] [CrossRef]
  14. Xu, L.; Zhang, Y.; Xu, J.; Wang, Y.; Feng, C.; Yang, Y.; Liu, D.; Liu, X.; Zheng, Y. Towards the integration of new-type power systems: Hydraulic stability analysis of pumped storage units in the S-characteristic region based on experimental and CFD studies. Energy 2025, 329, 136755. [Google Scholar] [CrossRef]
  15. Feng, J.; Ling, Z.; Zhao, Z.; Li, M.; Chen, W. Research on the Stability of Runner Structure of Mixed-Flow Turbine under Eccentric Load Conditions. J. Hydropower 2021, 40, 107–114. [Google Scholar]
  16. Liao, W.; Xu, B.; Lu, P.; Zhang, H.; Wang, J. The influence of runner blade deformation of mixed-flow turbine under partial load on the flow field. J. Mech. Eng. 2006, 42, 55–59. [Google Scholar] [CrossRef]
  17. Xu, B. Dynamic Characteristics Analysis of Rotor Solid-State Coupling in Mixed-Flow Turbine. Master’s Thesis, Xi’an University of Technology, Xi’an, China, 2006. [Google Scholar]
  18. Xiao, R.F.; Wang, Z.W.; Luo, Y.Y. Static stress characteristics analysis of Francis turbine runner based on fluid-structure interaction. J. Hydroelectr. Eng. 2007, 26, 120–123. [Google Scholar]
  19. Wang, W.Q.; He, X.Q.; Zhang, L.X.; Liu, J.; Chen, Y. Strongly coupled simulation of fluid–structure interaction in a Francis hydroturbine. Int. J. Numer. Methods Fluids 2009, 60, 515–538. [Google Scholar] [CrossRef]
  20. Wang, Z.W.; Qin, L.; Zeng, J.D.; Li, H.; Zhang, Y. Hydroturbine operating region partitioning based on analyses of unsteady flow field and dynamic response. Sci. China Technol. Sci. 2010, 53, 519–528. [Google Scholar] [CrossRef]
  21. Thibault, D.; Gagnon, M.; Godin, S. The effect of materials properties on the reliability of hydraulic turbine runners. Int. J. Fluid Mach. Syst. 2015, 8, 254–263. [Google Scholar] [CrossRef]
  22. Presas, A.; Luo, Y.; Wang, Z.; Guo, B. Fatigue life estimation of Francis turbines based on experimental strain measurements: Review of the actual data and future trends. Renew. Sustain. Energy Rev. 2019, 102, 96–110. [Google Scholar] [CrossRef]
  23. Julian, U.; Markus, E.; Eduard, D. Fatigue analysis of Francis Turbines with different specific speeds using site measurements. WASSERWIRTSCHAFT 2019, 109, 48–53. [Google Scholar] [CrossRef]
  24. Zhu, D.; Tao, R.; Xiao, R.; Li, Y.; Wang, Q. Solving the runner blade crack problem for a Francis hydro-turbine operating under condition-complexity. Renew. Energy 2020, 149, 298–320. [Google Scholar] [CrossRef]
  25. Shi, G.; Zhu, Y.; Liu, Z.; Li, J. The influence of guide vane opening on the stress and strain of the runner in a mixed-flow turbine. J. Drain. Irrig. Mach. Eng. 2020, 38, 1. [Google Scholar]
  26. Liu, D.; Deng, X.; Zhao, Y.; Li, Y.; Zhang, J. Research on Dynamic Stress and Pressure Pulsation Test of Large Mixed-Flow Model Unit. J. Mech. Eng. 2020, 55, 9–18. [Google Scholar]
  27. Presas, A.; Valentin, D.; Zhao, W.; Egusquiza, M.; Valero, C.; Egusquiza, E. On the use of neural networks for dynamic stress prediction in Francis turbines by means of stationary sensors. Renew. Energy 2021, 170, 652–660. [Google Scholar] [CrossRef]
  28. Zhao, Y.; Dang, M.; Feng, J.; Luo, X.; Li, Z. The influence of free liquid surface and water body gravity on the stress and strain of tubular turbine blades. Chin. J. Agric. Eng. 2022, 38, 52–60. [Google Scholar]
  29. Hua, H.; Zhang, Y.; Qin, Z.; Yang, Y.; Fernandez-Rodriguez, E. Dynamic response of a semi-submersible floating wind turbine-point absorption wave energy hybrid energy system under rated and extreme conditions. Phys. Fluids 2025, 37, 017144. [Google Scholar] [CrossRef]
  30. Vantadori, S.; Carpinteri, A.; Scorza, D. Simplified analysis of fracture behaviour of a Francis hydraulic turbine runner blade. Fatigue Fract. Eng. Mater. Struct. 2013, 36, 679–688. [Google Scholar] [CrossRef]
  31. Georgievskaia, E. Analytical system for predicting cracks in hydraulic turbines. Eng. Fail. Anal. 2021, 127, 105489. [Google Scholar] [CrossRef]
  32. Seydoux, M.; Vagnoni, E.; Nicolet, C.; Paolone, M. On the prediction of the induced damage by the start-up sequence of Francis turbines: On operational resilience framework. Renew. Energy 2024, 228, 120587. [Google Scholar] [CrossRef]
Figure 1. Three-dimensional geometric model of the turbine.
Water 17 02374 g001
Figure 2. Three-dimensional model grid of the turbine computing domain.
Water 17 02374 g002
Figure 3. y+ distribution on the runner computational grid.
Water 17 02374 g003
Figure 4. Grid independence verification. The star in the figure here represent the number of meshes of the model I finally chose and the efficiency results obtained by numerical calculations under that mesh.
Water 17 02374 g004
Figure 5. Comparison of numerical simulation and experimental results.
Water 17 02374 g005
Figure 6. Deformation distribution of the runner under different working conditions.
Water 17 02374 g006aWater 17 02374 g006b
Figure 7. The variation trend of the maximum deformation under each working condition.
Water 17 02374 g007
Figure 8. The equivalent stress distributions of the runner under different working conditions.
Water 17 02374 g008aWater 17 02374 g008b
Figure 9. Penetrating cracks at the water outlet edge of the blade.
Water 17 02374 g009
Figure 10. The variation trend of the maximum equivalent stress under each working condition.
Water 17 02374 g010
Table 1. Basic design parameters of turbine.
ParametersValueParametersValue
Rated head H/(m)197Number of guide vanes Zg24
Rated flow rate Q/(m3/s)432.67Number of rotor blades Zr15
Rated speed n/(r/min)125Rated output P/(MW)784
Rotor diameter D1/(m)7.4Efficiency η/(%)96.61
Table 2. Calculation conditions based on the orthogonal experimental method.
Guide Vane Opening (%)10255070100
Head (m)
154.612345
197678910
229.41112131415
Disclaimer/Publisher’s Note: The statements, opinions and data contained in all publications are solely those of the individual author(s) and contributor(s) and not of MDPI and/or the editor(s). MDPI and/or the editor(s) disclaim responsibility for any injury to people or property resulting from any ideas, methods, instructions or products referred to in the content.