1. Introduction
In recent years, urban pluvial waterlogging has emerged as a frequent and severe natural disaster worldwide, causing substantial socioeconomic losses [
1]. Accelerated urbanization, increased impervious surfaces, and the rising frequency of extreme precipitation events have significantly weakened the capacity of cities to regulate runoff, leading to growing risks of urban inundation [
2,
3]. These waterloggings not only threaten the safe operation of cities but also endanger residents’ lives and property. Against this backdrop, accurately simulating urban flood scenarios-particularly at the community scale and quantitatively assessing building-level economic losses have become central issues in urban disaster prevention and mitigation research [
4,
5].
Historically, urban flood simulation and asset loss assessment methods have evolved through three major stages. The first stage relied on empirical and survey-based approaches, which depended heavily on subjective judgment and lacked scalability. The second stage saw the development of physically based hydrological-hydraulic models such as SWMM, MIKE FLOOD, and InfoWorks ICM, which simulate the entire rainfall-runoff-drainage-inundation process with high accuracy [
6,
7,
8,
9]. However, these models require detailed pipe network configurations, extensive hydrological parameters, and high-quality rainfall data, making them complex and computationally intensive, thus limiting their practical application at larger urban scales [
10,
11].
With the advancement of Geographic Information Systems (GISs) and the increasing availability of multi-source spatial data, a new paradigm has emerged: data-driven, automated flood risk assessment models. High-resolution digital elevation models (DEM), building footprint datasets, remote sensing imagery, and property inventories now provide the necessary data infrastructure for modeling flood hazards and vulnerabilities at the urban, and even building scale [
3,
12]. Meanwhile, the integration of scripting languages such as Python 3.6 or R with GIS platforms has enabled researchers to automate complex workflows, including rainfall volume estimation, inundation depth calculation, asset classification, and loss computation [
13,
14].
GIS-based automated waterlogging assessment systems have thus become a research focus. These methods use spatial overlay analysis to integrate rainfall scenarios, effective runoff area estimation, waterlogging depth modeling, and property vulnerability data into a streamlined simulation-to-evaluation pipeline. Compared with traditional hydrodynamic models, GIS-based approaches require fewer hydrological inputs [
4,
15,
16], are easier to implement, and are particularly well-suited to community-level high-resolution and multi-scenario waterlogging analysis. Moreover, they are advantageous in urban environments where sewer infrastructure data are incomplete or where historical waterlogging records are lacking [
17,
18].
Despite recent progress, prevailing GIS-based automated methods still face several critical limitations. First, many studies apply uniform depth–damage functions across all building types, neglecting the fundamental differences in vulnerability between residential and commercial assets, which leads to significant estimation biases [
19,
20]. Second, many models do not fully integrate waterlogging simulation with economic loss estimation, limiting their capacity for automation and fine-scale analysis [
1,
3,
21]. Third, a lack of open and adaptable frameworks limits their applicability in many Chinese cities, which are characterized by high-density development, complex micro-topography, and an absence of comprehensive sewer network data [
11,
22,
23].
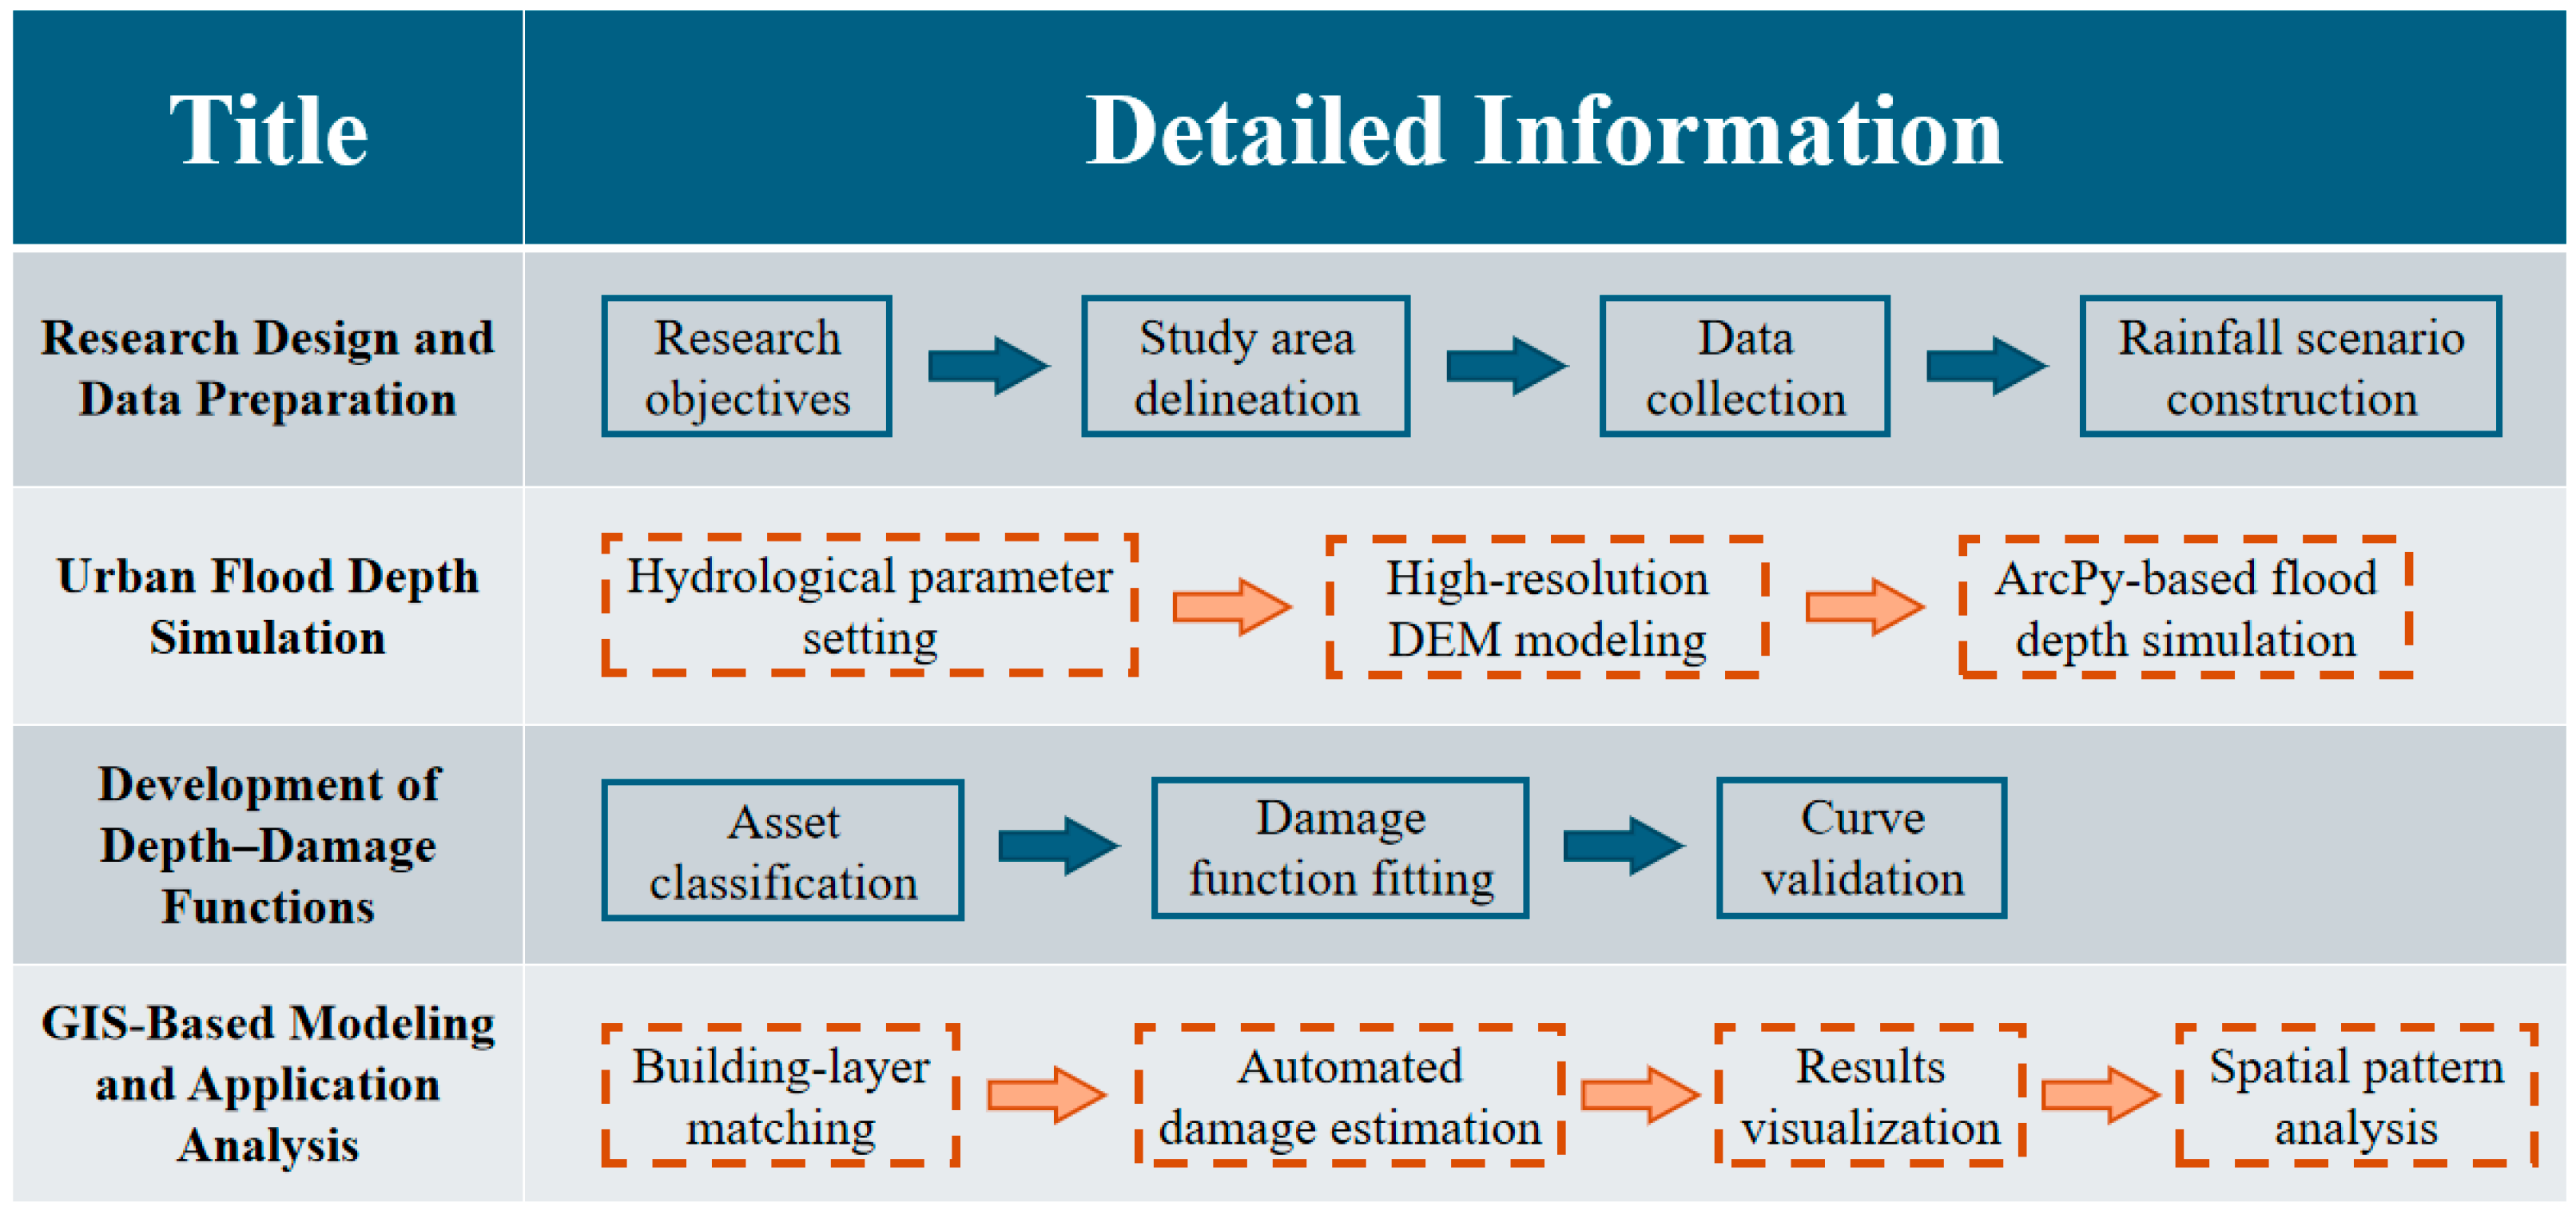
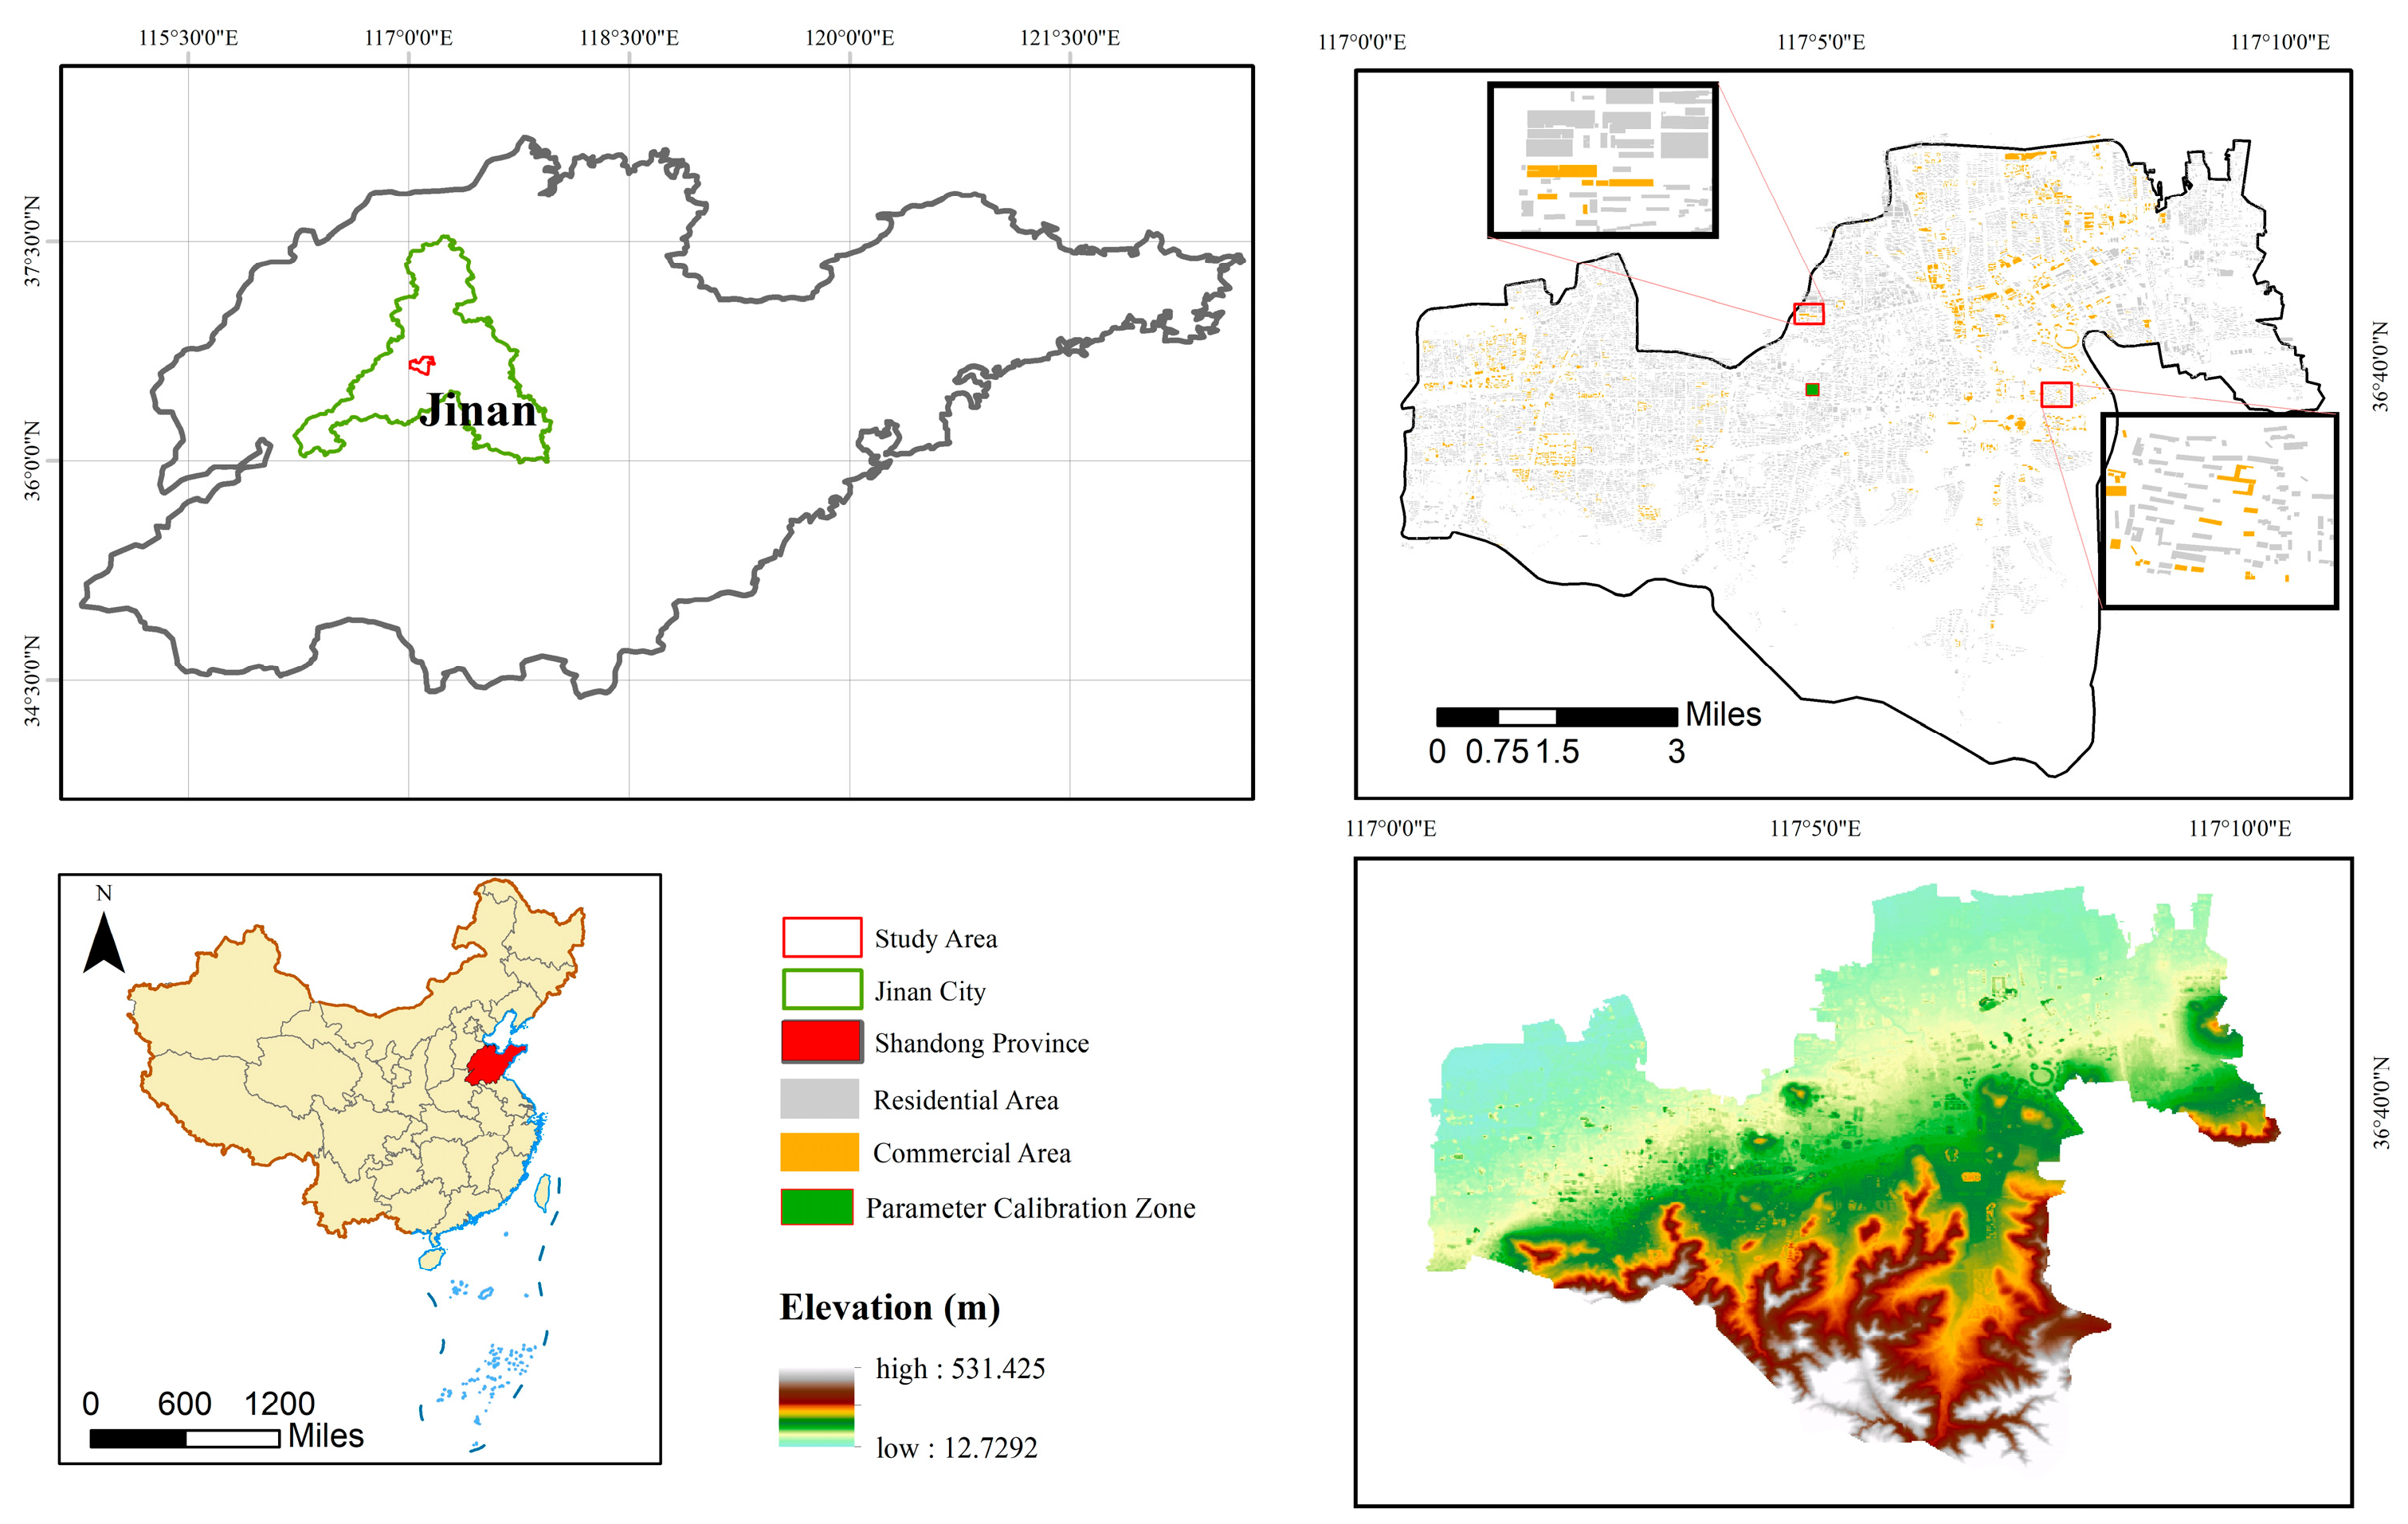
To address these gaps, this study proposes a GIS-based method that not only leverages automation for scalability but also introduces a differentiated modeling approach. Using the Lixia District in Jinan City, China, as a representative urban core area, an automated inundation depth model is developed that incorporates rainfall scenarios, runoff estimation, and volume-based iterative calculations for high-precision waterlogging modeling. We construct detailed depth–damage curves for residential and commercial buildings, accounting for household appliances, interior decoration, furniture, inventory, and temporary relocation costs. Loss assessment is implemented via layered accumulation (for residential structures) and piecewise linear models (for commercial buildings), integrated with ArcPy scripting for automated processing. The results are visualized and exported through a unified GIS workflow that includes waterlogging depth rasters, spatial heatmaps, attribute tables, and statistical summaries (see
Figure 1). Our framework is designed to (i) construct and apply separate depth–damage functions for residential and commercial buildings, (ii) achieve building-level loss estimation for over 15,000 structures, and (iii) validate the model’s accuracy to within 5 % error, demonstrating its practicality for data-scarce urban environments.
3. Methodology
This section describes the technical framework developed to simulate urban waterlogging depths and estimate building-level economic losses. The methodology integrates rainfall scenario simulation, water depth calculation using DEMs, the construction of depth–damage functions for residential and commercial buildings, and the implementation of a GIS-based automated loss estimation model.
3.1. Waterlogging Depth Simulation
3.1.1. Model Development
An automated waterlogging depth calculation model was developed using ArcPy, which distributes rainfall volumes across the DEM grid cells using a finite-volume approach. By inputting different combinations of rainfall intensities and durations, the model can simulate corresponding waterlogging depths for various regions.
3.1.2. Model Environment and Parameter Settings
(1) Workspace: Specifies the path to the ArcGIS 10.8 geodatabase and allows overwriting of existing outputs.
(2) Input Parameters: Include the DEM file path, target rainfall volume, and output directory.
(3) Simulation Parameters: The initial water surface elevation is iteratively increased with a step size of 0.01 m. The acceptable error threshold is set to 5% of the total target volume.
3.1.3. Runoff Coefficient and Effective Runoff Area Calculation
The surface runoff coefficient (
Ψ) is a key hydrological parameter that quantifies the fraction of precipitation that becomes surface runoff [
1,
12]. To accurately estimate the effective runoff volume contributing to waterlogging, an area-weighted approach was adopted, accounting for the infiltration capacity of different surface types.
The study area was partitioned into homogeneous units based on surface permeability (e.g., asphalt roads, block-stone pavements, roofs, and green spaces). The effective runoff area (
Aef) for each category was calculated as
Aef =
S ×
Ψ, where
S is the surface area (m
2) and
Ψ is the runoff coefficient assigned according to Chinese design codes (GB 50014 and GB 50015) [
31,
32] and local surveys: 0.9 for roads and roofs, 0.6 for block-stone pavements, 0.4 for dry brick sidewalks, and 0.2 for green spaces.
The total effective runoff area (At) for the entire study site was then determined by aggregating the contributions from all partitions: At = Σ(Si × Ψi). This approach refines the rainfall volume input (V = 0.001 × D × At) for the waterlogging simulation model by converting the hydrologically heterogeneous surface into an equivalent, smaller, completely impervious area, thereby providing a more accurate representation of the actual runoff generation process that excludes infiltrated rainfall.
3.1.4. Processing Workflow
Starting from the lowest elevation within the DEM, the model iteratively raises the hypothetical water surface by 0.01 m per step. The “Surface Volume_3D” tool is used to calculate the inundated volume corresponding to each water level. These values are recorded in a dynamic log file [
15]. The program continuously compares the computed volume with the target volume, updating the optimal result in real time.
The iteration stops when one of the following conditions is met: (1) the error is within the acceptable tolerance; (2) the computed volume reaches the target volume; (3) the elevation exceeds the predefined upper limit. The final output includes the optimal waterlogging depth, corresponding inundation volume and associated error.
The process of calculating urban waterlogging depth consists of the following three steps:
(1) Rainfall Depth (
D in mm):
Here, R is the rainfall intensity (mm/h) and T is the duration (h).
(2) Rainfall Volume (
V in m
3):
Here, A is the effective runoff area (m2).
(3) Waterlogging Depth (h in m): The calculated rainfall volume V is used as the input to the automated waterlogging depth model, which returns the corresponding waterlogging height, h, for the study area.
3.2. Depth—Damage Functions (Residential/Commercial)
To construct waterlogging depth–damage functions suitable for GIS-based urban waterlogging assessment models [
10,
19,
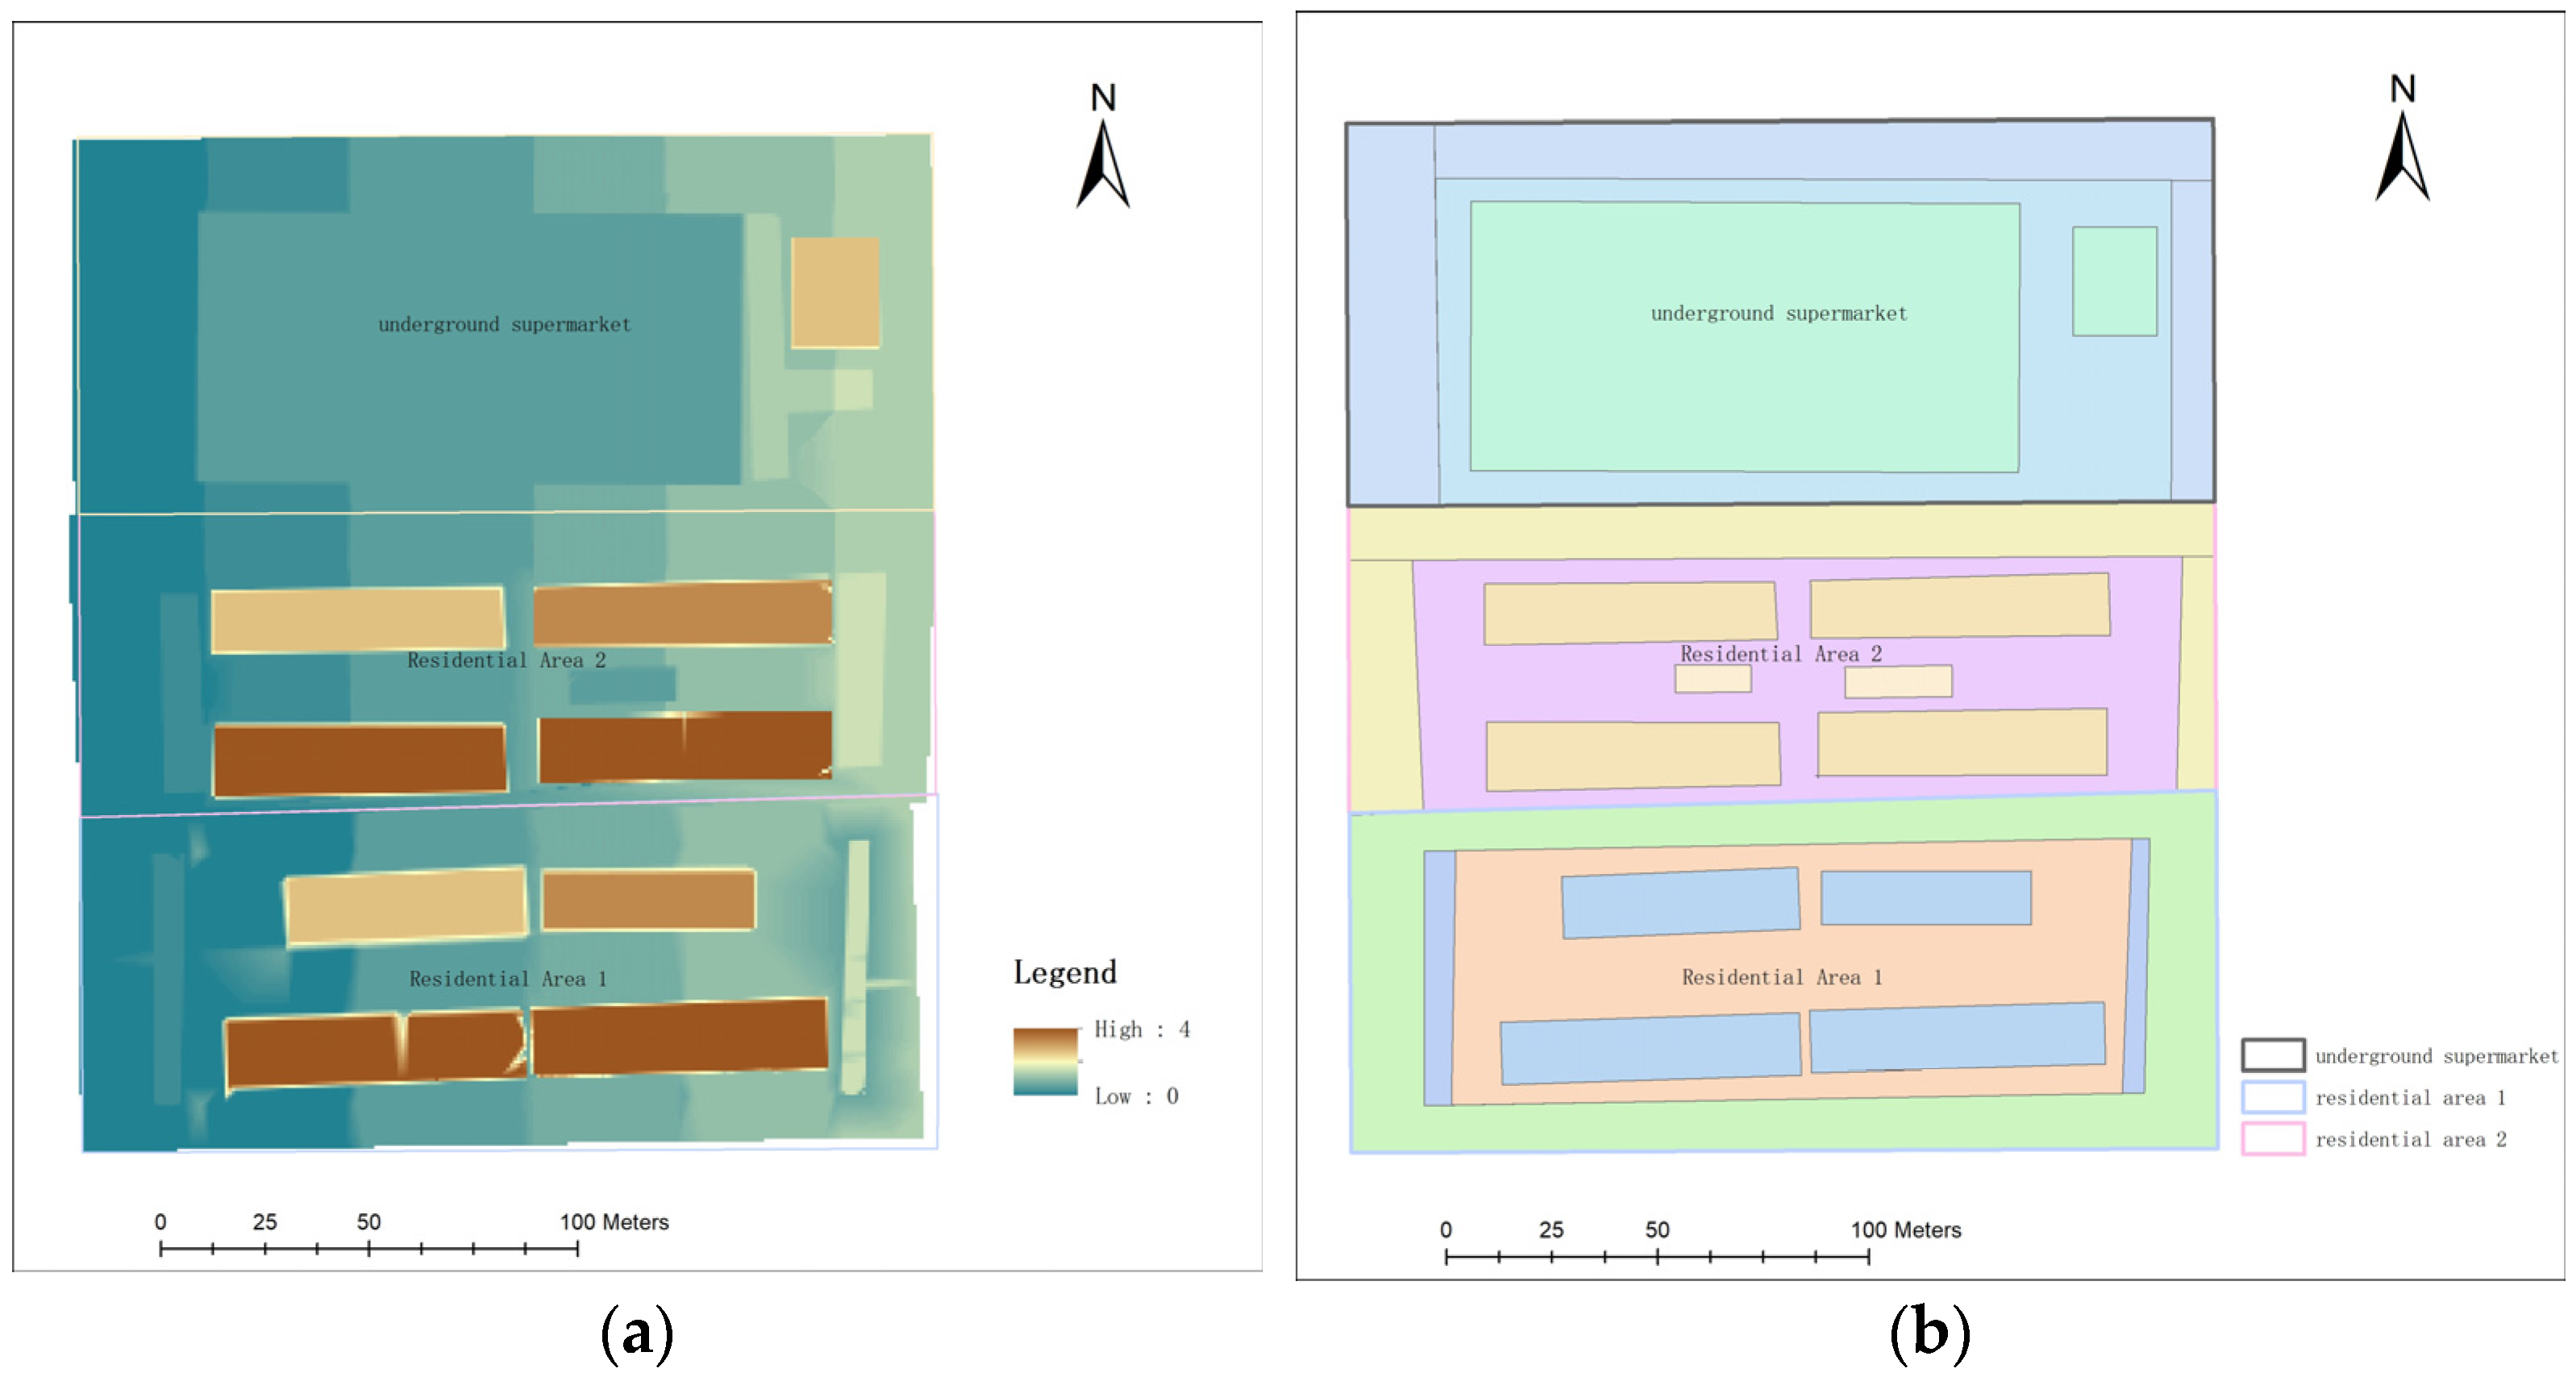
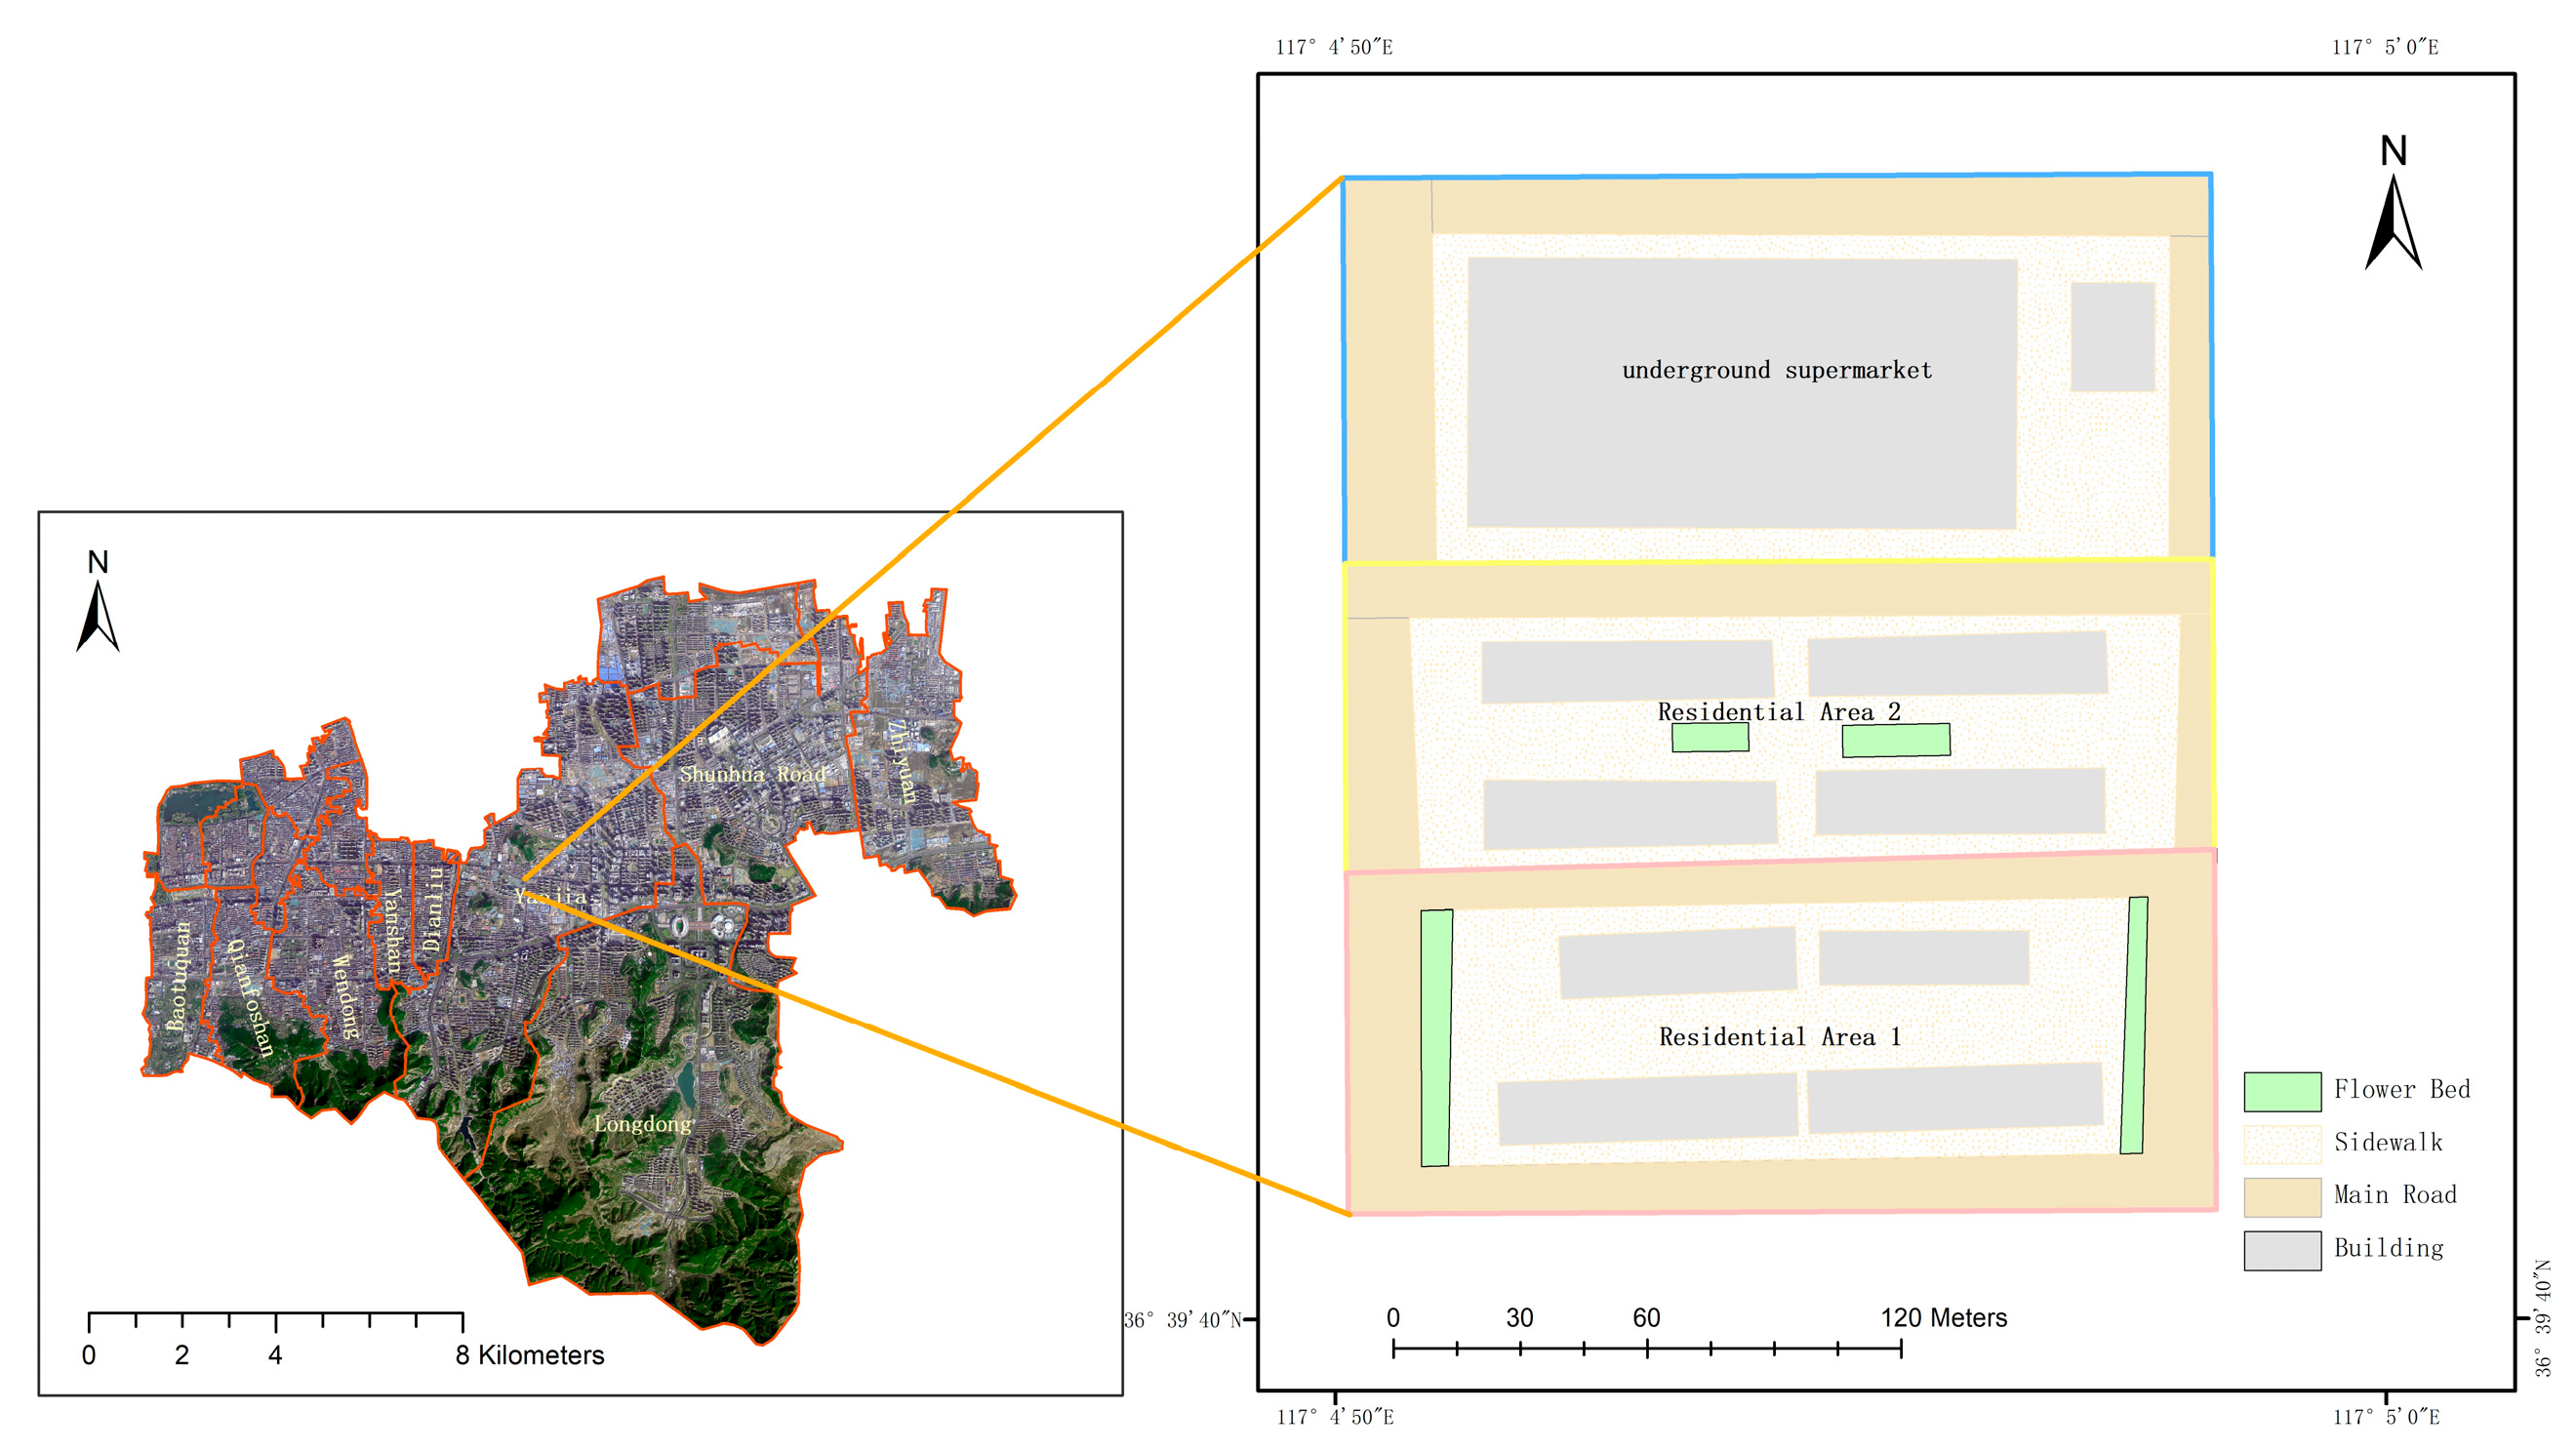
26], this study selected two typical residential communities and one underground commercial supermarket in the Yaojia Subdistrict, Lixia District, Jinan, as parameter calibration areas. Asset structure and historical waterlogging impact data were collected to fit separate damage curves for residential and commercial buildings. As shown in
Figure 4, the selected area is located in Jinan’s central urban zone, characterized by high building density, weak drainage infrastructure, and a terrain that slopes from east to west, making it prone to water accumulation. The underground supermarket is a closed space, highly vulnerable to waterlogging.
3.2.1. Residential Depth–Damage Curves
In constructing the residential depth–damage curves, the categorization into three representative household types—120 m2 three-bedroom and one-living room, 100 m2 two-bedroom and one-living room, and 140 m2 three-bedroom and two-living room—was derived from an integrated field survey and real-estate data analysis. For each type, depth–damage relationships were developed by systematically evaluating structural renovation costs (flooring and wall finishes), appliance repair and replacement expenditures, and resettlement costs associated with temporary relocation. The relative weights assigned to each loss component were determined through a combination of local consumption statistics, appliance penetration rates, and official government guidelines, ensuring that the curves reflect region-specific socioeconomic conditions. This structured approach allows residential damage functions to capture both physical exposure and socioeconomic vulnerability, thereby improving the realism and applicability of the model.
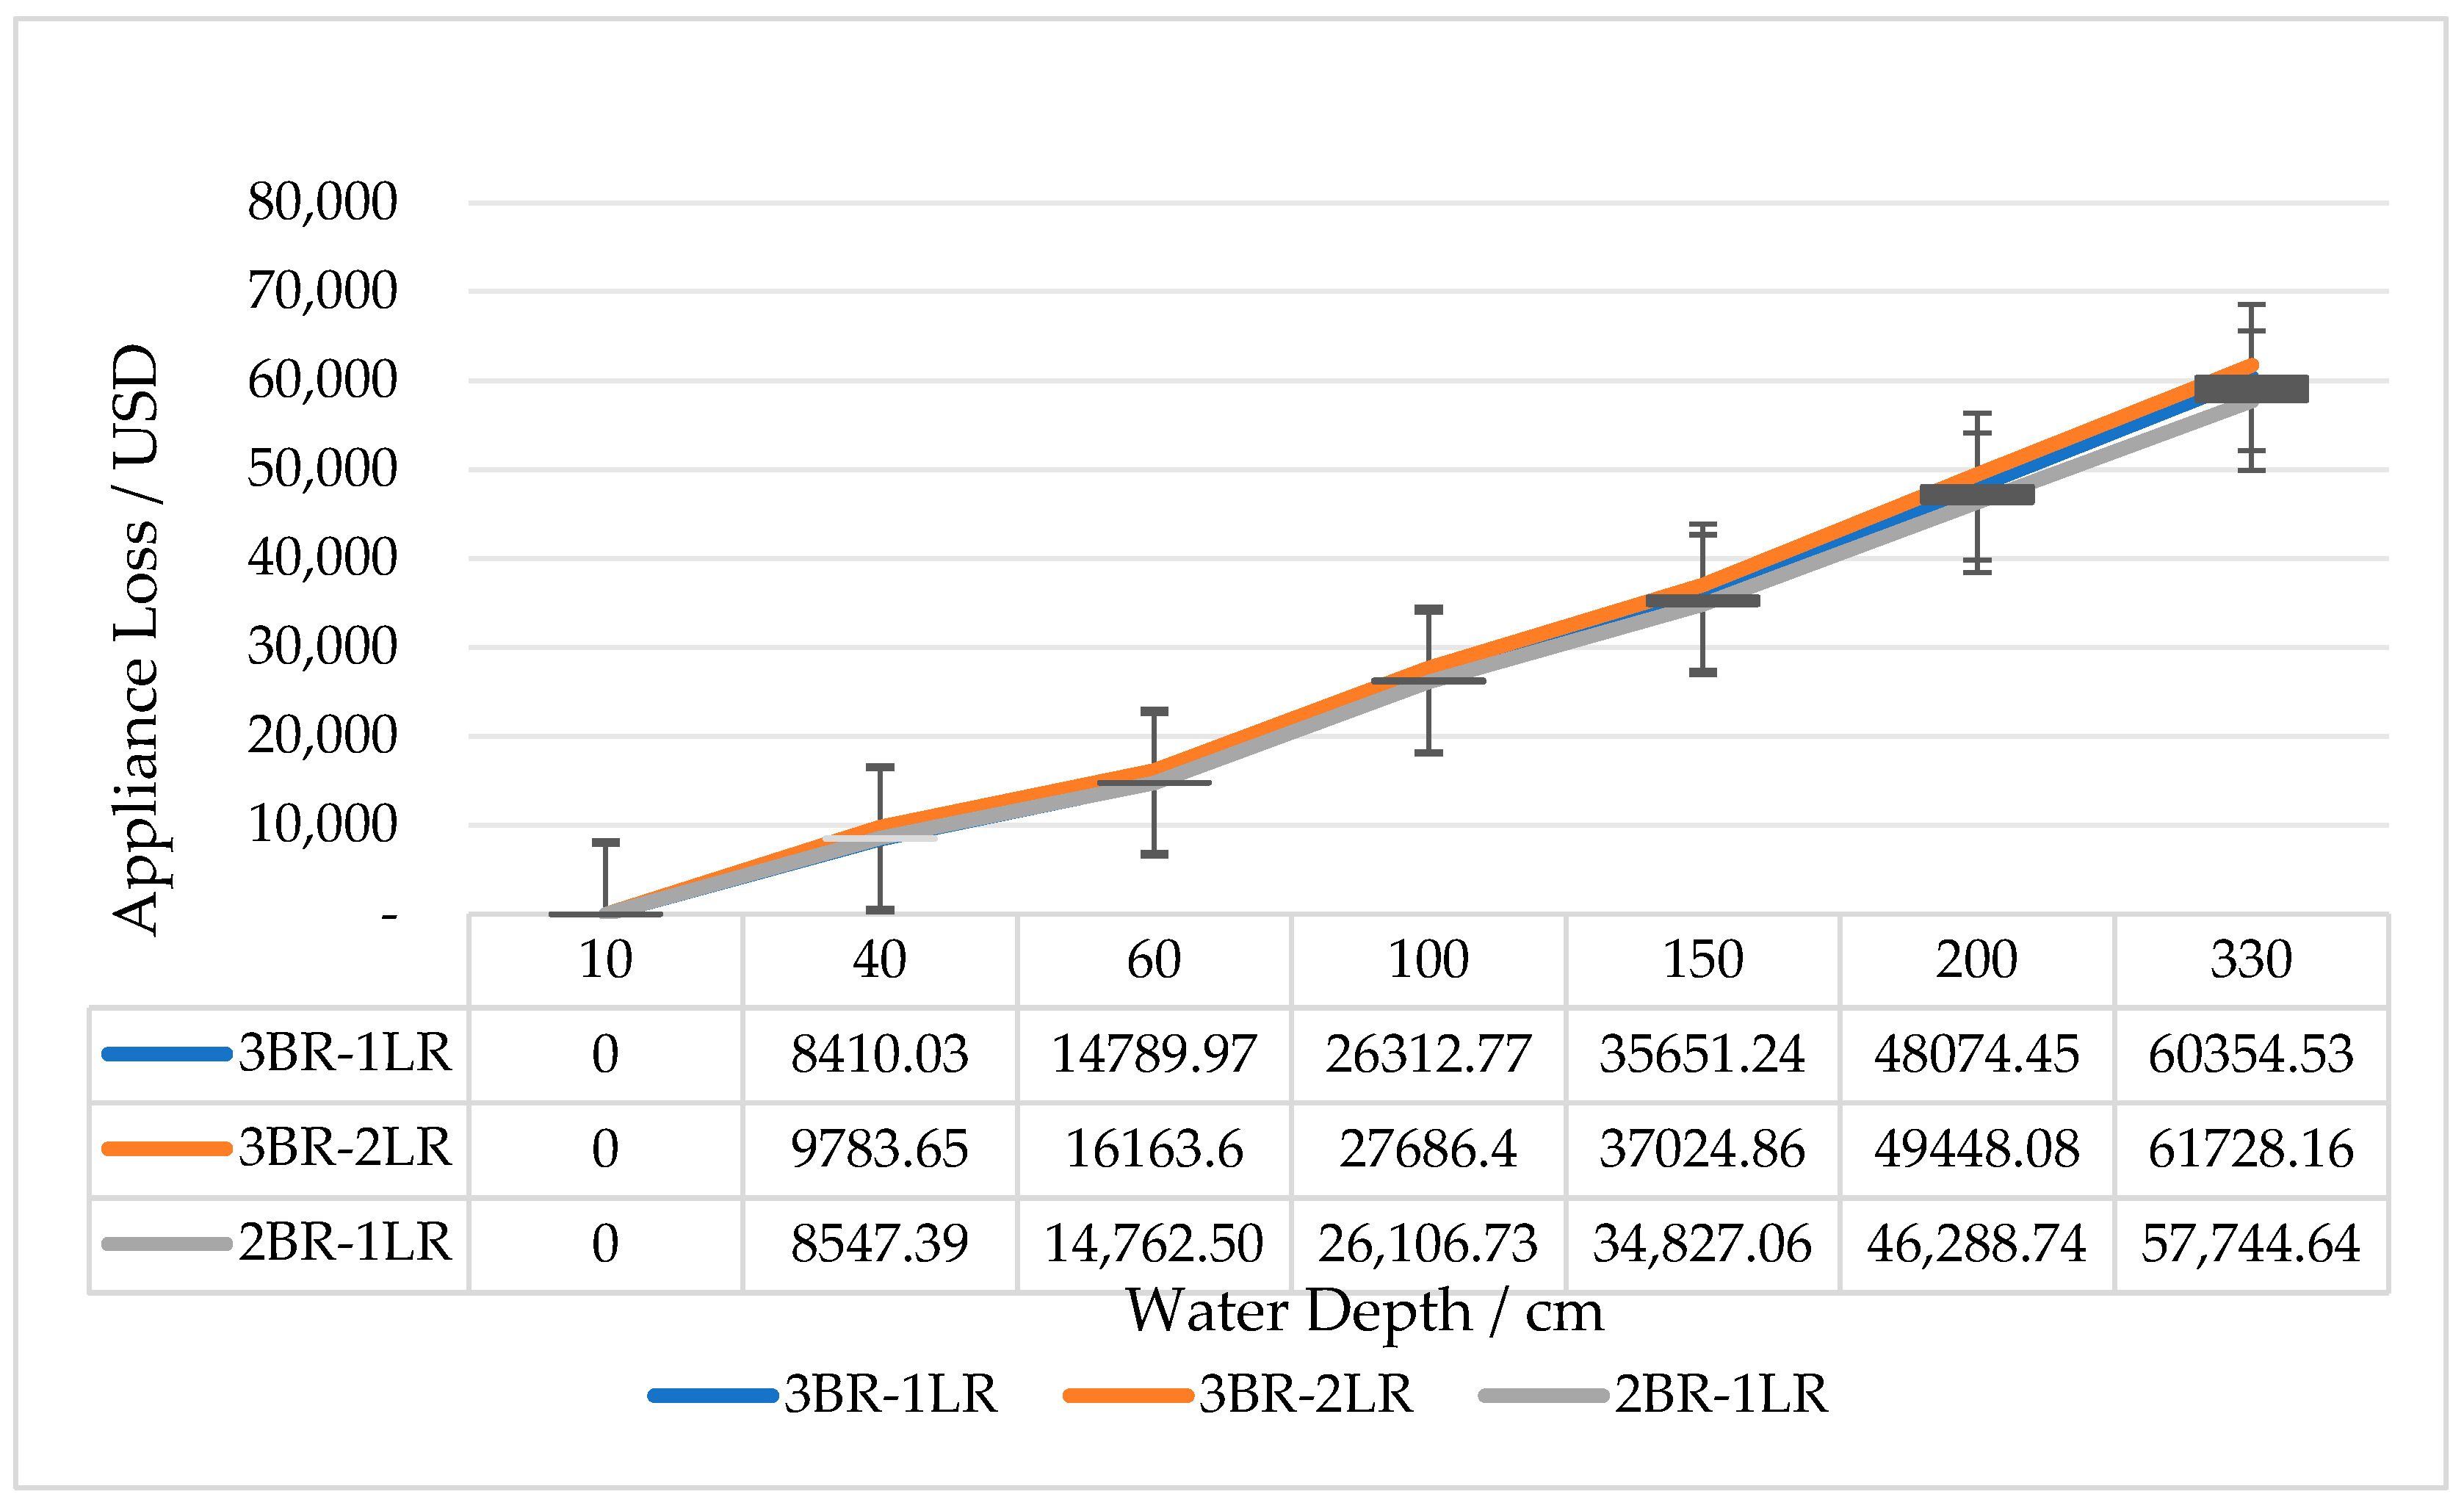
Eight residential buildings were selected as samples, with a total floor area of 16,517 m2. The housing types include three-bedroom and one-living-room, two-bedroom and one-living-room, and three-bedroom and two-living-room units. Damage estimates were calculated for different water depths, considering losses in decoration, home appliances, furniture, and temporary resettlement:
Decoration loss: Significant damage occurs above 30 cm, with a maximum loss ranging from USD 10,989 to USD 22,670.
Home appliances: Partial damage starts at 40 cm, and most devices are considered fully destroyed above 200 cm; total loss estimated at USD 41,209–USD 54,945.
Furniture: Low-positioned furniture begins to suffer at 40 cm; total loss at 330 cm, estimated at USD 10,989–USD 16,484.
Temporary resettlement: Estimated based on 15/45/105 days of relocation, ranging from USD 577 to USD 4041 per household.
Using asset value, vulnerability thresholds, and water depth levels, a component-based cumulative estimation method [
27] was applied to construct the estimation function:
where
is the total loss (¥),
is the asset value of type i, and
is the damage function of asset
i at water depth
h. Representative results are shown in
Table 2, reflecting direct economic losses for three housing types at various inundation depths.
Based on the above estimates, depth–damage curves were developed for the three housing types. As shown in
Figure 5, the loss increases nonlinearly with water depth, validating the rationality of the model.
3.2.2. Commercial Depth–Damage Curve
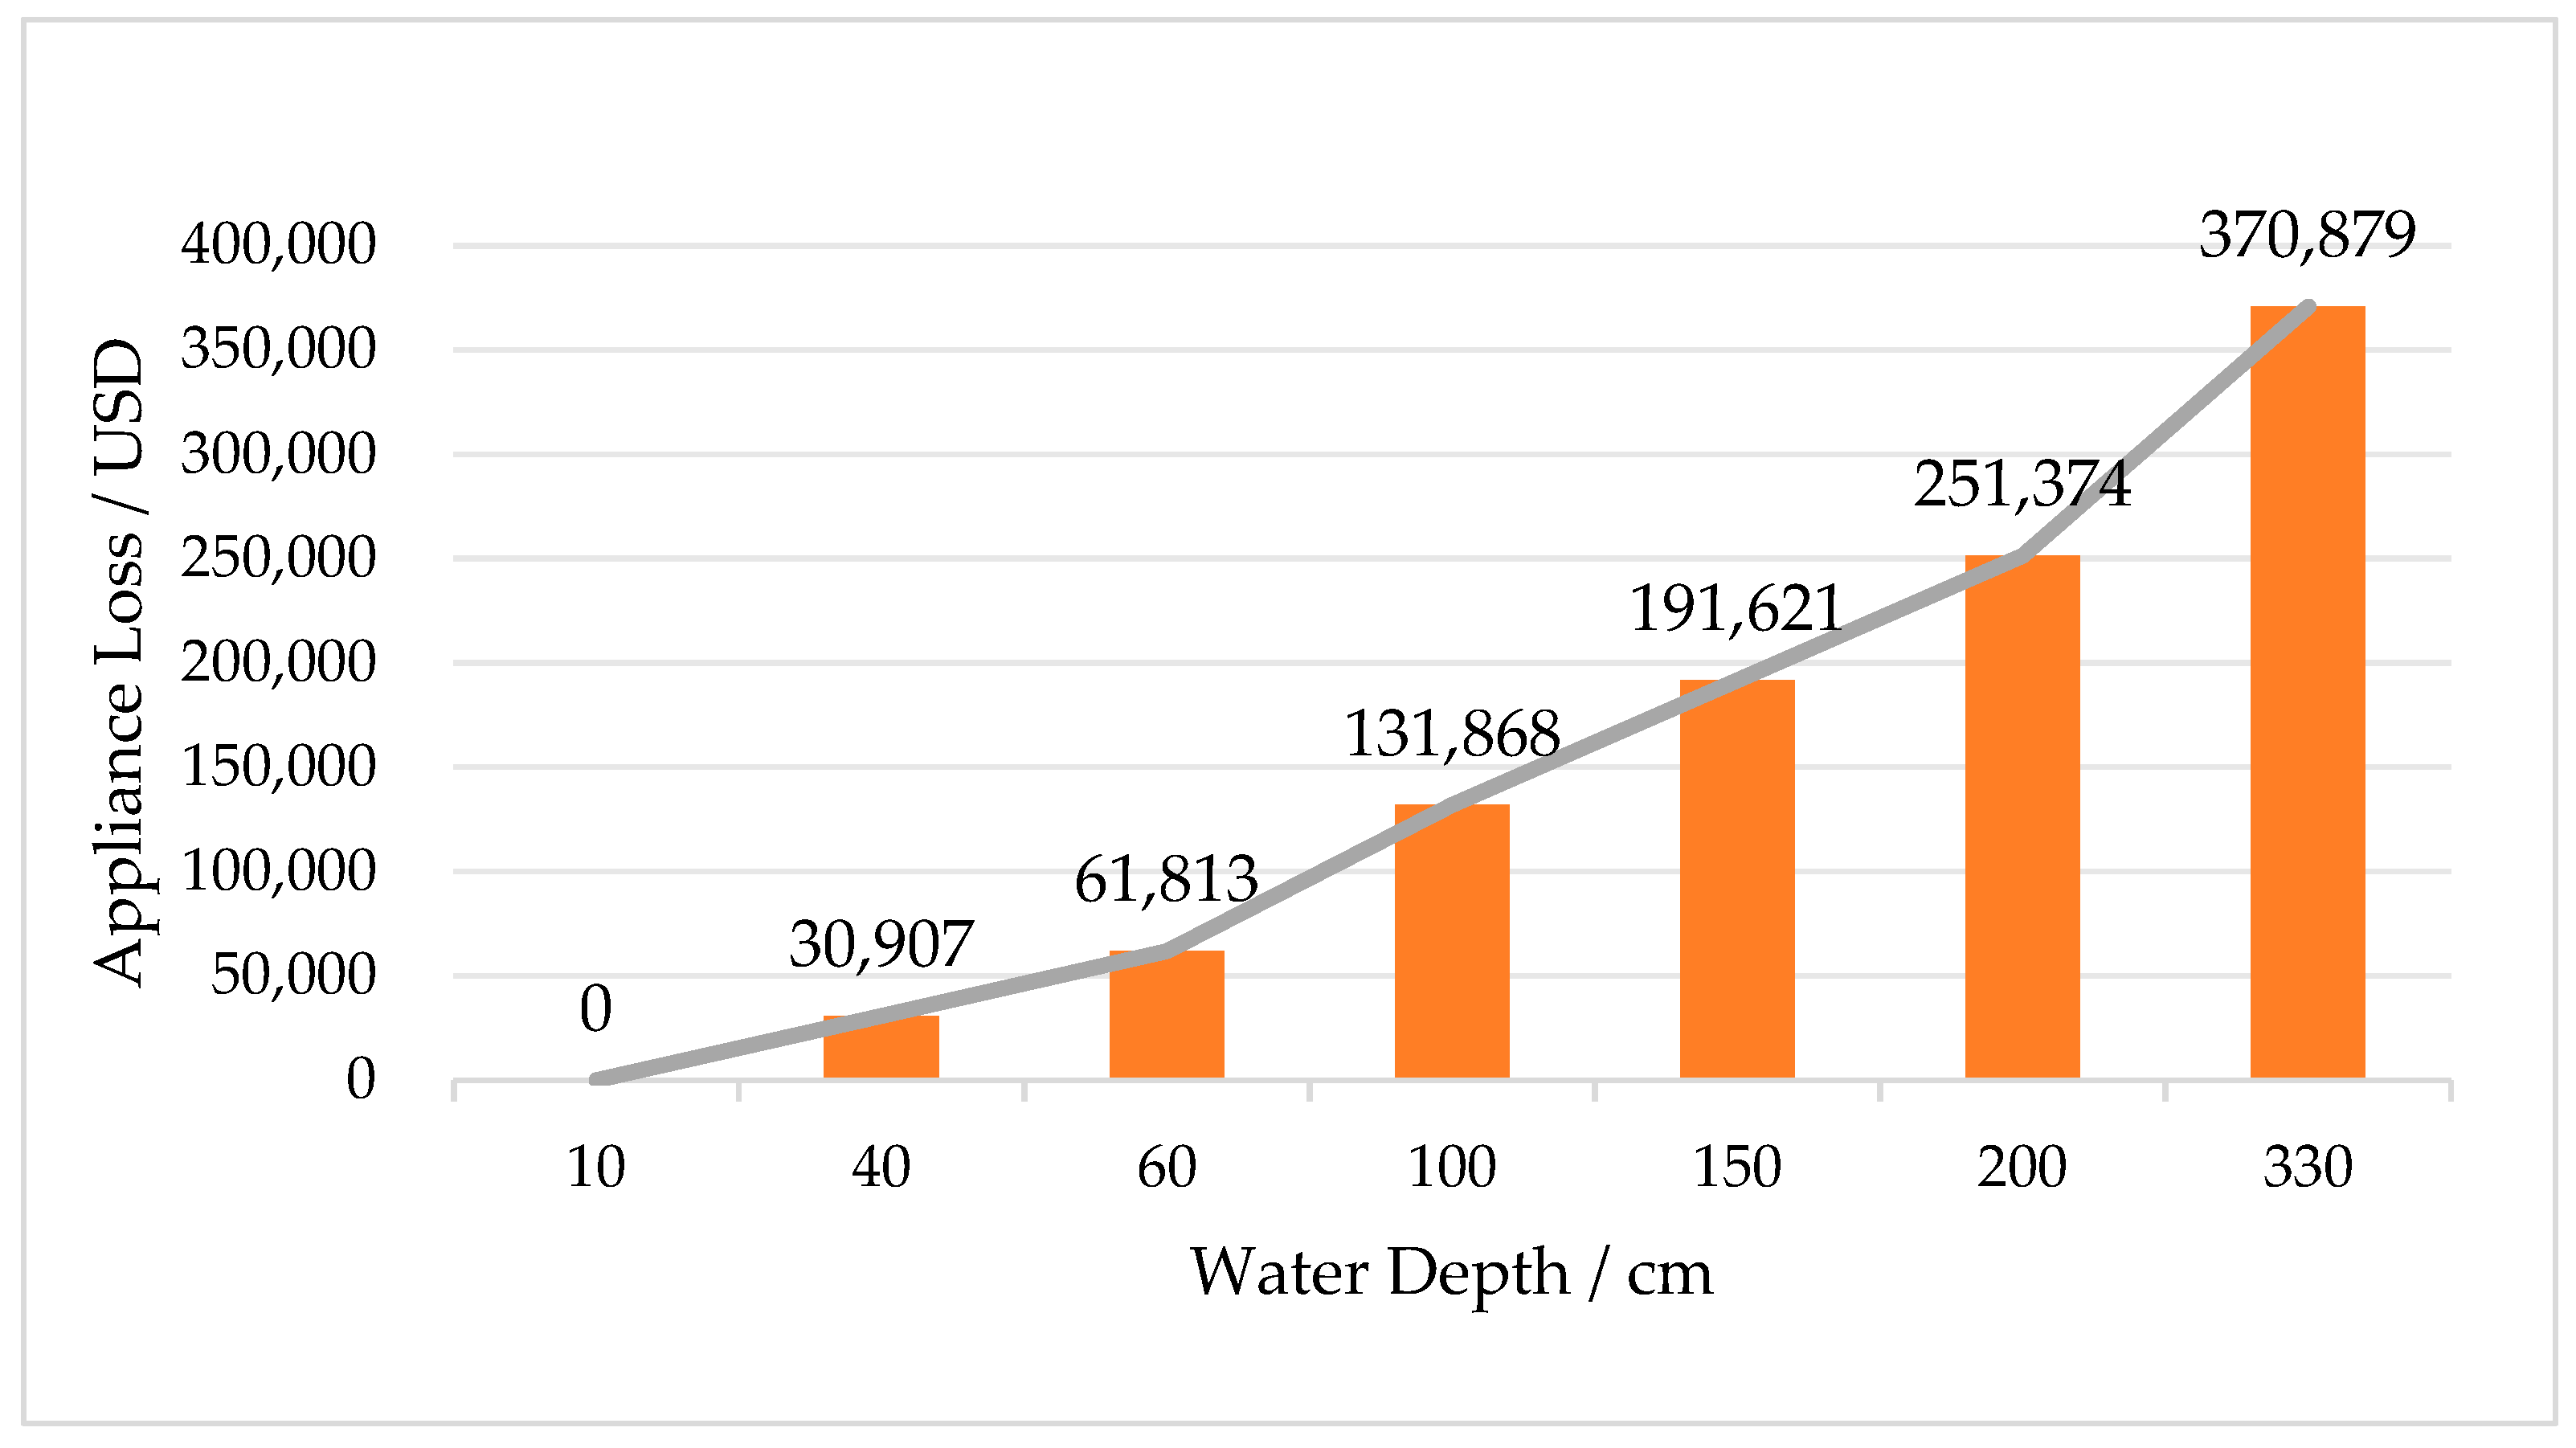
Taking the underground supermarket as a case study, different functional zones were identified. Asset categories such as inventory, elevators, power generators, and air conditioning systems were weighted by their respective proportions. Damage estimation was performed using a rule-based cumulative estimation. Asset vulnerability is highly sensitive to waterlogging depth, with two loss inflection points identified at 100 cm and 330 cm. See
Table 3 for detailed estimations.
As shown in
Figure 6, the underground supermarket suffers a near-total asset loss at 100 cm, and at 330 cm, complete reconstruction is necessary. The loss curve shows a sharp increase beyond these thresholds.
This functional differentiation represents a central innovation because: (i) residential losses exhibit progressive accumulation (
Figure 5), while commercial losses show threshold effects (
Figure 6); (ii) existing models [
19,
20] typically apply uniform curves, overestimating commercial losses by 23 ± 5% and underestimating residential losses by 17 ± 8% in validation cases; (iii) sector-specific curves reduce aggregate error from 15.2% to 4.8% (
Section 3.4), critical for insurance pricing and disaster funds allocation.
3.3. GIS-Based Loss Estimation and Automation
3.3.1. ArcPy Automated Calculation Workflow
This study developed an urban building loss estimation model based on a hybrid workflow combining ArcGIS Pro 3.0 and Python 3.6 scripting. The overall process consists of three main steps. First, data preprocessing was conducted to unify coordinate systems, attribute structures, and measurement units (e.g., converting building heights into meters), thereby ensuring data consistency across sources. Second, waterlogging depth was calculated by subtracting the terrain elevation from waterlogging surface elevation, using the processed DEM to obtain the average inundation depth of each building (as shown in Equation (4)). This automated procedure, implemented through ArcPy scripting, allowed for batch processing of thousands of buildings while minimizing manual intervention. Finally, the waterlogging loss value for each building was estimated by applying the corresponding depth–damage curve according to its building type. By aggregating the loss estimates of all individual buildings, the total economic loss for the study area was obtained. Compared with traditional manual workflows, this integrated GIS-Python approach not only improves computational efficiency but also enhances reproducibility and scalability for large-scale urban applications.
Here, is the simulated waterlogging elevation and is the digital elevation model value.
3.3.2. Loss Estimation Algorithms
Based on the “depth–damage” curve, slope values for different waterlogging stages are extracted to build a piecewise linear loss model.
Table 4 shows the fitted parameters for each water depth interval. A compensation mechanism is introduced for extreme water depths.
In commercial loss calculations, if the water depth exceeds the building height, an excess-depth compensation factor is applied. The total loss is computed using:
where
is the excess-depth compensation coefficient. The residential model assumes a floor height of 3.3 m, with the ground floor assigned the highest weight. Loss is calculated floor by floor and summed. If the waterlogging depth is insufficient to submerge a full floor, it is scaled proportionally. The loss function is defined in the following:
where
n denotes the floor index based on depth,
is the existence indicator function (1 if depth ≥ floor height; otherwise 0).
, and
denote empirically the coefficients based on asset damage patterns.
The ArcPy script calls the ZonalStatistics tool to calculate the average inundation depth for each building. Based on building use type, the corresponding loss model is applied, and the results are dynamically written to the attribute table.
Two types of outputs are generated by the model, as seen in
Table 5. (1) Spatial Data: Includes waterlogging depth raster (.TIFF) and building loss vector layer (.SHP), containing attributes such as ID, type, depth, height, and loss value. (2) Statistical Reports: Includes detailed loss records for individual buildings and aggregated summaries for different building types (.xlsx).
3.4. Model Validation
The proposed loss estimation models were validated using two representative buildings: one commercial building and one residential apartment (three-bedroom and two-living room type). For the commercial building, the original model achieved a MAPE of 10% (overestimation by 10%, MAE = USD 10,080), as seen in
Table 6. For the residential building, the original model achieved a MAPE of 3% (underestimation by 3%, MAE = USD 650).
After parameter adjustment, including secondary fitting of the extreme-depth loss coefficient for commercial buildings and residual-depth proportion adjustment for residential buildings, the MAE for both building types was reduced to within USD 5000, with the MAPE not exceeding 5%. These results indicate that the model achieves an acceptable level of accuracy for large-scale waterlogging loss simulations.
3.5. Summary
This chapter established depth–damage curves for both residential and commercial buildings based on field surveys, asset structure analysis, and hydrodynamic simulation results. The residential model adopted a layered cumulative approach, accounting for the progressive increase in damage with water depth across different building components. The commercial model emphasized asset sensitivity differences between functional zones, especially the sharp increase in losses when water depths exceed critical thresholds. The validation process confirmed that the models provide sufficiently accurate loss estimates for integration into a GIS-based automated assessment framework.
4. Result
4.1. Total Economic Losses
Based on the validated models, the following section presents the total economic loss estimates. Under the 50-year rainfall scenario, the total estimated economic loss in the Lixia District reached 327.88 million USD, with residential buildings accounting for 290.51 million USD (88.6%) and commercial buildings for 37.37 million USD (11.4%) (
Table 7).
Residential buildings (n = 13,105) experienced an average loss of 22,176.10 USD per building, with the highest single-building loss recorded at 57,731.87 USD for a three-bedroom, two-living-room unit. Commercial buildings (n = 2212) suffered an average loss of 16,901.10 USD per building, and underground supermarkets showed the highest vulnerability, with a maximum single-building loss of 251,373.63 USD.
All monetary values are expressed in USD, converted from CNY using the exchange rate stated in the Abstract.
4.2. Spatial Distribution of Waterlogging Losses
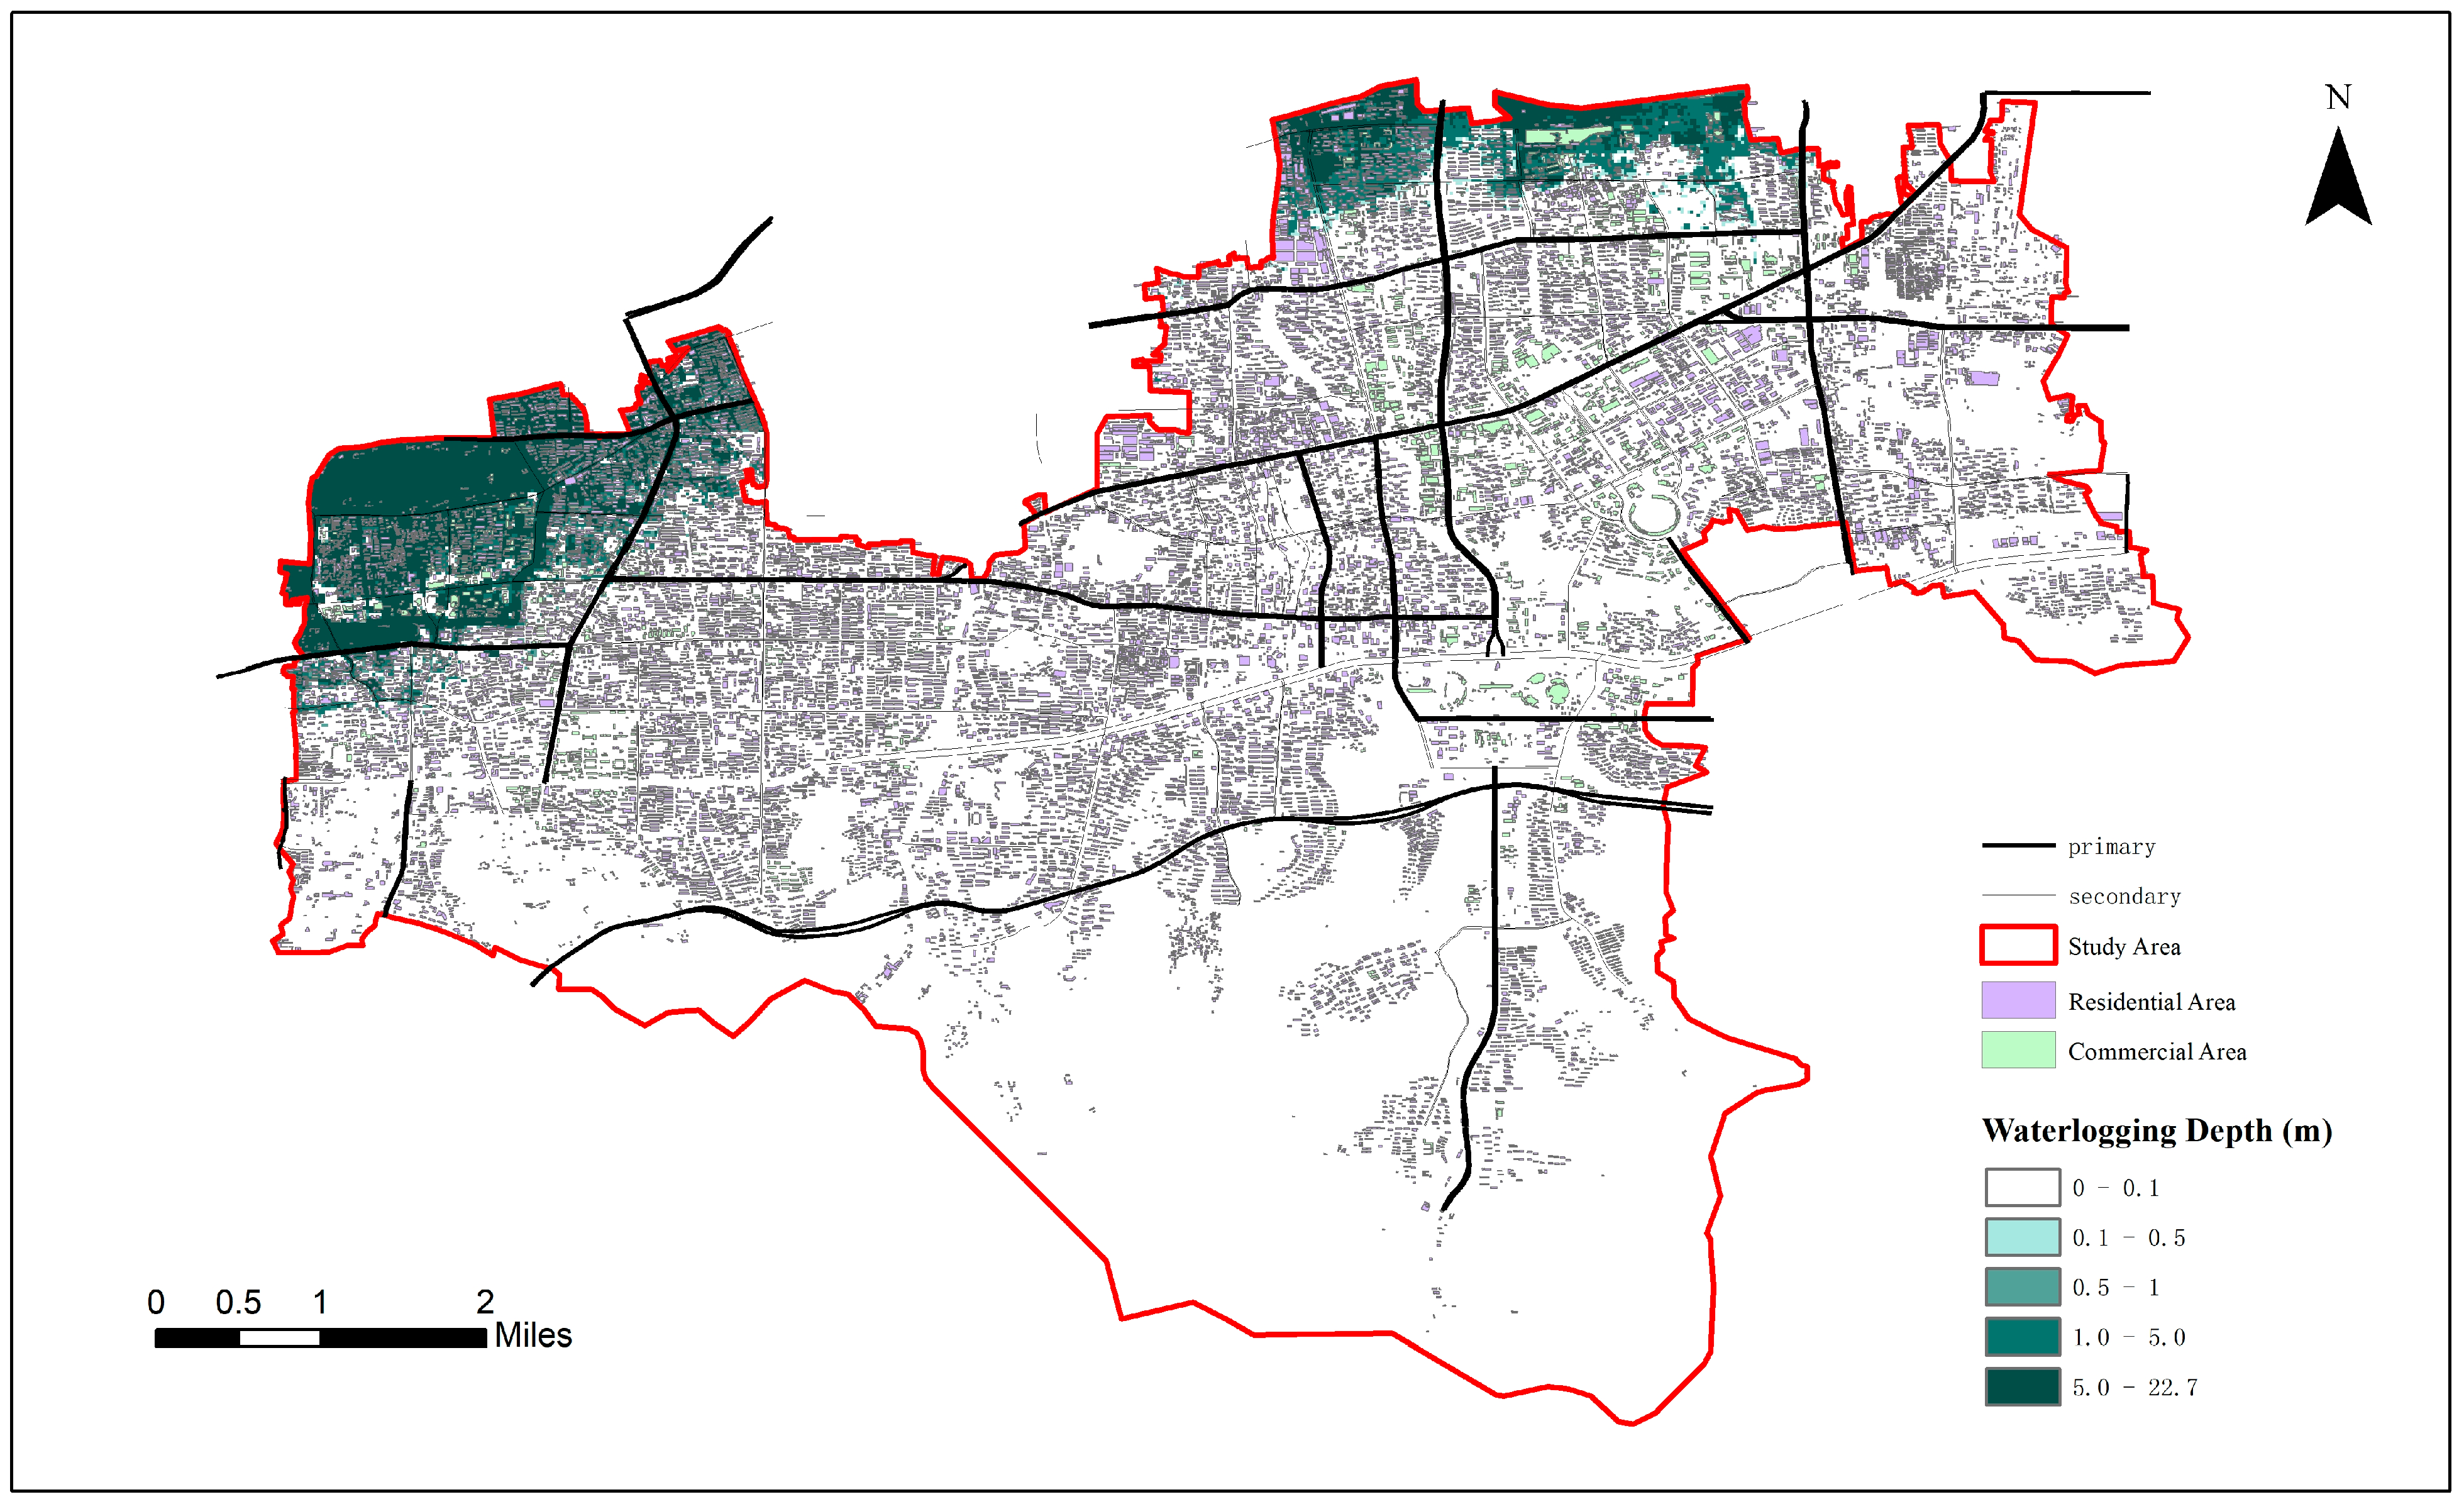
A waterlogging elevation of 35.5 m was used to simulate water accumulation during a 50-year rainfall event. Results showed high inundation zones concentrated in low-lying areas in the northwest, with maximum water depth reaching 15 m. A threshold of 0.1 m was set, values below this were excluded from damage calculations. The spatial distribution is shown in
Figure 7.
The spatial heatmap of building losses (see
Figure 8) revealed that high-risk areas were concentrated in low-lying northwest zones. This spatial concentration of waterlogging hazards is closely related to the underlying topography and drainage system configuration, suggesting that further analysis is needed to understand the driving factors behind these patterns, such as those around Daming Lake, where average water depths exceeded 1.2 m, and single-building residential losses surpassed USD 41,208.79.
In commercial areas, losses were concentrated in underground facilities and large malls (e.g., Yinzuo Mall), where mechanical and electrical equipment is highly vulnerable. Once water depths exceeded one m, damage increased sharply.
4.3. Comparison Among Building Types
Residential losses varied by housing layout and interior quality. Three-bedroom, two-living-room units had the highest average loss (USD 25,051.65), while two-bedroom units averaged USD 20,000.00.
In commercial buildings, loss per unit area increased significantly once water depth exceeded one m due to large-scale equipment and inventory damage. Loss intensity in underground commercial spaces was 3.2 times higher than in aboveground structures.
4.4. Model Implementation Summary
This chapter developed a GIS-based building loss estimation model driven by spatial analysis and Python scripting. The model achieves full automation of data standardization, waterlogging depth extraction, loss model matching, and result visualization. Residential losses are estimated using a floor-by-floor cumulative model, while commercial losses are estimated via rule-based piecewise loss functions. The model validation showed an error margin within ±5%, demonstrating strong applicability and scalability. This provides a technical foundation for building-level loss assessments across the entire study area.
5. Discussion
5.1. Comparison with Existing Studies
Urban flood inundation and loss assessment methodologies have evolved significantly, primarily branching into detailed hydraulic simulations and GIS-based empirical estimations. This study proposes a novel, automated GIS-based framework that integrates high-resolution DEM data and building-level asset structures to achieve rapid and accurate loss assessment. To clearly position our contribution, a comparative analysis against representative previous studies is essential [
33].
Traditional hydrodynamic models, such as the one developed by Xu et al. [
13], solve the full St. Venant equations to simulate complex flow regimes (e.g., pressure flow, backwater flow) in drainage networks. Applied in Shanghai, such models can accurately simulate surcharge conditions and identify flooding nodes with high physical fidelity [
34]. However, their application is constrained by formidable data requirements, including detailed pipe network geometry, roughness coefficients, and extensive hydrological calibration. Computationally, simulating a single storm event for a district-scale area can take several hours even on high-performance PCs, making them less feasible for rapid scenario testing or cities lacking complete sewer data [
9,
34].
GIS-based methods offer a powerful alternative by leveraging spatial analysis to overcome data scarcity. Early approaches, like the one presented by Zhu [
13], utilized a DEM and a single observed water level or peak discharge value to simulate inundation extent and depth for a historical flood event. While this method is straightforward and efficient, its accuracy is highly dependent on the quality and representativeness of the single input hydrological data point. It primarily provides a static snapshot of one scenario and lacks an integrated, automated workflow for translating water depth into economic loss estimates for individual buildings [
13].
Other GIS approaches focus on multi-factor risk indexing. The study by Li et al. [
35] in Zhengzhou City employed an Analytic Hierarchy Process (AHP) to weigh various hazards, vulnerability, and exposure factors (e.g., rainfall, slope, population density, and GDP) to create a spatial flood risk index. This method effectively maps relative risk trends over time and identifies high-risk zones at a regional scale. Nevertheless, its output is a unitless risk index rather than a physical water depth or a quantitative economic loss value, limiting its direct application for concrete loss estimation and cost–benefit analysis of mitigation measures [
1,
36].
Our framework is designed to bridge these gaps by adopting a data-driven, physically plausible yet highly efficient approach. Unlike the model in [
36], we bypass the need for sewer network data entirely by using a volume-matching algorithm on a high-resolution DEM to estimate inundation depth, making it instantly applicable in data-scarce environments. Compared to the method in [
13], our model incorporates rainfall-runoff transformation using land-cover-specific coefficients (
Section 3.1.3) to generate water depth from design rainfall, freeing it from dependency on historical flood records and enabling scenario-based analysis. Crucially, we advance beyond both [
1] and [
13] by fully integrating the inundation simulation with an automated, building-scale economic loss assessment engine using differentiated depth–damage functions for residential and commercial assets.
The quantitative advantages of our framework are summarized in
Table 8. For instance, while the hydrodynamic model [
35] offers high accuracy, it requires unavailable sewer data for most Chinese cities [
11]. The AHP risk mapping method [
1], while scalable, provides a qualitative risk index rather than a quantitative loss value. Our method achieves a critical balance: it provides building-specific loss estimates (e.g., total loss of USD 327.88 million for the Lixia District) with an error margin (<5% MAPE) comparable to complex models, but with the computational efficiency (2.5 h for 15,317 buildings) and minimal data requirements (only a DEM and building vectors) of a GIS-based approach. This unique combination of precision, automation, and scalability addresses a significant methodological gap in urban flood risk management.
5.2. Residential vs. Commercial Loss Functions
A central innovation of this study lies in the explicit differentiation of residential and commercial building loss functions. For the residential sector, data were sourced from real-estate platforms and complemented by on-site surveys, which revealed that the study area primarily consists of three typical apartment layouts: three-bedroom and one-living room (120 m2), two-bedroom and one-living room (100 m2), and three-bedroom and two-living room (140 m2), all characterized as reinforced concrete frame structures. Consequently, residential losses were modeled to include expenses related to flooring and wall refurbishment at different inundation depths, repair or replacement of household appliances, and temporary resettlement costs for affected residents. Each cost component was parameterized based on local consumption levels, household appliance penetration rates, and official government reports, ensuring a realistic representation of potential losses. By contrast, commercial facilities, such as underground supermarkets, were modeled using a rule-based piecewise loss function approach that accounted for inventory damage, elevator malfunction, power generator failure, and air-conditioning equipment loss. This dual-structured framework improves model applicability by capturing the heterogeneous vulnerability of urban assets and highlights the importance of distinguishing residential and commercial contexts in waterlogging risk assessments.
5.3. Limitations
Despite promising results, the model has several limitations that introduce specific biases and should be considered:
Exclusion of Drainage Networks: The model simulates pluvial waterlogging based on surface topography and rainfall volume, omitting the capacity of underground drainage systems to retain or convey stormwater. This simplification likely leads to an overestimation of inundation depth and duration in well-serviced areas with efficient drainage, while potentially underestimating waterlogging in locations where network congestion or failure is the primary cause of inundation. Although the calculation of effective runoff area using distributed coefficients (
Section 3.1.3) considers surface infiltration—a key advancement over simpler models—it does not capture the dynamic interaction between surface and subsurface flow.
Static Rainfall Scenarios: The use of a spatially uniform design rainfall event lacks the dynamic spatiotemporal distribution of real storms. This fails to capture the concentrating effect of rainfall cores and the critical timing of peak intensity, which are key drivers of waterlogging peak and extent. Consequently, the model may misrepresent the actual spatial pattern and severity of waterlogging.
Focus on Direct Physical Damage: The assessment is confined to direct structural and content damage. It excludes indirect socio-economic losses such as business interruption, supply chain disruptions, and emergency response costs, which can be substantial [
35,
36]. This results in a systematic underestimation of the total economic impact.
Data Precision: Limitations in DEM accuracy and building use classification could propagate errors into the loss assessment [
37]. Specifically, while the one m DEM used in this study was refined from public sources and controlled for vertical errors (<5%), it may still lack the resolution to capture critical micro-topographic features such as road curbs, small drainage ditches, or building entrance steps. These features can significantly influence local flow paths and ponding patterns, meaning their omission could lead to an over-simplification of inundation extent and depth in complex urban environments.
5.4. Spatial Patterns and Risk Insights
The spatial distribution of waterlogging impacts in the study area reveals a distinct concentration of high-risk zones in the northwest low-lying regions. This pattern can be explained by the combined influence of urban topography, drainage infrastructure, and socio-economic conditions. First, the northwest is characterized by concave terrain and relatively low elevation, which naturally facilitates water accumulation and prolongs inundation during rainstorm events. Second, the drainage system in this area is comparatively underdeveloped, with fewer underground pipelines and limited capacity, making it less effective in discharging stormwater than the central and eastern districts. Third, this part of the city contains a higher proportion of older residential communities, many of which lack waterlogging infrastructure and exhibit lower adaptive capacity. These socio-economic vulnerabilities further exacerbate exposure and hinder post-waterlogging recovery. Together, these factors explain why the northwest experiences disproportionately severe losses compared with other parts of the district.
The dominance of residential losses (88.6% of the total) is not only a function of their numerical majority (85.3% of all buildings) but also reflects their higher aggregate vulnerability. Unlike commercial properties, which may be owned by corporations with greater financial resilience, residential losses are directly absorbed by households, potentially causing severe long-term socioeconomic distress. This finding underscores a critical equity dimension in urban waterlogging risk. From a planning perspective, these insights necessitate targeted policy interventions. Firstly, urban renewal programs should prioritize the drainage upgrades and resilient retrofitting of aging residential communities in low-lying areas. Secondly, the development of localized waterlogging insurance mechanisms or government disaster relief funds should be accelerated to mitigate the financial impact on vulnerable households. Finally, land-use planning should strictly limit the construction of new high-density residential zones in topographical depressions without first implementing robust blue-green infrastructure systems for stormwater retention and discharge. From a planning perspective, these insights underscore the need for targeted drainage upgrades, resilient retrofitting of old residential areas, and community-level disaster preparedness to strengthen urban resilience.
5.5. Model Automation and Practical Applications
Automation via ArcPy scripts significantly reduces computational costs and manual intervention, ensuring reproducibility and scalability. This opens a clear pathway for practical implementation:
Integration with Municipal GIS: The framework can be embedded into existing urban digital governance platforms. Municipalities could establish a routine whereby forecasted rainfall data are automatically fed into the model to generate pre-event waterlogging risk heatmaps, guiding the pre-positioning of emergency resources.
Linking to Insurance Sector Workflows: Insurance companies could adopt this tool for rapid post-disaster loss assessment and claims verification. The building-level loss estimates provide a transparent, data-driven basis for pricing waterlogging insurance products and assessing portfolio risk.
Supporting Community-Based Waterlogging Preparedness: The model’s outputs, particularly spatial heatmaps of risk and loss, can be simplified and disseminated to communities via public portals or mobile apps. This empowers residents to understand their exposure and participate in grassroots resilience planning.
By combining building-level precision with operational efficiency, the model offers a practical toolkit for informed decision-making in data-limited urban environments, moving beyond academic research into the realm of operational utility.
5.6. Limitations and Future Research
Despite promising results, the model has several limitations. It does not explicitly account for underground drainage networks or dynamic spatiotemporal rainfall distributions, which could bias predictions. Additionally, the current framework focuses on direct physical asset damage, excluding indirect socio-economic losses, human safety, and traffic disruption. Future work could couple the GIS-based model with hydrodynamic simulations, integrate real-time meteorological and remote sensing data, and expand the damage assessment to incorporate indirect impacts. Such extensions would enhance predictive accuracy, broaden applicability, and strengthen resilience planning for diverse urban contexts, including low-income regions with limited data infrastructure.
Future work could couple the GIS-based model with hydrodynamic simulations to integrate the effects of drainage networks. However, this integration presents significant challenges, including: (i) the substantial data requirements for detailed sewer network parameters (e.g., pipe dimensions, slope, and roughness) which are often incomplete or unavailable; (ii) the high computational costs associated with dynamic hydraulic simulations, which would drastically increase processing time from hours to potentially days for large urban areas; and (iii) the complexity of achieving stable and mass-conservative coupling between the GIS surface model and the 1D subsurface flow model. Therefore, such a coupled approach, while physically more comprehensive, is currently most feasible for critical sub-catchments where data can be intensively collected, rather than for immediate district-wide application. Furthermore, to overcome the limitations of medium-resolution DEMs, future research should integrate high-resolution topographic data derived from LiDAR or UAV-based photogrammetry. These technologies can provide centimeter-level accuracy and capture essential urban micro-topography, drastically improving the precision of flow routing and waterlogging depth estimation at the building footprint scale.
Furthermore, the current model operates deterministically. Future research could significantly strengthen the reliability and interpretability of the results by incorporating uncertainty quantification techniques. This could involve performing sensitivity analysis on key input parameters (e.g., runoff coefficients and asset values within depth–damage functions) to identify the most influential factors. Additionally, implementing Monte Carlo simulations to propagate the uncertainty from these inputs through the entire modeling chain would provide a probabilistic range of loss estimates, offering a more robust and informative assessment for decision makers under different waterlogging scenarios.
Finally, a critical reflection on the framework’s adaptability is warranted. While the model is designed to be lightweight and relies on openly accessible data (DEMs and building vectors), its application in diverse urban contexts, particularly in low-income regions, faces challenges. The accuracy of building-level loss estimation is contingent upon the quality of input data. In regions with weaker geospatial data infrastructures, building footprints and classification (residential/commercial) may be incomplete or inaccurate, potentially propagating errors into the loss assessment. Furthermore, the depth–damage functions developed for Jinan may not be directly transferable to regions with vastly different construction standards, material costs, or building typologies (e.g., informal settlements). The framework’s core strength—automation and scalability—remains valid, but its effective application requires initial local calibration. This involves adapting the depth–damage curves to local economic conditions and building practices, which can be achieved through targeted field surveys or collaboration with local insurance claims data. Thus, the framework is best viewed as an adaptable toolkit rather than an off-the-shelf solution, with its implementation success being highest when coupled with local knowledge and calibration efforts.
6. Conclusions
A GIS-based urban waterlogging loss assessment framework is developed that integrates high-resolution DEM data and building-level asset structures. The framework was designed to overcome key limitations in existing GIS-based approaches, namely the lack of asset-type differentiation and building-level resolution. Using the Lixia District of Jinan City as a case study, the model demonstrated automation in rainfall scenario generation, water volume simulation, and economic loss estimation, with strong practical applicability and scalability. The key conclusions are:
(1) An automated waterlogging depth calculation model was developed, integrating rainfall intensity, runoff coefficients, and a volume iteration algorithm, supporting one m-resolution DEM inputs for accurate waterlogging simulation at the community scale.
(2) Depth–damage functions for residential and commercial buildings were constructed based on sample communities and underground retail facilities, refining asset categories to include interior finishes, furniture, appliances, and inventory.
(3) Two GIS-based loss models were established: a layered cumulative approach for residential units and rule-based piecewise loss functions for commercial buildings. Both models support automated matching to inundation depth and demonstrated error margins within ±10%.
(4) Full-district application under a 50-year storm scenario estimated total losses at USD 327.88 million, with residential buildings accounting for 88.6%. High-risk areas were found in low-lying northwest regions, and the highest per-unit losses occurred in three-bedroom apartments and underground commercial spaces.
Overall, the proposed framework provides reliable data and methodological support for waterlogging risk identification, emergency response planning, post-disaster assessment, and insurance estimation. As demonstrated in the comparative analysis, it offers a practical alternative to computationally intensive hydrodynamic models and coarse empirical GIS methods, particularly in contexts where detailed infrastructure data are lacking. Future enhan cements should focus on dynamic forecasting capabilities using real-time rainfall, pipe network models, and remote sensing integration. Future enhancements will also explore the integration of uncertainty methods, such as Monte Carlo simulation, to provide probabilistic risk assessments.
