Article

Representing Small Shallow Water Estuary Hydrodynamics to Uncover Litter Transport Patterns

1
Institut Supérieur Industriel de Bruxelles, Haute Ecole Bruxelles-Brabant (ISIB, HE2B), Bd Louis Schmidt 2, 1040 Brussels, Belgium
2
Deltares, Boussinesqweg 1, 2629 HV Delft, The Netherlands
3
Centro Interdisciplinar de Investigação Marinha e Ambiental (CIIMAR/CIMAR), Universidade do Porto, Terminal de Cruzeiros do Porto de Leixões, Av. General Norton de Matos s/n, 4450-208 Matosinhos, Portugal
4
Departamento de Biologia, Faculdade de Ciências, Universidade do Porto, Rua do Campo Alegre s/n, 4169-007 Porto, Portugal
*
Author to whom correspondence should be addressed.
Water 2025, 17(18), 2698; https://doi.org/10.3390/w17182698
Submission received: 9 July 2025 / Revised: 31 August 2025 / Accepted: 5 September 2025 / Published: 12 September 2025
(This article belongs to the Special Issue Marine Plastic Pollution: Recent Advances and Future Challenges)

Abstract

Plastic pollution is an increasing global concern, with estuaries being especially vulnerable as transition zones between freshwater and marine systems. These ecosystems often accumulate large amounts of waste, affecting wildlife and water quality. This study focuses on analysing the circulation patterns of the Ave Estuary, a small, shallow system on Portugal’s north-western coast, and their influence on litter transport and distribution. This site was selected for installing an aquatic litter removal technology under the EU-funded MAELSTROM project. A 2DH hydrodynamic model using Delft3D FM, coupled with the Wflow hydrological model, was implemented and validated. Various scenarios were simulated to assess estuarine dynamics and pinpoint zones prone to litter accumulation and flood risk. The results show that tidal action and river discharge mainly drive the estuary’s behaviour. Under low discharge, floating litter should be mostly transported toward the ocean, while high discharge conditions should result in litter movement at all depths due to stronger currents. High water levels and flooding occur mainly upstream and in specific low-lying areas near the mouth. Low-velocity zones, which can favour litter accumulation, were found around the main channel and on the western margin near the estuary’s mouth, even during high flows. These findings highlight persistent accumulation zones, even under extreme event conditions.

1. Introduction

Estuaries, as transitional zones between rivers and oceans, are particularly vulnerable to litter accumulation due to their location and hydrodynamic patterns that can trap sediments and pollutants [1]. The convergence of freshwater and saltwater environments in estuaries leads to litter deposition, often carried from upstream sources and urban runoff, with severe consequences, affecting water quality, wildlife, and the overall health of the ecosystem. While various materials contribute to this litter, plastic is the most prevalent, making it a significant concern for environmental management of transitional water ecosystems. Due to its durability, lightweight, and corrosion resistance, plastic is widely used in numerous applications. However, these properties, combined with widespread consumption, rapid disposal and inadequate recycling of plastic waste, generate a global problem with harmful effects on the aquatic organisms, causing injury, impaired growth, or even death [2,3,4].
Furthermore, the breakdown of larger plastic items into microplastics presents long-term contamination challenges, as these tiny particles are nearly impossible to remove from the environment and can persist for decades, potentially entering the food web. It is, therefore, of utmost importance to prevent litter entering the ocean, and for that, transitional water regions such as estuaries, are the last opportunity to catch this litter before it can be lost in the sea. Addressing plastic pollution in transitional water regions requires comprehensive strategies, including improved waste management, public awareness campaigns, and the implementation of policies aimed at reducing plastic production and usage [5]. Such strategies should be developed on the basis of reliable and accurate information that can be provided by in situ campaigns and hydrodynamic numerical models. These tools can provide key information about the transitional water dynamics and transport patterns, helping to identify litter hotspots where innovative technologies can be installed to prevent these items reaching the marine environment.
Although the initial characterization of estuarine regions is usually performed through in situ measurements of several physical, chemical, and biological parameters [6,7], these observations are often limited in duration and spatial coverage due to their high cost and logistical constraints. Measurement campaigns are usually expensive, time-limited, and restricted to selected sites. To complement them and to obtain a deeper understanding of the physical processes, high-resolution hydrodynamic numerical models are essential. These models can accurately simulate the hydrodynamic behaviour in coastal and estuarine areas [8,9] considering the effects of several driving factors such as tides, flood/ebb cycles, river flow, bathymetry, and earth rotation [10,11,12,13]. By assessing the effect of each forcing driver, high-resolution hydrodynamic models can provide a deep understanding of the hydrodynamic processes for complex coastal environments, as well as forecast the effects of anthropogenic intervention activities [14,15,16], hazardous and extreme events [17,18,19,20,21], or even the effect of climate change conditions on water level dynamics [22,23,24]. Despite the complexity of the estuarine hydrodynamic drivers, 2DH models can provide accurate solutions with good agreement between measured and modelled hydrodynamic patterns, simplifying the numerical model complexity, when compared to 3D models, and reducing the computational time. The works of Horrit and Bates [17], Hu et al. [25], Néelz and Pender [26], Robins and Davies [11], Monteiro et al. [12], Wan et al. [27], Symonds et al. [28], Iglesias et al. [6,7,23,29,30], Melo et al. [22], Menten et al. [24], and Siemes et al. [16] demonstrate the capability of 2DH models to reproduce and forecast velocity, flood extent and water level in coastal and estuarine regions. Consequently, high-resolution numerical models are key tools for decision-making, supporting effective and integrated coastal management, and promoting population safety and the sustainability of marine ecosystems and services [6].
In the context of transitional water regions, generally research has traditionally focused on large estuaries due to their visibility, complex dynamics, and significant socioeconomic importance. Nevertheless, small estuaries should not be forgotten. They are highly sensitive to environmental changes due to their limited size and capacity to buffer external influences, making them crucial early indicators of shifts in water quality, pollution, and other stressors. These issues may take longer to appear in larger estuaries due to their greater capacity to dilute or absorb environmental changes. Moreover, the proximity of small estuaries to urban and industrial areas further exacerbates their vulnerability to human activities like pollution, land use change, and coastal development, which can significantly disrupt their dynamics and ecosystem functions [31]. While larger estuaries also face human impacts, their size and complexity often make these effects less immediately noticeable and more challenging to manage. Small estuaries additionally provide critical ecosystem services, such as nutrient cycling, water purification, and habitat support that are essential to both local populations and regional ecological integrity. Understanding their dynamics is crucial for maintaining and ensuring these services, as the scale and complexity of these functions in smaller estuaries can differ markedly from those in larger estuarine systems.
The Ave Estuary is an example of such a small estuary, a transitional water region located in northern Portugal, which was selected as a case study under the scope of the EU co-funded MAELSTROM project (https://www.maelstrom-h2020.eu/, accessed on 4 September 2025), which is focused on testing innovative technologies to remove litter transported by rivers, thereby helping reduce marine pollution. To understand the main hydrodynamic patterns of the Ave River estuary, identify litter hotspots and support the installation of a litter removal technology, numerical modelling tools were developed and validated with data obtained in specially designed measurement campaigns. A hydrological model was developed using Wflow to generate the river discharge, and a hydrodynamic model was set up using Delft3D FM. This paper summarizes the main findings and the results obtained with the numerical models, providing key insights into the behaviour of shallow-water small estuaries, their litter transport patterns, and our capacity to address aquatic pollution with sociological and technological interventions.

2. Geographical Setting: The Ave Estuary

The Ave River source is located in Serra da Cabreira, at an altitude of around 1200 m, and the river flows for around 85 km before reaching the Atlantic Ocean, south of Vila do Conde city. The Ave River basin covers an area of 1391 km2, of which approximately 247 km2 and 340 km2 are the respective areas of the basins of its two most important tributaries: the Este River (on the right bank), and Vizela River (on the left bank). The region covered by the Ave River basin has average annual rainfall ranging from 900 mm to 3900 mm. The highest rainfall occurs in Serra da Cabreira, and there is a tendency for precipitation to decrease progressively from upstream to downstream along the river basin [32].
The Ave River differs from other northern Portuguese rivers not only because of its high pollution levels, but also because of the large spatial and temporal variability of pollutant concentration [33,34]. In the Ave River basin, watercourses generally show serious disturbances, both at the physical-chemical and biological levels, with the exception of the sectors close to the source. These disturbances result in the degradation of the riparian vegetation, changes to the riverbed and poor water quality, which have obvious repercussions for aquatic communities. Along the hydrographic basin of the Ave River, several pressures were identified that contribute to the occurrence of litter in the aquatic ecosystem, which comprises both built-up and agricultural areas. In addition, this area is one of the most industrialized areas of Portugal, hosting a huge number of industries, such as textile, metal plating, leather tanning, rubber and plastic, cutlery and metalworking manufactures [35].
The Ave Estuary is an urban estuary located in the Vila do Conde municipality, Porto district, Portugal (Figure 1). To the south of Vila do Conde city, the Ave River flows over a weir into the Ave Estuary, which limits the extension of the estuary to a total length of about 2 km. This estuary presents a NE–SW orientation with a shore-to-shore distance of about 100 m, ranging between 80 m and 200 m. Due to its small size, and the configuration of its margins in relation to predominant wind directions, the effect of wind on water circulation and on surface-transported litter is limited. The estuary is protected from oceanic storms by two breakwaters: a northern breakwater, which is about 350 m long; and a southern jetty, which is about 270 m long (Figure 1). Hence, the effects of the oceanic waves are expected to be minimal inside the estuary [36]. Low waves from small boats passing through the estuary can have an effect over the surface-transported litter, although, due to the limited navigation in the estuary and the size of the boats that can navigate this area, this effect can be neglected.
The Ave Estuary is a very shallow estuary with depths generally around 4 m (relative to the mean sea level (MSL) and the Cascais Helmert 38 Datum). Maximal depths of around 8 m below the MSL occur near the weir (Figure 1 and Figure 2), but these are associated with an artificial excavation due to the presence of a historical water mill. Given the configuration of the estuary, the depth is higher in the outer bend located in the northwest part of the estuary. This corresponds with the urban margin (western), which is delimited by an artificial structure (rock wall). On the opposite side (eastern margin) of the channel (inner bend), the bed level changes more gradually and sedimentation tends to occur. In this inner bend, more vegetated areas can be found, except for the shipyard region (Figure 1), where a small breakwater was constructed to protect the structures from erosion and stabilize the margin. In this area, the width of the estuary has been artificially reduced. Despite its shallow waters, medium and small vessels navigate this estuary up the weir. However, sedimentation is a risk for navigation, and the estuary is dredged regularly to maintain its water depth.
A previous work [7], which analysed in situ data obtained in the Ave Estuary, demonstrated that this transitional region is a highly stratified estuary due to the development of a salt-wedge, with very strong vertical and longitudinal salinity gradients. The observed current velocities were low, mostly generated by tides and estuarine circulation during low and average river flows. Since these currents were low, the stratification was maintained even during spring tide. Higher flow velocity was measured during high river flows, when the water column became fully occupied by freshwater. This behaviour indicates that, as soon as the river flow started to increase, the conditions in the Ave Estuary became mainly driven by river discharge [7].

3. Material and Methods

3.1. Sampling Campaigns

To construct the numerical grid, updated bathymetric data were required. A bathymetric survey was carried out in September 2021 following the methodology described by Bio et al. [37]. The estuarine bottom elevation was determined in relation to the MSL using a sonar combined with a dual-frequency differential high-precision GNSS. This technique provides a precise horizontal and vertical position of the vessel and plotter without the need to consider any water level or tide correction. The survey was carried out along predefined tracks. Inside the estuary, the survey tracks were predominantly across-river with between-track distances of 25 m to 30 m. A digital elevation model (DEM) with 5 m resolution was computed using Nearest Neighbour interpolation.
Among other parameters, water level and velocity, key variables for numerical model validation, were measured in the Ave Estuary during long-term campaigns (approximately 1 month of duration) using a Nortek Acoustic Doppler Current Profiler (ADCP) (Norway) and Van Essen Current, Temperature Depth (CTD) (Delft, The Netherlands) divers. Instruments were deployed for several weeks (see Table 1 for the periods) at two sampling sites (Figure 1). At sampling site 1, two CTD divers were installed: one close to the bottom, and the other floating on a buoy at a constant distance from the surface. Additionally, an ADCP was mounted upward-looking in a frame, and lowered to the bed. The velocity was solely gauged at the upstream bottom location due to the availability of only a single ADCP. However, it was assumed that the disparity in velocity between the two locations would be negligible, given the small size of the estuary and the short distance separating both measurement sites. At sampling site 2, one CTD diver at the surface and another close to the bottom were installed. The CTD divers and the ADCP were programmed to measure at a time interval of 5 min. The time series were smoothed using a moving average with a window of 45 min, to reduce noise in the observations. More details about the campaign protocols and the obtained results can be found in Iglesias et al. [7]. Results of a previous campaign not included in Iglesias et al. [7] were also considered in this study to complement the numerical model validation. In this campaign, the measurement protocols were the same as in Iglesias et al. [7], but the equipment used (Idronaut CTDs) was different, with no ADCP nor bottom probe at sampling point 1.

3.2. Hydrological Numerical Model

Due to the lack of data regarding river flow for the estuarine region, a hydrological model of the Ave River basin was implemented to feed the hydrodynamical model with realistic river discharges. To accomplish this task, the Wflow grid-based hydrological modelling platform was selected [38,39]. Wflow allows accounting for precipitation, interception, snow accumulation and melt, evapotranspiration, soil water, surface water, and groundwater recharge in a fully distributed environment, and it includes a number of hydrological modules. For this study, the physics-based SBM concept was chosen, as it is targeted to perform hydrological simulations using GIS raster data based on global (European) datasets, which makes it the concept of choice in data-scarce environments [39]. Based on gridded topography, soil, land use and climate data, Wflow calculates all hydrological fluxes at any given point in the model at a given time step. The movement of surface water across the landscape is determined by the reservoir and kinematic wave modules, providing a more accurate representation of river discharges.
A first setup of the Ave catchment model was prepared using open-access data sources. The model catchment properties and construction datasets selected included the global 3 arc second MERIT Hydro Adjusted Elevations dataset [40] for model elevation and associated topological information (catchment delineation, 1D flow direction, slope, stream network and stream characteristics); the global 250 m SoilGrids Database [41] for soil properties (clay, silt, organic carbon content and bulk density) and derived Wflow model soil parameters (hydraulic conductivity, porosity, soil water content, and saturation content); and the European 100 m Corine Land Cover (CLC) 2018 map with information on land-use, land-cover classes and associated vegetation parameters (roughness, rotting depth of the vegetation, fraction of paved areas, etc.).
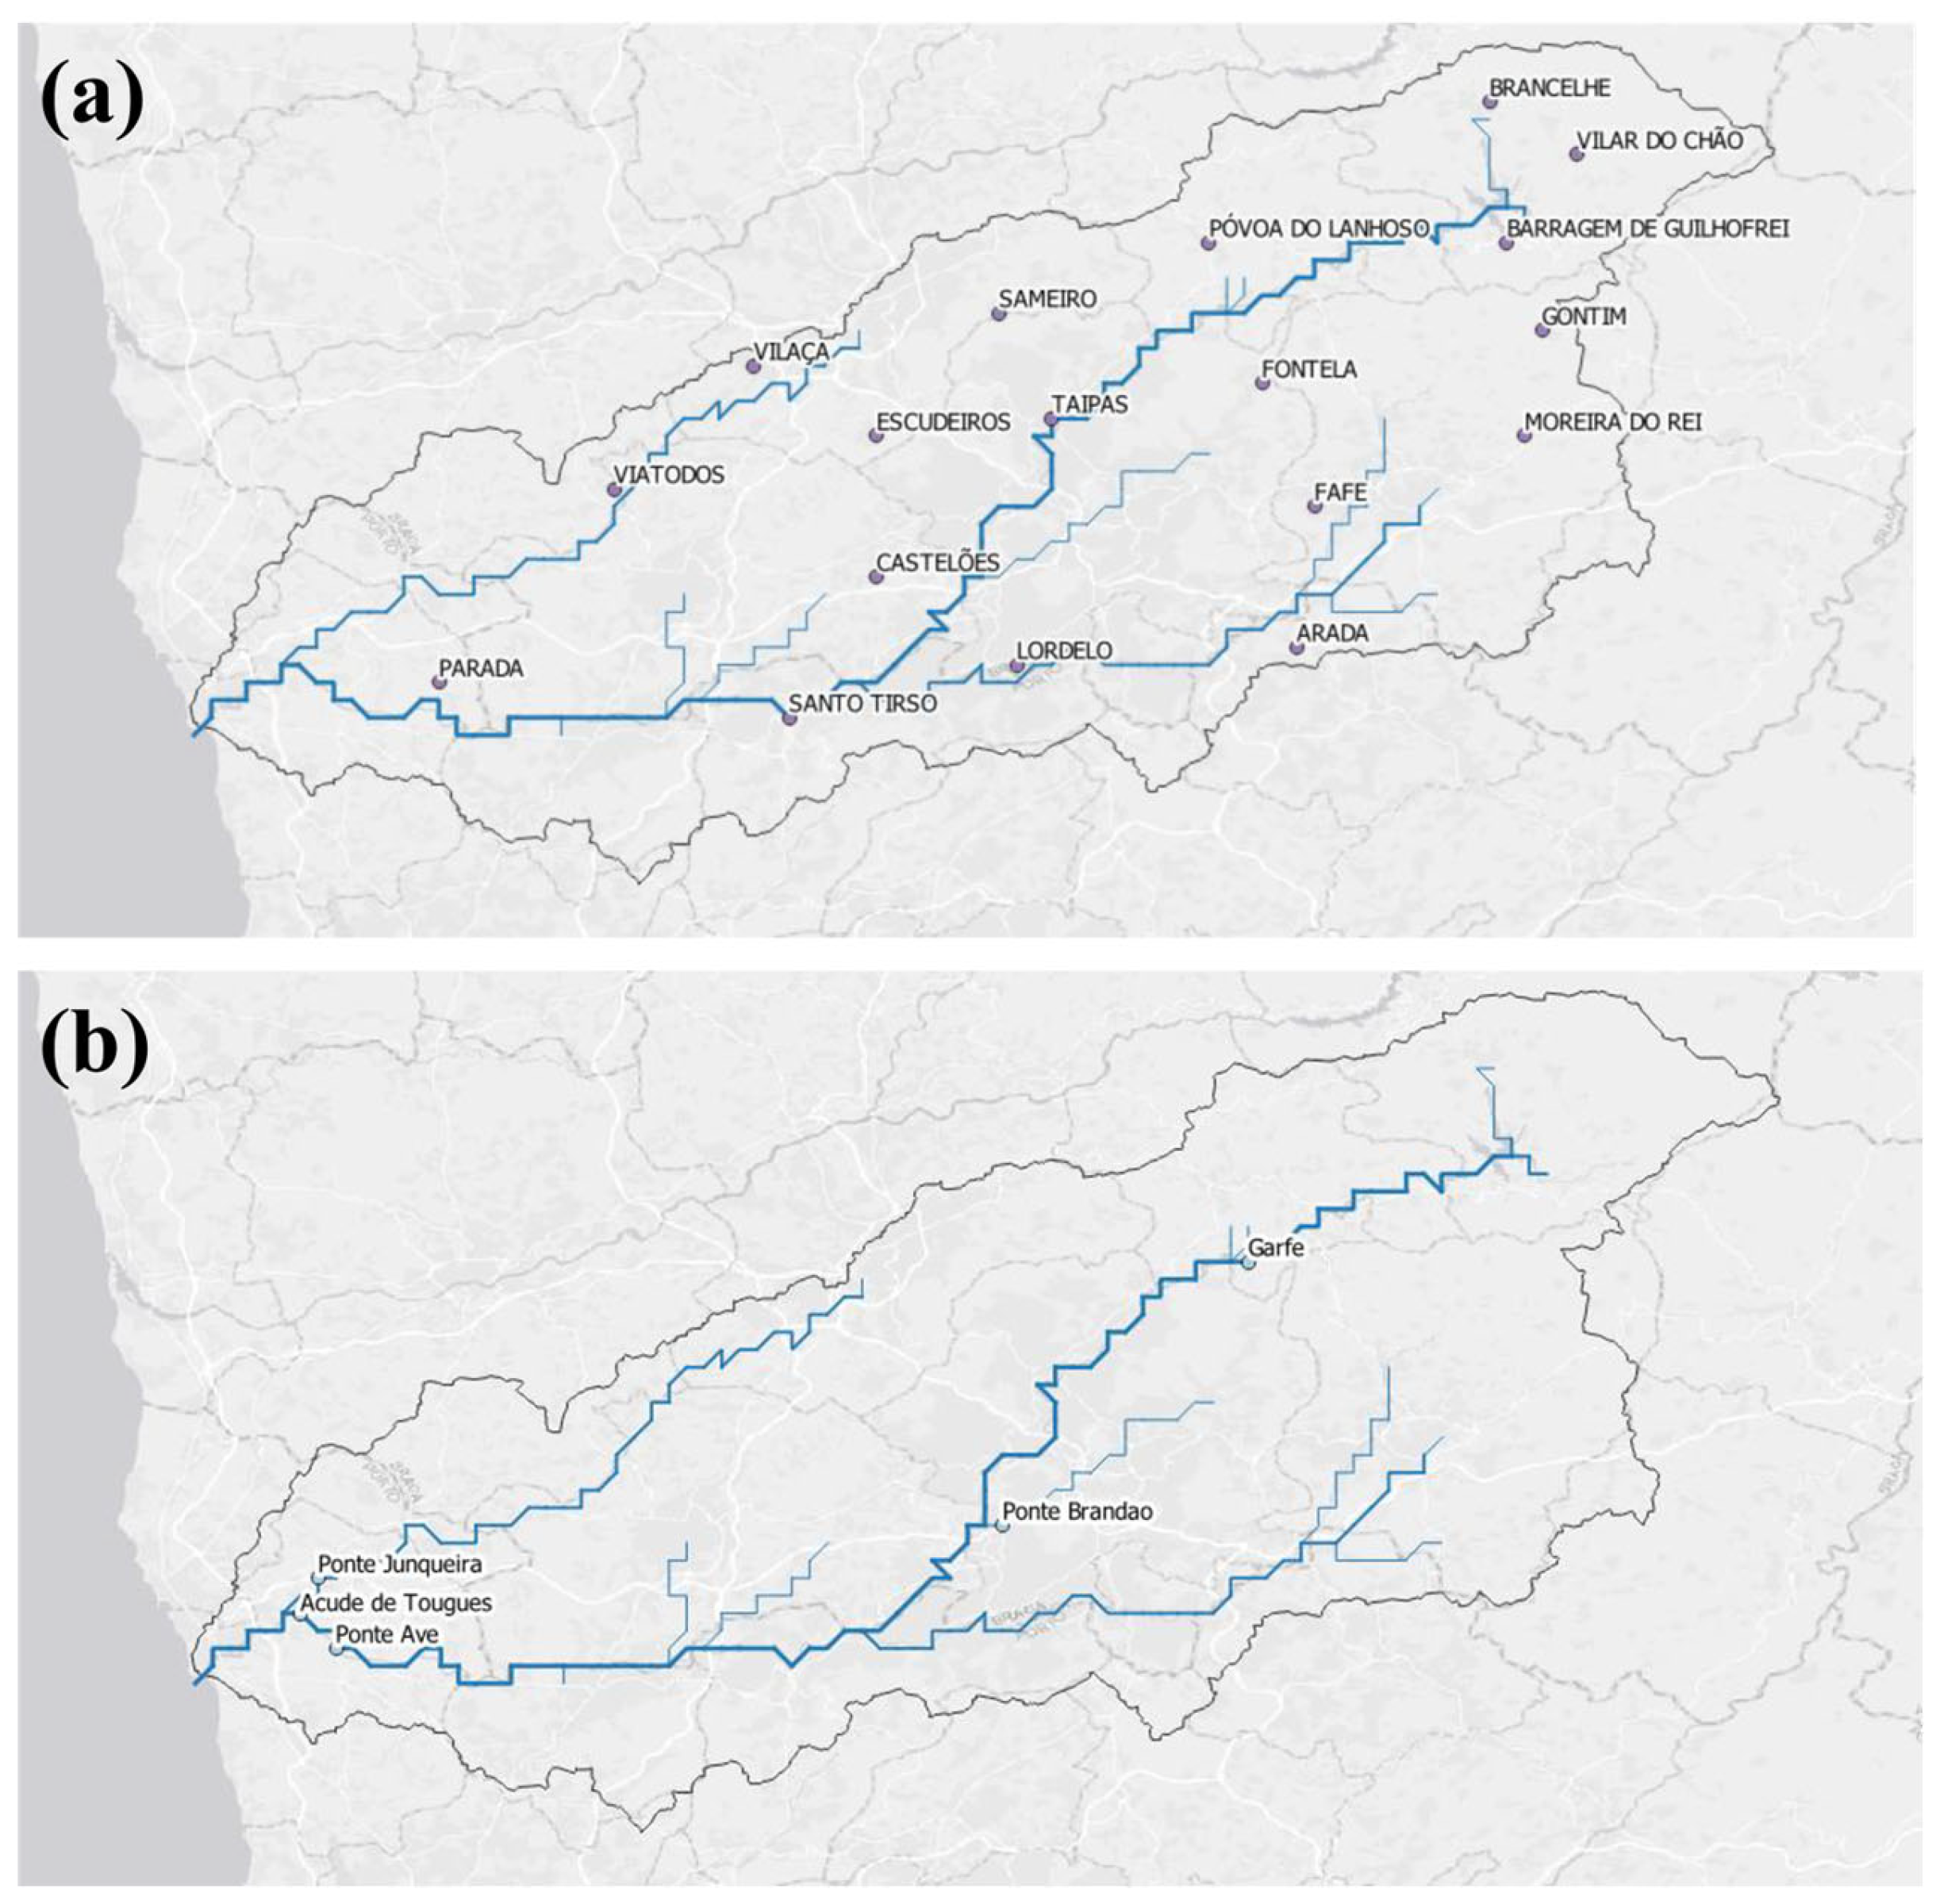
As forcing data, Wflow SBM requires three main meteorological variables to be defined per computational grid cell, per time step: total precipitation, average air temperature, and potential evapotranspiration. The precipitation and air temperature were derived from the 0.1° resolution daily gridded observations of the E-OBS dataset [42]. Potential evaporation was computed from air temperature, pressure, and incoming shortwave radiation using the Makkink equation [43]. Since precipitation data quality is crucial for hydrological modelling, a second dataset was chosen: the ERA5 reanalysis [44,45]. ERA5 provides hourly estimates of atmospheric, land and oceanic climate variables at a resolution of 0.25°. To validate both rainfall grids and to calibrate and validate the modelled discharge values from the Wflow model, observed rainfall and discharge daily time series from the SNIRH [46] for different locations along the basins were selected (Figure 3). Precipitation was obtained for 18 stations from 1931 to 2021. Discharge time series were scarce and available for 5 stations from 1980 to 2000. The best results were selected based on a visual inspection of the hydrographs, the best representation of the (annual) cumulative discharge (volume), and the best results for the computation of efficiency coefficients, namely the NSE (Nash–Sutcliffe Efficiency) and the KGE (Kling–Gupta Efficiency). These coefficients range between −∞ (very poor) and 1 (perfect), and it is considered that a model starts to be acceptable at 0.4, good at 0.6 and very good from 0.8 on.

3.3. Hydrodynamical Numerical Model

The hydrodynamic numerical model for the Ave Estuary was implemented using the 2DH hydrodynamic module of the Delft3D Flexible Mesh Suite (Delft3D FM) developed by Deltares. Delft3D FM is specifically designed for coastal, riverine, and estuarine areas. This hydrodynamic module calculates non-steady flow and transport phenomena that result from tidal and meteorological forcing on structured and unstructured boundary-fitted grids. The term ‘Flexible Mesh’ in the name refers to the flexible combination of unstructured grids, which are useful for representing the dynamics of study cases that present complex geometries. Some of the areas of application of the hydrodynamic module of the Delft3D FM are tide-driven flows, river discharge effects, freshwater river discharge, and salt intrusion. To represent all these phenomena, the module can consider tidal forcing, Coriolis force, density-driven flows, advection–diffusion, turbulence, and time-varying sources, and sinks.
An unstructured grid was set up for the Ave Estuary and the surrounding coastal and oceanic zone (Figure 2). The grid resolution is 15 m inside the estuary and around 1 km at the oceanic western boundary [39]. The bathymetry for the numerical grid was obtained from several databases, namely, EMODNET 2020 (114 m resolution) [47], for the oceanic region; Portuguese LiDAR 2011 (2 m resolution) [48], for the coastal zone; estuarine topography was extracted from the DEM computed by CIIMAR researchers in 2019 using aerial photography from an aircraft flight survey (0.5 m resolution) [49]; and the estuarine bathymetry was measured during MAELSTROM bathymetric campaign (September 2021). All the data were carefully merged to avoid inconsistencies between the different databases, using the coordinate system PT-TM06/ETRS89. The MSL was selected as the vertical reference level.
The tidal forcing at the oceanic boundary was extracted from the TPXO9 atlas with 1/30 degrees resolution using the TMD model [50]. The tidal forcing was extracted at several sites separated by a distance of about 3 km along the model oceanic boundary, allowing a better description of the tidal behaviour inside the numerical domain. The river discharge provided by the hydrological model described in the previous section was forced at the river entrance just downstream of the weir. The flow was equally distributed over the cross-section. The temperature and salinity values of the oceanic and river water masses were extracted from the in situ data measured [7]. A time step of 6 s, a Manning coefficient of 0.033 s m−1/3, and horizontal eddy viscosity and diffusivity coefficients of 1 m2 s−1 were considered. Effects of wind and waves were neglected in this model as the Ave Estuary is a relatively narrow (maximum width around 100 m) and short (less than 2 km) water body. Due to its orientation regarding the predominant winds (northern winds), these winds cross the estuarine region with minimal effects on the water lenses. In addition, the urban area on the northern margin, due to the roughness of the buildings, diminishes the wind strength at the water surface. Likewise, waves do not have a great effect on the hydrodynamic conditions due to the configuration of the breakwaters that protect the estuary from oceanic waves, and the occasional small boats passing also have minimal effects. At the nodes surrounding the oceanic boundary, a higher horizontal eddy viscosity coefficient of 500 m2 s−1 was included to ensure smooth entrance of the oceanic conditions. A spin-up period of 2 h was considered before each simulation to let the model stabilize and avoid numerical inconsistencies.
Several scenarios were performed following the measurements available for model validation (Table 2).
Several tests were performed with different hydraulic roughness Manning coefficient and horizontal eddy viscosity and diffusivity coefficient values, until reaching the optimum values that best represent the estuarine dynamics. To ensure the best values for these coefficients, different numerical metrics were considered, namely the Pearson correlation coefficient (PCC, Equation (1)), the root mean square error (RMSE, Equation (2)), the bias (Equation (3)) and the skill (Equation (4)). Additionally, the average difference for positive (ADP) and negative (ADN) values were also calculated (Equation (5) and Equation (6), respectively).
P C C = i = 1 N X p t i X p ¯ X m t i X m ¯ i = 1 N X p t i X p ¯ i = 1 N X m t i X m ¯
  RMSE   = 1 N i = 1 N X m t i X p t i 2
  Bias   = i = 1 N X p t i X m t i N
  Skill   = 1 i = 1 N X p t i X m t i 2 i = 1 N X p t i X m ¯ + X m t i X m ¯ 2
  ADP   = i = 1 N X p t i X m t i N
If X p t i ,   X m t i > 0
  ADN   = i = 1 N X p t i X m t i N
If X p t i ,   X m t i < 0
  • where N is the number of observations, Xp and Xm are the predicted (p) and measured (m) values of variable X for the observation at time ti, and X ¯ i (with i = m or p) is the time average of a distribution.
PCC measures the linear association between the measured and the predicted variables. Its values are between +1 and −1, indicating a total positive or negative correlation, and if PCC = 0, no linear correlation is present. The bias function provides the difference between the predicted and the measured variables. The values of the bias function are between 0 (or unbiased) and 1. Better comparisons are obtained when the bias function is close to 0. RMSE also estimates the difference between predicted and measured variables. RMSE values are non-negative, and RMSE = 0 indicates a perfect fit to the data. Finally, a predictive skill of 1 indicates a perfect agreement between the predicted and the measured data, whereas a predictive skill of 0 indicates a complete disagreement.
The maximum observed difference and the mean difference between measured and modelled variables were also calculated. In addition, the tidal harmonics of the longer scenarios (VS2 and VS3) were extracted from the model and compared with the observations provided by the bottom probes. To extract the tidal harmonics from both time series, the T-Tide Harmonic Analysis Matlab toolbox was used [51].
To gain a deeper understanding of the hydrodynamic behaviour of the Ave Estuary, three additional scenarios were run considering summer (S1), winter (S2), and extreme (S3) river flow conditions. The proposed scenarios were run for 27 days with a variable tide and a constant river flow value during the entire simulation. The selected period for tidal forcing was considered not to be affected by the effect of the equinox and the solstices, and included neap and spring tides to evaluate the effect of this driver on the estuarine hydrodynamics. To represent the effect of the tide and river flow as hydrodynamic drivers, the temperature was assumed to be constant (17 °C) for both water masses (ocean and river waters) during the entire simulations, with salinity values of 0 for the river water masses and 36 for the oceanic water. Regarding the river flow, the peak discharge obtained during the summer and winter campaigns (S1 and S2, respectively) was considered. For the extreme scenario S3, the maximum discharge modelled by the hydrological model was implemented. The simulation scenarios are summarized in Table 3.

4. Results and Discussion

4.1. Hydrological Model Calibration and Validation

The first part of the calibration/validation of the hydrological model consisted of analysing the quality of the gridded rainfall data from E-OBS and ERA5 compared to the observed time series at different locations in the basin. Here, three representative stations, distributed along the hydrographic basin, were selected (Figure 4). Results for other locations present similar behaviour. The comparison was performed for the period between 1980 (start of the global data) and 2000, for which discharge observations are also available for all stations (Figure 3b). In this period, 12 stations in the Ave River hydrological basin from the SNIRH database had sufficient data coverage, with few to no missing values (Figure 3a). From the analysis of rainfall volumes, there is no clear conclusion on which dataset is better than the other. In most cases, ERA5 seemed to better estimate the yearly volumes (Figure 4a–c, green line), but with a tendency to overestimate and without a good distribution of the rain volumes per month (Figure 4d–f, green line). E-OBS seemed to generally underestimate the rainfall volumes per year (Figure 4a–c, blue line), but to present a much better distribution of these volumes per month, especially during the dry season (Figure 4d–f, blue line). For some stations, E-OBS better estimated the yearly volumes than ERA5, and, for a few locations, the quality of the gridded rainfall datasets seemed poor.
Since none of the databases outperformed the other, their capacity was subsequently tested for high flow events. Here, two representative stations, distributed along the hydrographic basin, were selected (Figure 5). The presented results considered two different sets of values on key parameters, which were assigned based on the literature and our experience. It was found that E-OBS seems better suited for use with the hydrological model, as the discharge volumes are well-represented for most stations (Figure 5, blue line). In addition, ERA5 seems to overestimate most of the peak rainfall and introduce additional intermediate rainfall events (Figure 5, green line), compared to E-OBS. From this analysis, it seems that the E-OBS dataset is better suited for the study of the Ave River as the peak-flow and low-flow conditions are better represented. The E-OBS dataset was, therefore, selected for the second step of the model calibration.
After selecting the best precipitation dataset (E-OBS), a sensitivity analysis was performed to select the parameter values for the hydrological model that produced the best results. Based on our experience and previous studies [52], the analysed model parameters chosen were the vertical hydraulic conductivity at the soil surface (KsatVer), the horizontal hydraulic conductivity at the soil surface (KsatHorFrac), the scaling parameter that controls the exponential decline of conductivity with soil depth (f), the saturated water content (porosity) of the soil (θs), and the rooting depth of vegetation (RootingDepth). From the different selection criteria and looking at the different stations available, the final parameter values retained are a KsatHorFrac of 500, an f multiplier of 0.5, and a θs of 1.2, which result in a NSE of 0.78 and a KGE of 0.83.
In order to provide the discharge forcing as input to the hydrodynamic model of the estuary, the modelled river discharge was extracted at the estuarine location from June 2020 to July 2023 (Figure 6). The discharge time series shows two peaks, one in February 2021 of around 300 m3 s−1, and another in January 2023 of around 500 m3 s−1. Looking back at the available observed discharge, it seems that such events indeed regularly appear for the Ave River with a return period of 3 years between 1979 and 1990. As an extra check, we looked back at the European Flood monitoring and forecasting reports: warnings were issued on these particular dates for flood risk in the Ave and surrounding rivers, validating the obtained results.

4.2. Hydrodynamic Model Calibration and Validation

The results of the tidal harmonics for the main constituents considering scenarios VS2 and VS3 are presented in Table 4 and Table 5. The comparison between the tidal constituents’ amplitude and phase obtained from measured and modelled water levels revealed that the numerical model was able to reproduce the main components with satisfactory results, acknowledging that, in reality, the water level may also vary due to varying river discharge. The calculation of the tidal form factor (F), which is the ratio between the sum of the amplitudes of the diurnal components (K1 and O1) and the sum of the amplitudes of the semidiurnal components (S2 and M2), revealed similar values for the observed and the modelled data, indicating a semidiurnal tidal behaviour (F: 0–0.25 semidiurnal; F: 0.25–1.5 mixed, mainly semidiurnal; F: 1.5–3 mixed, mainly diurnal; F: >3 diurnal) (Table 4 and Table 5).
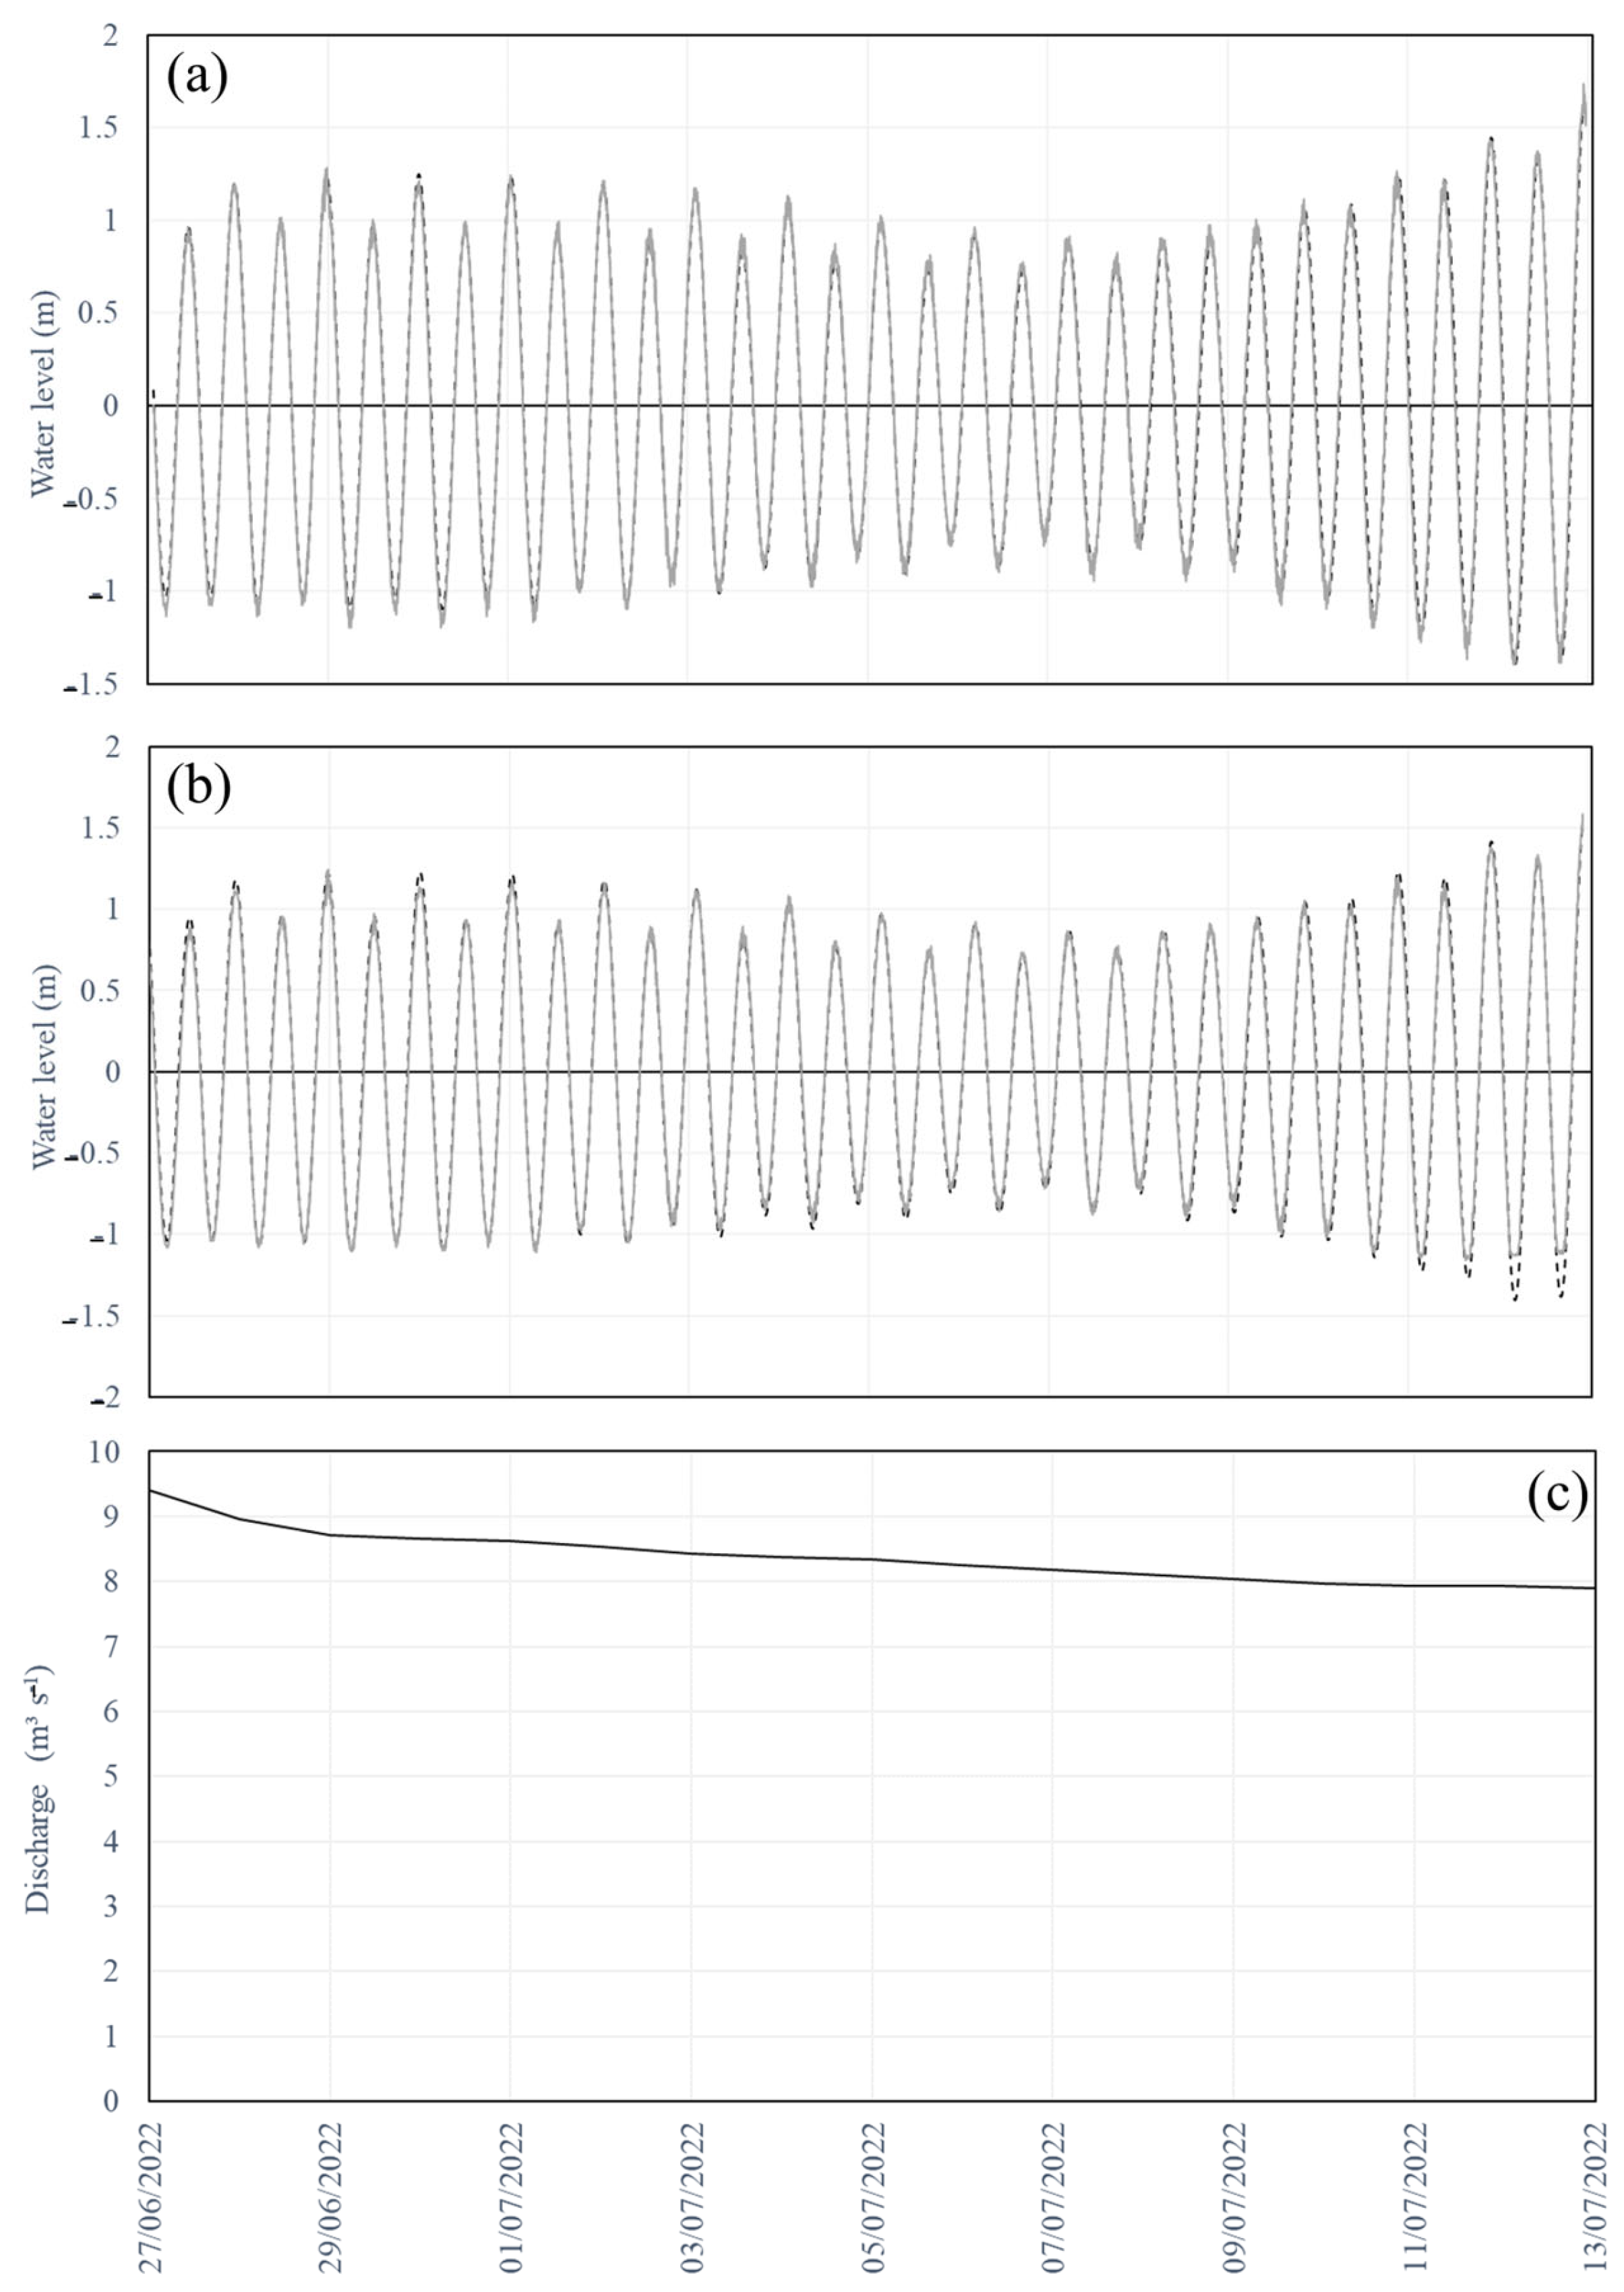
Regarding the water level, the model behaved quite well for the three validation scenarios. For VS1 (Figure 7), the main water level changes are due to tidal influence (Figure 7a,b), since the river flow varied between 8 m3 s−1 and 10 m3 s−1 (Figure 7c). A good agreement was found between the simulations and the measurements, indicated by a small RMSE, close to null bias values, and close to unity correlation and skill coefficients (Table 6). The numerical outputs for the water levels match the field measurements relatively well (Figure 7a,b). The ADP and ADN were also small for both sampling points during the whole simulation period (Table 6).
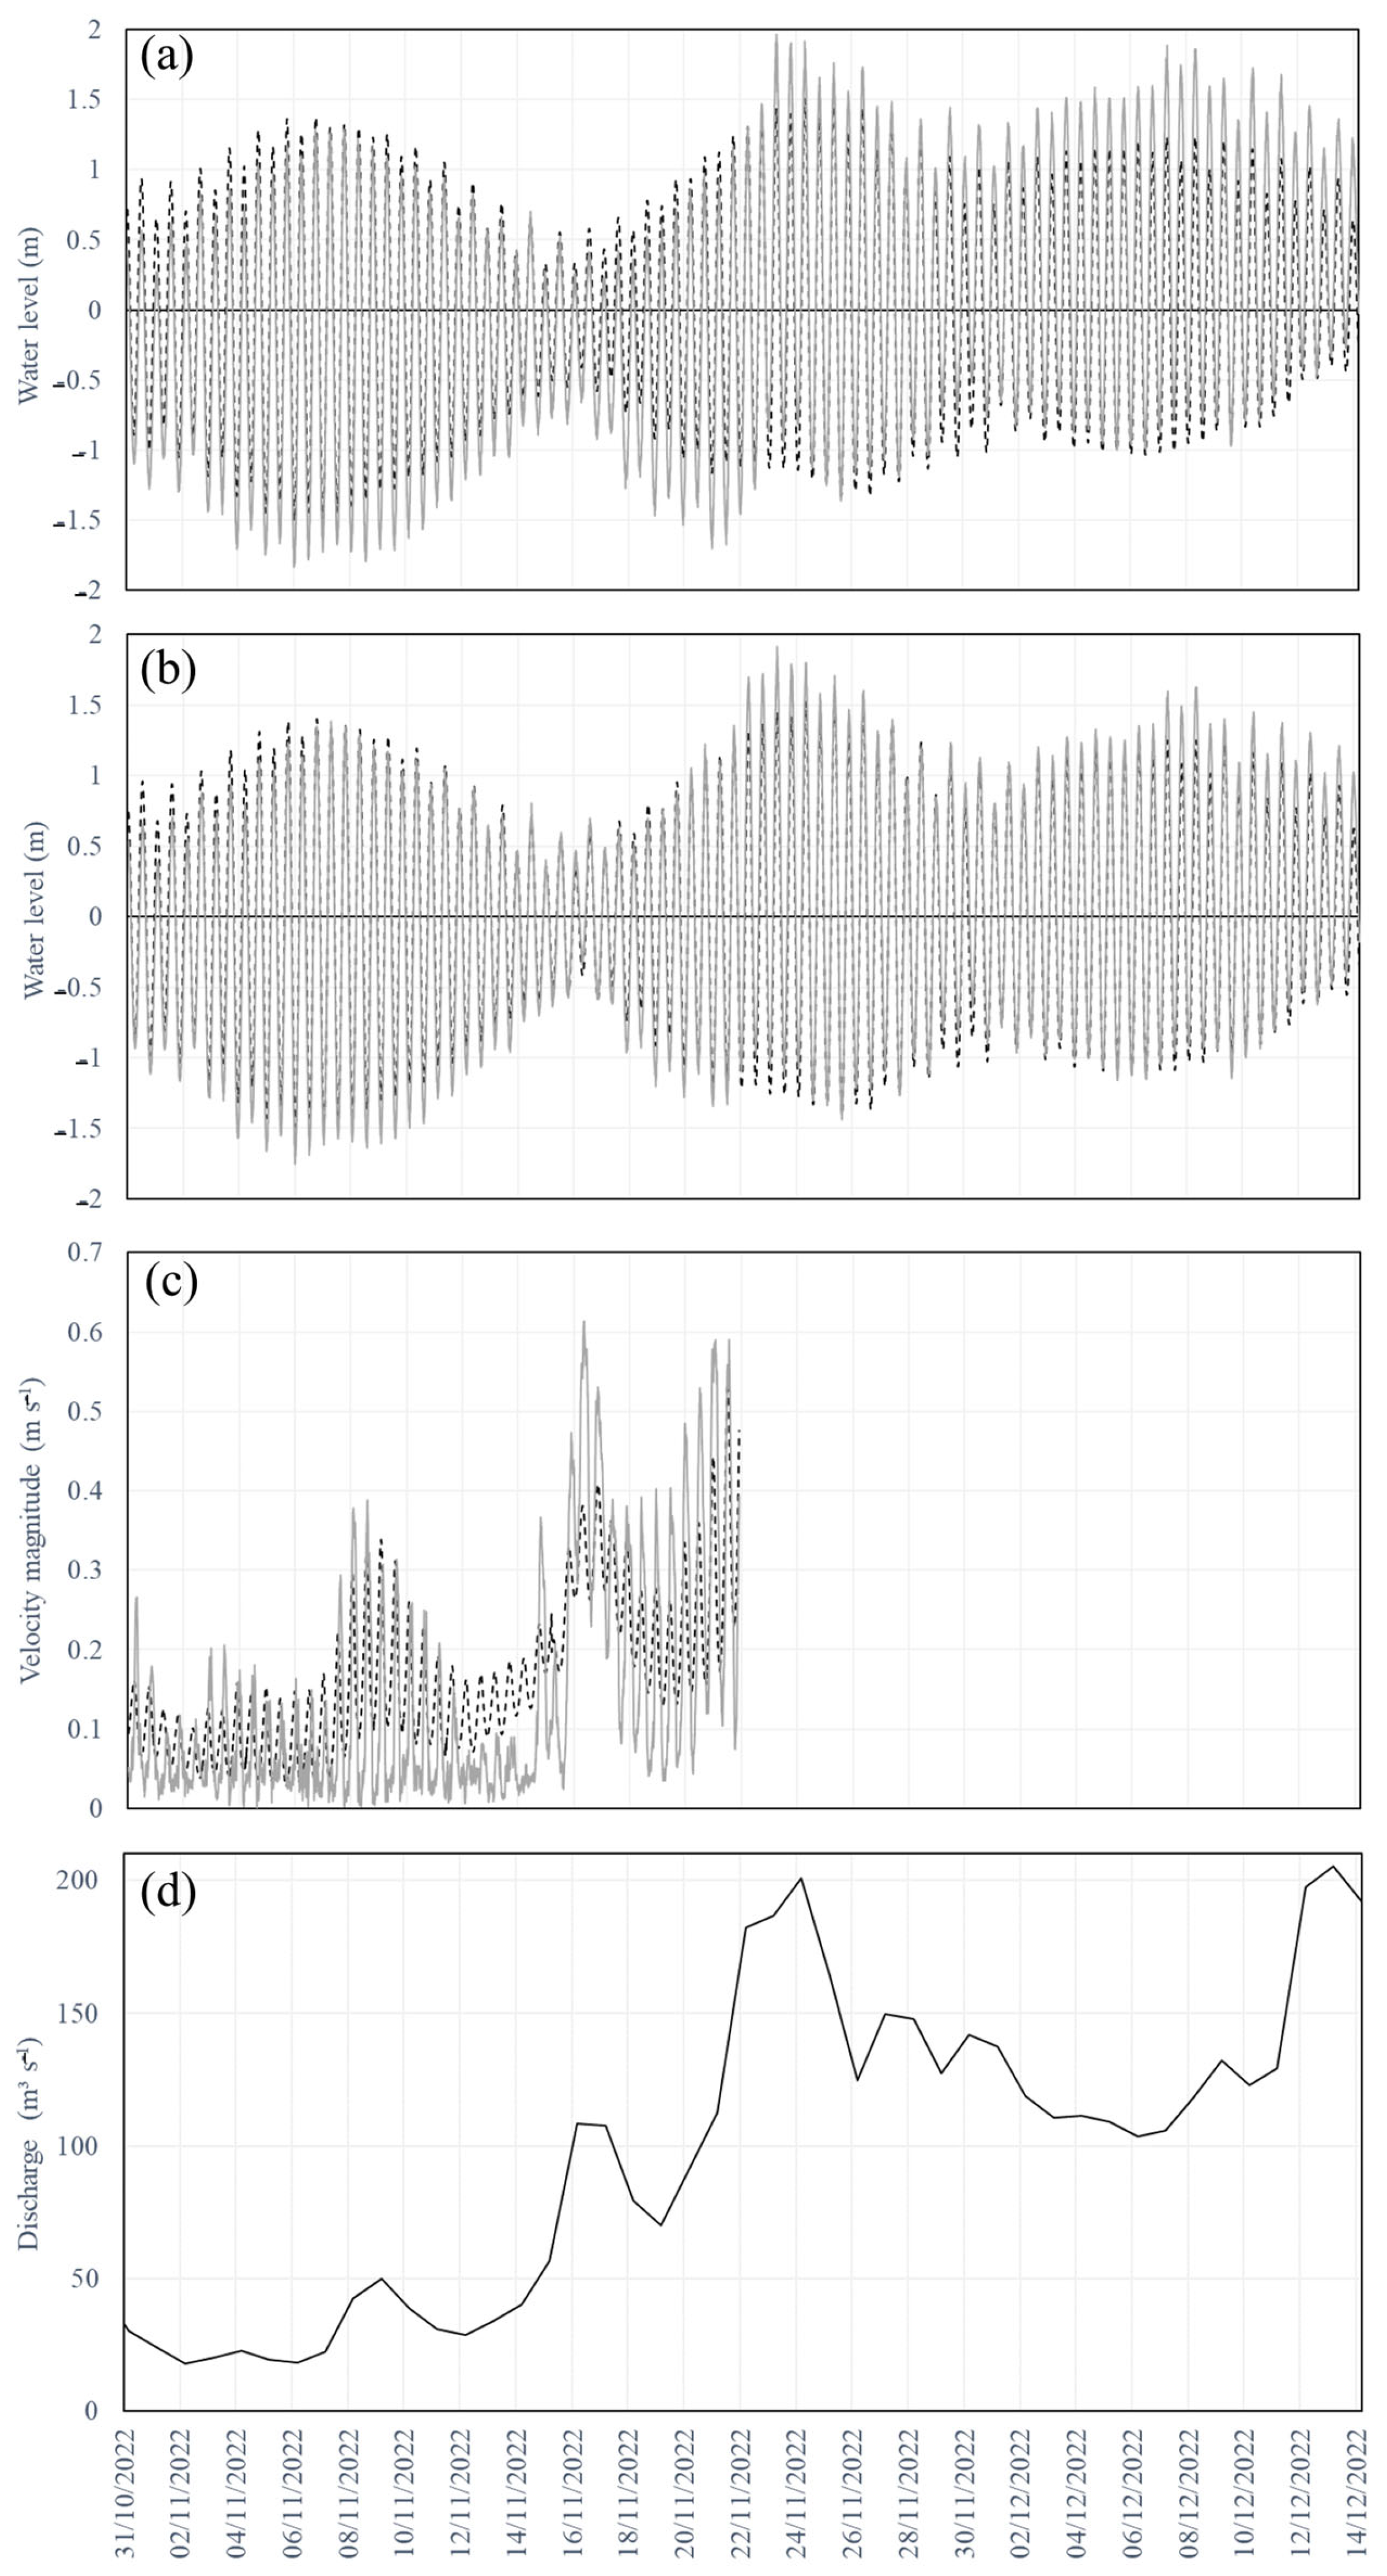
The results obtained for scenario VS2 (Figure 8) also reveal a good alignment between the modelled and the measured water elevation (Figure 8a,b), and the errors obtained are within reasonable bounds (Table 6) for both sampling points. Here, ADP and ADN are slightly higher than the values obtained at VS1 for both sampling points. These differences could be associated with the uncertainty related with the use of modelled river flows, since in this scenario, the river flow is higher and so affects the estuarine dynamics. During VS2, the river flow values reached 200 m3 s−1 (Figure 8d). Despite this modelled forcing, the obtained results can be considered satisfactory.
Also, scenario VS3 revealed a good alignment between the modelled and the measured water elevation (Figure 9a,b). Similar to VS1, VS3 presented low river flows (below 25 m3 s−1, Figure 9d), and the water level fluctuations could be associated with tidal conditions rather than river flow conditions, as in VS2. VS3 presented lower correlation and higher ADP and ADN values than the previous scenarios, although still with satisfactory values (Table 6).
Despite the good results obtained for the water elevation, the model presented some limitations in representing the velocity magnitude for both scenarios (Figure 8c and Figure 9c). The measured and modelled velocity magnitudes seem to be closer for higher river flows as, for example, around 22 November 2022 for VS2 (Figure 8c). This is because this estuary is highly stratified [7]. For low-river-flow conditions, which are the most frequent conditions in this estuarine region, the riverine water flows to the ocean on the less dense surface layer, while the oceanic water develops a salt wedge structure at the bottom of the estuary that evolves with the tide. During flood tidal conditions, the two layers (freshwater and saltwater) can present opposite current directions, with the freshwater at the surface flowing downstream, and the saltwater at the bottom flowing upstream, which cannot be fully represented in a 2DH model. However, for stronger river flows, the salt wedge entrance is restricted to the estuarine mouth and the water column is fully filled by freshwater, which presents a single movement in the downstream direction.
In addition to the stratification, it is important to note that the ADCP measurements also have inherent uncertainties due to equipment limitations. The ADCP is not able to measure the entire water column. The equipment, deployed at the bottom, presents a no-data region between the bottom and 1.5 m above the bottom, underestimating the velocity of the salt wedge. Also, the measurements near the surface region should be neglected due to reflection processes related to the change from water to air at the surface, which corresponds to the ADCP upper cell, around 0.5 m depth. Sometimes the surface freshwater layer can be very thin [7], and thus fully absent from the ADCP measurements. This means that the ADCP is neither able to measure the full behaviour of the salt wedge nor to fully capture the freshwater flow at the surface, as only about two-thirds of the water column can be observed, and it was this portion of the water column that was averaged for the analysis, while the model represents the average of the entire water column.
Despite the described limitations of the measurements, the additional uncertainty introduced by using numerically modelled river flow, and also considering that the flow observations were done at one profile, while the simulated flow is averaged over the grid cell, the velocity validation results can be considered quite satisfactory. Although there are differences in the intensity, with a mean difference of 0.077 m s−1 for VS2 and 0.027 m s−1 for VS3, both datasets (measured and modelled) are in the same order of magnitude and they have a similar behaviour, with reasonable values of PCC, RMSE, bias and skill for both validation scenarios, and with ADN and ADP values lower than 0.1 m s−1 (Table 6).

4.3. Additional Scenarios

Additional scenarios were developed to comprehensively understand the estuarine hydrodynamic patterns under changing conditions. To represent the water level evolution along time, four observational sites distributed along the estuary (OS1 to OS4, Figure 1) were selected. The results demonstrated that, for S1, the water level along the estuary was practically the same (Figure 10a). Differences started to appear for S2, with the upstream stations presenting less developed low tides due to the effect of the river flow (Figure 10b), with differences of around 0.7 m (MSL) between the upstream (OS1) and the downstream (OS4) sites during spring tide conditions. This effect is enhanced during extreme events (S3, Figure 10c), where the differences between the upstream (OS1) and the downstream (OS4) sites are above 1 m (MSL) for low tides of spring tides, with the most upstream sites (OS1, OS2 and OS3) presenting water elevations always above MSL. A difference in water elevation during high tides was also observed for S3. This difference, which is smaller than that observed for low-tide conditions, is more evident during neap tides and can reach values of 0.5 m (MSL). This reflects the expected flood levels in this estuarine region under extreme river flow conditions, as represented in the S3 scenario.
The difference between the scenarios for each site is clearly visible in Figure 11. The river flow considered in S3 always reduces the amplitude of the low tides, demonstrating that, although there is an effect of the tides on the estuary, it is the river flow that drives the estuarine circulation. This effect is noticeable for all the sampling sites selected. Again, in the upstream locations (OS1, OS2 and OS3), the water level depicted for the S3 scenario is always above MSL. In contrast, the low river flows simulated in S1 do not have an effect on the water level, and so the circulation is apparently controlled by the tides (Figure 10a and Figure 11).
The water levels presented in Figure 11 and Figure 12 clearly indicate that there should be some regions of the estuarine margin flooded, at least for the extreme event river flow scenario S3. To analyse the extension of the flood, water level maps are presented in Figure 12 considering four key moments of the simulations, including the high-tide and low-tide conditions during spring and neap tides. As expected, higher water level values were observed during spring high-tide conditions (ST HT) and lower during spring low-tide conditions (ST LT). However, differences arise between the proposed scenarios.
The water level is noticeably higher inside the estuary for spring low-tide conditions in the winter scenario (S2), when compared with the summer scenario (S1), which is expected due to the increased discharge rate. Even at the lowest tide, the water level remains elevated compared to the summer scenario. But, when compared with the extreme scenario (S3), both other scenarios (S1 and S2) presented lower water level values.
The highest water levels were obtained for the extreme river flow scenario (S3), with the eastern margin of the estuary showing some flooded areas. The western margin is not flooded due to the existence of an approximately 3 m high wall that protects the urban area, which increases the pressure on the eastern margin. During spring low-tidal conditions, scenario S3 depicted higher water levels, compared with S1 and S2, demonstrating that the circulation is dominated by the river flow. However, the increase in the water level is perceptible in all the selected key moments.
A comparison of the different scenarios gives information about the wet and dry areas on the eastern estuarine margin due to the tides, and also the flooded areas, on both the eastern and western margins near the river mouth and next to the breakwaters.
The representation of velocity (Figure 13) shows that normal river flow conditions (S1) produce vertically averaged velocities below 0.5 m s−1 in almost all of the estuarine region. Higher vertically averaged velocities are obtained during low-tide conditions, being the highest in spring low tide (ST LT), reaching values above 2 m s−1 in the narrowest estuarine regions for the S3 scenario. These highest velocities are obtained in the three areas where a narrowing of the channel causes the water to speed up to maintain a constant flow rate. Even for a winter event (S2), vertically averaged velocities can reach 1.5 m s−1 inside the study region. However, even during the extreme event, several regions of low velocities can be identified, mainly in the mouth but also around the main channel, as the inner side of the last bend of the river (westward margin). The area with low velocities located on the east margin at the south of the shipyards (Figure 1) is an artificially semi-enclosed small bay used for boating manoeuvres. The water residence time there is high due to the artificial structures constructed on the east margin to protect the shipyard (Figure 13).

5. Discussion

In the scope of the MAELSTROM project, two different numerical models were calibrated and validated to represent the hydrological and hydrodynamic conditions of the Ave Estuary and to understand its main dynamic paths. The main objective of this task was to provide the MAELSTROM consortium with key information to install a litter removal technology, by identifying the areas with the best conditions for the technology, as well as other regions that could be possible hotspots of aquatic litter accumulation.
In terms of hydrodynamic representation, it must be emphasised that the work presented here has some limitations. During low-river-flow conditions, the most frequent type for the Ave Estuary, the riverine water flows into the ocean along a shallow water layer at the surface. Meanwhile, the oceanic water develops a salt wedge structure at the bottom, entering the estuary region and reaching its upstream limit (the weir). During flood tidal conditions, these two layers can present opposite currents, with the freshwater flowing downstream, and the salt water flowing upstream. This stratification pattern cannot be represented in a 2D model due to the average of the water column that a 2DH model performs. During stronger river flows, the salt wedge entrance is restricted to the estuarine mouth and, in most of the estuary, the water column is fully filled by freshwater moving downstream. In these conditions, the water column is more uniform, and this pattern is thus better represented in a 2D model. However, this pattern is less common in the Ave Estuary.
In addition to the stratification issue, and as was carefully explained, the ADCP measurements also present uncertainties because the equipment is not able to measure the entire water column, with blanks near the surface and the bottom due to reflection and the deployment settings. This means that only about two-thirds of the water column velocity was measured, while the model represents the average of the entire water column, resulting in an underestimation or overestimation of the observed vertical averaged velocity depending on the hydrodynamic patterns, the salt wedge penetration, and the depth of the freshwater layer.
Despite these limitations, and also considering that river flow estimates were provided by a hydrological model, which brings additional uncertainty, the validation of both, the water level and the velocity, produced satisfactory results.
It is clear that, to achieve an accurate representation of marine litter pathways, numerical models should be carefully selected and implemented. Lagrangian models are key tools that can be used to represent the trajectories and hotspots of accumulation of different types of particles, such as eggs and larvae [53,54], oil spills [55], sediments [56], or litter [57,58], among others. However, to produce accurate results, Lagrangian models need to define the exact position of the sources, which in the case of the marine litter are normally unknown and diffuse, as well as the specific characteristics of the particles. When this information is not fully available, the obtained results can be inaccurate. In addition, Lagrangian models have some limitations in representing litter behaviour such as fragmentation, aggregation, biofouling, changes in buoyancy, washing and beaching. An additional difficulty regarding the Lagrangian model results validation is the lack of data on litter sources, types, transport trajectories, and deposition rates collected over various seasons and hydrological events, which limits the validation and applicability of these models [59].
Despite all these limitations, Lagrangian models are the best tool to represent litter transport. However, they are dependent on hydrodynamic numerical models, with the implementation of an accurate hydrodynamic model being a key step for the representation of marine litter transport. Hydrodynamic models alone cannot give the exact position of the litter and its transport pathways since they do not consider the properties of the litter “particles”. However, their implementation can be useful for understanding litter behaviour in general terms, providing results to identify the areas with low velocities where litter could accumulate, as well as flooded regions where accumulated litter could be washed, providing important insights for decision- and policy-makers, as well as other stakeholders [60].
With this in mind, the results of the hydrodynamical model simulations for the Ave Estuary, jointly with the previous field studies performed from September 2021 to November 2022 [7,39], demonstrated that the Ave Estuary flow dynamics are primarily driven by tides and river discharge, with the wind and oceanic waves playing limited roles. The estuary becomes highly stratified under low river discharge conditions, with a fresh–brackish water layer sitting above the oceanic water. For these conditions, flow velocities do not normally exceed 0.5 m s−1. However, during periods of high river discharge, salt water is flushed out, resulting in a fully freshwater column. In extreme discharge scenarios, flow velocities can reach up to 2 m s−1, quickly transporting litter out of the estuary, and the margins around the estuarine region can be flooded. During low discharges, estuarine circulation accelerates the surface transport of floating litter toward the ocean, as surface flow is directed seaward for most of the tidal cycle. Low-velocity areas were identified near the margins around the main channel, right upstream at the estuary mouth, in wider sections of the river or in other regions partially protected by the geometry of the margins. These areas with low currents suggest potential hotspots for litter accumulation. In contrast, high discharge conditions lead to a more mixed water column, facilitating efficient outward transport of marine litter at all depths. However, even during extreme events, several regions of low velocities can be identified in the mouth and around the main channel, indicating potential regions for aquatic litter accumulation. The semi-enclosed bay next to the mouth presents high water residence times. If any aquatic litter enters this area, it would be expected to stay there for a long time given the absence of strong currents. Another identified region is located on the inner side of the last bend of the river (westward margin), where sediments also settle. In this area, several beach clean-up activities were performed, and a substantial quantity of litter was found there before the installation of the marine litter removal system implemented in the scope of the MAELSTROM project. During these clean-up activities, performed on the World Cleanup Day in September 2023, 140 kg of litter (66 kg of plastic, 29 kg of glass, 45 kg of undifferentiated litter) was collected, which suggests that this beach could be a hotspot of litter accumulation. After the installation of the marine litter removal technology, during November 2023, litter deposition was substantially reduced, as demonstrated by the World Cleanup Day campaigns in September 2024, when 94 kg of litter (27 kg of plastic, 6 kg of glass, 61 kg of undifferentiated litter) was collected from the same area.
In addition to the velocity, the water level results can also provide clues regarding marine litter behaviour. The scenarios defined to represent the hydrodynamic patterns of the Ave Estuary demonstrated that, as expected, the higher the river flow, the higher the water level, with the highest values observed during high-tide conditions of the spring tide. The regions most prone to higher water levels during ebbs are located in the most upstream areas. High water levels can be found upstream during high-tide conditions of the extreme events. Flooded areas were observed on both margins near the river mouth and next to the breakwaters for the extreme river flow scenario. These are potential regions of litter accumulation due to the effect of the tides and strong river flows, as well as the wet and dry areas generated due to the tides and identified on the eastern estuarine margin. Litter deposited in these regions can be washed away with the next high tide or flood that reaches the same or a higher water level if not collected on time.
The hydrological model can also give some insights about marine litter accumulation and transportation. The results obtained for the modelled period (June 2020–July 2023) demonstrated that the normal Ave River flow is low, not exceeding 30 m3 s−1, except for regular winter conditions, where river flows of about 50 m3 s−1, 100 m3 s−1 and 200 m3 s−1 were observed, and also two extreme event conditions where the river flow reached 300 m3 s−1 and 500 m3 s−1. It was demonstrated that, even considering the scarce in situ data available, such extreme events regularly take place in the Ave Estuary with a return period of 3 years. These events can have an effect on the litter accumulated on the margins, returning it to the water masses and transporting it to the ocean. During the BlueWWater project (https://bluewwater.eu/, accessed on 4 September 2025) campaigns, which were performed upstream the Ave Estuary weir by some of the authors, litter was observed hanging from the branches of trees near the river margins at a height of around 2.5 m. If not collected before the next extreme event, this litter, deposited during high river flow events, can be washed back again and transported to the ocean.

6. Conclusions

This manuscript summarizes work performed to understand the main hydrodynamic patterns of a small and shallow estuarine region: the Ave Estuary. To accomplish this task, two numerical models were implemented, including a hydrological and a hydrodynamic model, which are based on the Wflow and on the 2DH module of the Delft3D FM, respectively. The hydrological numerical model was implemented to compensate for the lack of river flow data for this estuarine region.
Both models were calibrated and validated, with satisfactory results obtained. Particularly for the hydrodynamic model, several scenarios were designed to validate the model and to understand the main hydrodynamic patterns of the estuary, from low to high river flows, considering different tidal conditions (spring and neap tides). Applying the validation procedures, the results achieved for water elevations were satisfactory. For the velocity, results seem to be less accurate due to the strong stratification of this estuary and the limitations of the observational datasets. However, considering these limitations, the validation results obtained for the velocity can also be considered satisfactory.
It was demonstrated that the Ave Estuary hydrodynamics are driven by tides and river discharge. The estuary presents a strong stratification for low river discharge conditions. When high river discharge is present, the oceanic water is flushed out resulting in a freshwater column. Velocities are normally low (around 0.5 m s−1) but can reach stronger values during extreme river flow conditions (2 m s−1). Regions prone to be flooded were also identified.
Based on the obtained results, several hypotheses about the aquatic litter transport and hotspots were proposed, identifying possible accumulation areas with low velocity patterns that persist even during extreme events and flooding conditions.
This study demonstrates the importance of constructing accurate numerical models to understand the main hydrodynamic and transport patterns in estuarine regions. Numerical models can and should be used as decision-making support tools for an effective and integrated estuarine management, providing key results for estuarine intervention, to optimize the installation of technologies and to understand litter transport. Knowledge of estuarine dynamics and behaviour is essential to promote community safety, sustainable management of estuarine ecosystems, and to tackle the issue of aquatic pollution.

Author Contributions

Conceptualization, F.B. and I.I.; Methodology, F.B., H.B. and I.I.; Software, L.B.A., F.B., H.B., A.B. and I.I.; Validation, L.B.A., F.B., H.B. and I.I.; Formal Analysis, L.B.A., F.B., H.B. and I.I.; Writing—Original Draft Preparation, L.B.A., F.B., H.B. and I.I.; Writing—Review and Editing, L.B.A., F.B., H.B., A.B., L.R.V., S.C.A., G.F.K., I.S.-P. and I.I.; Visualization, L.B.A., F.B., H.B., A.B. and I.I.; Project Administration, L.R.V. and I.S.-P.; Funding Acquisition, I.S.-P. All authors have read and agreed to the published version of the manuscript.

Funding

This research was partially supported by the Strategic Funding UIDB/04423/2020 and UIDP/04423/2020 through national funds provided by the FCT—Foundation for Science and Technology—and the European Regional Development Fund (ERDF). This contribution was also funded by the EU co-funded project H2020 MAELSTROM—Smart technology for MArinE Litter SusTainable Removal and Management (EC Grant agreement no: 101000832 supported by the Program—Horizon 2020 Framework of the European Union for Research and Innovation (2014–2020). I. Iglesias, and L. R. Vieira also acknowledge FCT financing through the CEEC program (2022.07420.CEECIND; 2021.02308.CEECIND).

Data Availability Statement

The raw data supporting the conclusions of this article will be made available by the authors on request.

Conflicts of Interest

Frans Buschman and Helene Boisgontier were employed by the company Deltares. All the authors declare that the research was conducted in the absence of any commercial or financial relationships that could be construed as a potential conflict of interest. The funders had no role in the design of the study; in the collection, analyses, or interpretation of data; in the writing of the manuscript; or in the decision to publish the results.

References

  1. Díez-Minguito, M.; Bermúdez, M.; Gago, J.; Carretero, O.; Viñas, L. Observations and idealized modelling of microplastic transport in estuaries: The exemplary case of an upwelling system (Ría de Vigo, NW Spain). Mar. Chem. 2020, 222, 103780. [Google Scholar] [CrossRef]
  2. Kennish, M.J. Environmental threats and environmental future of estuaries. Environ. Conserv. 2002, 29, 78–107. [Google Scholar] [CrossRef]
  3. Yang, L.; Zhang, Y.; Kang, S.; Wang, Z.; Wu, C. Microplastics in Freshwater Sediment: A Review on Methods, Occurrence, and Sources. Sci. Total Environ. 2020, 754, 141948. [Google Scholar] [CrossRef]
  4. Simone, G. Environmental Data Collection for Ecological Status Assessment and Monitoring of Microplastics Pollution in Sediments in the Ave River Estuary, Portugal. Master’s Thesis, Università di Bologna, Bologna, Italy, 2023. [Google Scholar]
  5. Meire, P.; Ysebaert, T.; Damme, S.V.; den Bergh, E.V.; Maris, T.; Struyf, E. The Scheldt estuary: A description of a changing ecosystem. Hydrobiologia 2005, 540, 1–11. [Google Scholar] [CrossRef]
  6. Iglesias, I.; Almeida, C.M.R.; Teixeira, C.; Mucha, A.P.; Magalhães, A.; Bio, A.; Bastos, L. Linking contaminant distribution to hydrodynamic patterns in an urban estuary: The Douro estuary test case. Sci. Total Environ. 2020, 707, 135792. [Google Scholar] [CrossRef]
  7. Iglesias, I.; Buschman, F.A.; Simone, G.; Amorim, F.; Bio, A.; Vieira, L.R.; Boisgontier, H.; Zaggia, L.; Moschino, V.; Madricardo, F.; et al. Hydrodynamics of a highly stratified small estuary and the influence of nearby river plumes. Estuar. Coast. Shelf Sci. 2024, 304, 108843. [Google Scholar] [CrossRef]
  8. Corti, S.; Pennati, V. A 3-D hydrodynamic model of river flow in a delta region. Hydrol. Process. 2000, 14, 2301–2309. [Google Scholar] [CrossRef]
  9. Putra, S.S.; Wegen, M.V.D.; Reyns, J.; Dam, A.V.; Solomatine, D.P.; Roelvink, J.A. Multi Station Calibration of 3D Flexible Mesh Model: A Case Study of the Columbia Estuary. Procedia Environ. Sci. 2015, 28, 297–306. [Google Scholar] [CrossRef][Green Version]
  10. Jones, J.E.; Davies, A.M. Application of a finite element model to the computation of tides in the Mersey Estuary and Eastern Irish Sea. Cont. Shelf Res. 2010, 30, 491–514. [Google Scholar] [CrossRef]
  11. Robins, P.E.; Davies, A.G. Morphological controls in sandy estuaries: The influence of tidal flats and bathymetry on sediment transport. Ocean Dyn. 2010, 60, 503–517. [Google Scholar] [CrossRef]
  12. Monteiro, I.O.; Marques, W.C.; Fernandes, E.H.; Gonçalves, R.C.; Moller, O.O. On the Effect of Earth Rotation, River Discharge, Tidal Oscillations, and Wind in the Dynamics of the Patos Lagoon Coastal Plume. J. Coast. Res. 2011, 27, 120–130. [Google Scholar] [CrossRef]
  13. van Maren, D.S.; van Kessel, T.; Cronin, K.; Sittoni, L. The impact of channel deepening and dredging on estuarine sediment concentration. Cont. Shelf Res. 2015, 95, 1–14. [Google Scholar] [CrossRef]
  14. Zarzuelo, C.; Díez-Minguito, M.; Ortega-Sánchez, M.; López-Ruiz, A.; Losada, M.Á. Hydrodynamics response to planned human interventions in a highly altered embayment: The example of the Bay of Cádiz (Spain). Estuar. Coast. Shelf Sci. 2015, 167, 75–85. [Google Scholar] [CrossRef]
  15. Tosic, M.; Martins, F.; Lonin, S.; Izquierdo, A.; Restrepo, J.D. Hydrodynamic modelling of a polluted tropical bay: Assessment of anthropogenic impacts on freshwater runoff and estuarine water renewal. J. Environ. Manag. 2019, 236, 695–714. [Google Scholar] [CrossRef] [PubMed]
  16. Siemes, R.W.; Duong, T.M.; Borsje, B.W.; Hulscher, S.J. Climate Change Can Intensify the Effects of Local Interventions: A Morphological Modeling Study of a Highly Engineered Estuary. J. Geophys. Res. Earth Surf. 2024, 129, e2023JF007595. [Google Scholar] [CrossRef]
  17. Horritt, M.S.; Bates, P.D. Evaluation of 1D and 2D numerical models for predicting river flood inundation. J. Hydrol. 2002, 268, 87–99. [Google Scholar] [CrossRef]
  18. Chua, V.P.; Xu, M. Impacts of sea-level rise on estuarine circulation: An idealized estuary and San Francisco Bay. J. Mar. Syst. 2014, 139, 58–67. [Google Scholar] [CrossRef]
  19. Gomes, M.P.; Pinho, J.L.; Carmo, J.S.A.D.; Santos, L. Hazard assessment of storm events for The Battery, New York. Ocean Coast. Manag. 2015, 118, 22–31. [Google Scholar] [CrossRef][Green Version]
  20. Yang, Z.; Wang, T.; Voisin, N.; Copping, A. Estuarine response to river flow and sea-level rise under future climate change and human development. Estuar. Coast. Shelf Sci. 2015, 156, 19–30. [Google Scholar] [CrossRef]
  21. Teng, J.; Jakeman, A.J.; Vaze, J.; Croke, B.F.W.; Dutta, D.; Kim, S. Flood inundation modelling: A review of methods, recent advances and uncertainty analysis. Environ. Model. Softw. 2017, 90, 201–216. [Google Scholar] [CrossRef]
  22. Weber de Melo, W.; Pinho, J.L.; Iglesias, I.; Bio, A.; Avilez-Valente, P.; Vieira, J.M.P.; Bastos, L.; Veloso-Gomes, F. Hydro- and Morphodynamic Impacts of Sea Level Rise: The Minho Estuary Case Study. J. Mar. Sci. Eng. 2020, 8, 441. [Google Scholar] [CrossRef]
  23. Iglesias, I.; Bio, A.; Melo, W.; Avilez-Valente, P.; Pinho, J.; Cruz, M.; Gomes, A.; Vieira, J.; Bastos, L.; Veloso-Gomes, F. Hydrodynamic Model Ensembles for Climate Change Projections in Estuarine Regions. Water 2022, 14, 1966. [Google Scholar] [CrossRef]
  24. Menten, G.; Melo, W.; Pinho, S.; Iglésias, I.; Antunes, S. Simulation of Saltwater Intrusion in the Minho River Estuary under Sea Level Rise Scenarios. Water 2023, 15, 2313. [Google Scholar] [CrossRef]
  25. Hu, K.; Ding, P.; Wang, Z.; Yang, S. A 2D/3D hydrodynamic and sediment transport model for the Yangtze Estuary, China. J. Mar. Syst. 2009, 77, 114–136. [Google Scholar] [CrossRef]
  26. Néelz, S.; Pender, G. Benchmarking the Latest Generation of 2D Hydraulic Modelling Packages. 2013. Available online: https://www.gov.uk/government/publications/benchmarking-the-latest-generation-of-2d-hydraulic-flood-modelling-packages (accessed on 4 September 2025).
  27. Wan, Y.; Gu, F.; Wu, H.; Roelvink, D. Hydrodynamic evolutions at the Yangtze Estuary from 1998 to 2009. Appl. Ocean Res. 2014, 47, 291–302. [Google Scholar] [CrossRef]
  28. Symonds, A.M.; Vijverberg, T.; Post, S.; Van der Spek, B.-J.; Henrotte, J.; Sokolewicz, M. Comparison between Mike 21 FM, Delft3d and Delft3d FM Flow Models of Western Port Bay, Australia. Coast. Eng. Proc. 2017, 1, 11. [Google Scholar] [CrossRef]
  29. Iglesias, I.; Venâncio, S.; Pinho, J.L.; Avilez-Valente, P.; Vieira, J.M.P. Two Models Solutions for the Douro Estuary: Flood Risk Assessment and Breakwater Effects. Estuaries Coasts 2018, 42, 348–364. [Google Scholar] [CrossRef]
  30. Iglesias, I.; Bio, A.; Bastos, L.; Avilez-Valente, P. Estuarine hydrodynamic patterns and hydrokinetic energy production: The Douro estuary case study. Energy 2021, 222, 119972. [Google Scholar] [CrossRef]
  31. Largier, J.L. Recognizing Low-Inflow Estuaries as a Common Estuary Paradigm. Estuaries Coasts 2023, 46, 1949–1970. [Google Scholar] [CrossRef]
  32. APA—Associação Portuguesa do Ambiente. Plano de Gestão de Região Hidrográfica; Parte 2—Caracterização e, Diagnóstico; Região Hidrográfica do Cávado, Ave e Leça; APA: Amadora, Portugal, 2015. [Google Scholar]
  33. Gonçalves, A.M.; Alpuim, T. Water quality monitoring using cluster analysis and linear models. Environmetrics 2011, 22, 933–945. [Google Scholar] [CrossRef]
  34. Rocha, M.J.; Madureira, T.V.; Venade, C.S.; Martins, I.; Campos, J.; Rocha, E. Presence of estrogenic endocrine disruptors in three European estuaries in Northwest Iberian Peninsula (Portugal). Toxicol. Environ. Chem. Rev. 2019, 101, 244–264. [Google Scholar] [CrossRef]
  35. Antunes, S.C.; Vieira, L.R.; Iglesias, I.; Sousa-Pinto, I.; Correia, A.M.; Moreira, R.; Padilha, D.; Moschino, V.; Nicoletta, N.; Sigovini, M.; et al. Ecosystem State and ML Pollution Assessment in the Demo Site (Lagoon of Venice and Ave estuary); MAELSTROM Deliverable 2.3; European Commission: Brussels, Belgium, 2022; p. 143. [Google Scholar] [CrossRef]
  36. Abel, M. D2.2 First Version of Workflow Tools Published That Allows to Perform Quarterly Benchmarks of ML Solutions. 2023. Available online: https://www.maelstrom-eurohpc.eu/content/docs/uploads/doc14.pdf (accessed on 4 September 2025).
  37. Bio, A.; Gonçalves, J.A.; Magalhães, A.; Pinheiro, J.; Bastos, L. Combining Low-Cost Sonar and High-Precision Global Navigation Satellite System for Shallow Water Bathymetry. Estuaries Coasts 2020, 45, 1000–1011. [Google Scholar] [CrossRef]
  38. Deltares. 2025. Available online: https://www.deltares.nl/en/software-and-data/products/wflow-catchment-hydrology (accessed on 4 September 2025).
  39. Buschman, F.; Iglesias, I.; Ghezzo, M.; McKiver, W.; De Pascalis, F.; Zaggia, L.; Boisgontier, H.; Tiessen, M. MAELSTROM D2.2: Numerical Modelling and Field Campaigns to Support Litter Removal at the Demo Sites; Deltares 2023, CIIMAR, CNR; European Commission: Brussels, Belgium, 2023. [Google Scholar] [CrossRef]
  40. Yamazaki, D.; Ikeshima, D.; Sosa, J.; Bates, P.D.; Allen, G.; Pavelsky, T. MERIT Hydro: A high-resolution global hydrography map based on latest topography datasets. Water Resour. Res. 2019, 55, 5053–5073. [Google Scholar] [CrossRef]
  41. Hengl, T.; Mendes de Jesus, J.; Heuvelink, G.B.; Ruiperez Gonzalez, M.; Kilibarda, M.; Blagotić, A.; Shangguan, W.; Wright, M.N.; Geng, X.; Bauer-Marschallinger, B.; et al. SoilGrids250m: Global gridded soil information based on machine learning. PLoS ONE 2017, 12, e0169748. [Google Scholar] [CrossRef]
  42. Cornes, R.C.; van der Schrier, G.; van den Besselaar, E.J.M.; Jones, P.D. An Ensemble Version of the E-OBS Temperature and Precipitation Data Sets. J. Geophys. Res. Atmos. 2018, 123, 9391–9409. [Google Scholar] [CrossRef]
  43. Makkink, G.F. Examination of Penman’s revised formula. Neth. J. Agric. Sci. 1957, 5, 290–305. (In Esperanto) [Google Scholar] [CrossRef]
  44. ECMWF ERA5 Hourly Data on Single Levels from 1940 to Present. 2018. Available online: https://cds.climate.copernicus.eu/datasets/reanalysis-era5-single-levels?tab=overview (accessed on 4 September 2025).
  45. Hersbach, H.; Bell, B.; Berrisford, P.; Hirahara, S.; Horányi, A.; Muñoz-Sabater, J.; Nicolas, J.; Peubey, C.; Radu, R.; Schepers, D.; et al. The ERA5 global reanalysis. Q. J. R. Meteorol. Soc. 2020, 146, 1999–2049. [Google Scholar] [CrossRef]
  46. SNIRH—Sistema Nacional de Informação de Recursos Hídricos. Available online: https://snirh.apambiente.pt (accessed on 4 September 2025).
  47. European Marine Observation and Data Network (EMODnet). Bathymetry. 2020. Available online: https://www.emodnet-bathymetry.eu/ (accessed on 4 September 2025).
  48. Modelos Digitais do Relevo—DGT. 2011. Available online: https://www.dgterritorio.gov.pt/cartografia/cartografia-topografica/modelos-digitais (accessed on 4 September 2025).
  49. CIIMAR GIS Data Server. 2025. Available online: https://gis.ciimar.up.pt/ (accessed on 4 September 2025).
  50. Egbert, G.D.; Erofeeva, S.Y. Efficient Inverse Modeling of Barotropic Ocean Tides. J. Atmos. Ocean. Technol. 2002, 19, 183–204. [Google Scholar] [CrossRef]
  51. Pawlowicz, R.; Beardsley, B.; Lentz, S. Classical tidal harmonic analysis including error estimates in MATLAB using T_TIDE. Comput. Geosci. 2002, 28, 929–937. [Google Scholar] [CrossRef]
  52. Imhoff, R.O.; van Verseveld, W.J.; van Osnabrugge, B.; Weerts, A.H. Scaling Point-Scale (Pedo)transfer Functions to Seamless Large-Domain Parameter Estimates for High-Resolution Distributed Hydrologic Modeling: An Example for the Rhine River. Water Resour. Res. 2020, 56, e2019WR026807. [Google Scholar] [CrossRef]
  53. Clavel-Henry, M.; Sol’e, J.; Kristiansen, T.; Bahamon, N.; Rotllant, G.; Company, J. Modeled buoyancy of eggs and larvae of the deep-sea shrimp aristeus antennatus (crustacea: Decapoda) in the northwestern Mediterranean Sea. PLoS ONE 2020, 15, e0223396. [Google Scholar] [CrossRef] [PubMed]
  54. Peliz, A.; Marchesiello, P.; Dubert, J.; Marta-Almeida, M.; Roy, C.; Queiroga, H. A study of crab larvae dispersal on the Western Iberian Shelf: Physical processes. J. Mar. Syst. 2007, 68, 215–236. [Google Scholar] [CrossRef]
  55. Marta-Almeida, M.; Ruiz-Villarreal, M.; Pereira, J.; Otero, P.; Cirano, M.; Zhang, X.; Hetland, R. Efficient tools for marine operational forecast and oil spill tracking. Pollut. Bull. 2013, 71, 139–151. [Google Scholar] [CrossRef] [PubMed]
  56. Amorim, F.N.; Caetano, M.; Bastos, L.; Iglesias, I. Deep-sea mining rock-fragment dispersal scenarios associated with submesoscale forcings: A case study in the Atlantic. Heliyon 2024, 10, e34174. [Google Scholar] [CrossRef] [PubMed]
  57. Núñez, P.; García, A.; Mazarrasa, I.; Juanes, J.A.; Abascal, A.J.; Méndez, F.; Castanedo, S.; Medina, R. A methodology to assess the probability of marine litter accumulation in estuaries. Mar. Pollut. Bull. 2019, 144, 309–324. [Google Scholar] [CrossRef]
  58. Krelling, A.P.; Souza, M.M.; Williams, A.T.; Turra, A. Transboundary movement of marine litter in an estuarine gradient: Evaluating sources and sinks using hydrodynamic modelling and ground truthing estimates. Mar. Pollut. Bull. 2017, 119, 48–63. [Google Scholar] [CrossRef]
  59. Baci, N.O.; Santiago-Collazo, F.L.; Woodson, C.B.; Jambeck, J.R. Advancing numerical models for land-to-ocean litter transport: A review of hydrodynamic processes and inland contributions. Sci. Total Environ. 2025, 970, 179013. [Google Scholar] [CrossRef]
  60. De Almeida Duarte, L.F.; Ribeiro, R.B.; De Medeiros, T.V.; Scheppis, W.R.; Gimiliani, G.T. Are mangroves hotspots of marine litter for surrounding beaches? Hydrodynamic modeling and quali-quantitative analyses of waste in southeastern Brazil. Reg. Stud. Mar. Sci. 2023, 67, 103177. [Google Scholar] [CrossRef]
Figure 1. Ave Estuary location (yellow star) in northern Portugal (a), and main features inside the estuary (b).
Water 17 02698 g001
Figure 2. Numerical modelling grid area (a), and detail of the Ave Estuary region with representation of the topo-bathymetric conditions (b).
Water 17 02698 g002
Figure 3. Ave hydrological basin and location of the stations for the observed rainfall (a), and discharge (b) data.
Water 17 02698 g003
Figure 4. Rainfall comparison between observations (black), E-OBS (blue) and ERA5 (green) considering total rainfall per year (mm yr−1) (ac), and average rainfall per month (mm month−1) (df), for three of the twelve selected stations for the Ave River hydrological basin, namely: Escudeiros (a,d), Brancelhe (b,e), and Parada (c,f).
Water 17 02698 g004
Figure 5. Observed (black) and modelled discharge (m3 s−1) using precipitation from E-OBS (blue) or ERA5 (green) at two of the twelve selected stations for the Ave River hydrological basin, namely: Ponte Brandão (a), and Ponte Ave (b).
Water 17 02698 g005
Figure 6. Modelled river flow at the estuarine location between June 2020 and July 2023.
Water 17 02698 g006
Figure 7. Validation results for the VS1 scenario. Water level time series at (a) site 1, and (b) site 2 calibration stations (Figure 1); (c) modelled river discharge at the estuary. Field data (continuous grey line) and numerical data (dotted black line). Water levels are relative to MSL.
Water 17 02698 g007
Figure 8. Validation results for the VS2 scenario. Water level time series at (a) site 1, and (b) site 2 calibration stations (Figure 1); (c) velocity magnitude time series at site 1; (d) modelled river discharge at the estuary. Field data (continuous grey line) and numerical data (dotted black line). Water levels are relative to MSL.
Water 17 02698 g008
Figure 9. Validation results for the VS3 scenario. Water level time series at (a) site 1, and (b) site 2 calibration stations (Figure 1); (c) velocity magnitude time series at site 1; (d) modelled river discharge at the estuary. Field data (continuous grey line) and numerical data (dotted black line). Water levels are relative to MSL.
Water 17 02698 g009
Figure 10. Water level (m MSL) evolution for each considered scenario ((a) S1, (b) S2 and (c) S3) and observational sites (OS1, OS2, OS3 and OS4).
Water 17 02698 g010
Figure 11. Water level (m MSL) evolution for each considered observational site ((a) OS1, (b) OS2, (c) OS3 and (d) OS4) and scenario (S1, S2 and S3).
Water 17 02698 g011
Figure 12. Water level (MSL) for high-tide (HT) and low-tide (LT) conditions during spring (ST) and neap tides (NT), for the three considered scenarios (S1, S2 and S3).
Water 17 02698 g012
Figure 13. Velocity for high-tide (HT) and low-tide (LT) conditions during spring (ST) and neap tides (NT), for the three considered scenarios (S1, S2 and S3). Arrows represent direction and shadows the magnitude.
Water 17 02698 g013
Table 1. Overview of the field observations.
CampaignLocationMeasurementsObservation Period
1Sites 1 and 2CTDs27 June 2022–26 July 2022
2Sites 1 and 2ADCP + CTDs31 October 2022–15 December 2022
323 May 2023–21 June 2023
Table 2. Validation simulations.
ScenariosPeriodDischarge Range (m3 s−1)Temperature (°C)Salinity
VS127 June 2022–13 July 2022 [8–10]River: 20
Ocean: 15
River: 0
Ocean: 36
VS231 October 2022–15 December 2022 [18–205]River: 14
Ocean: 17
VS319 May 2023–23 June 2023 [11–26]River: 20
Ocean: 15
Table 3. Hydrodynamic scenarios.
ScenarioDischarge
(m3 s−1)
TideTemperature
(°C)
Salinity
S1 (Summer)207 February 2023–5 March 20231736
S2 (Winter)200
S3 (Extreme)500
Table 4. Amplitude and phase obtained from measured and modelled water levels for the VS2 scenario.
Sampling SiteTidal ConstituentFrom Measured Water LevelsFrom Modelled Water Levels
Amplitude (m)Phase (°)Amplitude (m)Phase (°)
1O10.07302.090.07299.22
K10.08116.250.08121.34
M21.02118.800.96118.49
S20.34142.890.31147.11
F = 0.11F = 0.12
2O10.07300.320.07298.36
K10.08115.570.08120.86
M21.01117.810.98118.01
S20.34143.400.32146.85
F = 0.11F = 0.12
Table 5. Amplitude and phase obtained from measured and modelled water levels for the VS3 scenario.
Sampling SiteTidal ConstituentFrom Measured Water LevelsFrom Modelled Water Levels
Amplitude (m)Phase (°)Amplitude (m)Phase (°)
1O10.0723.090.079.39
K10.184.190.173.82
M21172.451.01144.81
S20.25116.050.2787.44
F = 0.14F = 0.13
2O10.0722.640.078.99
K10.0983.550.173.80
M21172.671.01144.70
S20.25116.620.2787.35
F = 0.13F = 0.13
Table 6. Error metric results for each validation scenario and sampling point (1 and 2). WL is water level, and V is velocity.
VS1VS2VS3
WL1WL2WL1WL2V1WL1WL2V1
Correlation110.940.980.780.880.880.69
RMSE0.070.060.280.170.090.370.370.03
Bias00000.02000.03
Skill110.970.9910.940.940.78
ADP0.050.050.250.140.080.310.320.03
ADN−0.06−0.05−0.27−0.14−0.08−0.32−0.32−0.01
Disclaimer/Publisher’s Note: The statements, opinions and data contained in all publications are solely those of the individual author(s) and contributor(s) and not of MDPI and/or the editor(s). MDPI and/or the editor(s) disclaim responsibility for any injury to people or property resulting from any ideas, methods, instructions or products referred to in the content.