Article

Multi-Scenario Optimization of PID Controllers for Hydro-Wind-Solar Complementary Systems Based on the DEAGNG Algorithm

by
Jun Yan
1,
Zhi Wang
2,
Yuye Li
1,
An Yan
1,
Shaoyong Liu
3,
Jinwen Luo
3,
Chu Zhang
2,* and
Chaoshun Li
2
1
China Three Gorges Corporation Wuhan Science and Innovation Park, Wuhan 430000, China
2
Institute of Water Resources and Hydropower Research, Huazhong University of Science and Technology, Wuhan 430074, China
3
Wudongde Hydropower Plant, China Yangtze Power Co., Ltd., Kunming 651511, China
*
Author to whom correspondence should be addressed.
Water 2025, 17(18), 2697; https://doi.org/10.3390/w17182697
Submission received: 21 July 2025 / Revised: 3 September 2025 / Accepted: 10 September 2025 / Published: 12 September 2025
(This article belongs to the Special Issue Research Status of Operation and Management of Hydropower Station)

Abstract

This paper focuses on the hydro–solar–wind complementary system, targeting two typical scenarios (both include PV output fluctuations driven by solar radiation intensity: wind power not participating in frequency regulation and wind power participating in frequency regulation) to conduct research on system frequency characteristic analysis and Proportional-Integral-Derivative (PID) controller parameter (KP, KI) optimization. By constructing a frequency response model that accounts for wind power penetration and output fluctuations, the dynamic regulation characteristics of the system under different scenarios are quantitatively analyzed. Given the limitations of single-objective optimization algorithms in balancing multiple performance indicators, the Decomposition-based Evolutionary Algorithm Guided by Growing Neural Gas (DEAGNG) multi-objective algorithm is introduced, with the Integral Time Absolute Error (ITAE) and the Integral Time Squared Error (ITSE) as the objective functions for parameter collaborative optimization. The results show that the optimization method based on DEAGNG can effectively improve the frequency stability of the system, reduce the mean value and maximum deviation of frequency fluctuations, and exhibit good adaptability in both scenarios. This study provides a multi-scenario-adapted PID parameter optimization scheme for hydro–solar–wind complementary systems, offering theoretical and technical support for achieving high-precision frequency control and enhancing the operational reliability of the system.

1. Introduction

With the vigorous development of renewable and clean energy in China, multi-energy complementary generation and coordinated operation have gradually become the key direction for the evolution of power systems [1]. As outlined in the 14th Five-Year Plan, China has proposed the construction of nine major clean energy bases, including the integrated hydropower–wind–solar base in the lower reaches of the Jinsha River [2]. Promoting the coordinated development of hydropower, wind power, and photovoltaic (PV) generation and accelerating the bundled deployment of clean energy sources such as hydro–wind–solar can significantly alleviate the energy crisis and environmental pollution. These efforts are of great importance for achieving the dual-carbon goals and building a new-type power system [3].
However, the current development of hydro–wind–solar complementary systems still faces many challenges [4]. The inherent randomness and intermittency of wind and solar power lead to poor active power and frequency control performance in wind and PV stations [5]. Large-scale integration of renewable energy into the grid poses significant threats to frequency stability, seriously affecting the secure and stable operation of the power grid. As the only flexible power source in the complementary system, hydropower is increasingly burdened with short-term regulation tasks due to the fluctuating input from wind and solar energy, thus intensifying its frequency regulation pressure [6]. Therefore, in-depth analysis of the impacts caused by renewable integration and power fluctuations, as well as a detailed study on the response characteristics and regulation capabilities of hydropower within complementary systems, are crucial for advancing the development of hydro–wind–solar integrated power systems [7].
Currently, a series of studies have been conducted domestically and internationally on the regulation characteristics of hydro-wind-solar hybrid systems. Yan et al. [8] proposed an aggregated system frequency response (SFR) model, which can reflect the frequency characteristics of power systems with high wind power penetration, and the accuracy of the model has been verified through simulations. Liu et al. [9] combined identification theory with a generalized predictive control algorithm to propose a control strategy for wind turbines participating in secondary frequency modulation, enabling the system to maintain frequency stability while achieving a shorter rise time and smaller overshoot. Chen et al. [10] explored the power spectral density distribution characteristics of wind power fluctuation components, obtained the spectral characteristics of wind power fluctuations under different mean values, and proposed dynamic indicators for frequency modulation effects. Yan et al. [11] established a power system frequency response model incorporating photovoltaic power generation; through qualitative analysis of characteristic quantities, they studied the impact of photovoltaic frequency modulation control strategies on the dynamic characteristics of system frequency. Yan et al. [12] developed a power system frequency response model considering the inertia support and primary frequency modulation capability of photovoltaic units, realizing quantitative evaluation of frequency characteristics under different photovoltaic penetration rates. Zhu et al. [13] proposed a primary frequency modulation strategy for hydro-wind-solar hybrid systems, and the effectiveness of the scheme was verified through simulations. Fan et al. [14] introduced the concept of resilience in hydro-wind-solar hybrid systems, constructed a three-stage conceptual model, and verified through case studies that this method is helpful for resource allocation, scheduling strategies, and safe operation. Ma et al. [15] built a new frequency response model considering wind, solar, and energy storage; by defining indicators for the frequency modulation contribution of wind, solar, and energy storage, they studied the impact of various control coefficients on frequency stability, providing guidance for the safe operation of frequency in new power systems. Zhang et al. [16] proposed an optimal capacity decision method based on complementary guarantee rate and cumulative time proportion for the determination of the optimal capacity of hydro-wind-solar hybrid systems, and proved its feasibility and universality. However, current research mostly focuses on the impact of single wind power or photovoltaic power on the regulation characteristics of power systems, with relatively few studies on the frequency response of combined hydro-wind-solar systems [17]. Moreover, most studies focus on primary frequency modulation strategies of hybrid systems, with relatively single research scenarios, lacking in-depth research on frequency modulation control of hydro-wind-solar hybrid systems under multiple regulation scenarios [18].
Nevertheless, existing studies mainly focus on the individual impacts of wind or PV on system regulation characteristics [19]. Research on frequency response in hydro–wind–solar integrated systems remains limited and tends to focus on primary frequency control strategies under a single regulation scenario. In contrast, the issue of frequency control optimization under multiple regulation scenarios remains insufficiently addressed [20].
Hydro–wind–solar coordination is a crucial approach to achieving the dual-carbon objectives [21]. However, the lack of research on multi-scenario regulation imposes significant constraints on frequency control within complementary systems. In multi-regulation scenarios, the frequency optimization of such systems faces complex and dynamic challenges. Traditional single-objective optimization methods often target Proportional-Integral-Derivative (PID) controller tuning under a single Scenario, which proves inadequate in multi-scenario applications [22].
To address this issue, this study proposes a multi-objective optimization method based on the Decomposition-based Evolutionary Algorithm Guided by Growing Neural Gas (DEAGNG) algorithm, specifically designed for two operating Scenarios (both including PV output fluctuations driven by solar radiation intensity changes as a common disturbance factor): (i) wind power not participating in frequency regulation under 30% wind penetration (Scenario 1), and (ii) wind power participating in frequency regulation with 30% wind penetration (Scenario 2). The proposed approach simultaneously optimizes the proportional gain (KP) and integral gain (KI) of the PID controller to suit both Scenarios. Simulation results demonstrate that the optimized parameters significantly improve frequency stability in both scenarios, effectively reducing the mean and maximum deviation of frequency fluctuations, thereby confirming the effectiveness and superiority of the multi-objective optimization approach in handling scenario-specific regulation tasks.
The structure of this study is organized as follows: Section 2 establishes the mathematical models of the hydro-wind-solar complementary system, including detailed formulations for the hydroturbine-governor system, wind turbine generator, and photovoltaic power generation system, along with an analysis of their coordinated frequency response characteristics (with explicit elaboration on the two core Scenarios and the role of PV fluctuations). Section 3 elaborates on the proposed DEAGNG algorithm, covering the principles of its constituent components and the detailed procedure of the integrated multi-objective optimization framework for PID controller parameters. Section 4 presents case simulations, comparing the performance of the DEAGNG algorithm with other single-objective and multi-objective optimization algorithms under the two aforementioned typical scenarios (consistently incorporating PV disturbance factors), and analyzing the frequency response results and stability metrics. Finally, Section 5 summarizes the key findings of this study and outlines potential directions for future research.

2. Mathematical Modeling of Hydro–Wind–Solar Complementary System

This section focuses on developing a mathematical model of a hydro–wind–solar complementary system. To facilitate the analysis of the dynamic characteristics of coordinated regulation within the hybrid system, mathematical models of the hydroturbine governor system and the wind turbine generator are constructed, respectively. These models are then integrated to form a coupled model of the hydro–wind–solar generation system, providing theoretical support for subsequent studies on the frequency response characteristics of the system.

2.1. Mathematical Model of the Hydroturbine and Governor System

This subsection establishes the mathematical model of the hydropower generation system. The system primarily comprises several interconnected subsystems, including the hydroturbine and penstock, governor, generator, and load. The respective subsystem models are described as follows [23].

2.1.1. Hydroturbine and Penstock Model

The hydroturbine serves as the key device that converts the kinetic and potential energy of water into mechanical energy. For analytical purposes, a linearized mathematical model of the hydroturbine is developed. The six-parameter model of the hydroturbine is expressed as follows:
Δ Q = e q h Δ h + e q ω Δ ω r + e q y Δ y Δ T m = e h Δ h + e ω Δ ω r + e y Δ y
e h = Δ T m h ; e ω = Δ T m ω ; e y = Δ T m y
e qh = Δ Q h ; e q ω = Δ Q ω ; e qy = Δ Q y
where ΔTm denotes the relative deviation of the turbine torque, ΔQ is the relative deviation of turbine flow rate, Δy is the relative deviation of guide vane opening, Δ ω r represents the relative deviation of turbine rotational speed, Δh is the relative deviation of water head. And the coefficients are defined as: ey: transfer coefficient of torque with respect to guide vane opening, e ω : transfer coefficient of torque with respect to rotational speed, eh: transfer coefficient of torque with respect to head, eqy: transfer coefficient of flow with respect to guide vane opening, e q ω : transfer coefficient of flow with respect to speed, eqh: transfer coefficient of flow with respect to head.
The fluid motion in the penstock is governed by the momentum equation and the continuity equation, which can be written as:
h x + 1 g A Q t + f Q 2 2 g D A 2 = 0
Q x + g A a 2 h t = 0
where h is the water head, Q is the flow rate, x denotes the distance from the upstream end, g is the gravitational acceleration, A is the cross-sectional area of the pipeline, f is the Darcy–Weisbach friction factor, D is the pipe diameter, and the symbol a denotes the wave propagation speed (celerity) of the water column inside the penstock and is a critical parameter governing water-hammer effects. Its magnitude is governed by the material properties of the pipe. In this study, the penstock is made of the steel grade commonly employed in engineering practice-Q345 steel (referring to the actual material used in the Wudongde Hydropower Station). Based on the typical engineering range for wave speed in steel penstocks (1200–1400 m/s) and taking into account the station-specific geometry of an internal diameter of 8.5 m and a wall thickness of 0.08 m, the wave speed is set to a = 1280 m/s, t represents the time variable, which is a critical parameter in the equations as it accounts for the temporal changes in the flow rate and water head.
By neglecting friction and head loss, and applying a Taylor series expansion, the water hammer transfer function can be obtained as:
G An ( s ) = 2 h w i = 0 m ( 0.5 T r s ) 2 i + 1 ( 2 i + 1 ) ! i = 0 m ( 0.5 T r s ) 2 i ( 2 i ) !
h w = a · Q 2 g A H
T r = 2 L a
where hw is the water head, T is a time constant related to the system, s is the Laplace variable, and m is the summation index used to denote the number of terms in the series expansion.
When m = 0, a rigid water hammer model of the pressurized penstock can be obtained:
G A s = T w s
where Tw represents the water hammer inertia time constant.

2.1.2. Speed Regulator Model

The speed regulator is the core control system of the unit, which can maintain stability of power and frequency of the unit. In this paper, the speed regulator adopts a PI control (Proportional-Integral control) strategy. The servo system, acting as the actuator of the speed regulator, is responsible for converting the output electrical signal into a mechanical signal. It includes various nonlinear characteristics such as dead band, saturation, delay, and speed limitation. Since the research in this paper focuses on small-disturbance operating Scenarios, the nonlinear characteristics are neglected.
The mathematical model of the PI control is given by:
G p i ( s ) = K P + K I s
where G p i s is the transfer function of the PI controller (Proportional-Integral Controller Transfer Function), which converts the speed deviation signal into the control command of the governor. KP is proportional gain, which sets the controller’s immediate response to the present error; KI is integral gain, which sets the controller’s response to the accumulated past error and eliminates steady-state error; s is the Laplace variable. This transfer function achieves precise control of the turbine guide vane opening through the proportional link that quickly responds to current errors and the integral link that eliminates steady-state errors.
The mathematical model of the speed regulator can be expressed as:
G g s = 1 T h t g s + 1
where G g ( s ) is the transfer function of the governor (Governor Transfer Function), which describes the dynamic adjustment characteristics of the governor to the turbine guide vane opening after receiving the output signal of the PI controller. Thtg is the time constant of the turbine speed regulator (with a value of 0.2, see Table 1), which reflects the response lag characteristic of the governor; s is the Laplace variable. This transfer function embodies the first-order inertial filtering effect of the governor on the control command, avoiding the water hammer effect caused by sudden changes in the guide vane opening.
Considering the water hammer effect, to ensure the stability of the turbine, a water hammer compensation loop must be incorporated into the model, which can be represented as:
G w h ( s ) = T g h s + 1 T g h ( R T / R 2 ) s + 1
where G w h ( s ) is the transfer function of the water hammer compensation link (Water Hammer Compensation Transfer Function), which is used to suppress the water hammer effect in the penstock and avoid large fluctuations in system frequency caused by water hammer impact. Tgh is the reset time parameter of the water hammer compensation controller (with a value of 5, see Table 1), which determines the decay rate of the compensation effect; RT is the transient slope coefficient (with a value of 0.5, see Table 1), which is used to temporarily adjust the droop characteristic of the governor; R2 is the turbine regulation coefficient (with a value of 0.048, see Table 1), which reflects the proportional relationship between the unit output and the frequency deviation; s is the Laplace variable. Through its lead-lag characteristics, this transfer function suppresses the head fluctuation caused by the change of guide vane opening in advance and enhances the frequency stability of the system.

2.1.3. Generator and Load Model

A first-order model of the generator is adopted in this paper, taking into account the rotational characteristics of the generator rotor. The expression is as follows:
J d ω d t = M t M g M t = M t 0 + Δ M t + M t ω Δ ω M g = M g 0 + Δ M g + M g ω Δ ω
where J represents the moment of inertia of the unit, which is a physical quantity describing the size of the unit’s rotational motion inertia. Mt indicates the main driving torque of the unit. Mg denotes the load torque of the unit. ω is the angular velocity of the unit, Mt0 and Mg0 are the main driving torque and load torque under stable operating Scenarios, respectively, ΔMt is the change in the main driving torque caused by the guide vane opening and head, ΔMg is the change in the load torque, M t ω Δ ω   and   M g ω Δ ω are the changes in the main driving torque and load torque caused by the change in angular velocity.
Combining consideration of the moment of inertia of the load, the transfer function of the generator and load model can be obtained as:
G g l ( s ) = 1 ( T a + T b ) s + e n
where Ta is the inertia time constant of the unit, Tb is the inertia time constant of the load, and en is the overall self-regulation coefficient of the unit.

2.2. Mathematical Model of Wind Turbine Generators

This subsection primarily focuses on establishing the mathematical model of wind turbine generators and the output power model of wind energy. The principle of wind power generation is based on the rotation of the wind turbine blades driven by the wind, which in turn drives the generator to produce electricity. Through wind turbine systems, wind energy can be converted into rotational mechanical energy and ultimately transformed into electrical energy. The output power of wind energy is influenced by multiple parameters, including wind speed, air density, and the cross-sectional area of the rotor, and is calculated using the following formula [24]:
P w = 1 2 C p ρ A V 3
where Pw is the wind power output, Cp is the power coefficient, ρ is the air density, A is the cross-sectional area of the wind turbine rotor, and V is the wind speed. The coefficient Cp can be calculated using the following equation:
C p = 0.57 ( λ 0.022 β 2 5.6 ) e 0.17 λ
where λ is the tip-speed ratio and β is the pitch angle, which is set to 10° in this paper. The following relationships hold:
λ = ω r w R V = π R n 30 V
where ωrw is the rotational angular velocity of the wind turbine, n is the rotational speed of the wind turbine, and R is the radius of the wind turbine rotor.

2.3. Mathematical Model of Photovoltaic Power Generation System

This subsection primarily focuses on establishing the mathematical model for the output power of PV power generation. The output power of a photovoltaic system is mainly influenced by solar radiation and ambient temperature, with solar radiation being the key factor determining the power generation of photovoltaic systems. The solar radiation intensity is defined as the radiative power per unit area projected by solar radiation. Therefore, by establishing a solar radiation intensity model, the output power of the photovoltaic system can be calculated [25].
The horizontal solar radiation model studies the solar radiation received on a horizontal surface, which includes both direct radiation Ib and diffuse radiation Id The formula for calculating direct radiation Ib is as follows:
I b = I n sin α
where In is the radiation intensity of the light on its vertical plane, and α is the angle between the light and the ground, which can be given by:
sin α = sin φ sin δ + cos φ cos δ cos ω s
where φ is the latitude, δ is the solar declination, and ωs is the solar hour angle.
The calculation of In is as follows:
I n = S P m m
where Pm is the integrated average atmospheric transmittance coefficient, representing the degree of attenuation of radiation through the atmosphere, which can be given by empirical values; S is the solar constant corrected for the Earth-Sun distance, defined by:
S = S 1 + 0.034 cos 2 π n T / 365
where S is the solar constant, and nT is the day of the year.
According to the Bougher theory, assuming that half of the solar scattering reaches the ground, the mathematical expression for diffuse radiation Id is:
I d = 1 2 S ( 1 P m m ) sin α
Thus, the horizontal solar radiation intensity I can be expressed as:
I = I b + I d
The output power of the photovoltaic cell Pph can be calculated using the following equation:
P p h = η A I ( 1 + α t ( T T 0 ) )
where η is the conversion efficiency of the cell, A is the effective area of the cell, I is the horizontal solar radiation intensity, α t is the temperature coefficient of the cell, T is the temperature of the cell, and T0 is the reference temperature of the cell.

2.4. Analysis of Response Characteristics of the Hydro-Wind-Solar Complementary System

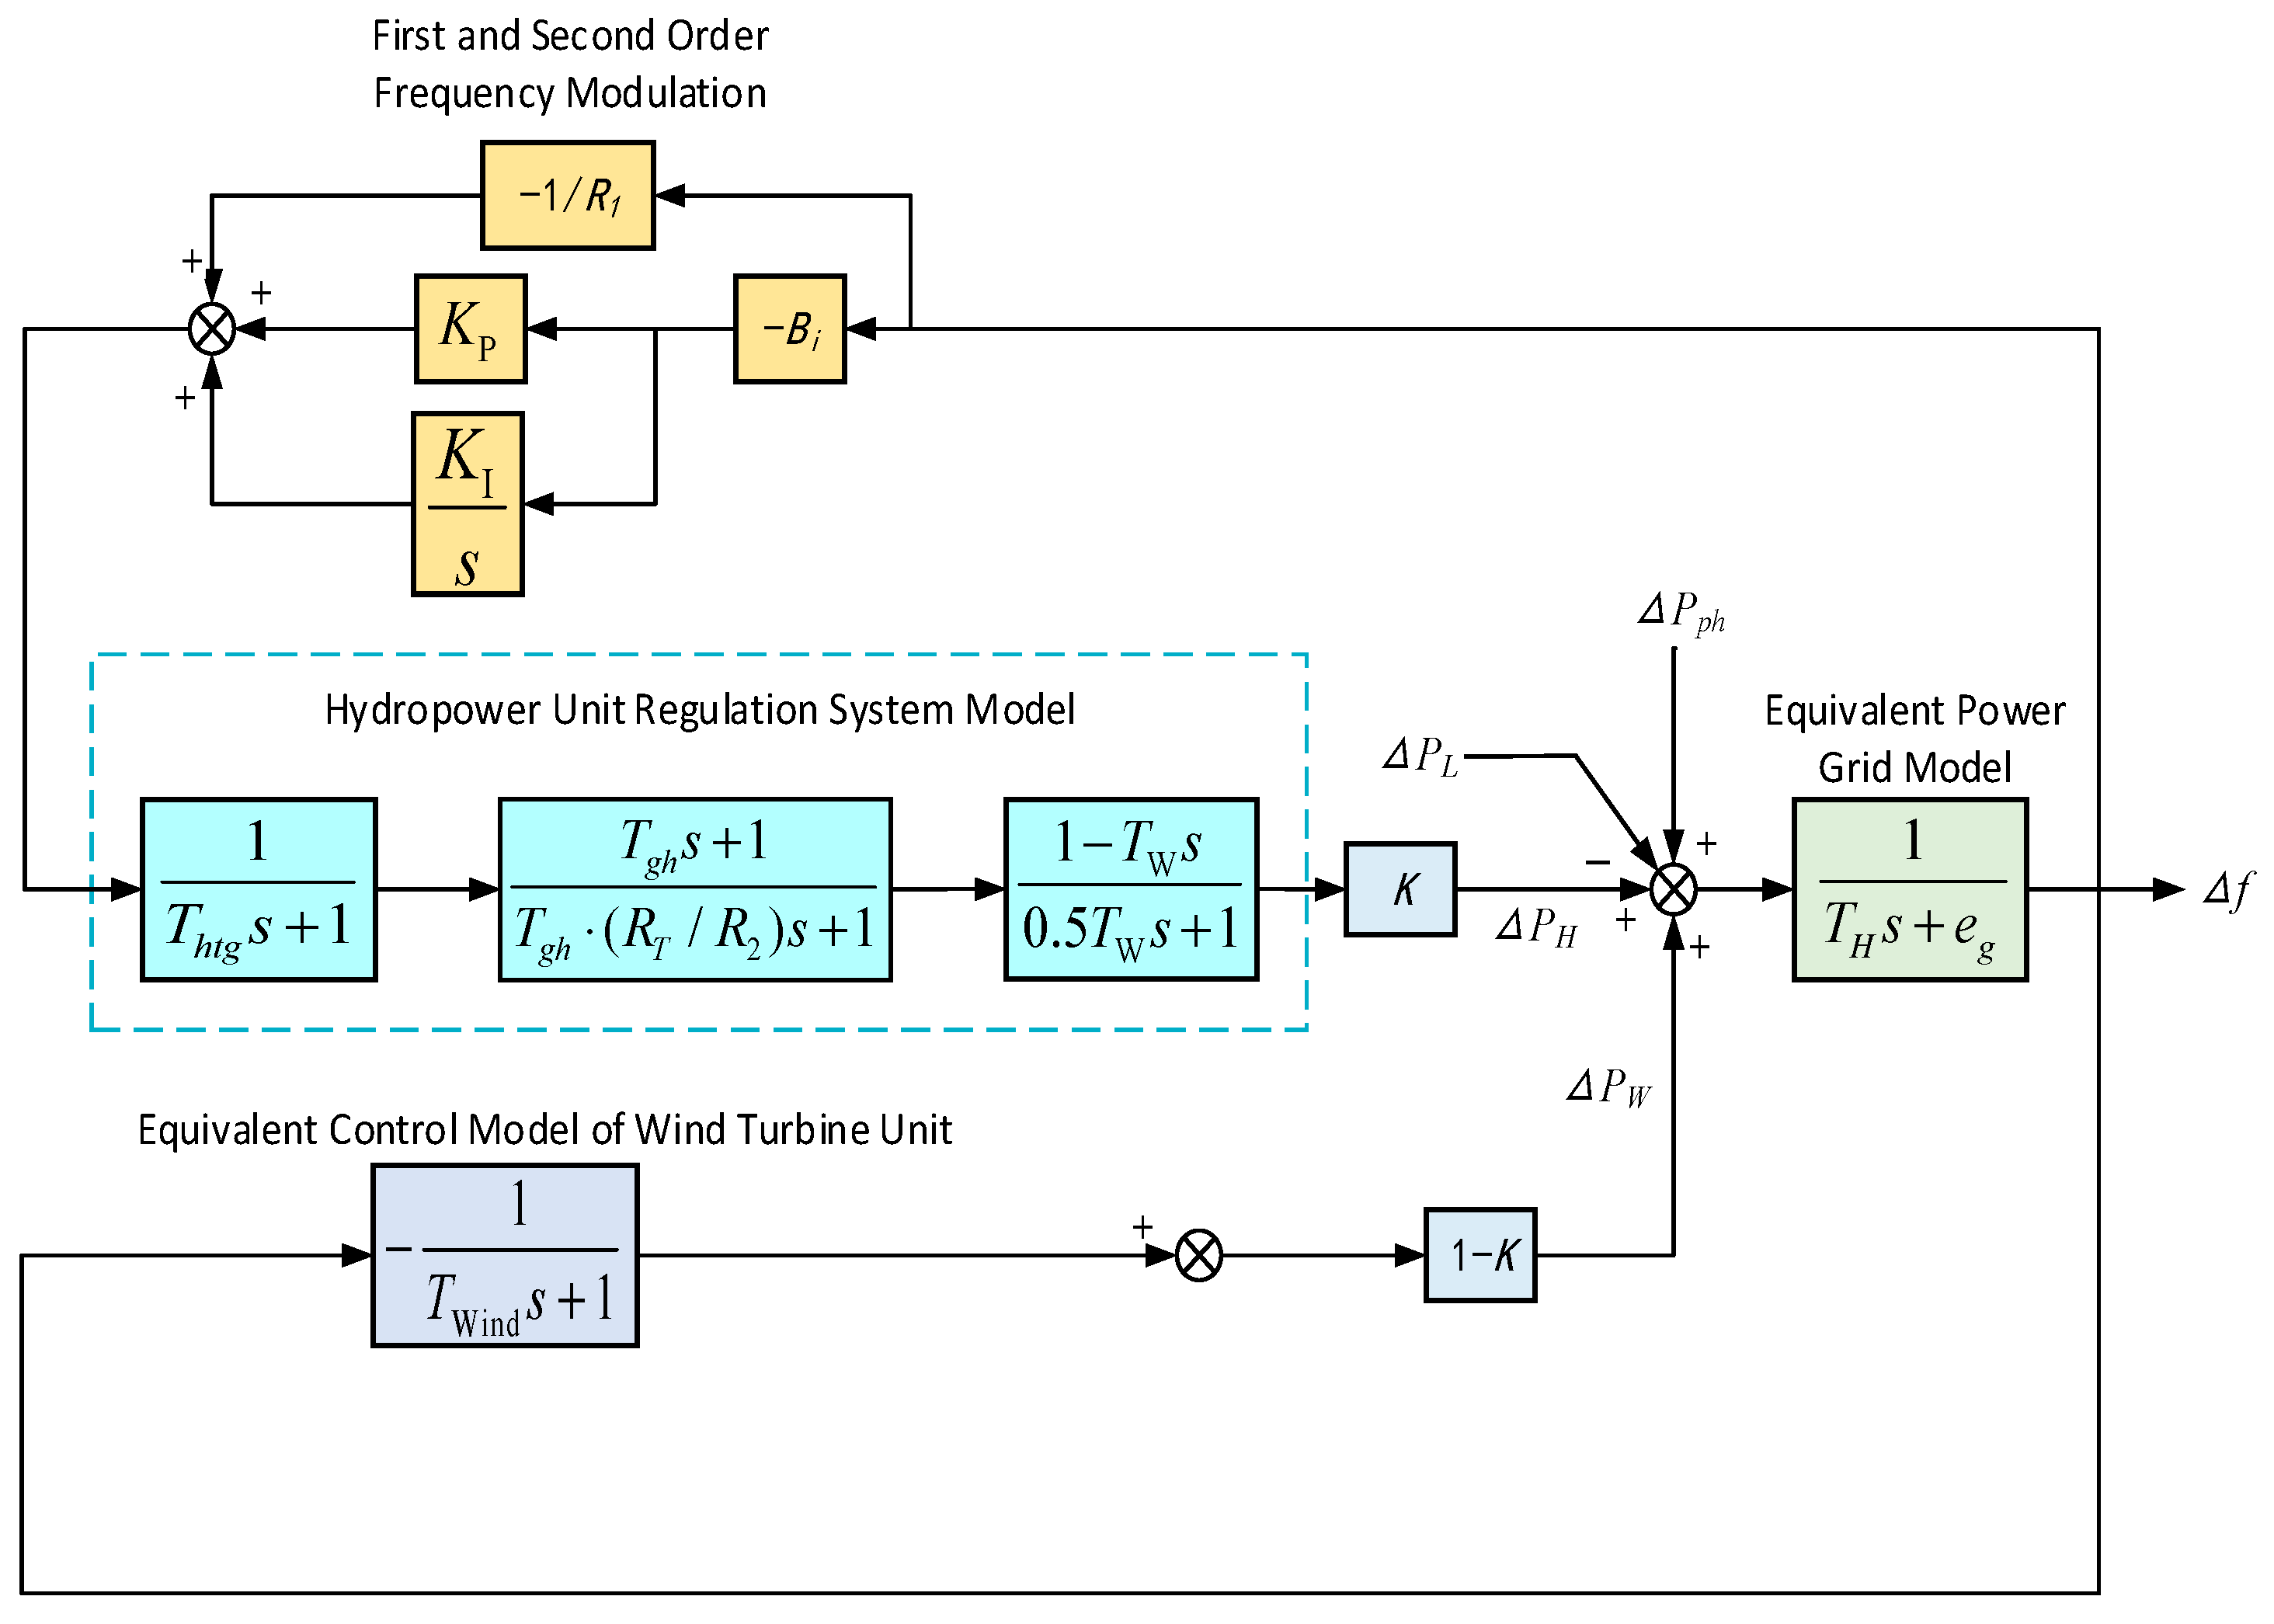
This section focuses on analysis of the response characteristics of the established models, based on the need to analyze the dynamic characteristics of the coordinated regulation of the complementary system [26]. The analysis is divided into two main parts: the frequency regulation response characteristics of the hydro-generator units and the dynamic fluctuation characteristics of the complementary system. The frequency regulation response of the complementary system is primarily achieved through the hydro-generator units and wind power. The frequency regulation response model of the hydro-wind-solar complementary system is shown in Figure 1.
In Figure 1, ΔPH represents the change in hydroelectric power, ΔPW represents the change in wind power, ΔPph represents the fluctuation in photovoltaic power, ΔPL represents the system power disturbance, K is the proportion of hydroelectric power, TWind is the inertia time constant of the wind turbine unit, TH is the equivalent inertia time constant of the system, eg is the self-regulation coefficient of the power grid, Bi is the frequency deviation coefficient, K represents the proportion of hydroelectric power, and this value is set to 0.7, and KP and KI are the proportional and integral coefficients of the secondary frequency regulation PI controller. The cross symbols ⊗ denote coupling or signal multiplication points between blocks.
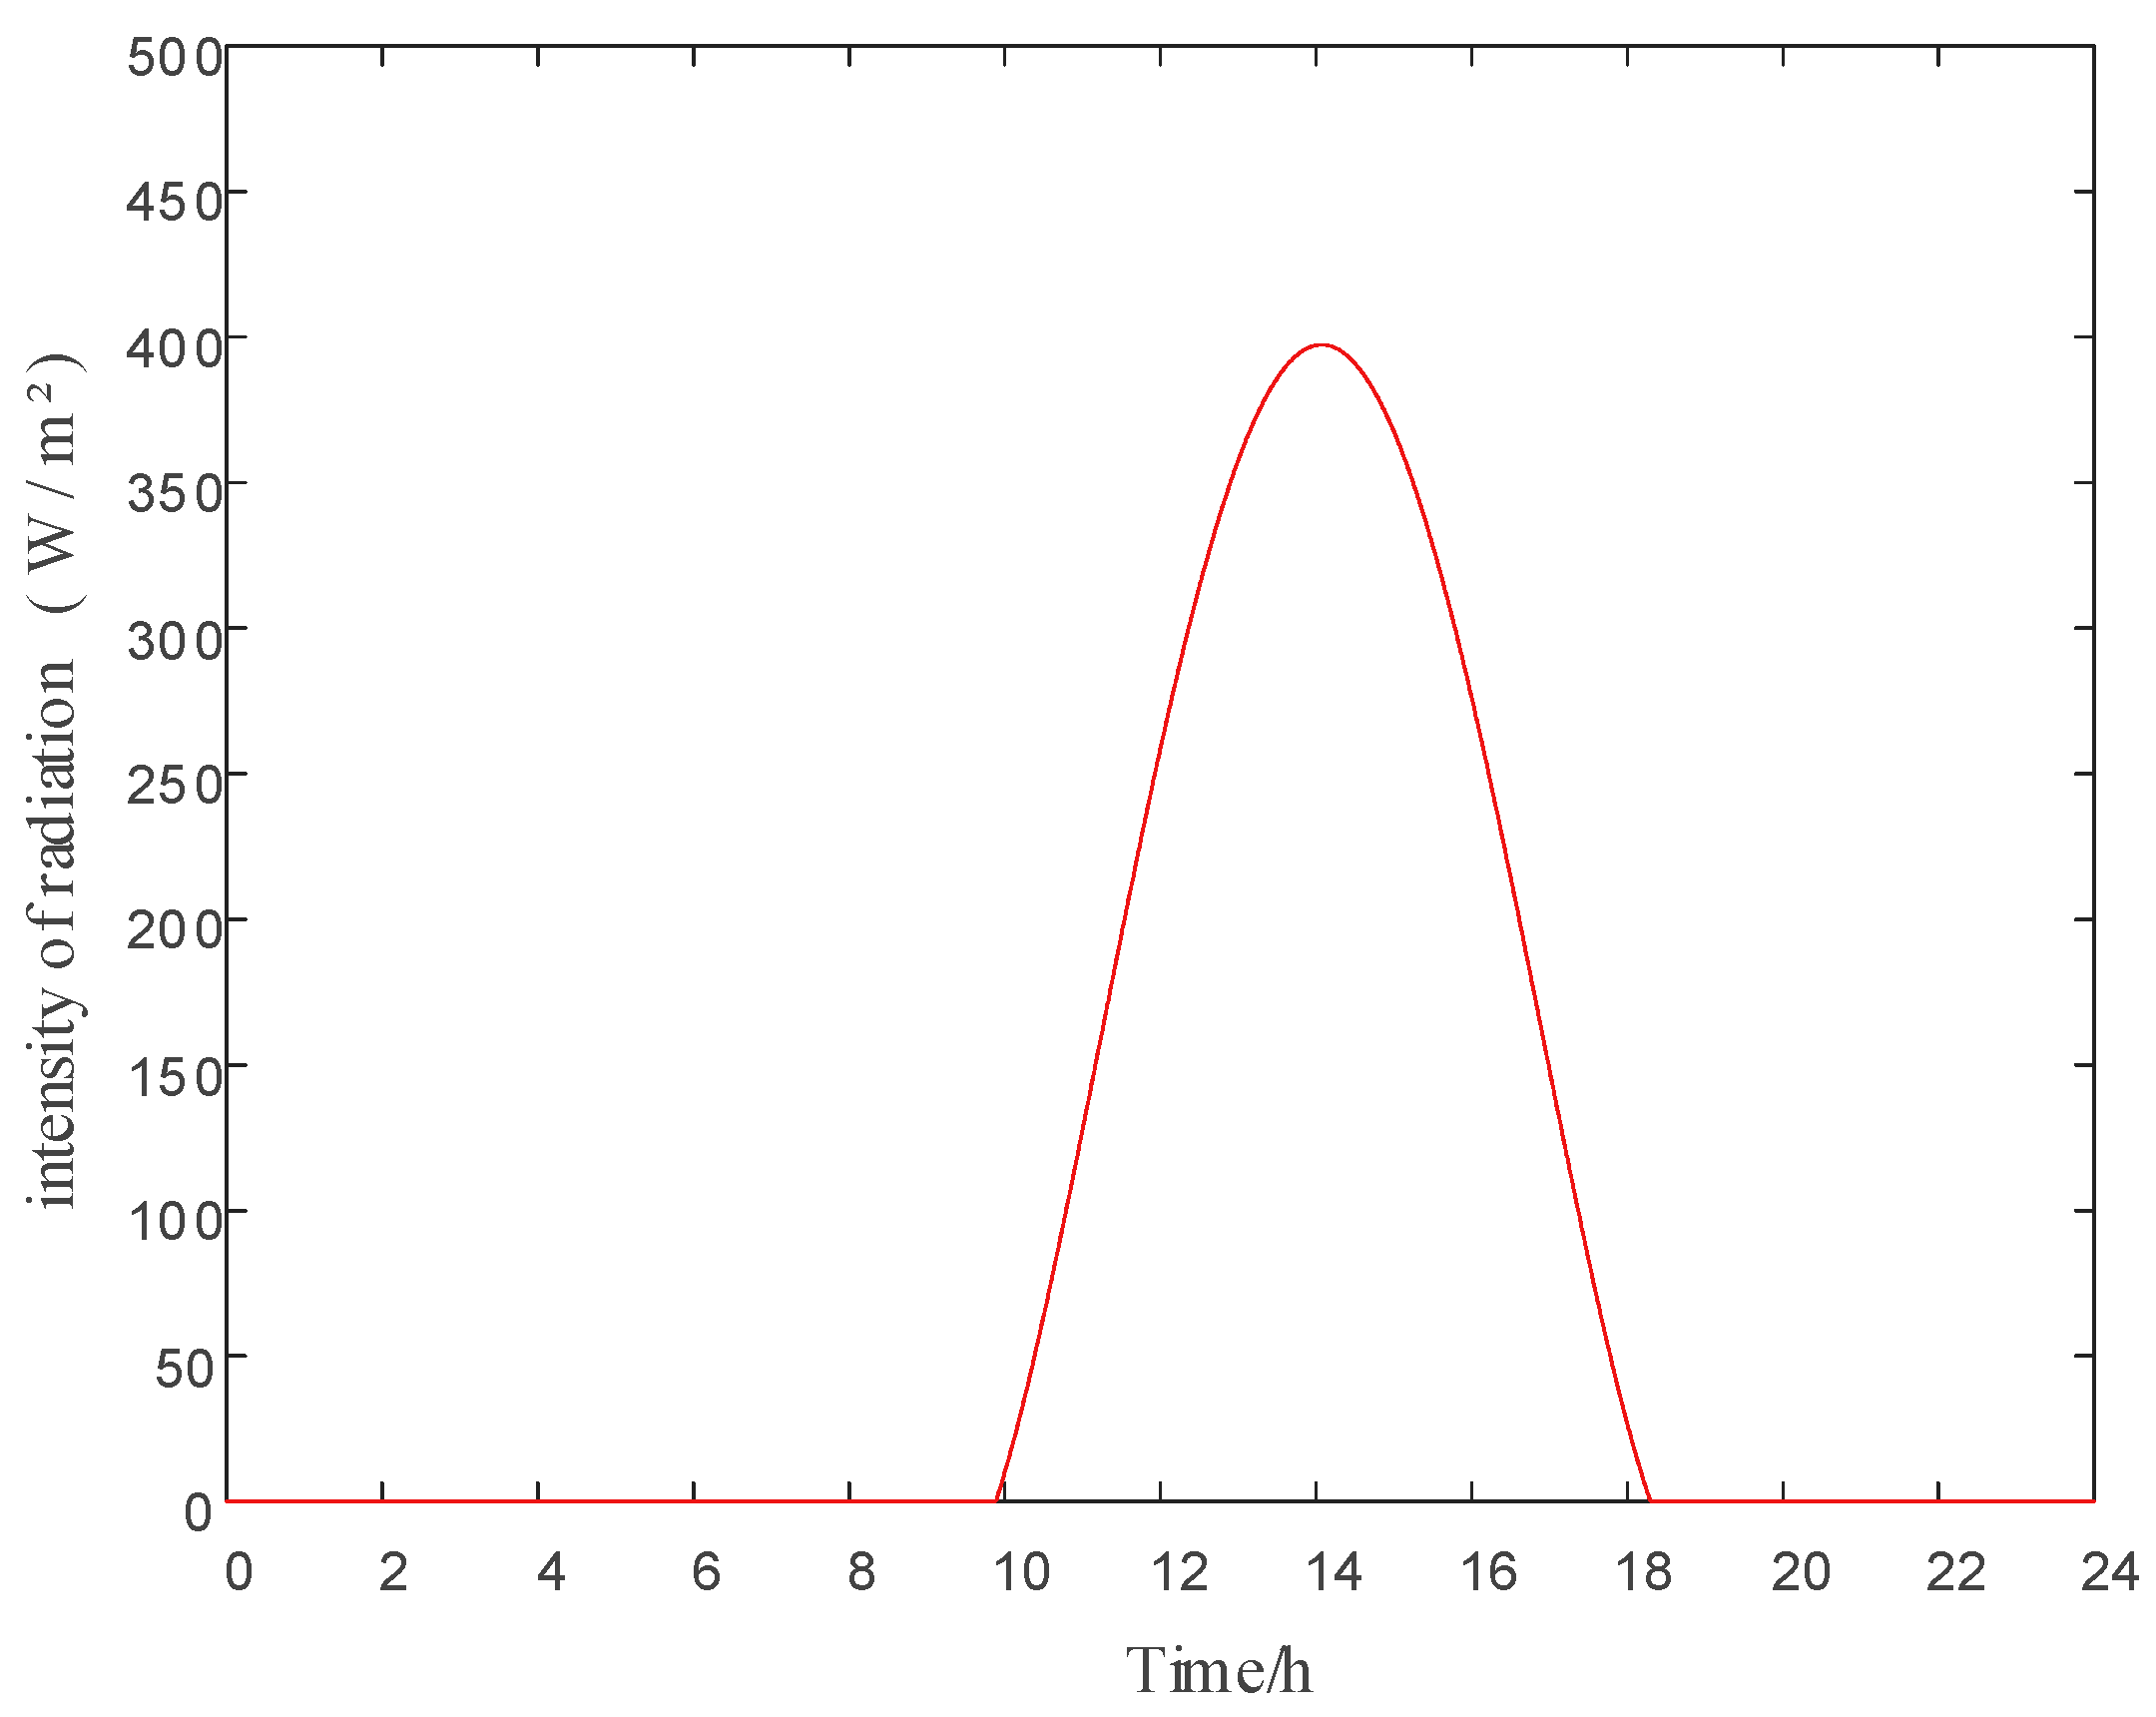
Notably, the fluctuations in photovoltaic (PV) output power, as described below, represent a common disturbance factor in the two working scenarios illustrated in Figure 1. The frequency fluctuations of the photovoltaic power generation system are influenced by the intensity of solar radiation. Based on this relationship, multiple time points throughout a day were selected to calculate the horizontal solar radiation intensity. The results were then fitted using a fourth-order polynomial to create a fitted curve of the horizontal solar radiation intensity over the time period, as shown in Figure 2. The output power fluctuations of the photovoltaic cells were calculated based on the changes in the horizontal solar radiation intensity.
Based on the above model, the frequency response characteristics are mainly studied under the following two working Scenarios when the load power changes (both scenarios adopt a 30% wind power penetration rate and include PV output fluctuations driven by solar radiation intensity)
Scenario 1: Under the action of primary and secondary frequency regulation, wind power is connected and participates in frequency regulation. The frequency response function of the system in this case is:
G 2 ( s ) = G ( s ) 1 G ( s ) ( K G H 2 ( s ) + ( 1 K ) G W ( s ) )
Scenario 2: Under the action of primary and secondary frequency regulation, wind power is connected but does not participate in frequency regulation. The frequency response function of the system in this case is:
G 1 ( s ) = G ( s ) 1 K G ( s ) G H 2 ( s )
where G(s) represents the equivalent grid model, GW(s) represents the transfer function of the wind turbine unit.
The frequency response transfer function of the hydroelectric unit under secondary frequency regulation control is expressed as:
G H 2 s = G 3 ( s ) G 4 ( s )
G 3 ( s ) = 1 R 1 B i K I s + K P
G 4 ( s ) = 1 T h t g s + 1 T g h s + 1 R T / R 2 T g h s + 1 1 T W s 0.5 T W s + 1
The equivalent control model of the wind turbine unit is derived by aggregating and simplifying the wind turbine units, and its transfer function is as follows:
G W ( s ) = 1 T Wind s + 1
The equivalent power grid model G(s) is:
G ( s ) = 1 T H s + e g
This study proposes a multi-objective optimization method for PID parameters based on DEAGNG for the two operating Scenarios mentioned above, addressing the issue that traditional single-objective optimization cannot balance multiple performance indicators simultaneously. The optimization results show that the parameters obtained by this method can effectively enhance the frequency stability and disturbance rejection capability of the system under high wind power penetration, providing data support and algorithm reference for the design of frequency regulation controllers in practical engineering applications. Future work can further combine robust optimization theory to expand the adaptability of the parameters to small fluctuations in penetration rates, thereby enhancing the practicality of the method in engineering applications.

3. Introduction to Multi-Objective Algorithms

3.1. Distribution Estimation Algorithm Principle

The Distribution Estimation Algorithm (DEA) is a global optimization method based on probabilistic statistical thinking [27]. This approach involves analyzing the statistical characteristics of high-quality solutions within the current population to establish a parametric distribution model. New generations of solutions are then generated under the guidance of this model, progressively approximating the optimal solution. Unlike traditional genetic algorithms, DEA does not rely on genetic operations such as crossover and mutation but instead iterates updates based on probability models, offering stronger directional search and globality.
The optimization process of DEA includes steps such as population initialization, fitness evaluation, selection of high-quality individuals, probabilistic modeling, and resampling. During the modeling process, DEA estimates the statistical relationships between variables based on the distribution characteristics of high-quality individuals, thereby constructing a new solution distribution. In this way, the algorithm can adaptively adjust the search range, focusing exploration on more promising areas.
This method has a simple structure, is easy to implement, and is suitable for optimization problems involving continuous or discrete variables. Particularly in engineering applications such as parameter tuning and controller design, DEA demonstrates strong global search capabilities and rapid convergence speeds and has been widely applied in fields such as power system optimization, mechanical design, and multi-objective control.

3.2. Principle of Growing Neural Gas

Growing Neural Gas (GNG) is a dynamic neural network model designed to adaptively learn the topological structure of input data [28]. In traditional neural networks, such as Convolutional Neural Networks (CNNs) and Recurrent Neural Networks (RNNs), the topological structure of neurons is predetermined before training begins, and the training process only adjusts the parameters of the neurons. However, in unsupervised learning scenarios, the topological distribution of the input data space is often unknown, making it difficult for networks with fixed topological structures to flexibly handle complex data distributions.
The GNG algorithm innovatively allows the network structure to dynamically adjust according to the input data. It starts with only two neurons and increases the number of neurons during the iterative learning process based on the error Scenarios of the data. Specifically, each neuron has an internal variable that accumulates “local error” to measure the fit of the neuron to the input data. As learning progresses, if a particular region has a large error, it indicates that the data features in that region have not been adequately learned, and GNG will add new neurons in that region to better fit the data.
Regarding neuron connections, GNG employs competitive Hebbian rule to create a series of connections between neurons. These connections form a topological structure that best corresponds to the distribution of input vectors. The connections between nodes are characterized by a variable called “age.” As the connection is used more frequently, its “age” increases. If a connection remains unused for an extended period and its “age” exceeds a certain threshold, the connection is deleted. This ensures the dynamism and effectiveness of the network structure. The features of dynamic growth and adaptive connection adjustment of GNG make it particularly effective in handling compression and vector quantization problems with a large number of input parameters, such as speech and image recognition, classification, and recognition of abstract paradigms. It effectively avoids the issues of traditional dimensionality reduction methods (such as Principal Component Analysis (PCA)) that may destroy the original relationships between features and fail to preserve the topological structure while retaining the main information.

3.3. Optimization Process Based on DEAGNG Algorithm

The DEAGNG algorithm proposed in this paper integrates the strengths of the DEA and the GNG network, and is specifically optimized for the frequency regulation control issue of the complementary hydro–wind–photovoltaic system [29]. This algorithm uses the Integral Time Absolute Error (ITAE) and the Integral Time Squared Error (ITSE) as objective functions to perform joint optimization of the proportional gain KP and the integral gain KI of the PID controller.

3.3.1. Definition of Objective Functions

The formula for ITAE is as follows:
ITAE = 0 T t · | e ( t ) | d t
where e(t) is the frequency deviation of the system at time t, and T is the total simulation duration. ITAE comprehensively reflects the cumulative effect of frequency deviation over time, measuring the overall ability of the system to suppress frequency deviations.
The formula for ITSE is as follows:
ITSE = 0 T t · e ( t ) 2 d t
ITSE focuses more on the integral of the squared frequency deviation over time, making it more sensitive to extreme deviations in system frequency. It emphasizes the ability of the system to suppress large frequency fluctuations.
By optimizing both ITAE and ITSE simultaneously, the goal is to achieve the best frequency stability of the hydro-wind-solar complementary system under different operating Scenarios, and to find the optimal combination of KP and KI that can effectively suppress both the accumulation of frequency deviations and large fluctuations.

3.3.2. Detailed Algorithm Procedure

Initialization of Population: Randomly generate an initial population consisting of a certain number of individuals. Each individual is represented by a set of KP and KI parameter values, forming different combinations of PID controller parameters. These individuals serve as the starting point for the search of the algorithm [30].
Fitness Calculation: Substitute the KP and KI parameter values of each individual into the frequency response model of the hydro-wind-solar complementary system to calculate the corresponding ITAE and ITSE values. Based on these two objective function values, evaluate the fitness of each individual using a specific fitness assessment strategy. Higher fitness indicates that the parameter combination of the individual performs better in terms of the optimization objectives.
Selection of Elite Group: Select individuals with higher fitness from the current population to form an elite group. These individuals in the elite group are considered more likely to guide the algorithm towards finding better solutions.
Construction of Probabilistic Model Based on GNG: Use the parameter values of individuals in the elite group as input data and apply the GNG network for learning. GNG establishes connections between neurons based on the distribution characteristics of the input data, forming a network that reflects the topological structure of the parameter space. By analyzing the distribution and connections of neurons in the GNG network, construct a probabilistic model that describes the distribution of KP and KI parameters in the solution space. For example, if certain regions in the GNG network have a higher density of neurons, it indicates that parameter values corresponding to these regions have a higher probability of occurrence.
Random Sampling to Generate New Individuals: Randomly sample from the probabilistic model constructed based on GNG to generate new individuals, i.e., new combinations of KP and KI parameters. These new individuals form a new population, providing search candidates for the next iteration of the algorithm.
Iteration and Termination Judgment: The process from fitness calculation to the generation of new individuals is repeated for multiple iterations. In each iteration, the algorithm updates the probabilistic model through the learning of the elite group data by GNG, guiding the search towards regions with better solutions. The algorithm stops iterating when a predefined termination scenario is met, such as reaching the maximum number of iterations or the convergence of the fitness values of the population. The algorithm then outputs the individual with the highest fitness in the current population, and the corresponding KP and KI parameter values are considered the optimized results.
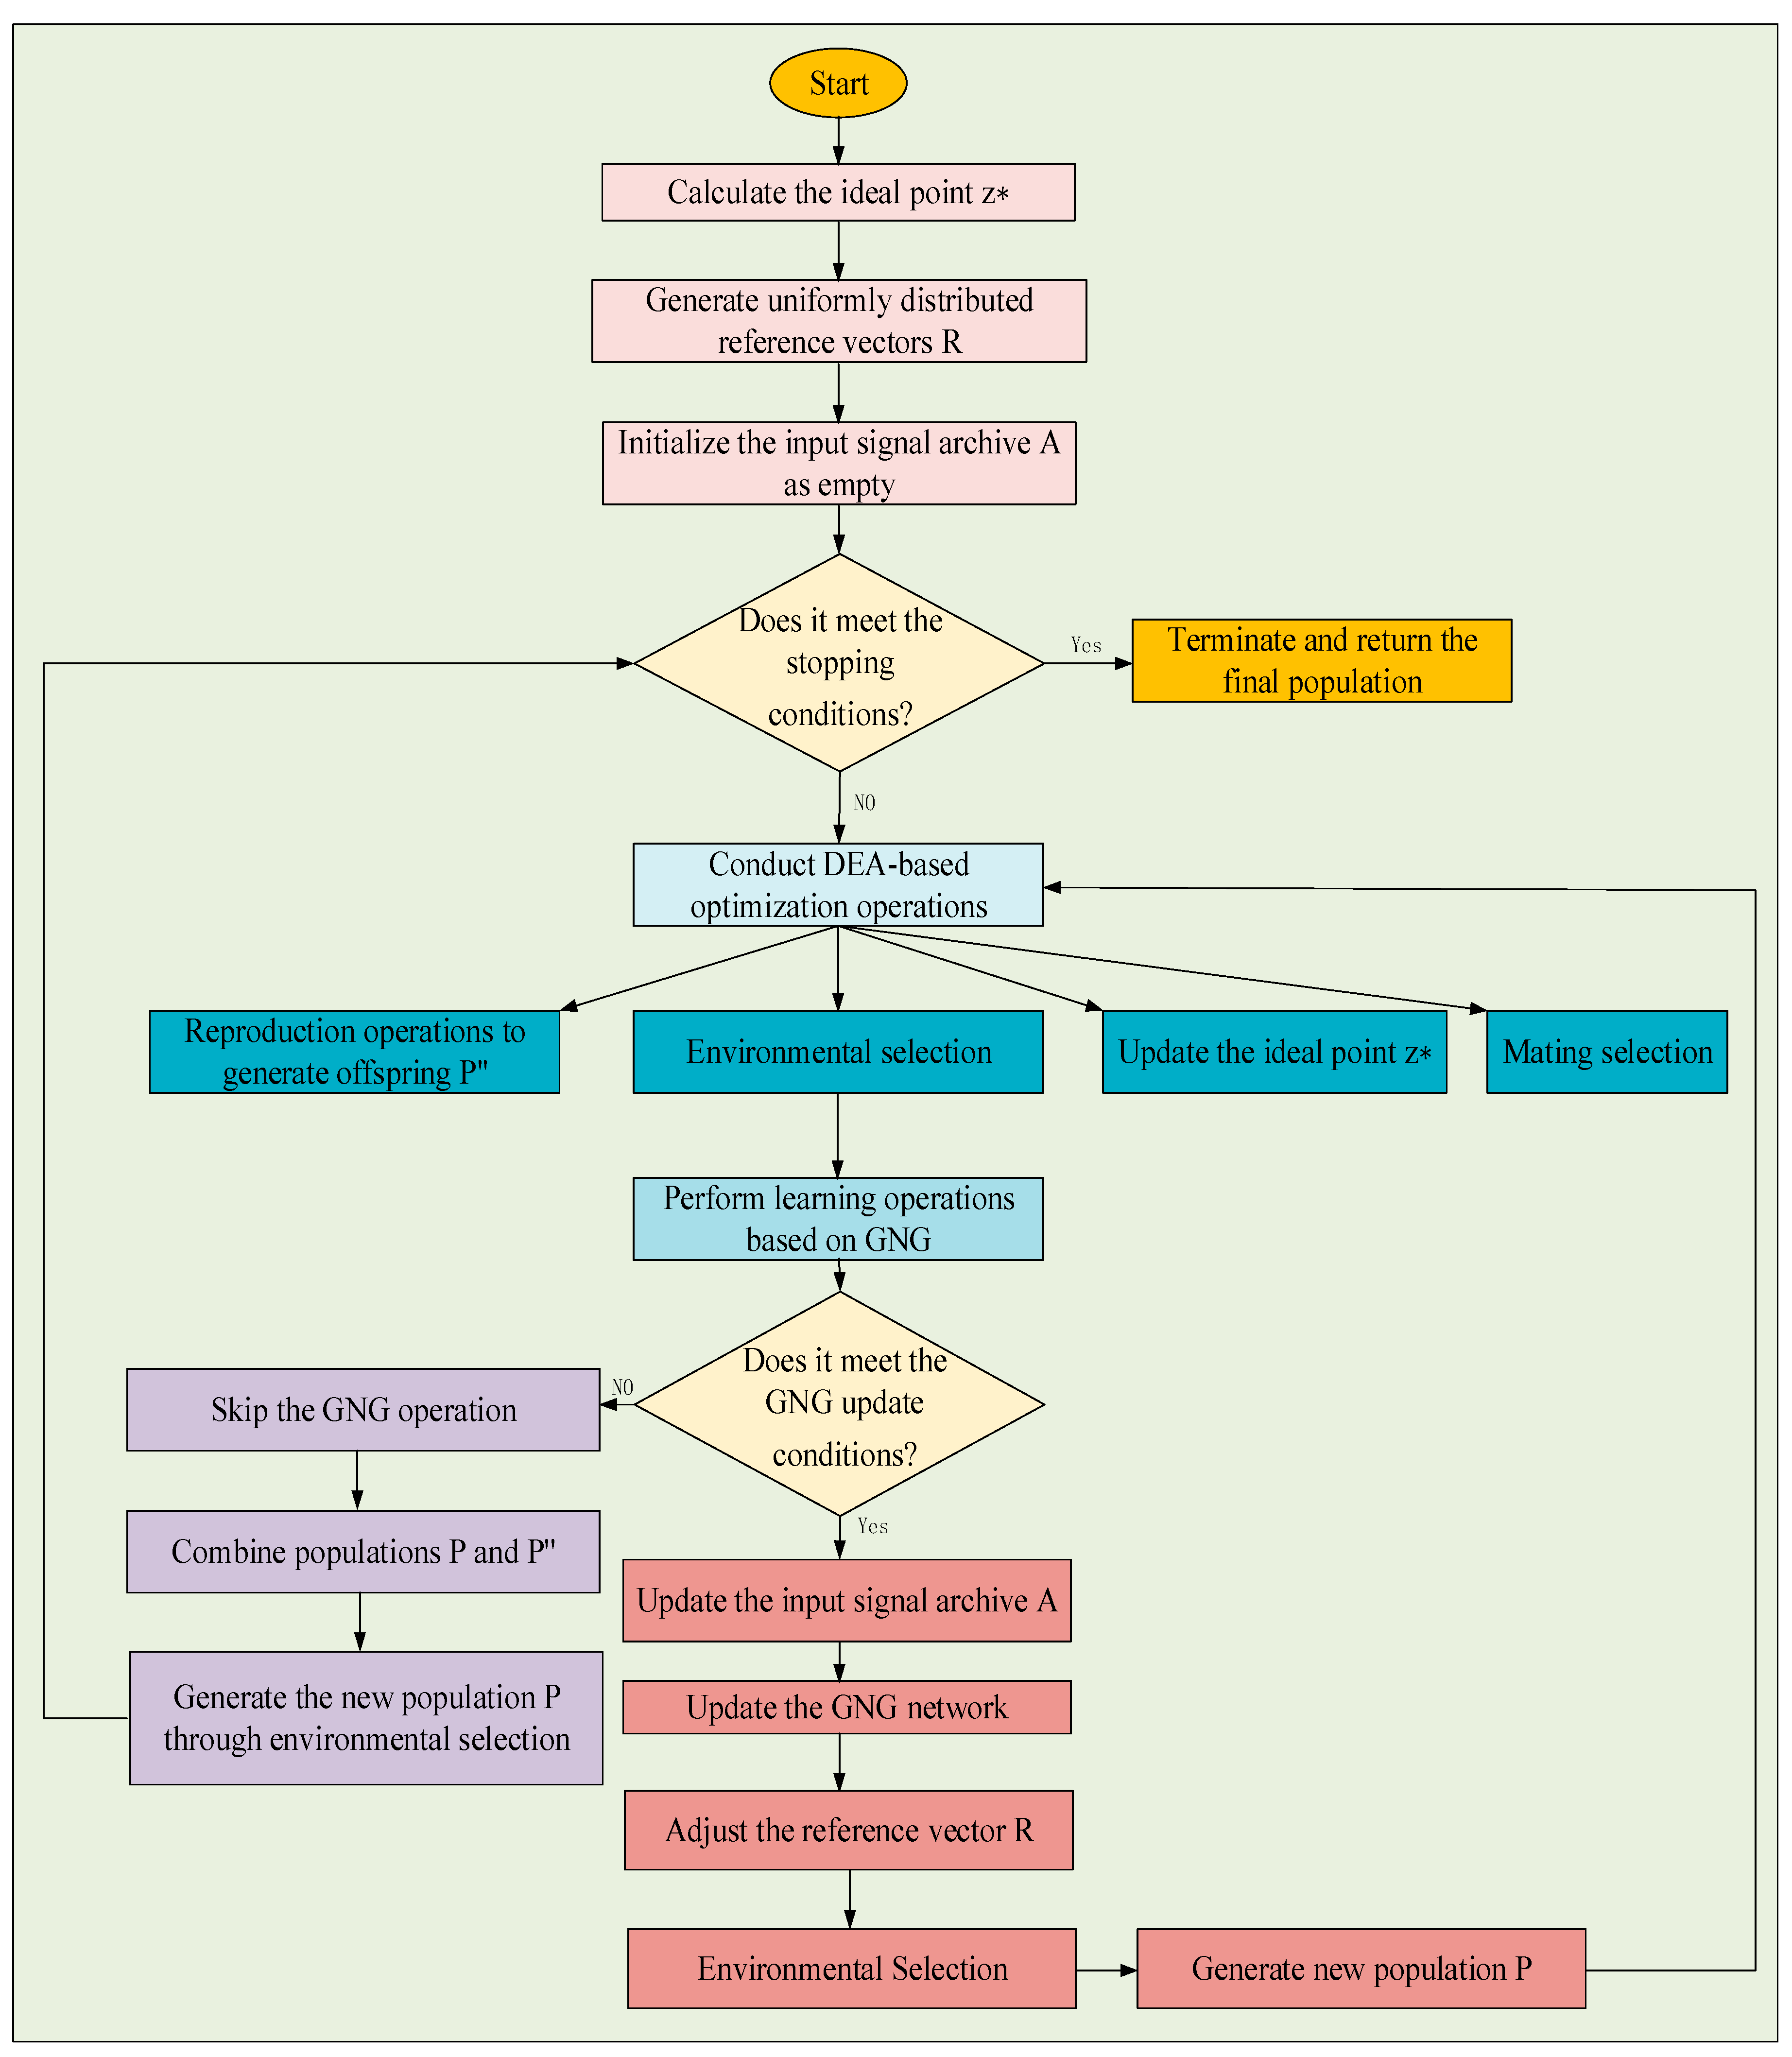
During this process, we need to clarify some notations: z * (Ideal Point): z * is calculated at the start of the algorithm. It represents an ideal set of performance metrics (such as minimum ITAE and ITSE values) that the algorithm aims to achieve. It serves as a reference to evaluate the performance of the current population and guide the search direction.
R (Reference Vectors): R is generated at the beginning of the algorithm as uniformly distributed vectors. They help in guiding the evolutionary process of the population. Each reference vector Ri is used to compare with the individuals in the population to determine their fitness in a multi-objective optimization context.
A (Input Signal Archive): A is initialized as an empty set at the start. It is used to store relevant input signals generated during the execution of the algorithm, such as signals from the environmental selection, mating selection, and learning operations. This archive helps in keeping track of the historical information of the algorithm’s operation and can be used for analysis and debugging purposes.
When adjusting the reference vector R, the next step is to generate a new population P through environmental selection. This step involves using the adjusted reference vectors and the current state of the algorithm (including the populations and other relevant data) to select individuals through environmental selection criteria, thereby generating a new population for the next iteration of the algorithm.
The algorithm stops iterating when a predefined termination scenario is met, such as reaching the maximum number of iterations or the convergence of the fitness values of the population. The algorithm then outputs the individual with the highest fitness in the current population, and the corresponding KP and KI parameter values are considered the optimized results.
The flowchart of the DEAGNG algorithm is shown in Figure 3.
Z* denotes the optimal compromise solution on the Pareto front obtained by DEAGNG, arrows indicate the direction of data flow, and the asterisk (*) denotes the updated state of the corresponding variable during the algorithm iteration.

4. Case Simulation and Result Analysis

To verify the effectiveness of the optimization strategy based on the DEAGNG algorithm, this section presents simulation experiments to demonstrate the impact of the optimized PID controller parameters KP and KI on the performance of the hydro-wind-solar complementary system. The simulation experiments are conducted in the MATLAB R2023b (version 9.14.0.2239454, 64-bit) environment, aiming to evaluate the frequency response characteristics of the system under different operating Scenarios.
To address the issue of missing data on the scale of hydropower, wind power, and solar power systems, and to verify the effectiveness of the optimization strategy based on the DEAGNG algorithm, this study refers to the actual energy configuration characteristics of the complementary system in the Wudongde area and establishes a frequency response model for the coordinated regulation of the hydro-wind-solar complementary system in the MATLAB environment. The total installed capacity of the model is set at 13,000 MW, with the specific capacity allocation for each energy source as follows:
Hydropower capacity: Fixed at 10,000 MW (consistent with the actual installed capacity of the Wudongde Hydropower Station), accounting for 70% of the total system capacity. As the core flexible regulation unit, it undertakes primary and secondary frequency regulation tasks to suppress power fluctuations caused by wind and solar energy.
Wind power capacity: 1500 MW, accounting for 15% of the total system capacity. In Scenario 1 (wind power participating in frequency regulation), it provides auxiliary inertia support; in Scenario 2 (wind power not participating in frequency regulation), it only outputs power based on real-time wind speed without frequency regulation intervention.
Photovoltaic capacity: Consistent with wind power capacity, at 1500 MW, accounting for 15% of the total system capacity. Its output fluctuation is driven by solar radiation intensity, with a fluctuation range of ±15% of its rated capacity (calibrated based on typical photovoltaic power plant operation data).
The capacity ratio of each energy source is determined based on the complementary principle: the large-capacity hydropower unit ensures the basic frequency stability of the system, while the 10% to 20% wind-solar capacity meets the requirements of high renewable energy penetration without exceeding the regulation capacity of the hydropower unit.
In the MATLAB model, based on the traditional hydroelectric frequency regulation model, a wind power frequency regulation unit is added to jointly undertake the frequency regulation task. Additionally, the power fluctuations of wind and PV power caused by changes in solar radiation intensity are considered. The following analysis examines the changes in frequency characteristics of the hydro-wind-solar complementary system under different wind power penetration rates and wind-solar power fluctuations when the hydroelectric unit participates in primary and secondary frequency regulation and wind power is involved in the regulation. It also investigates the influence of hydroelectric unit control parameters on frequency characteristics. The parameter settings are as shown in Table 1.

4.1. Single-Objective Algorithm Optimization

This section primarily investigates the impact of the secondary frequency regulation parameters KP and KI of the hydroelectric unit on the regulation performance of the complementary system. Traditional single-objective optimization algorithms, Cuckoo Search Optimization(CSO) and Artificial Bee Colony Algorithm(ABC), are employed to optimize KP and KI respectively [31,32]. The corresponding performance metrics of the complementary system are calculated for each set of values, and data fitting is conducted to draw tables showing how the performance metrics vary with KP and KI as Table 2 and Table 3:
From the tables, it can be observed that although the performance of the two algorithms is similar in Scenario 2, the CSO algorithm demonstrates better optimization effects in terms of ITAE in Scenario 1. This indicates that the performance of algorithms may vary under different Scenarios, and the CSO algorithm is more effective in reducing the ITAE value in the current experimental setup.
Despite the good optimization performance of the CSO algorithm in Scenario 1, especially in reducing the ITAE value, this single-objective optimization method has its inherent limitations. In practical hydro-wind-solar complementary systems, we need to not only focus on the dynamic response speed of the system but also consider multiple aspects such as system stability, robustness, and possible energy consumption simultaneously. Single-objective optimization methods often fail to balance these different performance metrics, as they usually focus solely on minimizing or maximizing a specific objective function.
To overcome this limitation, multi-objective optimization algorithms are introduced. Multi-objective optimization algorithms can seek the best trade-off solutions among multiple performance metrics, thereby providing a more comprehensive optimization plan for system design. For example, by considering both ITAE and ITSE simultaneously, multi-objective optimization algorithms can help us reduce the dynamic response time while also taking into account system stability and energy consumption, achieving a comprehensive improvement in system performance.

4.2. Multi-Objective Algorithm Optimization

To overcome the limitations of single-objective optimization, this experiment employs several multi-objective algorithms for comparison. To verify the performance of the DEAGNG algorithm in solving multi-objective test function problems, three widely used multi-objective intelligent optimization algorithms—Adaptive geometry estimation-based many objective evolutionary algorithm II (AGEMOEA2), Decomposition-based multi-objective evolutionary algorithm with the e-constraint framework (DMOEAeC), and Grouped and linked mutation operator algorithm (GLMO)—are selected as the control group. The simulation experiments consider the optimization of PID parameters using these algorithms under two operating Scenarios [33,34].
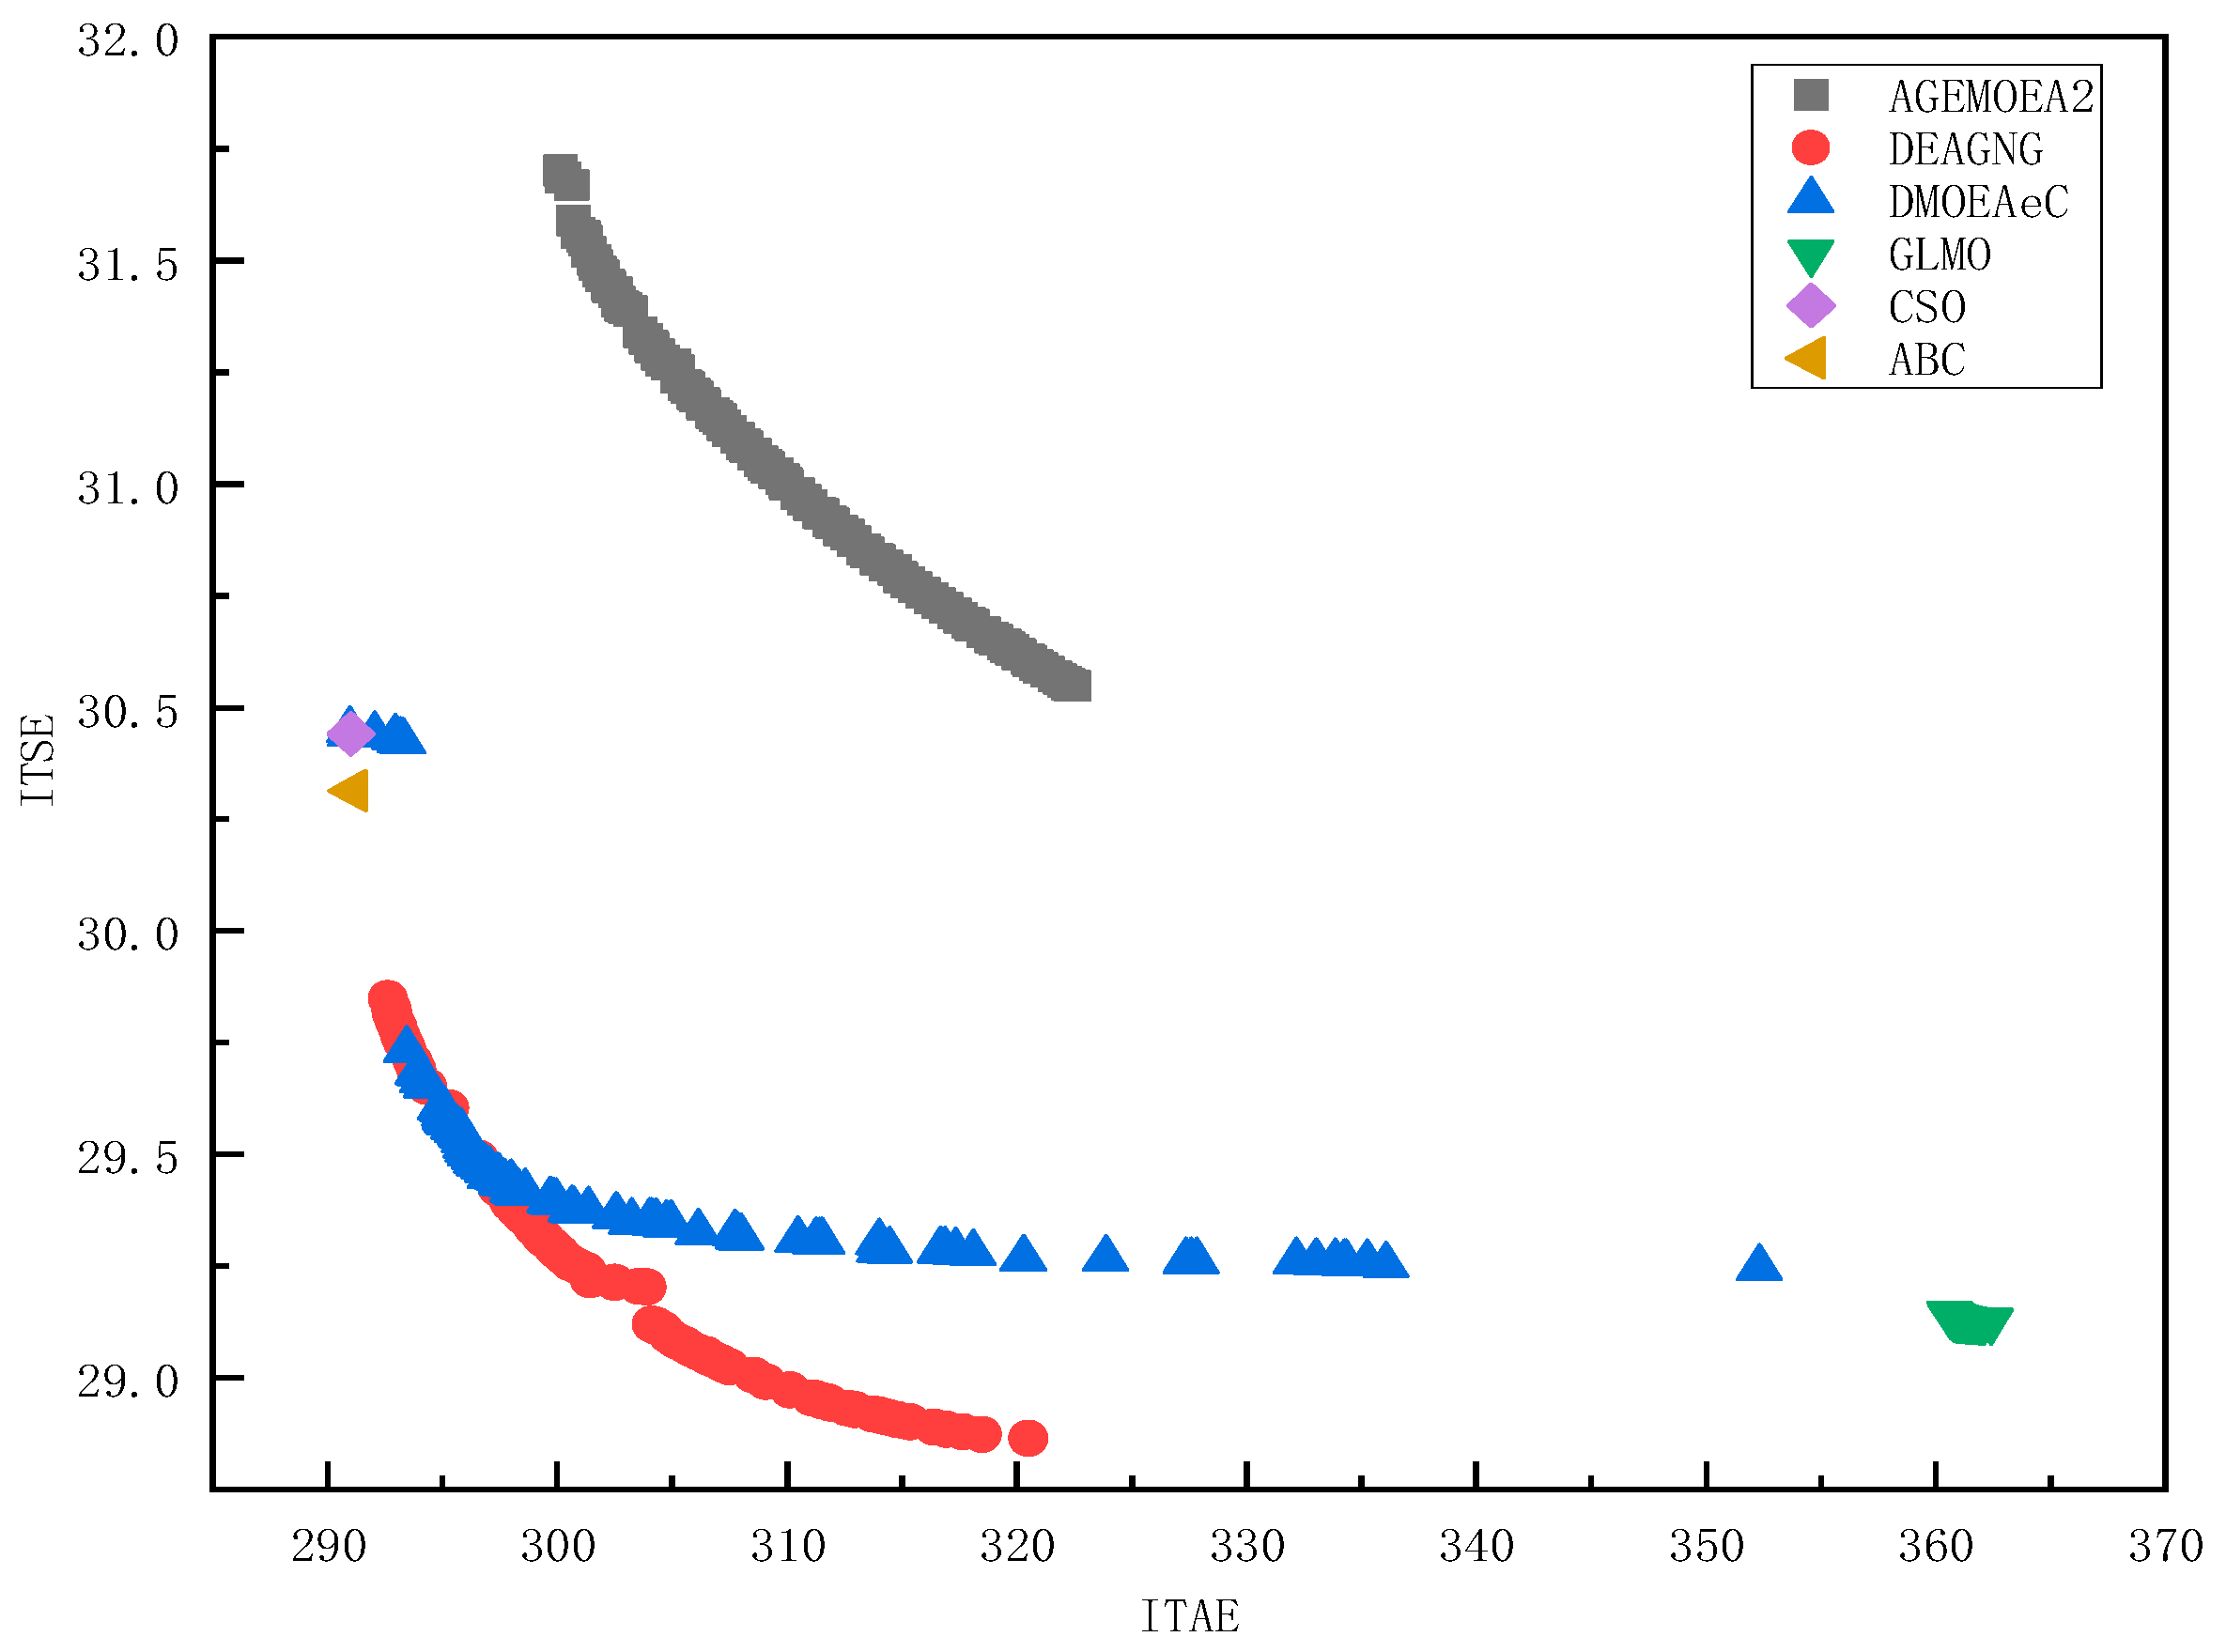
For Scenario 1, which corresponds to a wind power penetration rate of 30% in frequency regulation, the Pareto fronts obtained after optimization using various algorithms are shown in Figure 3:
From the solution results of the pumped storage unit PID speed control system depicted in Figure 4, it can be observed that the multi-objective algorithm DMOEAeC encompasses solutions from the single-objective algorithm CSO. Moreover, the multi-objective algorithms DEAGNG, DMOEAeC, and GLMO exhibit more pronounced advantages in terms of ITSE. Among these, the algorithm DEAGNG achieves a superior Pareto front compared to several other algorithms. Table 4 specifically details the performance metrics corresponding to the median solutions of the Pareto fronts obtained by each algorithm.
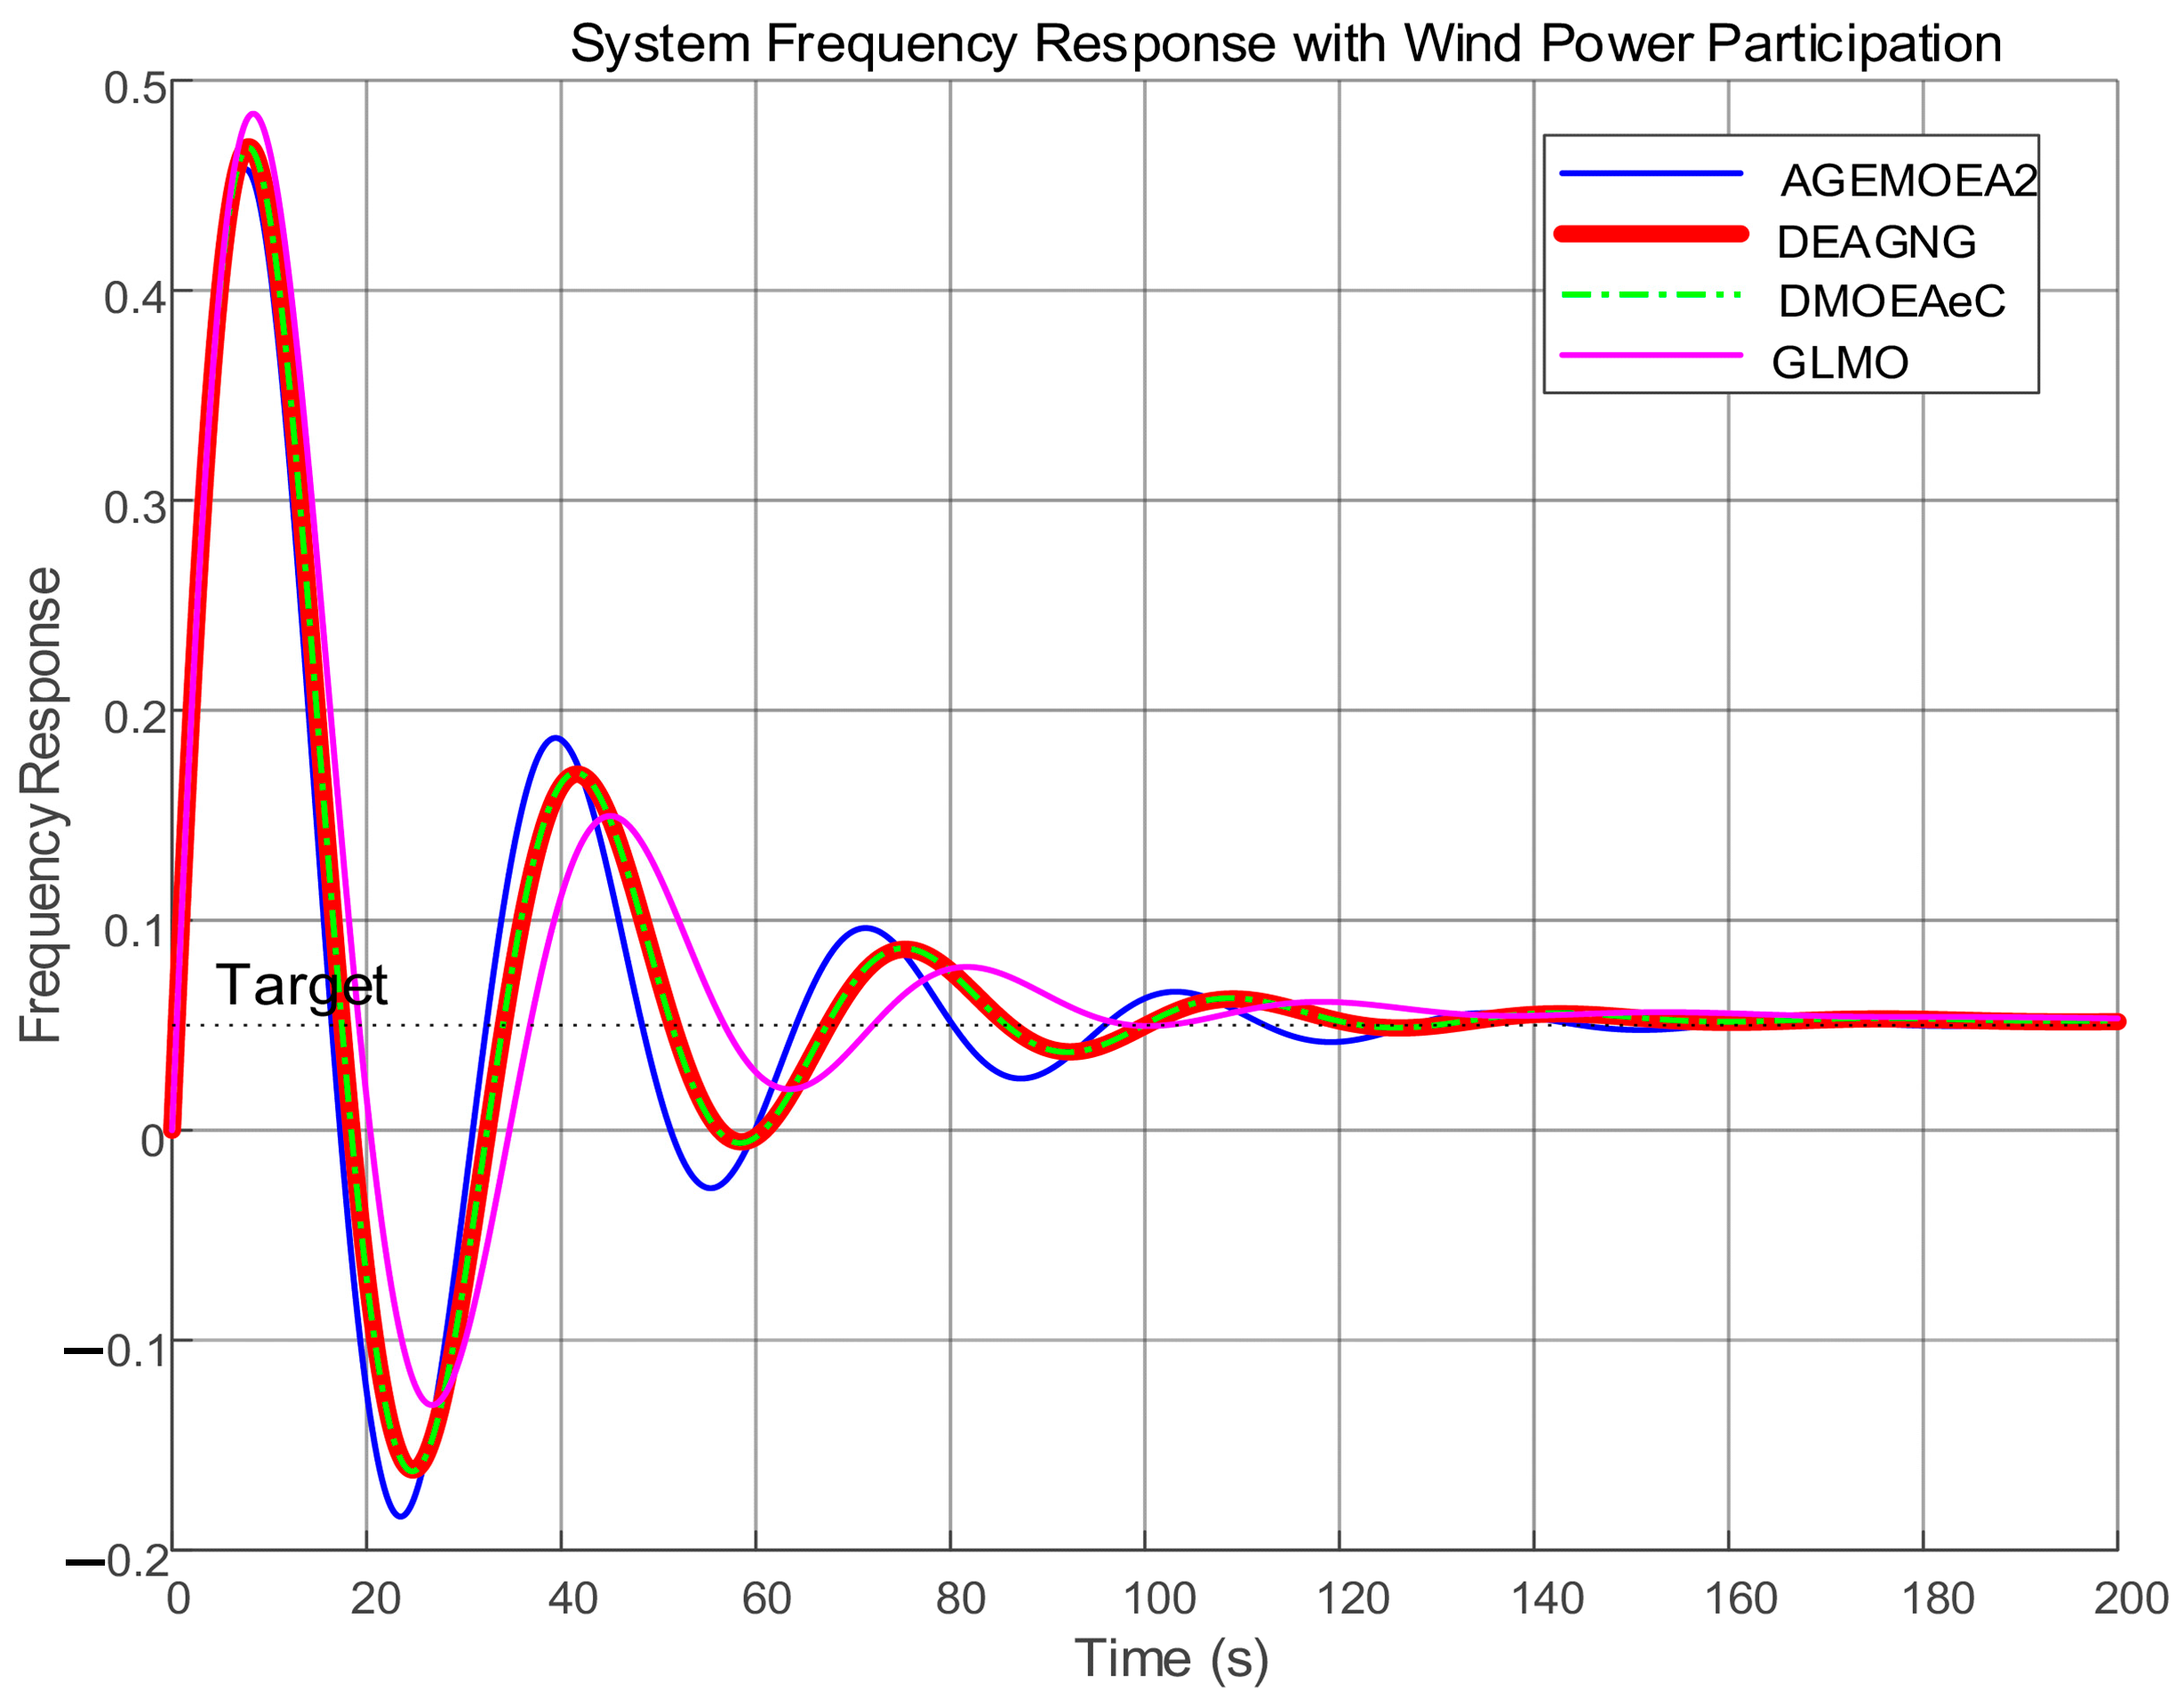
Based on the optimized PID parameters from each algorithm, the respective system frequency response curves are plotted as shown in Figure 5.
From Figure 5, it can be seen that during the system frequency response process, there are four curves representing different dynamic characteristics: DEAGNG (red curve), AGEMOEA2 (blue curve), DMOEAeC (green curve), and GLMO (pink curve).
In terms of the ITAE metric, the DEAGNG curve has a relatively small cumulative degree of frequency deviation over the entire time range (0–200 s). Although there are fluctuations after the initial disturbance, the range of oscillation is narrow during the stabilization process, and it performs well in terms of the ITAE metric. Regarding the ITSE metric, the DEAGNG curve does not exhibit large amplitude frequency deviations throughout the response process, demonstrating good stability in the recovery process after disturbance, with frequency deviations not fluctuating widely for an extended period, giving it an advantage in the ITSE metric. In terms of settling time and overshoot, while the GLMO curve may stabilize more quickly in the initial stage, the DEAGNG curve has a relatively small overshoot in the process of recovering to the target frequency of 0.05Hz. This means that the system oscillates less before reaching a stable state, which is beneficial for system stability. Moreover, the DEAGNG curve can quickly return to the vicinity of the target frequency after the disturbance disappears, giving it an advantage in terms of system frequency recovery performance. Compared with the GLMO curve, considering factors such as ITAE and ITSE metrics, overshoot, and settling time, the DEAGNG performs better. Compared with the AGEMOEA2 and DMOEAeC curves, DEAGNG has a clear advantage in frequency deviation control and system recovery performance; these two curves exhibit larger amplitude frequency fluctuations and longer settling times during the response process.
In summary, the DEAGNG algorithm demonstrates superiority in the system frequency response process when considering various factors comprehensively, effectively enhancing the dynamic performance and stability of the hydro-wind-solar complementary system.
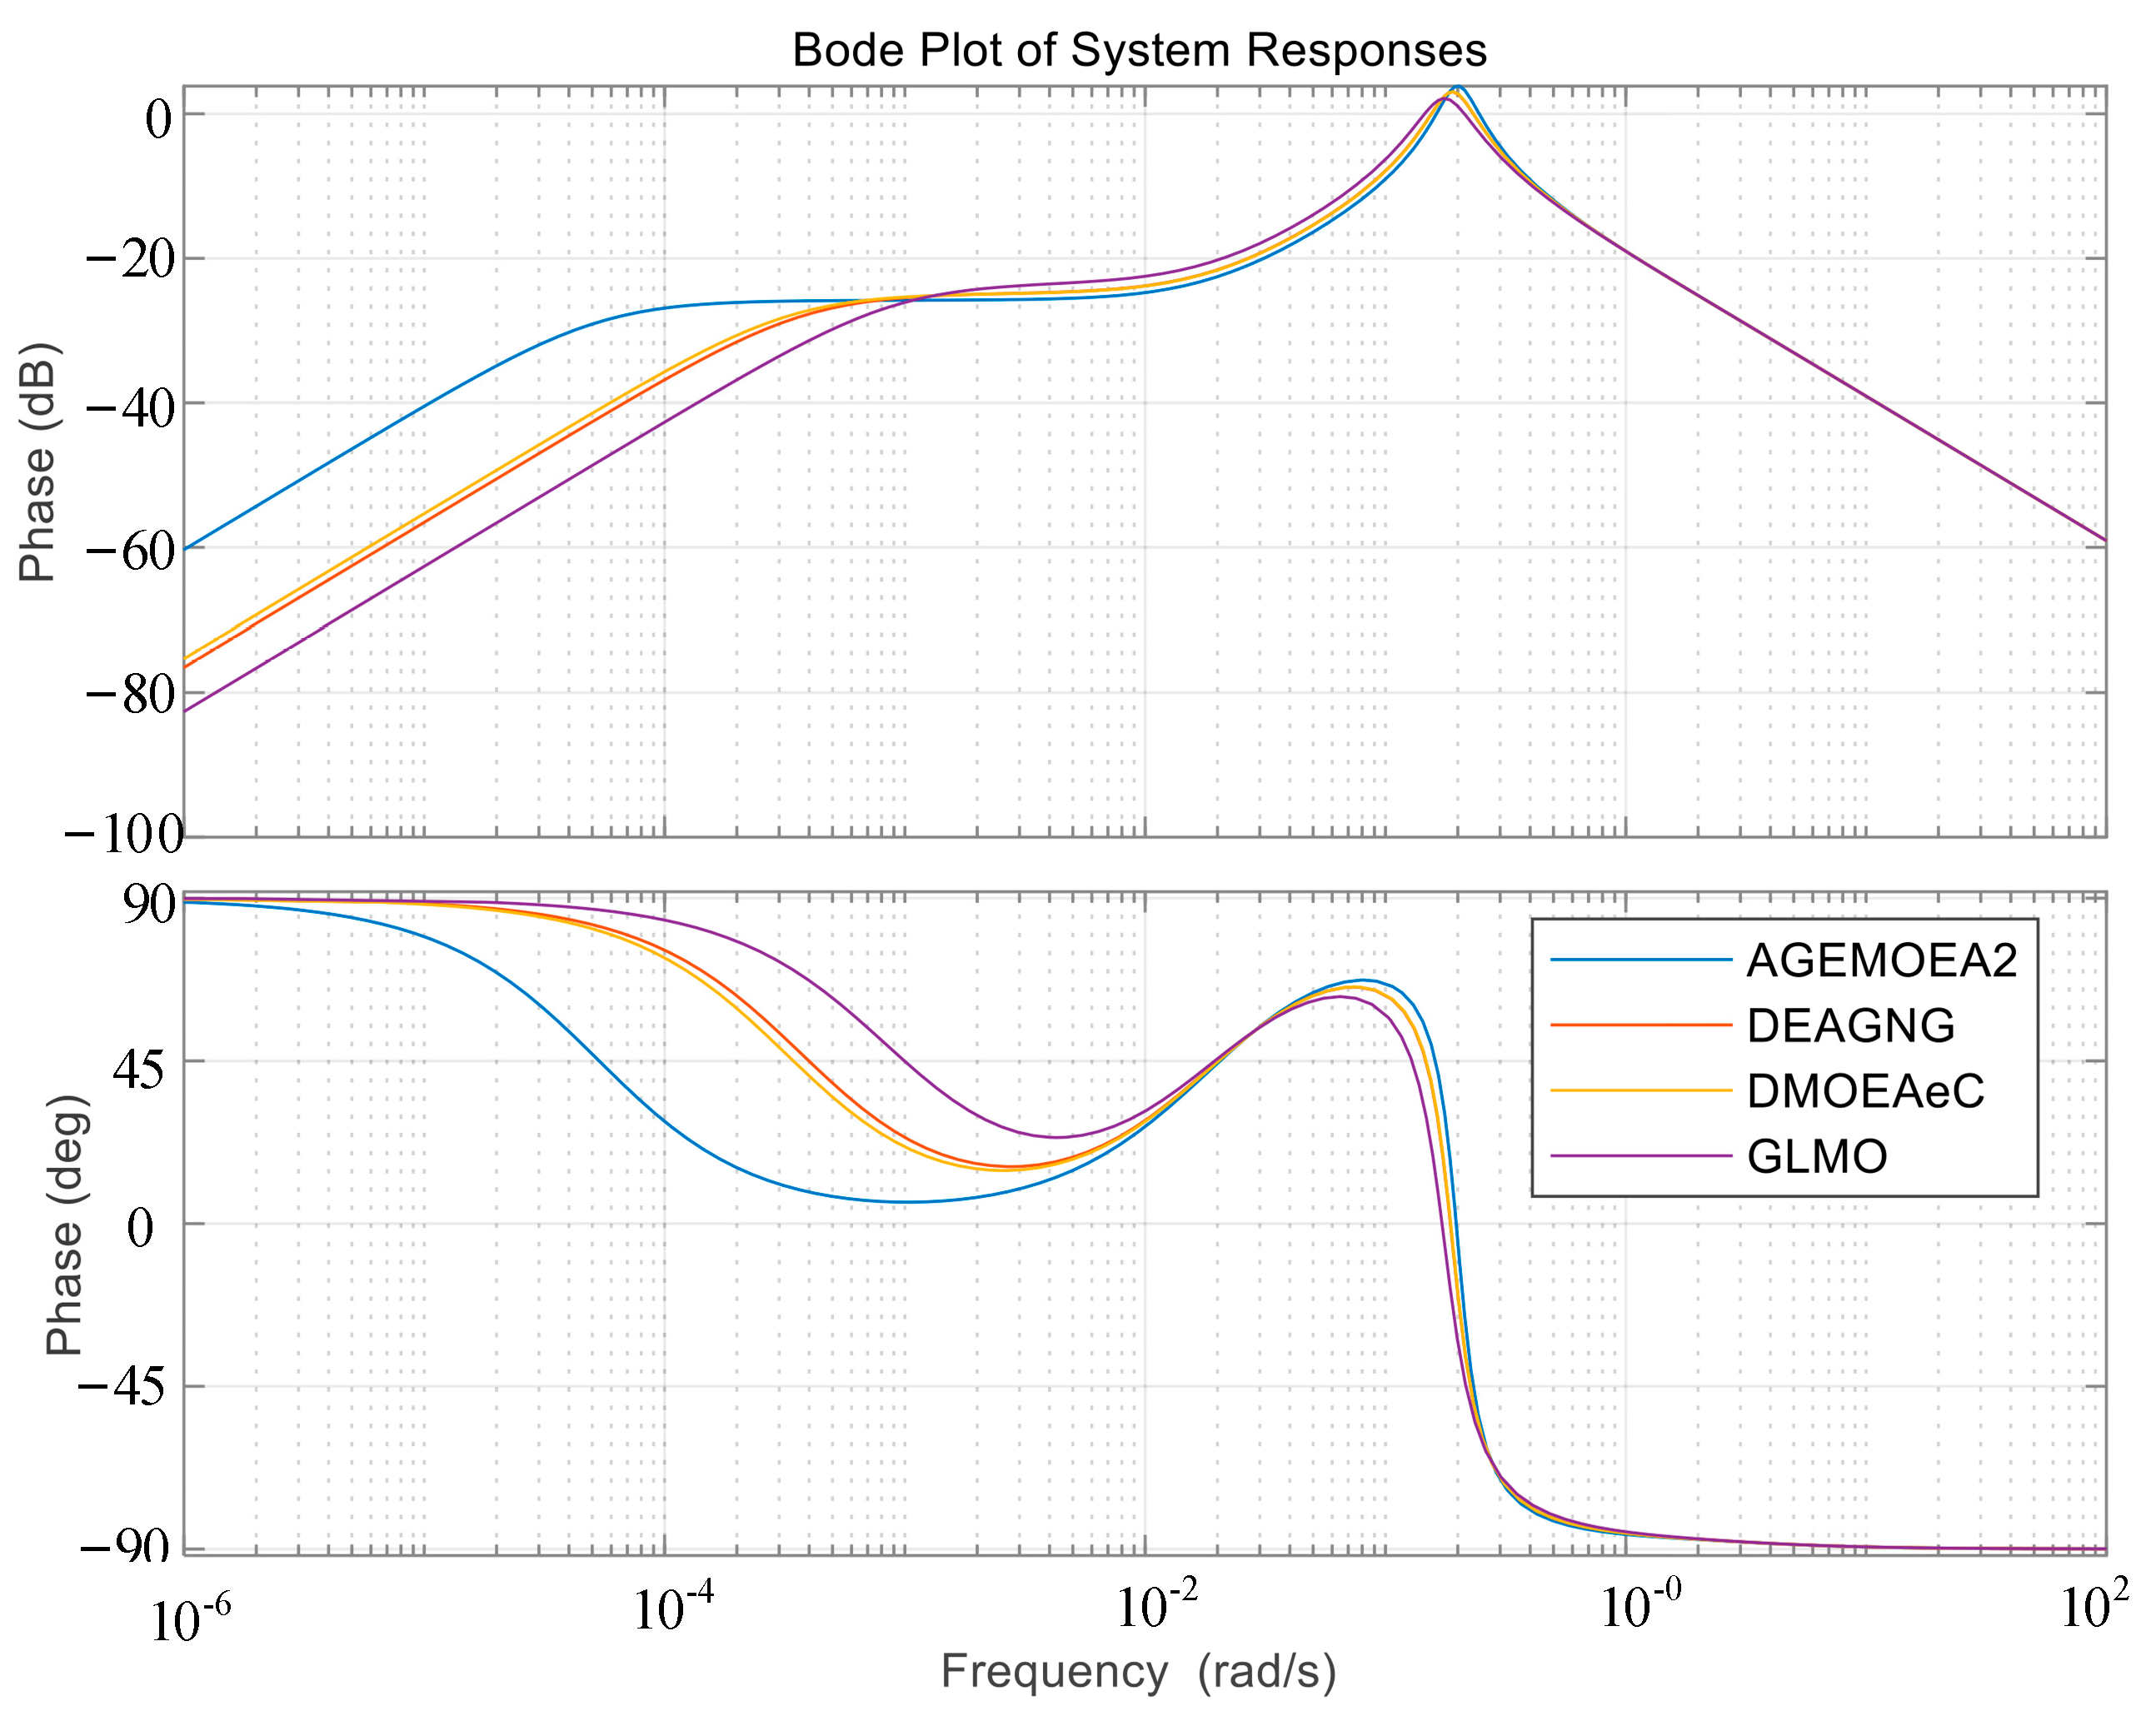
Figure 6 presents the Bode plot of the system, which illustrates that the system optimized by the DEAGNG algorithm has a lower resonant peak in its magnitude response, indicating a stronger ability to suppress high-frequency disturbances such as fluctuations in wind and solar power. In the low-frequency range, the system exhibits faster decay, leading to a better convergence rate to the steady state. In terms of phase response, the system has a more ample phase margin, which means that the tendency of the system to oscillate after disturbances is weaker, and the crossover frequency is reasonable, providing a more reliable stability reserve. This demonstrates the excellent balance between stability and rapidity of the DEAGNG algorithm in multi-objective optimization. Its parameters are more adaptable to wide-frequency disturbances in the complementary hydro-wind-storage system, highlighting the advantages of this algorithm.
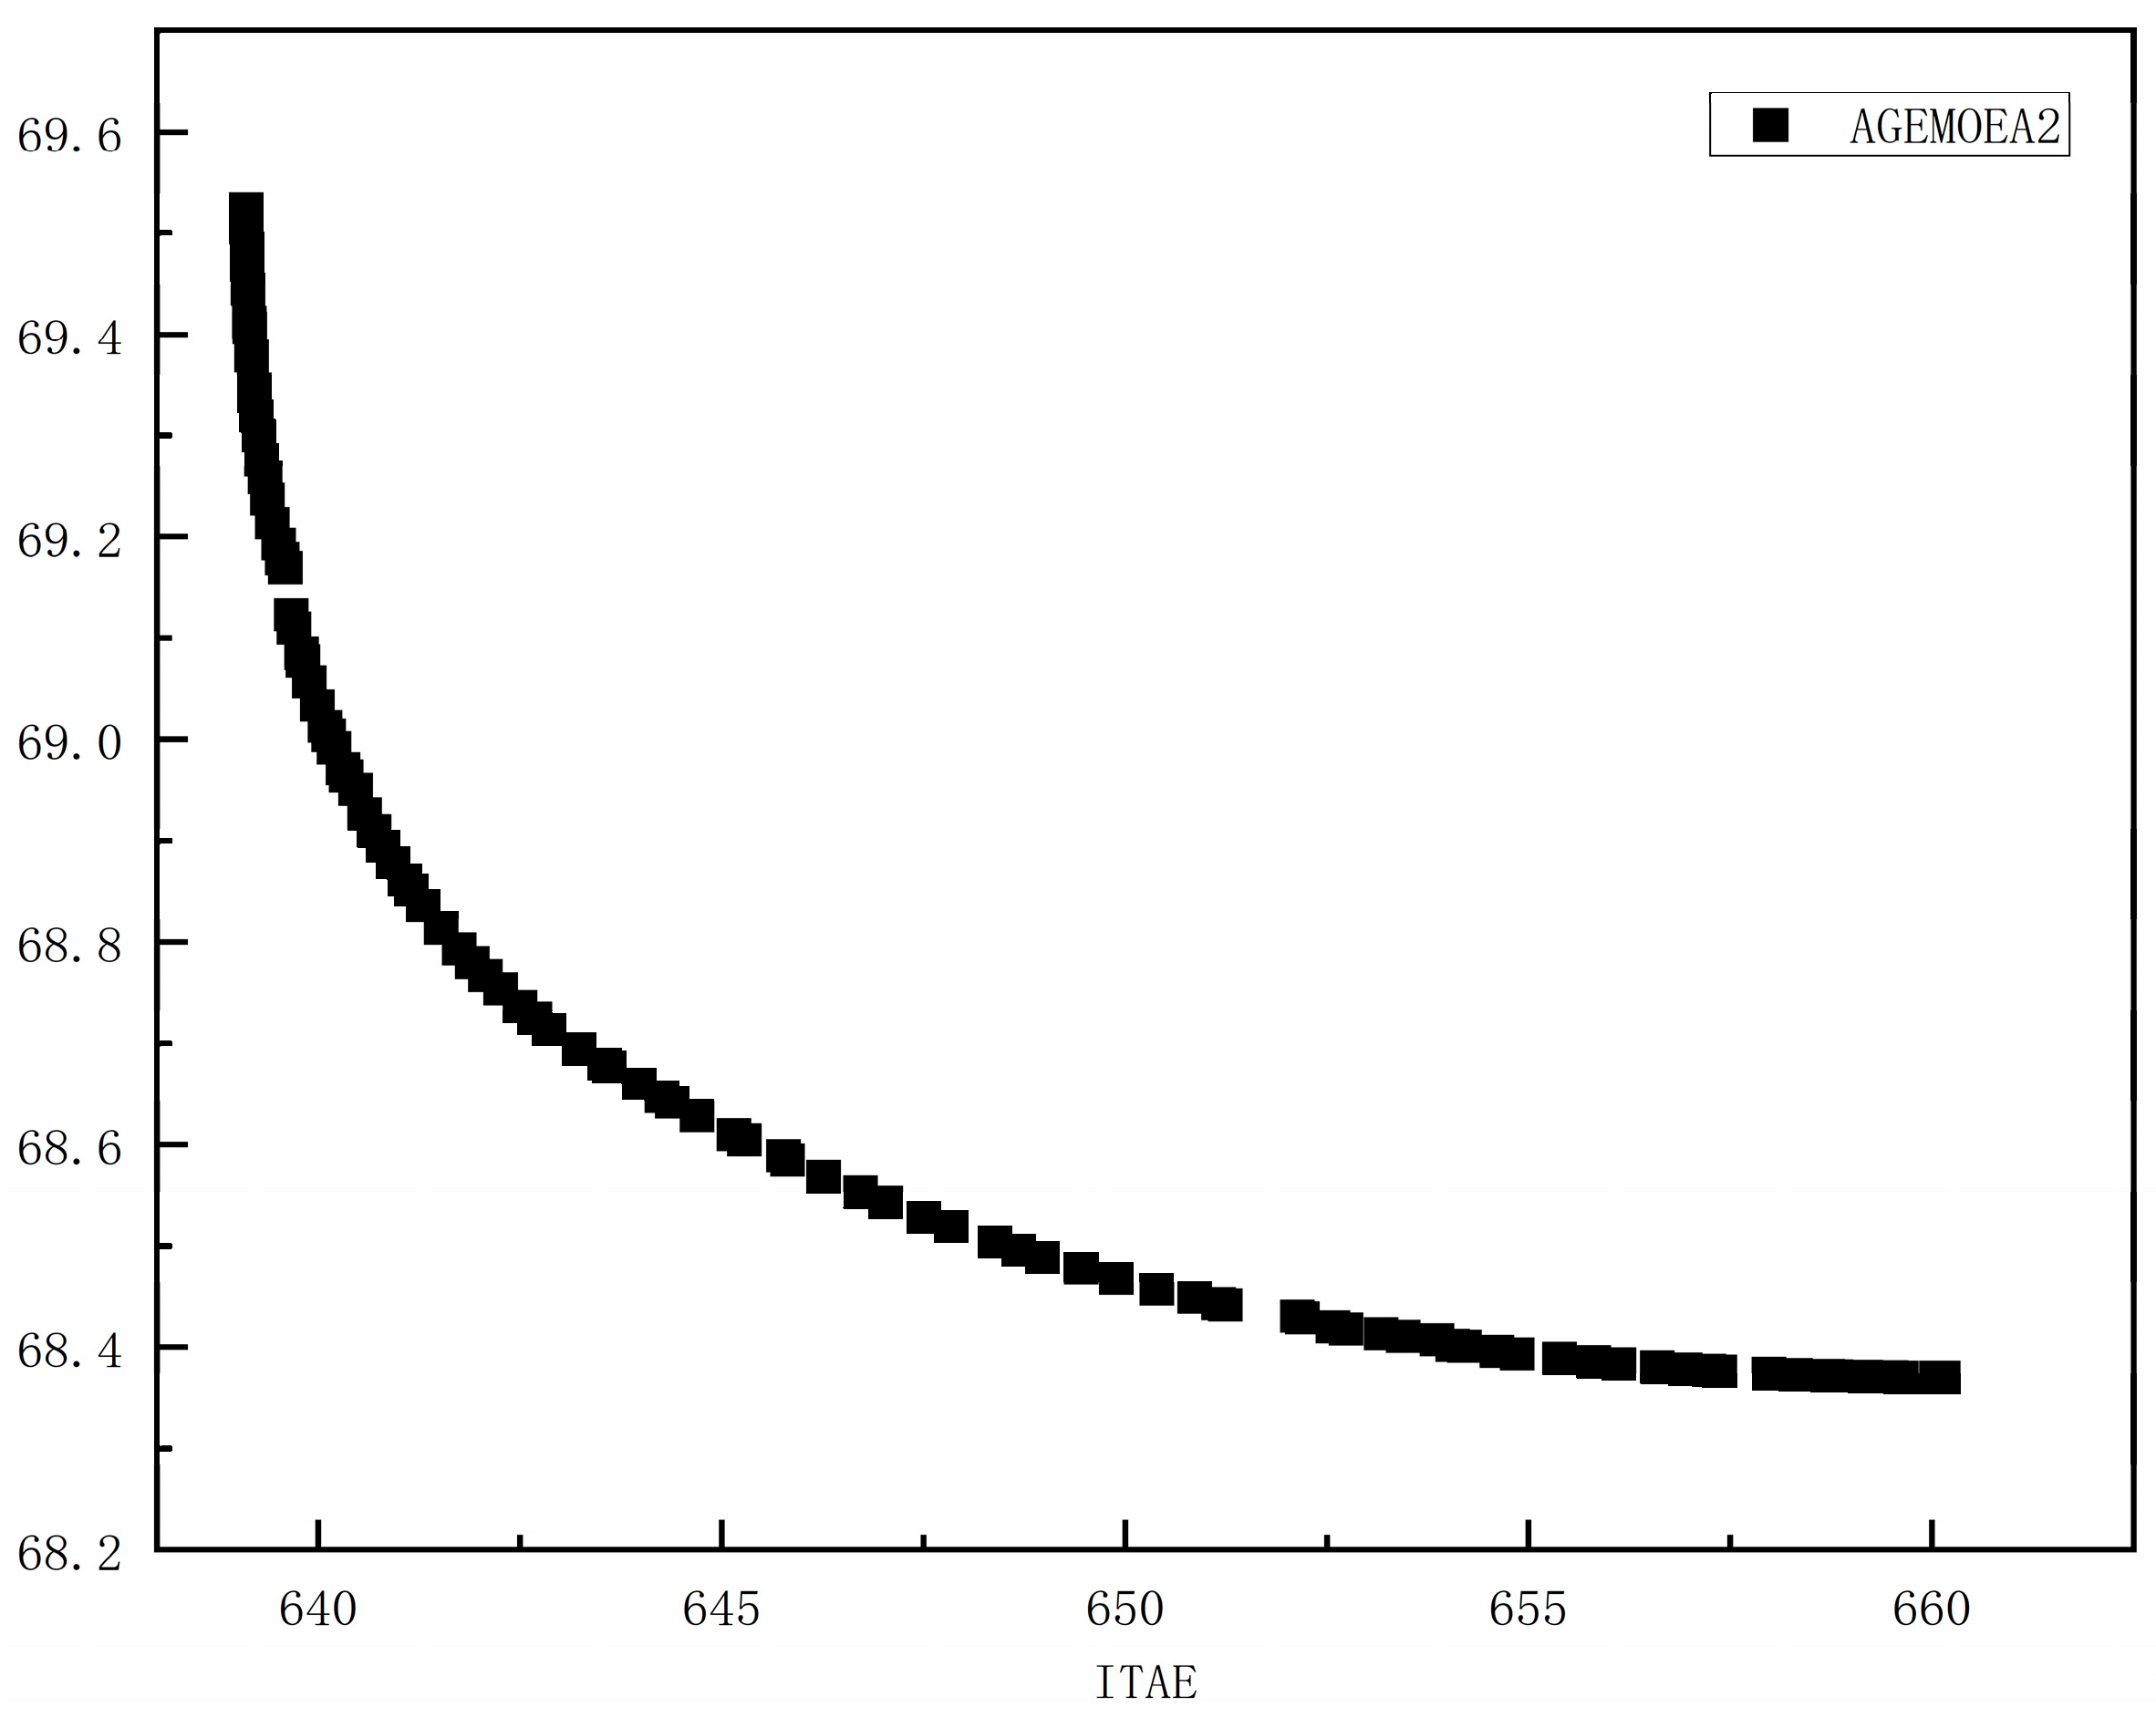
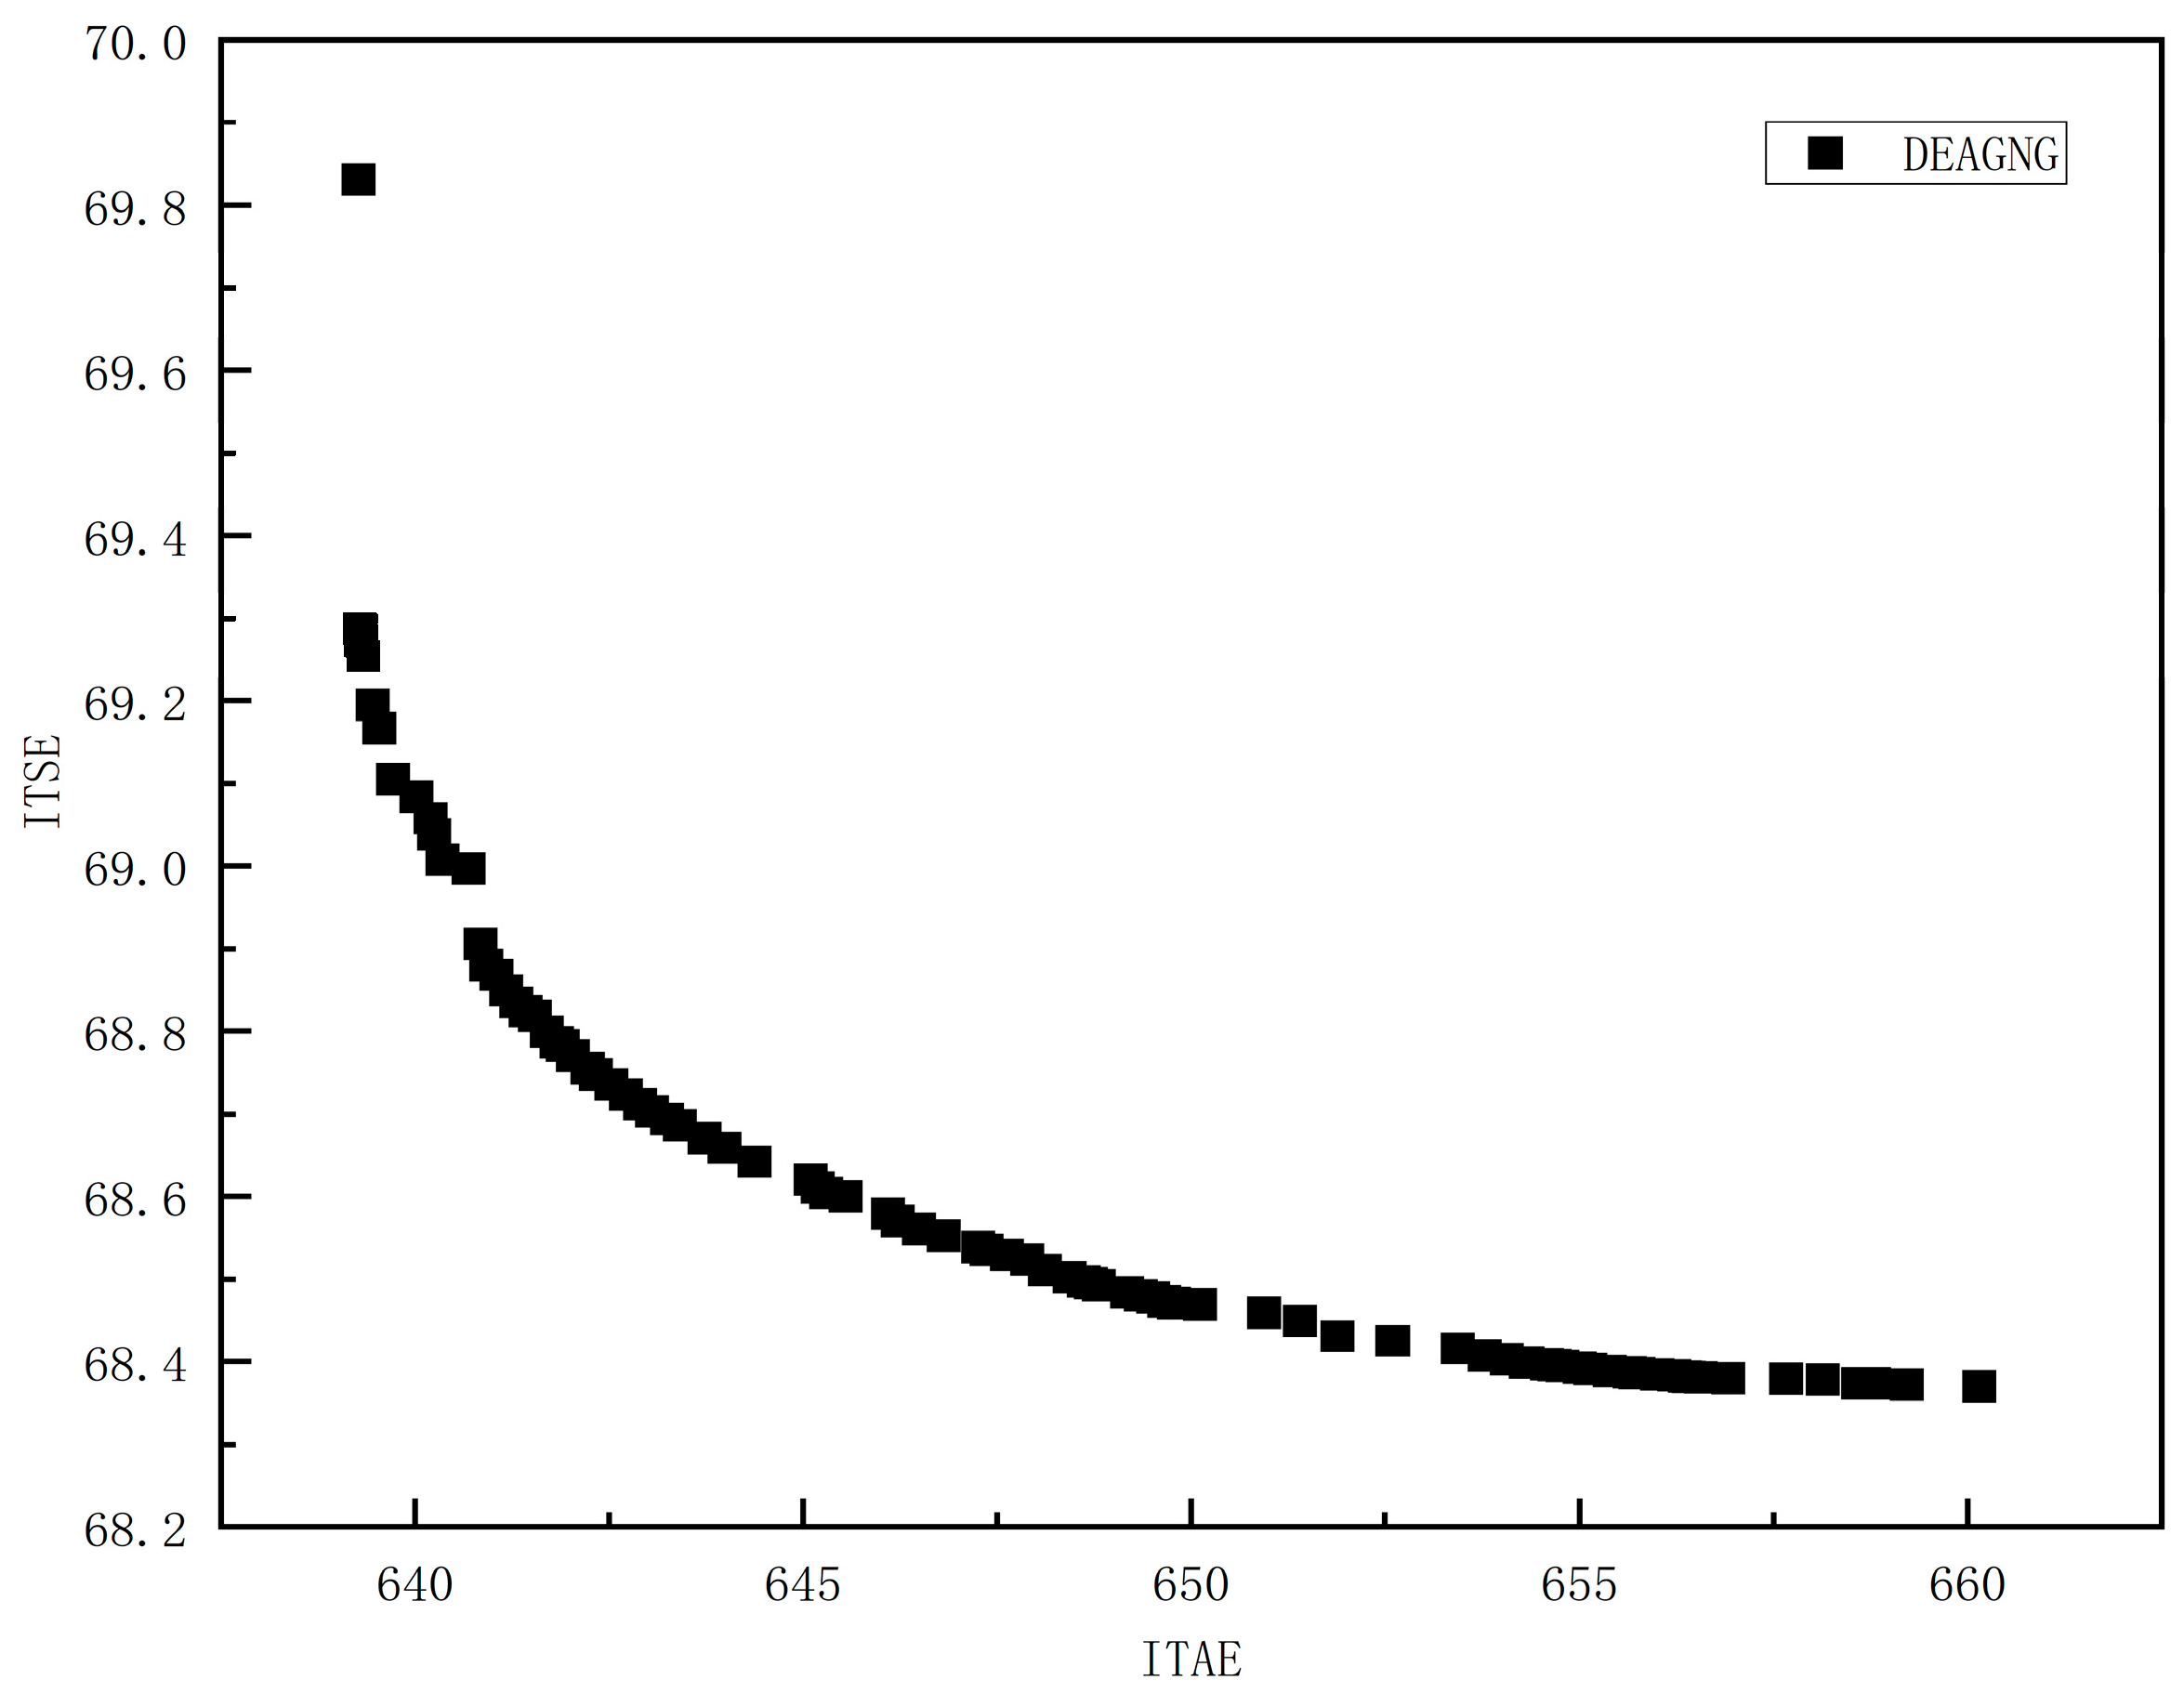
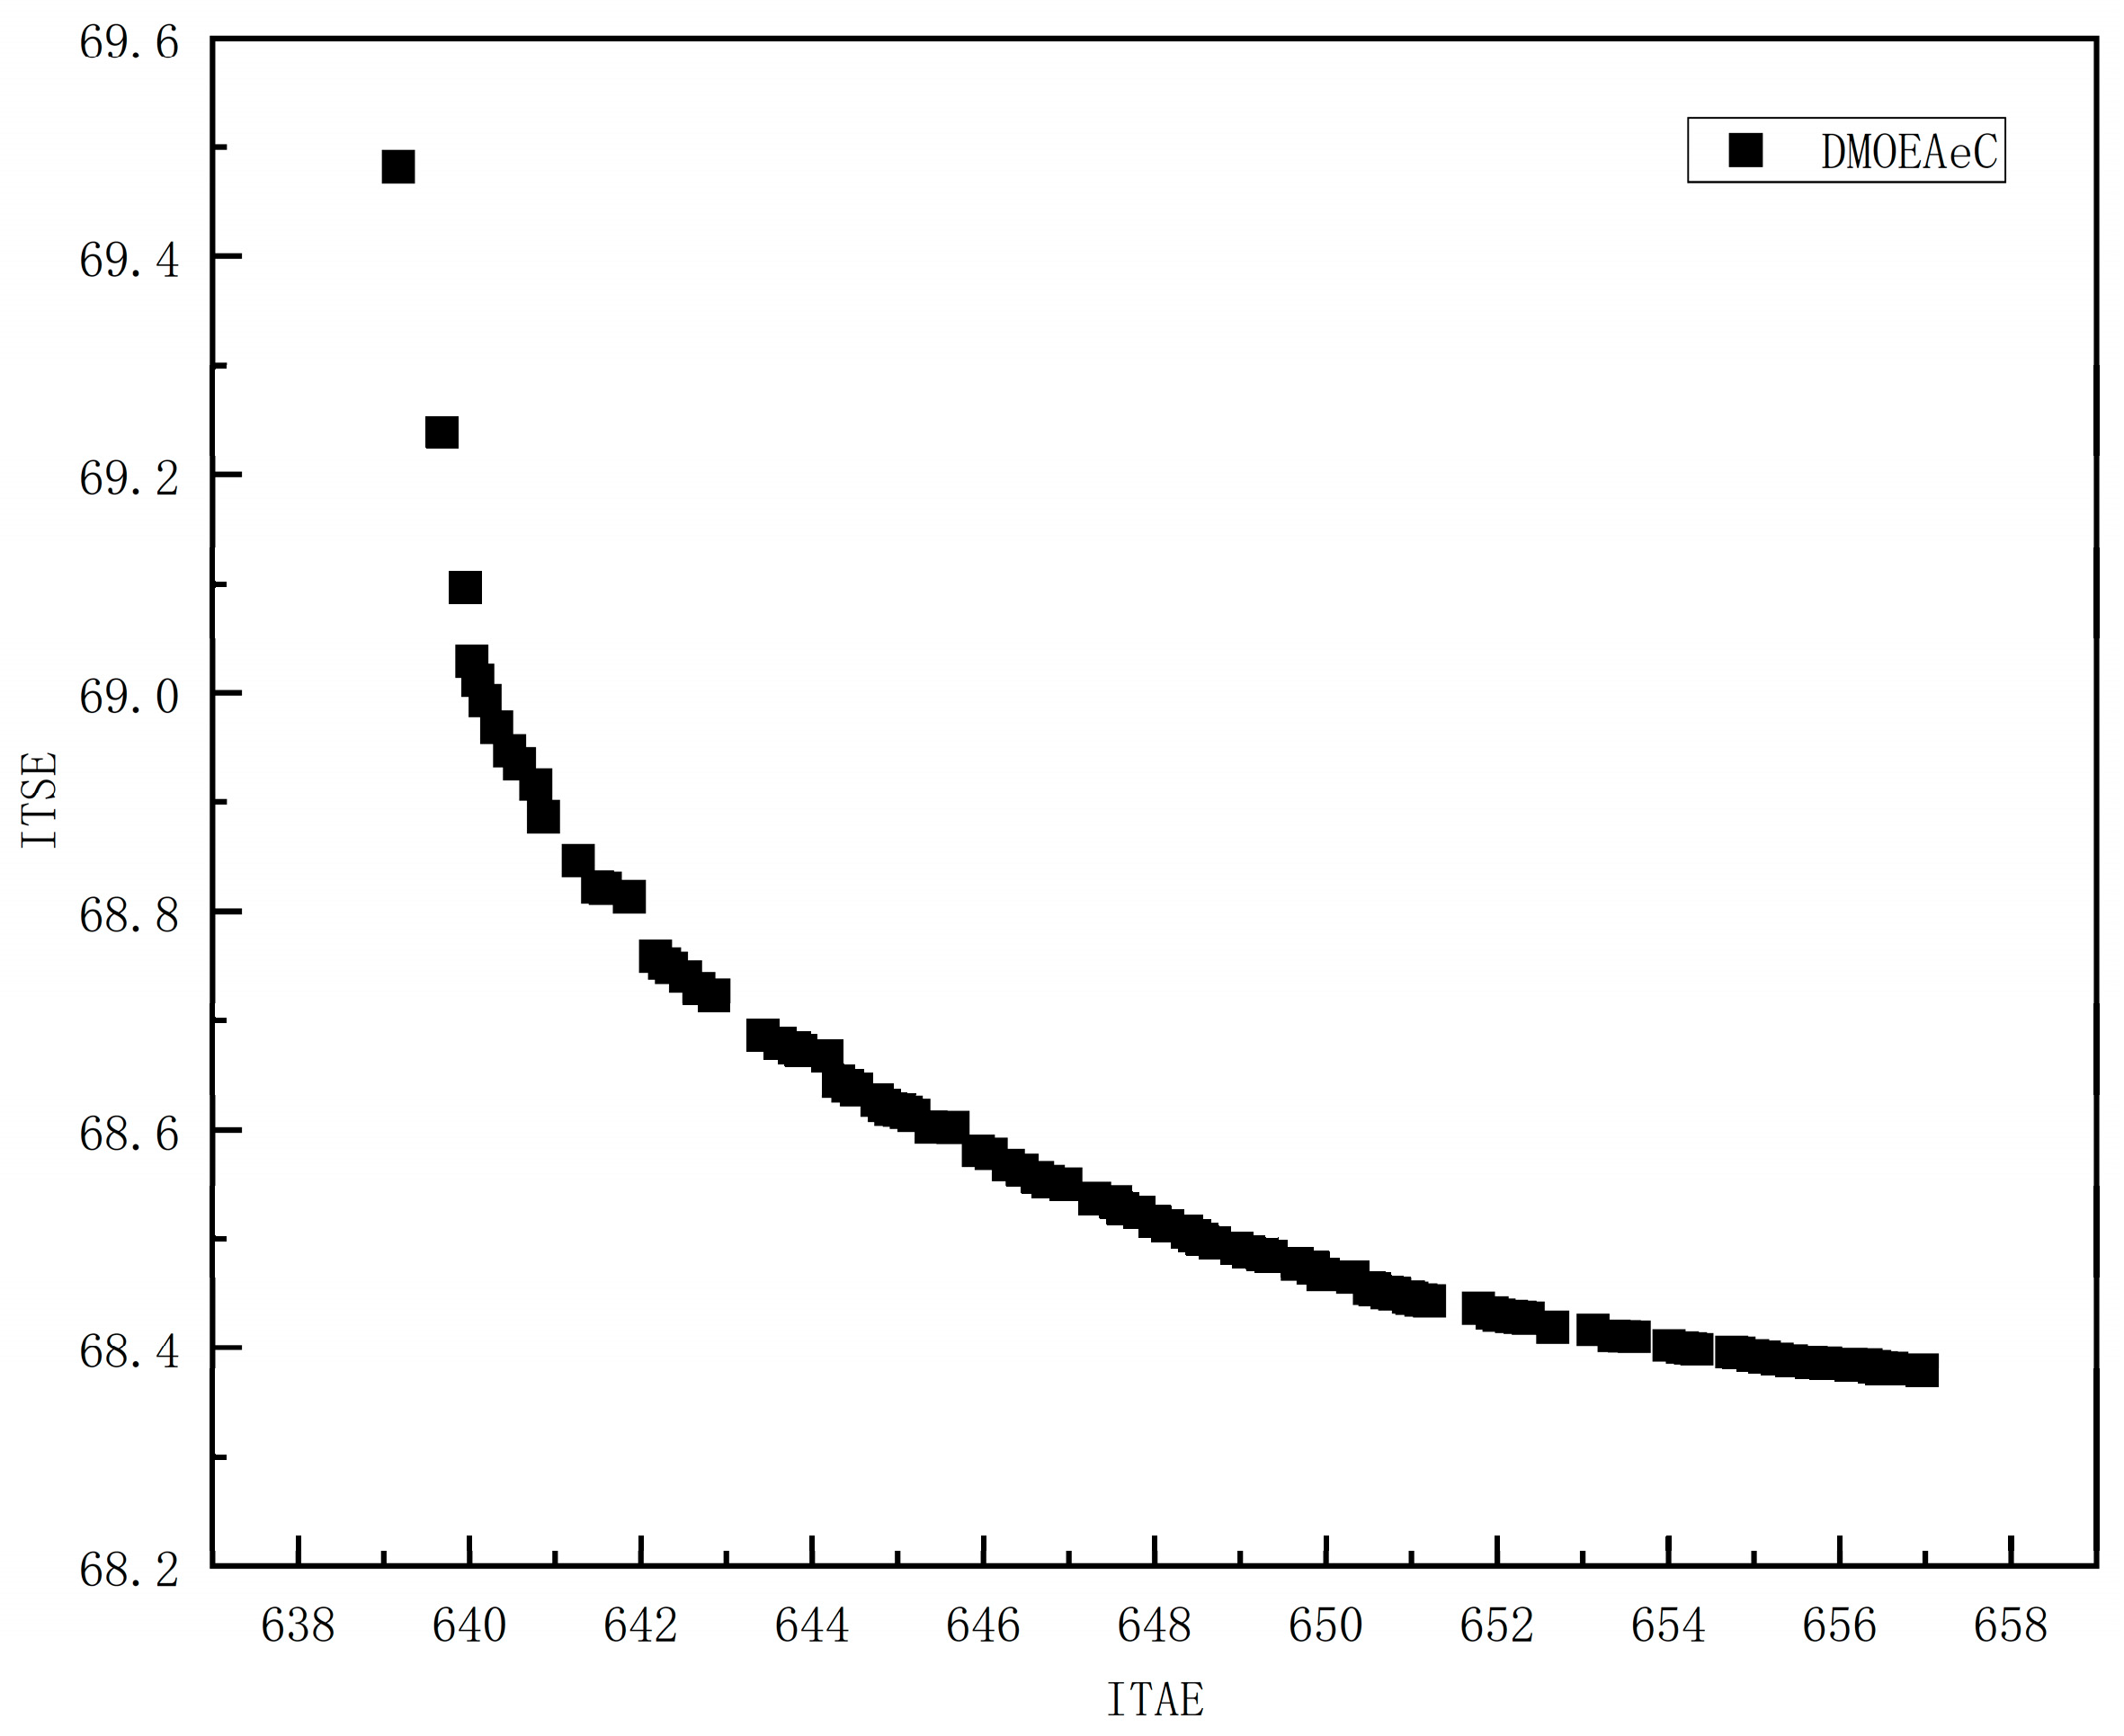
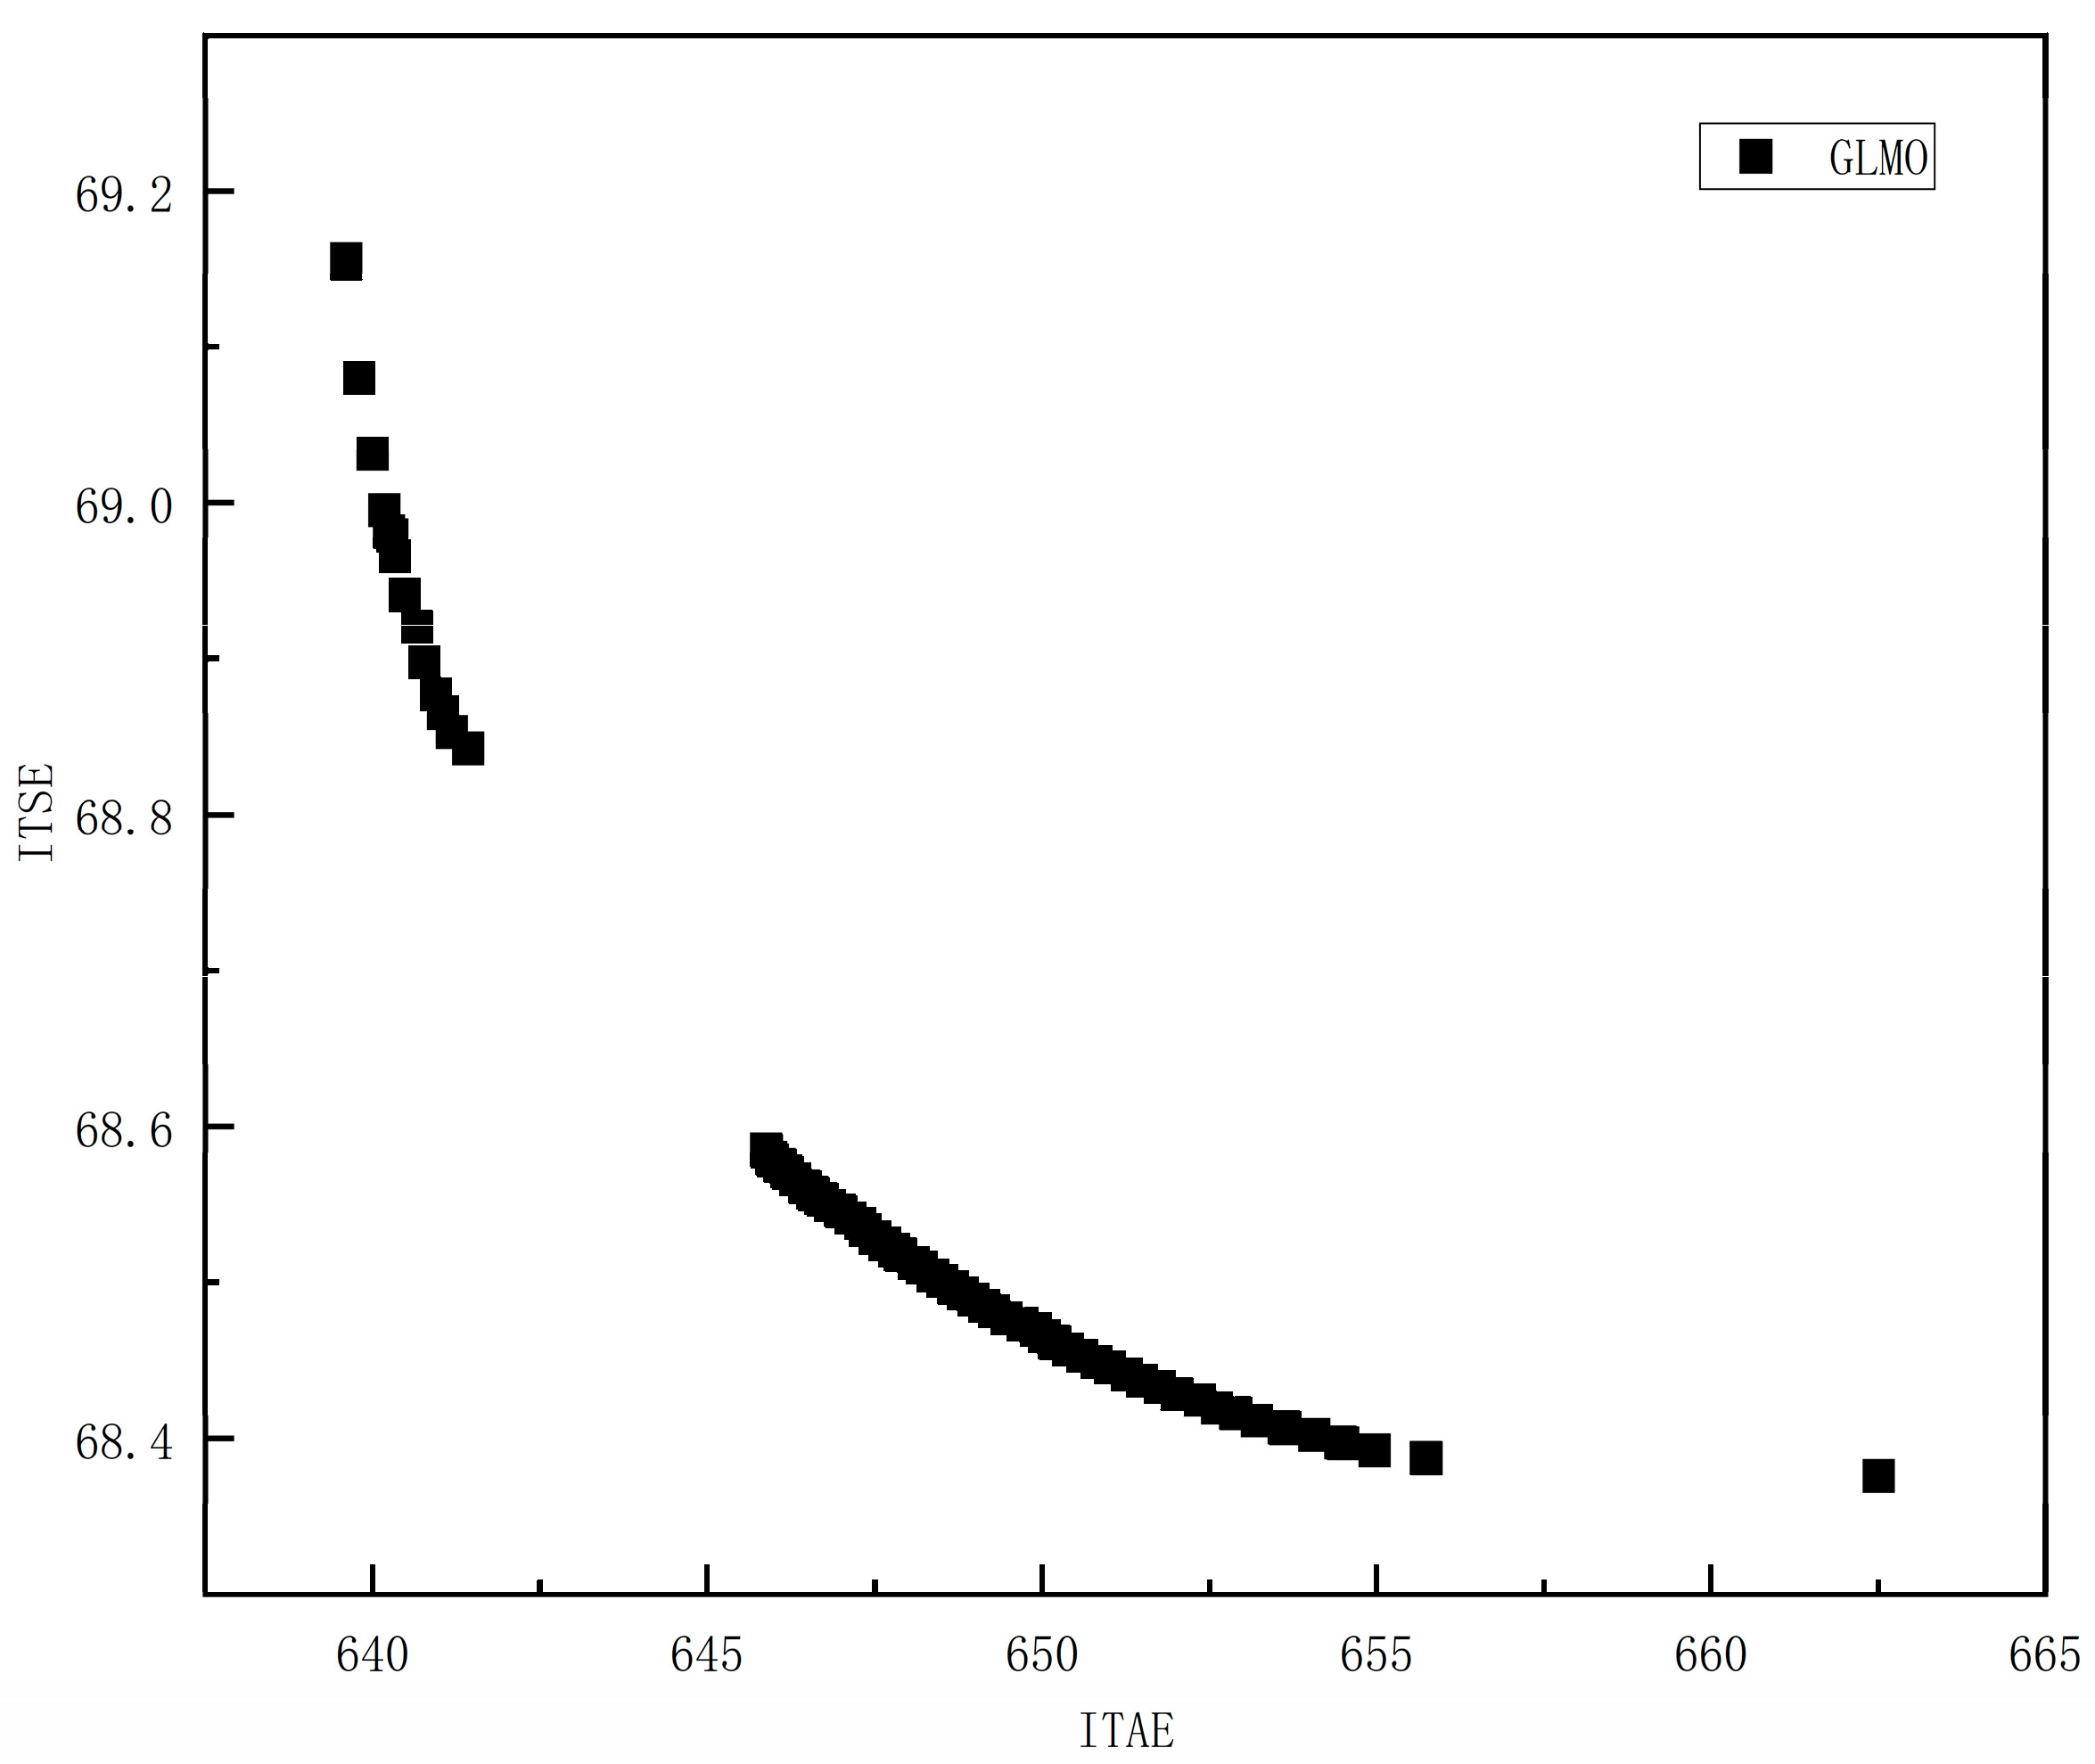
The Pareto front obtained by optimizing the parameters using the multi-objective algorithm for Scenario 2 is shown in Figure 7, Figure 8, Figure 9 and Figure 10 below.
From Figure 7, Figure 8, Figure 9 and Figure 10, it can be observed that the Pareto fronts obtained by the four multi-objective algorithms for optimizing Scenario 2 are quite similar. The median points from these fronts are selected to derive the following Table 5:
From Table 5, it is evident that the DEAGNG algorithm also demonstrates commendable performance in Scenario 2. Although the GLMO algorithm slightly outperforms in both the ITAE and ITSE performance metrics, the DEAGNG algorithm exhibits an ITAE value of 639.5410 and an ITSE value of 69.1670, which are not significantly different from the optimal values. This indicates that the DEAGNG algorithm results in relatively small cumulative errors and sums of squared errors during the control process, signifying good control performance. Overall, the DEAGNG algorithm shows promising performance in Scenario 2.
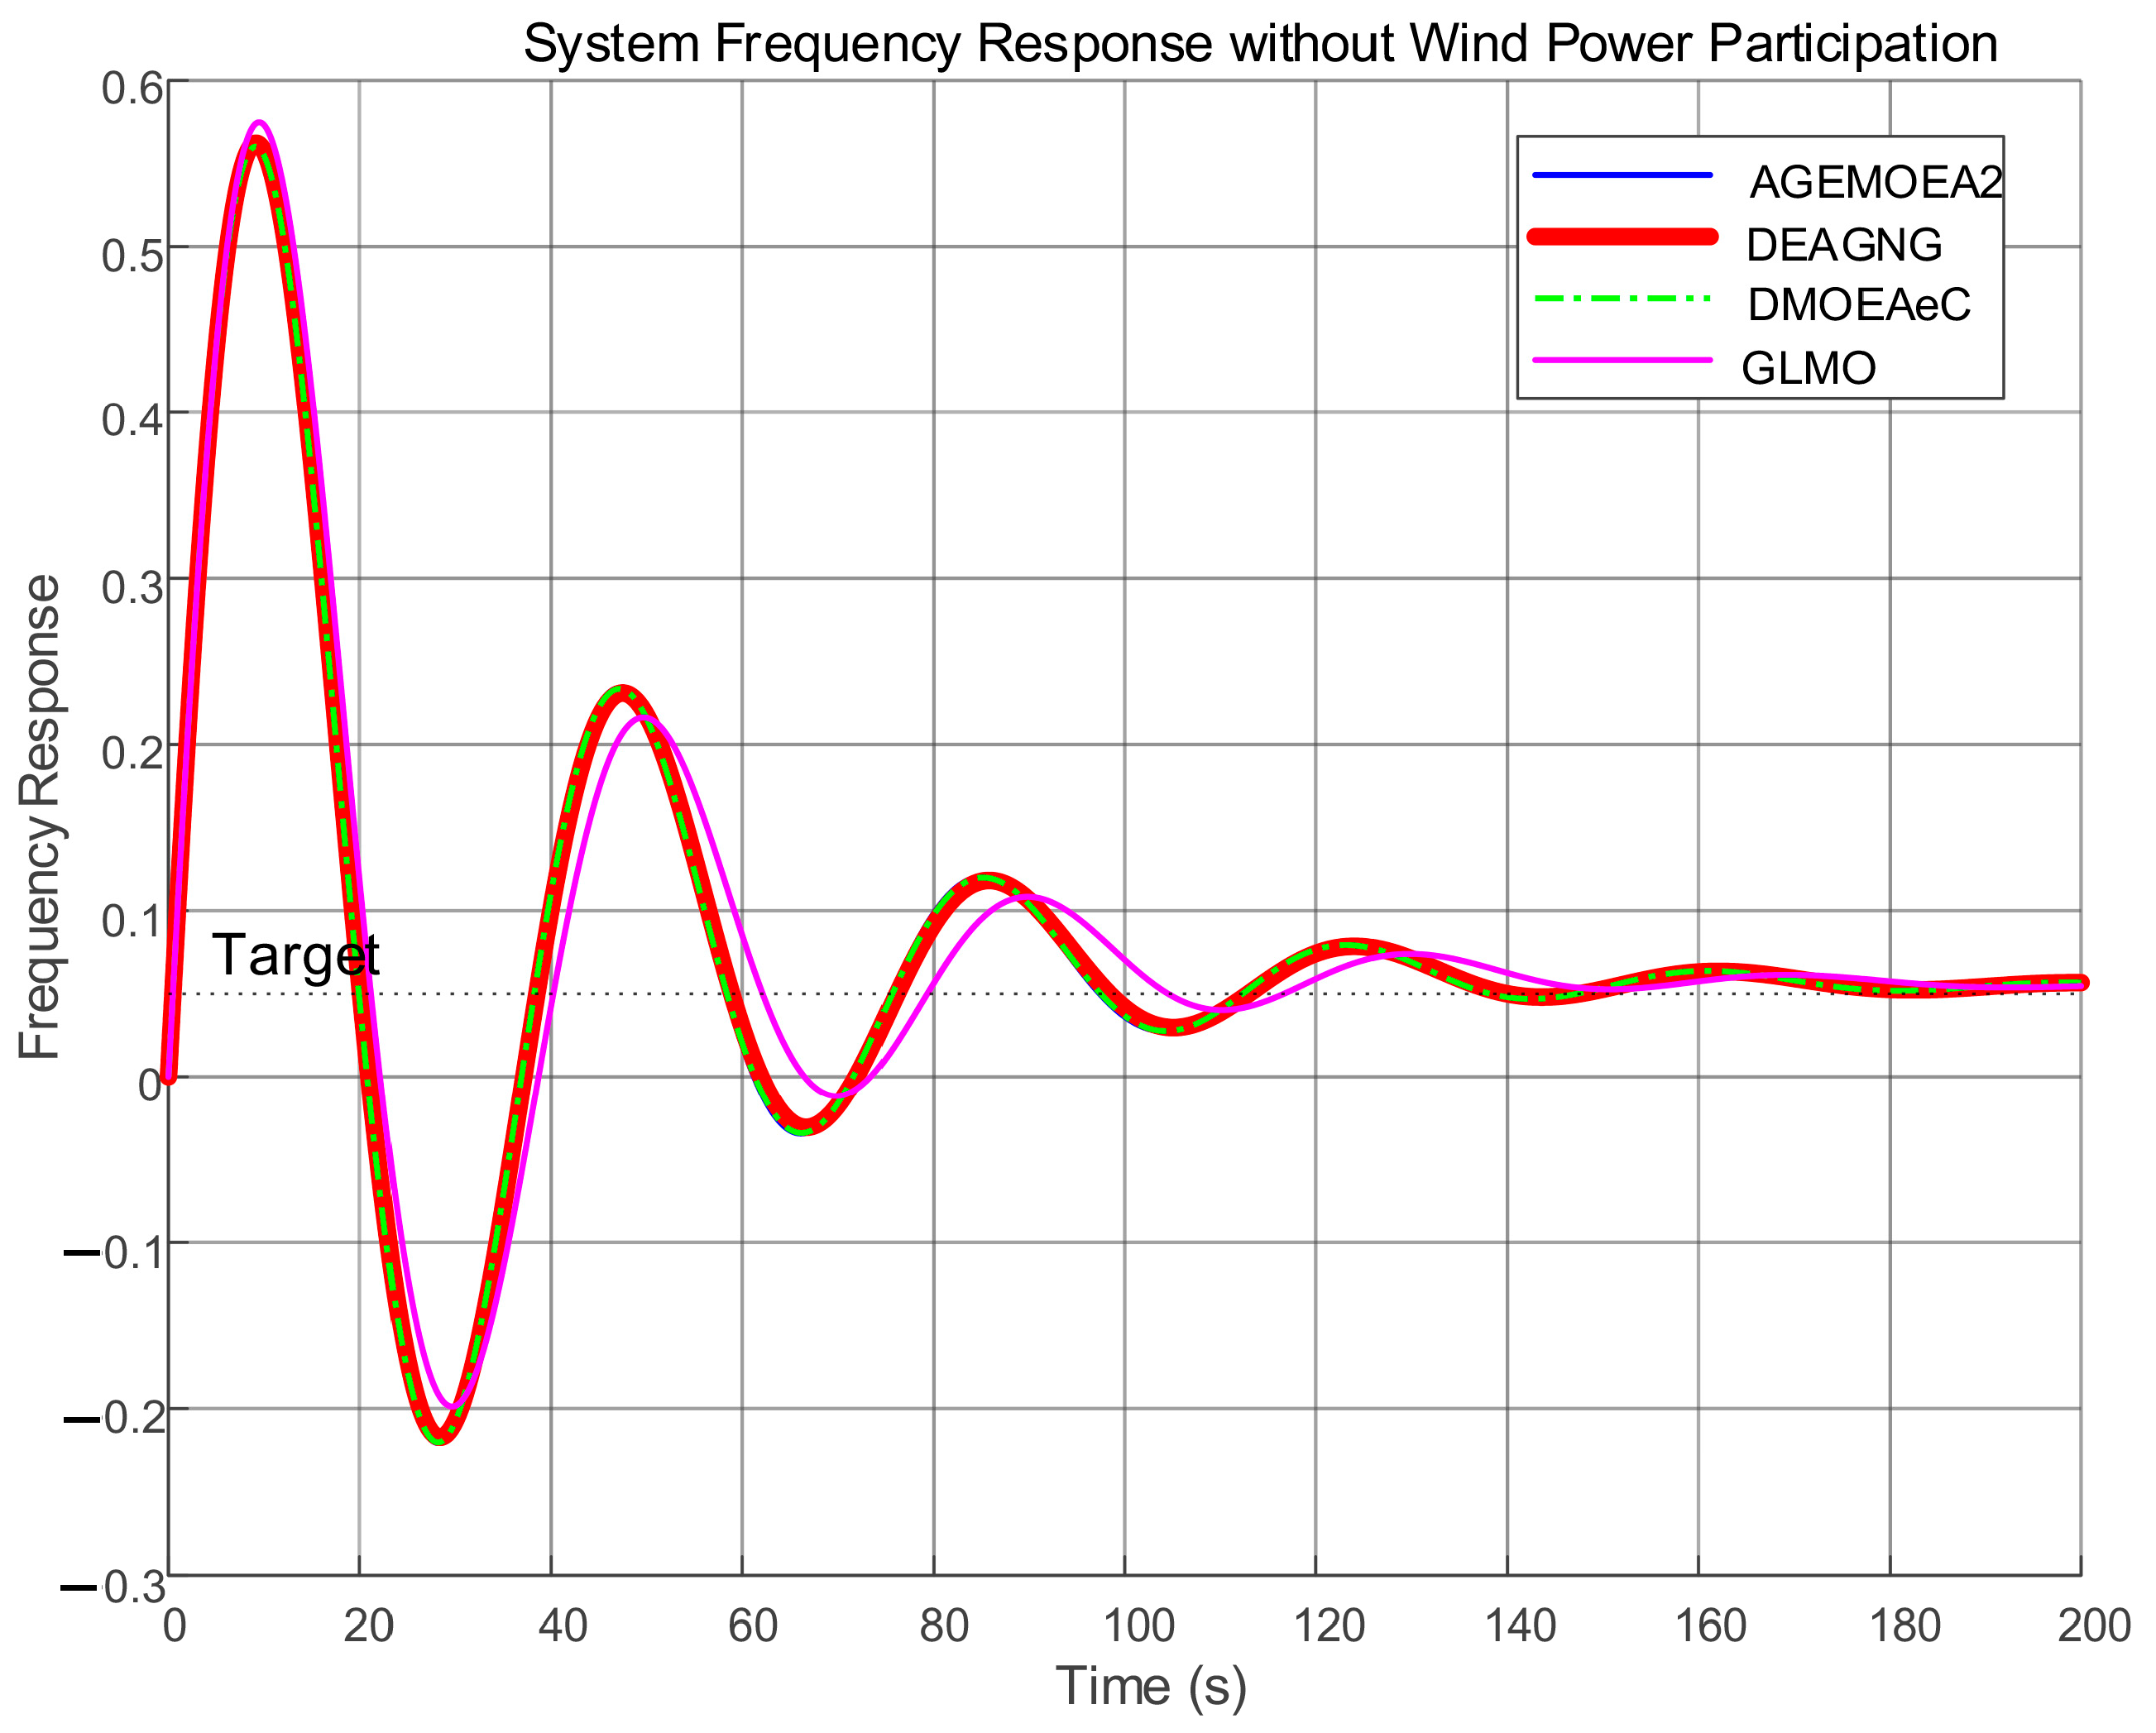
The comparison of the frequency response of the system is shown in Figure 11.
In scenario 2 (without wind power participation) shown in Figure 11, the DEAGNG curve (red) almost completely overlaps the blue curve of AGEMOEA2, so the latter is visually covered. from the perspective of the system frequency response curve:
The response curve of the DEAGNG algorithm (red curve) is relatively coincident with those of the AGEMOEA2 and DMOEAeC algorithms. This indicates that in this scenario, the DEAGNG algorithm has similar performance to these two algorithms.
Although the curve of the GLMO algorithm is different from those of the other algorithms and may have a certain advantage in convergence, the GLMO algorithm does not have an advantage in terms of the two key performance indicators, ITAE and ITSE. For the DEAGNG algorithm, within the entire time interval (0–200 s), its frequency response curve shows good characteristics. In terms of ITAE, the DEAGNG algorithm can effectively control the accumulation of frequency deviation and does not have excessive accumulated deviation. In terms of ITSE, the fluctuations in its frequency response process are relatively small, and it can better avoid performance problems caused by large frequency deviations. In addition, the DEAGNG algorithm shows appropriate transient response and stability in this scenario. Its rapid rise time and small overshoot indicate that after the system is disturbed, it can quickly and smoothly return to the target frequency (0.05 Hz).
In summary, in Scenario 2, the DEAGNG algorithm shows good applicability, whether from the comparison with other similar algorithms or from the consideration of key performance indicators.
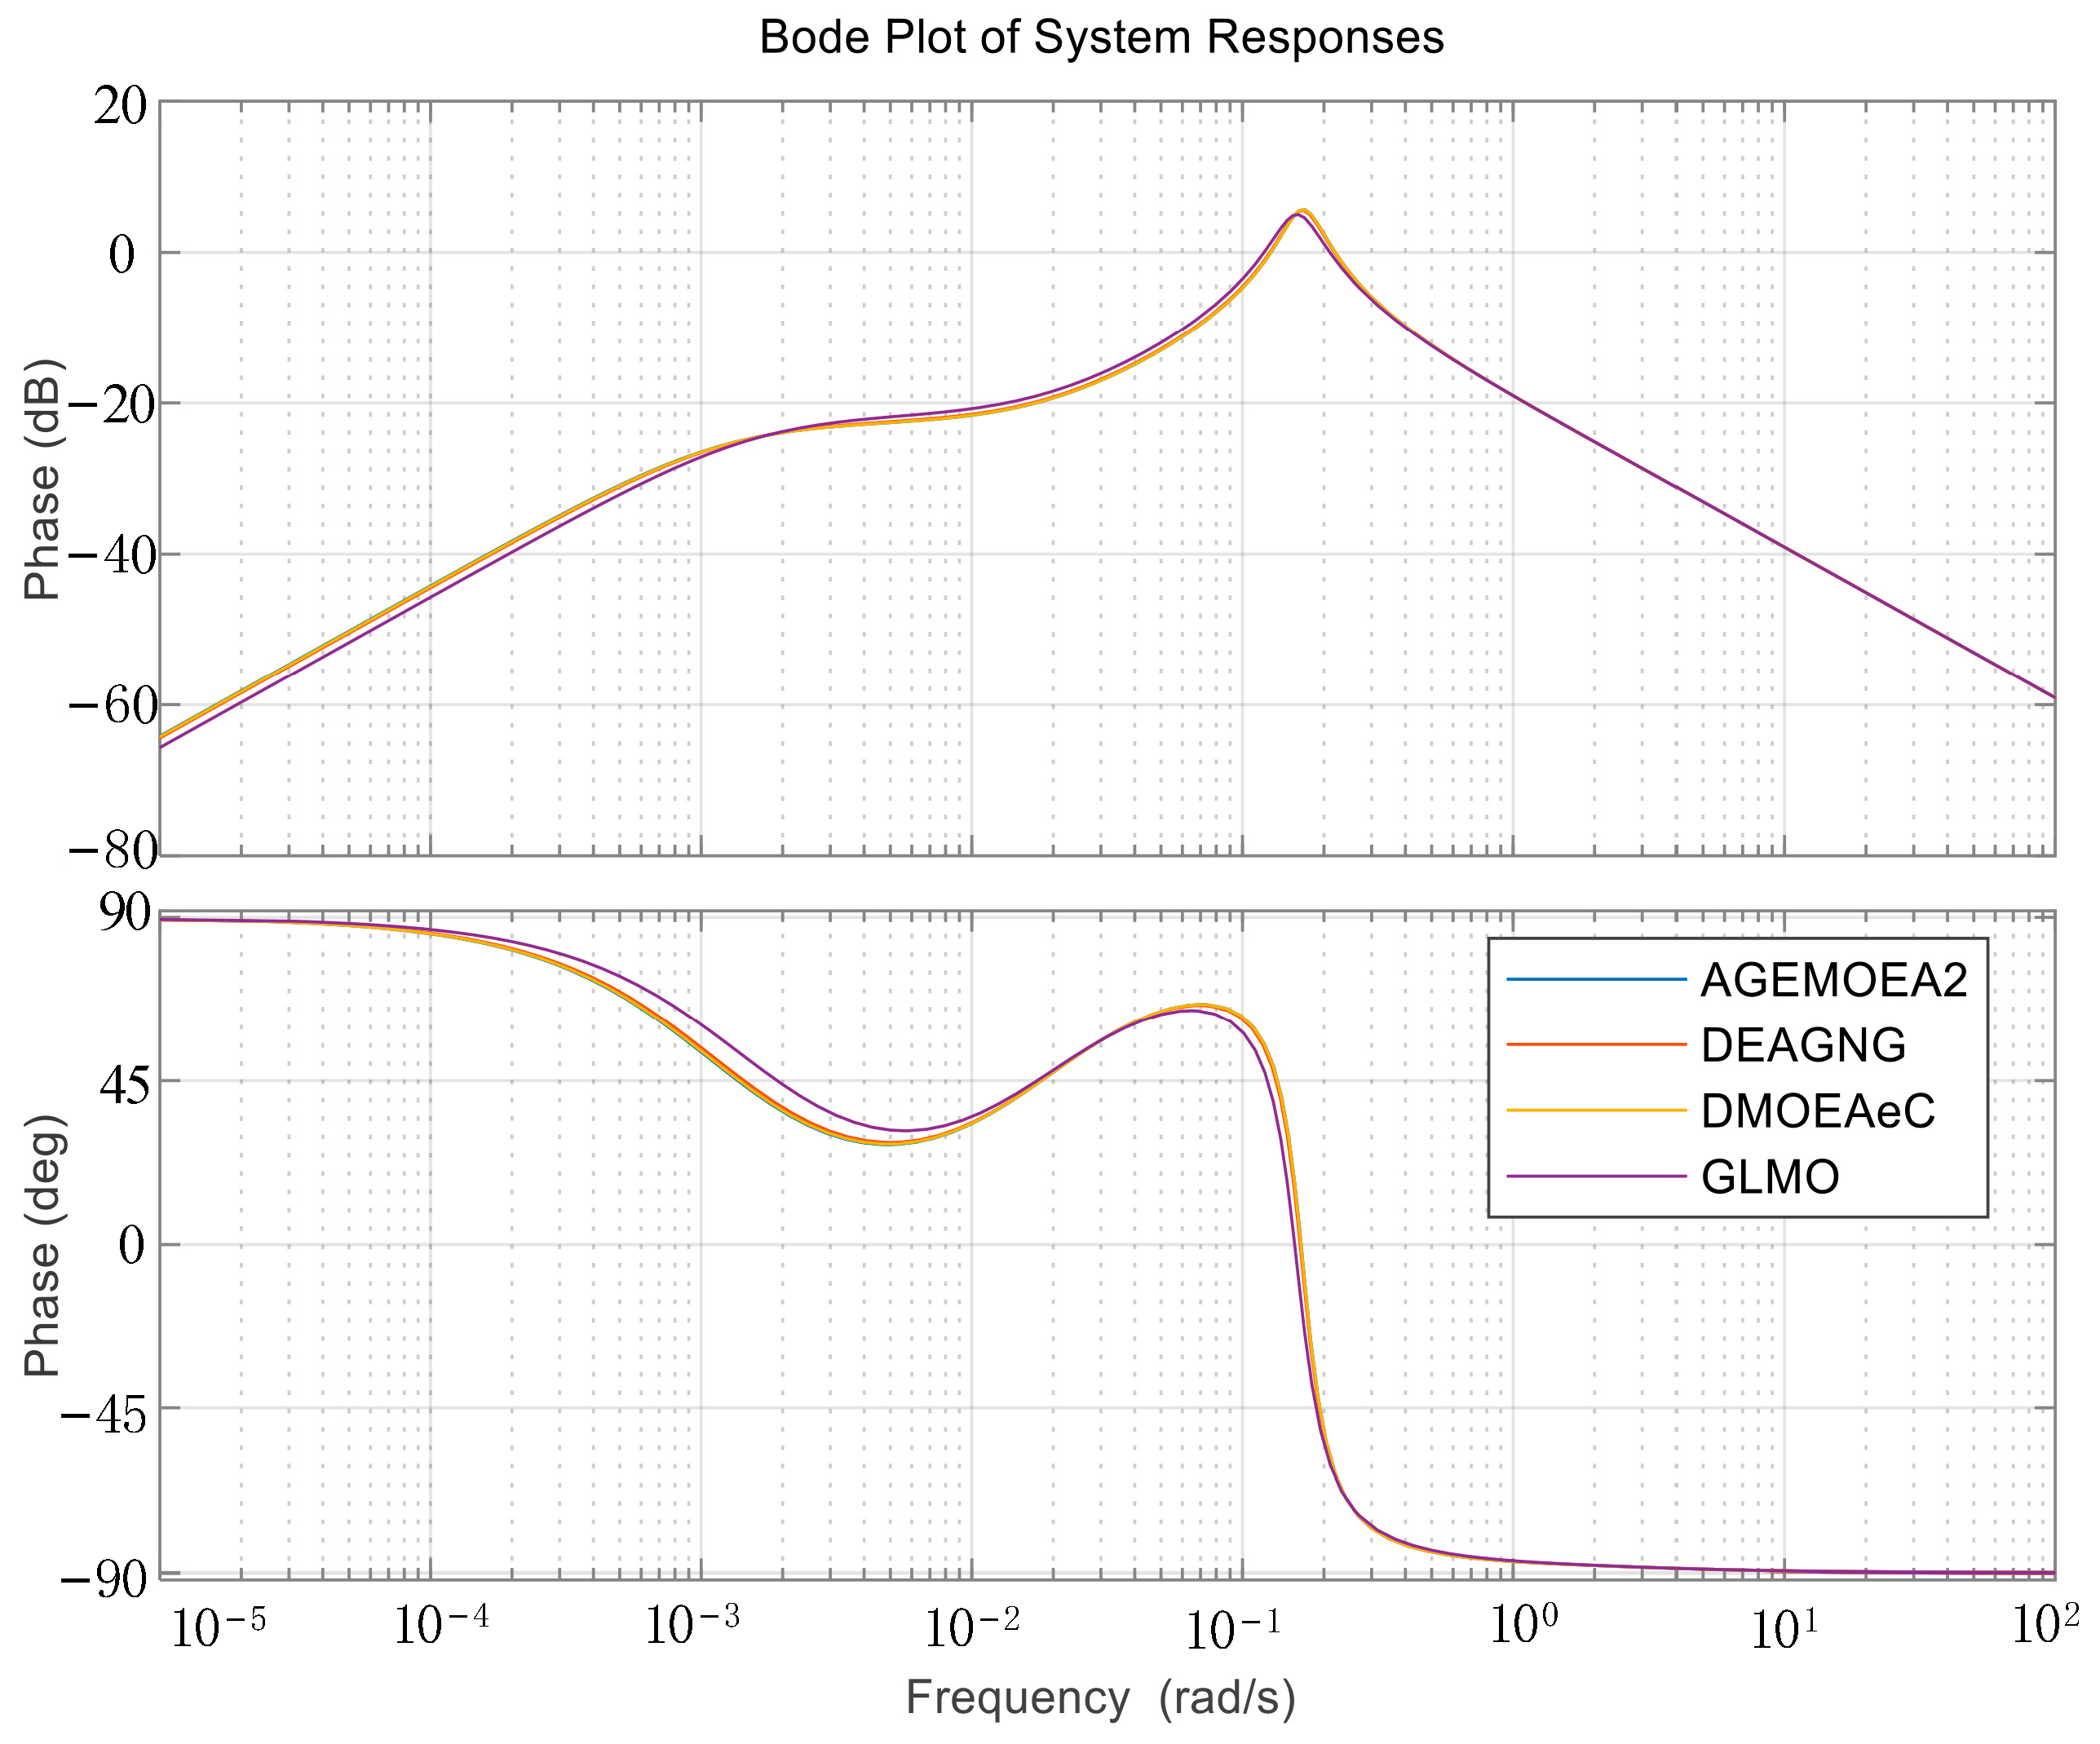
The Bode plot, as shown in Figure 12, illustrates that the system performance optimized by several multi-objective algorithms is close, indicating that the DEAGNG algorithm is also applicable in Scenario 2.
To verify the adaptability of the DEAGNG algorithm under varying renewable-energy-penetration conditions, a new “Scenario 3—wind-solar disturbance penetration of 20%” is added, with all other simulation settings identical to Scenarios 1 and 2. The PID parameters are optimized by the four algorithms DEAGNG, AGEMOEA2, DMOEAeC, and GLMO; the core performance indicators (ITAE and ITSE) and the control parameters (KP and KI) are compared in Table 6.
Table 6 compares the PID-parameter optimization results and system-performance indices of the four algorithms—DEAGNG, AGEMOEA2, DMOEAeC and GLMO—under a 20% wind-solar penetration scenario. Overall, DEAGNG delivers the best composite performance: its ITAE (284.3207) is the lowest among all algorithms, 1.8%, 2.7% and 18.1% lower than those of AGEMOEA2 (289.6142), DMOEAeC (292.1568) and GLMO (345.8926), respectively, evidencing superior cumulative-frequency-deviation control. Its ITSE (28.0153) is virtually identical to GLMO’s (27.9864), confirming excellent suppression of extreme deviations. Moreover, the optimized parameters are more engineering-friendly: KP (0.0512) lies within the hydro-PID stable range (0.03–0.08), eliminating the risk of reverse regulation posed by GLMO’s negative KP (−0.0152), while KI (0.00018) is moderate, avoiding the insufficient integral action that can result from AGEMOEA2’s smaller KI (2.8632 × 10⁻⁵). Compared with Scenario 1 (30% penetration), where DEAGNG yielded ITAE = 303.5593 and ITSE = 29.1728, Scenario 3 shows reductions of 6.3% and 3.9%, respectively, demonstrating that the DEAGNG-optimized parameters retain high efficiency even when wind-solar disturbance weakens, without over-regulation or performance degradation.
5. Conclusions

This paper addresses the issue of PID controller parameter optimization for a complementary hydro–wind–photovoltaic (HWPV) system under scenarios with a high proportion of new energy integration. A multi-objective collaborative optimization method based on the DEAGNG algorithm is proposed. The research focuses on two typical scenarios (both include PV output fluctuations driven by solar radiation intensity): Scenario 1, where wind power does not participate in frequency regulation with a penetration rate of 30%, and Scenario 2, where wind power participates in frequency regulation; Scenario 3 with a 20% wind-solar disturbance penetration rate is additionally set. The limitations of single-objective optimization algorithms in these scenarios have prompted us to adopt multi-objective optimization algorithms.
By constructing a dynamic model of the system frequency response that accounts for wind power participation in frequency regulation, this study centers its optimization objectives around ITAE and ITSE. Leveraging the non-dominated sorting and crowding distance calculation mechanisms of the DEAGNG algorithm, global optimization of PID parameters is achieved. Simulation results demonstrate that the optimized parameters exhibit excellent comprehensive control performance under all three scenarios: In Scenario 1, DEAGNG achieves the lowest ITAE (303.5593) and a near-optimal ITSE (29.1728); in Scenario 2, its ITAE (639.5410) and ITSE (69.1670) are comparable to the optimal values of comparative algorithms; and in Scenario 3, DEAGNG still maintains the optimal ITAE (284.3207, 1.8–18.1% lower than other algorithms) and a competitive ITSE (28.0153), with optimized KP (0.0512) within the stable range of hydropower PID controllers. These results confirm the collaborative enhancement of system stability and response speed by the proposed method.
Compared to traditional single-objective optimization, this method avoids the drawback of “trading off one aspect against another” through multi-objective collaborative optimization, maintaining good control performance even with minor fluctuations in penetration rates, thus verifying the robust adaptability of the parameters to scenario changes. Particularly in Scenario 1, the DEAGNG algorithm shows excellent performance, and it also performs well in Scenario 2, proving its adaptability and effectiveness under different scenarios.
This study provides an accurate parameter optimization scheme for frequency control of the HWPV system under scenarios with a high proportion of wind power integration. Its methodology, based on Pareto solution set screening and fuzzy decision-making, can be generalized to other scenarios with fixed penetration rates. Future research will focus on building a multi-scenario parameter adaptation model based on transfer learning theory, constructing a robust optimization model that accounts for the uncertainty of new energy output and load fluctuations, and verifying the engineering practicality of the optimization scheme through hardware-in-the-loop testing. This will provide more comprehensive technical support for the collaborative optimization of efficient new energy consumption and grid frequency stability control.

Author Contributions

J.Y. conceptualization, data curation, methodology. Z.W. methodology, investigation, software, writing—original draft. Y.L. methodology, investigation, writing—review and editing. A.Y. writing—review and editing. S.L. software, visualization. J.L. visualization, writing—review and editing. C.Z. writing—review and editing. C.L. conceptualization, writing—review and editing. All authors have read and agreed to the published version of the manuscript.

Funding

This project is funded by the Three Gorges Jinsha River Yunchuan Hydropower Development Co., Ltd. Luquan Wudongde Power Plant, Contract No: 5223020071.

Data Availability Statement

The data presented in this study are available on request from the corresponding author.

Conflicts of Interest

The authors declare that this study received funding from the Three Gorges Jinsha River Yunchuan Hydropower Development Co., Ltd. Luquan Wudongde Power Plant (Contract No. 5223020071). The funder was not involved in the study design, collection, analysis, interpretation of data, the writing of this article or the decision to submit it for publication.

Abbreviations

ITAEIntegral Time Absolute Error
ITSEIntegral Time Squared Error
CSOCuckoo Search Optimization
ABCArtificial Bee Colony Algorithm
AGEMOEA2Adaptive geometry estimation-based many objective evolutionary algorithm II
DEAGNGDecomposition-based Evolutionary Algorithm Guided by Growing Neural Gas
DMOEAeCDecomposition-based multi-objective evolutionary algorithm with the e-constraint framework
GLMOGrouped and linked mutation operator algorithm
HWPVHydro-Wind-Photovoltaic
SFRSystem Frequency Response
PIDProportional-Integral-Derivative
KPProportional Gain
KIIntegral Gain
TWindInertia Time Constant of the Wind Turbine Unit
THEquivalent Inertia Time Constant of the System
egSelf-regulation Coefficient of the Power Grid
BiFrequency Deviation Coefficient

References

  1. Zhang, Y.; Cheng, C.; Cai, H.; Jin, X.; Jia, Z.; Wu, X.; Su, H.; Yang, T. Long-term stochastic model predictive control and efficiency assessment for hydro-wind-solar renewable energy supply system. Appl. Energy 2022, 316, 119134. [Google Scholar] [CrossRef]
  2. He, Y.; Hong, X.; Xian, N. Long-term scheduling strategy of hydro-wind-solar complementary system based on chaotic elite selection differential evolution algorithm with death penalty function. Eng. Appl. Artif. Intell. 2025, 142, 109878. [Google Scholar] [CrossRef]
  3. Ma, C.H.; Pan, Z.Y.; Liu, C.N.; Li, W.B. Frequency regulation research of wind-PV-ES hybrid micro-grid system based on adaptive droop control. Power Syst. Prot. Control 2015, 43, 21–27. (In Chinese) [Google Scholar]
  4. Chen, L.; Li, X.R.; Huang, J.Y.; Tan, Z.X.; Li, P. Effect evaluation method for energy storage system participating in frequency regulation based on amplitude-frequency characteristics. Proc. CSU-EPSA 2018, 30, 22–29. (In Chinese) [Google Scholar]
  5. Li, Y.; Su, Y.; Zhang, Y.; Wu, W.; Xia, L. Two-layered optimal scheduling under a semi-model architecture of hydro-wind-solar multi-energy systems with hydrogen storage. Energy 2024, 313, 134115. [Google Scholar] [CrossRef]
  6. Ba-abbad, M.A.; Touti, E.; Alrougy, I.; Alalweet, F. Techno-economic assessment of 1TW Solar and wind system with thermal and pumped hydro energy storage in Saudi Arabia. Clean. Eng. Technol. 2025, 24, 100871. [Google Scholar] [CrossRef]
  7. Jiang, W.; Liu, Y.; Fang, G.; Ding, Z. Research on short-term optimal scheduling of hydro-wind-solar multi-energy power system based on deep reinforcement learning. J. Clean. Prod. 2023, 385, 135704. [Google Scholar] [CrossRef]
  8. Yan, K.; Li, G.; Zhang, R.; Li, F.; Jiang, T.; Li, X.; Chen, H. Aggregated SFR model for VSCHVDC interconnected power systems with high penetration of wind power. Electr. Power Syst. Res. 2023, 216, 109018. [Google Scholar] [CrossRef]
  9. Shadabi, H.; Kamwa, I. A decentralized non-linear dynamic droop control of a hybrid energy storage system blue for primary frequency control in integrated AC-MTDC systems. Int. J. Electr. Power Energy Syst. 2022, 136, 107630. [Google Scholar] [CrossRef]
  10. Yu, H.N.; Yao, L.Z.; Liang, S.; Xu, J.; Cheng, F.; Wu, M. Coordinated control of grid-following and grid-forming energy storage for virtual inertia response considering frequency modal characteristics. Int. J. Electr. Power Energy Syst. 2025, 168, 110686. [Google Scholar] [CrossRef]
  11. Saad, N.M.; Yusuf, M.A.M.; Abas, M.F.; Pebrianti, D.; Jaalam, N.; Ghani, S.A. A novel fuzzy–backward/forward sweep power flow for uncertainty management in radial distribution network with photovoltaic generation. Energy Storage Sav. 2025; in press. [Google Scholar]
  12. Ren, Y.; Jin, K.Y.; Gong, C.L.; Hu, J.; Liu, D.; Jing, X.; Zhang, K. Modelling and capacity allocation optimization of a combined pumped storage/wind/photovoltaic/hydrogen production system based on the consumption of surplus wind and photovoltaics and reduction of hydrogen production cost. Energy Convers. Manag. 2023, 296, 117662. [Google Scholar] [CrossRef]
  13. Liu, Y.Y.; Zhang, H.; Guo, P.C.; Wu, S. Short-term complementary scheduling of cascade energy storage systems for wind and solar regulation. J. Energy Storage 2025, 124, 116775. [Google Scholar] [CrossRef]
  14. Li, L.L.; Zhang, Z.Y.; Sethanan, K.; Tseng, M.-L. Multi-energy synergistic planning of distributed energy supply system: Wind-solar-hydrogen coupling energy supply. Renew. Energy 2024, 237, 121769. [Google Scholar] [CrossRef]
  15. Zhang, X.J.; Wang, J.Z.; Zhao, Z.W.; Li, F.; Ker, P.J.; Ahmed, A.N.; Xu, B.; Chen, D. Dynamic flexibility management for pumped hydro storage: Enhancing frequency stability and economic efficiency in cascade hydro-wind-solar-storage integrated delivery systems. J. Energy Storage 2025, 126, 117044. [Google Scholar] [CrossRef]
  16. Zhang, Y.S.; Lian, J.J.; Ma, C.; Yang, Y.; Pang, X.; Wang, L. Optimal sizing of the grid-connected hybrid system integrating hydropower, photovoltaic, and wind considering cascade reservoir connection and photovoltaic-wind complementarity. J. Clean. Prod. 2020, 274, 123100. [Google Scholar] [CrossRef]
  17. Han, X.; Lv, F.; Li, J.; Zeng, F. Flexible interactive control method for multi-scenario sharing of hybrid pumped storage-wind-photovoltaic power generation. J. Energy Storage 2024, 100, 113590. [Google Scholar] [CrossRef]
  18. Fan, J.L.; Huang, X.; Shi, J.; Li, K.; Cai, J.; Zhang, X. Complementary potential of wind-solar-hydro power in Chinese provinces: Based on a high temporal resolution multi-objective optimization model. Renew. Sustain. Energy Rev. 2023, 184, 113566. [Google Scholar] [CrossRef]
  19. Lin, M.; Shen, J.; Cheng, C.; Lü, Q.; Wang, Y. Long-term multi-objective optimal scheduling for large cascaded hydro-wind-photovoltaic complementary systems considering short-term peak-shaving demands. Energy Convers. Manag. 2024, 301, 118063. [Google Scholar] [CrossRef]
  20. Zhu, F.; Zhong, P.A.; Xu, B.; Liu, W.; Wang, W.; Sun, Y.; Chen, J.; Li, J. Short-term stochastic optimization of a hydro-wind-photovoltaic hybrid system under multiple uncertainties. Energy Convers. Manag. 2020, 214, 112902. [Google Scholar] [CrossRef]
  21. Ming, B.; Liu, P.; Guo, S.; Zhang, X.; Feng, M.; Wang, X. Optimizing utility-scale photovoltaic power generation for integration into a hydropower reservoir by incorporating long- and short-term operational decisions. Appl. Energy 2017, 204, 432–445. [Google Scholar] [CrossRef]
  22. Jin, X.; Liu, B.; Deng, Z.; Zhao, Z.; Zhang, Y.; Cao, R.; Lu, J.; Cheng, C. Deriving strategic region-wise hydro-wind-solar portfolios. Renew. Sustain. Energy Rev. 2025, 210, 115145. [Google Scholar] [CrossRef]
  23. Khamari, D.; Sahu, R.K.; Panda, S.; Arya, Y. A mMSA-FOFPID controller for AGC of multi-area power system with multi-type generations. Sustainable Comput.: Informatics Syst. 2024, 44, 101046. [Google Scholar] [CrossRef]
  24. Alemam, A.; Al-Sumaiti, A.S.; Afgan, I. Optimized hybrid storage standalone microgrid with electrical, heat, and hydrogen loads based on stochastic photovoltaic modelling. Energy Convers. Manag. X 2025, 27, 101091. [Google Scholar] [CrossRef]
  25. Chen, J.D. Research on reliability evaluation method and fault diagnosis technology of photovoltaic power generation system. Lights Light. 2025, 49, 56–58. (In Chinese) [Google Scholar]
  26. Mastoi, M.S.; Wang, D.L.; Zhou, X.; He, X.; Hassan, M.; Ali, A.; Rehman, A. Study of energy storage technology approaches for mitigating wind power fluctuations to enhance smart grid resilience. Renew. Sustain. Energy Rev. 2025, 224, 116072. [Google Scholar] [CrossRef]
  27. Charnes, A.; Cooper, W.W.; Rhodes, E. Measuring the efficiency of decision making units. Eur. J. Oper. Res. 1978, 2, 429–444. [Google Scholar] [CrossRef]
  28. Zheng, T.; Song, L.; Liang, H.; Guo, B.; Guo, L. Online anomaly detection of streaming data for space payloads based on improved GNG algorithm. In Proceedings of the 4th International Conference on Multimedia Systems and Signal Processing 2019, Guangzhou, China, 10–12 May 2019; ACM: New York, NY, USA; pp. 177–181. [Google Scholar]
  29. Liu, Y.; Ishibuchi, H.; Masuyama, N.; Nojima, Y. Adapting Reference Vectors and Scalarizing Functions by Growing Neural Gas to Handle Irregular Pareto Fronts. IEEE Trans. Evol. Comput. 2019, 24, 439–453. [Google Scholar] [CrossRef]
  30. Zhou, Z.; He, Z.; Sun, C.; Xie, D.; Zhang, S.; Wu, J. Research on energy-saving control of air compressors based on EO-BP-PID algorithm. J. Xi’an Univ. Arts Sci. (Nat. Sci. Ed.) 2025, 28, 29–35. (In Chinese) [Google Scholar]
  31. Karaboga, D. An Idea Based on Honey Bee Swarm for Numerical Optimization; Technical Report-TR06; Erciyes University, Engineering Faculty, Computer Engineering Department: Kayseri, Türkiye, 2005. [Google Scholar]
  32. Cheng, R.; Jin, Y. A Competitive Swarm Optimizer for Large Scale Optimization. IEEE Trans. Cybern. 2014, 45, 191–206. [Google Scholar] [CrossRef]
  33. Zille, H.; Ishibuchi, H.; Mostaghim, S.; Nojima, Y. Mutation Operators based on Variable Grouping for Multi-objective Large-scale Optimization. IEEE Trans. Evol. Comput. 2021, 25, 657–670. [Google Scholar]
  34. Panichella, A. An Improved Pareto Front Modeling Algorithm for Large-scale Many-Objective Optimization. In Proceedings of the Genetic and Evolutionary Computation Conference (GECCO’22), Boston, MA, USA, 9–13 July 2022; ACM: New York, NY, USA, 2022; p. 9. [Google Scholar]
Figure 1. Frequency Regulation Response Model of the Hydro-Wind-Solar Complementary System.
Water 17 02697 g001
Figure 2. Fitted curve of horizontal solar radiation intensity.
Water 17 02697 g002
Figure 3. Flowchart of the DEAGNG Algorithm.
Water 17 02697 g003
Figure 4. Pareto Fronts for Scenario 1 Control Group.
Water 17 02697 g004
Figure 5. System Frequency Response with wind power participation.
Water 17 02697 g005
Figure 6. Bode Plot of System Responses for Scenario 1.
Water 17 02697 g006
Figure 7. Pareto front generated by the ACEMOEA2 algorithm.
Water 17 02697 g007
Figure 8. Pareto front generated by the DEAGNG algorithm.
Water 17 02697 g008
Figure 9. Pareto front generated by the DMOEAec algorithm.
Water 17 02697 g009
Figure 10. Pareto front generated by the GLMO algorithm.
Water 17 02697 g010
Figure 11. System Frequency Response without wind power participation.
Water 17 02697 g011
Figure 12. Bode Plot of System Responses for Scenario 2.
Water 17 02697 g012
Table 1. Parameter Settings for the Complementary System.
ParameterNumerical Value
Thtg0.2
Tgh5
Ta8.5
Tb2.1
en0.05
RT0.5
R20.048
Tw1.2
TH9
eg0.8
Twind0.1
R10.048
Bi49
Hydropower rated capacity10,000 MW
Wind power rated capacity1500 MW
PV rated capacity1500 MW
Table 2. Performance Metrics for Scenario 1.
AlgorithmsKPKIITAEITSE
ABC9.598 × 10−28.6704 × 10−5291.279930.3047
CSO9.765 × 10−28.2068 × 10−5290.960030.4543
Table 3. Performance Metrics for Scenario 2.
AlgorithmsKPKIITAEITSE
ABC−5.055 × 10−24.71 × 10−4639.106969.5359
CSO−5.055 × 10−24.71 × 10−4639.106969.5359
Table 4. Performance Metrics for Scenario 1—Different Algorithms.
AlgorithmsKPKIITAEITSE
AGEMOEA21.121 × 10−13.0267 × 10−5308.581031.0652
DEAGNG5.41 × 10−21.9 × 10−4303.559329.1728
DMOEAeC5.64 × 10−21.7 × 10−4316.876629.2291
GLMO−1.8 × 10−23.9 × 10−4360.808329.1350
Table 5. Comparison of Optimization Results for Scenario 2 by Different Algorithms.
AlgorithmsKPKIITAEITSE
AGEMOEA2−5.07 × 10−24.71 × 10−4639.107769.5234
DEAGNG−5.70 × 10−24.85 × 10−4639.541069.1670
DMOEAeC−5.14 × 10−24.75 × 10−4639.169069.4823
GLMO−9 × 10−25.61 × 10−4662.507168.3758
Table 6. Performance Metrics for Scenario 2—Different Algorithms.
AlgorithmsKPKIITAEITSE
AGEMOEA21.085 × 10−12.8632 × 10−5289.614228.9517
DEAGNG5.12 × 10−21.8 × 10−4284.320728.0153
DMOEAeC5.37 × 10−21.6 × 10−4292.156828.1026
GLMO−1.52 × 10−23.7 × 10−4345.892627.9864
Disclaimer/Publisher’s Note: The statements, opinions and data contained in all publications are solely those of the individual author(s) and contributor(s) and not of MDPI and/or the editor(s). MDPI and/or the editor(s) disclaim responsibility for any injury to people or property resulting from any ideas, methods, instructions or products referred to in the content.