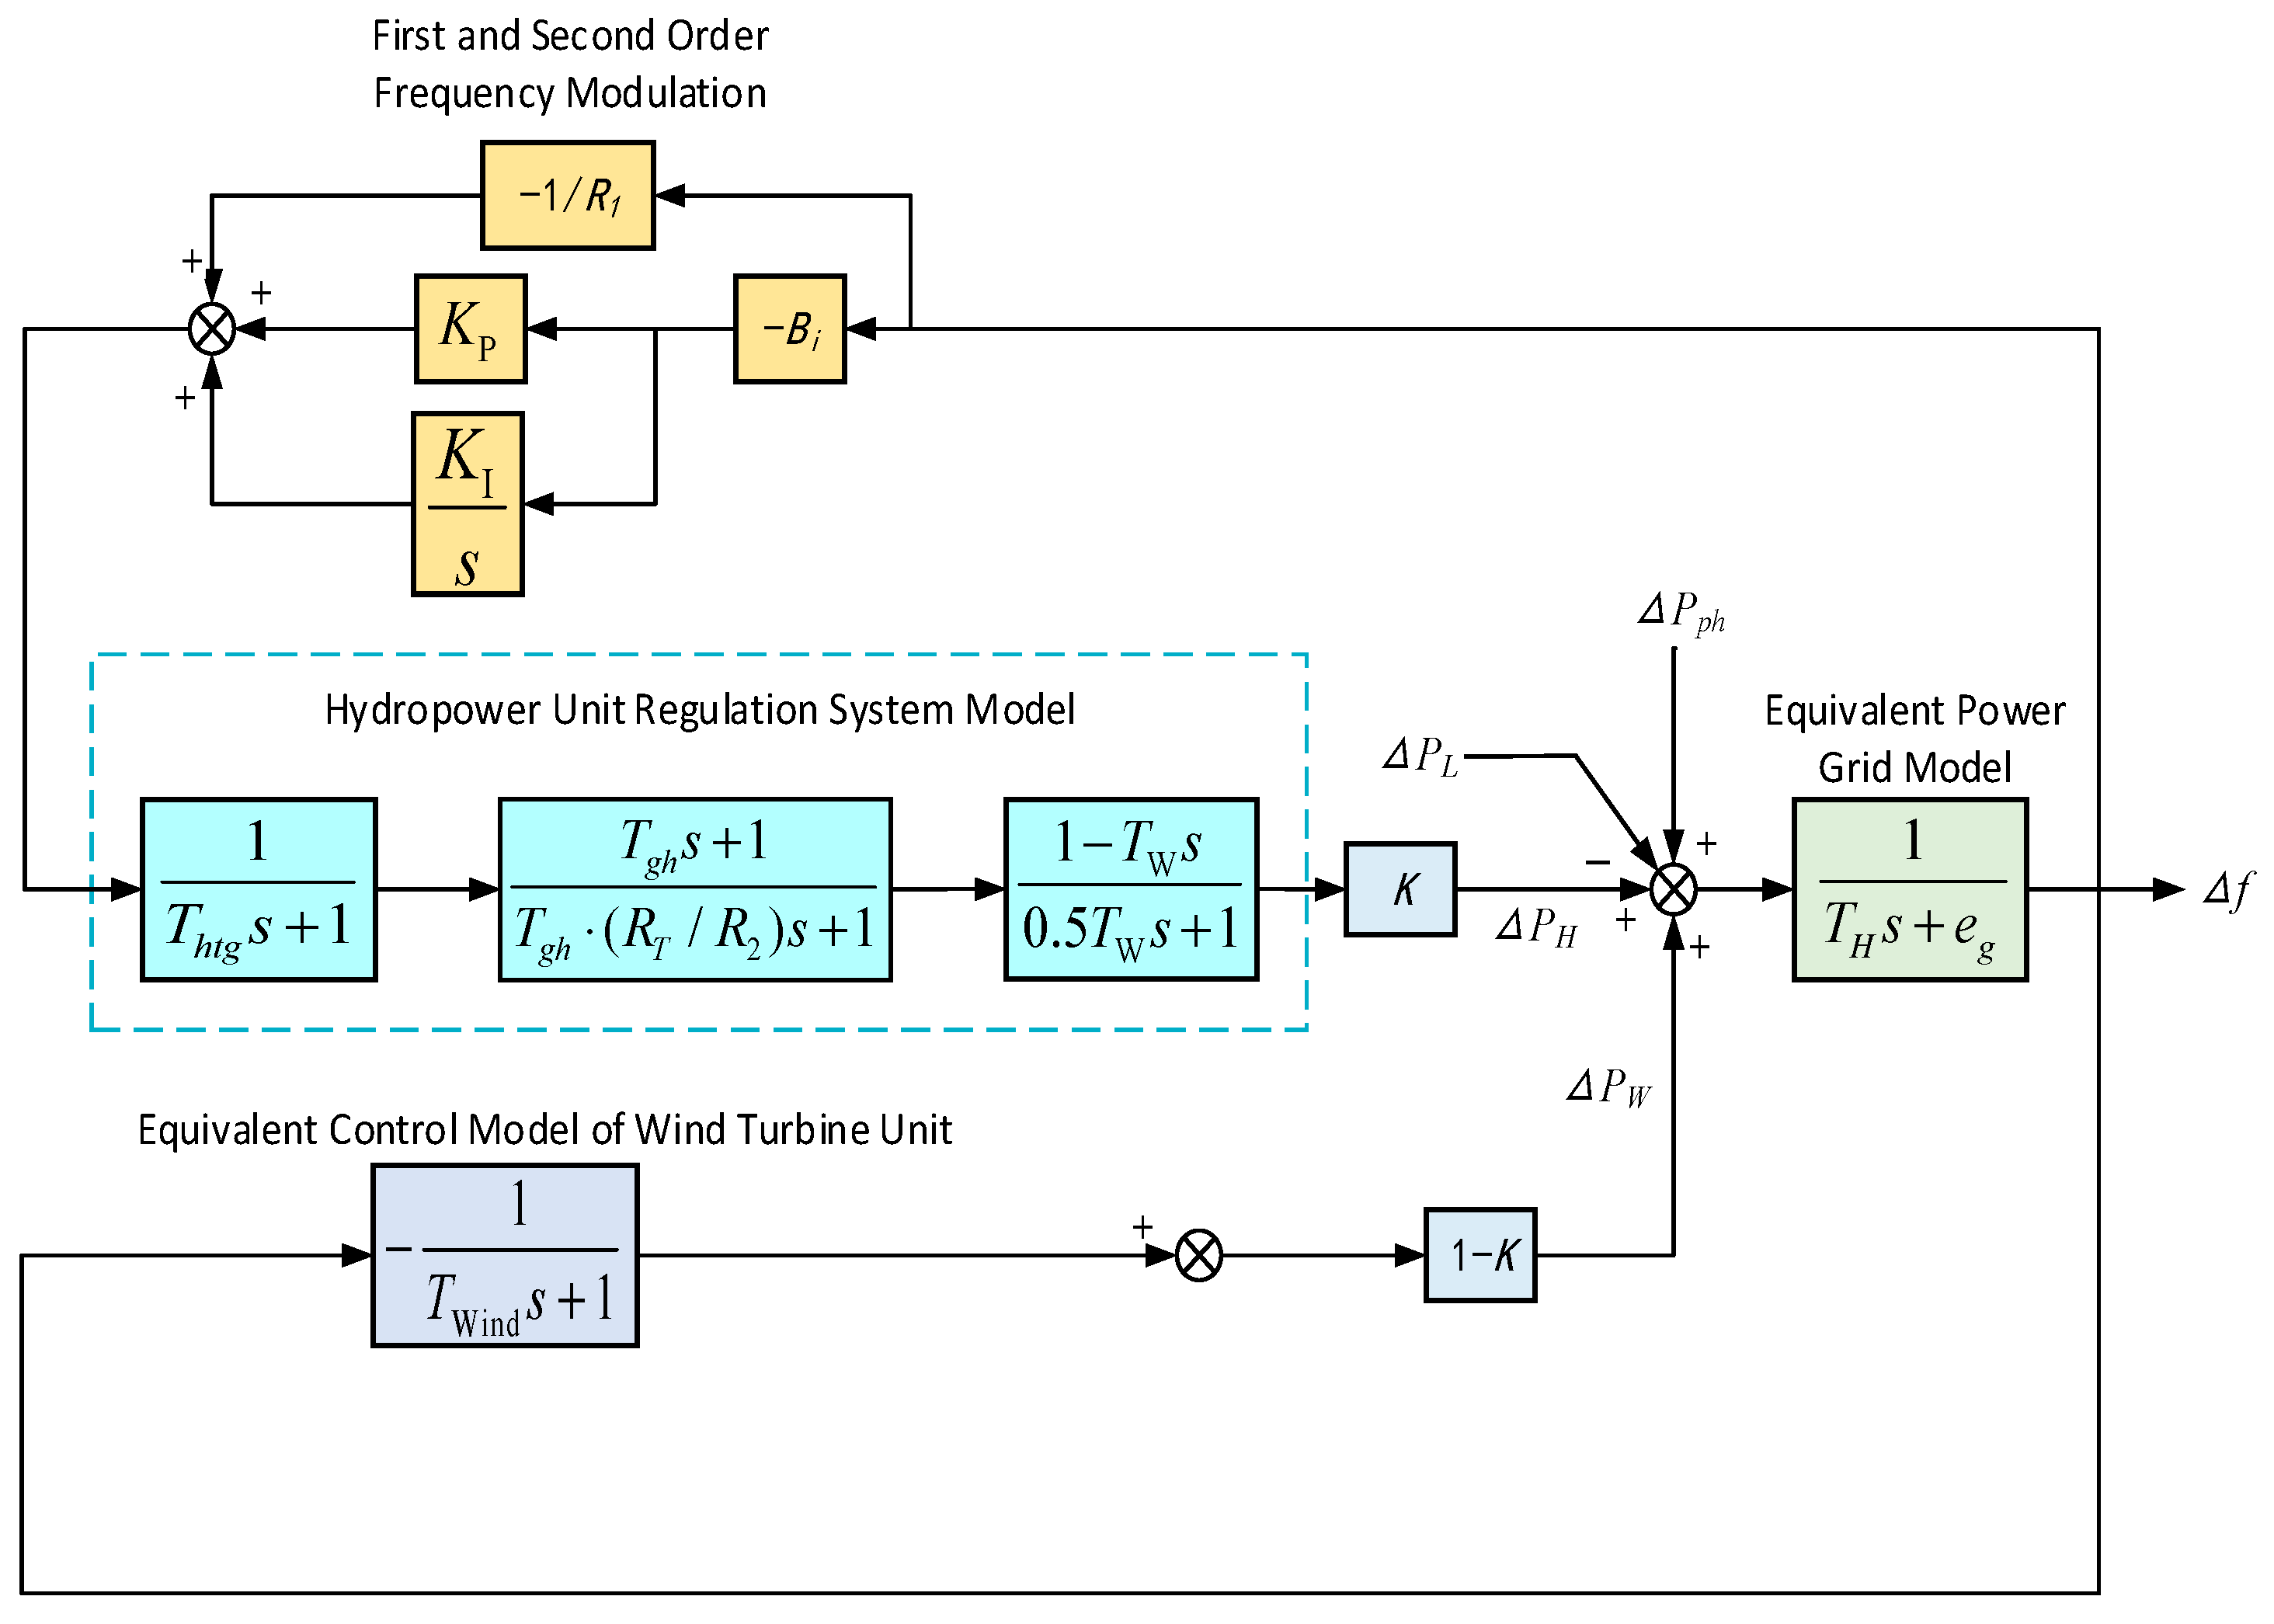
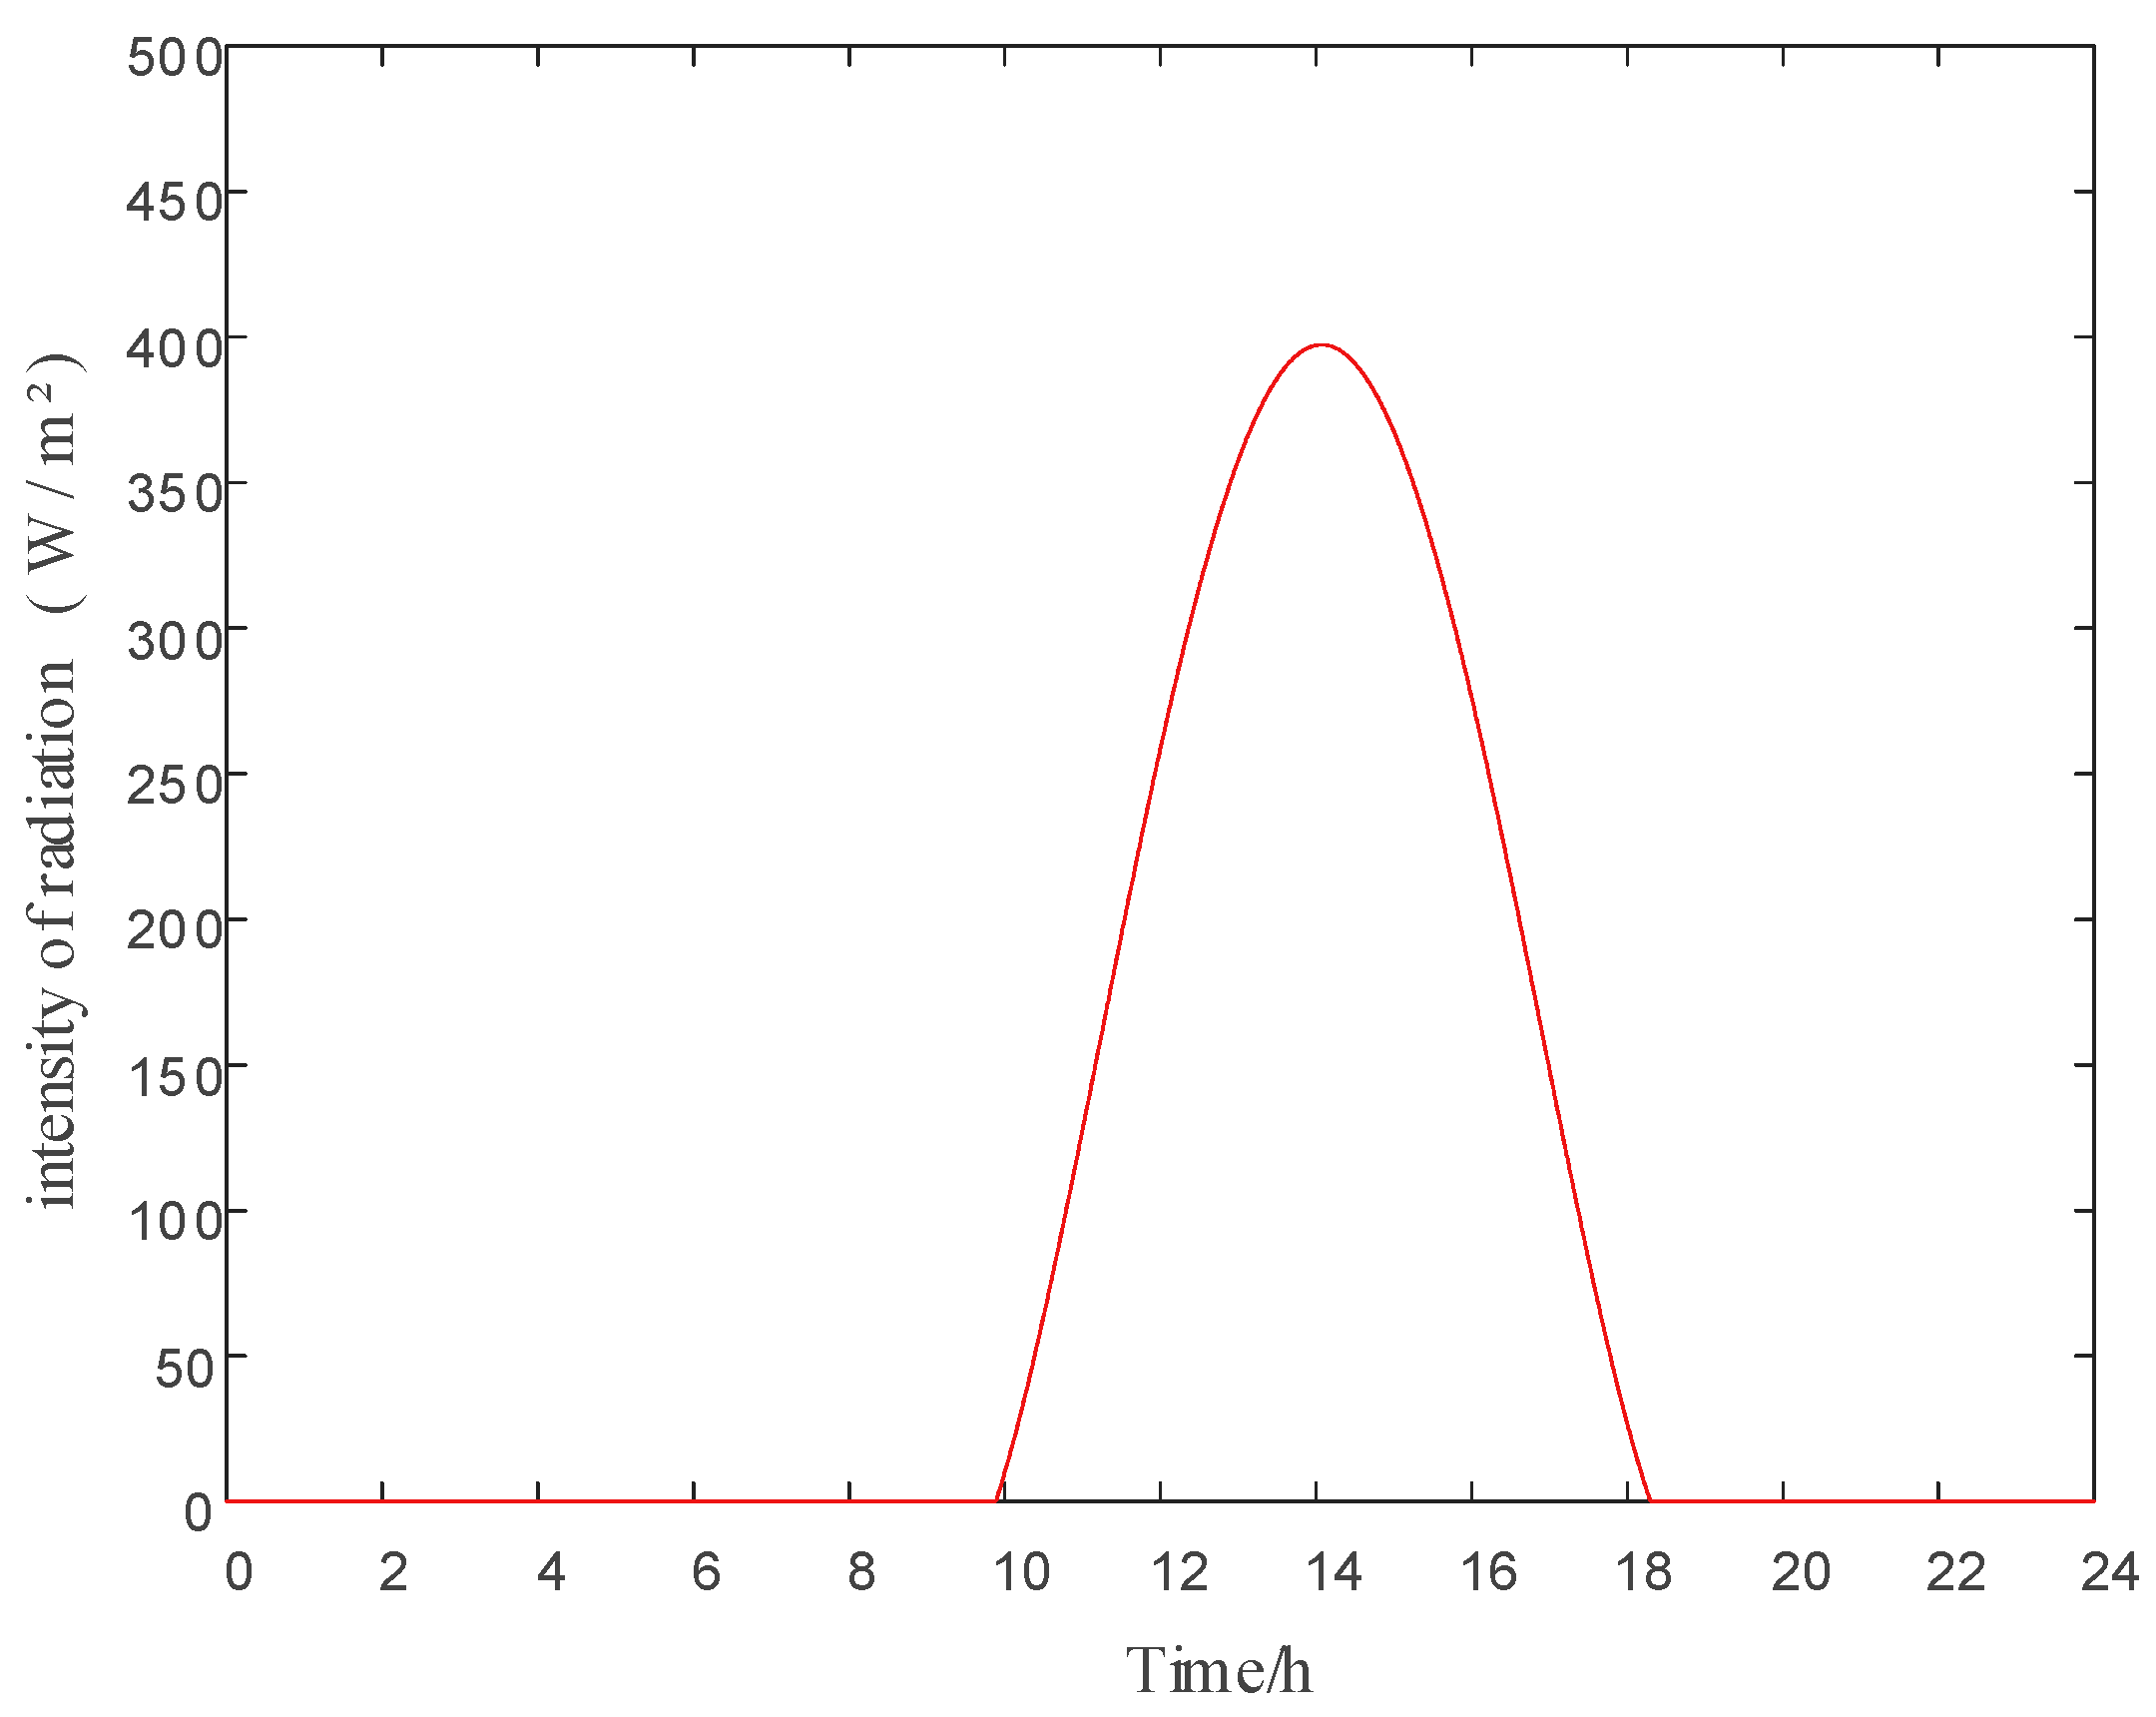
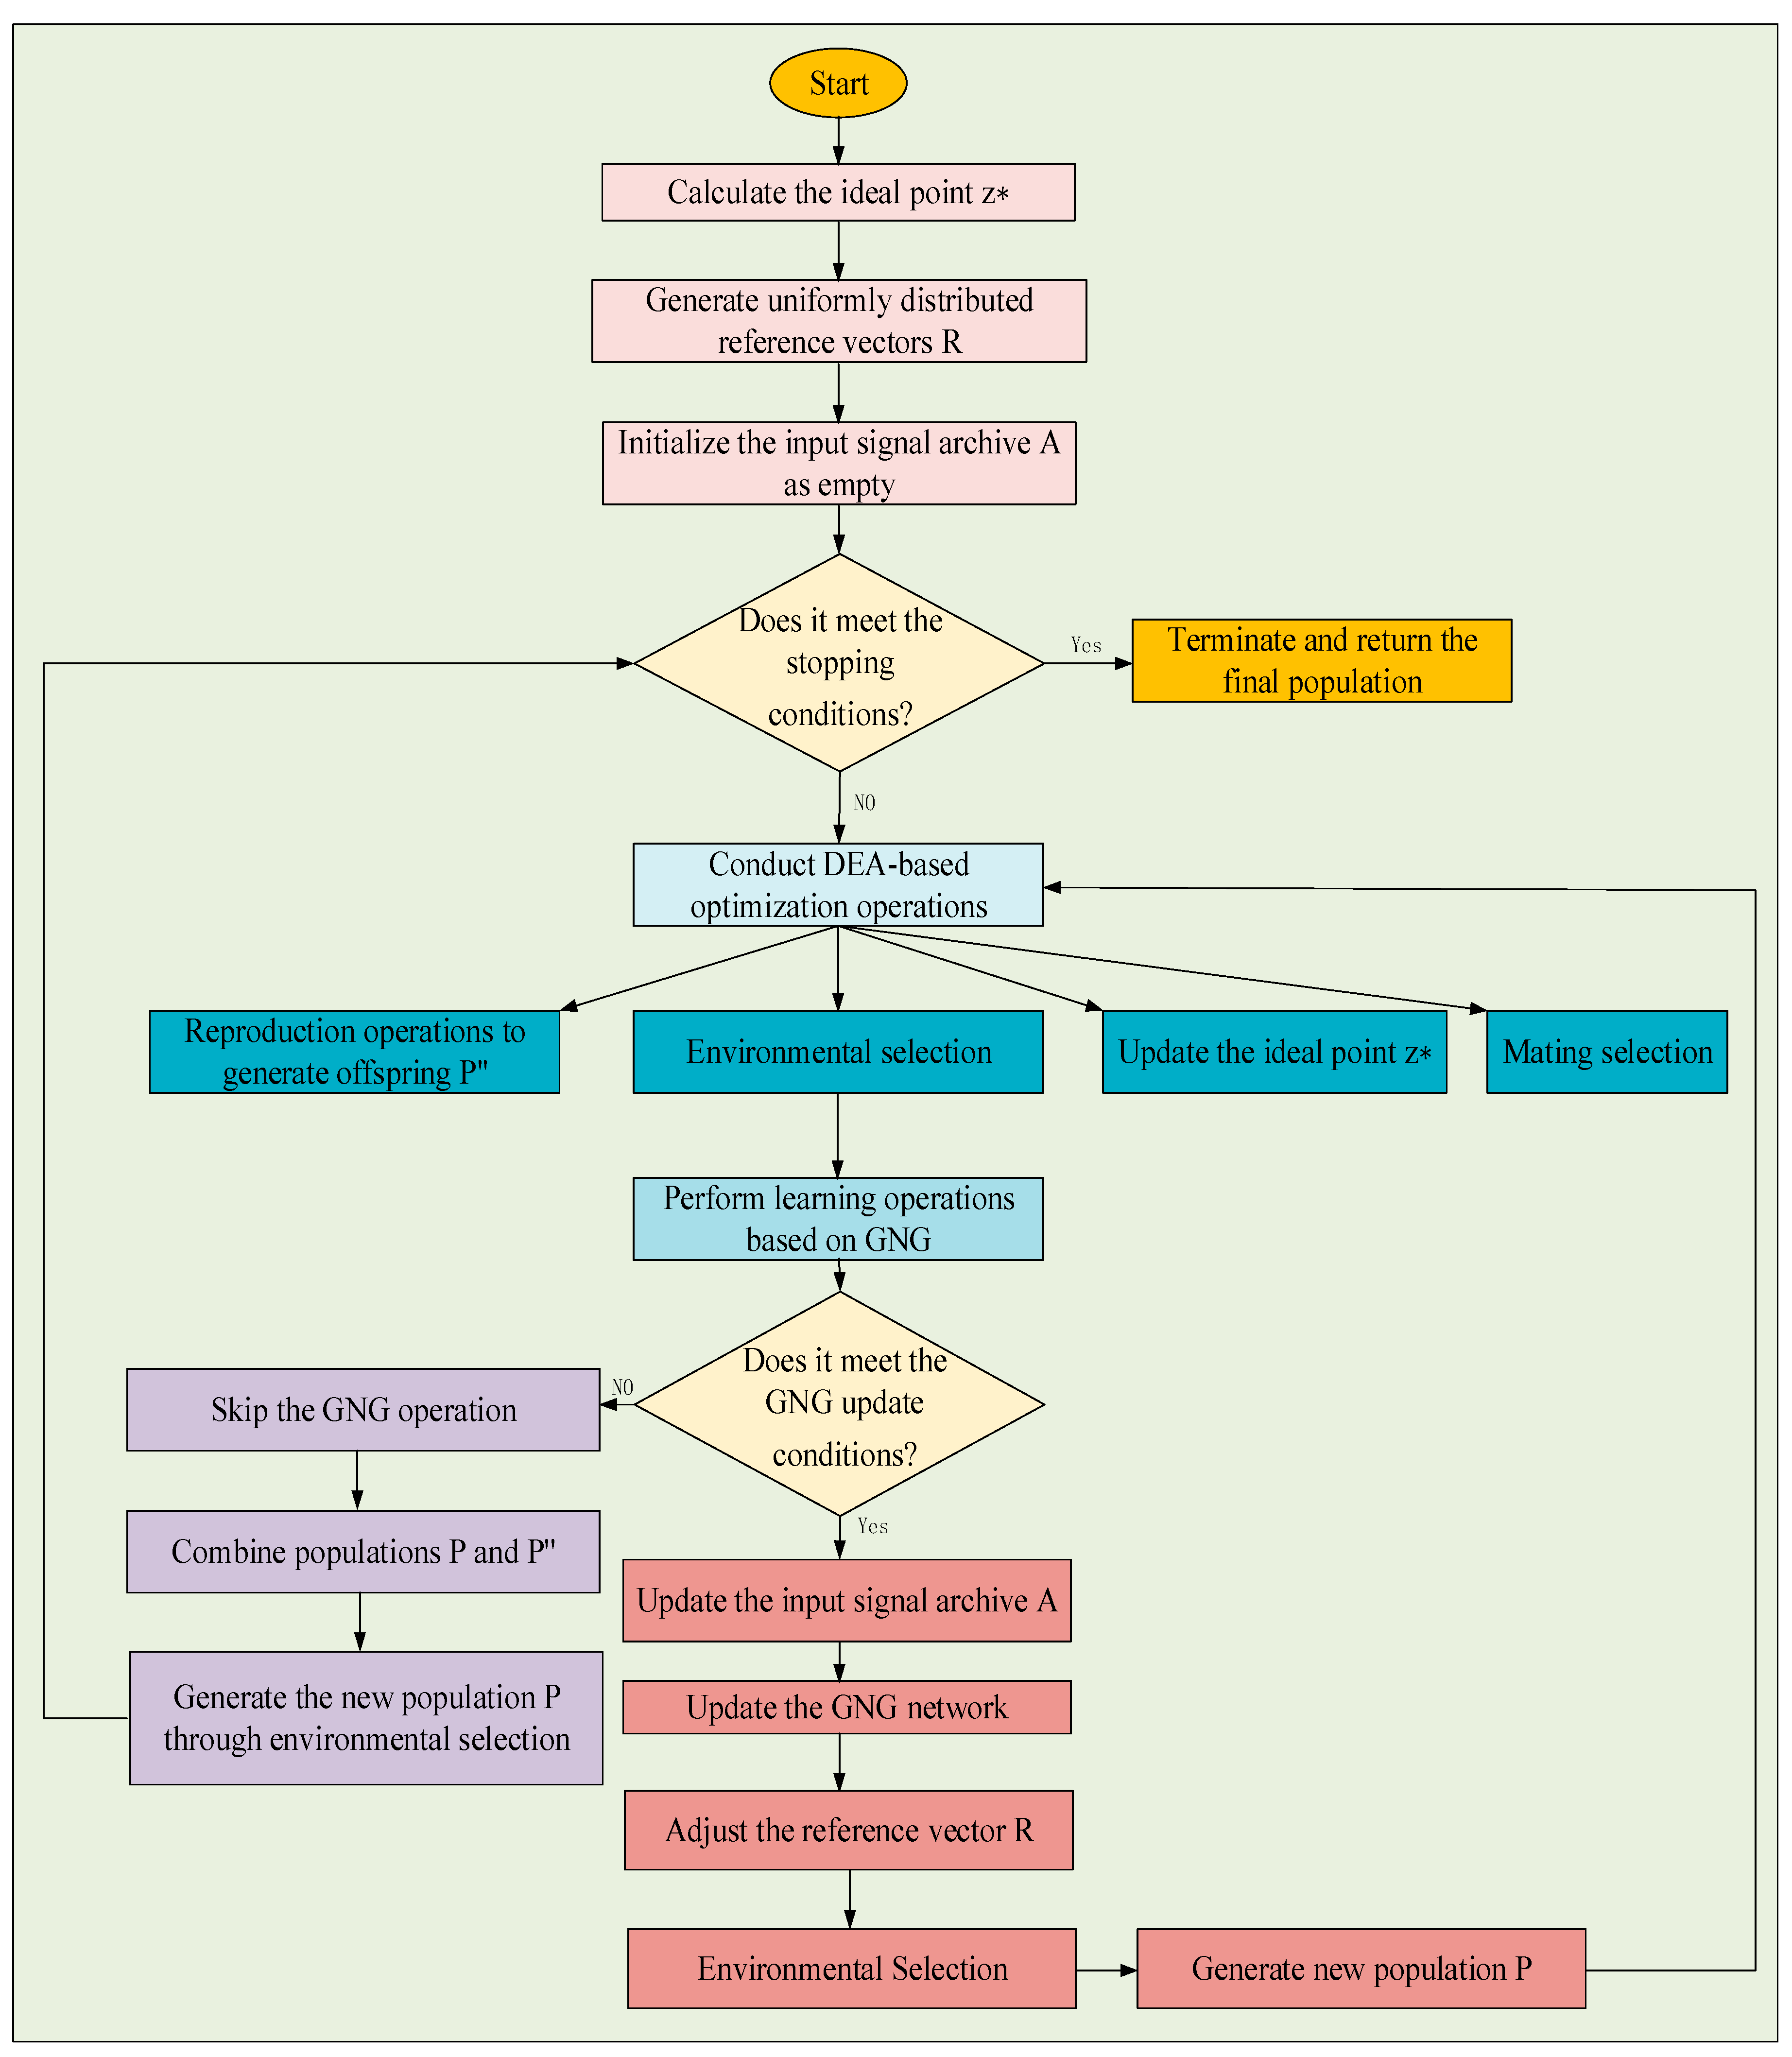
To verify the effectiveness of the optimization strategy based on the DEAGNG algorithm, this section presents simulation experiments to demonstrate the impact of the optimized PID controller parameters KP and KI on the performance of the hydro-wind-solar complementary system. The simulation experiments are conducted in the MATLAB R2023b (version 9.14.0.2239454, 64-bit) environment, aiming to evaluate the frequency response characteristics of the system under different operating Scenarios.
To address the issue of missing data on the scale of hydropower, wind power, and solar power systems, and to verify the effectiveness of the optimization strategy based on the DEAGNG algorithm, this study refers to the actual energy configuration characteristics of the complementary system in the Wudongde area and establishes a frequency response model for the coordinated regulation of the hydro-wind-solar complementary system in the MATLAB environment. The total installed capacity of the model is set at 13,000 MW, with the specific capacity allocation for each energy source as follows:
Hydropower capacity: Fixed at 10,000 MW (consistent with the actual installed capacity of the Wudongde Hydropower Station), accounting for 70% of the total system capacity. As the core flexible regulation unit, it undertakes primary and secondary frequency regulation tasks to suppress power fluctuations caused by wind and solar energy.
Wind power capacity: 1500 MW, accounting for 15% of the total system capacity. In Scenario 1 (wind power participating in frequency regulation), it provides auxiliary inertia support; in Scenario 2 (wind power not participating in frequency regulation), it only outputs power based on real-time wind speed without frequency regulation intervention.
Photovoltaic capacity: Consistent with wind power capacity, at 1500 MW, accounting for 15% of the total system capacity. Its output fluctuation is driven by solar radiation intensity, with a fluctuation range of ±15% of its rated capacity (calibrated based on typical photovoltaic power plant operation data).
The capacity ratio of each energy source is determined based on the complementary principle: the large-capacity hydropower unit ensures the basic frequency stability of the system, while the 10% to 20% wind-solar capacity meets the requirements of high renewable energy penetration without exceeding the regulation capacity of the hydropower unit.
4.1. Single-Objective Algorithm Optimization
This section primarily investigates the impact of the secondary frequency regulation parameters
KP and
KI of the hydroelectric unit on the regulation performance of the complementary system. Traditional single-objective optimization algorithms, Cuckoo Search Optimization(CSO) and Artificial Bee Colony Algorithm(ABC), are employed to optimize
KP and
KI respectively [
31,
32]. The corresponding performance metrics of the complementary system are calculated for each set of values, and data fitting is conducted to draw tables showing how the performance metrics vary with
KP and
KI as
Table 2 and
Table 3:
From the tables, it can be observed that although the performance of the two algorithms is similar in Scenario 2, the CSO algorithm demonstrates better optimization effects in terms of ITAE in Scenario 1. This indicates that the performance of algorithms may vary under different Scenarios, and the CSO algorithm is more effective in reducing the ITAE value in the current experimental setup.
Despite the good optimization performance of the CSO algorithm in Scenario 1, especially in reducing the ITAE value, this single-objective optimization method has its inherent limitations. In practical hydro-wind-solar complementary systems, we need to not only focus on the dynamic response speed of the system but also consider multiple aspects such as system stability, robustness, and possible energy consumption simultaneously. Single-objective optimization methods often fail to balance these different performance metrics, as they usually focus solely on minimizing or maximizing a specific objective function.
To overcome this limitation, multi-objective optimization algorithms are introduced. Multi-objective optimization algorithms can seek the best trade-off solutions among multiple performance metrics, thereby providing a more comprehensive optimization plan for system design. For example, by considering both ITAE and ITSE simultaneously, multi-objective optimization algorithms can help us reduce the dynamic response time while also taking into account system stability and energy consumption, achieving a comprehensive improvement in system performance.
4.2. Multi-Objective Algorithm Optimization
To overcome the limitations of single-objective optimization, this experiment employs several multi-objective algorithms for comparison. To verify the performance of the DEAGNG algorithm in solving multi-objective test function problems, three widely used multi-objective intelligent optimization algorithms—Adaptive geometry estimation-based many objective evolutionary algorithm II (AGEMOEA2), Decomposition-based multi-objective evolutionary algorithm with the e-constraint framework (DMOEAeC), and Grouped and linked mutation operator algorithm (GLMO)—are selected as the control group. The simulation experiments consider the optimization of PID parameters using these algorithms under two operating Scenarios [
33,
34].
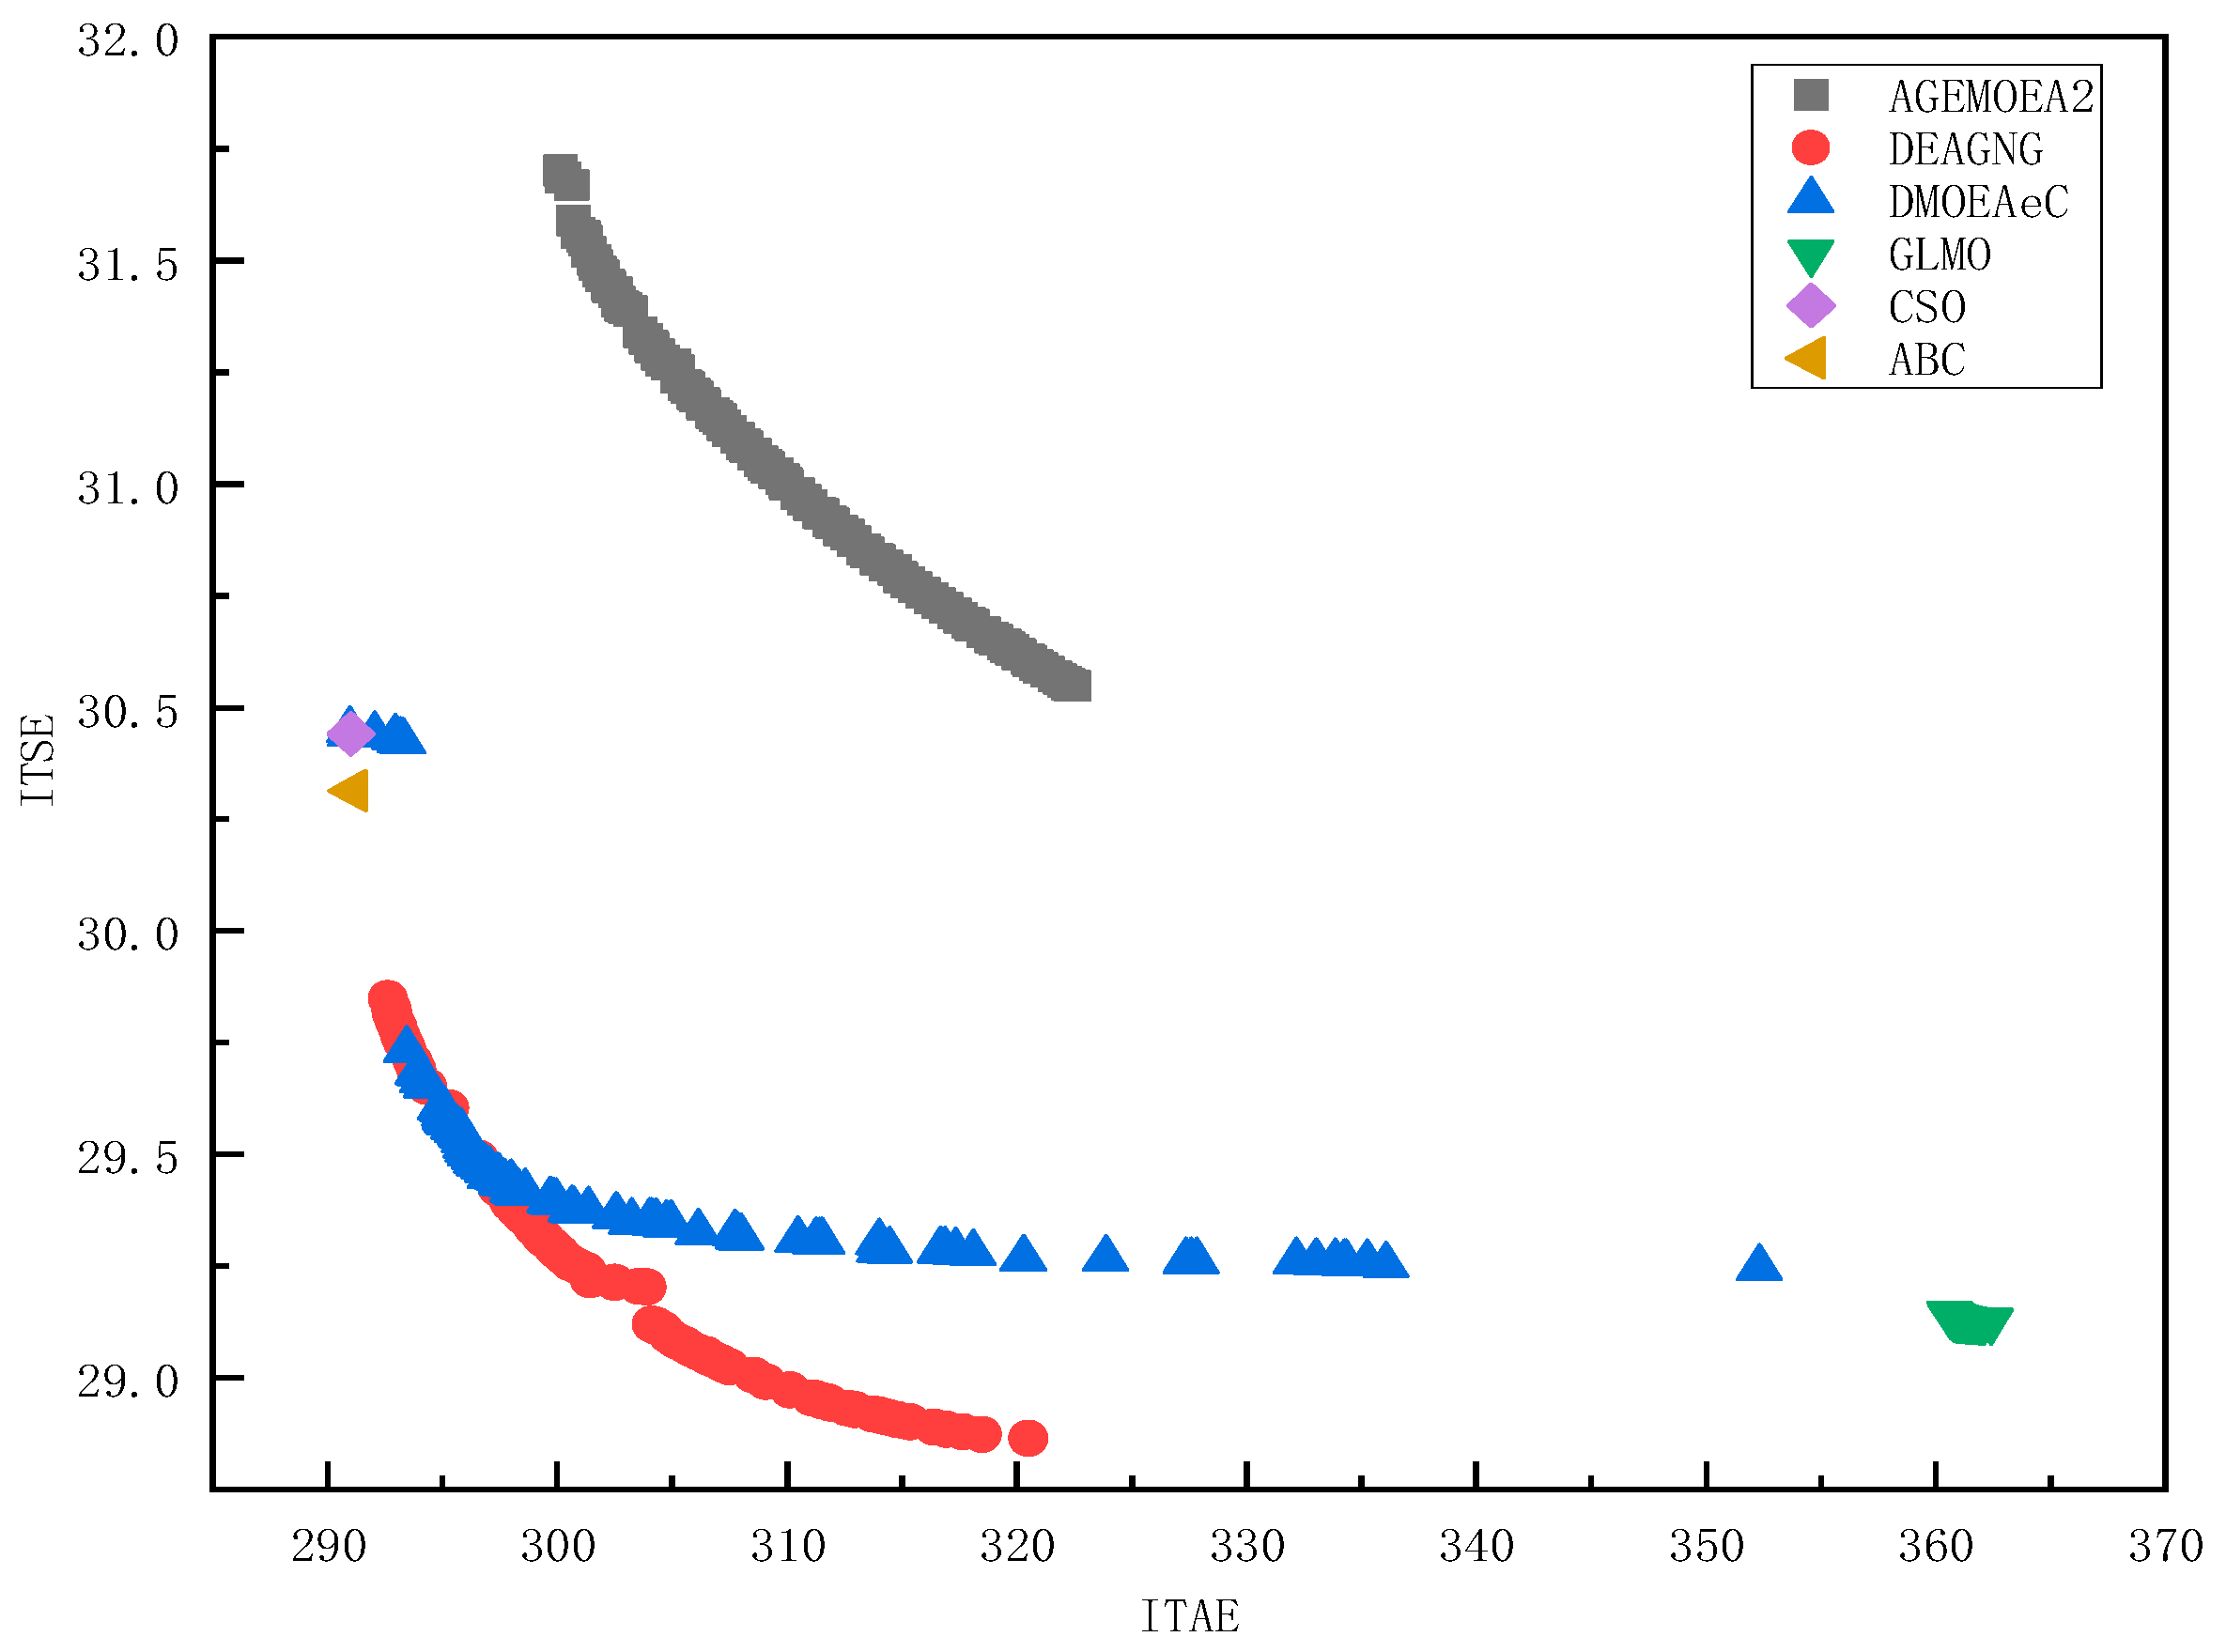
For Scenario 1, which corresponds to a wind power penetration rate of 30% in frequency regulation, the Pareto fronts obtained after optimization using various algorithms are shown in
Figure 3:
From the solution results of the pumped storage unit PID speed control system depicted in
Figure 4, it can be observed that the multi-objective algorithm DMOEAeC encompasses solutions from the single-objective algorithm CSO. Moreover, the multi-objective algorithms DEAGNG, DMOEAeC, and GLMO exhibit more pronounced advantages in terms of ITSE. Among these, the algorithm DEAGNG achieves a superior Pareto front compared to several other algorithms.
Table 4 specifically details the performance metrics corresponding to the median solutions of the Pareto fronts obtained by each algorithm.
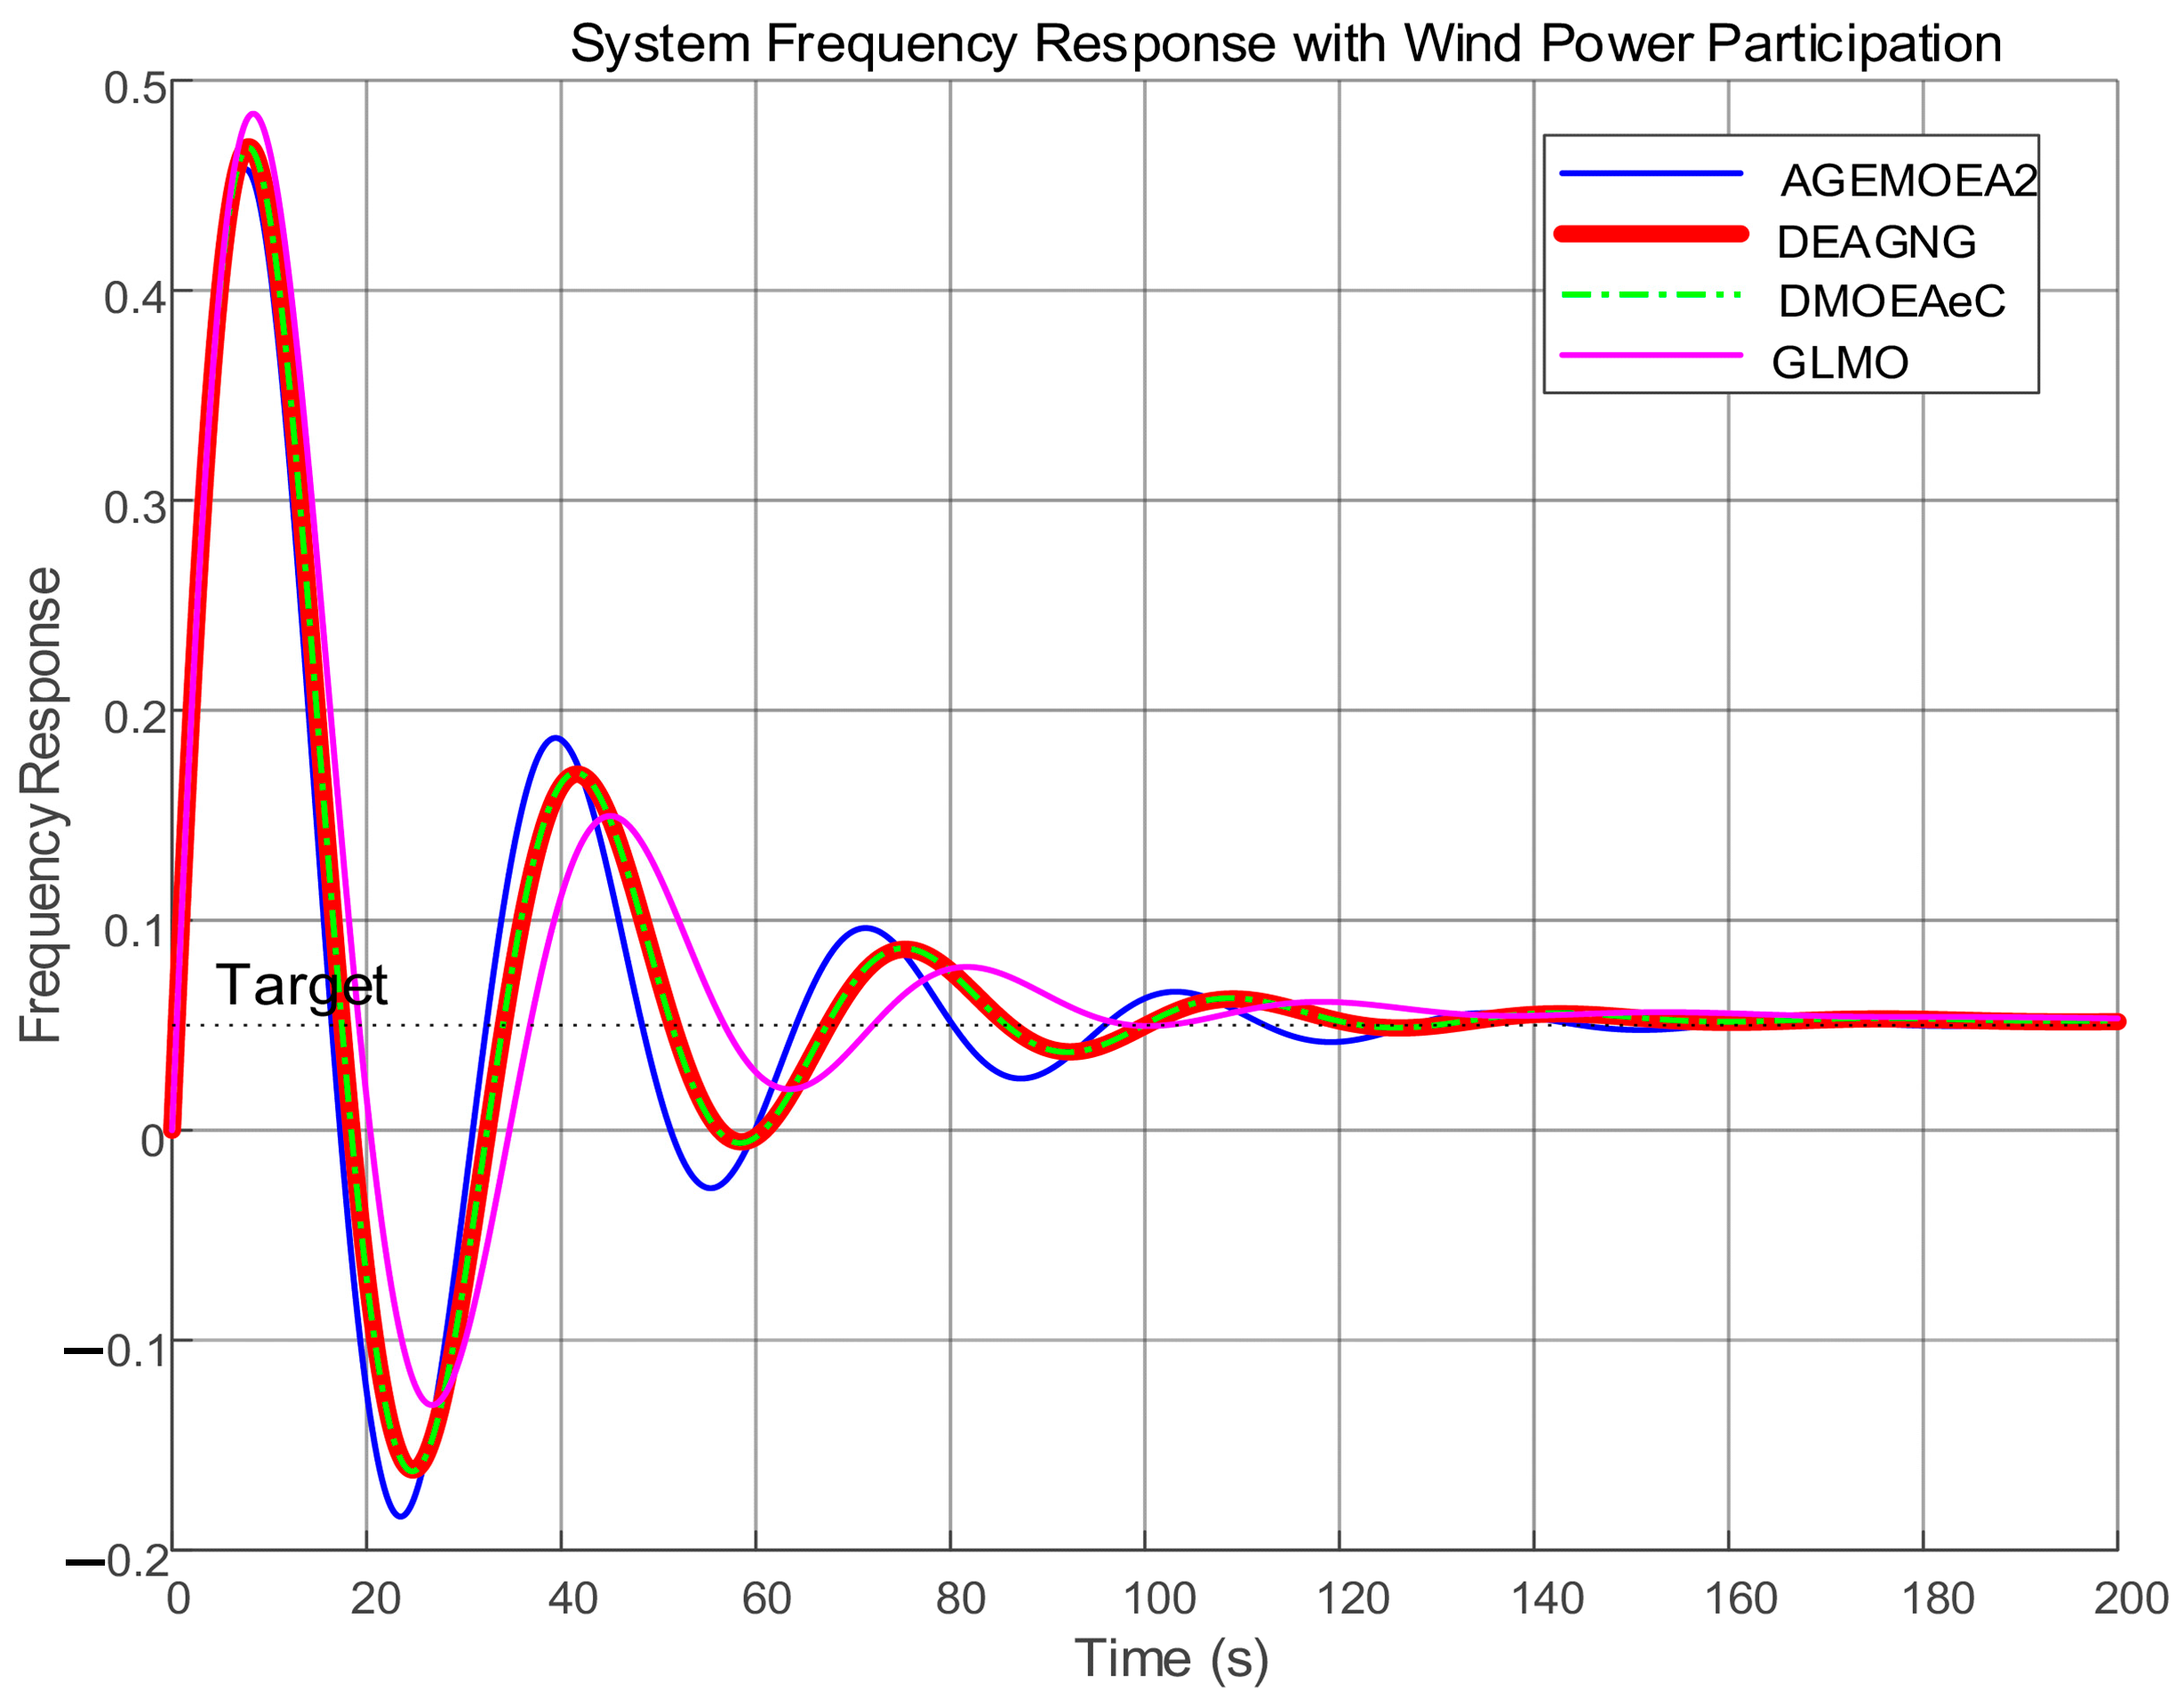
Based on the optimized PID parameters from each algorithm, the respective system frequency response curves are plotted as shown in
Figure 5.
From
Figure 5, it can be seen that during the system frequency response process, there are four curves representing different dynamic characteristics: DEAGNG (red curve), AGEMOEA2 (blue curve), DMOEAeC (green curve), and GLMO (pink curve).
In terms of the ITAE metric, the DEAGNG curve has a relatively small cumulative degree of frequency deviation over the entire time range (0–200 s). Although there are fluctuations after the initial disturbance, the range of oscillation is narrow during the stabilization process, and it performs well in terms of the ITAE metric. Regarding the ITSE metric, the DEAGNG curve does not exhibit large amplitude frequency deviations throughout the response process, demonstrating good stability in the recovery process after disturbance, with frequency deviations not fluctuating widely for an extended period, giving it an advantage in the ITSE metric. In terms of settling time and overshoot, while the GLMO curve may stabilize more quickly in the initial stage, the DEAGNG curve has a relatively small overshoot in the process of recovering to the target frequency of 0.05Hz. This means that the system oscillates less before reaching a stable state, which is beneficial for system stability. Moreover, the DEAGNG curve can quickly return to the vicinity of the target frequency after the disturbance disappears, giving it an advantage in terms of system frequency recovery performance. Compared with the GLMO curve, considering factors such as ITAE and ITSE metrics, overshoot, and settling time, the DEAGNG performs better. Compared with the AGEMOEA2 and DMOEAeC curves, DEAGNG has a clear advantage in frequency deviation control and system recovery performance; these two curves exhibit larger amplitude frequency fluctuations and longer settling times during the response process.
In summary, the DEAGNG algorithm demonstrates superiority in the system frequency response process when considering various factors comprehensively, effectively enhancing the dynamic performance and stability of the hydro-wind-solar complementary system.
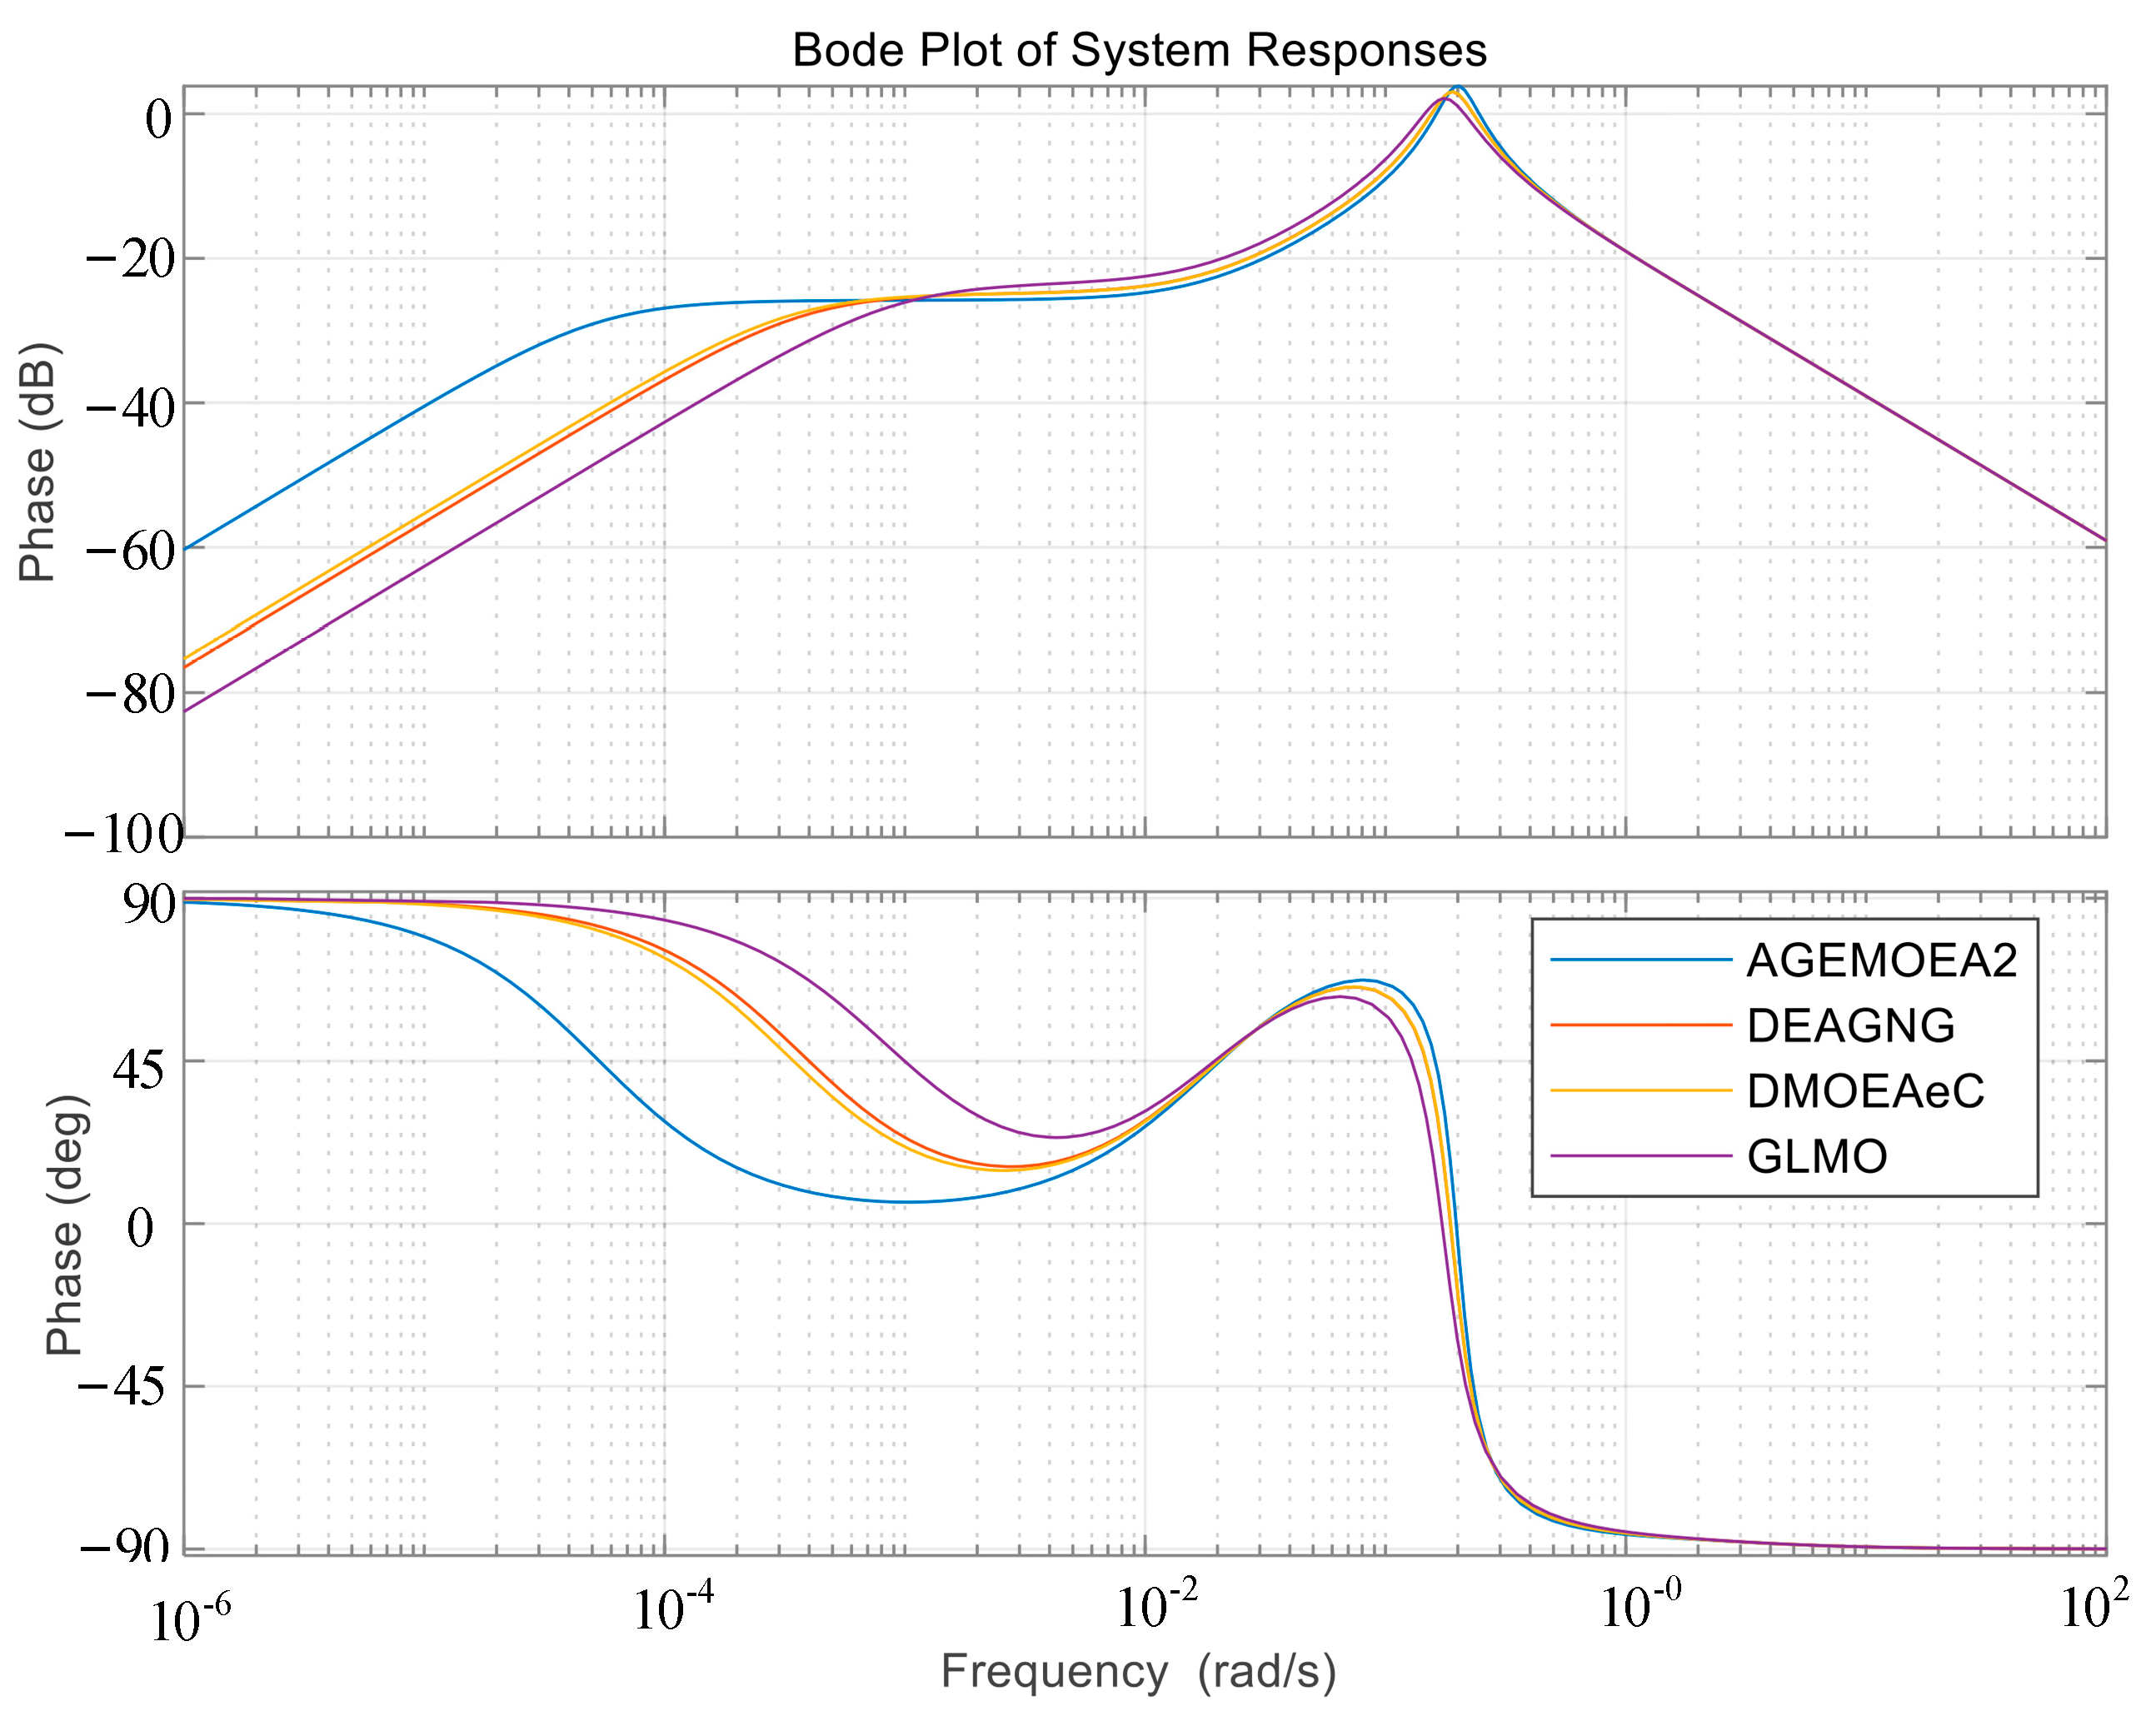
Figure 6 presents the Bode plot of the system, which illustrates that the system optimized by the DEAGNG algorithm has a lower resonant peak in its magnitude response, indicating a stronger ability to suppress high-frequency disturbances such as fluctuations in wind and solar power. In the low-frequency range, the system exhibits faster decay, leading to a better convergence rate to the steady state. In terms of phase response, the system has a more ample phase margin, which means that the tendency of the system to oscillate after disturbances is weaker, and the crossover frequency is reasonable, providing a more reliable stability reserve. This demonstrates the excellent balance between stability and rapidity of the DEAGNG algorithm in multi-objective optimization. Its parameters are more adaptable to wide-frequency disturbances in the complementary hydro-wind-storage system, highlighting the advantages of this algorithm.
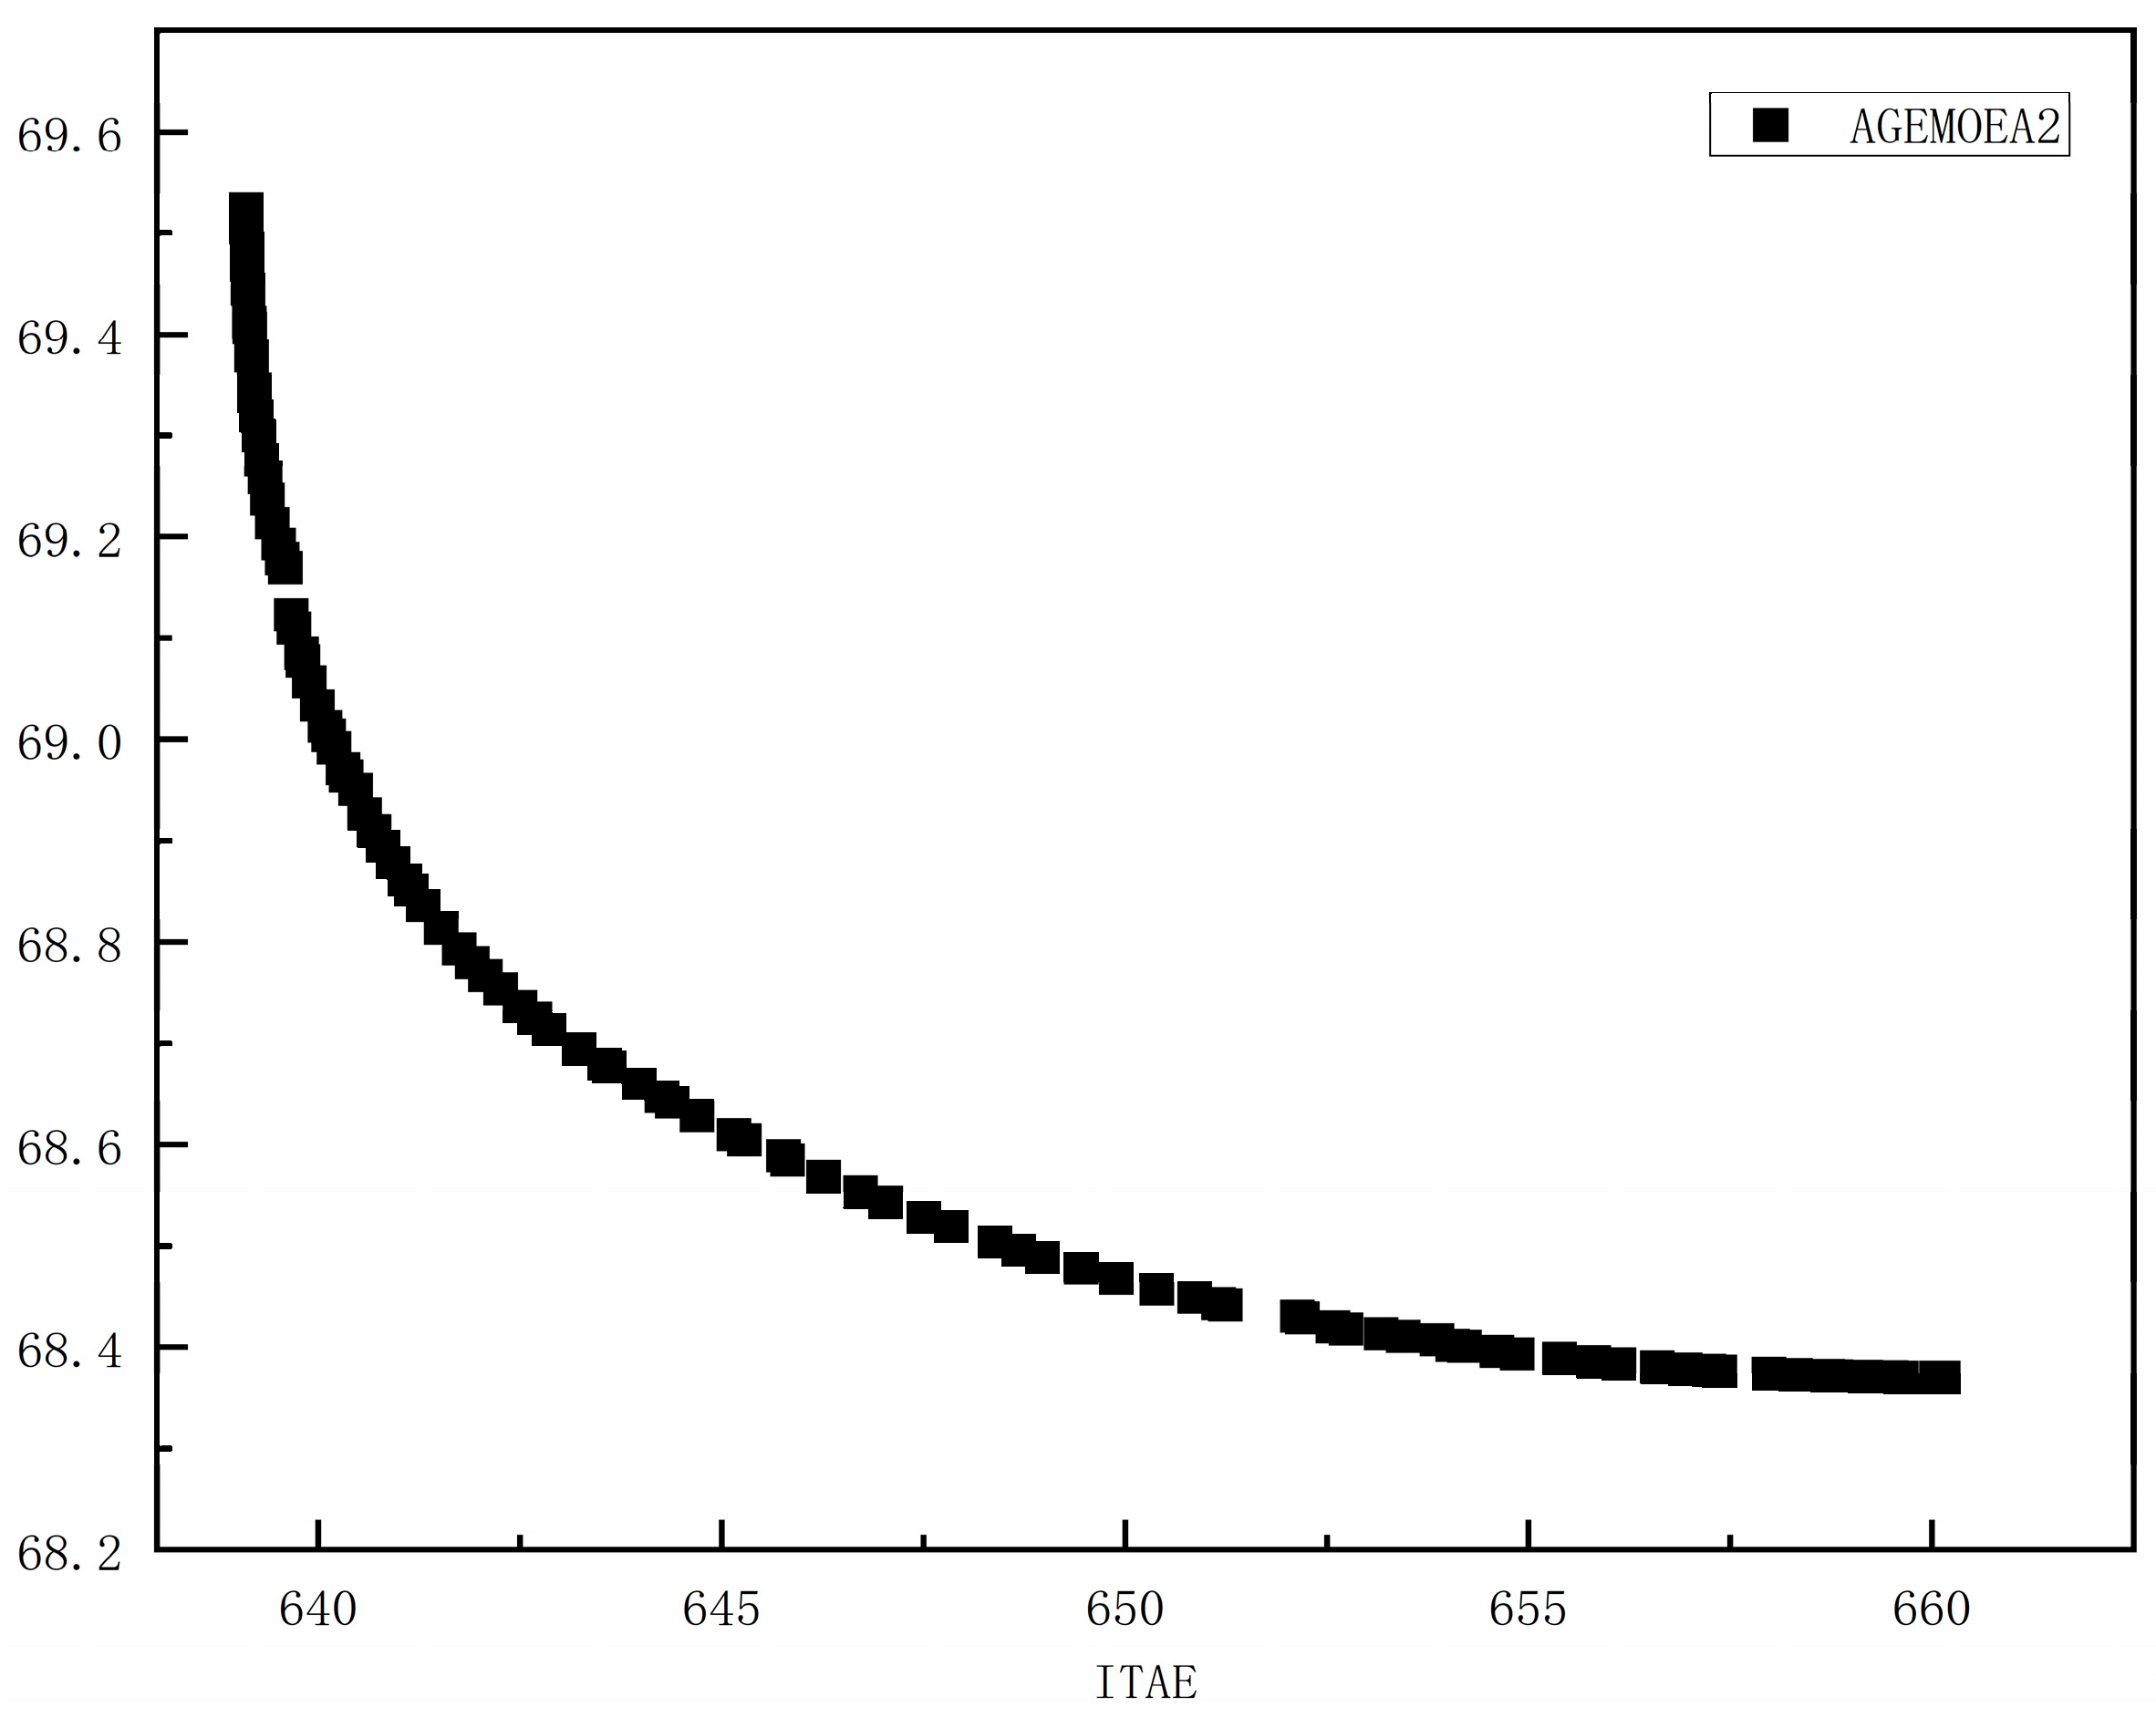
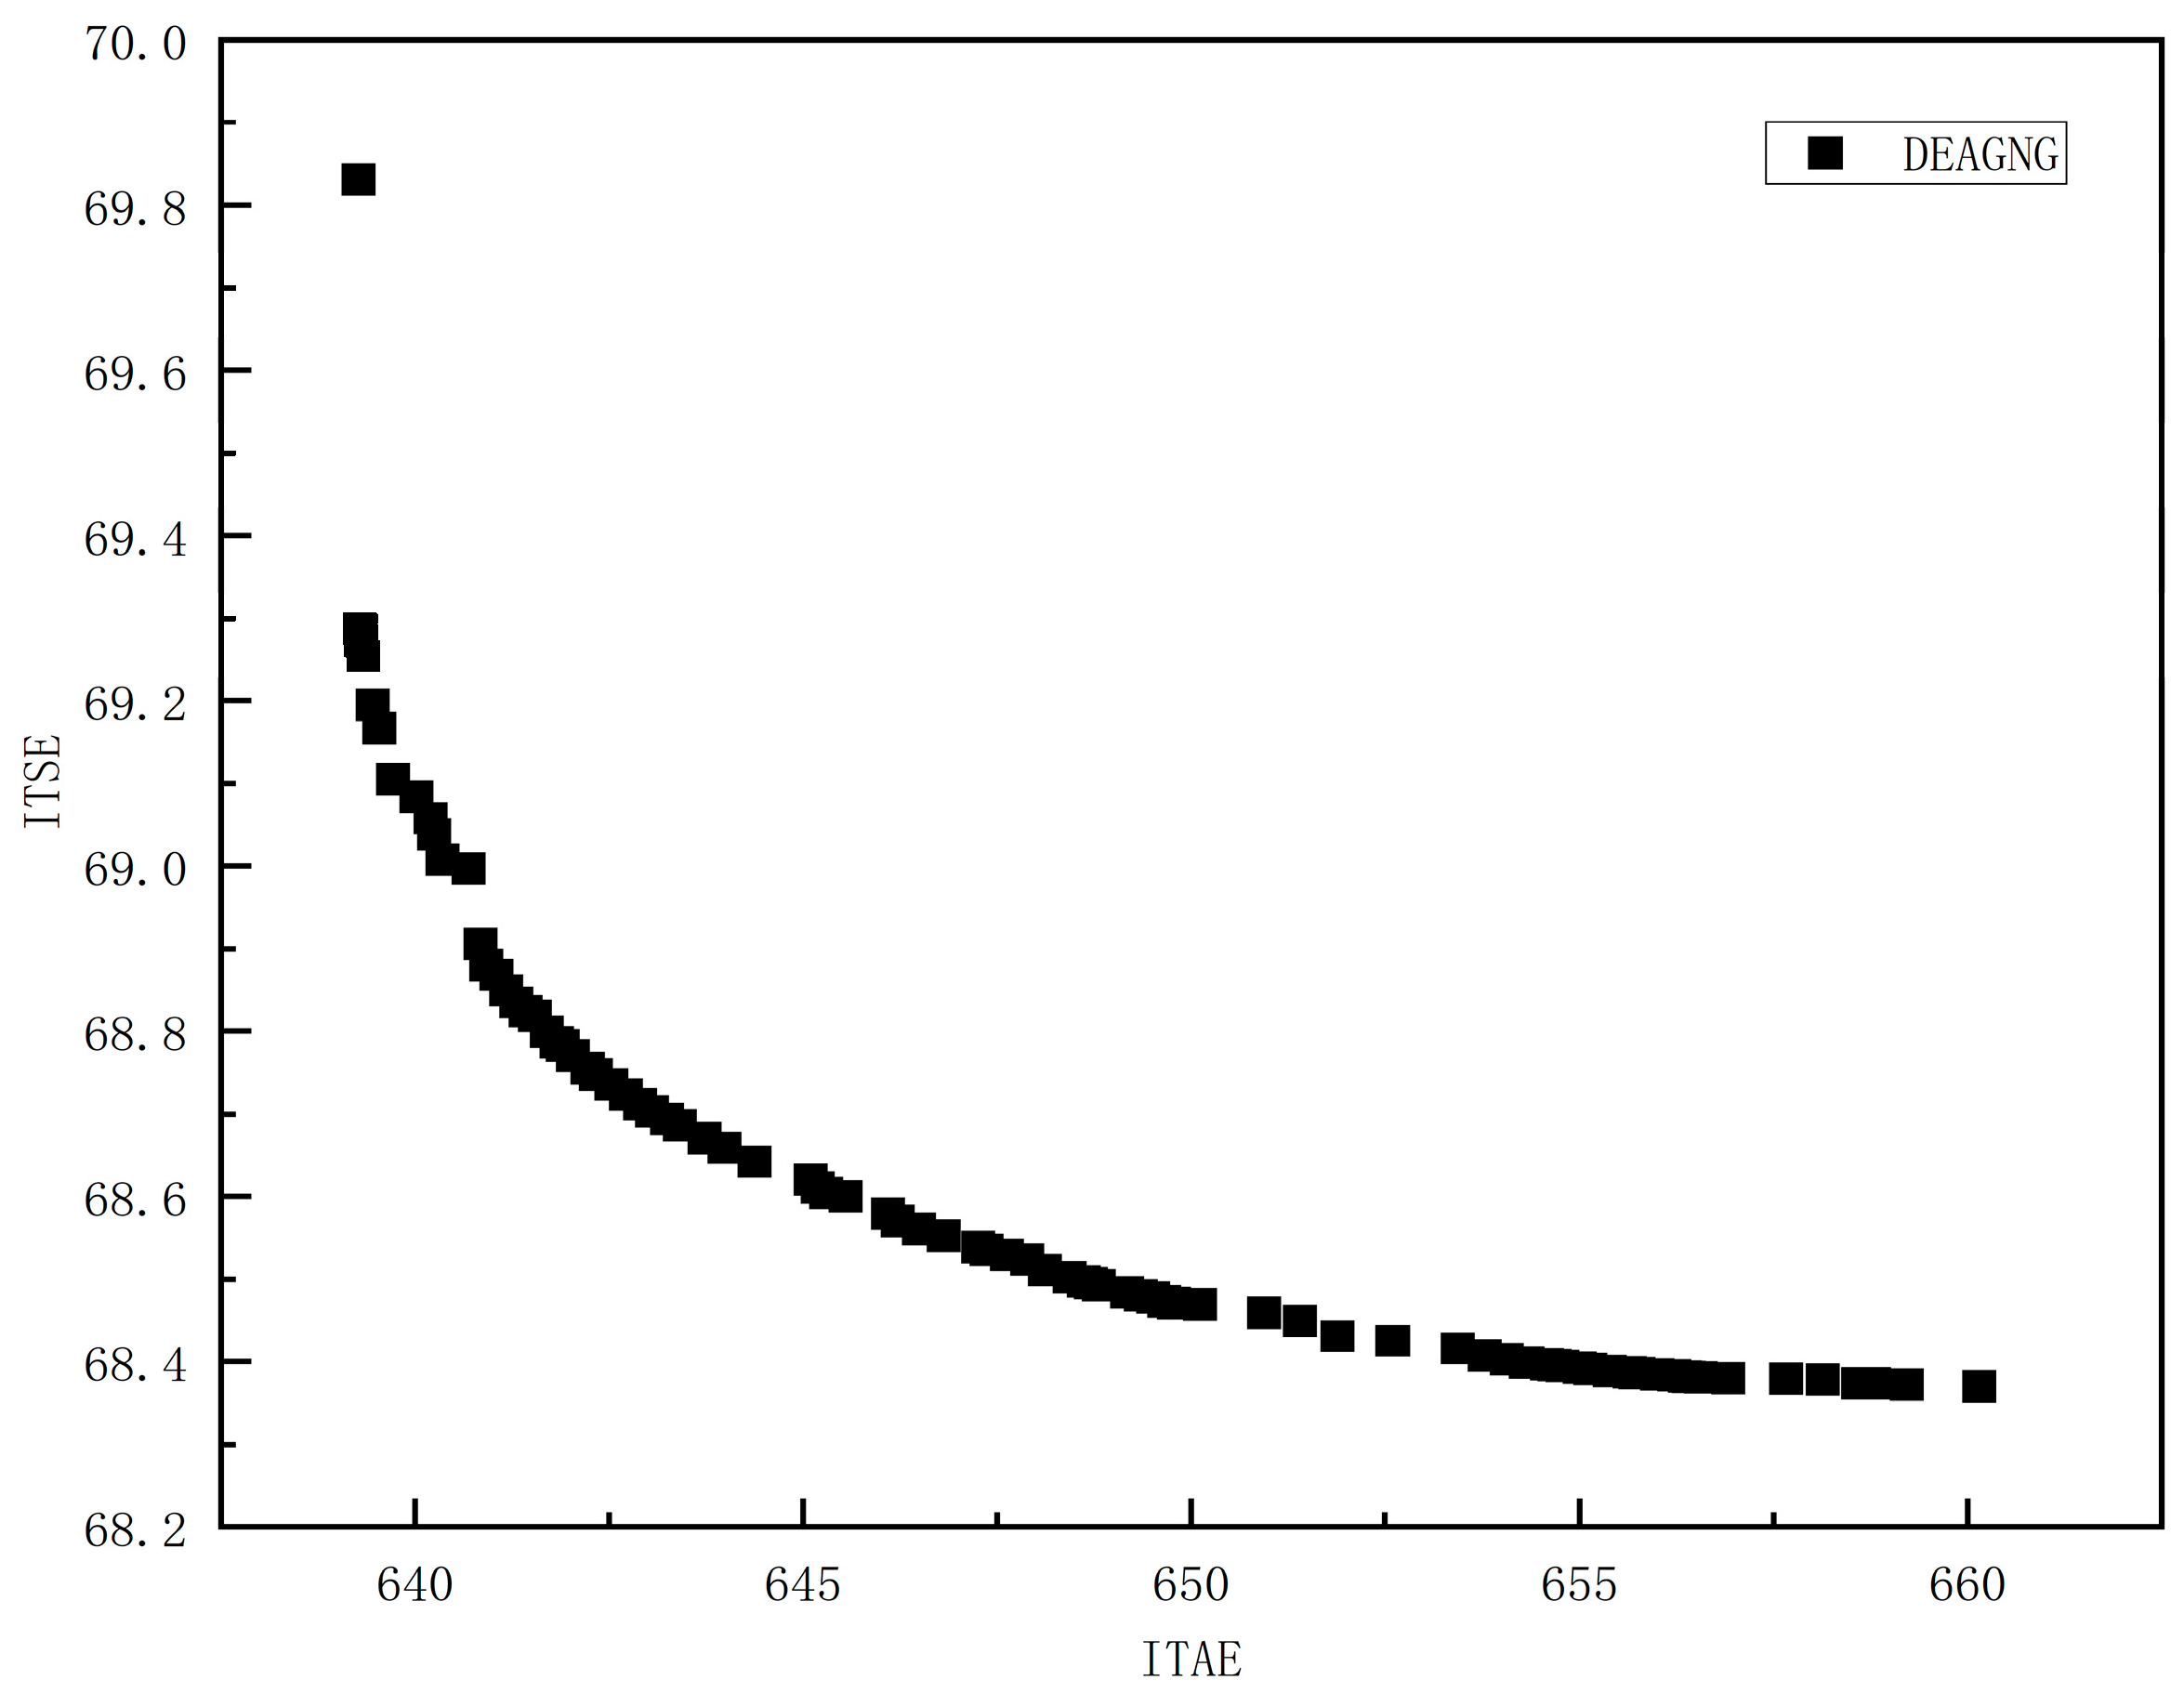
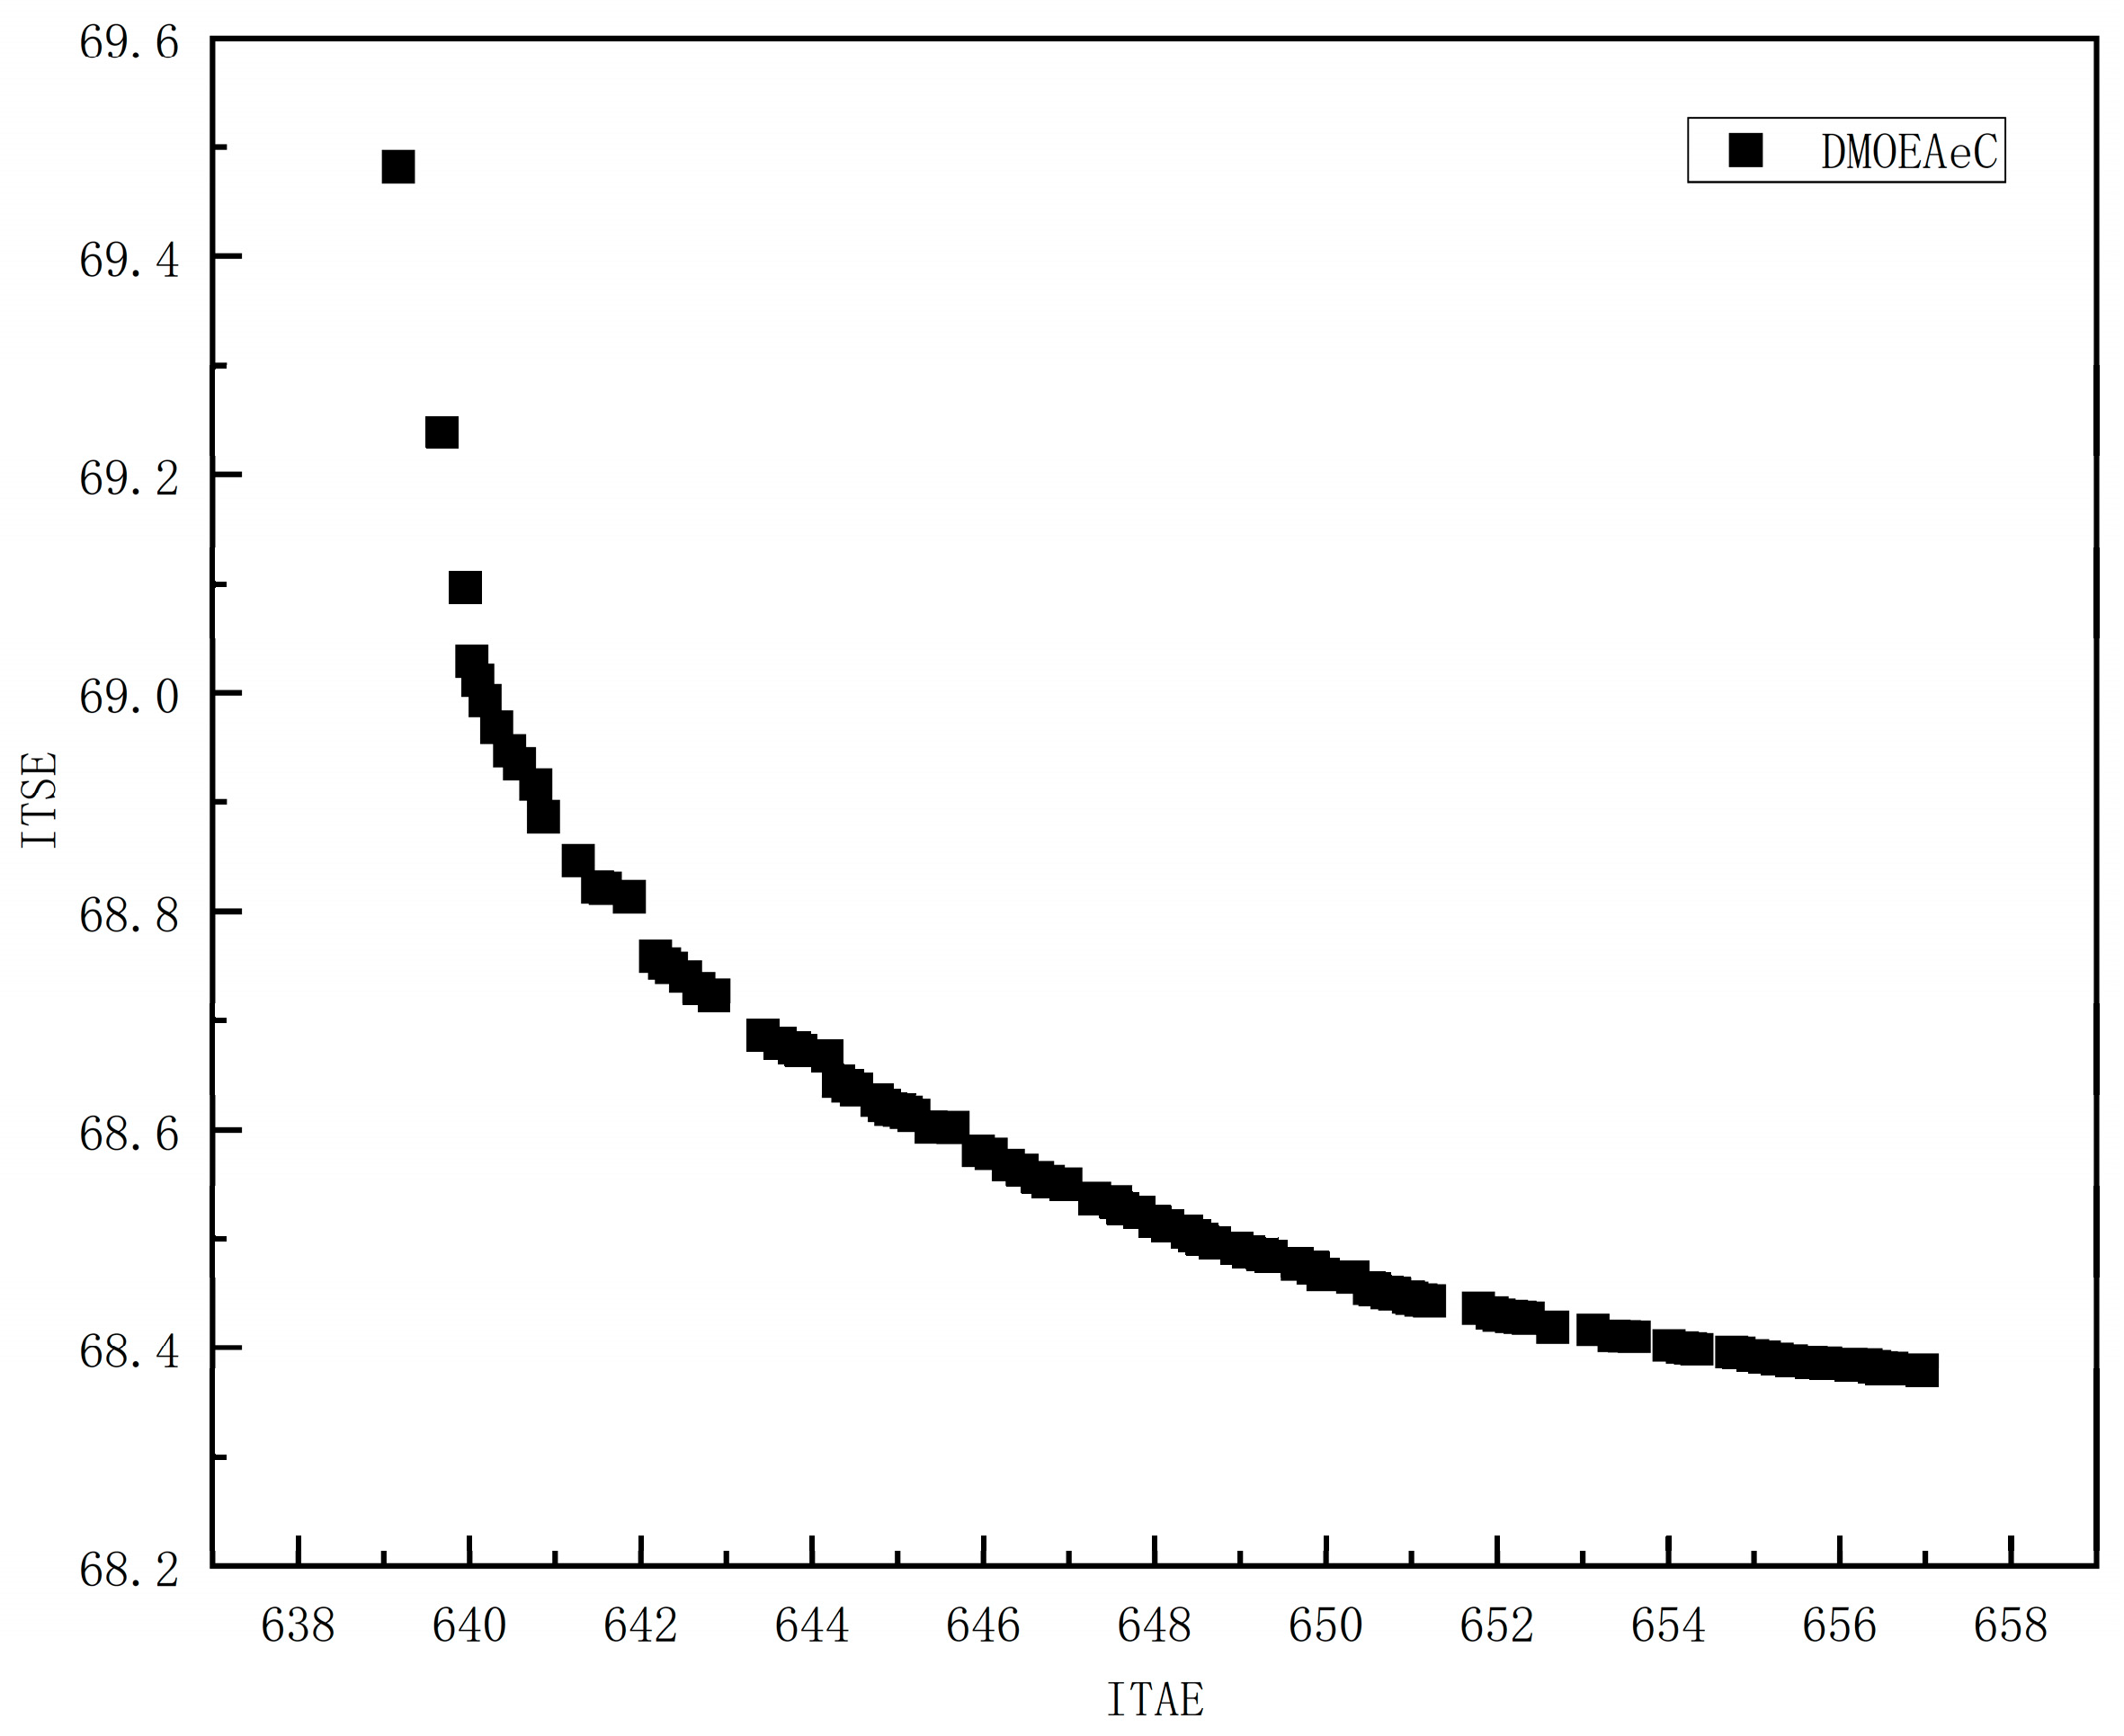
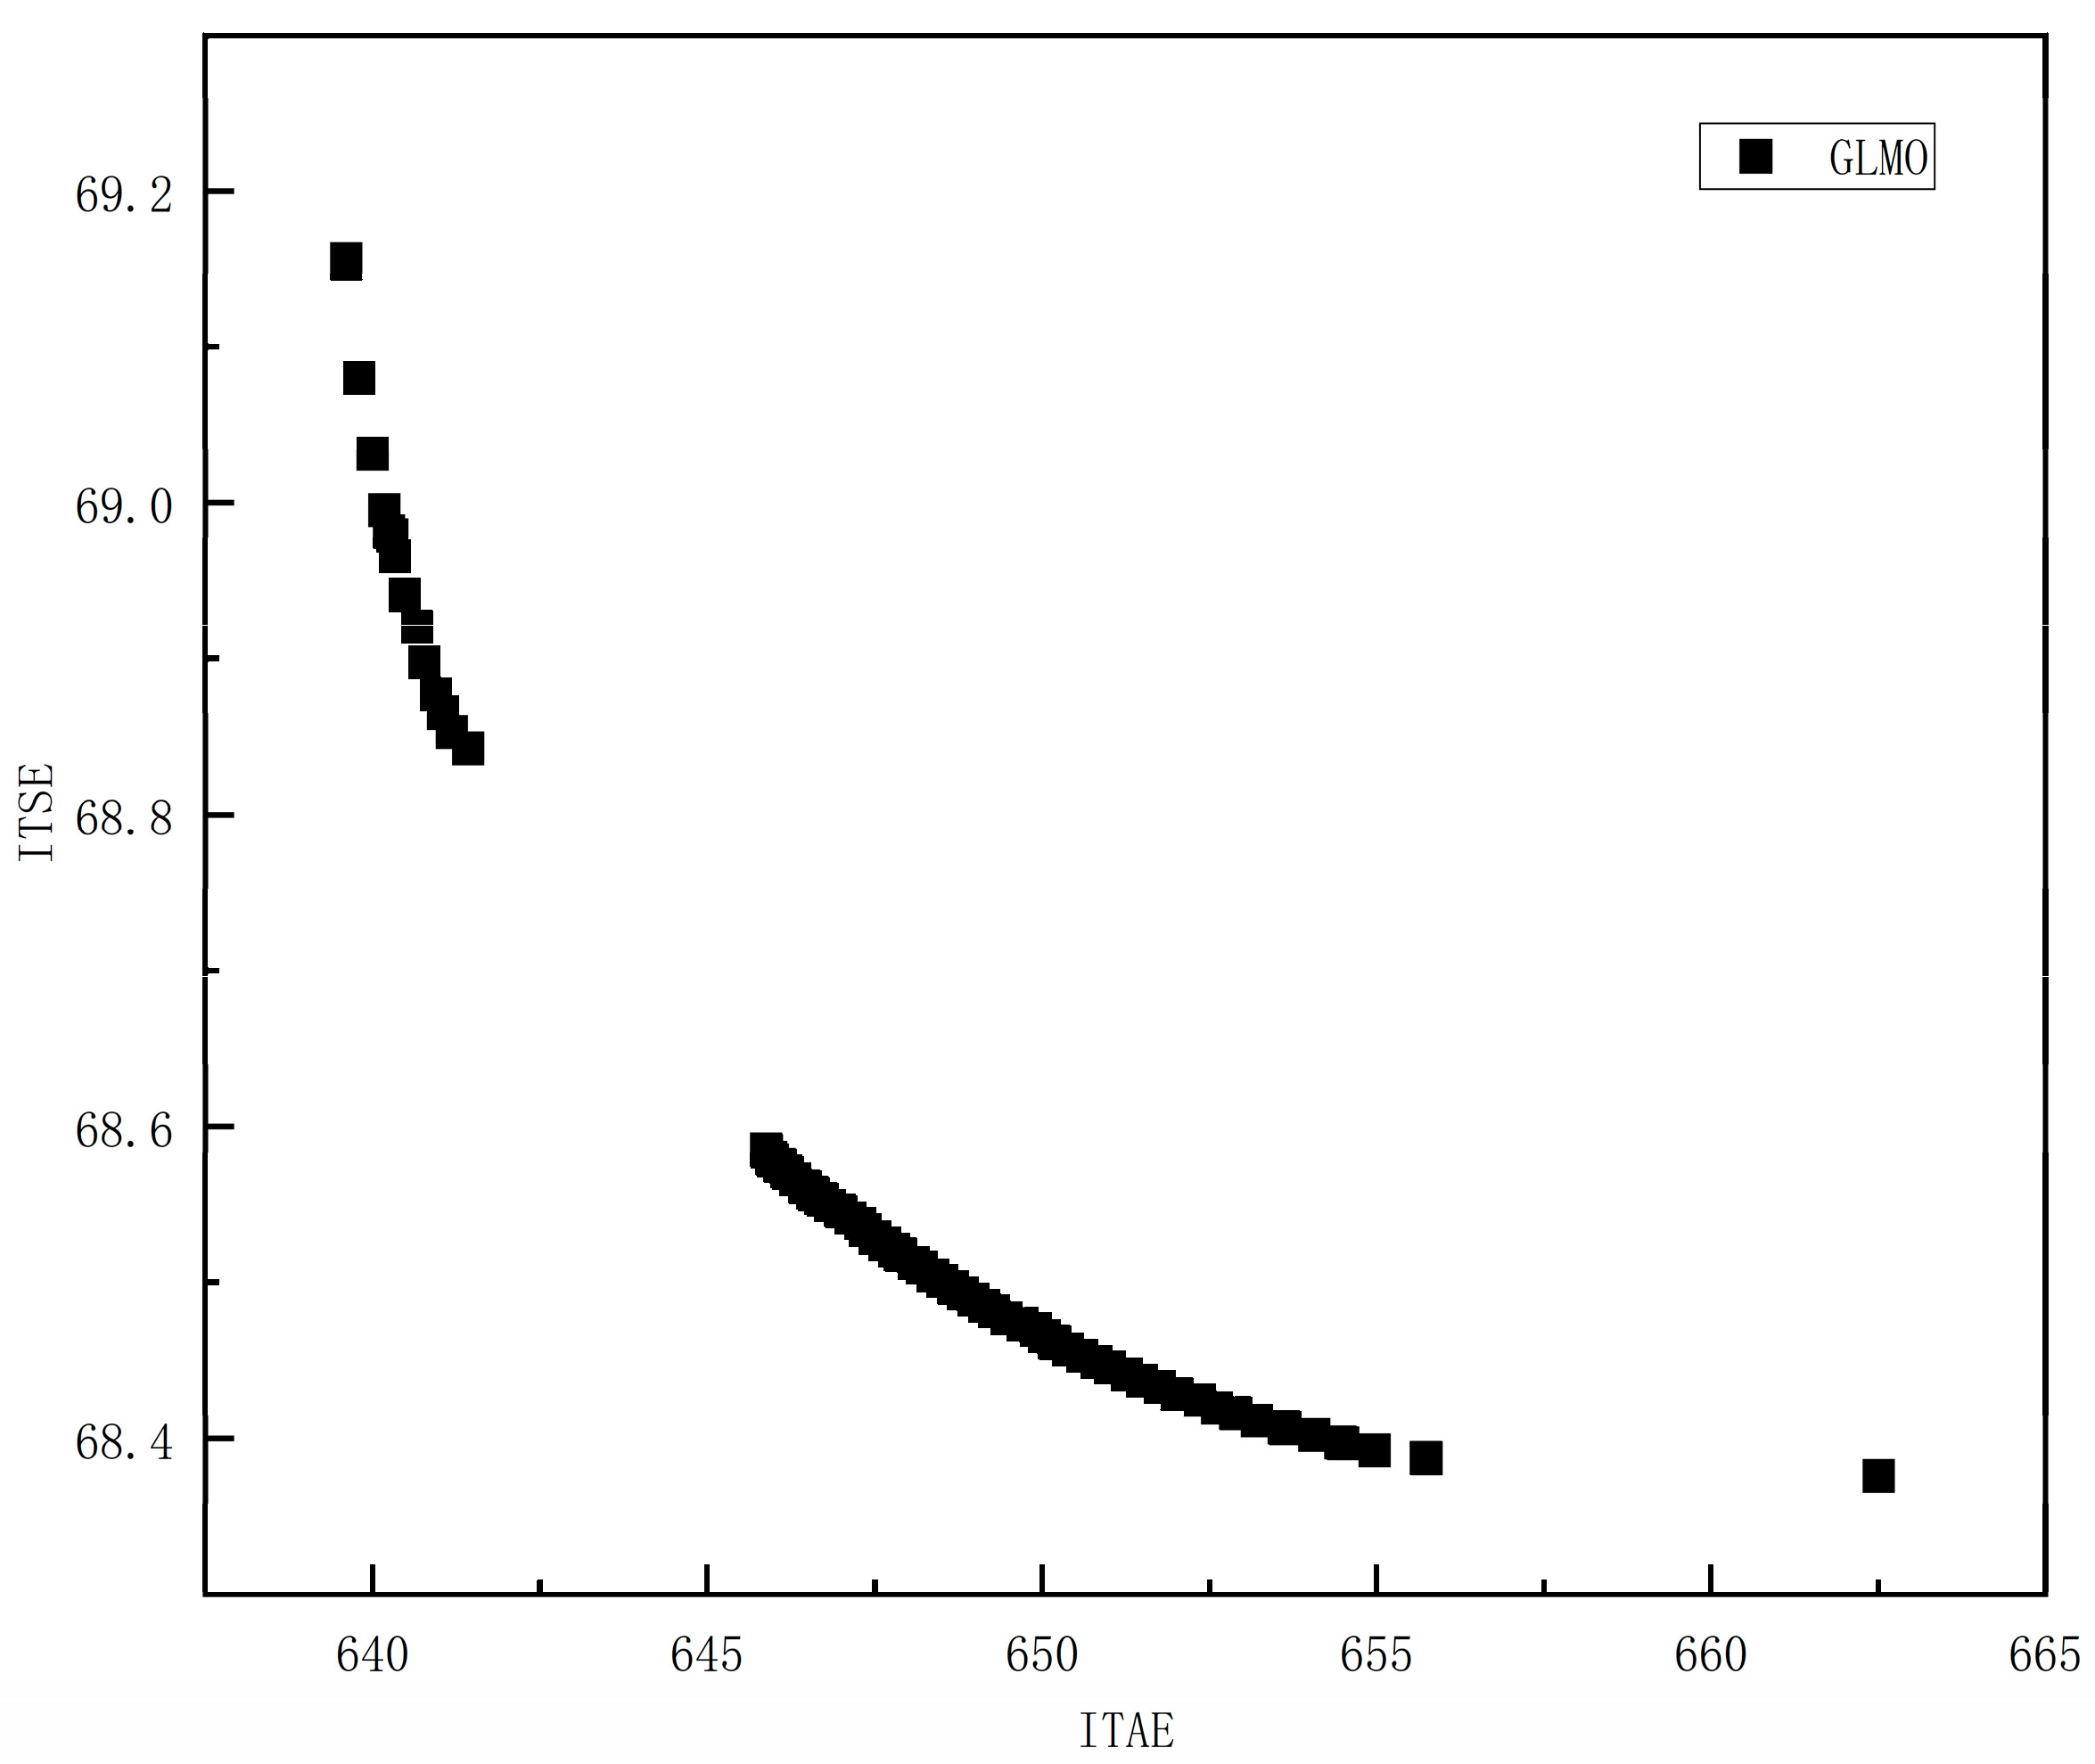
The Pareto front obtained by optimizing the parameters using the multi-objective algorithm for Scenario 2 is shown in
Figure 7,
Figure 8,
Figure 9 and
Figure 10 below.
From
Figure 7,
Figure 8,
Figure 9 and
Figure 10, it can be observed that the Pareto fronts obtained by the four multi-objective algorithms for optimizing Scenario 2 are quite similar. The median points from these fronts are selected to derive the following
Table 5:
From
Table 5, it is evident that the DEAGNG algorithm also demonstrates commendable performance in Scenario 2. Although the GLMO algorithm slightly outperforms in both the ITAE and ITSE performance metrics, the DEAGNG algorithm exhibits an ITAE value of 639.5410 and an ITSE value of 69.1670, which are not significantly different from the optimal values. This indicates that the DEAGNG algorithm results in relatively small cumulative errors and sums of squared errors during the control process, signifying good control performance. Overall, the DEAGNG algorithm shows promising performance in Scenario 2.
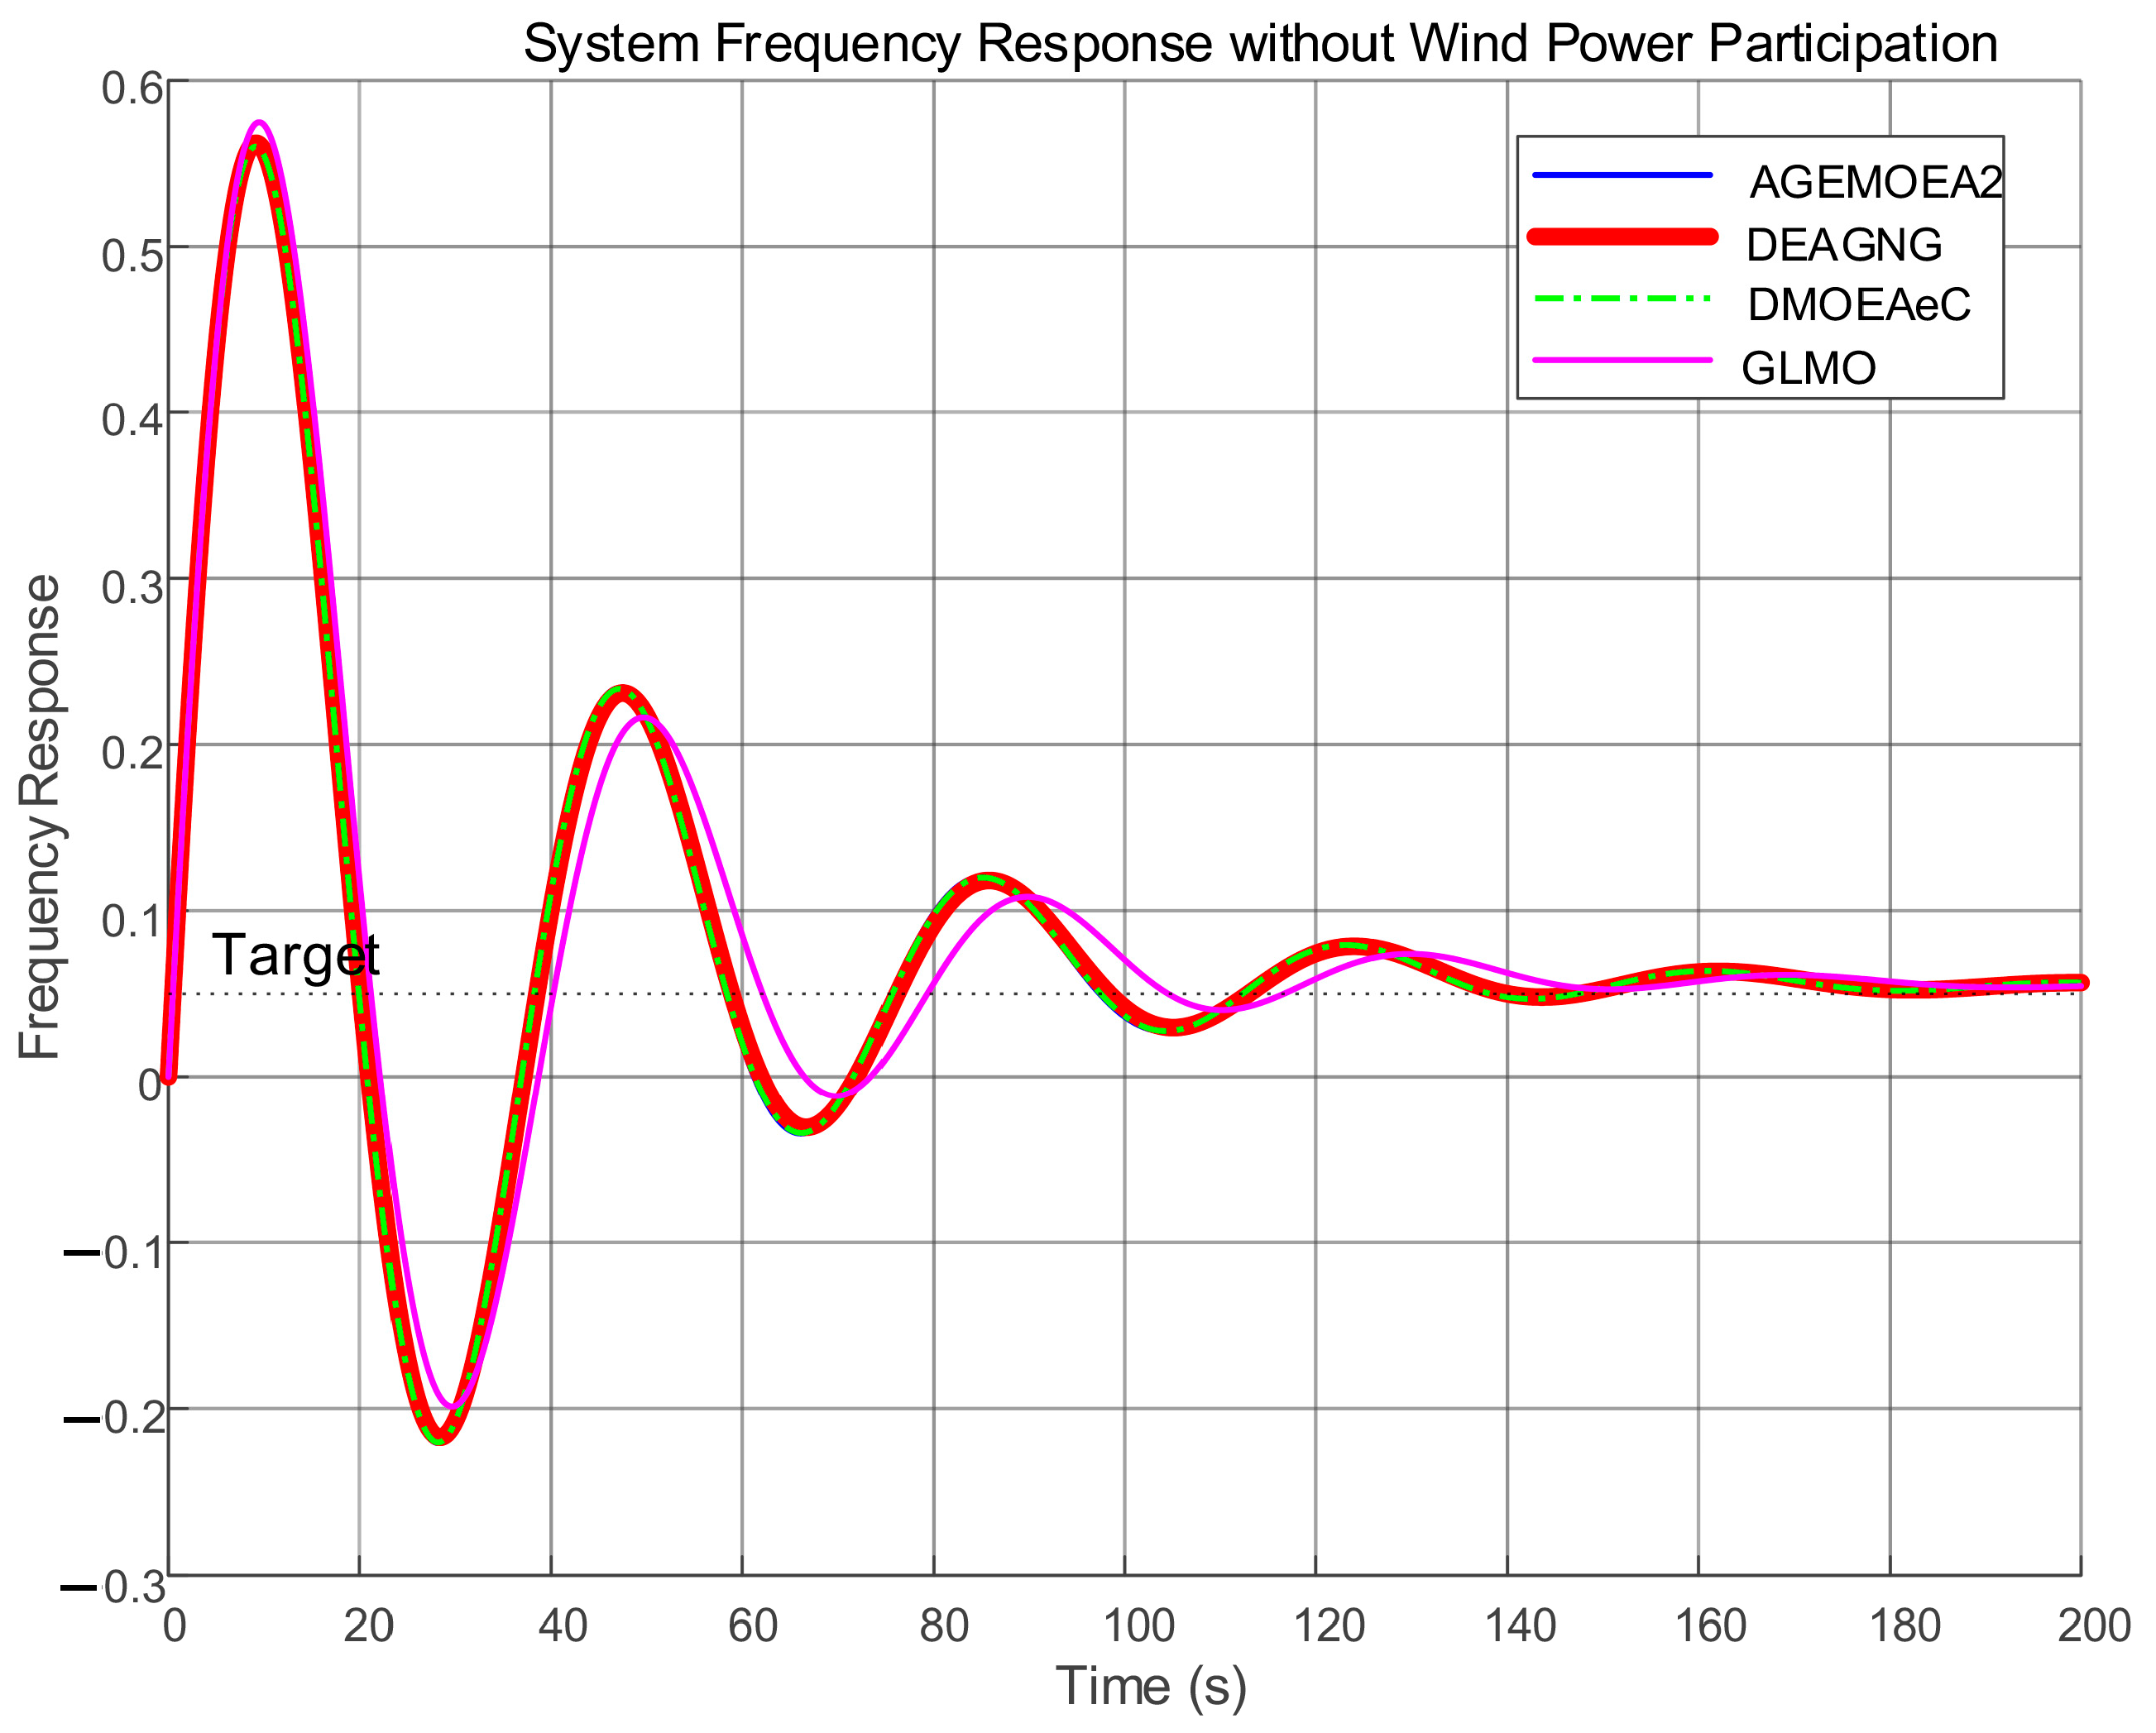
The comparison of the frequency response of the system is shown in
Figure 11.
In scenario 2 (without wind power participation) shown in
Figure 11, the DEAGNG curve (red) almost completely overlaps the blue curve of AGEMOEA2, so the latter is visually covered. from the perspective of the system frequency response curve:
The response curve of the DEAGNG algorithm (red curve) is relatively coincident with those of the AGEMOEA2 and DMOEAeC algorithms. This indicates that in this scenario, the DEAGNG algorithm has similar performance to these two algorithms.
Although the curve of the GLMO algorithm is different from those of the other algorithms and may have a certain advantage in convergence, the GLMO algorithm does not have an advantage in terms of the two key performance indicators, ITAE and ITSE. For the DEAGNG algorithm, within the entire time interval (0–200 s), its frequency response curve shows good characteristics. In terms of ITAE, the DEAGNG algorithm can effectively control the accumulation of frequency deviation and does not have excessive accumulated deviation. In terms of ITSE, the fluctuations in its frequency response process are relatively small, and it can better avoid performance problems caused by large frequency deviations. In addition, the DEAGNG algorithm shows appropriate transient response and stability in this scenario. Its rapid rise time and small overshoot indicate that after the system is disturbed, it can quickly and smoothly return to the target frequency (0.05 Hz).
In summary, in Scenario 2, the DEAGNG algorithm shows good applicability, whether from the comparison with other similar algorithms or from the consideration of key performance indicators.
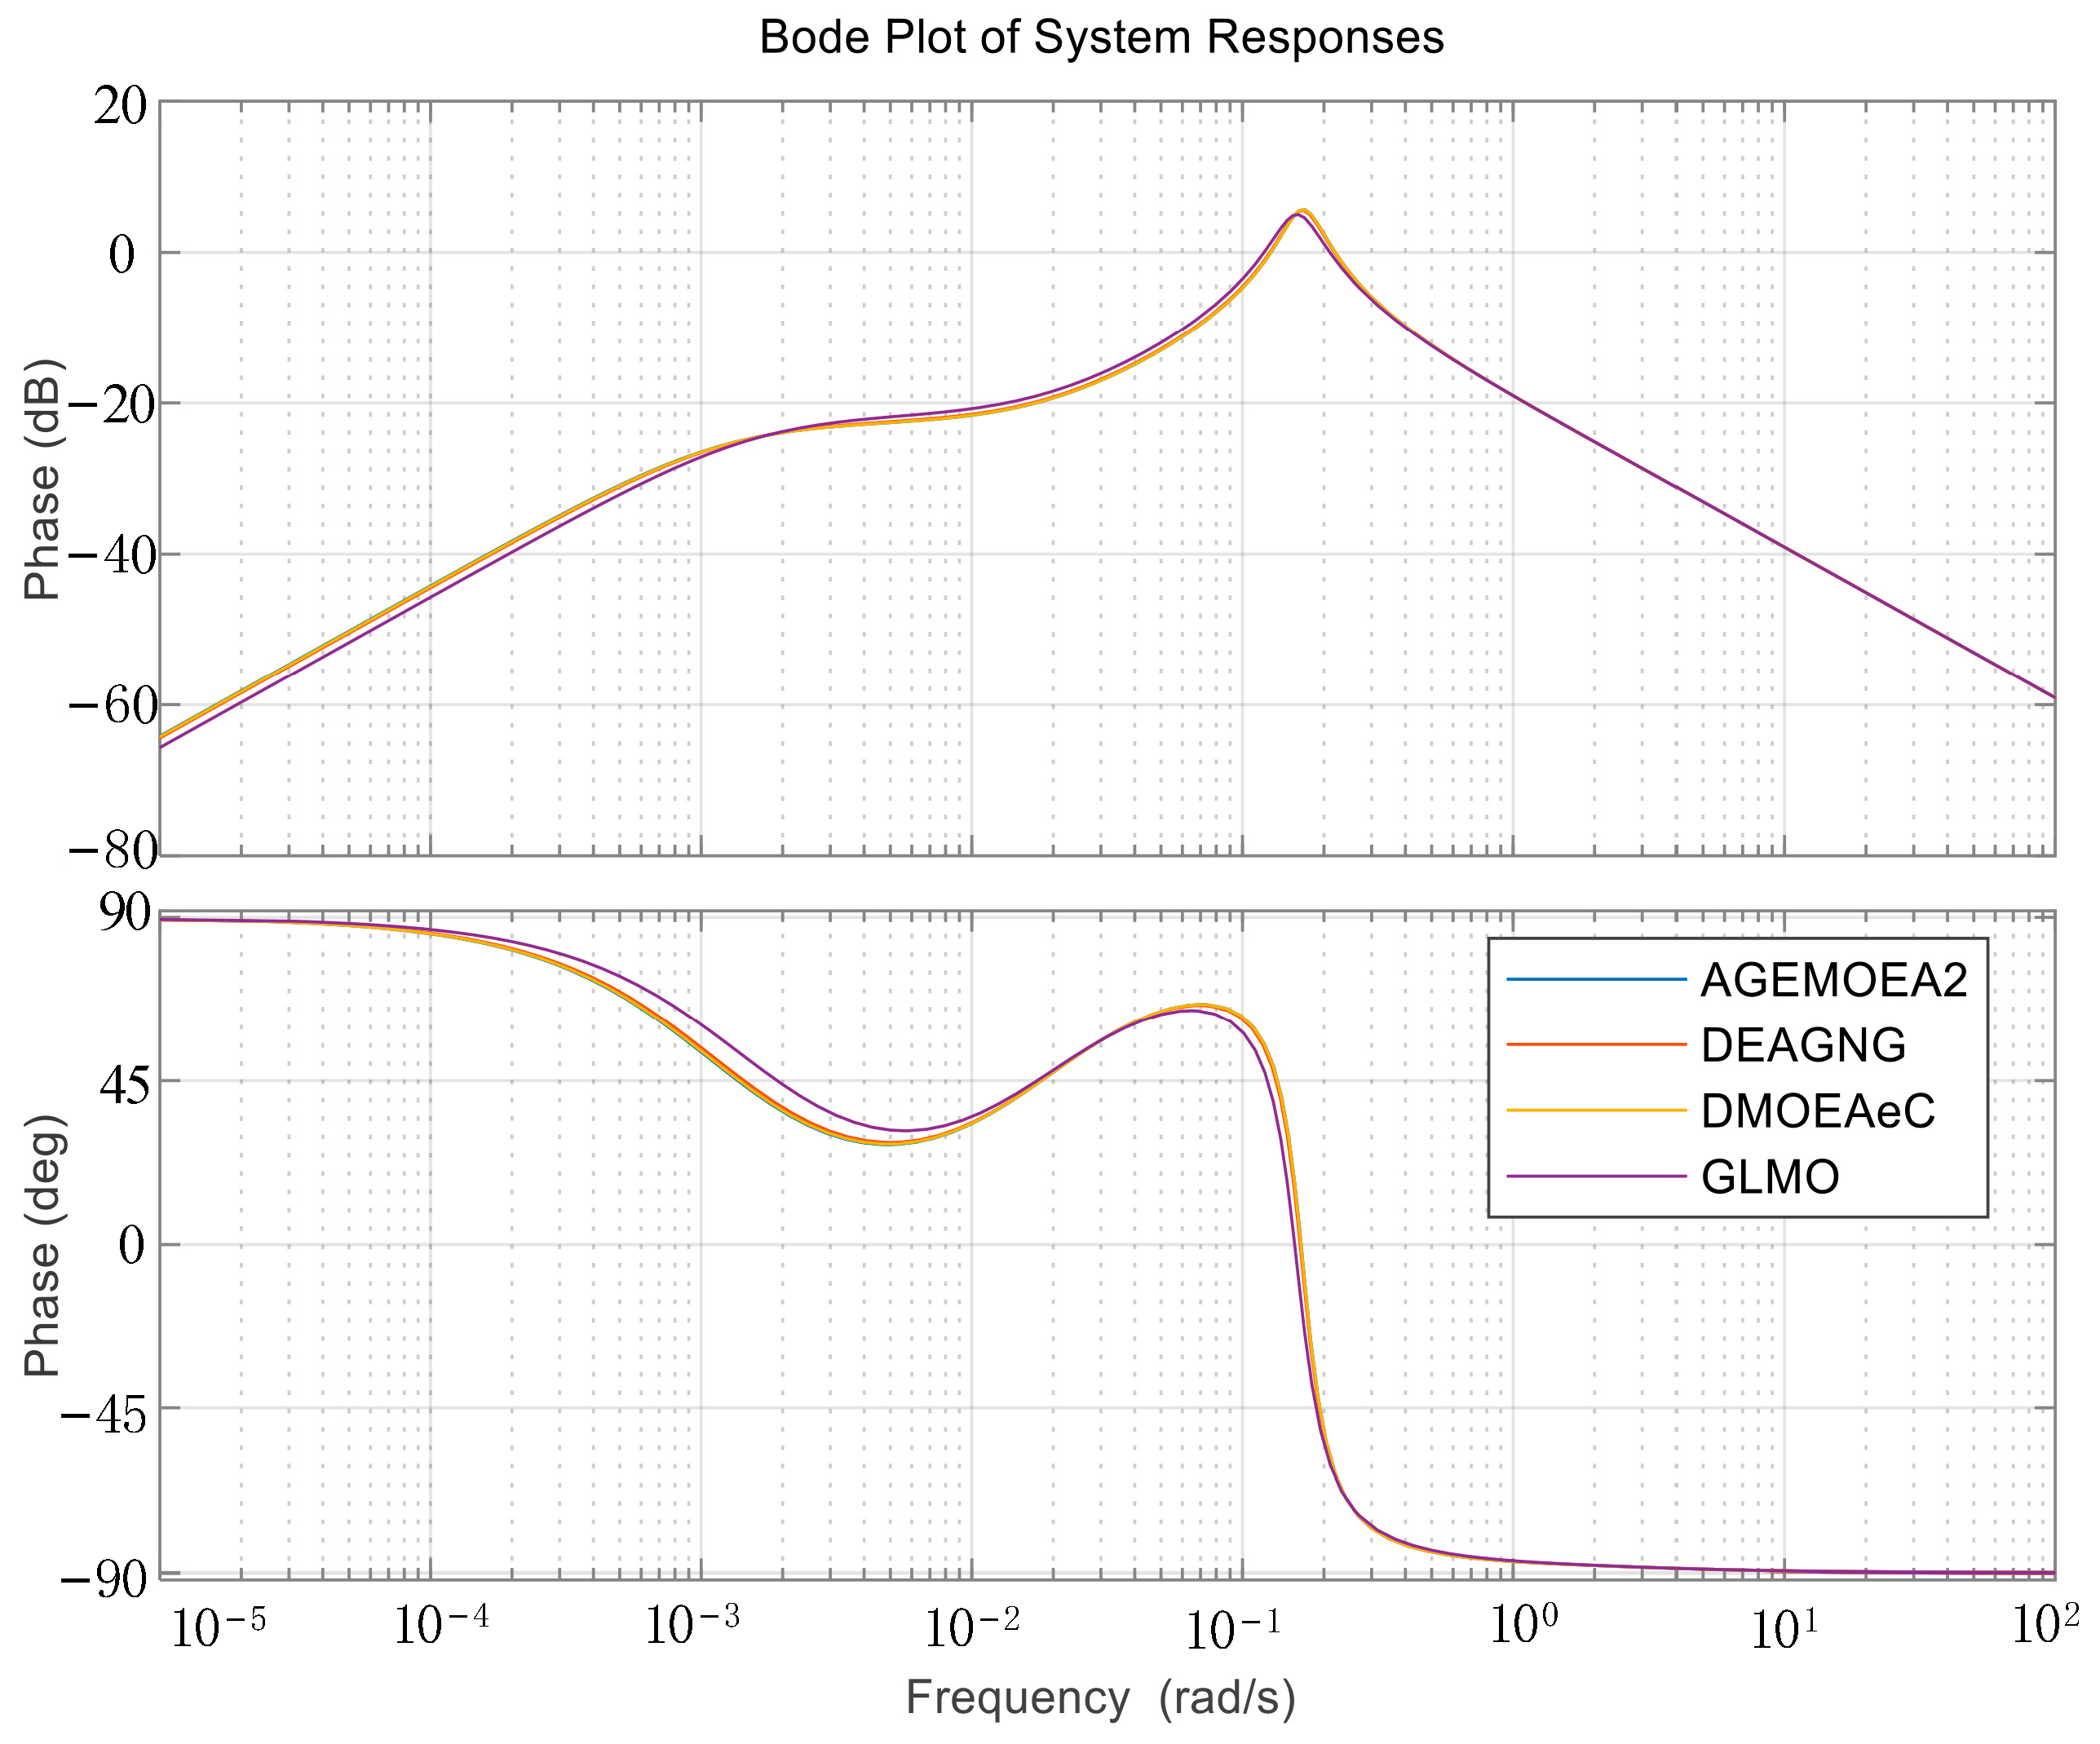
The Bode plot, as shown in
Figure 12, illustrates that the system performance optimized by several multi-objective algorithms is close, indicating that the DEAGNG algorithm is also applicable in Scenario 2.
To verify the adaptability of the DEAGNG algorithm under varying renewable-energy-penetration conditions, a new “Scenario 3—wind-solar disturbance penetration of 20%” is added, with all other simulation settings identical to Scenarios 1 and 2. The PID parameters are optimized by the four algorithms DEAGNG, AGEMOEA2, DMOEAeC, and GLMO; the core performance indicators (ITAE and ITSE) and the control parameters (
KP and
KI) are compared in
Table 6.
Table 6 compares the PID-parameter optimization results and system-performance indices of the four algorithms—DEAGNG, AGEMOEA2, DMOEAeC and GLMO—under a 20% wind-solar penetration scenario. Overall, DEAGNG delivers the best composite performance: its ITAE (284.3207) is the lowest among all algorithms, 1.8%, 2.7% and 18.1% lower than those of AGEMOEA2 (289.6142), DMOEAeC (292.1568) and GLMO (345.8926), respectively, evidencing superior cumulative-frequency-deviation control. Its ITSE (28.0153) is virtually identical to GLMO’s (27.9864), confirming excellent suppression of extreme deviations. Moreover, the optimized parameters are more engineering-friendly: K
P (0.0512) lies within the hydro-PID stable range (0.03–0.08), eliminating the risk of reverse regulation posed by GLMO’s negative K
P (−0.0152), while K
I (0.00018) is moderate, avoiding the insufficient integral action that can result from AGEMOEA2’s smaller K
I (2.8632 × 10
−5). Compared with Scenario 1 (30% penetration), where DEAGNG yielded ITAE = 303.5593 and ITSE = 29.1728, Scenario 3 shows reductions of 6.3% and 3.9%, respectively, demonstrating that the DEAGNG-optimized parameters retain high efficiency even when wind-solar disturbance weakens, without over-regulation or performance degradation.
