Article

Analysis of Risk Factors for Tunnel Flooding Disasters Based on DEMATEL

College of Pipeline and Civil Engineering, China University of Petroleum (East China), Qingdao 266580, China
*
Author to whom correspondence should be addressed.
Water 2025, 17(18), 2694; https://doi.org/10.3390/w17182694
Submission received: 26 July 2025 / Revised: 3 September 2025 / Accepted: 9 September 2025 / Published: 12 September 2025
(This article belongs to the Section Urban Water Management)

Abstract

The growing frequency of extreme rainstorms has increasingly exposed tunnels to flooding risks, underscoring the urgent need for effective flood prevention and drainage measures. In this context, an evaluation framework for tunnel flood hazards was developed based on three criteria—hazard-inducing factors, hazard-formative environment, and disaster-bearing body—encompassing nine specific indicators. This study employs the Decision Making Trial and Evaluation Laboratory (DEMATEL) method to construct a causal analysis model and assess the interrelationships and influence levels of risk factors associated with tunnel flooding disasters. Rainfall intensity (C1), rainfall duration (C2), ground elevation (C4), road slope (C5), and impervious surface area (C6) exhibit high causal values, acting as external input factors that drive the occurrence of tunnel flooding incidents. Conversely, water depth (C3), tunnel drainage capacity (C7), emergency flood control measures (C8), and infrastructure aging (C9) display high centrality values, serving as internal factors that reflect the tunnel’s flood prevention capability and determine the extent of disaster losses. Simply enhancing tunnel drainage capacity from the perspective of internal factors alone is insufficient; optimizing the tunnel’s flood resilience requires a combined consideration of both internal and external factors.

1. Introduction

Flooding is one of the most dangerous, frequent, and destructive natural disasters, consistently causing significant loss of life and socioeconomic damage [1,2,3]. The synergistic effects of climate change and urbanization have led to an increase in both the frequency and intensity of urban floods, along with an expansion of the affected areas [4,5]. The growing prevalence of surface flooding in urban environments has increasingly exposed subsurface infrastructure—such as tunnels—to heightened flood hazards. Tunnels are typically situated in low-lying areas where surface runoff can easily enter under the influence of gravity. Their enclosed structural design poses several challenges, including poor drainage efficiency, limited pumping capacity, and a tendency for rainwater to accumulate but remain difficult to discharge [6,7]. As a result, tunnel waterlogging can cause submerged vehicles, traffic paralysis, stranded passengers, and even casualties, leading to severe and potentially catastrophic flood events [8]. For instance, during the torrential rainfall event on 20 July 2021, in Zhengzhou, China, the Jing Guang North Tunnel on the expressway experienced severe backflow flooding, resulting in six fatalities and the submergence of 247 vehicles [9]. Tunnel flood disasters should not be underestimated. Analyzing the contributing factors and assessing the potential risks of rainwater backflow are essential for guiding the planning, design, and implementation of effective flood prevention and drainage systems in tunnels.
In recent years, scholars have conducted extensive research on the risk assessment of flooding disasters. Pant et al. [10] quantified the sources, locations, and severity of flood risks in the Thames River Basin, thereby identifying priorities for flood protection investments in critical infrastructure. Lyu et al. [11] focused on the Guangzhou metro system and applied the Improved Analytic Hierarchy Process (I-AHP) to construct a regional flood risk map, assessing flood risks within a 500 m buffer along the metro lines. Wu et al. [12] proposed a Bayesian network model for the rapid prediction of underground flood evolution, which identifies key factors and supports scenario-based emergency decision-making. Li et al. [13] analyzed 63 urban underground flooding incidents and systematically examined the coupling effects of human factors, physical conditions, environmental variables, and management practices in flood inducement. O’Donnell et al. [14] assessed the driving factors of urban flooding and found that rainfall is the primary source of flood risk, while the deterioration of urban assets is the main driving force behind its escalation. Pathan et al. [15] employed the AHP and TOPSIS methods, using 14 flood-related indicators to develop a flood risk map for the city of Navsari, aiming to identify the most vulnerable areas susceptible to inundation. Rafiei et al. [16] integrated machine learning techniques with the TOPSIS method to assess flood risk in the city of Jiroft. However, most studies focus on analyzing flood risks from a city-wide perspective, while limited attention has been given to assessing the risk of flooding incidents in underground infrastructure such as tunnels. In particular, there is a lack of in-depth research on how tunnel-specific structural characteristics and external environmental conditions influence disaster mechanisms. In response, this study employs the Decision-Making Trial and Evaluation Laboratory (DEMATEL) method to analyze indicators that contribute to tunnel flooding, establish an influence matrix among the factors, and identify key elements responsible for tunnel inundation. This analysis provides a reference for tunnel flood prevention planning and emergency response strategies.

2. Data Materials

2.1. Factor Selection

Flood disasters result from the interaction of multiple factors and essentially represent an imbalance within a local system. Li et al. [17] examined annual rainfall in China from 2000 to 2015 and identified a positive correlation between precipitation and flood damage. Using urban flood simulations, Afrin et al. [18] showed that insufficient stormwater infrastructure and low land permeability can substantially increase flood volume. Sohn et al. [19] highlighted a potential relationship between the performance of drainage systems near roadways and the severity of flood damage. Wang et al. [20] divided flood management strategies into structural measures (keeping water away from people) and non-structural measures (keeping people away from water bodies), stressing that reducing flood risk requires an optimal balance between the two. Xian et al. [21] further demonstrated that the optimal elevation of coastal buildings is closely linked to their vulnerability following flood events. These studies indicate that occasional flooding incidents do not stem from a single “root cause,” but rather from the combined failure of multiple factors.
Tunnel flooding exhibits similar characteristics, arising from the coupled effects of multiple hazard factors within the tunnel environment. To systematically analyze tunnel flooding incidents, this study reviewed relevant literature and Chinese national standards (Table 1), identified and categorized the risk factors associated with tunnel waterlogging, and developed a risk assessment framework for urban tunnel inundation (Figure 1).
The framework is structured as a three-tier triangle. The top tier (Layer A) represents the overall objective: risk factor indicators for tunnel inundation hazards. The second tier classifies factors into three categories based on their attributes: disaster-inducing factors (B1), disaster-breeding environments (B2), and exposure of the hazard-bearing body (B3). The third tier comprises specific indicators under each category. Disaster-inducing factors are the direct triggers of flood hazards. Tunnel inundation is typically caused by extreme weather events such as heavy rainfall or storm surges, and rainfall intensity (C1), rainfall duration (C2), and inundation depth (C3) are commonly used as key indicators for flood warning and mitigation. The disaster-breeding environment does not directly cause hazards but provides the necessary conditions for their occurrence. Commonly used indicators include ground elevation (C4), road gradient (C5), and impervious surface area (C6), reflecting the potential risk of flooding. The hazard-bearing body refers to the entity exposed to flood hazards, whose exposure level determines potential post-disaster losses. Tunnel drainage capacity (C7), emergency flood control measures (C8), and degree of infrastructure aging (C9) are commonly employed to assess system resilience. In total, the indicator layer consists of nine elements, with their definitions and data sources summarized in Table 1.

2.2. Basic Data Source

The study employed a questionnaire survey to invite experts to evaluate and score each risk factor. Based on the 0–4 and 1–5 scaling methods proposed in Reference [31], the survey questionnaire was designed to avoid negative scores. Considering the potential existence of zero-correlation factors, a 0–5 scaling method was adopted to expand the scoring range (see Table 2). For the indicator layer Ci of the “Tunnel Inundation Disaster Threat Indicator Evaluation System,” experts were invited to conduct pairwise comparisons between factors to analyze their mutual influence.
The final paper-based questionnaires for this study were distributed starting on 20 November 2024, and the distribution, collection, and data compilation concluded on 7 February 2025. Over 17 days, a total of 52 questionnaires were distributed, with 37 valid questionnaires returned. The experts include 9 municipal engineering designers, 11 water supply and drainage designers, 10 tunnel construction engineers, 10 drainage network engineers, 5 university professors, and 7 on-campus researchers. Some expert ratings were excluded as they did not comply with the 0–5 scaling method. The valid questionnaires were evaluated using Kendall’s W (Kendall’s coefficient of concordance) to measure the consistency of expert judgments. As shown in Table 3, the Kendall’s W value was 0.811, which exceeds 0.8, indicating a high level of consistency. The asymptotic significance was less than 0.05, demonstrating that the experts’ opinions were statistically significant.

3. Methods

Tunnel flooding disasters can be regarded as systemic disturbances involving hazard-inducing factors, hazard-prone environments, and exposed elements [32], where multiple triggering factors are closely interrelated. The assessment of causal relationships among tunnel flood risk factors inevitably involves fuzzy and non-quantitative data. The analytic hierarchy process (AHP) is not suitable for directly revealing the interrelationships among different categories of factors. The entropy weight method relies on the dispersion of objective data, while some risk factors are primarily quantified subjectively (e.g., emergency measures). Although the fuzzy comprehensive evaluation method can address data uncertainty, it remains insufficient to distinguish between causes and effects among the factors. Given these limitations, this study employs the Decision Making and Trial Evaluation Laboratory (DEMATEL) to assess tunnel flood risk factors.
DEMATEL is a decision-making tool based on graph theory and matrix analysis, designed to construct causal relationship networks among system elements and to reveal the internal interactions and influence pathways within complex systems. A key advantage of DEMATEL lies in its directionality, which enables the analysis of logical relationships between any pair of factors within a system and the identification of each factor’s position in the overall network. This feature allows for a preliminary assessment of how individual factors influence the evolution of tunnel flooding incidents.

3.1. Construct the Direct Influence Matrix

The first step is to transform all evaluation data into a direct influence matrix. Based on the comprehensive scores from the survey, the judgment values from all experts for corresponding indicators were summed and defined as aij (specific values for each aij are shown in Table 3), establishing the direct influence matrix M = (aij)9×9. The matrix values are shown in Table 4.
To eliminate dimensional discrepancies and ensure the mathematical convergence of matrix operations, the direct influence matrix M was normalized, compressing its element values into the range [0, 1]. According to Equation (1), a linear transformation was applied to the matrix: the sum of the row elements of matrix M was calculated, and its maximum value was obtained. Each element within M was then divided by this maximum value, resulting in the normalized direct influence matrix N (Table 5).
N = 1 max j = 1 n a i j × M           1 i n

3.2. Calculation of the Comprehensive Influence Matrix

Before calculating the comprehensive influence matrix T, the indirect influence matrix needs to be determined. The indirect influence matrix is a higher power of the direct influence matrix N. The sum of the powers of matrix N yields the comprehensive influence matrix T, as shown in the following formula [33]:
T = ( N + N 2 + N 3 + N h ) = h = 1 N h
Since all elements of the normalized matrix N lie within the range [0, 1], as h→∞, the matrix Nh ( 0 = lim h N h ). Therefore, the comprehensive impact matrix T can be calculated using the simplified formula (Table 6):
T = N ( I N ) 1
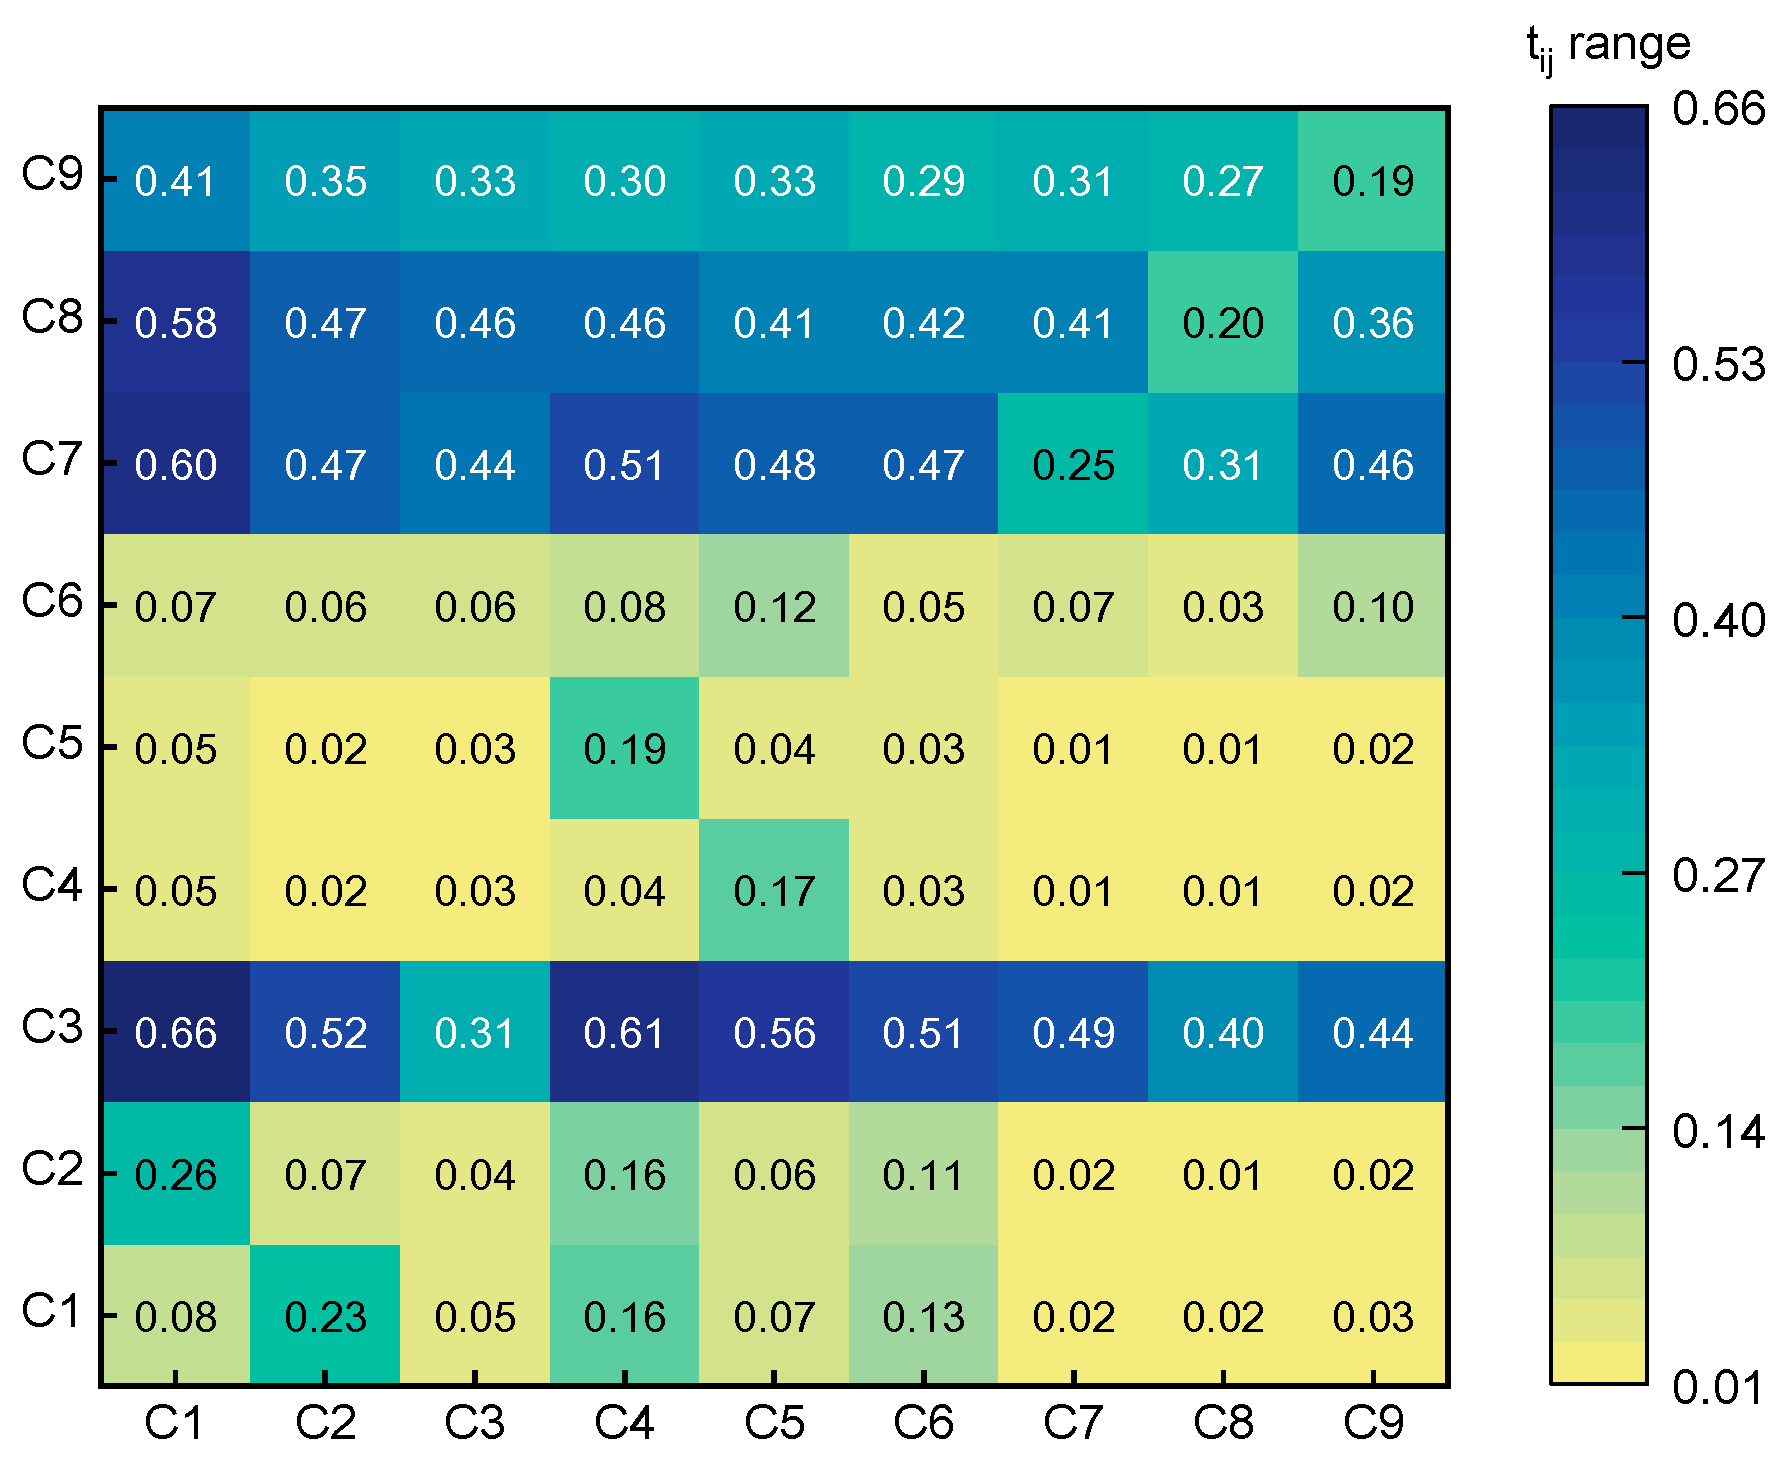
The elements in the comprehensive impact matrix are denoted as tij, where each value represents the overall degree of influence that a given factor exerts on all other factors. The matrix is visualized as a heatmap (Figure 2), in which the rows indicate the influence of each indicator on the others, while the columns represent the extent to which each indicator is influenced by the others. Darker colors correspond to stronger influence levels.
Based on the total influence matrix T, the row and column vectors are processed using Equations (4)–(7) to obtain the influence degree (Di), the influenced degree (Ci), the centrality (Mi), and the cause degree (Ri) for each indicator, as shown in Table 7. The formulas are as follows:
D i = j = 1 n t ij ( i = 1 , 2 , 3 , , n )
C i = i = 1 n t ij ( j = 1 , 2 , 3 , , n )
M i = D i + C i
R i = D i C i

4. Results

4.1. Influence Degree and Influenced Degree

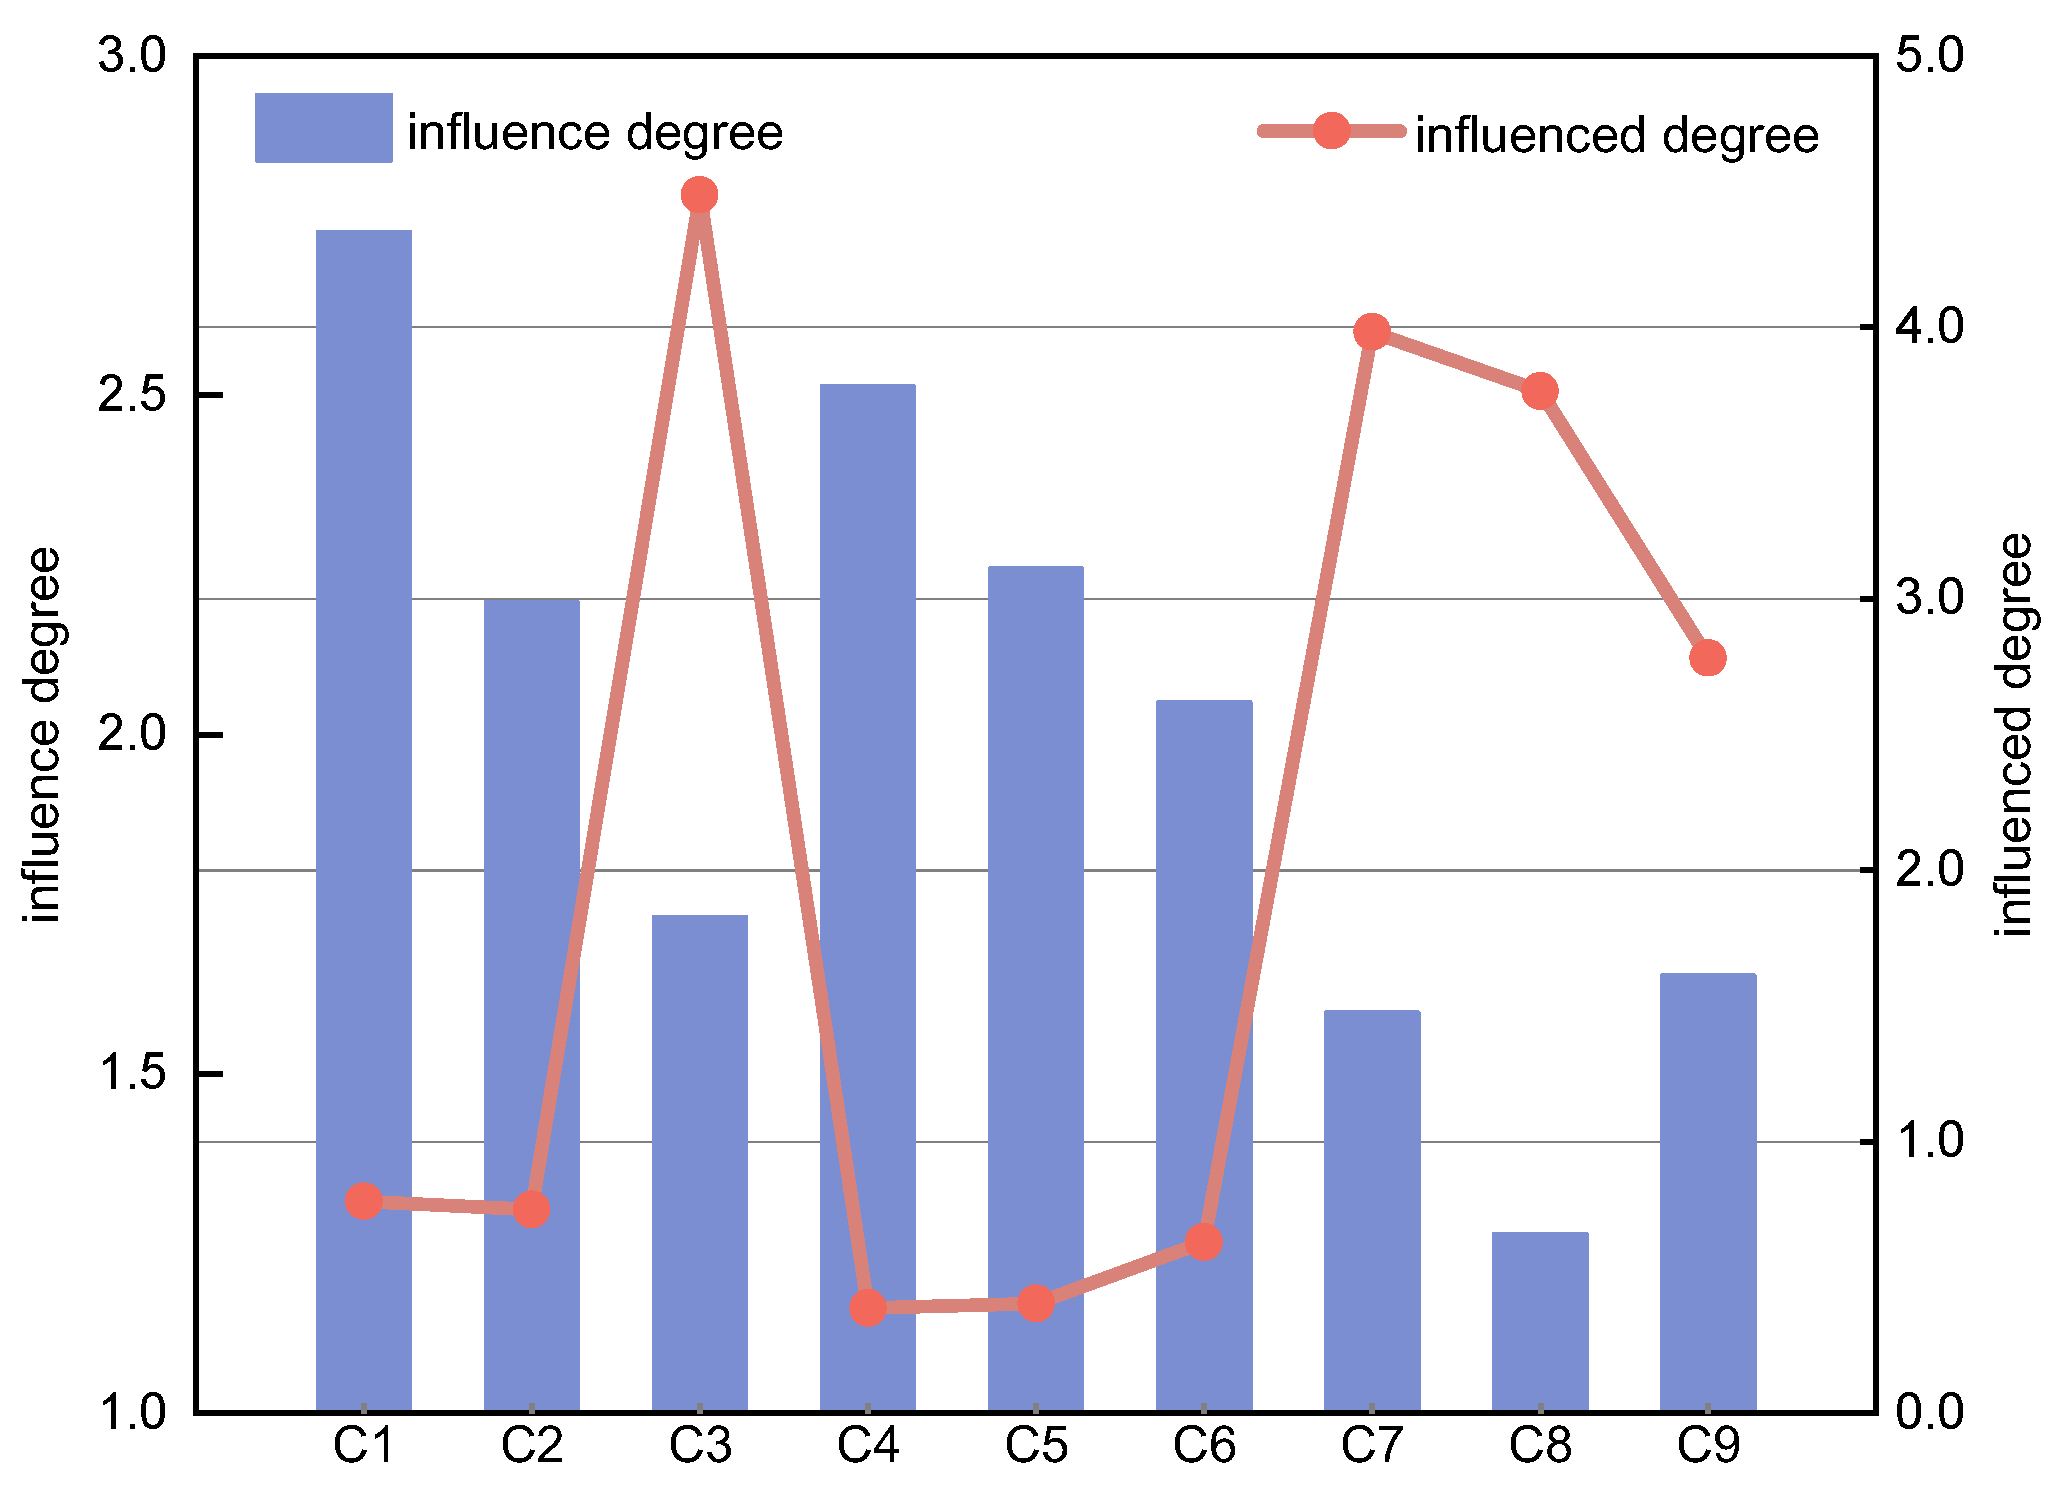
The influence degree Di is defined as the sum of the elements in the row vector of the total influence matrix, representing the extent to which a given factor may affect other factors. Based on Table 6, a diagram of the influence and influenced degrees for each factor is plotted (Figure 3). As shown in Figure 3, the influence degrees of “rainfall intensity C1,” “ground elevation C4,” “road gradient C5,” and “rainfall duration C2” are 2.74, 2.51, 2.24, and 2.20, respectively. These factors exhibit relatively high influence degrees and can be regarded as upstream elements in the system. They not only serve as preconditions for the occurrence of disasters but also amplify the risks and consequences of tunnel waterlogging events. Therefore, the design standards and emergency response plans for tunnels should be formulated with full consideration of such indicators.
The influenced degree Ci is obtained by summing the elements of the column vector in the total influence matrix, representing the extent to which a given factor is affected by other factors. As shown in Figure 3, the influenced degrees of “inundation depth C3,” “tunnel drainage capacity C7,” “emergency flood control measures C8,” and “degree of infrastructure aging C9” are 4.49, 3.98, 3.76, and 2.78, respectively. These indicators determine the extent of water accumulation after floodwaters enter the tunnel, whether the water can be discharged promptly, whether emergency measures can be initiated in time, and whether the infrastructure can respond effectively.

4.2. Central Degree and Cause Degree

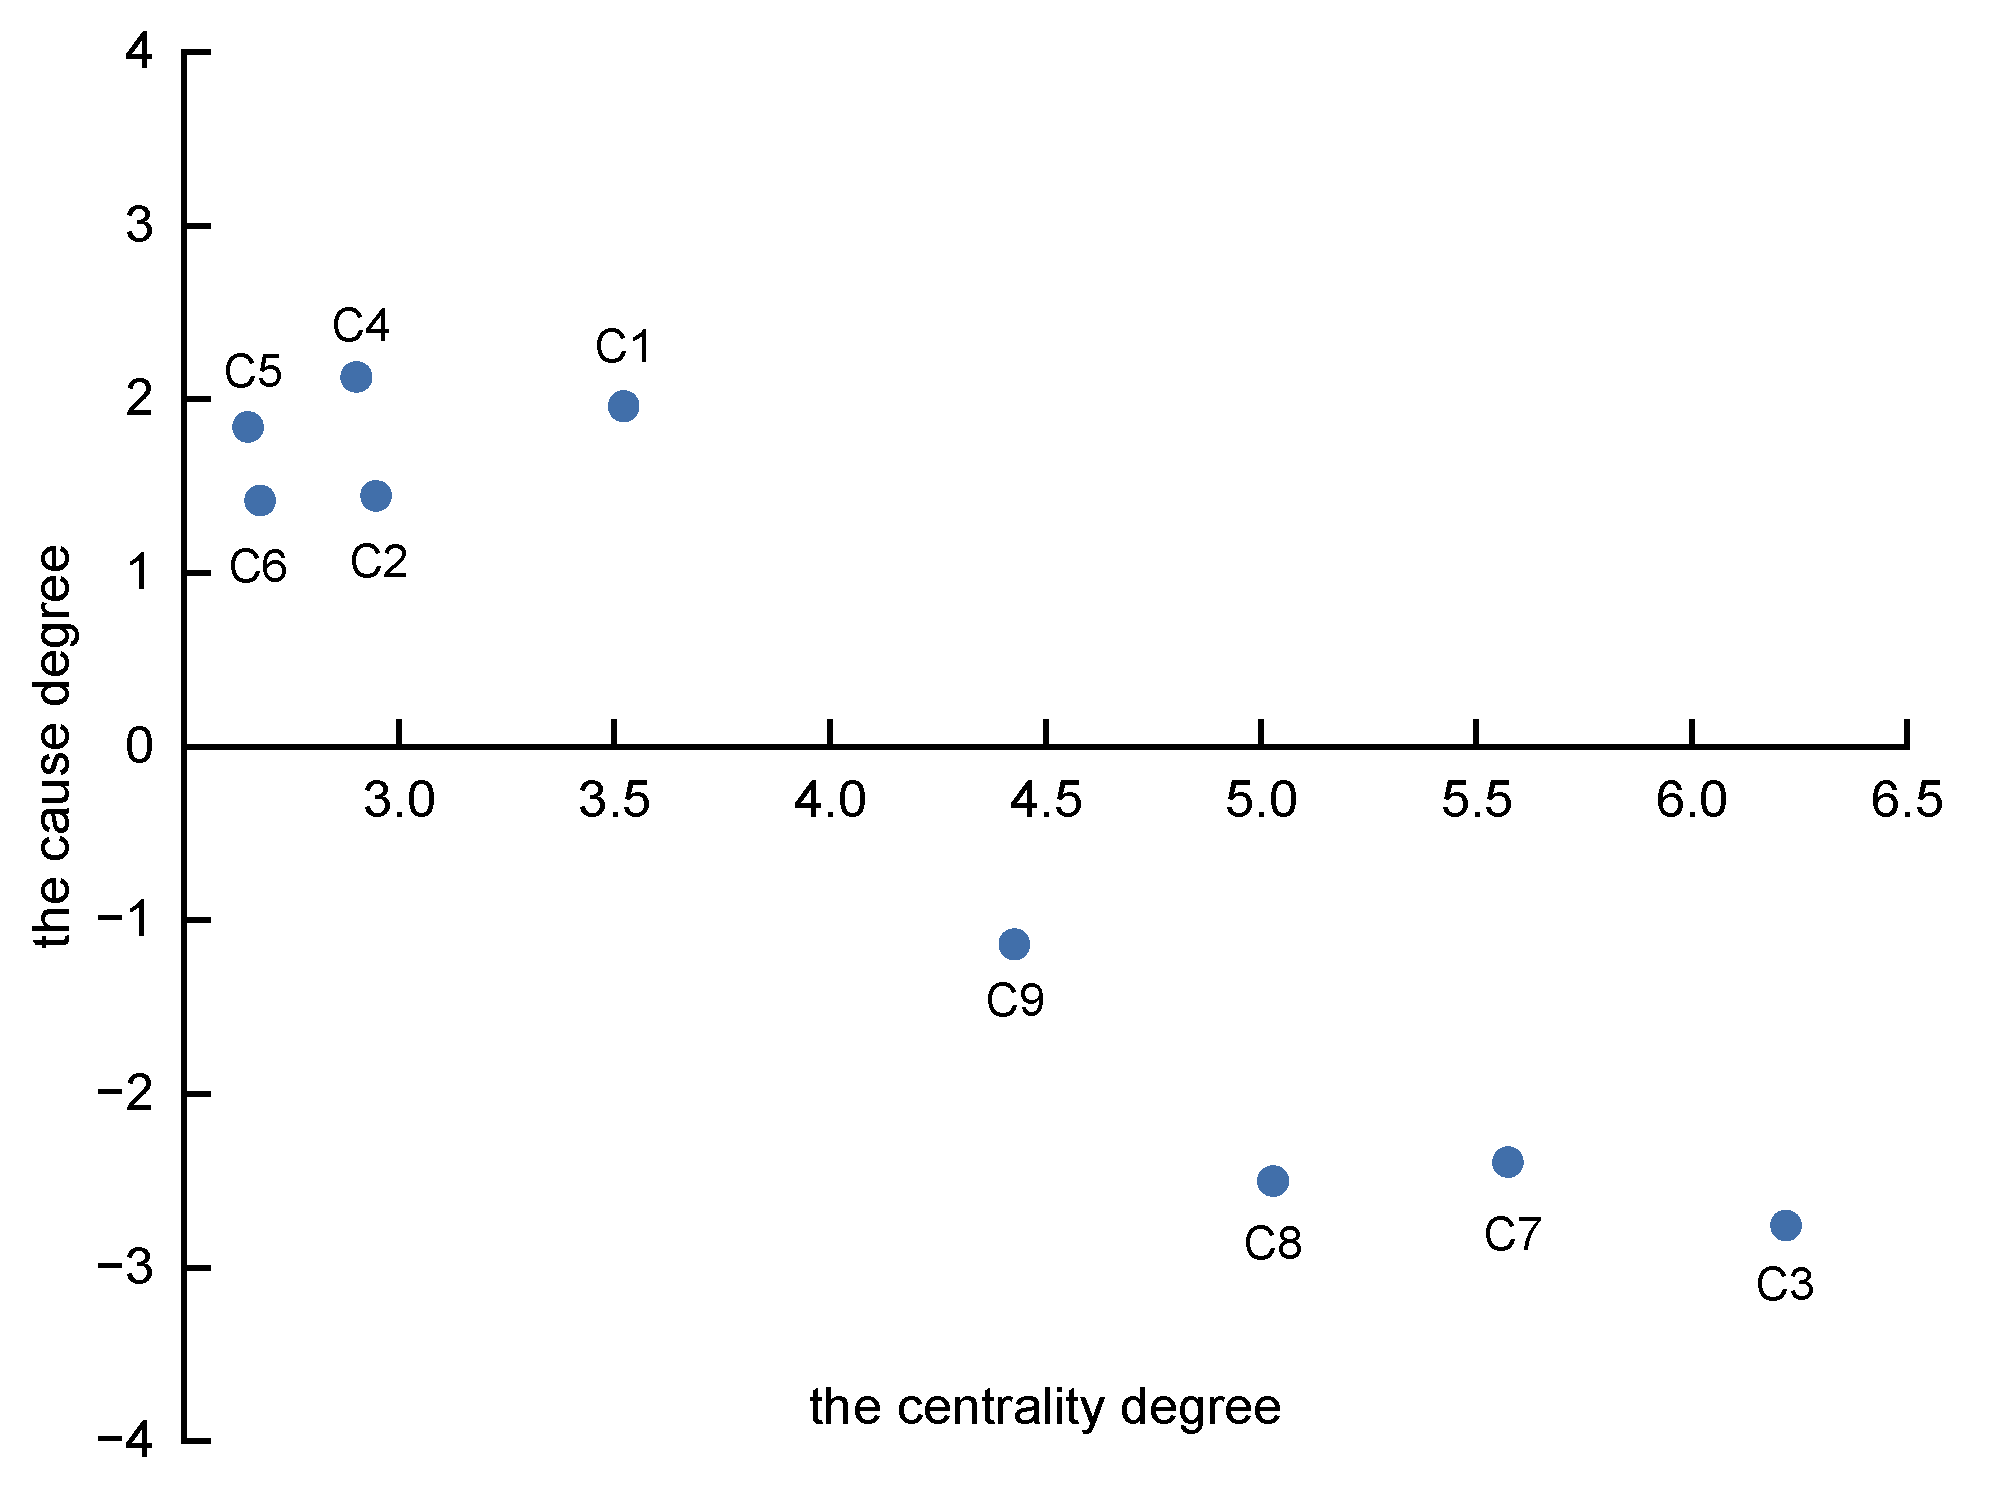
Based on the data presented in Table 6, a visual analysis chart of tunnel waterlogging hazards was constructed, with centrality on the horizontal axis and causality degree on the vertical axis (Figure 4). The factors “rainfall intensity,” “rainfall duration C2,” “ground elevation C4,” “road gradient,” and “impervious surface” exhibit positive causality degrees and relatively low centrality values and are therefore categorized as causal factors. During extreme weather events in urban areas, these causal factors—acting as exogenous variables—serve as the primary drivers of waterlogging incidents. Moreover, their relatively low levels of interaction with other factors suggest a degree of independence within the system.
“Inundation depth,” “tunnel drainage capacity,” “emergency flood control measures,” and “infrastructure aging” exhibit low causality degrees and high centrality values, and are therefore classified as result factors. These indicators determine the extent of damage and the recovery capacity of tunnels under flood impact. In the progression of tunnel waterlogging disasters, result factors play a significant role in shaping post-disaster outcomes. Consequently, it is essential to implement improvement measures that target these indicators. However, rather than directly optimizing result factors, their adverse effects can be mitigated indirectly by managing the causal factors.

5. Discussion

This study focuses on the primary threat factors associated with tunnel waterlogging incidents. A set of tunnel flood risk factors was established using expert surveys, and the DEMATEL method was employed to conduct a visual matrix analysis, identifying the influence of nine key factors contributing to tunnel waterlogging disasters. The main conclusions are as follows:
(1)
Extreme rainfall represents the primary trigger of tunnel flooding. The formation of a hazard-prone environment within the tunnel area can further amplify the risk of rainfall-induced flooding. Moreover, the tunnel’s exposure and its flood protection capacity directly determine the severity of post-disaster losses. Causal factors such as rainfall intensity, rainfall duration, ground elevation, and road gradient serve as driving forces in the formation of tunnel waterlogging disasters. In contrast, result factors such as water accumulation depth, tunnel drainage capacity, and emergency flood control measures are closely associated with the post-flood severity. According to the evaluation results, improving tunnel flood resilience does not necessarily require the direct enhancement of drainage capacity. Instead, resilience can be effectively improved during the design phase by anticipating rainfall intensity, adjusting ground elevation, and modifying road gradients (e.g., by incorporating reverse slopes at tunnel entrances).
(2)
The influence matrix in DEMATEL relies on expert judgment, which introduces subjectivity and potential bias into the analysis of tunnel flooding risks. When multiple factors are strongly correlated, the DEMATEL analysis may amplify or attenuate causal relationships, making it unsuitable for deriving precise conclusions regarding tunnel flood mitigation capability. Therefore, future research should be based on hydrological experiments and numerical simulations to analyze the dynamic evolution of tunnel flooding and to derive the quantitative influence of risk indicators.

Author Contributions

Conceptualization, Y.F. and Y.Z. (Yanmei Zhang); methodology, Y.F.; funding acquisition, Y.Z. (Yanmei Zhang); project administration, Y.Z. (Yanmei Zhang); visualization, Y.F.; validation, Y.F., Y.Z. (Yanmei Zhang), Y.Z. (Yanchang Zhu), Y.T., R.Z., and Q.W.; writing—review and editing, Y.F. and Y.Z. (Yanmei Zhang). All authors have read and agreed to the published version of the manuscript.

Funding

This research received no external funding.

Data Availability Statement

The data presented in this study are available on request from the corresponding author because during the preparation of this paper, the collaborating experts were engaged in a confidential tunnel project. The data access is jointly controlled by both parties, and its use requires approval from the cooperating unit.

Conflicts of Interest

The remaining authors declare that the research was conducted in the absence of any commercial or financial relationships that could be construed as potential conflicts of interest.

References

  1. Gharakhanlou, N.M.; Perez, L. Flood susceptible prediction through the use of geospatial variables and machine learning methods. J. Hydrol. 2023, 617, 129121. [Google Scholar] [CrossRef]
  2. Xu, K.; Zhuang, Y.; Bin, L.; Wang, C.; Tian, F. Impact assessment of climate change on compound flooding in a coastal city. J. Hydrol. 2023, 617, 129166. [Google Scholar] [CrossRef]
  3. Alabbad, Y.; Yildirim, E.; Demir, I. A web-based analytical urban flood damage and loss estimation framework. Environ. Model. Softw. 2023, 163, 105670. [Google Scholar] [CrossRef]
  4. Pariartha, I.G.S.; Aggarwal, S.; Rallapalli, S.; Egodawatta, P.; McGree, J.; Goonetilleke, A. Compounding effects of urbanization, climate change and sea-level rise on monetary projections of flood damage. J. Hydrol. 2023, 620, 129535. [Google Scholar] [CrossRef]
  5. Ma, C.; Qi, W.; Xu, H.; Zhao, K. An integrated quantitative framework to assess the impacts of disaster-inducing factors on causing urban flood. Nat. Hazards 2022, 113, 1903–1924. [Google Scholar] [CrossRef]
  6. He, R.; Tiong, R.L.; Yuan, Y.; Zhang, L. Enhancing resilience of urban underground space under floods: Current status and future directions. Tunn. Undergr. Space Technol. 2024, 147, 105674. [Google Scholar] [CrossRef]
  7. Chen, F.; Liu, S. Research Prospect on Some Scientific and Technological Problems of Water Disaster Prevention and Control in Urban Underground Space. J. Chang. River Sci. Res. Inst. 2024, 41, 90. [Google Scholar]
  8. Zhao, C.; Wang, J.; Zhang, Y.; Zhang, B. Review of the characteristics, causes and governance of urban flood in China. J. Catastrophol. 2023, 38, 220–228. [Google Scholar]
  9. Dong, B.; Xia, J.; Li, Q.; Zhou, M. Risk assessment for people and vehicles in an extreme urban flood: Case study of the “7.20” flood event in Zhengzhou, China. Int. J. Disaster Risk Reduct. 2022, 80, 103205. [Google Scholar] [CrossRef]
  10. Pant, R.; Thacker, S.; Hall, J.; Alderson, D.; Barr, S. Critical infrastructure impact assessment due to flood exposure. J. Flood Risk Manag. 2018, 11, 22–33. [Google Scholar] [CrossRef]
  11. Lyu, H.-M.; Shen, S.-L.; Zhou, A.; Yang, J. Perspectives for flood risk assessment and management for mega-city metro system. Tunn. Undergr. Space Technol. 2019, 84, 31–44. [Google Scholar] [CrossRef]
  12. Wu, J.; Fang, W.; Hu, Z.; Hong, B. Application of Bayesian approach to dynamic assessment of flood in urban underground spaces. Water 2018, 10, 1112. [Google Scholar] [CrossRef]
  13. Li, Z.; Su, H.; Li, Z.; Du, Y. Risk coupling effects on flood-induced hazards in urban underground spaces. Nat. Hazards 2025, 121, 8541–8563. [Google Scholar] [CrossRef]
  14. O’DOnnell, E.C.; Thorne, C.R. Drivers of future urban flood risk. Philos. Trans. R. Soc. A 2020, 378, 20190216. [Google Scholar] [CrossRef] [PubMed]
  15. Pathan, A.I.; Agnihotri, P.G.; Said, S.; Patel, D. AHP and TOPSIS based flood risk assessment-a case study of the Navsari City, Gujarat, India. Environ. Monit. Assess. 2022, 194, 509. [Google Scholar] [CrossRef]
  16. Rafiei-Sardooi, E.; Azareh, A.; Choubin, B.; Mosavi, A.H.; Clague, J.J. Evaluating urban flood risk using hybrid method of TOPSIS and machine learning. Int. J. Disaster Risk Reduct. 2021, 66, 102614. [Google Scholar] [CrossRef]
  17. Wei, L.; Hu, K.-H.; Hu, X.-D. Rainfall occurrence and its relation to flood damage in China from 2000 to 2015. J. Mt. Sci. 2018, 15, 2492–2504. [Google Scholar] [CrossRef]
  18. Anni, A.H.; Cohen, S.; Praskievicz, S. Sensitivity of urban flood simulations to stormwater infrastructure and soil infiltration. J. Hydrol. 2020, 588, 125028. [Google Scholar] [CrossRef]
  19. Sohn, W.; Brody, S.D.; Kim, J.-H.; Li, M.-H. How effective are drainage systems in mitigating flood losses? Cities 2020, 107, 102917. [Google Scholar] [CrossRef]
  20. Wang, L.; Cui, S.; Li, Y.; Huang, H.; Manandhar, B.; Nitivattananon, V.; Fang, X.; Huang, W. A review of the flood management: From flood control to flood resilience. Heliyon 2022, 8, e11763. [Google Scholar] [CrossRef]
  21. Xian, S.; Lin, N.; Kunreuther, H. Optimal house elevation for reducing flood-related losses. J. Hydrol. 2017, 548, 63–74. [Google Scholar] [CrossRef]
  22. Xue, P.; Huang, S.; Xie, K.; Sun, Y.; Fei, L. Identification of the critical factors in flood vulnerability assessment based on an improved DEMATEL method under uncertain environments. Int. J. Disaster Risk Reduct. 2024, 100, 104217. [Google Scholar] [CrossRef]
  23. Chen, F.; Liu, S.; Liu, W. Causes and characteristics of flooding in urban underground space. J. Chang. River Sci. Res. Inst. 2018, 35, 38. [Google Scholar]
  24. Yang, K.; Huang, G.Z.; Zhang, L.; Song, Z.; Li, H.X.; Gao, X.H. Analysis of influencing factors of subway system vulnerability under rainstorm conditions based on DEMATEL-AHDT. Water Resour. Hydropower Eng. 2023, 54, 22–33. [Google Scholar]
  25. Wang, Y.; Li, S.; Hu, C.; Ren, J.; Liu, P.; Zhao, C.; Zhu, M. Analysis of Surface Runoff in Zhengzhou City Under Extreme Rainfall Conditions. Water Resour. Power 2024, 42, 8–10. [Google Scholar]
  26. Zhong, J.; Li, D.; Jiang, K. Assessment of urban underground spaces inundation during extreme rainfall events. Water Sci. Technol. 2024, 89, 2851–2866. [Google Scholar] [CrossRef]
  27. Xiao, Z.; Gao, Q.; Hou, X.; Ma, M.; Hu, B.; Song, W.; Jia, L. Rainstorm waterlogging vulnerability assessment of subway stations in the central area of Tianjin. Hydrol. Sci. J. 2023, 68, 2277–2297. [Google Scholar] [CrossRef]
  28. Salman, A.M.; Li, Y. Flood risk assessment, future trend modeling, and risk communication: A review of ongoing research. Nat. Hazards Rev. 2018, 19, 04018011. [Google Scholar] [CrossRef]
  29. Hou, X.; Gao, Q.; Xiao, Z.; Ma, M.; Liu, B.; Hu, B.; Jia, L.; Song, W. Rainstorm Flood Risk Assessment of Urban Metro System in Different Operating Periods: A Case Study of the Central Urban Area of Tianjin, China. Nat. Hazards Rev. 2018, 19, 04018011. [Google Scholar] [CrossRef]
  30. Liu, J.; Zheng, W.; Chen, J.; Zhao, J. Evaluation of Rainstorm Waterlogging Emergency Response Capability of Subway Station for Trio Spaces. J. Catastrophol. 2024, 39, 172–176. [Google Scholar]
  31. Sun, Y.H.; Han, W.; Duan, W.C. Review on research progress of DEMATEL algorithm for complex systems. Control Decis. 2017, 32, 385–392. [Google Scholar]
  32. Li, J.; Zhao, J.; Li, Y.; Zhang, Y.; Zhang, S. Risk assessment of urban work safety based on regional disaster system theory. J. Saf. Sci. Technol. 2025, 21, 23–30. [Google Scholar]
  33. Du, Y.-W.; Zhou, W. New improved DEMATEL method based on both subjective experience and objective data. Eng. Appl. Artif. Intell. 2019, 83, 57–71. [Google Scholar] [CrossRef]
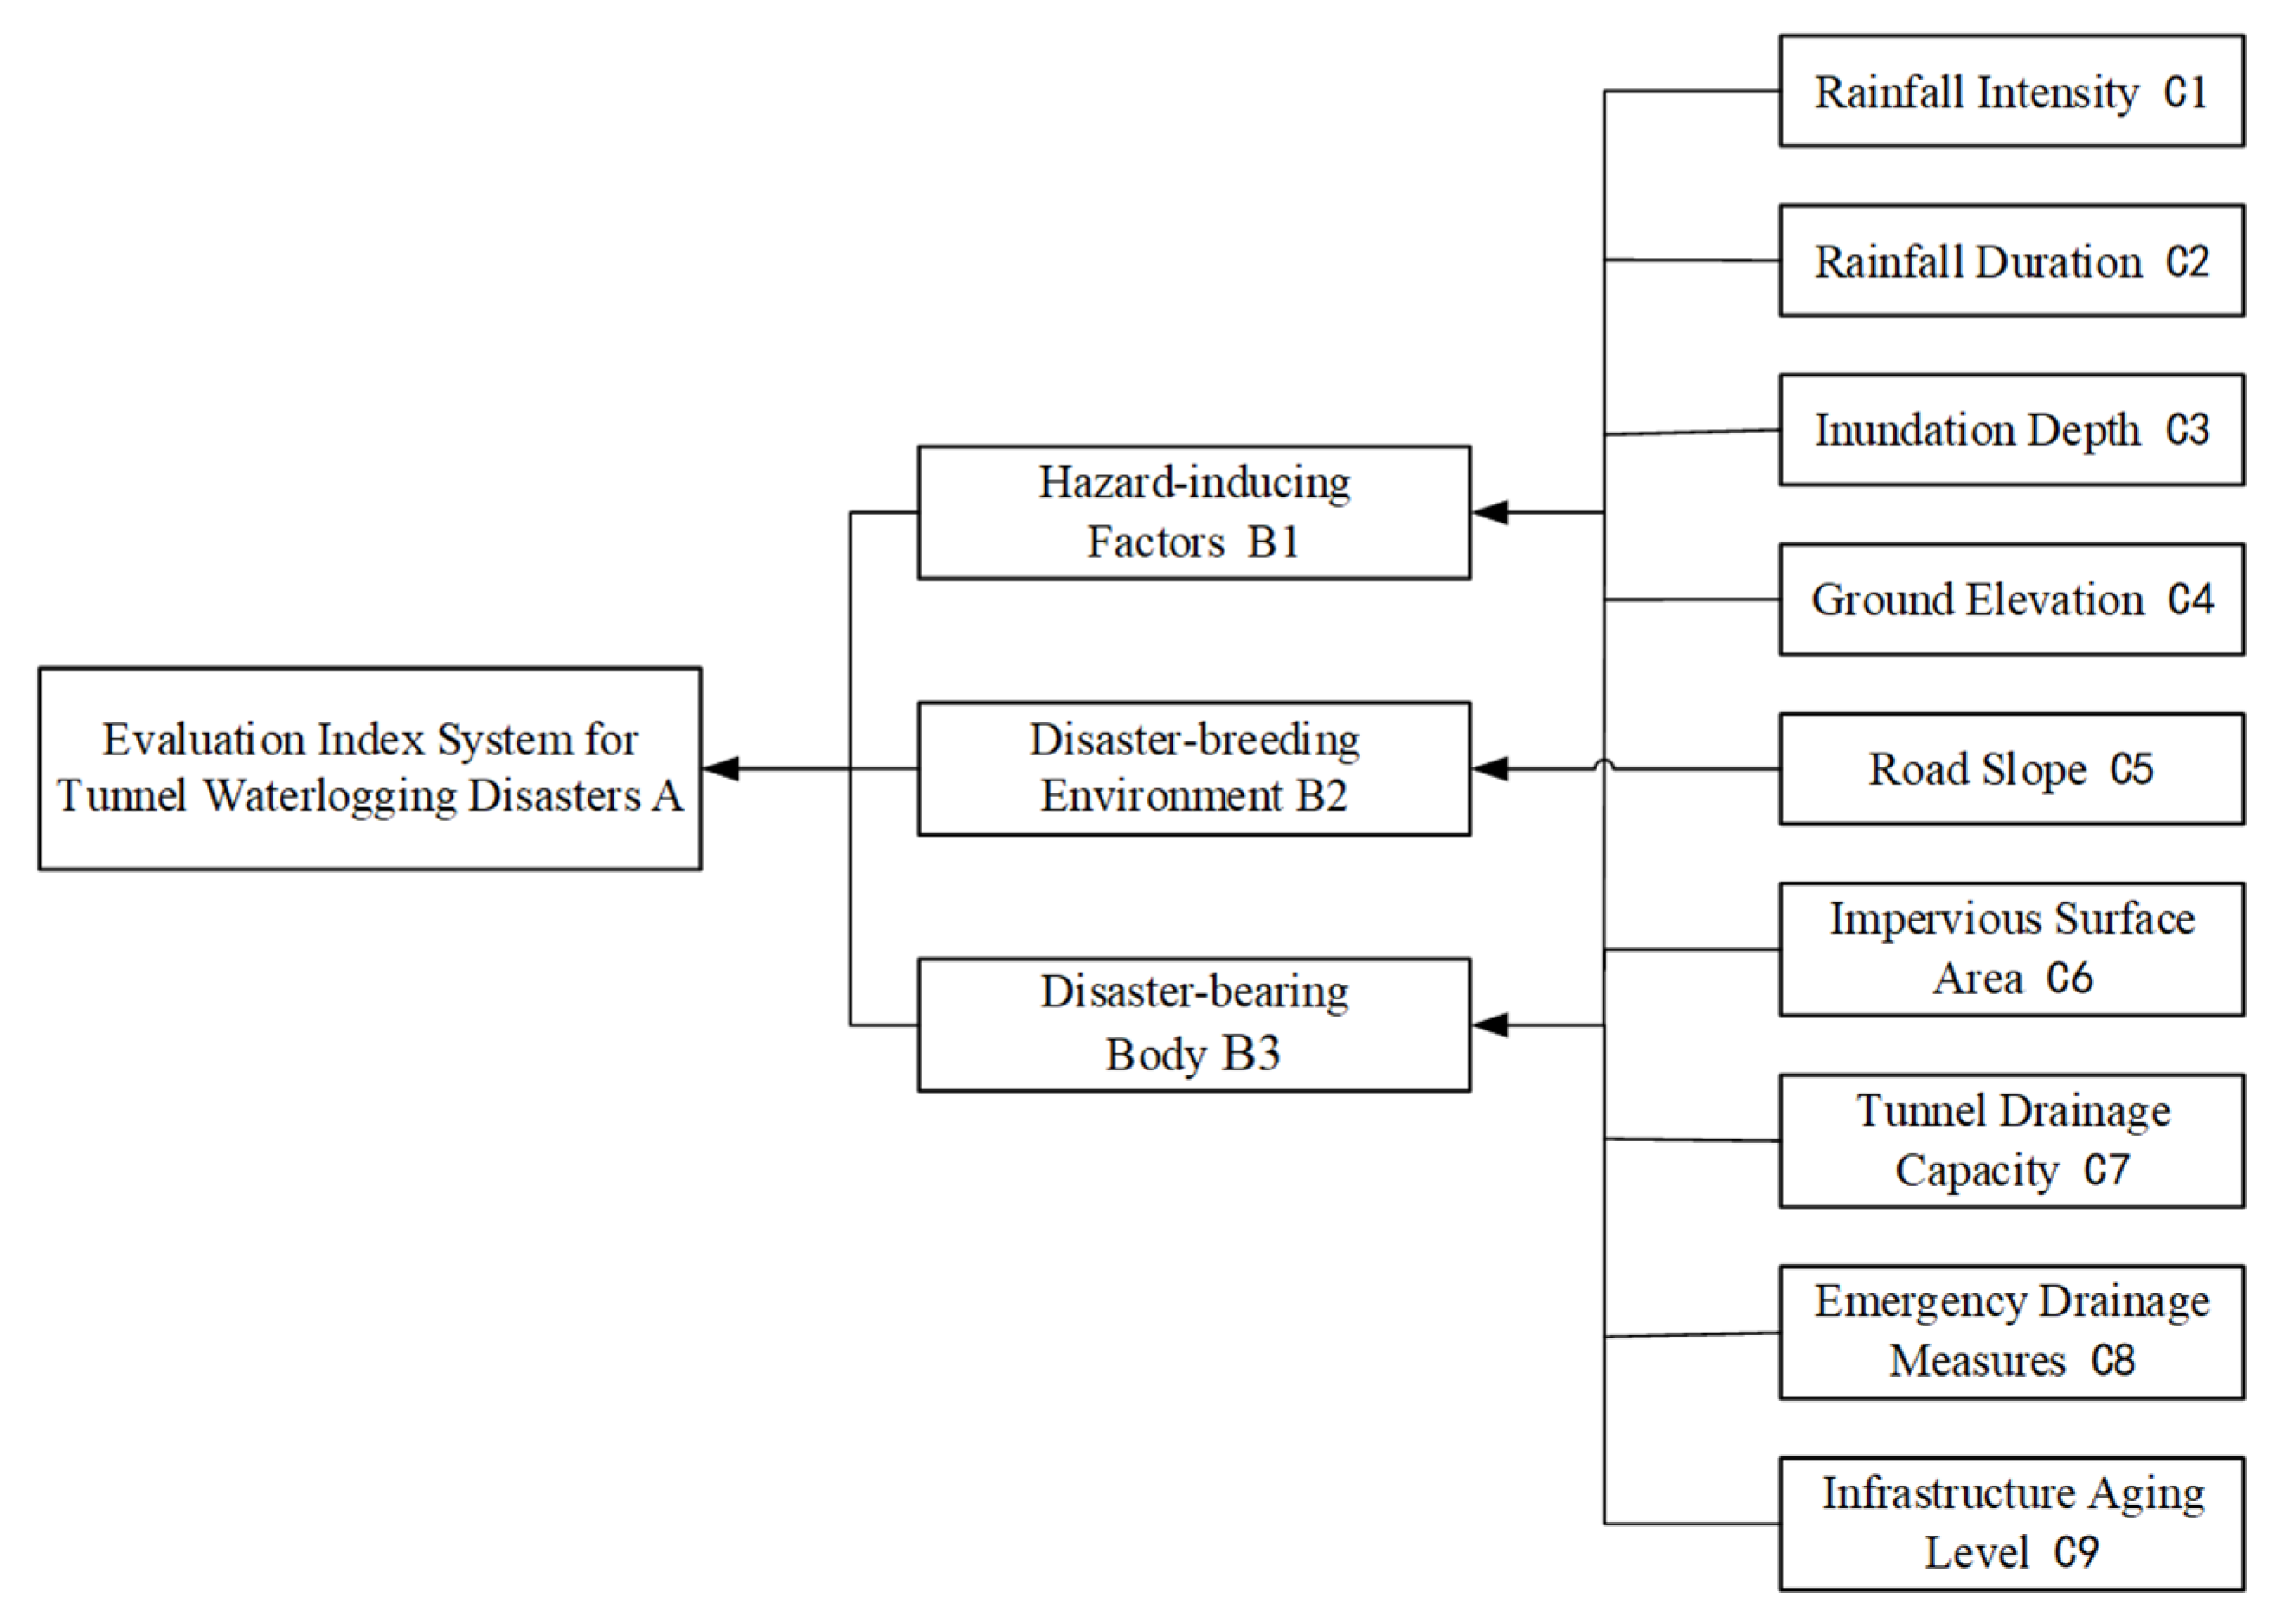
Figure 1. Assessment index system and data sources for tunnel flooding disasters in Qingdao.
Water 17 02694 g001
Figure 2. Heatmap of the comprehensive impact matrix (rainfall intensity C1, rainfall duration C2, inundation depth C3, ground elevation C4, road gradient C5, impervious surface area C6, tunnel drainage capacity C7, emergency flood control measures C8, degree of infrastructure aging C9).
Water 17 02694 g002
Figure 3. Influence and influenced degree of tunnel waterlogging hazard indicators (rainfall intensity C1, rainfall duration C2, inundation depth C3, ground elevation C4, road gradient C5, impervious surface area C6, tunnel drainage capacity C7, emergency flood control measures C8, degree of infrastructure aging C9).
Water 17 02694 g003
Figure 4. Centrality and causality degree analysis of tunnel waterlogging hazard indicators (rainfall intensity C1, rainfall duration C2, inundation depth C3, ground elevation C4, road gradient C5, impervious surface area C6, tunnel drainage capacity C7, emergency flood control measures C8, degree of infrastructure aging C9).
Water 17 02694 g004
Table 1. Basis for selection of tunnel flood risk assessment factors.
FactorsDefinition CriteriaStandards ReferencedReferenced
Literature
Rainfall Intensity C124 h Cumulative Rainfall (mm)
Heavy rain: 50–99.9 mm
Torrential rain: 100–249.9 mm
Extreme torrential rain: ≥250 mm
GB/T 28592-2012[14,22,23,24,25]
Rainfall Duration C2Rainfall duration refers to the time from the beginning to the end of a rainfall event. It is generally determined by the catchment area of the drainage facility and typically ranges from 3 to 24 hours.GB/T 28592-2012[14,22,26]
Inundation Depth C3Low risk: less than 27 cm
Moderate risk: 27–40 cm
High risk: 40–60 cm
Very high risk: greater than 60 cm
GB 51222-2017[22,23,26,27]
Ground Elevation C4Tunnel elevation is related to the configuration of drainage pathways. In principle, drainage design follows the concept of “high-level water drains at high points, low-level water drains at low points,” utilizing natural ground elevation to achieve gravity-driven outflow.GB50015-2019 [23,27,28,29,30]
Road Gradient C5The longitudinal slope of the road should be no less than 0.3%. The typical range for road cross-slope is 1.5% to 2.0%, and the shoulder cross-slope may be designed to be 1.0% steeper than the main roadway surface.CJJ 83-2016
CJJ 37-2012
[25]
Impervious Surface Area C6Impervious surfaces are unable to absorb or retain rainfall, making it easier for precipitation to generate surface runoff. The proportion of rainfall that becomes runoff is typically characterized by the runoff coefficient.GB50015-2019[14,23,25]
Tunnel Drainage Capacity C7The ability of a tunnel entrance to effectively intercept inflowing water and ensure smooth drainage, as well as the degree of connectivity between internal and external drainage systems.JTG/T 3660—2020[24,27]
Emergency Flood Control Measures C8In the event of a flood disaster, a rapid response capability is essential to implement predefined emergency plans and ensure the operational safety and accessibility of the tunnel.CJJ 68-2016[23,24,26,30]
Degree of Infrastructure Aging C9Over time, pipelines may deteriorate due to blockages, structural cracks, or corrosion, leading to a marked decline in drainage performance.GB 55027[14,23,28]
Table 2. Grading basis.
Scale ValueDegree of Importance
1ai has extremely low influence on aj
2ai has relatively low influence on aj
3ai has a moderate influence on aj
4ai has relatively high influence on aj
5ai has an extremely high influence on aj
0no influence
Table 3. Kendall’s coefficient of concordance (W).
Total37
Kendall’s W0.811
Asymptotic Significance0.5
Table 4. Direct influence matrix (rainfall intensity C1, rainfall duration C2, inundation depth C3, ground elevation C4, road gradient C5, impervious surface area C6, tunnel drainage capacity C7, emergency flood control measures C8, degree of infrastructure aging C9).
M9×9C1C2C3C4C5C6C7C8C9
C103029331282514
C226022001192014
C3320222273120
C4141327022220133
C522262009211213
C61292422024168
C7003400402618
C8002800017018
C9002411932160
Table 5. Normalized direct influence matrix (rainfall intensity C1, rainfall duration C2, inundation depth C3, ground elevation C4, road gradient C5, impervious surface area C6, tunnel drainage capacity C7, emergency flood control measures C8, degree of infrastructure aging C9).
N9×9C1C2C3C4C5C6C7C8C9
C10.00 0.23 0.22 0.02 0.02 0.01 0.21 0.19 0.11
C20.20 0.00 0.17 0.00 0.00 0.01 0.14 0.15 0.11
C30.02 0.02 0.00 0.02 0.02 0.02 0.20 0.23 0.15
C40.11 0.10 0.20 0.00 0.17 0.02 0.15 0.10 0.02
C50.02 0.02 0.20 0.15 0.00 0.07 0.16 0.09 0.10
C60.09 0.07 0.18 0.02 0.02 0.00 0.18 0.12 0.06
C70.00 0.00 0.26 0.00 0.00 0.03 0.00 0.20 0.14
C80.00 0.00 0.21 0.00 0.00 0.00 0.13 0.00 0.14
C90.00 0.00 0.18 0.01 0.01 0.07 0.24 0.12 0.00
Table 6. Comprehensive impact matrix (rainfall intensity C1, rainfall duration C2, inundation depth C3, ground elevation C4, road gradient C5, impervious surface area C6, tunnel drainage capacity C7, emergency flood control measures C8, degree of infrastructure aging C9).
T9×9C1C2C3C4C5C6C7C8C9
C10.08 0.26 0.66 0.05 0.05 0.07 0.60 0.58 0.41
C20.23 0.07 0.52 0.02 0.02 0.06 0.47 0.47 0.35
C30.05 0.04 0.31 0.03 0.03 0.06 0.44 0.46 0.33
C40.16 0.16 0.61 0.04 0.19 0.08 0.51 0.46 0.30
C50.07 0.06 0.56 0.17 0.04 0.12 0.48 0.41 0.33
C60.13 0.11 0.51 0.03 0.03 0.05 0.47 0.42 0.29
C70.02 0.02 0.49 0.01 0.01 0.07 0.25 0.41 0.31
C80.02 0.01 0.40 0.01 0.01 0.03 0.31 0.20 0.27
C90.03 0.02 0.44 0.02 0.02 0.10 0.46 0.36 0.19
Table 7. Factor influence assessment table (rainfall intensity C1, rainfall duration C2, inundation depth C3, ground elevation C4, road gradient C5, impervious surface area C6, tunnel drainage capacity C7, emergency flood control measures C8, degree of infrastructure aging C9).
FactorsInfluence Degree DiInfluenced Degree CiCentral Degree MiCause Degree Ri
C12.74 0.78 3.52 1.96
C22.20 0.75 2.95 1.44
C31.73 4.49 6.22 −2.76
C42.51 0.39 2.90 2.13
C52.24 0.41 2.65 1.84
C62.05 0.63 2.68 1.42
C71.59 3.98 5.57 −2.39
C81.26 3.76 5.03 −2.50
C91.65 2.78 4.43 −1.14
Disclaimer/Publisher’s Note: The statements, opinions and data contained in all publications are solely those of the individual author(s) and contributor(s) and not of MDPI and/or the editor(s). MDPI and/or the editor(s) disclaim responsibility for any injury to people or property resulting from any ideas, methods, instructions or products referred to in the content.