Article

Scour Control in a 90° Bend by Means of an Air Bubble Screen

by
Pari Maleki
1,2,
Javad Ahadiyan
1,2,*,
Rui Aleixo
3,
Hossein Azizi Nadian
4,*,
Zeinab Tamoradi
5,
Seyed Mahmood Kashefipour
1,2,
Anton J. Schleiss
6 and
Manouchehr Fathi Moghadam
1,2
1
Faculty of Water and Environmental Engineering, Shahid Chamran University of Ahvaz, Ahvaz 61357-83151, Iran
2
Center of Excellence of the Network Improvement and Maintenance, Ahvaz 61357-43311, Iran
3
Institute of Hydro-Engineering of the Polish Academy of Sciences, ul. Kościerska 7, 80-328 Gdańsk, Poland
4
Department of Civil Environmental Architectural Engineering and Mathematics, University of Brescia, 25121 Brescia, Italy
5
Department of Civil Engineering, Arak Branch, Islamic Azad University, Arak 14778-93855, Iran
6
Platform of Hydraulic Constructions (PL-LCH), Ecole Polytechnique Fédérale de Lausanne (EPFL), CH-1015 Lausanne, Switzerland
*
Authors to whom correspondence should be addressed.
Water 2025, 17(18), 2693; https://doi.org/10.3390/w17182693
Submission received: 17 July 2025 / Revised: 1 September 2025 / Accepted: 4 September 2025 / Published: 12 September 2025
(This article belongs to the Special Issue Numerical Modeling of Hydrodynamics and Sediment Transport)

Abstract

Scouring is an erosional process driven by the water motion over a sediment bed. Scour can lead to structural safety risks of built structures and to riverbanks’ instabilities and collapse. In particular, scouring in river bends is a known phenomenon caused by secondary flow currents. This scouring can result in negative impacts on the economic and social activities that occur on the riverbanks. On the other hand, the erosion and scouring processes of riverbeds are often addressed by means of heavy civil engineering construction works. Aiming at looking for different solutions for the scour in river bends, this research investigates the use of an air bubble screen system to minimize the scouring in river bends by providing detailed measurements of sedimentation patterns and velocity fields in a mild 90-degree bend where an air screen bubble was installed. The air bubble screen is generated by injecting compressed air through a perforated pipe placed on the bed along the outer bend. Different parameters were tested, including the water flow rate in the channel, the air flow rate, the angle of attack between the air bubble screen and the secondary flow, and flow direction. The air bubble screen opposes the direction of the bend’s induced secondary flows, altering the velocity pattern such that the maximum velocity at cross-sections of 45°, 65°, 80°, and 90° were displaced from the outer wall as much as 53%, 68%, 89%, and 84% of the width, respectively. The air bubble screen system also reduced the secondary flow power in the maximum scour zone by 35%. Hence, the maximum scour depth was reduced by 59% to 79.8% for the maximum flow rate by increasing the air bubbles’ angle of attack relative to the primary flow from 0° to 90°. Finally, the limitations of this study and its applicability to real cases is discussed.

1. Introduction

A single-thread meandering river has significantly different flow patterns from a straight trapezoidal channel. In a straight, uniform channel, the primary flow is downstream (streamwise direction). With no significant cross-stream, flow patterns present the motion is mostly parallel to the banks velocity is highest near the surface and center, slower near the bed and banks due to shear. When the river bends the centrifugal force on the moving water pushes it outward towards the outer bank, creating a cross-stream pressure gradient [1]. This means that the flow depth is slightly higher in the outer bank. Near the surface, the outward push of centrifugal force is stronger than the inward pull from the pressure gradient. On the other hand, close to the bed, the flow is slower, but the inward pressure gradient still acts, pushing the water toward the inner bank. The combination of these two motions near the surface and near the bed generates a rotational circulation in the cross-section, known as secondary current [2]. Figure 1a shows the secondary flow flowing transversely to the primary flow from the outer to the inner river bends. Figure 1b illustrates the secondary rotational flow forming due to the differential pressure across the river’s cross-section, resulting in the creation of a centripetal force. The secondary flow exerts shear stress on the riverbanks and bed, resulting in scouring on the outer bend, which is the removal of sediments from the meander outer bank by means of the flow. This is a natural and dynamic process that varies according to hydrodynamic, geotechnical, and geometrical conditions [2]. Outer bank scouring results from secondary downward, vertical flows close to the outer bend wall. Hence, local scouring reduces the slope stability of nearby river banks [3].
Because of the secondary rotational flow, the streamlines on the water surface are perpendicular to the flow from the inner to outer bend, but go from the outer to inner bend on the river bed. Knowing the flow pattern and scouring mechanisms are crucial when deciding how best to protect the river bed and banks [4], such as spur dikes, vanes, and ripraps, among others [5,6,7]. However, implementing structural measures in large, deep rivers can be costly, time-consuming, and may have undesired environmental consequences. In addition, methods like spur dikes can hinder safe navigation. Therefore, relatively low-cost measures that can be implemented quickly and safely are preferred [8].
The air bubble screen technique for scouring control generates a rising air bubble screen caused by a pressurized porous (perforated) tube on the bed. The bubble-impacted flow can counteract the downward vertical velocities associated with secondary flows. Moreover, secondary flow cells, such as those induced by air bubbles, efficiently redistribute the patterns of velocity and boundary shear stress [9]. Several studies [10,11] have shown the bubble technique to minimize local scour along a 193° bend.
Blanckaert and De Vriend [12] experimentally investigated the turbulence structure in one cross-section of a sharp open-channel bend. Their results showed that the downstream mean velocity increases towards the outer bend, and that maximum velocities occur in the lower part of the water column. In addition, the secondary flow power, i.e., the rate of work performed by the streamwise flow to maintain the secondary circulation is, in most outer bends, strongly reduced compared with the straight uniform flow. Blanckaert and Graf [13] investigated mean flow and turbulence in an open-channel bend. They showed that the outer bank cell and the reduced turbulent activity protect the outer bank and the adjacent bed, which limits an important driver behind the morphologic evolution of bends. Blanckaert [14] studied the varying bed topography and flow field in a channel with a 193° bend in an experimental study, which revealed the presence of a secondary flow towards the outer bend near the water surface but to the inner bend near the bed. Blanckaert and De Vriend [15] used nonlinear modeling for the mean flow redistribution in curved open channels to account for the feedback between the secondary circulation, the vertical distribution of the downstream velocity, and its width distribution. In addition, they showed that it can reproduce the velocity flattening and reduce downstream velocity with increasing curvature, typical of curved-channel flow. Vaghefi et al. [16] reported that the maximum secondary flow power occurs at the 45° cross-section in a 90° flume. Hence, they simulated the flow around a T-shaped spur dike with the SSIIM (Sediment Simulation In Intakes with Multiblock option) model with sediment simulation in the intakes with multiblock options. They concluded that this phenomenon occurs due to the cross of the streamlines and the outer bend wall. The method put forward by Shukry [17] is used here to determine the secondary flow power with the following equations:
S y z = K l a t e r a l K m a i n = V y z 2 / 2 g V 2 / 2 g V y z = v 2 + w 2 , V = u 2 + v 2 + w 2
where Syz is the dimensionless power of secondary flow, K is the kinetic energy, Vyz is the average velocity vector projected on the lateral and vertical planes; V is the mean cross-sectional velocity and u, v, w are the time average velocities in a plane.
Due to the displacement of the maximum velocity zone and the reduction in the lateral pressure gradient in the experiment with the air jet (bubble screen) system, the secondary flow power has decreased compared to the control experiment (without an air jet system). Decreasing bend scour with in-phase and out-of-same-phase hydraulic jets method in a 180° bend has been investigated by Tamoradi et al. [18]. They reported that the maximum scour depth shifts from the outer bend to the channel centerline. In another study, Tamoradi and Ahadiyan [8] showed that the maximum scour depth decreased by reducing the distance between the perforated tube and the outer wall.
Conceptually, the air bubble system along the outer bend creates a flow opposite to the direction of the secondary flow caused by the curvature that neutralizes it and reduces scouring in the outer wall of the bend. Tamoradi and Ahadiyan [19] did experiments with different injection discharges. Their results showed a reduction in scour depth in the main experiments compared to the reference tests. Dugué et al. [11] investigated the interplay between the air bubble screen, the bubble-induced secondary flow, the patterns of longitudinal flow, and the morphology in shallow flow depth. Also, the results showed the potential of the bubble screen technique to modify morphology in various applications in shallow rivers and open channels.
Using experimental and theoretical modeling, Abduo et al. [20] studied the counteracting of secondary flow in open channel bends. They simulated and predicted the velocity distribution in the channel bend using FLUENT with the k-ε turbulent model. Their results showed that the bubble screen system helps reducing the secondary flow’s downward movement and shift the core of maximum downstream velocities away from the outer bank. Champagne et al. [21] investigated the effect of air injection on reducing the scour of stilling basins. They reported that using that to reduce scouring was efficient and effective. Seyedashraf et al. [22] investigated the application of computational intelligence methods for complex two-phase flow pattern recognition. They found that the employed models were efficient to simulate the helical flow pattern in the strongly curved 60° bend. According to Rodi and Leschziner [23], a strongly curved bend is defined if R/b > 3 where R is the radius of the curvature, and b is the channel width. Tipireddy and Barkdoll [24] evaluated the optimal configuration of air injection to scour control around a cylindrical bridge pier. They experimented with clear water conditions with noncohesive sediment and air injected through a horizontal, semicircular air diffuser. These were placed on the upstream pier half at the level of the original sediment bed before scouring initiation. They determined the diffuser location, number, and size of ports previously to be optimal. Their findings showed that the scour had been reduced by 35% compared to the absence of an air jet injection system.
Tamoradi et al. [18] investigated the effect of spacings among the tube ports on the amount of the outer bank scour. The maximum scour depth decreased by increasing the spacings between tube ports. Tamoradi and Ahadiyan [8] investigated the effect of both the ports’ spacings and the bend’s outer wall distance on the outer bank scour in the 180° bend. Their findings showed that the maximum scour depth was reduced by decreasing the port’s spacing and distance between the outer wall and tube.
The air bubble screen can be considered as a recent technique to reduce scouring with the following advantages: (i) there is no need for an extra structure within the river [19]; (ii), the non-rigidity of the created barriers and tubes against the flow and their flexibility makes it less intrusive to the navigation system [18]. As disadvantages the following can be considered: (i) the need to have access to an air compressor, which requires a constant supply of energy; (ii) the placement of the perforated pipe in the bed, that will require some fixation points to keep it in place; (iii) the influence of sediment deposition and flora development in the structure that may affect the air bubbles flows; and (iv) the dependency of the flow conditions, as higher flow rates will lead to a inertia dominant role over bubble induced forces.
The bubble screen technique is a function of several variables, namely: the bubble screen cross angle, the air injection flow rate, the injection tube discharge, ports distance and diameter on the perforated tube, the distance of the perforated tube from the outer wall of the river bend, etc., may affect the capability of this technique for river bed and bank protection.
One of the open questions in this study is the definition of efficiency and the function of the air bubble screen’s angle—that is, how efficiency is defined. This study aims to clarify the role of the bubble screen’s incidence angle relative to the mainstream flow and the effect of the air injection flow rate in controlling scouring. The research was conducted through carefully designed and planned laboratory experiments.
The air bubble screen method has been applied to other hydraulic cases namely, to reduce the noise levels in aquatic environments [25] prevent the sea water intrusion into rivers [26], to remove plastics from rivers [27] and prototype case as described in the great bubble barrier [28]. Commercial solutions for air bubble screens are available [29,30,31].
A crucial issue of the air bubble screens is the need for energy to make the system work. A cost–benefit analysis should be carried out prior to the installation to assess the use of renewable energy sources, such as solar panels and batteries, to make the system work.

2. Materials and Methods

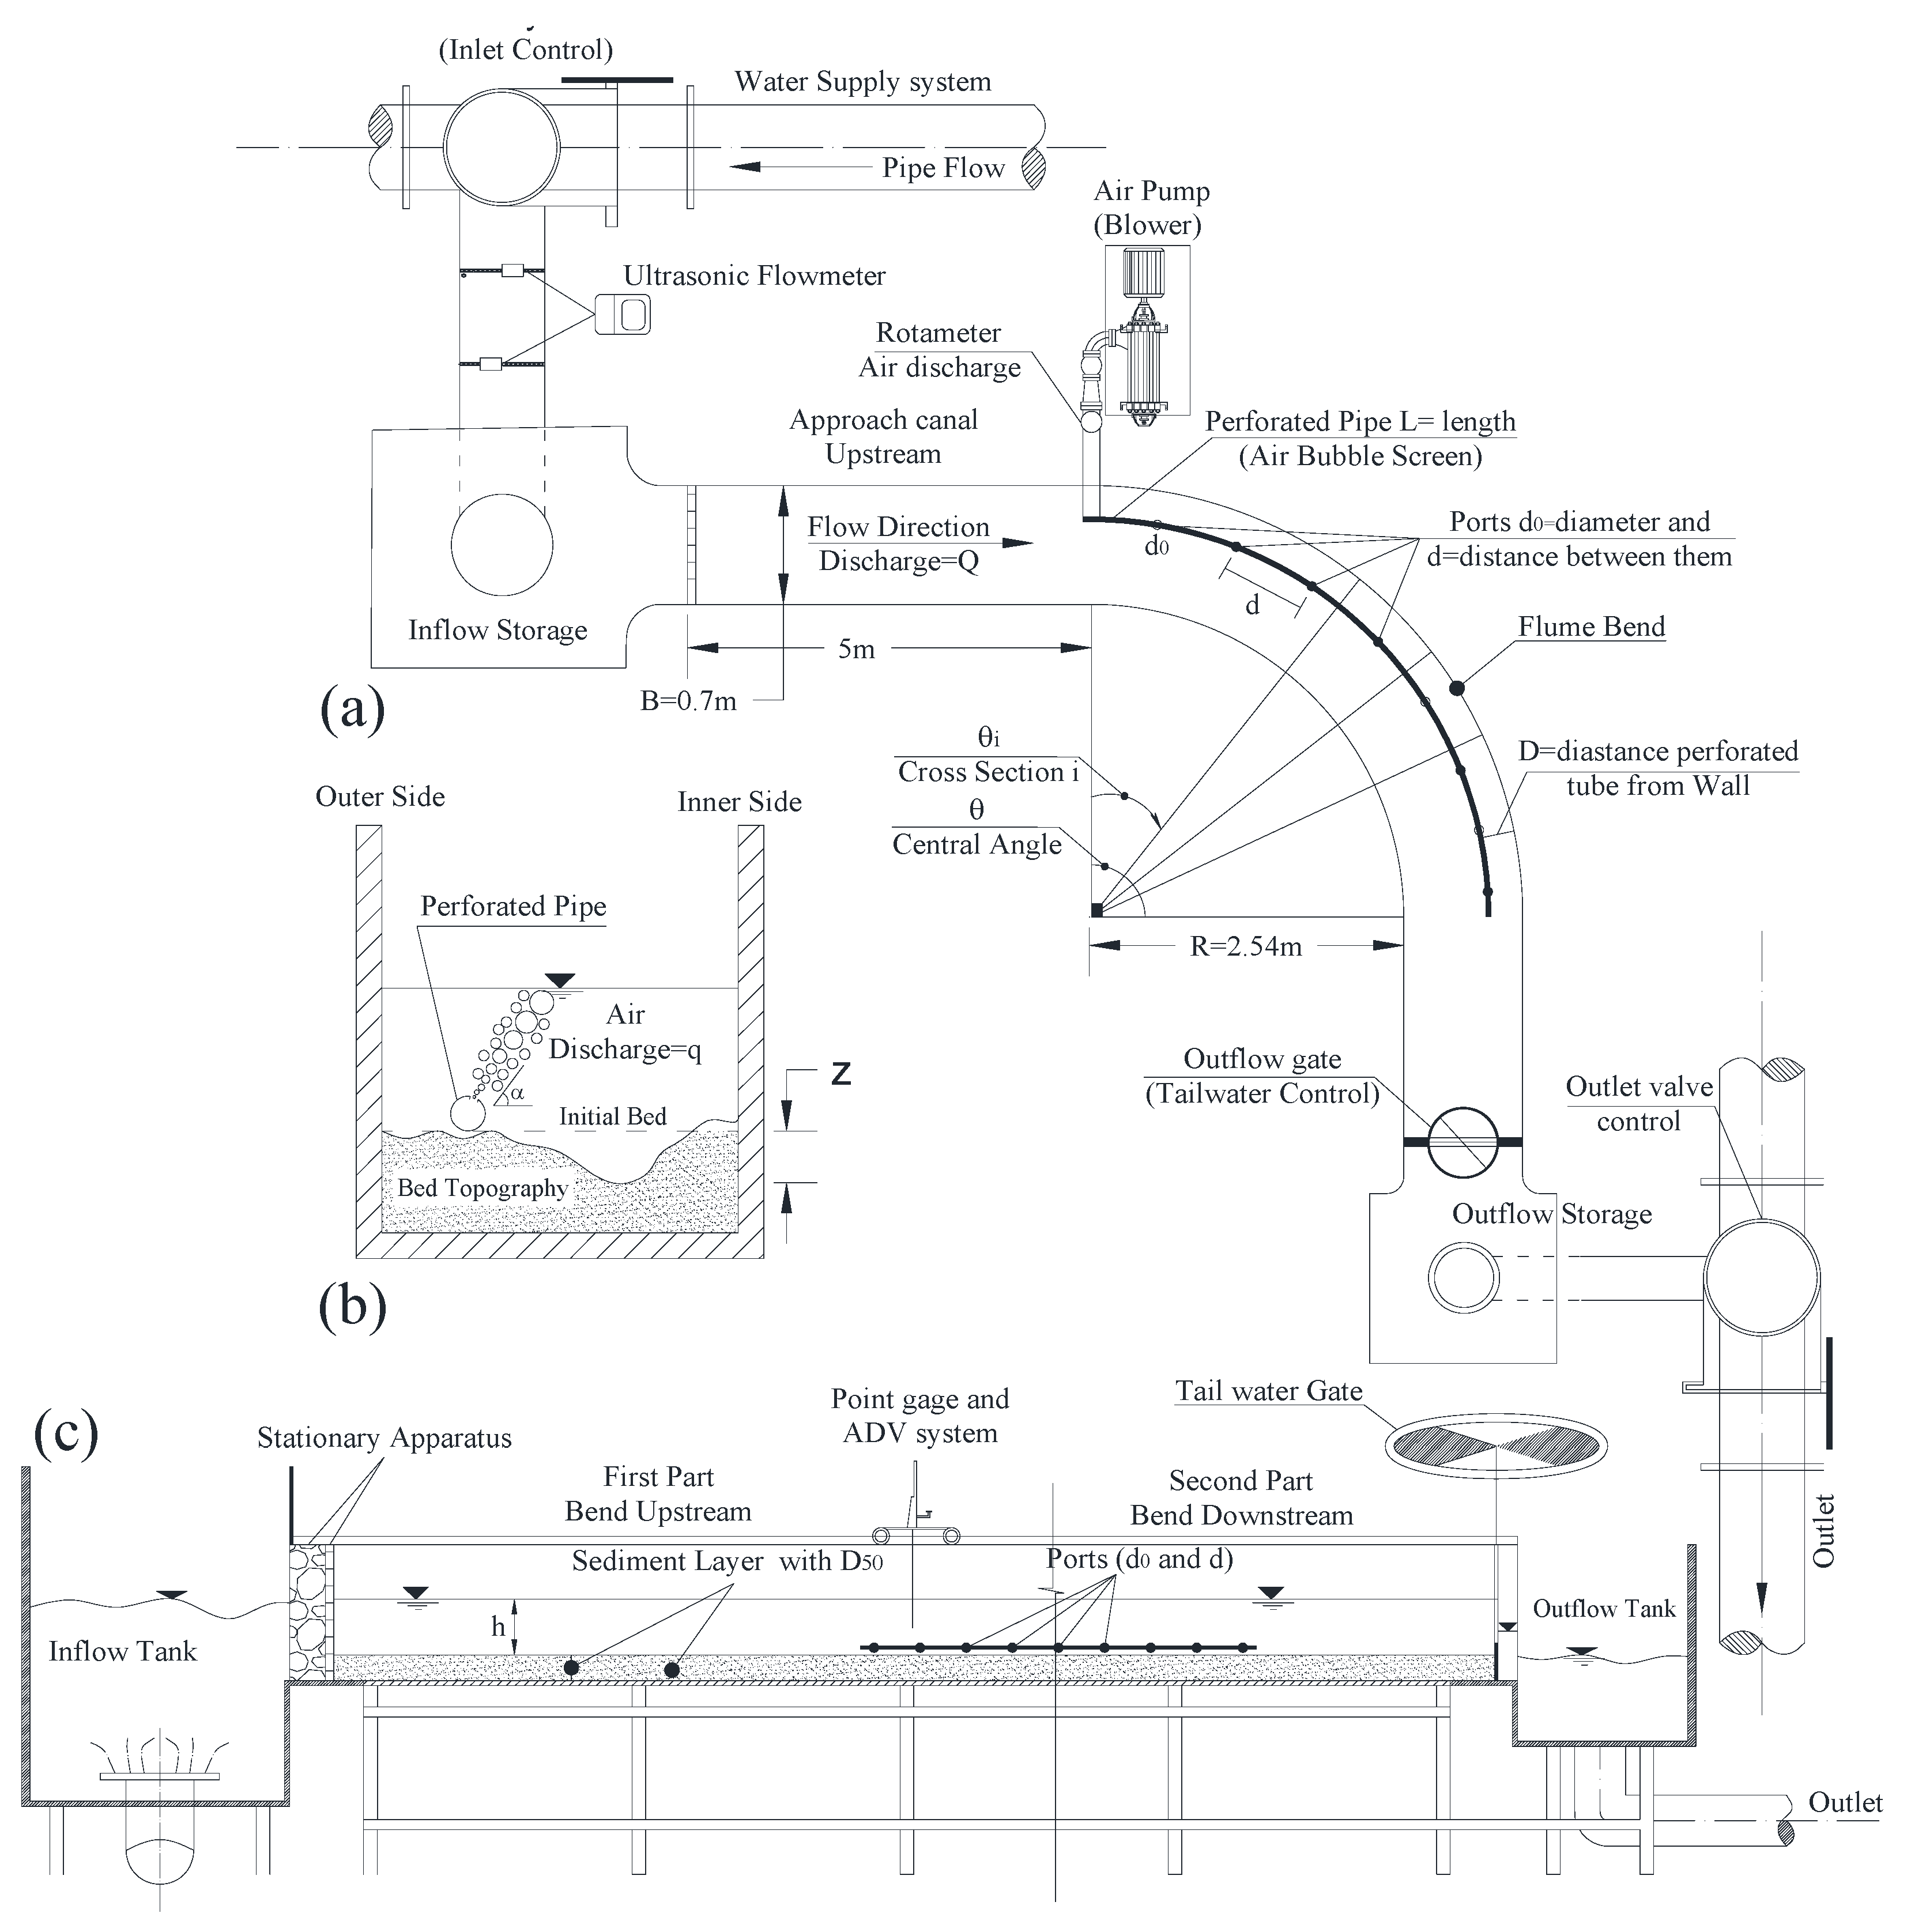
As shown in Figure 2a–c, the effective parameters on the scouring in a 90° bend with the presence of the bubble screen system are the following: scour depth (z); the variable water depth from the bed (Z); flume width (B); flume bed slope (S); bend or arc radius (R); air injection discharge (q); main flow rate (Q); fluid density (ρ); dynamic viscosity (μ); gravity acceleration (g); average particles diameter (D50); particles diameter standard deviation (σg); sediment density (ρs); static friction angle (φ); angle between air-bubbles and mainstream (α); pipe length (L); port diameter (d0); port distance on the perforated tube (d); perforated tube distance from the outer wall (D); perforated tube diameter (D0), and water depth (h) and θi is the angle of the i-th cross-section measured from the origin of the bend as shown in Figure 2a. According to the Buckingham theorem, Equation (2) holds:
f ( Z , z , B , S , R , Q , q , α , θ i , ρ , ρ s , μ , g , φ , L , D , d , D 0 , D 50 , d 0 , h , σ g ) = 0
Equation (2) contains n = 22 variables and with r = 3 fundamental dimensions one has nr = 19 non-dimensional groups. The flow depth h can be used to scale the different length related variables. It is possible to combine the flow rate, Q, with the flow section, (Bh), the flow depth, and the viscosity to obtain the Reynolds number. Similar reasoning can be made using the flow rate, the flow section, and the gravity acceleration, g, to obtain the Froude number. Combining the variables in dimensionless groups, it is possible to write:
f ( Z h , z h , σ g , D 0 h , B h , D 50 h , d h , R h , d 0 h , D h , L h , F r , ρ s ρ , q Q , S , Re , θ i , φ , α ) = 0
where in Equation (3) two parameters Fr = Q/(Bh(gh)0.5) and Re = ρ Q/μB are the Froude and Reynolds numbers, respectively; V, h, and μ are the flow mean velocity, flow depth, and absolute viscosity, respectively. The dimensionless parameter q/Q represents the flow rate ratio of the air injection to the mainstream flow discharge. However, according to Shukry [17] the viscosity effect can be ignored in the fully turbulent regime, that is, when the Re > 104. In this research, the minimum and maximum Reynolds numbers were equal to 4.3 × 10⁴ and 5.6 × 10⁴, respectively. Moreover, in this study, the values of σg, D0/h, B/h, D50/h, d/h, d0/h, D/h, L/h, ρs/ρ, and S were considered constant. However, investigating the maximum scouring depth at each θi is essential for controlling bend erosion. Thus, the investigating variables for the effect of the air bubble screen on scouring control in this study are the following:
z h = f ( D h , F r , q Q , θ i , α ) = 0
It is also important to consider the air bubbles dynamics and the two parameters, the Bond, Bo, and Weber, We, number given, respectively, by:
B o = ρ σ g d b 2
W e = ρ w V 2 d b σ
where Δρ = ρwρair is the density difference between water (w) and air (air), σ is the surface tension, db is the bubble diameter and V is the scale of bubble’s velocity. Since both the Bond and Weber numbers depend on bubble size, and surface tension σ is fixed (as both cases involve an air-water interface), it is not possible to simultaneously preserve the physics of the water flow (given by the Froude number) and the physics associated with the bubble scale (given by the Bond or Weber numbers). Inevitably, one of these phenomena will be distorted in physical modeling.

2.1. Laboratory Setup

Experiments were conducted in a 90° arched rectangular flume at the hydraulics laboratory of the Shahid Chamran University of Ahvaz, Iran (Figure 2). The flume dimensions were 0.7 m wide, and the upstream and downstream of the 90° bend straight reaches lengths were 5 m and 3 m, respectively.
The flume bend was a mild system with outer and inner bend radiuses of 3.15 m and 2.54 m, respectively. The water supply system toward the flume was provided by a pump connected to a reservoir. The flow rate and flow height were controlled by means of an upstream butterfly inlet valve and an outlet gate. To avoid scouring induced by initial filling of the channel, the following procedure was followed: (i) the outlet gate of the flume was closed before turning on the pump, (ii) then the butterfly inlet valve was slightly opened to impose a small flow to gently fill the channel. Then, the flow rate was gradually increased until it reached the desired flow rate, and the end gate was steadily raised to provide the desired depth in the channel. The flow rate was controlled using a valve and measured with an Ultrasonic flow meter model NG3100-TFM. In addition, the outlet gate was controlled to regulate the water surface level. The flume bed was covered with a 0.20 m thickness uniform sediment layer with characterized by D50 = 1.5 mm and a standard deviation σ g = d 84 / d 16 . The sediment surface was leveled with the help of a designed leveling device to prepare the sediment bed for each test. This device consisted of a vertical metal blade that could be moved along the width and length of the flume. The sediment surface was flattened by moving the device along the channel and shifting its plate. All experiments were carried out in clear water conditions (V/VC ≤ 0.90), where Vc is the flow velocity at particles’ incipient motion in a straight channel. Figure 2 shows a view of the experimental flume’s characteristics in this research. This Figure shows the channel’s plan, cross-section, and longitudinal profile. Moreover, the view of the actual condition of the canal is represented in Figure 3. An ultrasonic flowmeter Digi Sonic E+ model measured the main channel flow rate with an accuracy of ±0.01 L/s. The bubble screen system was formed from a perforated pipe with an outer diameter of 1.5 cm mounted on a metal base. The highest velocity occurs at the discharge of the port outlet position because of the jet and main channel flow intersection. In addition, the distance between the ports on the perforated pipe and the distance pipe from the bend outer wall was 2.5 cm and 5 cm, respectively. These distances were determined by trial and error to obtain the best effect in controlling the scour. The diameter of the holes in the pipe was 1 mm, and the spacing between holes in the air supply pipe was 2.5 cm. Three attack angles of the bubble screen cross with the mainstream, α, were considered using the perforated pipe port configurations. The injected air flow rate was measured through an RMC model Rotameter with a range of 5 to 50 Lmin−1 and an accuracy of ±0.02 Lmin−1. The air injection was provided using 2800 W air blowers. The air blowers were connected at the pipe’s start and end to allow air to flow uniformly throughout the perforated pipe. The flow velocity and flow pattern were measured using a 3D computer-operated ACM3-RS Electro-Magnetic Current Meter (Takahata-cho, Nishinomiya, Hyogo 663-8202, Japan) velocity meter (JEFALEC ACM3-RS model with an accuracy of ±2%) with an acquisition frequency of 20 Hz. This system consisted of a signal conditioning module, a probe with an acoustic transmitter, three acoustic receivers, and an electromagnetic current processor.

2.2. Methodology

Preliminary tests were carried out to determine the range of flow rates leading to bedload transport only. Hence, four flow rates were determined Q = {30, 33, 36, 39} Ls−1 with a constant water depth of 0.11 m. The corresponding Froude numbers were Fr = {0.37, 0.41, 0.45, 0.47}, respectively. The flow rate ranges were selected based on the clear water condition.
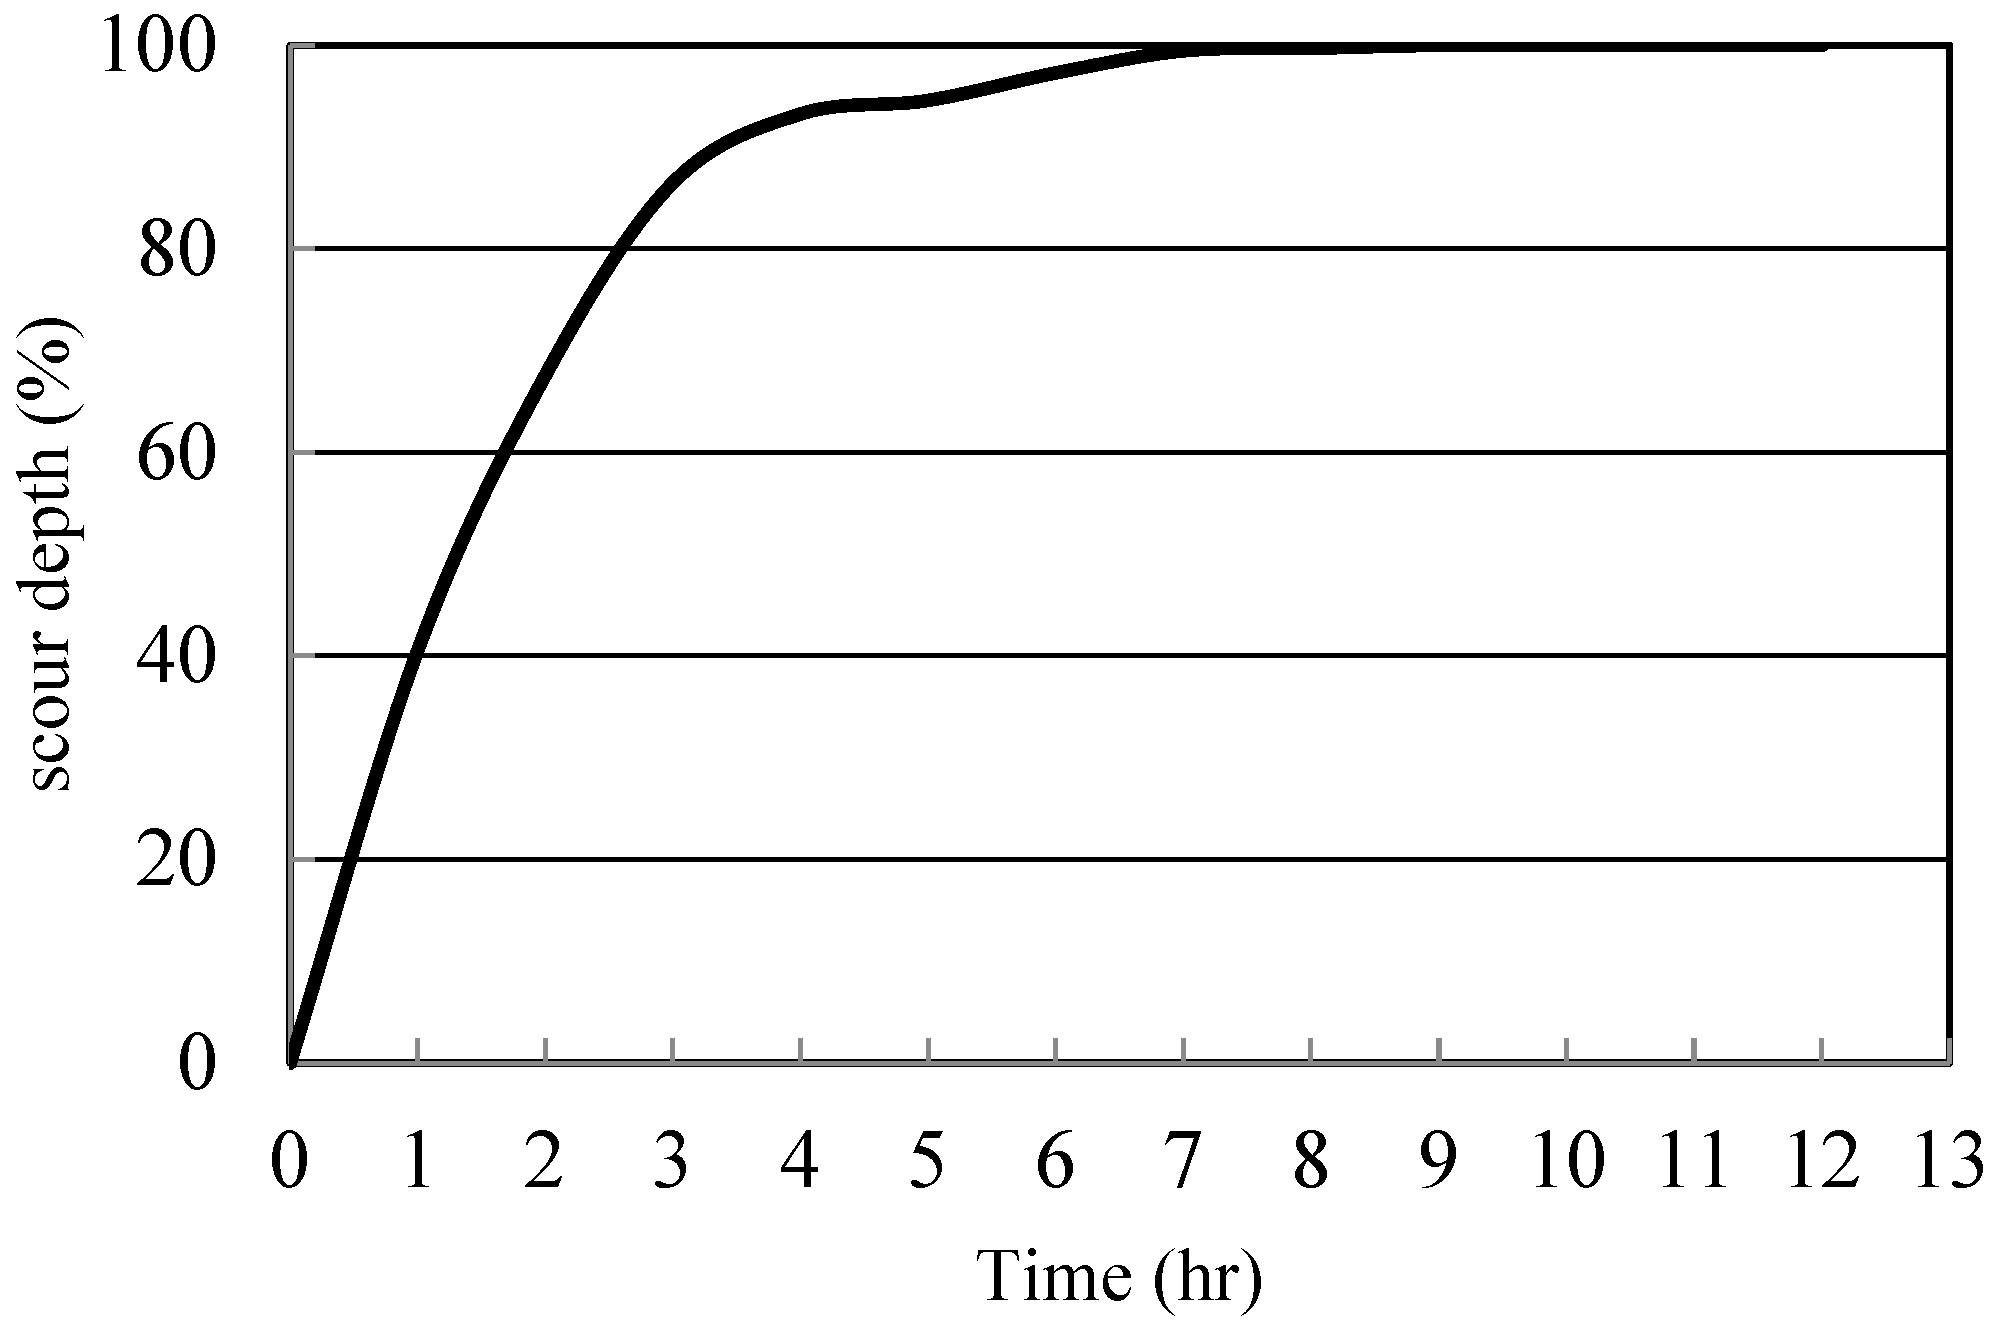
For the experiments is critical to define the equilibrium time, that is, time required for the scouring rate to be zero along the bend. This time was determined in an empirical way. A long-time experiment was performed for 12 h at a flow rate of 33 Ls−1. Figure 4 shows the results of the maximum scouring percentage versus time at the bend. According to Figure 4, 90% of the scouring occurs after 4 h. That was verified in 13 cross-sections along the channel bend. Hence, this time was assumed to be the equilibrium time for all the experiments.
Three angles, α = 0°, 45 °, and 90° were considered to investigate the effect of the angle between the air bubble system and the main flow direction on the scour reduction. Experiments were carried out at different air flow rates. Those were determined by trial and error based on the most significant effect of outer bend scouring control. As a result, all experiments were performed with three air injection flow rates of 46 Lmin−1, 48 Lmin−1, and 50 Lmin−1. Figure 5a shows the mild bend with a 3D velocity meter; Figure 5b shows the perforated tube installed along the outer bend (according to Figure 2) to investigate the effect of the air bubble screen system on the bend scouring; Figure 5c shows the action air bubble system. In addition, Table 1 presents the air velocity and the momentum values of the air and main flow. So, the air outlet velocity at the ports for discharges of 30 Lmin−1, 46 Lmin−1, 48 Lmin−1, and 50 Lmin−1 is 3.98 ms−1 were 6.10 ms−1, 6.37 ms−1, and 6.63 ms−1, respectively. On the other hand, the momentum of the air bubble screen is higher than the flow momentum, as indicated in Table 1.
In Table 1, the last column, MAJ/MMF is the ratio of the momentum air jet (MAJ) to the momentum main flow (MMF). Each experiment was stopped after four hours from the start of the experiment for the bed’s morphological equilibrium, and then the flume was dried and drained. After the end of the scouring process, the bed was drained and fixed with cement slurry to prevent further bed scouring and erosion. Then, the sedimented bed topography was surveyed using a laser meter model X310 with an accuracy of 1.5 mm. The measured topographic points had a width distance of 3.5 cm for each cross-section with βI = 5° (See Figure 2, where βi is the angle between each consecutive cross-section) along the bend. However, twenty points were measured at each cross-section, and 24 cross-sections along the canal bend were selected to measure the bed topography.
The velocity distribution along the bend with and without the air bubble screen system was measured using an electromagnetic velocity meter (Figure 5a). The velocity patterns are essential to investigate flow patterns and the air bubble effect on secondary flow in the river bend. Therefore, measurements of the three velocity components (longitudinal, transverse, and vertical) were performed for the main flow rate of 36 L/s and air injection flow rate of 50 Lmin−1, at 20 Hz frequency, for 60 s at each point. The bed sediment was also fixed using slurry-diluted cement after reaching the morphological equilibrium to minimize the effect of the electromagnetic velocity probe on bed changing and variations in measuring the velocity field.
The bed-fixing procedure took at least 24 h for the diluted cement to dry and fix the bed. Velocity measurements were performed in 12 cross-sections at θi angles (See Figure 2) of 0°, 15°, 30°, 45°, 55°, 60°, 65°, 70°, 75°, 80°, 85°, and 90° within the bend length. The velocity measurement points in each cross-section in the transverse direction of the flume were {5, 10, 15, 20, 25, 30, 35, 40, 45, 50, 55, 60, 65, and 68} cm from the outer bank. At each point, at least four vertical points in a vertical direction were measured. Table 2 shows the performed tests indicated by the nomenclature R xx Y Z.

3. Results and Discussion

3.1. Effect of Bubble Jet Screen on the Distribution of Flow Velocities

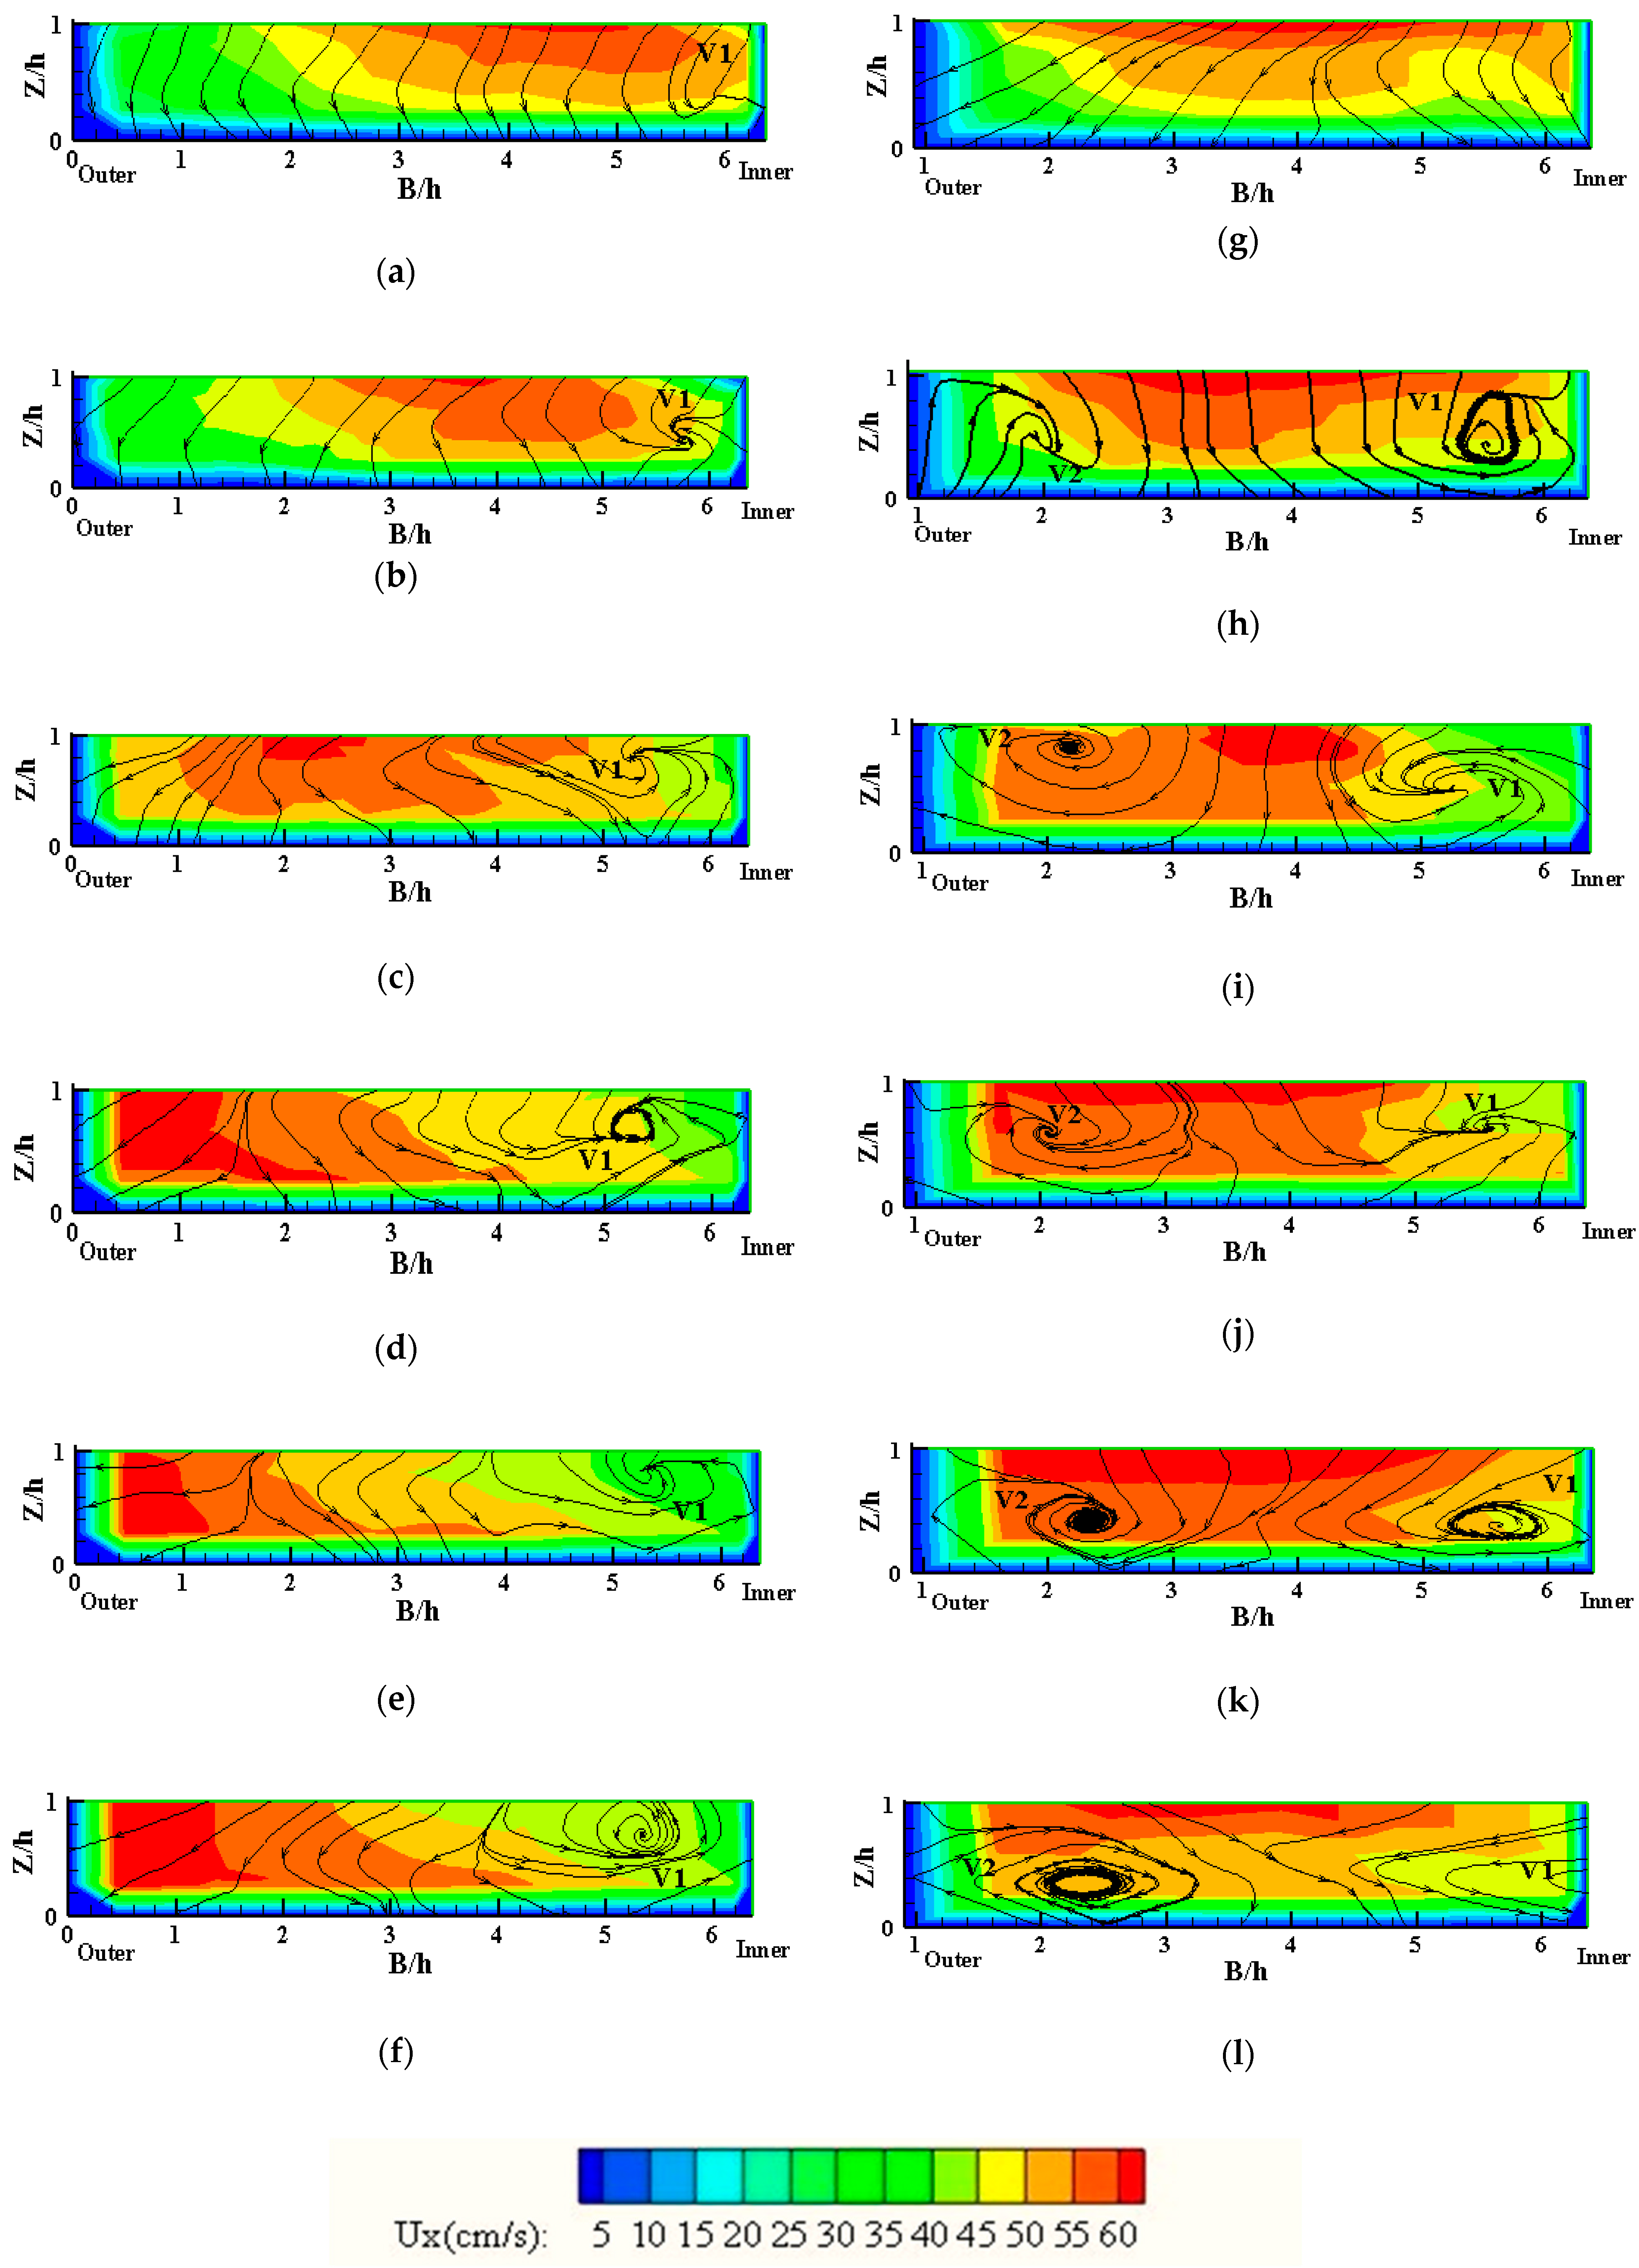
The velocity contours at transverse (yz plane) cross-sections with θi equal to 0°, 15°, 45°, 65°, 80°, and 90° for the reference test with a mean velocity of 0.46 ms−1 (R36-0-0) without any air bubble screen system are shown in Figure 6a–f. According to Figure 6, it is revealed that at 0°, i.e., the beginning of the bend, the maximum longitudinal velocity is V/Vmax = 0.16 (10 cms−1) from the inner bend wall and very close to the inner bank. However, the transverse flow presence through the outer to the inner wall indicates the secondary flow effect in the bend (See Figure 6). Series Figure 6a–f show the vorticity and rotational counter-clockwise flow in the yz plane due to the secondary flow. According to Blanckaert and Graf [13], Fazli et al. [32], and Blanckaert [14], the secondary flow effect also appeared immediately of the bend upstream. According to the velocity measurements depicted in Figure 6, the secondary flow power and the created transverse vortices gradually increase with the distance from the beginning of the bend. Likewise, the maximum velocity region is located adjacent to the outer wall for the 65° to 90° cross-sections, which causes more scouring in this location (Figure 6d–f). Hence, the streamlines are bended from near the water surface towards the outer bend and near the bed towards the inner bend. As a result of the interaction between the circulation cell and the non-uniformity of the velocity profile in depth, a spiral flow pattern is formed, which causes the flow to be disturbed. This flow type has a significant influence on the morphology of the bed. In such a way, it causes the streamlines to be pushed from the water surface to the bed; furthermore, the high flow velocity at the outer bend causes a strong lift of bed particles and the outer wall scouring of the rivers. Fazli et al. [32] and Blanckaert [14] reported the existence of a rotation cell that is generated due to the ratio between the centrifugal force and the induced force by the lateral pressure gradient in their laboratory canal. Figure 6g–l show the flow pattern as transverse yz plane and velocity (v,w) distribution contours for the experiment RB36-50-90, measured with an air bubble screen system. The velocities near the aeration system were not measurable due to the interference between air bubbles and the signaling devices of the velocimeter. At the bend’s beginning distance at the 15° cross-section, the primary–secondary flow cell is converted to 2 cells in opposite directions, including clockwise and anti-clockwise, for two vortices, V2 and V1, as shown in Figure 6h, respectively. The V1 cell is created by centrifugal force and a pressure gradient between the outer and inner walls, and the operation of air bubbles generates V2. In addition, it has been found that the air bubble screen system causes low velocities near the outer bend wall at all cross-sections. The maximum velocity zone is transferred from the outer bend to the channel centerline when considering the air bubble screen. However, both cell vortices are in all cross-sections according to Figure 6g–l. Creating a shear layer between these two cells causes the flow direction change towards the bed and transfers the trough line from the outer bend to the channel centerline. Therefore, the maximum scour in all air bubble experiments happened at the zone of the two circulating cells, i.e., V1 and V2, in Figure 6g–l. This phenomenon was also reported by Dugué et al. [11]. Likewise, in the reference tests, maximum velocity occurred at 5 cm, 15 cm, and 20 cm from the outer wall and 45°, 65°, 80°, and 90° angles along the bend, respectively. These distances, for the experiments with the presence of the air bubble screen system, were 43 cm, 48 cm, 48 cm, and 33 cm for each angle, respectively. That means that the air bubble system was able to displace the maximum velocity from the outer wall equal to 53%, 68%, 89%, and 84% for the angles mentioned above.
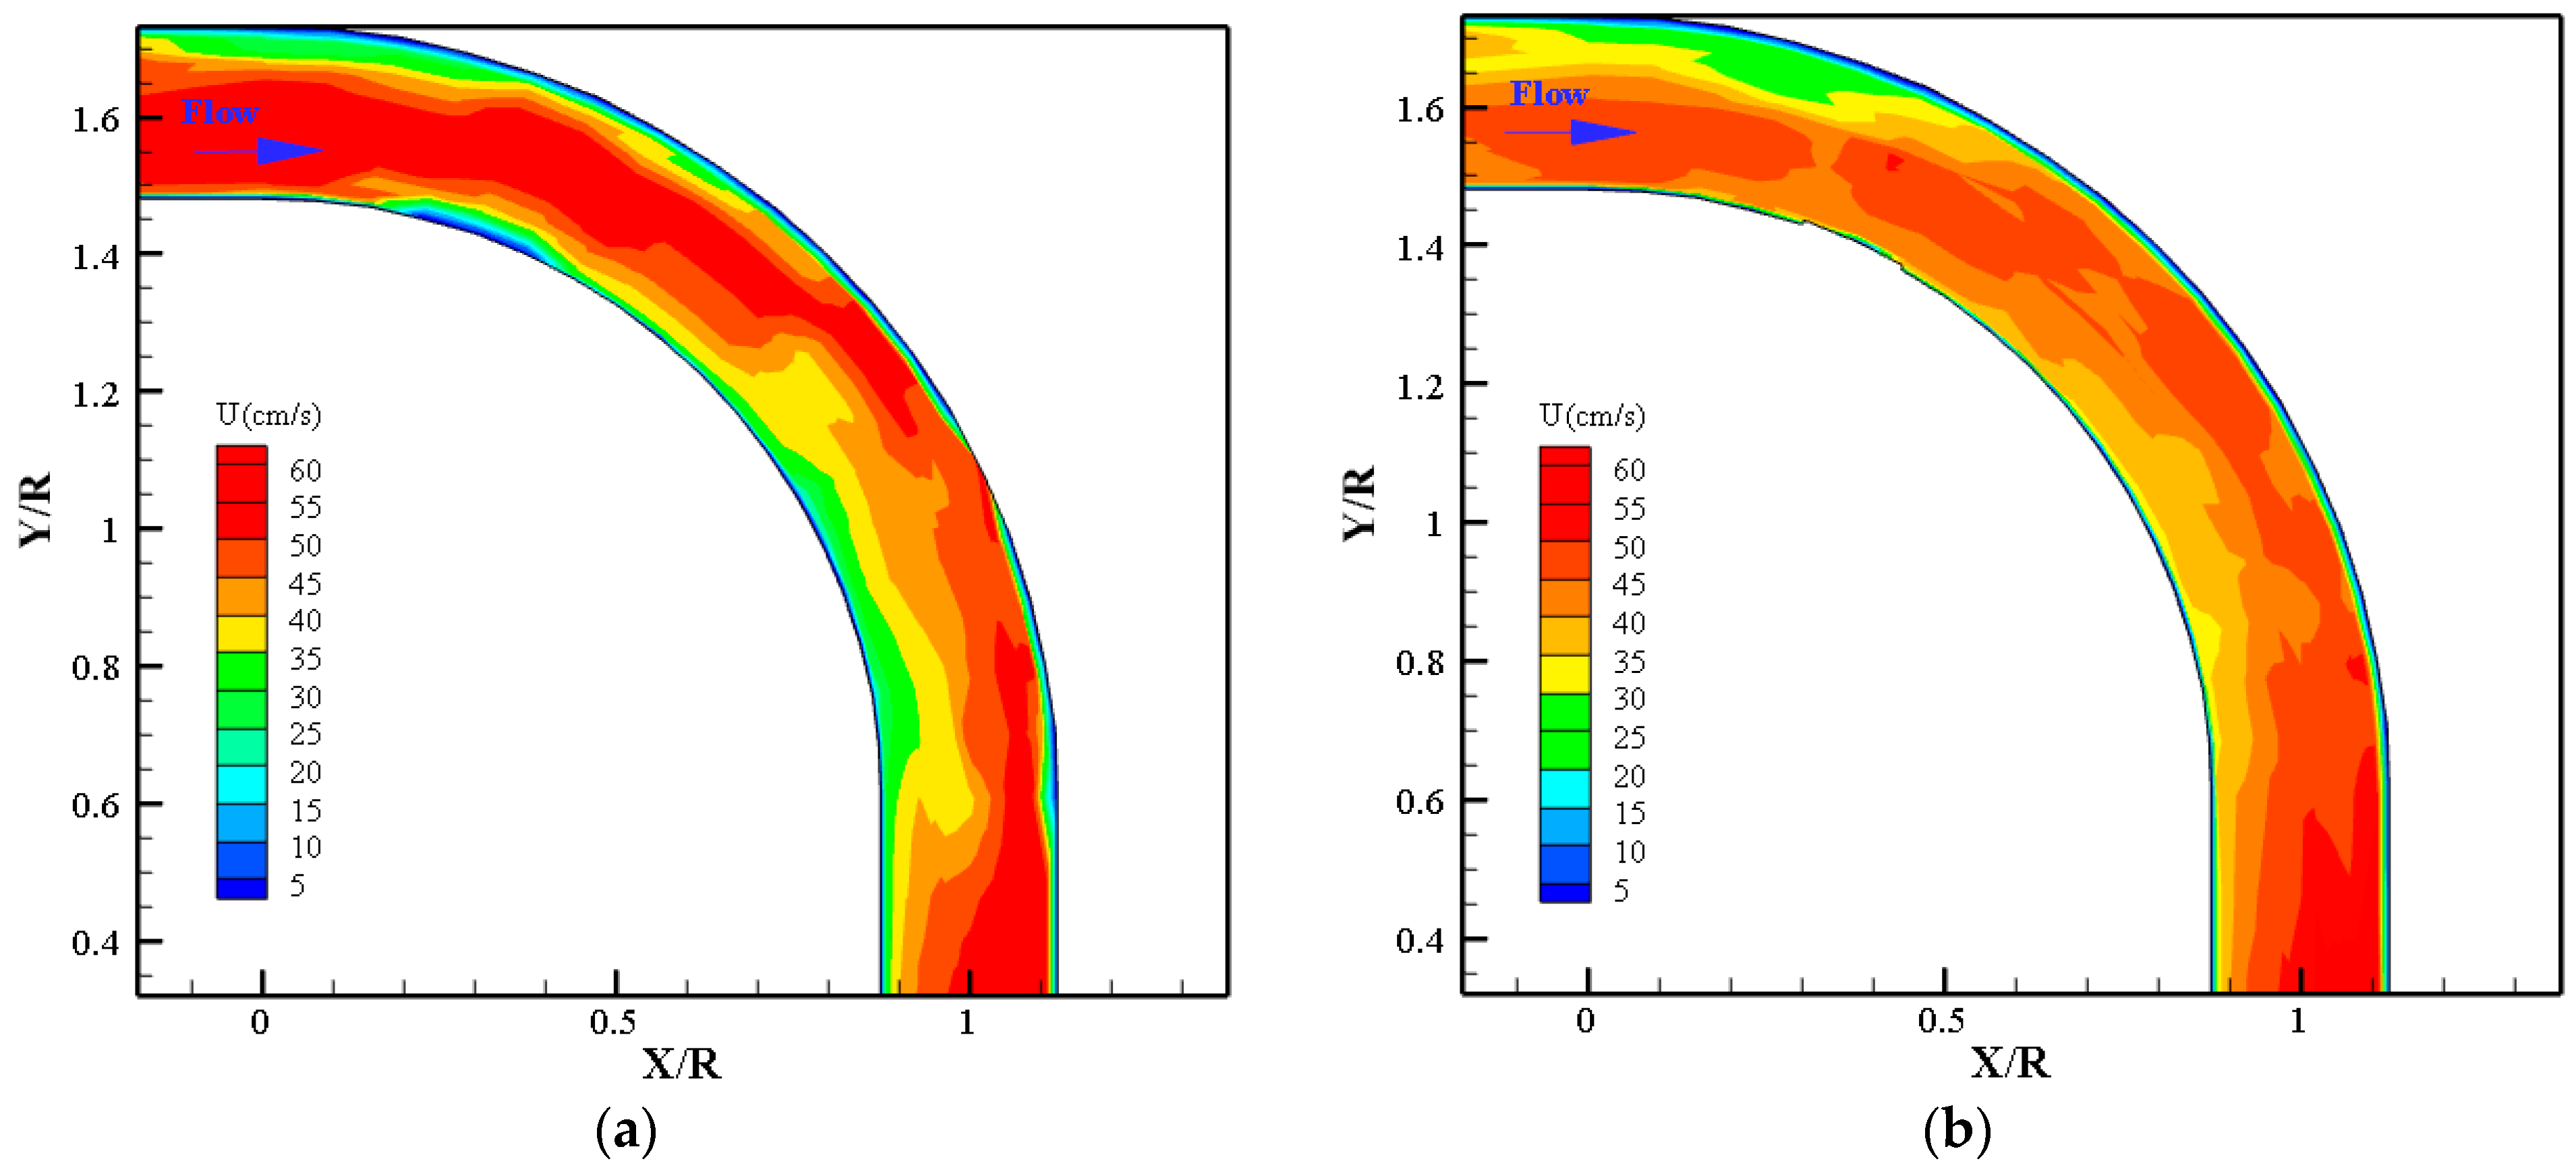
Furthermore, the longitudinal profile of the flow in the bend with and without the jet injection system has been investigated. Figure 7 shows the reference test results with a flow rate of 36 Ls−1 and an upstream flow depth of 11 cm.
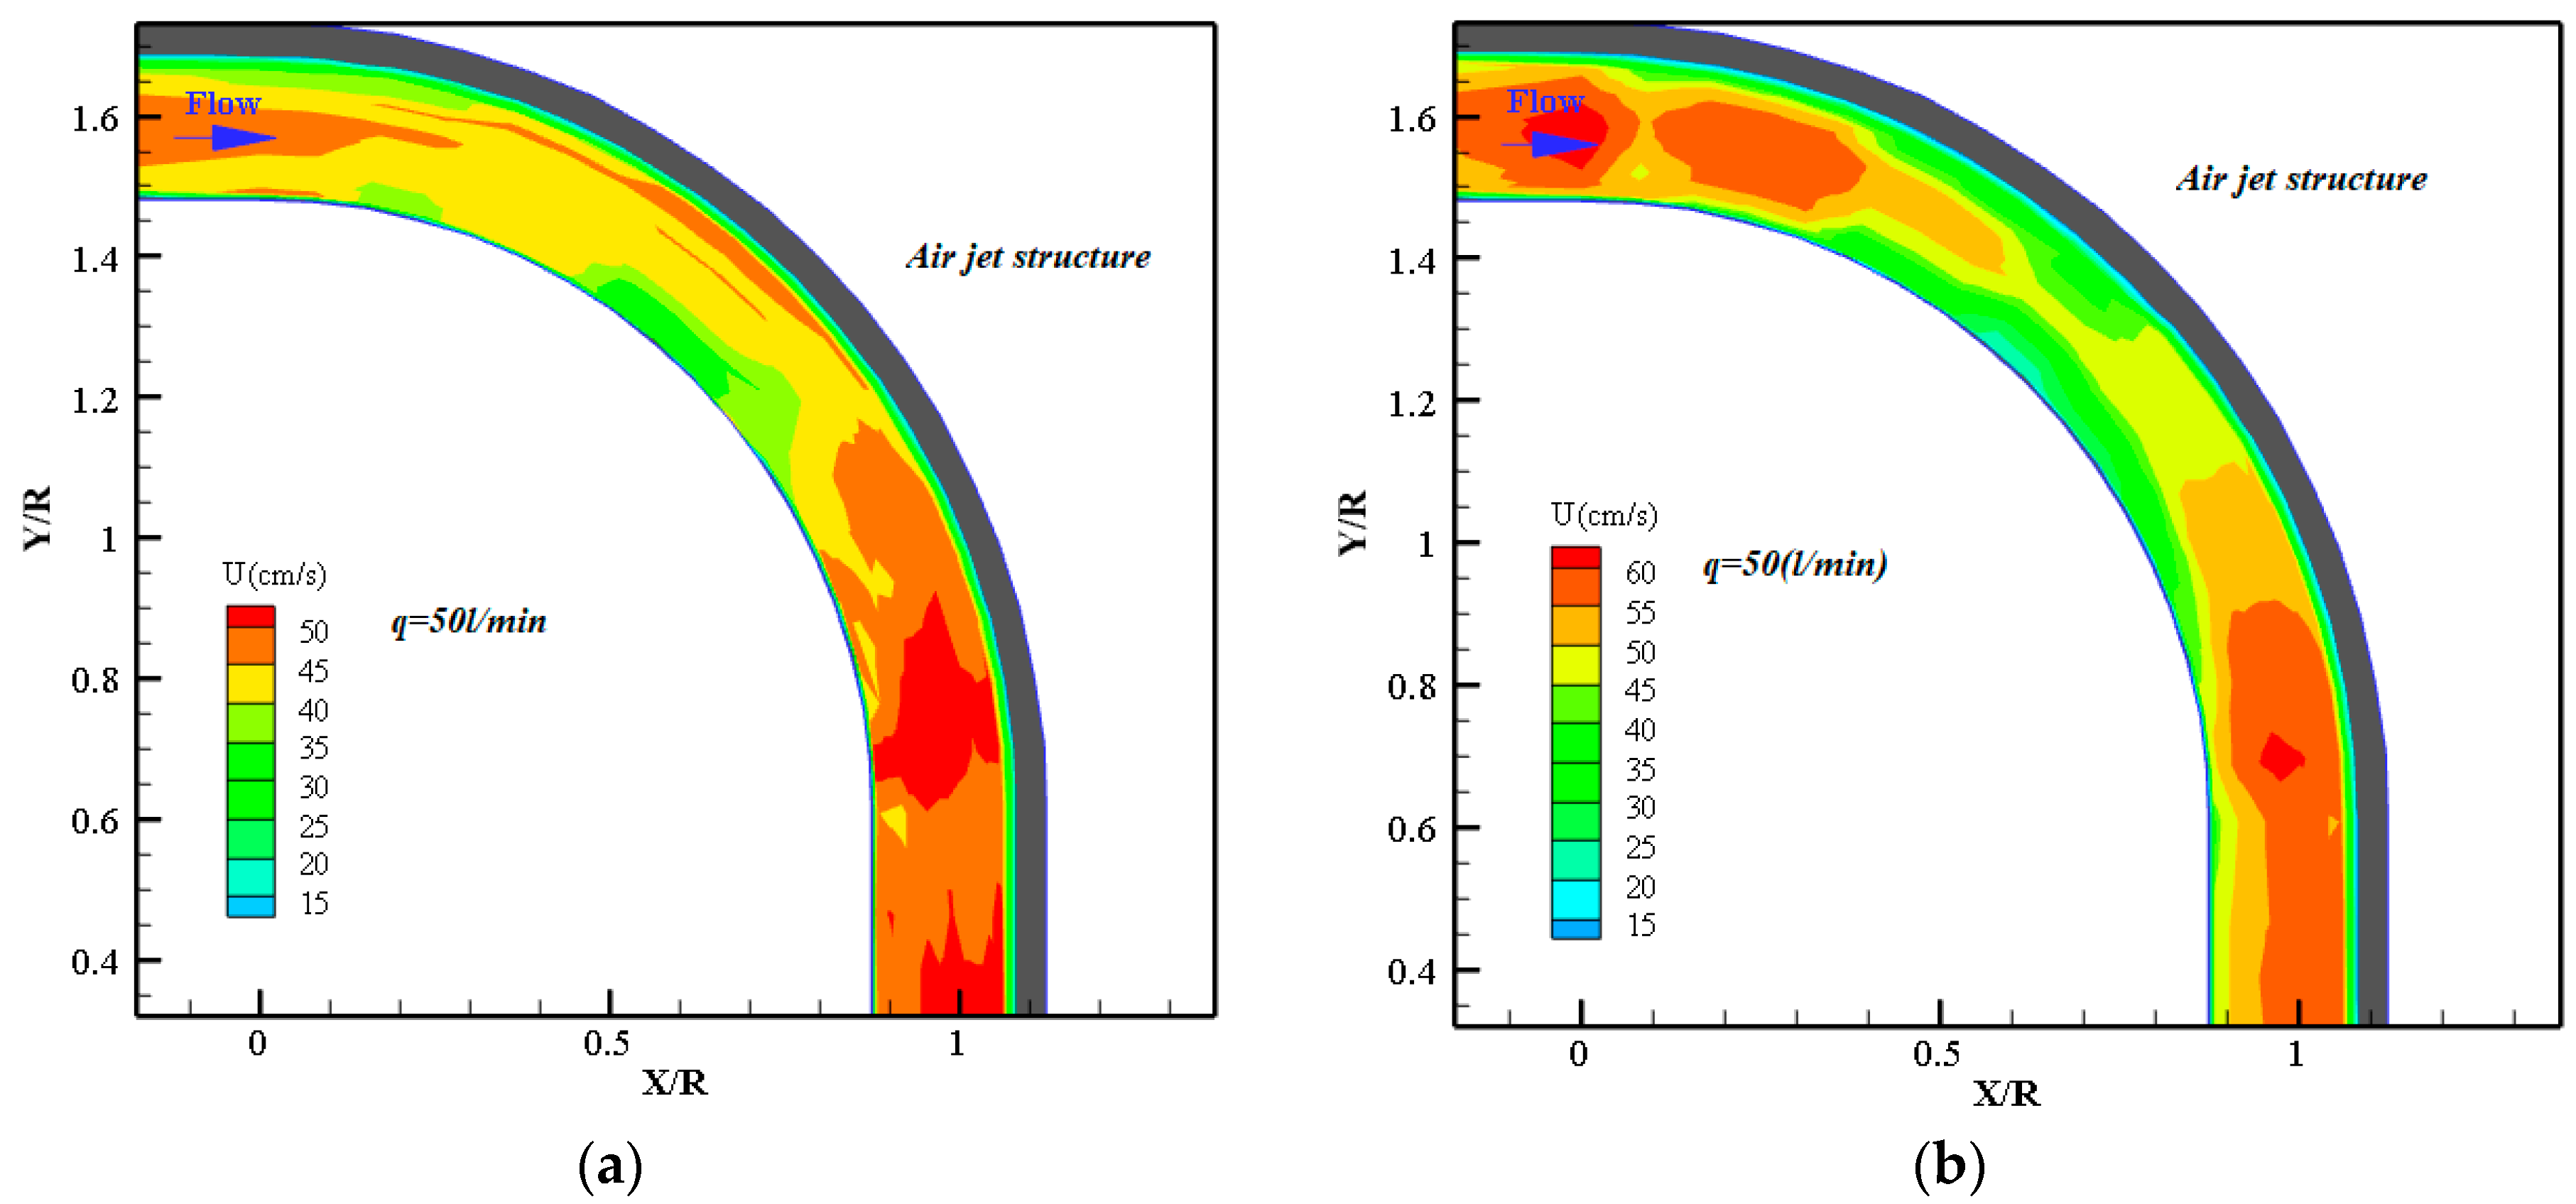
As shown in Figure 7, it was observed that the path curvature and the centrifugal force caused the maximum velocity zone to tend towards the inner bend when the flow passed through the upstream straight part and entered the bend. Rodi and Leschziner [23] consider this phenomenon, which is formed in straight sections far from distances upstream of the bend inlet, to be caused by the lateral pressure gradient. However, there is a decrease in pressure (negative longitudinal gradient) at the inner bend and an increase in pressure (positive longitudinal gradient) at the outer bend. It should be noted that the flow velocity decreases at the outer side because the flow depth in the bend inlet on the outer side is greater than the straight part before the bend. On the opposite side, the velocity increases at the inner side because the flow depth is smaller than the straight part. Hence, the maximum velocity zone increases and tends towards the outer wall at the end of the bend, affected by the secondary flow. Additionally, the secondary flows move towards the outer bend wall near the water surface and the inner bend wall near the bed surface. Then, the resulting spiral flows cause the transverse transmission of longitudinal momentum from the inner to the outer bend. Eventually, this process forms a high-velocity zone in the outer bend. However, the streamlines close together, and the maximum velocity occurs in the outer bend, thus being a factor for outer bend scouring. Figure 8 shows the flow mean velocity distribution pattern close to the bed (3 cm from the bed with Z/h = 0.27) and near the water surface (1.5 cm below the water surface with Z/h = 0.86). The air jet injection system has been in the dark line close to the outer wall. Investigation of the maximum velocity location indicates that the air bubble system has transferred the maximum velocity zone from the outer bend to the bend’s beginning and from the inner bend to the bend’s end and transferred both to the channel centerline. However, the aeration injection system behaves as a barrier against the flow by producing air bubbles perpendicular to the main flow.
Likewise, creating a rotational cell opposite to the primary main curvature cell has directed the maximum velocity lines from the outer bend to the channel centerline. The results showed that the near-bed velocities of air jet experiments are less than those without the aeration system in all cross-sections 0° to 60° from the bend inlet. The mean longitudinal velocities near the bed were higher than those at 60° to 85° cross-section. Its maximum value occurred in the cross-section of 75° and at B/h = 3.90 (43 cm) from the outer bend. In addition, from the 90° cross-section to the 80 cm cross-section downstream of the bend, the mean longitudinal velocity near the bed has gradually decreased.
Since the maximum velocity region overlaps the maximum scouring, the presence of an aeration injection system is expected to change the location of the (through line) thalweg of the channel. Despite the air bubble jet injection, the flow pattern near the water surface also indicates the correction of the observed flow pattern in the reference (test) experiment (without aeration system). The maximum velocity zone is transferred to the channel centerline in the first half of the bend. In the second half of the bend, the maximum velocity zone moves from the outer bend to the channel centerline. The reference experiment observed the same in the cross-section between 0.40 m and 0.80 m downstream of the bend.

3.2. Secondary Flow Power

As previously mentioned in the introduction, the secondary flow cell in the river bends is formed by the interaction between induced force, affecting the pressure gradient caused by the difference in water level between the outer and inner bend walls and the centrifugal force in the bend. To determine the secondary flow power (Syz), Equation (2) was used. However, Klateral is the lateral kinetic energy, Kmain is the flow kinetic energy, and u, v, and w are the longitudinal, lateral, and vertical velocities at each cross-section, respectively.
Hence, the secondary flow power was calculated for both experiments with and without the air bubble screen system to investigate the effect of the aeration structure, i.e., the air bubble system. Therefore, the experiments R36-50-90 and R36-0-0 were compared in Figure 9.
According to Figure 9, in the reference experiment (without aeration system), the longitudinal power flow increases with steep gradient cross-sections up to 30° in the bend. Then, the secondary flow cell is formed after these cross-sections. The secondary flow power increase continues to a maximum value for the angles 40° to 45° cross-sections of the bend. In this zone, the centrifugal force causes an increase in the water level in the outer bend. As a result, another force is generated by the difference in water level between the outer and inner sides and the lateral pressure gradient, which is in the opposite direction from the first one. This phenomenon increases the transverse velocity component, indicating that the secondary flow power is proportional to the squares of the lateral velocity components (v, w). Thus, the secondary flow power increases by coming along the path of the bend. However, the secondary flow power increases by increasing the air injection flow rate and, consequently, the flow velocity. It pushes the main flow away from the outer wall with a greater force. The limitation equilibrium of the centrifugal and the compressive gradient forces occurs with a movement of the maximum velocity to the channel centerline and the reduction in the transverse pressure gradient from the bend vertex to cross-sections up to 60° angles. The secondary power decreases (see Figure 9) from the 60° cross-section to the bend ends; streamlines are separated from the inner wall and cross with the outer wall.
Furthermore, the secondary flow power is again increasing with the momentum transition. In this area, the maximum secondary power occurs at 65° cross-sections. Regarding the curve trend of secondary flow power, it is expected that two regions with maximum scouring can be observed, namely at the beginning of the canal and in the second half of the bend in the area close to the cross-section of 60°, where the velocity and secondary flow power would be maximal. In this experiment, the secondary flow power increases from the bend beginning to the 45° cross-section, then this parameter decreases with a steep slope up to 55° (see Figure 9). The secondary flow power increases again from the 65° to end of the bend. The maximum value occurs at the 75° bend cross-section in this case. Therefore, scouring is expected to decrease along the bend’s outer bank.

3.3. Bed Morphology

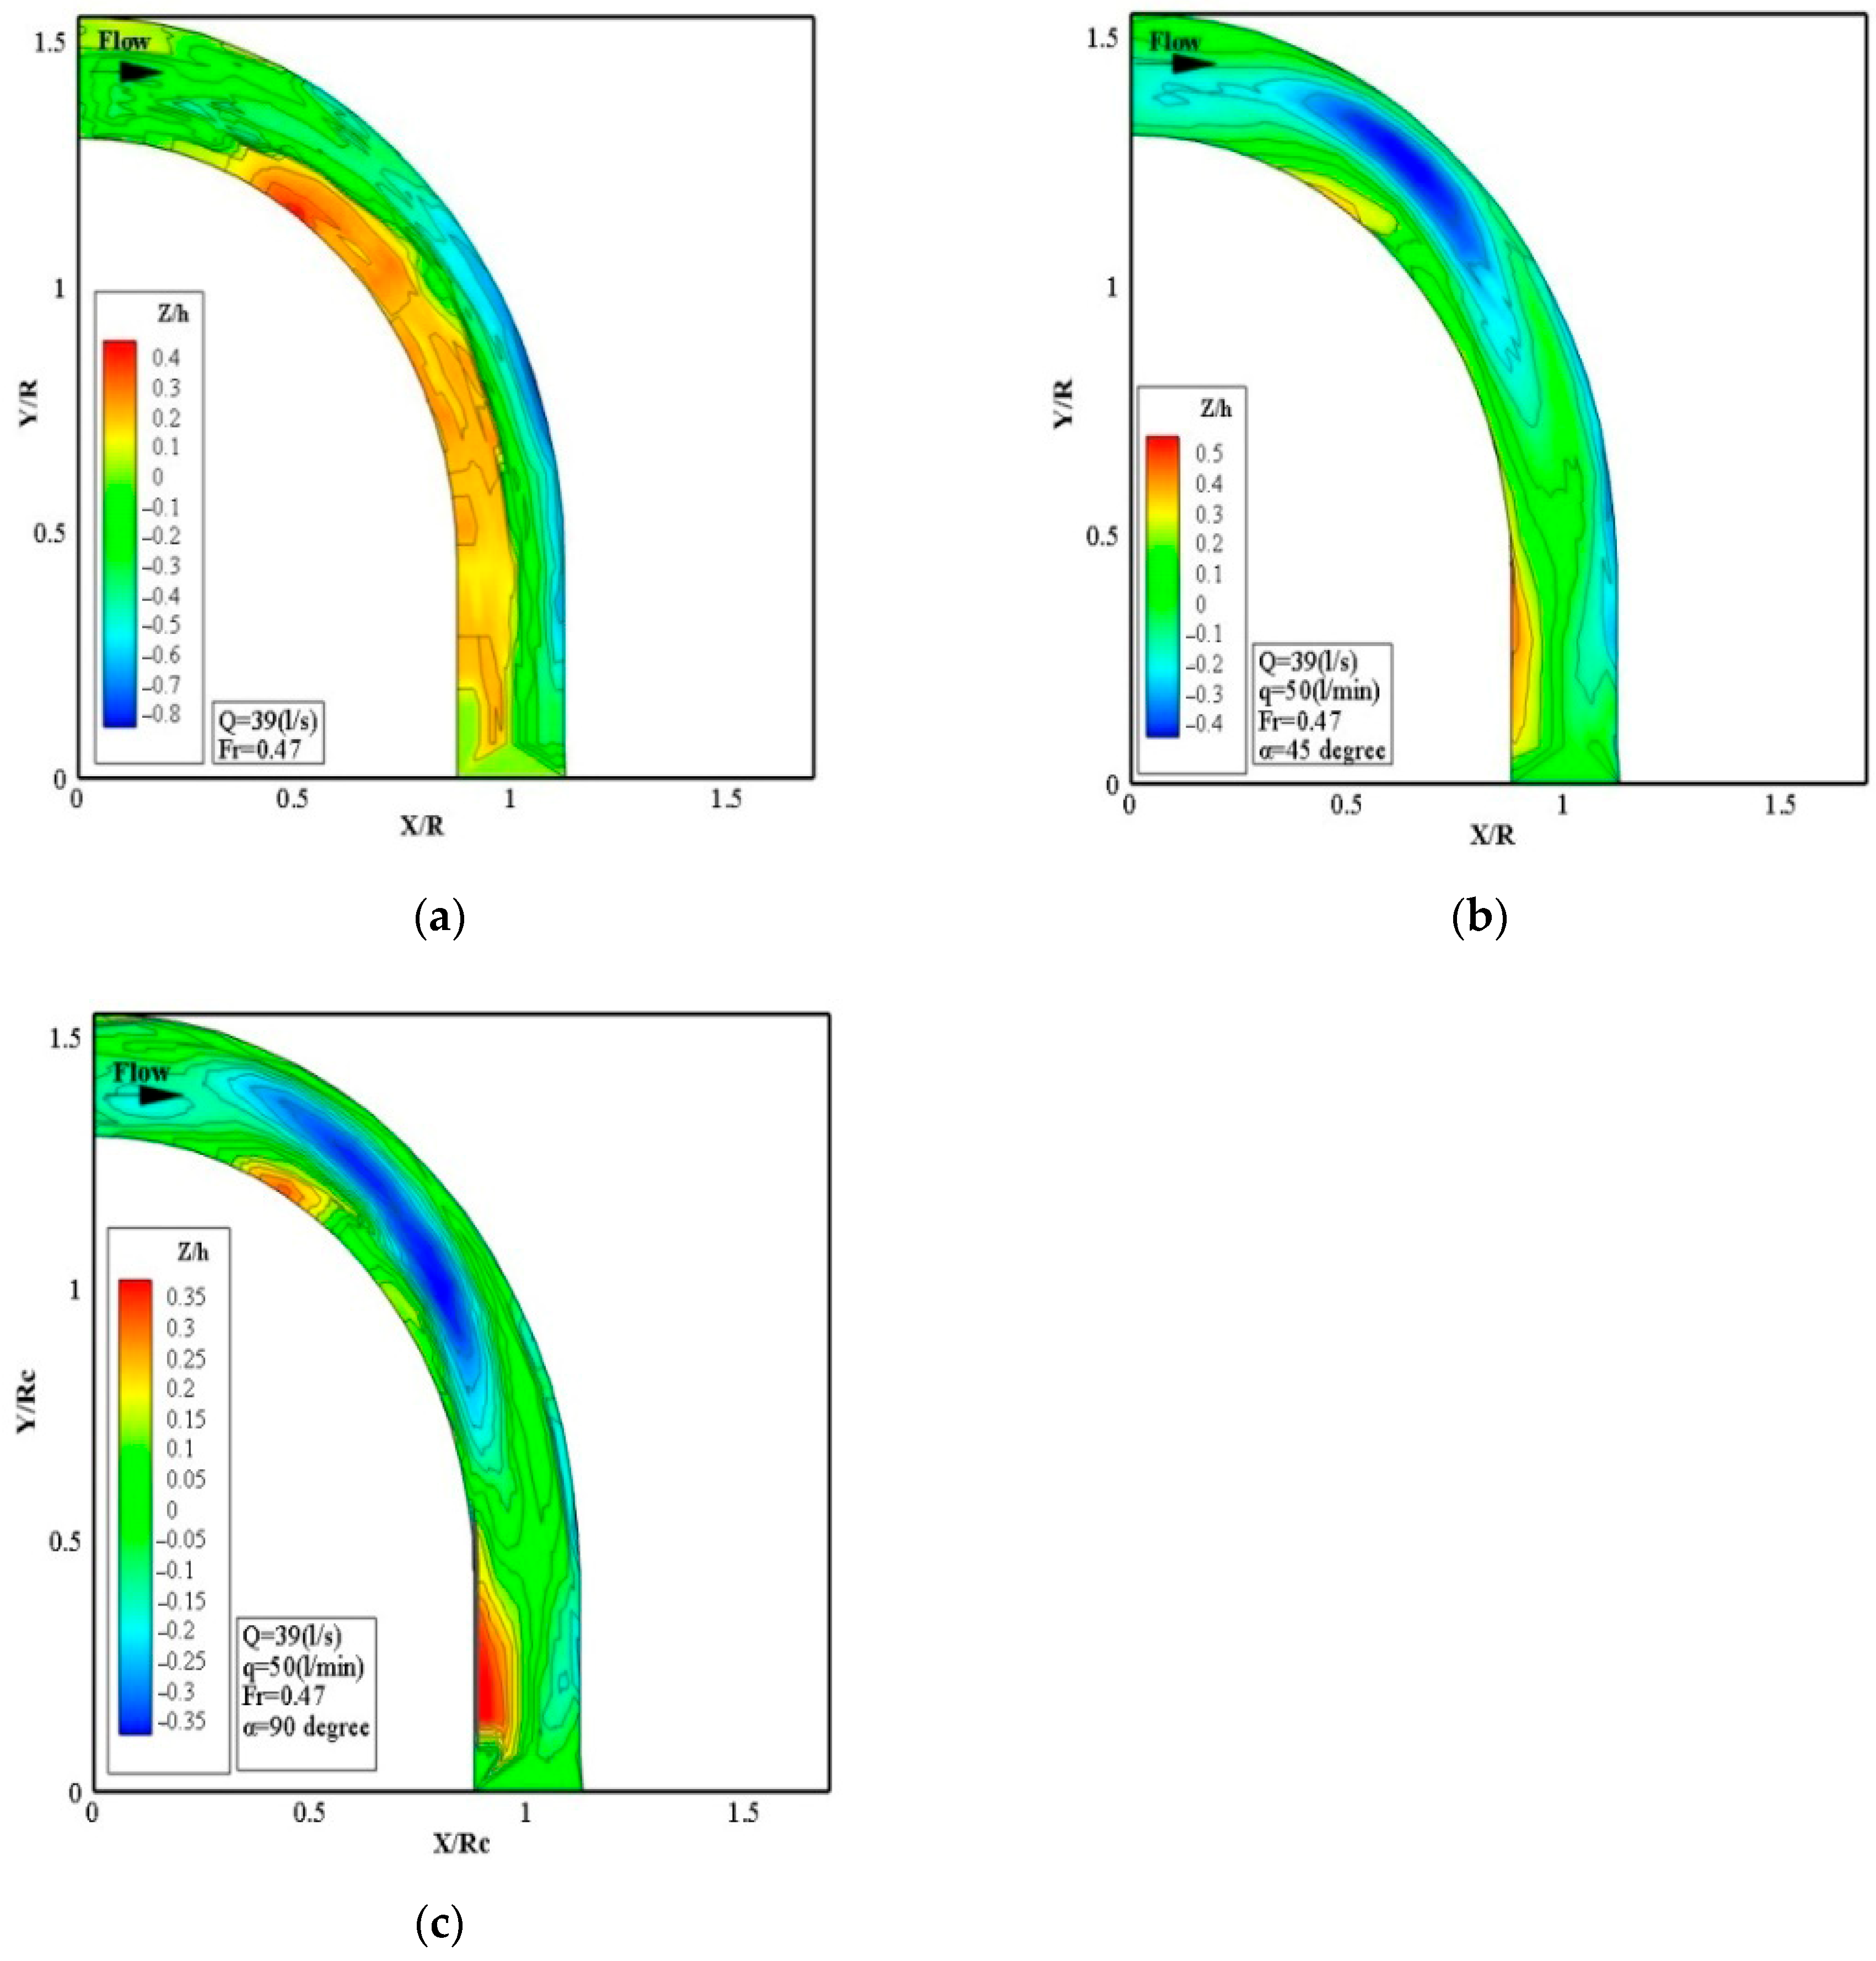
Figure 10 shows the bed morphology for the reference experiment (R39-0-0 without air bubble screen system) and with the experiments with an aeration system for Fr = 0.47, Q = 39 L/s, the air injection flow rate of q = 50 Lmin−1, and attack angles of 0°, 45°, and 90° (RB39-50-0, RB39-50-45, and RB39-50-90). The initial bed level, z = 0, was selected as the reference level or datum. The horizontal and vertical axes are changed to non-dimensional forms using the bend mean radius (Rc = 2.8 m). As shown in Figure 10a, the reference experiment bed scouring starts at the bend beginning along the inner wall, but it extends towards the outer wall from the 25° to the end cross-sections and is maximum at 70° an equal to 0.096 m. That occurs because of the secondary flow, which was previously discussed as the velocity distribution along the bend.
The bed topography for the experiments with the presence of the air bubble screen system is shown in Figure 10a–c for the attack angles, α = 0°, 45°, and 90°, respectively. However, according to these figures, the type of bed morphology has significantly changed. The sedimentation load along the inner bend wall has been reduced, and the scouring pattern in the outer wall has changed considerably. The sedimentation pattern at the outer wall indicates that the location of the maximum velocity was transferred. Thus, the maximum scouring depth is transferred from the outer wall to the centerline channel where the two secondary flow cells cross, and the maximum velocity and shear stress occur. Likewise, these figures show that the air bubble system significantly affects scouring along the outer bank and sedimentation in the inner wall. Hence, its maximum effect is related to the attack angle, α = 90°. Since α = 90°, the air bubbles impact vertically with the streamlines, thus increasing the resistance to the main flow and stronger secondary flow, which acts opposite the secondary flow induced by centrifugal force. When the cross-attach angle equals zero, the generated bubbles are aligned with the main flow direction. In this case, the main flow neutralizes them, and the secondary flow weakens. The results obtained for the cross-attack angle of 45° are between the corresponding results for zero and 90°. However, the generated secondary flow by each of the three angles significantly removes the effect of the original induced secondary flow by the centrifugal force at the bend and corrects the bed morphology.

3.4. Maximum Scour Depth

Figure 11a shows the longitudinal profiles of the maximum scour depth for the reference experiment (R36-0-0) and tests with an air bubble at α of 0°, 45°, and 90°, RB36-48-0, RB36-48-45, and RB36-48-90, respectively. According to the results, the observed scouring hole occurs at a cross-section between 45° up to the end of the bend, which is z/h = 0.67 (7.4 cm) for a bend cross-section between 65° and 70°. In all three experiments with the air bubbles, the shape of the longitudinal profile is almost the same. The scour hole has been significantly modified and transferred from the outer wall to the channel centerline, where both aforementioned rotational cells cross. This hole extends between 15° and 65° of the bend. However, the results show that the air bubble screen system with a cross-attack angle of 90° performed better than the other angles. The cross-sectional, i.e., lateral, profile at 70° cross-section for those experiments is shown in Figure 11b. The horizontal axis is dimensionless Xc/B, where (Xc) represents the distance between the points taken from the outer bend. The vertical axis is dimensionless scour depth (z/h), where h is upstream flow depth. The maximum scour depths were z/h = 0.67, 0.27, 0.22, and 0.15 (7.40, 3.00, 2.45, and 1.65 cm) for the reference and the other experiments considered. However, the maximum scour depths were reduced by 57%, 66%, and 77% for the injection air attack angles of 0°, 45°, and 90°, respectively, compared to the reference experiment.
Table 3 illustrates the maximum scouring rate and reduction percentage for the 70°cross-section in the bend and 50 Lmin−1 injection flow rate. Table 4 shows the average maximum scour depth reduction for different air cross-attack angles and Froude numbers.
Blanckaert et al. [10] and Dugué et al. [11] reported the maximum reduction in scour depth to be about 50%. The results of Tamoradi et al. [18] and Tamoradi et al. [19] reported the maximum reduction in scour depth as about 91%, 90%, and 63%, respectively, in the main experiments compared to the reference tests. However, in the present study, the maximum reduction in scour depth was about 79.8% (Fr = 0.47 and α = 90°), which can be attributed to the change in the considered variables.
On the other hand, it should be mentioned that one of the advantages of the bubble screen method is the possibility to implement and start-up an air jet system in a relatively short time frame when compared with the construction of embankments or other structural protection methods. However, the required electricity supply needed for the air pump can be considered a significative cost., to address this issue solar power panels can be considered as an option to provide energy.
The experiments here presented were carried out for a range of Reynolds and Froude numbers that can be found in natural rivers [1]. However, the experiments were carried out in a prismatic channel, which is significantly different from natural fluvial geometries (e.g., as depicted in Figure 1). The methodology presented here should therefore be applied to more complex fluvial geometries and the results properly compared. Besides fluvial geometry, it is also important to consider hydraulic conditions closer to the real cases scenarios. In the present case, clear water conditions were used, but further developments should consider other cases, namely with active sediment transport (bedload and suspended). In nature, flow transients occur, for example, due to floods, and the consequences of a changing flowrate should also be tested.
It will also be important to assess if the injected air momentum will be more likely to drive vertically rather than laterally the displacement of the secondary currents, thereby reducing the efficiency regarding the location of the scour. In this sense, an analysis of the air bubble diameter effect is needed for a complete characterization of the air curtain and their influence. Different port diameters should be tested in the lab, model scale, to assess the possible bubble diameter reduction in the prototype [33].
Finally, to assess the energy cost of the bubble air screen technique it should also be analyzed if the system should work 24 h 7 days a week, or if a periodic working cycle can also be considered in order to decrease the energy cost.

4. Conclusions

Experiments were performed under clear water conditions to investigate the effect of the air bubble jet system on bed topography and velocity field in a 90° channel bend. The measurements presented have shown that maximum scour depth depends on non-dimensional parameters such as Froude number, air bubble cross-attack angle with the mainstream, and the ratio of injecting air flow rate to main flow rate.
Regarding the effect of the bubble jet screen on the distribution of flow velocities, in bends without aeration, secondary flows induced by centrifugal forces shift the maximum velocity zone toward the outer wall, resulting in pronounced scouring and bed instability. The introduction of an air bubble screen system generates counter-rotating vortices that effectively redirect the high-velocity core from the outer wall to the channel centerline. This redistribution reduces near-bed velocities and outer bend erosion, while also displacing the thalweg from the outer bank toward the centerline. Overall, the aeration system demonstrates strong potential as a flow control measure to mitigate bend scour and enhance channel stability.
This study also demonstrated the significant impact of an air bubble screen system on secondary flow dynamics, bed morphology, and scour depth in channel bends. In the reference experiments without aeration, centrifugal forces and pressure gradients generated strong secondary flows that displaced the maximum velocity zone toward the outer bank, resulting in intensified scouring. With aeration, the formation of counter-rotating vortices redistributed secondary flow power, displaced the velocity core toward the channel centerline, and reduced the transverse pressure gradient.
The presence of air bubbles also induced notable changes in bed morphology. While the reference test showed progressive scouring from the inner wall to the outer bank with maximum erosion near 70°, aerated cases redirected the maximum scour zone to the channel centerline, where opposing circulation cells intersected. This redistribution reduced outer-bank erosion and corrected sedimentation along the inner wall, with the strongest effect observed at an injection angle of 90°, where bubble jets interacted most effectively with the main flow.
The scour depth measurements further confirmed the efficiency of the aeration system. Compared with the reference case, maximum scour was reduced by 57–79.8% depending on the attack angle, with the greatest reduction achieved under perpendicular injection (α = 90°, Fr = 0.47). These findings are consistent with previous studies but highlight improved performance due to optimized flow and aeration conditions.
Overall, the air bubble screen system proved highly effective in mitigating bend scour, reducing outer-bank erosion, and promoting channel stability. Its performance was strongly dependent on the bubble injection angle, with α = 90° providing the most favorable hydraulic and morphological outcomes.
The results obtained are promising in validating an environmentally friendly solution to reduce scour. However, further studies to validate this technique must be performed to address issues like more complex fluvial geometries and different hydrodynamic conditions.

Author Contributions

Conceptualization: All authors; Methodology: All authors; Software: P.M., R.A. and J.A.; Validation: All authors; Formal Analysis: P.M., R.A., Z.T., H.A.N. and J.A.; Investigation: P.M., R.A., Z.T., H.A.N. and J.A.; Resources: P.M., R.A., Z.T., H.A.N. and J.A.; Data Curation: P.M. and J.A.; Writing—Original Draft Preparation: P.M., R.A., Z.T., H.A.N. and J.A.; Writing—Review and Editing: All authors; Visualization: All authors; Supervision: J.A., S.M.K., M.F.M. and A.J.S.; Project Administration: J.A., S.M.K., M.F.M. and A.J.S.; All authors have read and agreed to the published version of the manuscript.

Funding

This work was supported by the Shahid Chamran University of Ahvaz, Iran, funding number: SCU.WHI402.260.

Data Availability Statement

The original contributions presented in this study are included in the article. Further inquiries can be directed to the corresponding authors.

Acknowledgments

The authors are grateful to the Research Council of the Shahid Chamran University of Ahvaz, for their valuable support.

Conflicts of Interest

The authors declare no conflicts of interest.

References

  1. Graf, W.H. Fluvial Hydraulics: Flow and Transport Processes in Channels of Simple Geometry; John Wiley & Sons: Hoboken, NJ, USA, 1998. [Google Scholar]
  2. Darby, S.E.; Alabyan, A.M.; Van de Wiel, M.J. Numerical simulation of bank erosion and channel migration in meandering rivers. Water Resour. Res. 2002, 38, 2-1–2-21. [Google Scholar] [CrossRef]
  3. Kartal, V.; Emiroglu, M.E. Local scour due to water jet from a nozzle with plates. Acta Geophys. 2021, 69, 95–112. [Google Scholar] [CrossRef]
  4. Pagliara, S.; Palermo, M. Rock grade control structures and stepped gabion weirs: Scour analysis and flow features. Acta Geophys. 2013, 61, 126–150. [Google Scholar] [CrossRef]
  5. Sajjadi, S.M.; Barihi, S.; Ahadiyan, J.; Azizi Nadian, H.; Valipour, M.; Bahmanpouri, F.; Khedri, P. Redesigning the fuse plug, emergency spillway, and flood warning system: An application of flood management. Water 2024, 16, 3694. [Google Scholar] [CrossRef]
  6. Chenari, S.A.; Nadian, H.A.; Ahadiyan, J.; Valipour, M.; Oliveto, G.; Sajjadi, S.M. Enhancing hydraulic efficiency of side intakes using spur dikes: A case study of Hemmat water intake, Iran. Water 2024, 16, 2254. [Google Scholar] [CrossRef]
  7. Najjaran, E.; Kamanbedast, A.A.; Shafai-Bejestan, M.; Masjedi, A.R.; Hasonizadeh, H. Control of river bends migration using a permeable rectangular vane made by six-pillar concrete elements. Iran. J. Sci. Technol. Trans. Civ. Eng. 2021, 45, 1049–1058. [Google Scholar] [CrossRef]
  8. Tamoradi, Z.; Ahadiyan, J. Effect of water and air injection on reduction of bend scour. Can. J. Civ. Eng. 2021, 48, 740–748. [Google Scholar] [CrossRef]
  9. Blanckaert, K.; Graf, W.H. Momentum transport in sharp open-channel bends. J. Hydraul. Eng. 2004, 130, 186–198. [Google Scholar] [CrossRef]
  10. Blanckaert, K.; Buschman, F.A.; Schielen, R.; Wijbenga, J.H. Redistribution of velocity and bed-shear stress in straight and curved open channels by means of a bubble screen: Laboratory experiments. J. Hydraul. Eng. 2008, 134, 184–195. [Google Scholar] [CrossRef]
  11. Dugué, V.; Blanckaert, K.; Chen, Q.; Schleiss, A.J. Influencing flow patterns and bed morphology in open channels and rivers by means of an air-bubble screen. J. Hydraul. Eng. 2015, 141, 04014070. [Google Scholar] [CrossRef]
  12. Blanckaert, K.; De Vriend, H.J. Turbulence structure in sharp open-channel bends. J. Fluid. Mech. 2005, 536, 27–48. [Google Scholar] [CrossRef]
  13. Blanckaert, K.; Graf, W.H. Mean flow and turbulence in open-channel bend. J. Hydraul. Eng. 2001, 127, 835–847. [Google Scholar] [CrossRef]
  14. Blanckaert, K. Topographic steering, flow recirculation, velocity redistribution, and bed topography in sharp meander bends. Water Resour. Res. 2010, 46, W09506. [Google Scholar] [CrossRef]
  15. Blanckaert, K.; De Vriend, H.J. Nonlinear modeling of mean flow redistribution in curved open channels. Water Resour. Res. 2003, 39, 1375. [Google Scholar] [CrossRef]
  16. Vaghefi, M.; Akbari, M.; Fiouz, A.R. An experimental study of mean and turbulent flow in a 180 degree sharp open channel bend: Secondary flow and bed shear stress. KSCE J. Civ. Eng. 2016, 20, 1582–1593. [Google Scholar] [CrossRef]
  17. Shukry, A. Flow around bends in an open flume. Trans. Am. Soc. Civ. Eng. 1950, 115, 751–778. [Google Scholar] [CrossRef]
  18. Tamoradi, Z.; Ahadiyan, J.; Najarchi, M.; Hasounizadeh, H.; Najafizadeh, M.M. Reducing bend scour using in-phase and out-of-phase hydraulic jets. Water Sci. Technol. Water Supply 2019, 19, 1446–1453. [Google Scholar] [CrossRef]
  19. Tamoradi, Z.; Ahadiyan, J. The effect of injection discharge to reduce the bend scour using water injection technique. Water Resour. 2022, 49, 422–428. [Google Scholar] [CrossRef]
  20. Abduo, S.S.; Elmoustafa, A.M.; Salam, M.S.A. Study of counteracting the secondary flow in open channel bends. Ain Shams Eng. J. 2021, 12, 2425–2433. [Google Scholar] [CrossRef]
  21. Champagne, T.M.; Barlock, R.R.; Ghimire, S.R.; Barkdoll, B.D.; Gonzalez-Castro, J.A.; Deaton, L. Scour reduction by air injection downstream of stilling basins: Optimal configuration determination by experimentation. J. Irrig. Drain. Eng. 2016, 142, 04016067. [Google Scholar] [CrossRef]
  22. Seyedashraf, O.; Rezaei, A.; Akhtari, A.A. Application of computational intelligence methods for complex two-phase flow pattern recognition. J. Braz. Soc. Mech. Sci. Eng. 2018, 40, 35. [Google Scholar] [CrossRef]
  23. Rodi, W.; Leschziner, M.A. Calculation of strongly curved open channel flow. J. Hydraul. Div. 1978, 105, 1297–1314. [Google Scholar] [CrossRef]
  24. Tipireddy, R.T.R.; Barkdoll, B.D. Scour reduction by air injection at a cylindrical bridge pier: Experimental determination of optimal configuration. J. Hydraul. Eng. 2019, 145, 06018016. [Google Scholar] [CrossRef]
  25. Zhu, S.J.; Ooi, A.; Skvortsov, A.; Manasseh, R. Modelling underwater noise mitigation of a bubble curtain using a coupled-oscillator model. J. Sound Vib. 2023, 567, 117903. [Google Scholar] [CrossRef]
  26. Kahrizi, E.; Salehi Neyshabouri, S.A.A.; Zeynolabedin, A.; Souri, J.; Akbari, H. Experimental evaluation of two-layer air bubble curtains to prevent seawater intrusion into rivers. J. Water Clim. Chang. 2023, 14, 543–558. [Google Scholar] [CrossRef]
  27. Zhang, E.; Stocchino, A.; De Leo, A.; Fang, J.K.H. Performance assessment of bubbles barriers for microplastic re-mediation. Sci. Total Environ. 2022, 844, 157027. [Google Scholar] [CrossRef] [PubMed]
  28. The Great Bubble Barrier. Cleaning Rivers from Plastic Pollution with Bubbles. Available online: https://thegreatbubblebarrier.com/ (accessed on 1 August 2025).
  29. Atlas Copco. The Right Bubble Curtain for the Right Job. Atlas Copco Czech Republic. Available online: https://www.atlascopco.com/cs-cz/rental/resources/blog/the-right-bubble-curtain-for-the-right-job (accessed on 1 August 2025).
  30. Hitachi Industrial Equipment Systems. Solving the Unintended Impacts of Noise Pollution with Bubble Curtain Technology. HIES Insights. Available online: https://insights.hitachi-ies.com/_ct/17747667 (accessed on 1 August 2025).
  31. Bubble Tubing. Case Studies. CanadianPond.ca. Available online: https://bubbletubing.com/case-studies/ (accessed on 1 August 2025).
  32. Fazli, M.; Ghodsian, M.; Neyshabouri, S.A.A. Scour and flow field around a spur dike in a 90 bend. Int. J. Sediment. Res. 2008, 23, 56–68. [Google Scholar] [CrossRef]
  33. O’Mahoney, T.S.; Oldenziel, G.; Van Der Ven, P. The effect of bubble size on lock-exchange density currents through bubble screens. J. Hydraul. Eng. 2024, 150, 04024006. [Google Scholar] [CrossRef]
Figure 1. (a) Scheme of the bend. (b) Flow patterns in a river bend.
Water 17 02693 g001
Figure 2. Global view of the laboratory apparatus. (a) Flume plan and its dimensions. (b) arbitrary cross-section and attack angle of bubble screen; (c) longitudinal profile of the flume system and parameters.
Water 17 02693 g002
Figure 3. The flume canal and air bubbles system at the laboratory.
Water 17 02693 g003
Figure 4. Long-term experiments to determine the equilibrium time of the scouring depth.
Water 17 02693 g004
Figure 5. (a) Channel bend and electromagnetic 3D-velocity-meter. (b) The perforated air supply tube at the outer bend. (c) Blowing air in a perforated pipe with a specific flow rate (indicate value or remove “specific flow rate”).
Water 17 02693 g005
Figure 6. Flow pattern in different sections along the 90° bend without air bubble screen and Fr = 0.45: (a) 0°; (b) 15°; (c) 45°; (d) 65°; (e) 80°; and (f) 90° and for with air bubble screen, Fr = 0.45: (g) 0°; (h) 15°; (i) 45°; (j) 65°; (k) 80°; and (l) 90°.
Water 17 02693 g006
Figure 7. Longitudinal mean velocity distribution without an air jet injection: (a) near the water surface (Z/h = 0.86) and (b) near the bed (Z/h = 0.27).
Water 17 02693 g007
Figure 8. Longitudinal mean velocity at air jet bubble system: (a) near the bed (Z/h = 0.27) and (b) near the water surface (Z/h = 0.86).
Water 17 02693 g008
Figure 9. Secondary flow power for both experiments with and without the air bubble screen system.
Water 17 02693 g009
Figure 10. Influence of the attack angle, α, on dimensionless bed topography: (a) reference experiment (R39-0-0); (b) RB39-50-45; and (c) RB39-50-90 experiments with the air bubble screen.
Water 17 02693 g010
Figure 11. Comparison of bed morphology: (a) longitudinal bed profiles in reference experiment (R36-0-0); (b) experiments with air bubble screen RB36-48-0, RB36-48-45 and RB36-48-90, Lateral bed profiles in the cross-section at 70°.
Water 17 02693 g011
Table 1. The characteristics of the present research data.
Discharge
Main Flow
Q (Ls−1)
Discharge
Air Jet
q (Ls−1)
Velocity
Air Jet
(ms−1)
Momentum
Air JET
(kg.ms−1)
Momentum
Main Flow
(kg.ms−1)
MAJ/MMF
30.000.503.980.003260.0006664.894
33.000.766.100.007670.0008059.527
36.000.806.370.008350.0009598.707
39.000.836.630.009060.0011258.053
Table 2. Experimental configuration.
Test Labelq
(Lmin−1)
Frα
(°)
Number
of Tests
Rxx-0-0-0.37, 0.41, 0.45, 0.47-4
RB xx-46-0460.37, 0.41, 0.45, 0.4704
RBxx-48-0480.37, 0.41, 0.45, 0.4704
RBxx-50-0500.37, 0.41, 0.45, 0.4704
RBxx-46-45460.37, 0.41, 0.45, 0.47454
RBxx-48-0480.37, 0.41, 0.45, 0.47454
RBxx-50-45500.37, 0.41, 0.45, 0.47454
RBxx-46-90460.37, 0.41, 0.45, 0.47904
RBxx-48-90480.37, 0.41, 0.45, 0.47904
RBxx-50-90500.37, 0.41, 0.45, 0.47904
Total tests 40
Table 3. Maximum scour depth and reduction percentage in cross-section at 70° at different experiments.
RunFrZmaxScour
Reduction %
R30-0-00.372.3-
R33-0-00.414.3-
R36-0-00.457.3-
R39-0-00.479.6-
RB30-50-00.371.152.17
RB 30-50-450.371.056.50
RB30-50-900.370.482.60
RB33-50-00.413.030.23
RB 33-50-450.411.660.80
RB33-50-900.410.588.37
RB36-50-00.453.650.68
RB 36-50-450.451.973.97
RB36-50-900.451.086.30
RB39-50-00.473.860.40
RB39-50-450.473.068.75
RB39-50-900.472.178.13
Table 4. Comparison of the average percentage of maximum scour depth reduction in bend.
Frα = 0°α = 45°α = 90°
0.3747.852.271.0
0.4139.348.680.5
0.4553.067.481.9
0.4759.465.979.8
Disclaimer/Publisher’s Note: The statements, opinions and data contained in all publications are solely those of the individual author(s) and contributor(s) and not of MDPI and/or the editor(s). MDPI and/or the editor(s) disclaim responsibility for any injury to people or property resulting from any ideas, methods, instructions or products referred to in the content.