Article

Prediction of Dam Inflow in the River Basin Through Representative Hydrographs and Auto-Setting Artificial Neural Network

1
Department of Civil Engineering, Chungbuk National University, Cheongju 28644, Republic of Korea
2
School of Civil Engineering, Chungbuk National University, Cheongju 28644, Republic of Korea
*
Author to whom correspondence should be addressed.
Water 2025, 17(18), 2689; https://doi.org/10.3390/w17182689
Submission received: 8 August 2025 / Revised: 8 September 2025 / Accepted: 10 September 2025 / Published: 11 September 2025
(This article belongs to the Special Issue Application of Machine Learning Models for Flood Forecasting)

Abstract

Hydrological prediction under climate change requires representative data selection and adaptable model architecture. This study proposes a two-part methodology to improve deep learning performance in hydrological prediction. The first component, the representative hydrograph extraction technique (RHET), identifies representative inflow patterns from historical records using dynamic time warping (DTW) and K-medoids clustering. Inflow data are segmented by year, annual DTW distances are calculated, and central events are selected. Representative hydrographs serve as training input. The second component is the auto-setting artificial neural network (AS-ANN). The AS-ANN automatically determines its structural parameters by performing pre-training to evaluate performance across different configurations. The proposed approach was applied to the Daecheong Dam basin in South Korea and compared against an artificial neural network (ANN). Results show that the proposed model reduced the minimum root mean squared error (Min RMSE) by approximately 267.51 m3/day in the validation results and by approximately 53.04 m3/day in the prediction results compared to the ANN. Furthermore, the proposed model reduced the root mean square error by 57.28% and improved peak inflow prediction accuracy by 54.00%. The proposed RHET-based AS-ANN is expected to show good performance in learning and predicting hydrological data, including the data used in this study, by replacing existing ANNs.

1. Introduction

Dams are social infrastructures that stabilize water availability and mitigate floods and droughts [1]. Dams minimize human casualties downstream of the dam through water management such as flood control [2]. Dams should be utilized to reduce human casualties through efficient water management. In particular, the use of dams is essential in areas where flood and non-flood seasons are clearly distinguished by season. This is because if less than the average rainfall occurs in a certain period in the basin and the dam reservoir is not filled with water, damage, such as water shortages and droughts, may occur [3]. In the opposite case, if more than the average rainfall occurs in the basin, floods may occur in the downstream area [4].
In the case of South Korea, strong seasonality is observed [4]. According to the annual average precipitation in South Korea from 1981 to 2021, approximately 55.3% of precipitation is concentrated in the flood season from June to August [5,6]. Therefore, in the case of South Korea, damage from natural disasters occurs a lot during the flood season. According to the National Assembly Budget Office in South Korea, damage costs caused by typhoons and heavy rains in South Korea accounted for approximately 88.4% of the annual damage costs [7].
Recent changes in weather have increased the volatility of hydrological data compared to data constructed in the past. For example, in the case of Daecheong dam located in the Geumgang river basin in South Korea, according to the Water Management Information System (WAMIS), when looking at the data from the past 12 years, the inflow in 2023 was approximately 121% of the inflow in 2022 due to extreme rainfall during the flood season (https://www.wamis.go.kr/, accessed on 8 August 2025). Therefore, in order to predict a rapid increase in dam inflow like Daecheong dam, learning and prediction using deep learning (DL) are essential.
DL is a data-based model that learns and predicts by distinguishing input and output data based on the constructed data. DL can be seen as a core technology of the industrial revolution due to its advantage of being able to produce results with high accuracy [8]. However, the biggest drawback of DL and the main problem that needs to be solved is overfitting of the training data [9]. DL performs representation learning based on internal operations on the nonlinear characteristics of the data given for learning [10]. If overfitting occurs during the learning process, DL begins to learn only random regularities for the training data [9]. Overfitting occurs when data different from the pattern of data used in the learning process is input during the prediction process [11]. When overfitting occurs, DL improves learning performance, but prediction accuracy decreases [12]. However, DL is generally used in the process of deriving future prediction values through learning and prediction using long-term measurement data [13,14]. If the pattern of the measurement data constructed in the process of using long-term measurement data is different from the pattern to be predicted, there is a possibility that the prediction performance of DL may deteriorate. Therefore, the pattern of the data must be considered when predicting hydrological data using DL. If DL is performed using all of the past 12 years of data, overfitting may occur, resulting in reflecting only the past data pattern.
There are two main methods for constructing optimal data to prevent overfitting. The first is input data construction based on analysis of individual input features. Input feature selection plays a crucial role in the simulation process using soft computing models, including DL [15]. Representative examples of input feature selection include principal component analysis (PCA) and subset selection by maximum dissimilarity (SSMD) [15,16]. Among input feature selection techniques, SSMD generates subsets based on the data and selects training and test sets to ensure stable statistical characteristics, such as maximum, minimum, and standard deviation [16]. However, PCA and SSMD, which select input features that constitute input data, have limitations in constructing training data that consider patterns in the established long-term data. A second method for constructing optimal data to prevent overfitting is representative data selection, which considers data patterns. As mentioned earlier, overfitting occurs when data that differs from the data patterns used in the DL process is input during the prediction process. Therefore, when constructing long-term data, it is necessary to eliminate biased data during the learning process.
Previous research has utilized deep learning to predict the inflow of Daecheong Dam with high accuracy. Ref. [17] proposed Adaptive Moments Combined with Improved Harmony Search (AdamIHS), which improves the optimizer operator of ANNs based on a multilayer perceptron (MLP) in DL. Using the proposed AdamIHS, they trained and predicted the inflow of Daecheong Dam, located in South Korea. The MLP with the proposed AdamIHS demonstrated higher accuracy than the existing MLP. Ref. [18] used a DL with an improved optimizer to analyze the influence of input factors on the input data, constructing an optimal input dataset for training and prediction of Daecheong Dam inflow. This study used a DL with a new optimizer and analyzed the influence of input factors through XAI analysis to construct new input datasets for training and prediction. However, these studies focused solely on improving the optimizer operator in DL. Because the focus has been on improving the internal operators of DL, research on preventing overfitting caused by hidden layers and hidden nodes has been limited.
DL should improve the learning performance of deep learning by using long-term measurement data, but overfitting caused by data should be prevented. If insufficient data preparation is performed, DL performance may deteriorate, and overfitting may occur [19]. In addition, the complexity of DL should be optimized through optimization of the number of DL cycles and structure [20]. In order to prevent overfitting, the data input to DL and the structure of DL should be optimized. In this study, new method was applied to control overfitting to the structure to prevent overfitting caused by hidden layers and hidden nodes that were not previously considered. There are four main ways to control overfitting for the structure of DL. First, the user manually designs the structure of DL before learning, second, the structure of DL is designed according to the learning process, and third, the structure of DL is redesigned when the learning performance of DL is not good [21]. Fourth, there is a ground-based review of basin-related time-series data, such as hydrological and meteorological data. DL uses existing data to classify input and output data and then learn to produce prediction results. Therefore, it is essential to construct input data based on data highly relevant to the output data to be predicted. In order to prevent overfitting of DL, the variability and diversity of data input to DL must be considered. In order to prevent data different from the pattern of data used in the learning process from being input during the prediction process, optimal data including diversity must be constructed.
In this study, a data construction technique and a DL construction technique are proposed to improve the usability and performance of DL in the hydrological application process. The data construction technique is a representative hydrograph extraction technique (RHET) that has representativeness based on the entire constructed data. The RHET is a method that extracts representative hydro events by utilizing unsupervised learning among long-term data. The DL construction technique is an auto-setting neural network (AS-ANN). The AS-ANN is an artificial neural network (ANN) that selects its own structure during the learning process among DLs. The AS-ANN is a technique developed based on the concept of designing the structure of DL according to the learning process. The AS-ANN is a technique that proposes a self-adaptive method for selecting all operators for the structure of DL in advance. To compare the performance of the proposed technique, the AS-ANN with the RHET was applied to the same target basin as the existing ANN. The target basin is Daecheong dam in South Korea. The input and output data for the DL used to predict Daecheong dam inflow were collected from WAMIS (https://www.wamis.go.kr/).

2. Methodology

2.1. Overview

The purpose of this study is to improve the verification and prediction accuracy compared to the existing DL by utilizing the input data of DL produced based on the RHET and AS-ANN. Therefore, the development of two technologies is targeted. The first is the development of the RHET and the second is the development of the AS-ANN. The accuracy of inflow prediction was compared by applying the RHET and AS-ANN to the Daecheong dam basin. The data for DL training is 12 years of long-term data (daily data from 2013 to 2024), and the data for verification is 2 years of data (daily data from 2022 to 2023). Figure 1 is a conceptual diagram showing the learning and prediction process based on the proposed RHET and AS-ANN.
According to Figure 1, the technology proposed in this study consists of two parts. First, there is a representative hydrograph calculation using dynamic time warping (DTW) based on existing measured data [22]. The optimal hydrograph is calculated by calculating the DTW for each year based on the data on the inflow measured in each year. Second, there is the AS-ANN that builds a structure through pre-learning based on the existing ANN. The AS -ANN is a method to set the ANN based on the structure that shows the optimal error in the pre-learning process. Finally, in this study, we compare and analyze the performance of the proposed technology through verification and prediction after learning the AS -ANN using the RHET, with DTW as learning data.

2.2. Representative Hydrograph Extraction Technique

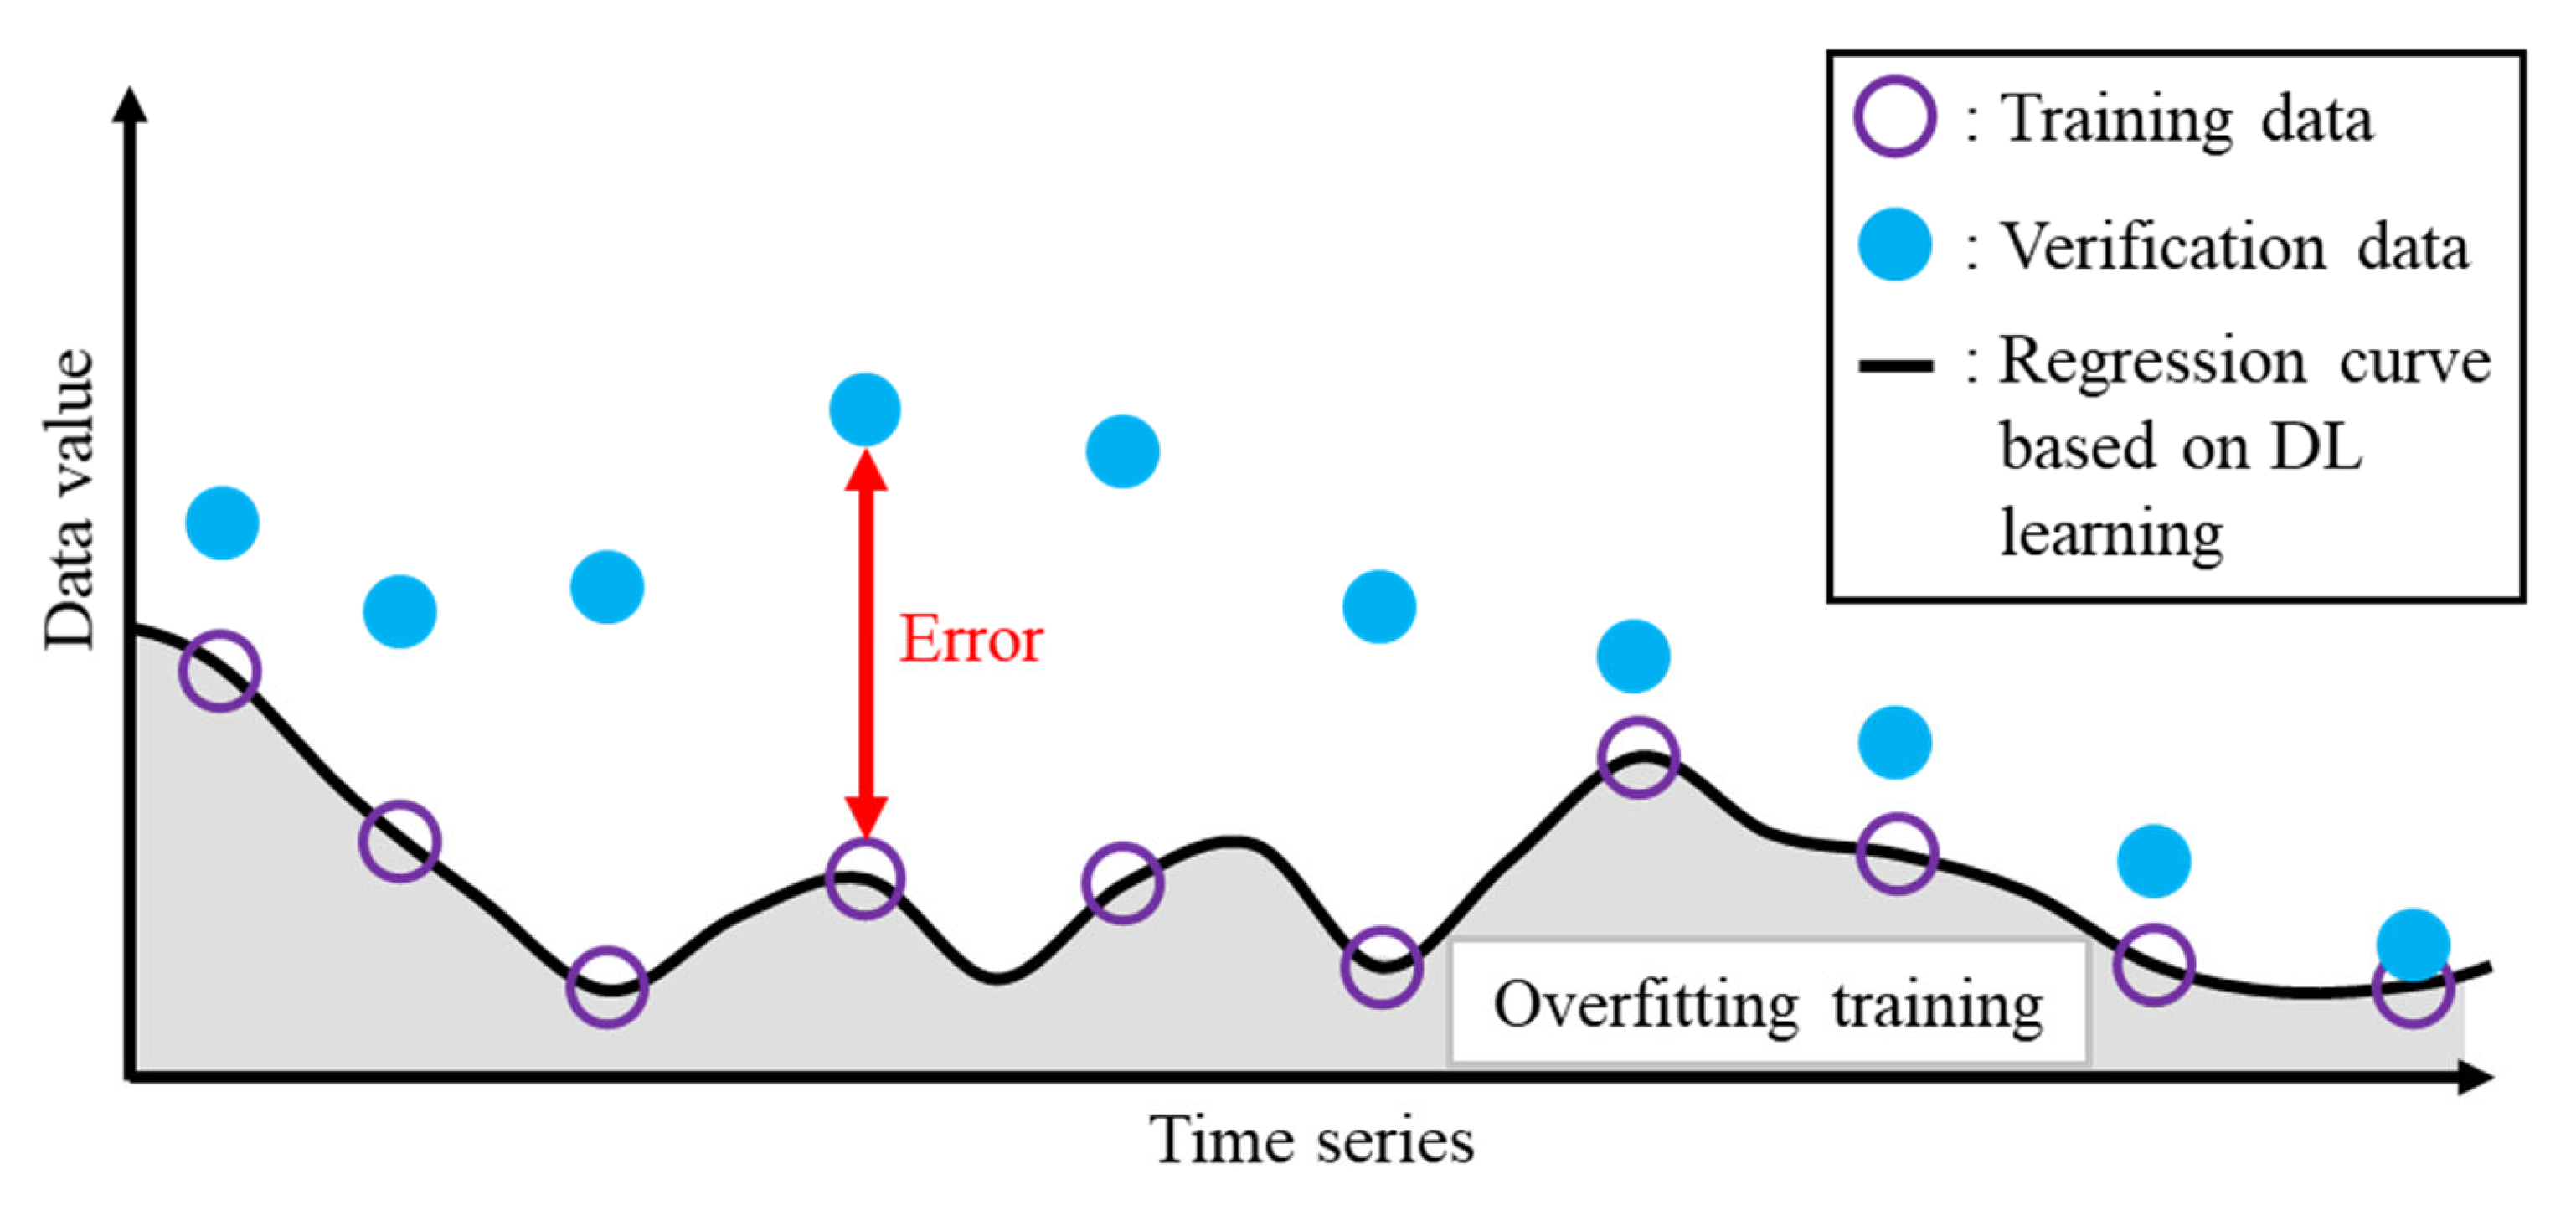
DL learns and predicts through internal operations based on data constructed for learning. However, if there is a large difference between the training data and the verification data, overfitting occurs in DL [23]. In other words, if learning is performed only by relying on the patterns of the learning data in the learning process using DL, if a new pattern different from the existing pattern is input as verification or prediction data, the error in the output results will be large. The reason why overfitting occurs in the learning process of DL is that there are situations where only limited patterns are learned due to the lack of diversity in data [24]. The situation where overfitting occurs in terms of data is conceptually represented as in Figure 2.
According to Figure 2, the data patterns of the training data are different from the data patterns of the verification data. It can be seen that the results produced by the DL learned using the training data are different from the verification data when a new pattern of input data is input. This situation is that the DL that learned the pattern of the DL’s training data produces an incorrect result when a new pattern of verification data is given.
DL performs representation learning that learns nonlinear patterns based on the given data [10]. If training data that reflects various nonlinear patterns is not used in DL, the possibility of overfitting increases. Therefore, when the training data is collected over a long period of time, it is necessary to select the data so that overfitting does not occur during the DL process.
The RHET proposed in this study generates a representative hydrograph through unsupervised learning of machine learning based on long-term accumulated data. The representative hydrograph is selected based on the output data, which is the dependent variable. The process of generating a representative hydrograph using the RHET is as follows:
  • Establishment of full-period data for the target basin;
  • Division of data by year;
  • Calculation of mutual DTW by annual event using the results of 2;
  • Selection of the center point using DTW-based K-medoids clustering;
  • Selection of data based on the center point.
According to the RHET process, it can be seen that the mutual DTW of the collected annual event data is calculated and clustering is performed through unsupervised learning, K-medoids clustering. Therefore, the RHET is largely conducted using DTW and K-medoids clustering. DTW is a technique for measuring the similarity of two time series data. The process of calculating DTW between two time series is as follows:
D T W i , j   =   d x i , y j   +   m i n D T W ( i     1 , j ) D T W ( i , j     1 ) D T W ( i     1 , j     1 )  
where DTW(i,j) is the DTW value between the data of i and the data of j, and d(xi, yj) is the Euclidean distance between the two data of i and j. d(xi, yj) can be organized as follows:
d x i , y j   =   ( x i , y j ) 2  
where xi is the i-th data of time series data x, and yj is the j-th data of time series data y. Mutual DTW is calculated and matrixized using DTW based on annual measured hydrological data. Medoids are then produced through K-medoids clustering based on the annual mutual DTW matrix.
K-medoids clustering is a type of clustering technique that groups given data through clustering [25]. Clustering techniques can be broadly divided into K-mean clustering and K-medoids clustering. K-mean clustering is a method of selecting k center points and assigning all objects to the selected center points [26]. K-mean clustering has low computational cost, but is sensitive to outliers [27]. K-medoids clustering was used due to the shortcomings of K-mean clustering. Unlike K-mean clustering, which uses center points as average values, K-medoids clustering selects center points based on actual input data [28]. Therefore, K-medoid clustering has the characteristic that the objects represented by the center points can be viewed as actual data. Figure 3 is a conceptual diagram showing the operation results of K-mean clustering and K-medoid clustering.
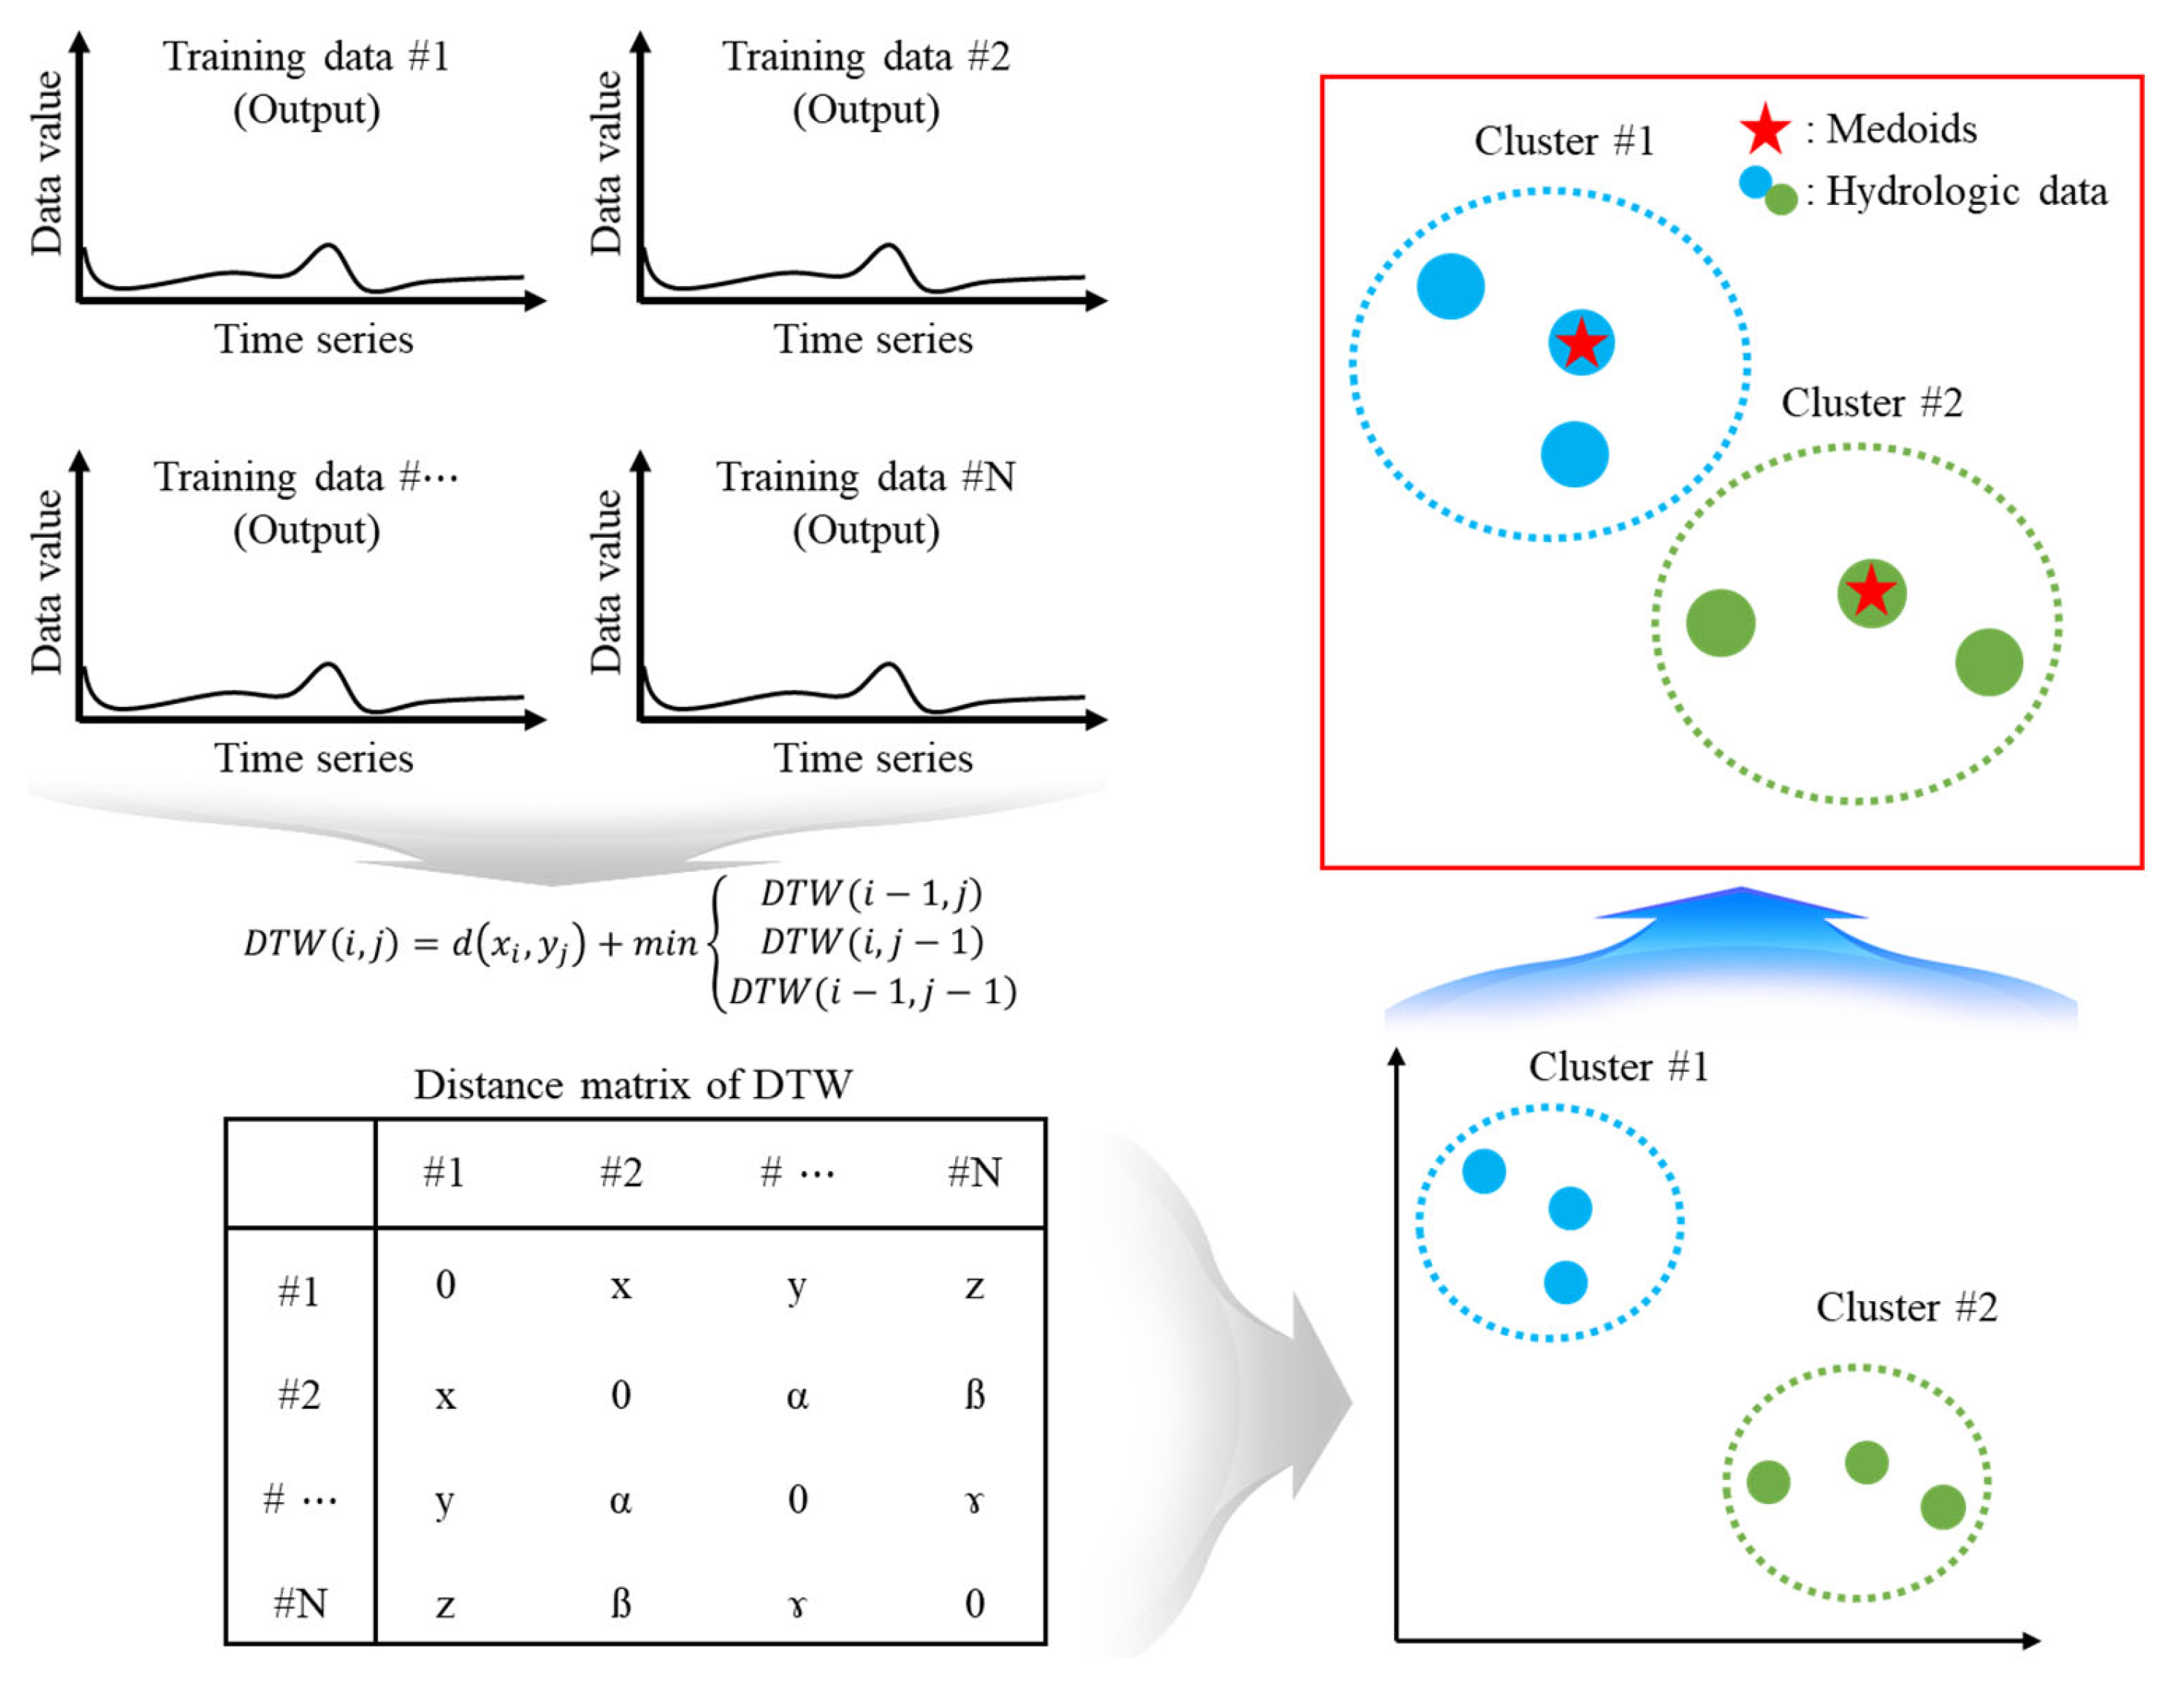
According to Figure 3, K-mean clustering generates a virtual centroid based on the given original data, and K-medoids clustering selects medoids from the actual data. Therefore, it can be seen that K-medoids clustering is suitable for selecting representative actual data. In this study, the distance is analyzed using DTW based on the data for each event in each year, and this is used as the input data for K-medoids clustering. Ultimately, the central data is intended to be selected based on the actual data using K-medoids clustering. The entire process of producing a representative hydrograph using the RHET is conceptualized and represented as shown in Figure 4.
According to Figure 4, DTW for time series is obtained based on a large number of collected training data and a DTW distance matrix is created. K-medoids clustering is performed based on the DTW distance matrix. Figure 4 explains the clustering process using a two-dimensional coordinate plane for conceptualization (in detail, K-medoids clustering performs clustering by utilizing the DTW distance between other datasets based on an arbitrary dataset among the DTW distance matrices.).
Using the RHET, representative hydrographs are selected for the set number of clusters. The selected hydrographs are medoids of the clusters, and since they are medoids, actual data selection is possible. The RHET selects representative hydrology data for each cluster through clustering based on the constructed hydrology data. The final result produced using the RHET is data representing the constructed hydrology data.

2.3. Auto Setting Artificial Neural Network

DL, including the ANN, sets the structure and internal operator parameters to build the structure of DL for learning and prediction. The structural parameters include the number of hidden nodes and the number of hidden layers. The internal operator parameters include the activation function and the optimizer. The description of the structural parameters and internal operator parameters is as shown in Table 1.
According to Table 1, DL consists of four main parameters. The four main parameters are set by the user based on their experience. DL performance is affected by the structure and internal operator parameters. Therefore, the trial and error method should be used to set the optimal structure and internal operator. In order to improve the usability of the existing DL and increase the usability while improving the learning and prediction performance, the DL with the self-adaptive method should be used. The proposed AS-ANN is a DL with the self-adaptive method based on pre-learning. Table 2 is the pseudo code of the AS-ANN.
According to Table 2, the AS-ANN is finally set through three stages. The first stage is to set the number of hidden nodes, the second stage is to set the number of hidden layers, and finally the activation function and optimizer. The AS-ANN sets hidden nodes, hidden layers, activation functions, and optimizers during the learning process. Therefore, the training data is used, and the hidden nodes, hidden layers, activation functions, and optimizers are selected and then verified based on the data. For AS-ANN development, Python 3.9 software was used, and the development was performed in an environment equipped with a 2.90 GHz Intel (R) Core (TM) i7-10700 CPU (Intel Corporation, Santa Clara, CA, USA) and an NVIDIA Geforce GTX 1660 GPU (NVIDIA Corporation, Santa Clara, CA, USA). Training, validation, and prediction were also performed independently in the same environment.
According to the first stage, initially, hidden nodes are placed based on one hidden layer. The placement of hidden nodes increases from 1 and stops according to the criteria defined by the user. In this study, the root mean squared error (RMSE) is set assuming that the number just before the increase is optimal in the process of decreasing and then increasing four times in succession. According to the second stage, hidden layers are set. The setting of hidden layers is performed in the same way as the first stage. According to the third stage, the optimizer and activation function are set. In the case of the optimizer and activation function, since there is no concept of increasing or decreasing, the operator showing the lowest RMSE is selected based on the results of the combination. The RMSE for operator selection is calculated through internal calculations. The error between the AS-ANN learning results and the observed values (correct or true values) is analyzed. The error analysis was not linked to an external program, but rather was performed through internal function calls within the Python program.

3. Results

3.1. Study Area

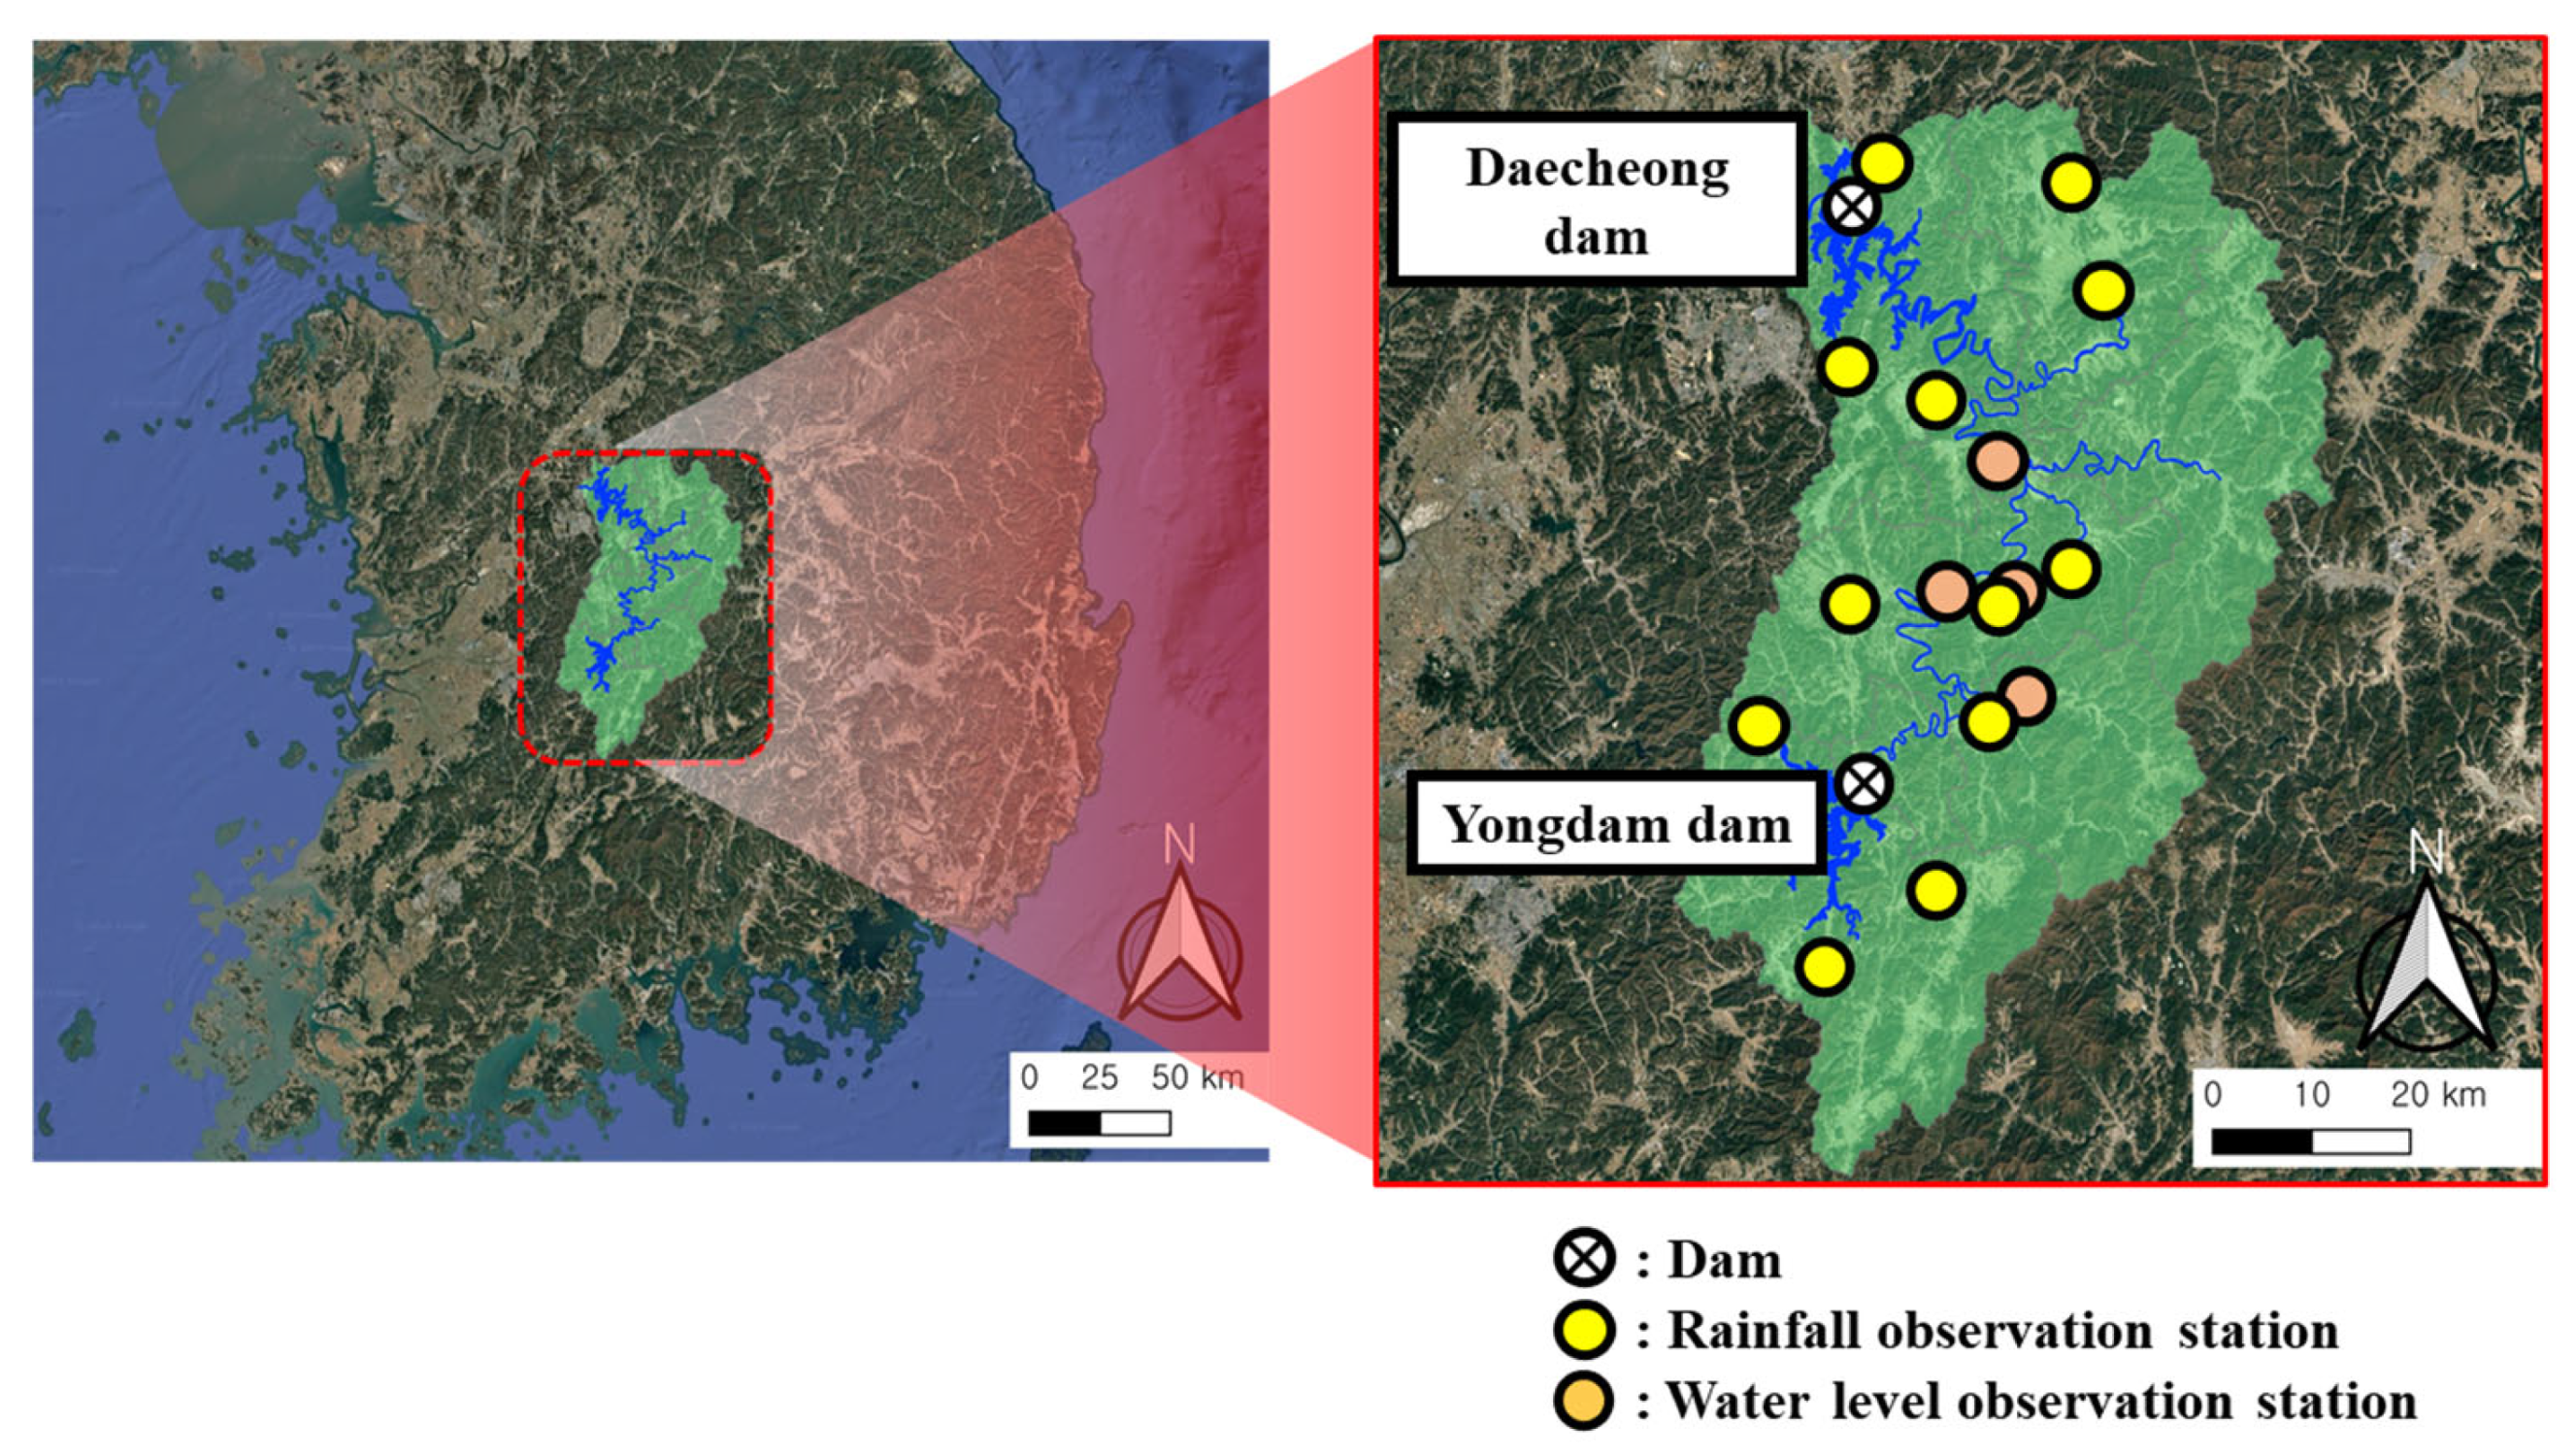
In order to analyze the performance of the RHET-based AS-ANN proposed in this study, the inflow of Daecheong dam located in Cheongju, South Korea was predicted. Daecheong dam is a multipurpose dam that plays the role of water management and flood control. According to the inflow of Daecheong dam measured in the past, the inflow has changed due to extreme rainfall caused by recent weather changes. The maximum daily inflow from 2013 to 2019 was approximately 2004.4 m3/day. However, on 9 August 2020, Daecheong dam recorded an inflow of 7596.6 m3/day, which is approximately 379% of the past inflow. According to a report by the Ministry of Environment of the Republic of Korea, on 9 August 2020, Daecheong dam exceeded the flood season limit water level (EL. 76.50 m) of Daecheong dam due to the continuous inflow, recording EL. 77.54 m [29]. Due to the increase in inflow from Daecheong dam, the discharge volume was rapidly increased, and the highest annual water level was measured in the river directly downstream of Daecheong dam [29]. Due to the rapid fluctuation of inflow from Daecheong dam, there were damages to life and property in the upstream and downstream of Daecheong dam. Therefore, this study aims to predict the inflow of Daecheong dam with high accuracy using the RHET and AS-ANN based on the existing measured hydrological data as a preemptive measure to prepare for the fluctuation of inflow due to extreme rainfall caused by abnormal climate. Figure 5 is a diagram showing the study area.
According to Figure 5, a total of 17 input data are used to predict the inflow of Daecheong dam. The input data was selected based on a previous study predicting the inflow of Daecheong Dam [18]. The 17 input data are organized into three categories. The first is the discharge amount of the upstream dam, the second is the rainfall observation station data, and the third is the water level observation station data. The detailed input data organized by each category are as shown in Table 3.
According to Table 3, out of the total number of collected input data, 1 is the discharge amount of Yongdam dam, an upstream dam, 4 are data from water level observation stations between Yongdam dam and Daecheong dam, and 12 are data from rainfall observation stations near the target basin. Data were collected by input data category to establish basic data for applying the RHET.

3.2. Collection of Hydrological Data and Application of RHET

In order to predict the inflow of Daecheong dam, where the recent maximum daily inflow has been extremely variable due to climate change, daily data were collected since 2013. Starting from 2013, hydrological and meteorological data were collected for 2024, including 2020, when the maximum daily inflow changed. The collected data are the same as the input data in Table 3. Based on the collected data, learning, verification, and prediction data for DL, including the AS-ANN, were constructed.
To compare the performance of DL learned based on the constructed data and the performance of the AS-ANN learned based on the RHET, hydrological data were constructed using two methods. The first is the traditional input data construction method. In order to learn DL based on the constructed data, data from 2013 to 2024 were used, data for verification from 2022 to 2023, and data for prediction from 2024. The second is the RHET-based input data construction method. In order to learn the AS-ANN based on the RHET, representative hydrographs through the application of the RHET were used as learning data, data for verification from 2022 to 2023, and data for prediction from 2024.
Based on the constructed data, data preprocessing was applied to improve the learning and prediction performance of DL including the AS-ANN. The applied data preprocessing is normalization and time lagged cross correlation (TLCC). Normalization is a method applied when the deviation of the constructed data is large, and can improve the learning and prediction performance of DL when applied [30]. The normalization formula is as follows:
N i   =   x i     x m i n x m a x     x m i n
where Ni is the i-th data converted using normalization, xi is the i-th raw data, xmax is the maximum value of the raw data, and xmin is the minimum value of the raw data.
Arrival time refers to the time when the impact of an event, including rainfall, reaches the target point when an arbitrary event occurs [31,32]. Therefore, the arrival time must be considered when constructing data to simulate deep learning. TLCC analyzes the correlation coefficient by delaying the input or output data by a constructed time unit until the absolute value of the correlation coefficient is the highest. The cross correlation formula used to calculate TLCC is as follows:
C C =   i   =   1 n ( x i     x ¯ ) × ( y i     y ¯ ) i   =   1 n ( x i     x ¯ ) 2 × i   =   1 n ( y i     y ¯ ) 2
where CC is the correlation coefficient, xi and yi are the time series data, x ¯ and y ¯ are the average value of the xi and yi. When applying TLCC to data collected to predict inflow to Daecheong Dam within the target basin, all 17 input data items showed a lag time of one day. Therefore, to apply TLCC, the input data was constructed by delaying the output data by one day.
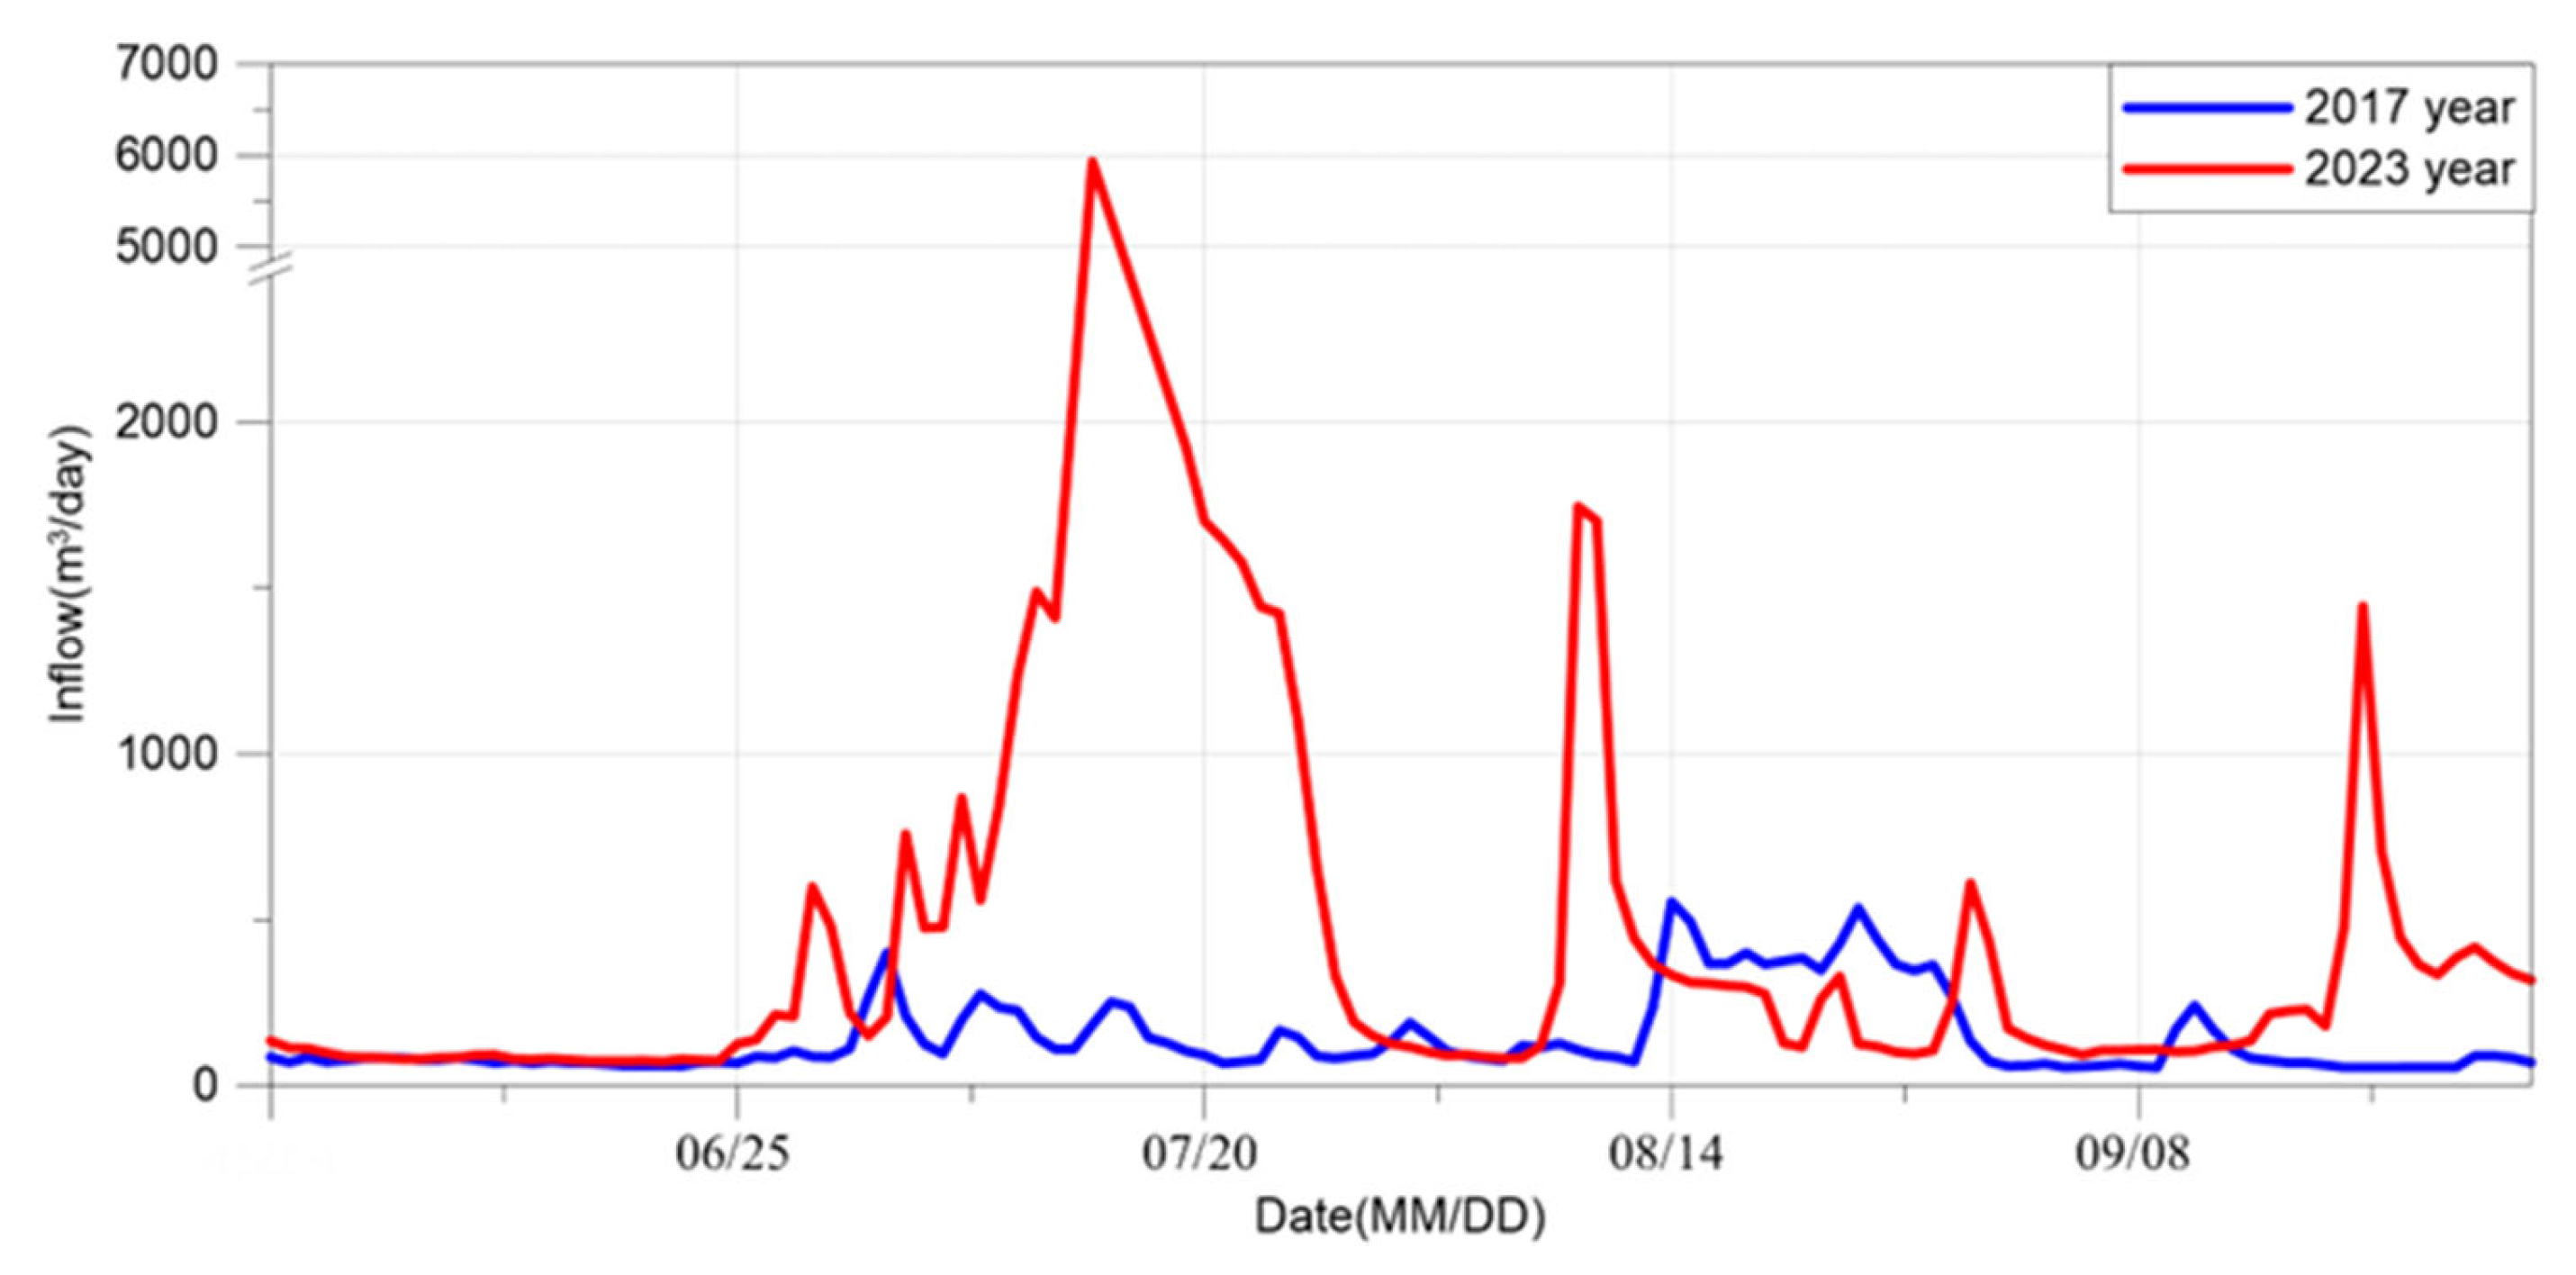
The RHET was applied based on data to which data preprocessing was applied. The number of clusters must be set to apply the RHET. In this study, the number of clusters was set to 2 in the process of applying k-medoids clustering after calculating DTW to select hydrological data that best represents the variability of flood season data. The RHET constructs a distance matrix using DTW and then performs clustering. The conceptual representation of the clustering process is shown in Figure 4. In the process of clustering hydrological data, in order to best represent the variability of data, traditionally measured hydrological data and hydrological data with a lot of variability must be selected. Therefore, the hydrological data were clustered into two groups and then medoids were selected. The representative hydrograph of the inflow of Daecheong dam selected by applying the RHET is shown in Figure 6.
According to Figure 6, the representative hydrographs of the Daecheong dam inflow produced by the RHET are from 2013 to 2024, and are from 2017 and 2023. The hydrographs of 2017 and 2023 have different characteristics. The biggest characteristic of the hydrographs of 2017 and 2023 is the difference in peak inflow. In 2017, the peak inflow that occurred during a one-year period was 553.7 m3/day on 15 August, but in 2023, it was 5930.2 m3/day on 15 July. The peak inflows of the two hydrographs are different in both the amount of inflow and the time of occurrence. This is because they were placed in different clusters during the clustering process. The hydrographs of 2017 and 2023 are the central ideas as medoids of each cluster. It can be seen that the hydrological data of the corresponding period is representative among the constructed hydrological data. Therefore, it was used as learning material for learning the AS-ANN based on the RHET.

3.3. Verification and Prediction Results Analysis of RHET-Based AS-ANN

In Section 3.2, the representative hydrographs derived from the RHET were used to learn, verify, and predict the AS-ANN. In order to compare the results of the AS-ANN, a DL ANN was used. The ANN used was based on specifications that showed good performance in learning and predicting hydrological data in the existing literature. The specifications of the ANN and AS-ANN used for learning, verification, and prediction of Daecheong dam inflow are as shown in Table 4.
According to Table 4, the AS-ANN does not set the structural parameters Hidden node and Hidden layer, and the operators Optimizer and Activation function. The structural parameters and operators are parameters that must be set to build an ANN. However, the AS-ANN has the advantage that the user does not need to set the structural parameters and operators because the AS-ANN is set by themselves during the pre-learning process. The performance of the ANN learned based on existing data and the performance of the AS-ANN learned based on the RHET were compared. The results were produced through 10 repeated runs using both techniques. Table 5 shows the verification results produced using each DL.
According to Table 5, the Min RMSE of the AS-ANN is 199.52 m3/day, which shows an error improvement of approximately 267.51 m3/day compared to the ANN. In addition, the Average RMSE of the AS-ANN is 276.67 m3/day, which shows an error improvement of approximately 244.03 m3/day. Based on these results, the AS-ANN utilizing the RHET can improve the error from approximately 46.87% to 57.28% compared to the existing ANN. The accuracy of the AS-ANN increases as the Min RMSE decreases, and the average RMSE decreases, which shows that the AS-ANN can produce more stable results than the ANN. The results according to each DL were analyzed for the peak inflow that occurred during the verification period. Table 6 shows the results of the peak inflow during the verification period calculated using each DL.
According to Table 6, it can be seen that the AS-ANN utilizing the RHET, which is the same as Table 5, shows a lower error than the ANN. The error of the AS-ANN is 1358.14 m3/day, which is about 23.89% reduced compared to the existing ANN. Unlike the ANN, the AS-ANN learns through a representative hydrograph utilizing the RHET. Therefore, the AS-ANN does not have long-term learning data compared to the ANN. The AS-ANN, which is learned with input data that is not long-term, has a lower possibility of overfitting than the ANN. Therefore, the AS-ANN, which does not overfit, has the advantage of being able to produce results with a relatively lower error than the ANN. Figure 7 is a graph showing the verification results of each DL by time.
According to Figure 7, both the AS-ANN and ANN showed similar patterns to the observed data in the verification results. Additionally, the period during which peak inflow occurred was expanded and analyzed. According to the expanded graph, both the AS-ANN and ANN show similar patterns to the observed data. Each technique produced results on the graph that peak inflow would occur on 15 July 2023, and showed a downward trend in inflow on 17 July 2023 and an upward trend on 19 July 2023. However, each technique showed differences in values from the observed data. The AS-ANN produced similar results to the ANN on 15 July 2023, when peak inflow occurred, but the AS-ANN produced results with relatively accurate values. In addition, the AS-ANN produced results with higher accuracy than the ANN for the time after peak inflow occurred.
Based on the verification results of the Daecheong dam inflow, it can be seen that the verification results of the Daecheong dam inflow using the RHET-based AS-ANN have higher accuracy than the verification results of the Daecheong dam inflow using the ANN. The AS-ANN performs learning using the representative hydrograph calculated based on the RHET. The representative hydrograph is data for two years out of the total 11 years of data constructed. Based on the verification results of the AS-ANN learned based on the representative hydrograph, it can be seen that peak inflow and total period inflow can be effectively predicted when the representative hydrograph is used.
Based on the verification results of Daecheong dam inflow using the RHET-based AS-ANN and the full data-based ANN, Daecheong dam inflow prediction for 2025 was conducted. Daecheong dam inflow prediction was conducted using the existing learned DL model. Table 7 shows the prediction results for each technique.
According to Table 7, the AS-ANN has lower Min RMSE, Max RMSE, and Average RMSE than the ANN for predicting Daecheong Dam inflow. In terms of Min RMSE, the AS-ANN is approximately 348.24 m3/day, which is approximately 53.04 m3/day lower than the ANN. Based on the Min RMSE results, the AS-ANN demonstrates higher accuracy in learning-based prediction performance than the ANN. Similarly, for Max RMSE, the AS-ANN also has lower values than the ANN. In terms of Max RMSE, the AS-ANN is approximately 492.63 m3/day, which has a lower error by approximately 163.11 m3/day compared to the ANN, and the Average RMSE of the AS-ANN is approximately 348.24 m3/day, which is 134.44 m3/day lower than the ANN. As a result of applying the AS-ANN and ANN to predict the inflow of Daecheong Dam, the AS-ANN shows higher accuracy and stability in prediction than the ANN.
In the case of the AS-ANN and ANN, the method of selecting the structure of DL built for learning is different. In the case of the ANN, the structure is set according to the trial and error method, sensitivity analysis, and user experience, but in the case of the AS-ANN, parameters and operators for the structure are selected through pre-learning. Based on the characteristics and prediction results of each technique, the AS-ANN shows improved accuracy and usability compared to the ANN.
The AS-ANN has different input data used for learning from the ANN. In the case of the AS-ANN, representative hydrographs using the RHET are used. Since the AS-ANN does not cause overfitting through representative hydrograph-based learning, the AS-ANN produces results with lower errors for the entire period compared to the ANN. Therefore, it can be seen that learning of DL using representative hydrographs improves accuracy compared to existing DL methods. Table 8 shows the error for each technique for the time when peak inflow occurred during the Daecheong dam inflow prediction period.
According to Table 8, the error for peak inflow is 823.94 m3/day for the AS-ANN, which is improved by about 973.27 m3/day compared to 1797.21 m3/day for the ANN. As mentioned above, the AS-ANN has structural improvements over the ANN, but it uses representative hydrographs using the RHET in the process of constructing learning data. DL has a disadvantage in that overfitting occurs and prediction performance deteriorates when data with a different pattern from the learning data are input. However, in the case of representative hydrographs using the RHET, only the data that become medoids among the existing learning data are extracted and constructed as learning data. Therefore, it can be seen that the problem of overfitting can be improved when representative hydrographs using the RHET are used as input data for DL. Figure 8 is a graph showing the prediction results for each technique by time zone for the prediction period.
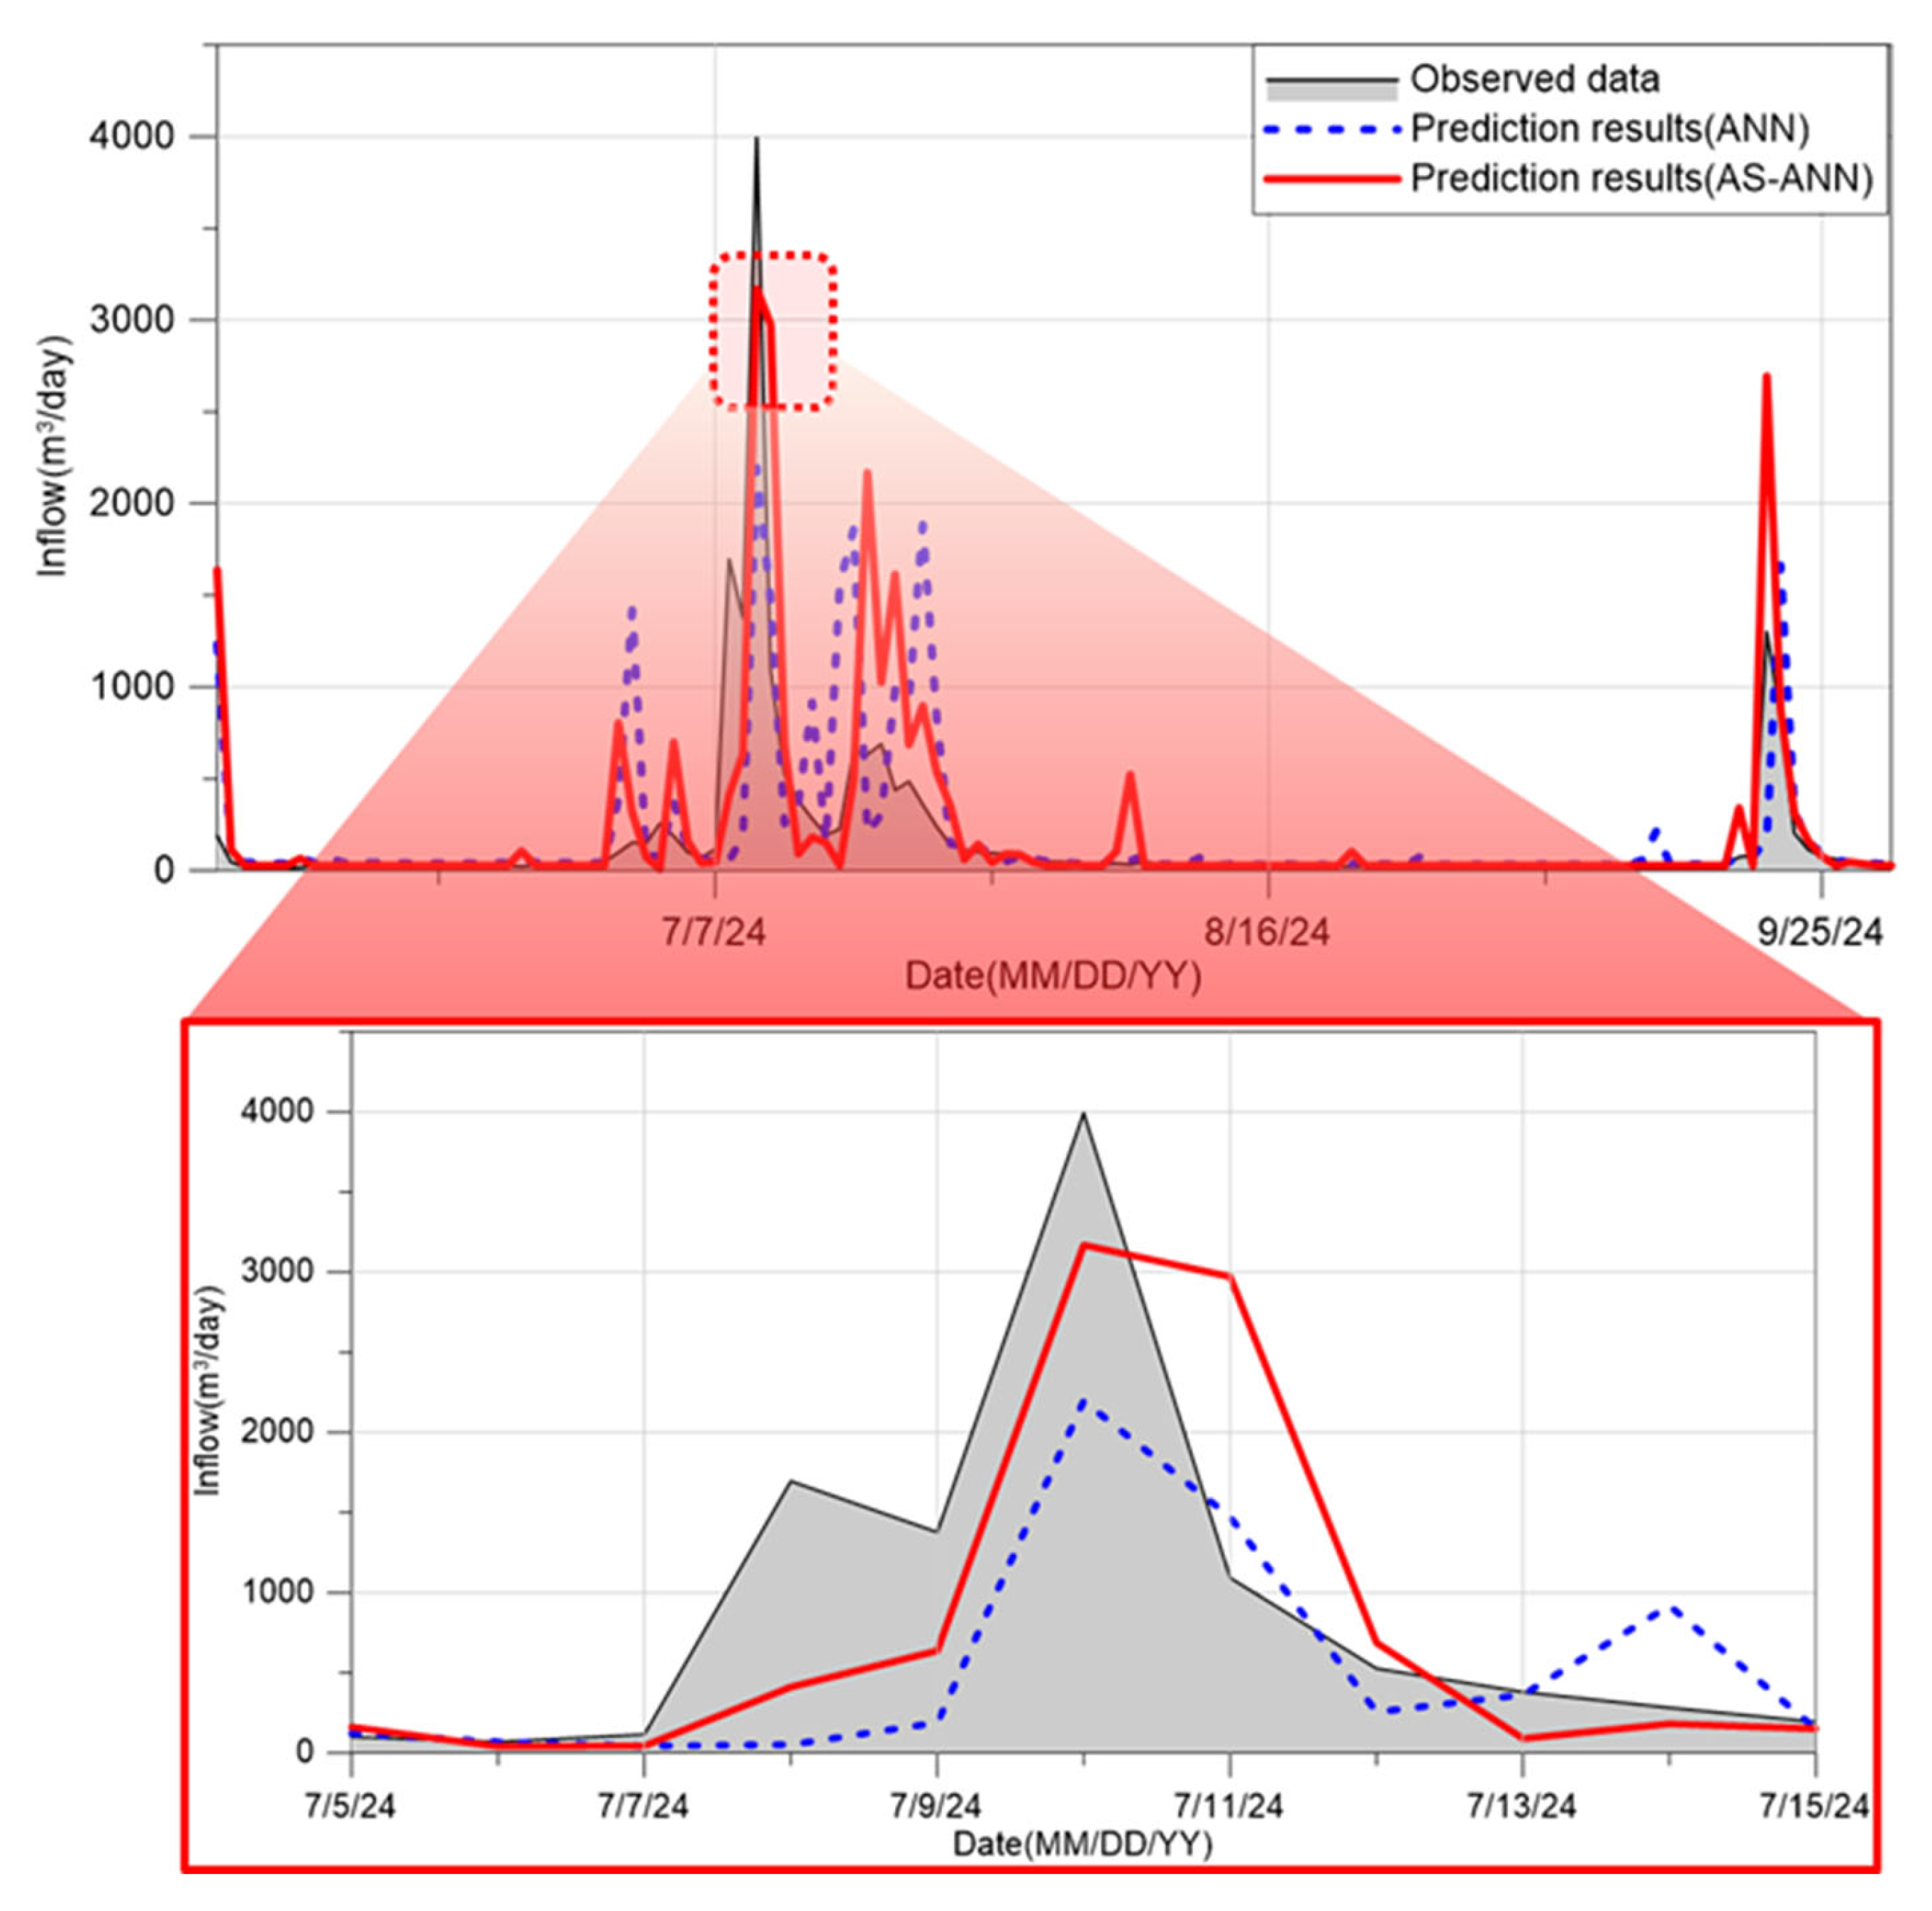
According to Figure 8, both techniques tend to overestimate overall. The overestimation intervals can be divided into four: the early part of the prediction period, just before the peak inflow, just after the peak inflow, and the latter part of the prediction period. If the results of each technique and the observed data are compared for the four intervals, the prediction results increase as the observed data increases. However, the prediction results of each technique increase relatively rapidly.
DL is a data model that learns patterns and produces prediction results. Therefore, it is analyzed that the results appear because a pattern different from the pattern according to the feature that constitutes the input data was input during the prediction process. The results of the Daecheong dam inflow prediction are analyzed to be due to an increase in the observed value of the feature that constitutes the input data located upstream of Daecheong dam. As a result of comparing the peak inflow for the prediction period, it can be seen that the prediction result using the AS-ANN has less error than the prediction result using the ANN. The AS-ANN proceeds with learning by utilizing representative hydrographs using the RHET. As mentioned above, the AS-ANN has less overfitting than the ANN due to learning by utilizing the RHET. In the case of the ANN, the error in the prediction result for peak inflow was large because the pattern of the learning data and the pattern of the prediction data were different. However, the AS-ANN prevented overfitting by utilizing representative hydrographs, so it is judged that it produced a prediction result for peak inflow that was more accurate than the ANN.

4. Discussion

The AS-ANN is a technique proposed to improve the usability and performance of existing DL models, including ANNs, by setting the structural parameters and internal operators. Conventional DL models require configuration of structural parameters (hidden layers and hidden nodes) and internal operators (activation functions and optimizers). However, these structural parameters and internal operators are set through user experience and sensitivity analysis. The AS-ANN uses a pre-training process to set each parameter to improve DL usability and performance.
The AS-ANN and DL share the requirement to set each structural parameter and internal operator before the training process. To compare the AS-ANN’s usability performance with that of ANNs, the number of operations required for structure selection was compared. Equation (5) was used to compare the number of operations required for structure selection.
N O R = N u b N l b × L u b L l b ×   α P ( a ) 1 × β P ( o ) 1
where NOR is the number of operations required, Nub is the hidden node’s upper boundary, Nlb is the hidden node’s lower boundary, Lub is the hidden layer’s upper boundary, Llb is the hidden layer’s lower boundary, α is the number of activation functions used, β is the number of optimizers used, P(a) is the number of combinations that can occur due to the number of activation functions used, and P(o) is the number of combinations that can occur due to the number of optimizers used. Table 9 shows the NOR for each technique calculated using Equation (5).
According to Table 9, the AS-ANN has a lower NOR by 621 than the ANN. The number of operations used to build the structure of DL was reduced by about 85% in the AS-ANN compared to the ANN. The ANN used in this study was set based on previous research. Therefore, in order to estimate the NOR of the ANN, the NOR used to select the structure and operator of previous research was calculated and compared with the AS-ANN. The AS-ANN performs pre-termination and setting of structural parameters for parameter setting based on the criteria set by the user in the pre-learning process. Therefore, it shows a lower NOR than the ANN that builds the structure of DL by conducting sensitivity analysis. The AS-ANN shows a lower NOR than the previous ANN in the process of building the structure for DL, and based on the results, it can be seen that the AS-ANN can terminate the pre-learning process earlier than the ANN.

5. Conclusions

In this study, the AS-ANN based on the RHET was proposed. The AS-ANN based on the RHET was applied to accurately predict dam inflow while simultaneously improving the usability and performance of DL. The proposed RHET utilizes the RHET, which derives representative hydrographs when training data is collected over a long period of time, to reduce overfitting during the learning process. The AS-ANN is a new form of DL that self-adaptively configures DL hyperparameters (hidden layers and hidden nodes) and internal operators (activation functions and optimizers) during the learning process.
The RHET applies DTW-based K-medoids clustering to derive representative hydrographs, which represent representative data from long-term hydrological data. Applying the RHET allows for the selection of representative hydrographs during the DL input data construction process, resulting in optimal DL input data. Based on the optimal DL input data, the AS-ANN was used for learning and prediction. To compare the performance of the RHET-based AS-ANN, a RHET-based AS-ANN was trained, verified, and predicted the inflow of Daecheong Dam, and compared the results with those of a conventional ANN.
According to the validation results of the Daecheong Dam inflow using the RHET-based AS-ANN and ANN, the RHET-based AS-ANN achieved a Min RMSE of approximately 199.52 m3/day, an improvement of approximately 57.30% over the ANN’s Min RMSE of 467.03 m3/day. The AS-ANN’s Average RMSE was approximately 276.67 m3/day, an improvement of approximately 46.87% over the ANN’s Average RMSE of 520.74 m3/day. The validation results for peak inflows occurring during the validation period showed that the RHET-based AS-ANN showed an approximately 23.89% improvement in peak inflow error compared to the ANN.
There are two major differences between the RHET-based AS-ANN and ANN. First, there is the difference in the data construction process, and second, there is the difference in DL. ANNs, like traditional methods, use all existing long-term data as training data. However, REHT-based AS-ANNs utilize REHT to construct training data using representative hydrograph data representing the representativeness of the long-term data. Therefore, RHET-based AS-ANNs have the advantage of eliminating data that causes overfitting during the training process compared to conventional ANNs.
According to the prediction results for Daecheong dam inflow by different techniques, the RHET-based AS-ANN improved the Min RMSE, Max RMSE, and Average RMSE by approximately 13.22%, 24.87%, and 25.01%, respectively, compared to the ANN. Furthermore, the RHET-based AS-ANN improved the peak inflow error during the prediction period by approximately 54.15% compared to the ANN.
The performance differences between the RHET-based AS-ANN and the ANN stem from the differences in the DL used in the learning and prediction processes. However, due to the nature of DL, these differences also arise from differences in the data construction process. DL uses a data model to learn patterns based on training data and outputs output when input prediction data. Therefore, if the patterns in the training data differ from those in the prediction data, overfitting occurs, resulting in poor prediction performance. The RHET generates representative hydrographs to prevent overfitting among long-term training data. Therefore, AS-ANNs with the RHET are expected to produce higher-accuracy validation and prediction results than conventional ANNs.
However, the RHET used in this study was limited to generating representative hydrographs. Future research, including representative hydrographs, is expected to expand the scope and applicability of the RHET to a wider range of hydrological data, including water quality and groundwater. Furthermore, the AS-ANN does not automatically configure epochs, the number of training cycles used for training. Proposing a technique to analyze priorities during the structural parameter setting process and configure structural parameters, including epochs, and internal operators would significantly enhance usability. Furthermore, the RHET-based AS-ANN used in this study constructed input data using a total of 17 input features. These 17 input features were selected based on previous research. However, prediction results show that the RHET-based AS-ANN experienced some overfitting. To effectively reduce overfitting and improve model accuracy, validation and reconstruction of the input features are necessary. Therefore, future research is needed to construct input data through validation of input features, such as SSMD and explainable artificial intelligence.

Author Contributions

Y.M.R. and E.H.L. carried out the literature survey and drafted the manuscript. Y.M.R. worked on subsequent drafted the manuscript. Y.M.R. performed the simulations. E.H.L. conceived the original idea of the proposed method. All authors have read and agreed to the published version of the manuscript.

Funding

This research was supported by a grant (RS-2025-02313776) of the Regional Customized Disaster-Safety R&D Program funded by Ministry of Interior and Safety (MOIS, Republic of Korea).

Data Availability Statement

Dataset available on request from the authors.

Conflicts of Interest

The authors declare no conflicts of interest.

References

  1. Di Baldassarre, G.; Wanders, N.; AghaKouchak, A.; Kuil, L.; Rangecroft, S.; Veldkamp, T.I.; Garcia, M.; van Oel, P.R.; Breinl, K.; Van Loon, A.F. Water shortages worsened by reservoir effects. Nat. Sustain. 2018, 1, 617–622. [Google Scholar] [CrossRef]
  2. Lee, S.; Kang, D. Analyzing the effectiveness of a multi-purpose dam using a system dynamics model. Water 2020, 12, 1062. [Google Scholar] [CrossRef]
  3. Lee, M.H.; Im, E.S.; Bae, D.H. Future projection in inflow of major multi-purpose dams in South Korea. J. Wetl. Res. 2019, 21, 107–116. [Google Scholar]
  4. Kim, Y.; Yu, J.; Lee, K.; Chung, H.I.; Sung, H.C.; Jeon, S. Impact assessment of climate change on the near and the far future streamflow in the Bocheongcheon Basin of Geumgang river, South Korea. Water 2021, 13, 2516. [Google Scholar] [CrossRef]
  5. Park, C.Y.; Moon, J.Y.; Cha, E.J.; Yun, W.T.; Choi, Y.E. Recent Changes in Summer Precipitation Characteristics over South Korea. J. Korean Geogr. Soc. 2008, 43, 324–336. [Google Scholar]
  6. Korea Meteorological Administration. Climate Change Forecast Analysis Report for Korean Peninsula; Meteorological Administration: Seoul, Republic of Korea, 2018.
  7. National Assembly Budget Office. Disaster Damage Support System Status and Analysis of Financial Needs; National Assembly Budget Office: Seoul, Republic of Korea, 2019.
  8. Sarker, I.H. Deep learning: A comprehensive overview on techniques, taxonomy, applications and research directions. SN Comput. Sci. 2021, 2, 1–20. [Google Scholar] [CrossRef] [PubMed]
  9. Jabbar, H.; Khan, R.Z. Methods to avoid over-fitting and under-fitting in supervised machine learning (comparative study). Comput. Sci. Commun. Instrum. Devices 2015, 70, 978–981. [Google Scholar]
  10. Ahmed, S.F.; Alam, M.S.B.; Hassan, M.; Rozbu, M.R.; Ishtiak, T.; Rafa, N.; Mofijur, M.; Ali, A.B.M.S.; Gandomi, A.H. Deep learning modelling techniques: Current progress, applications, advantages, and challenges. Artif. Intell. Rev. 2023, 56, 13521–13617. [Google Scholar] [CrossRef]
  11. Piotrowski, A.P.; Napiorkowski, J.J. A comparison of methods to avoid overfitting in neural networks training in the case of catchment runoff modelling. J. Hydrol. 2013, 476, 97–111. [Google Scholar] [CrossRef]
  12. Lee, W.J. Improvement of Multi Layer Perceptron Using Adaptive Moments and Harmony Search: Focused on Daecheong Dam Inflow Prediction. Master’s Thesis, Chungbuk National University, Cheongju-si, Republic of Korea, 2024. [Google Scholar]
  13. Zuo, G.; Luo, J.; Wang, N.; Lian, Y.; He, X. Decomposition ensemble model based on variational mode decomposition and long short-term memory for streamflow forecasting. J. Hydrol. 2020, 585, 124776. [Google Scholar] [CrossRef]
  14. Lee, W.J.; Lee, E.H. Runoff prediction based on the discharge of pump stations in an urban stream using a modified multi-layer perceptron combined with meta-heuristic optimization. Water 2022, 14, 99. [Google Scholar] [CrossRef]
  15. Riahi-Madvar, H.; Gharabaghi, B. Pre-processing and Input Vector Selection Techniques in Computational Soft Computing Models of Water Engineering. In Computational Intelligence for Water and Environmental Sciences; Springer: Singapore, 2022; pp. 429–447. [Google Scholar]
  16. Riahi-Madvar, H.; Dehghani, M.; Parmar, K.S.; Nabipour, N.; Shamshirband, S. Improvements in the explicit estimation of pollutant dispersion coefficient in rivers by subset selection of maximum dissimilarity hybridized with ANFIS-firefly algorithm (FFA). IEEE Access 2020, 8, 60314–60337. [Google Scholar] [CrossRef]
  17. Lee, W.J.; Lee, E.H. Improvement of multi layer perceptron performance using combination of adaptive moments and improved harmony search for prediction of Daecheong Dam inflow. J. Korea Water Resour. Assoc. 2023, 56, 63–74. [Google Scholar]
  18. Ryu, Y.M.; Lee, E.H. Development of dam inflow prediction technique based on explainable artificial intelligence (XAI) and combined optimizer for efficient use of water resources. Environ. Model. Softw. 2025, 187, 106380. [Google Scholar] [CrossRef]
  19. Aliferis, C.; Simon, G. Overfitting, underfitting and general model overconfidence and under-performance pitfalls and best practices in machine learning and AI. In Artificial Intelligence and Machine Learning in Health Care and Medical Sciences: Best Practices and Pitfalls; Springer: Berlin/Heidelberg, Germany, 2024; pp. 477–524. [Google Scholar]
  20. Bilmes, J. Underfitting and Overfitting in Machine Learning. UW ECE Course Notes, 5. 2020. Available online: https://people.ece.uw.edu/bilmes/classes/ee511/ee511_spring_2020/overfitting_underfitting.pdf (accessed on 8 August 2025).
  21. Bejani, M.M.; Ghatee, M. A systematic review on overfitting control in shallow and deep neural networks. Artif. Intell. Rev. 2021, 54, 6391–6438. [Google Scholar] [CrossRef]
  22. Pothuganti, S. Review on over-fitting and under-fitting problems in Machine Learning and solutions. Int. J. Adv. Res. Electr. Electron. Instrum. Eng. 2018, 7, 3692–3695. [Google Scholar]
  23. Senin, P. Dynamic Time Warping Algorithm Review. Information and Computer Science Department University of Hawaii at Manoa Honolulu, USA, 2008, 855(1–23), 40. Available online: https://seninp.github.io/assets/pubs/senin_dtw_litreview_2008.pdf (accessed on 8 August 2025).
  24. Xiao, M.; Wu, Y.; Zuo, G.; Fan, S.; Yu, H.; Shaikh, Z.A.; Wen, Z. Addressing overfitting problem in deep learning-based solutions for next generation data-driven networks. Wirel. Commun. Mob. Comput. 2021, 1, 8493795. [Google Scholar] [CrossRef]
  25. Han, J. Spatial clustering methods in data mining: A survey. In Geographic Data Mining and Knowledge Discovery; CRC Press: Boca Raton, FL, USA, 2001; pp. 188–217. [Google Scholar]
  26. MacQueen, J. Multivariate observations. In Proceedings of the 5th Berkeley Symposium on Mathematical Statisticsand Probability, Berkeley, CA, USA, 27 December 1965–7 January 1966; Volume 1, pp. 281–297. [Google Scholar]
  27. Park, H.S.; Jun, C.H. A simple and fast algorithm for K-medoids clustering. Expert Syst. Appl. 2009, 36, 3336–3341. [Google Scholar] [CrossRef]
  28. Kaufman, L.; Rousseeuw, P.J. Finding Groups in Data: An Introduction to Cluster Analysis; John Wiley & Sons: Hoboken, NJ, USA, 2009. [Google Scholar]
  29. Ministry of Environment. 2020 Flood Damage Survey (2nd) (Nakdong River, Geumgang River, Seomjin-Yeongsan River Area), Korea 2021. Available online: https://www.archives.go.kr/next/newsearch/searchTotalUp.do?selectSearch=1&upside_query=2020%EB%85%84+%ED%99%8D%EC%88%98%ED%94%BC%ED%95%B4%EC%83%81%ED%99%A9%EC%A1%B0%EC%82%AC (accessed on 8 August 2025).
  30. Nawi, N.M.; Atomi, W.H.; Rehman, M.Z. The effect of data pre-processing on optimized training of artificial neural networks. Procedia Technol. 2013, 11, 32–39. [Google Scholar] [CrossRef]
  31. Kite, G.W. Frequency and Risk Analyses in Hydrology; Water Resources Publications: Lone Tree, CO, USA, 1977; 224p. [Google Scholar]
  32. Loaiciga, H.A.; Mariño, M.A. Recurrence interval of geophysical events. J. Water Resour. Plan. Manag. 1991, 117, 367–382. [Google Scholar] [CrossRef]
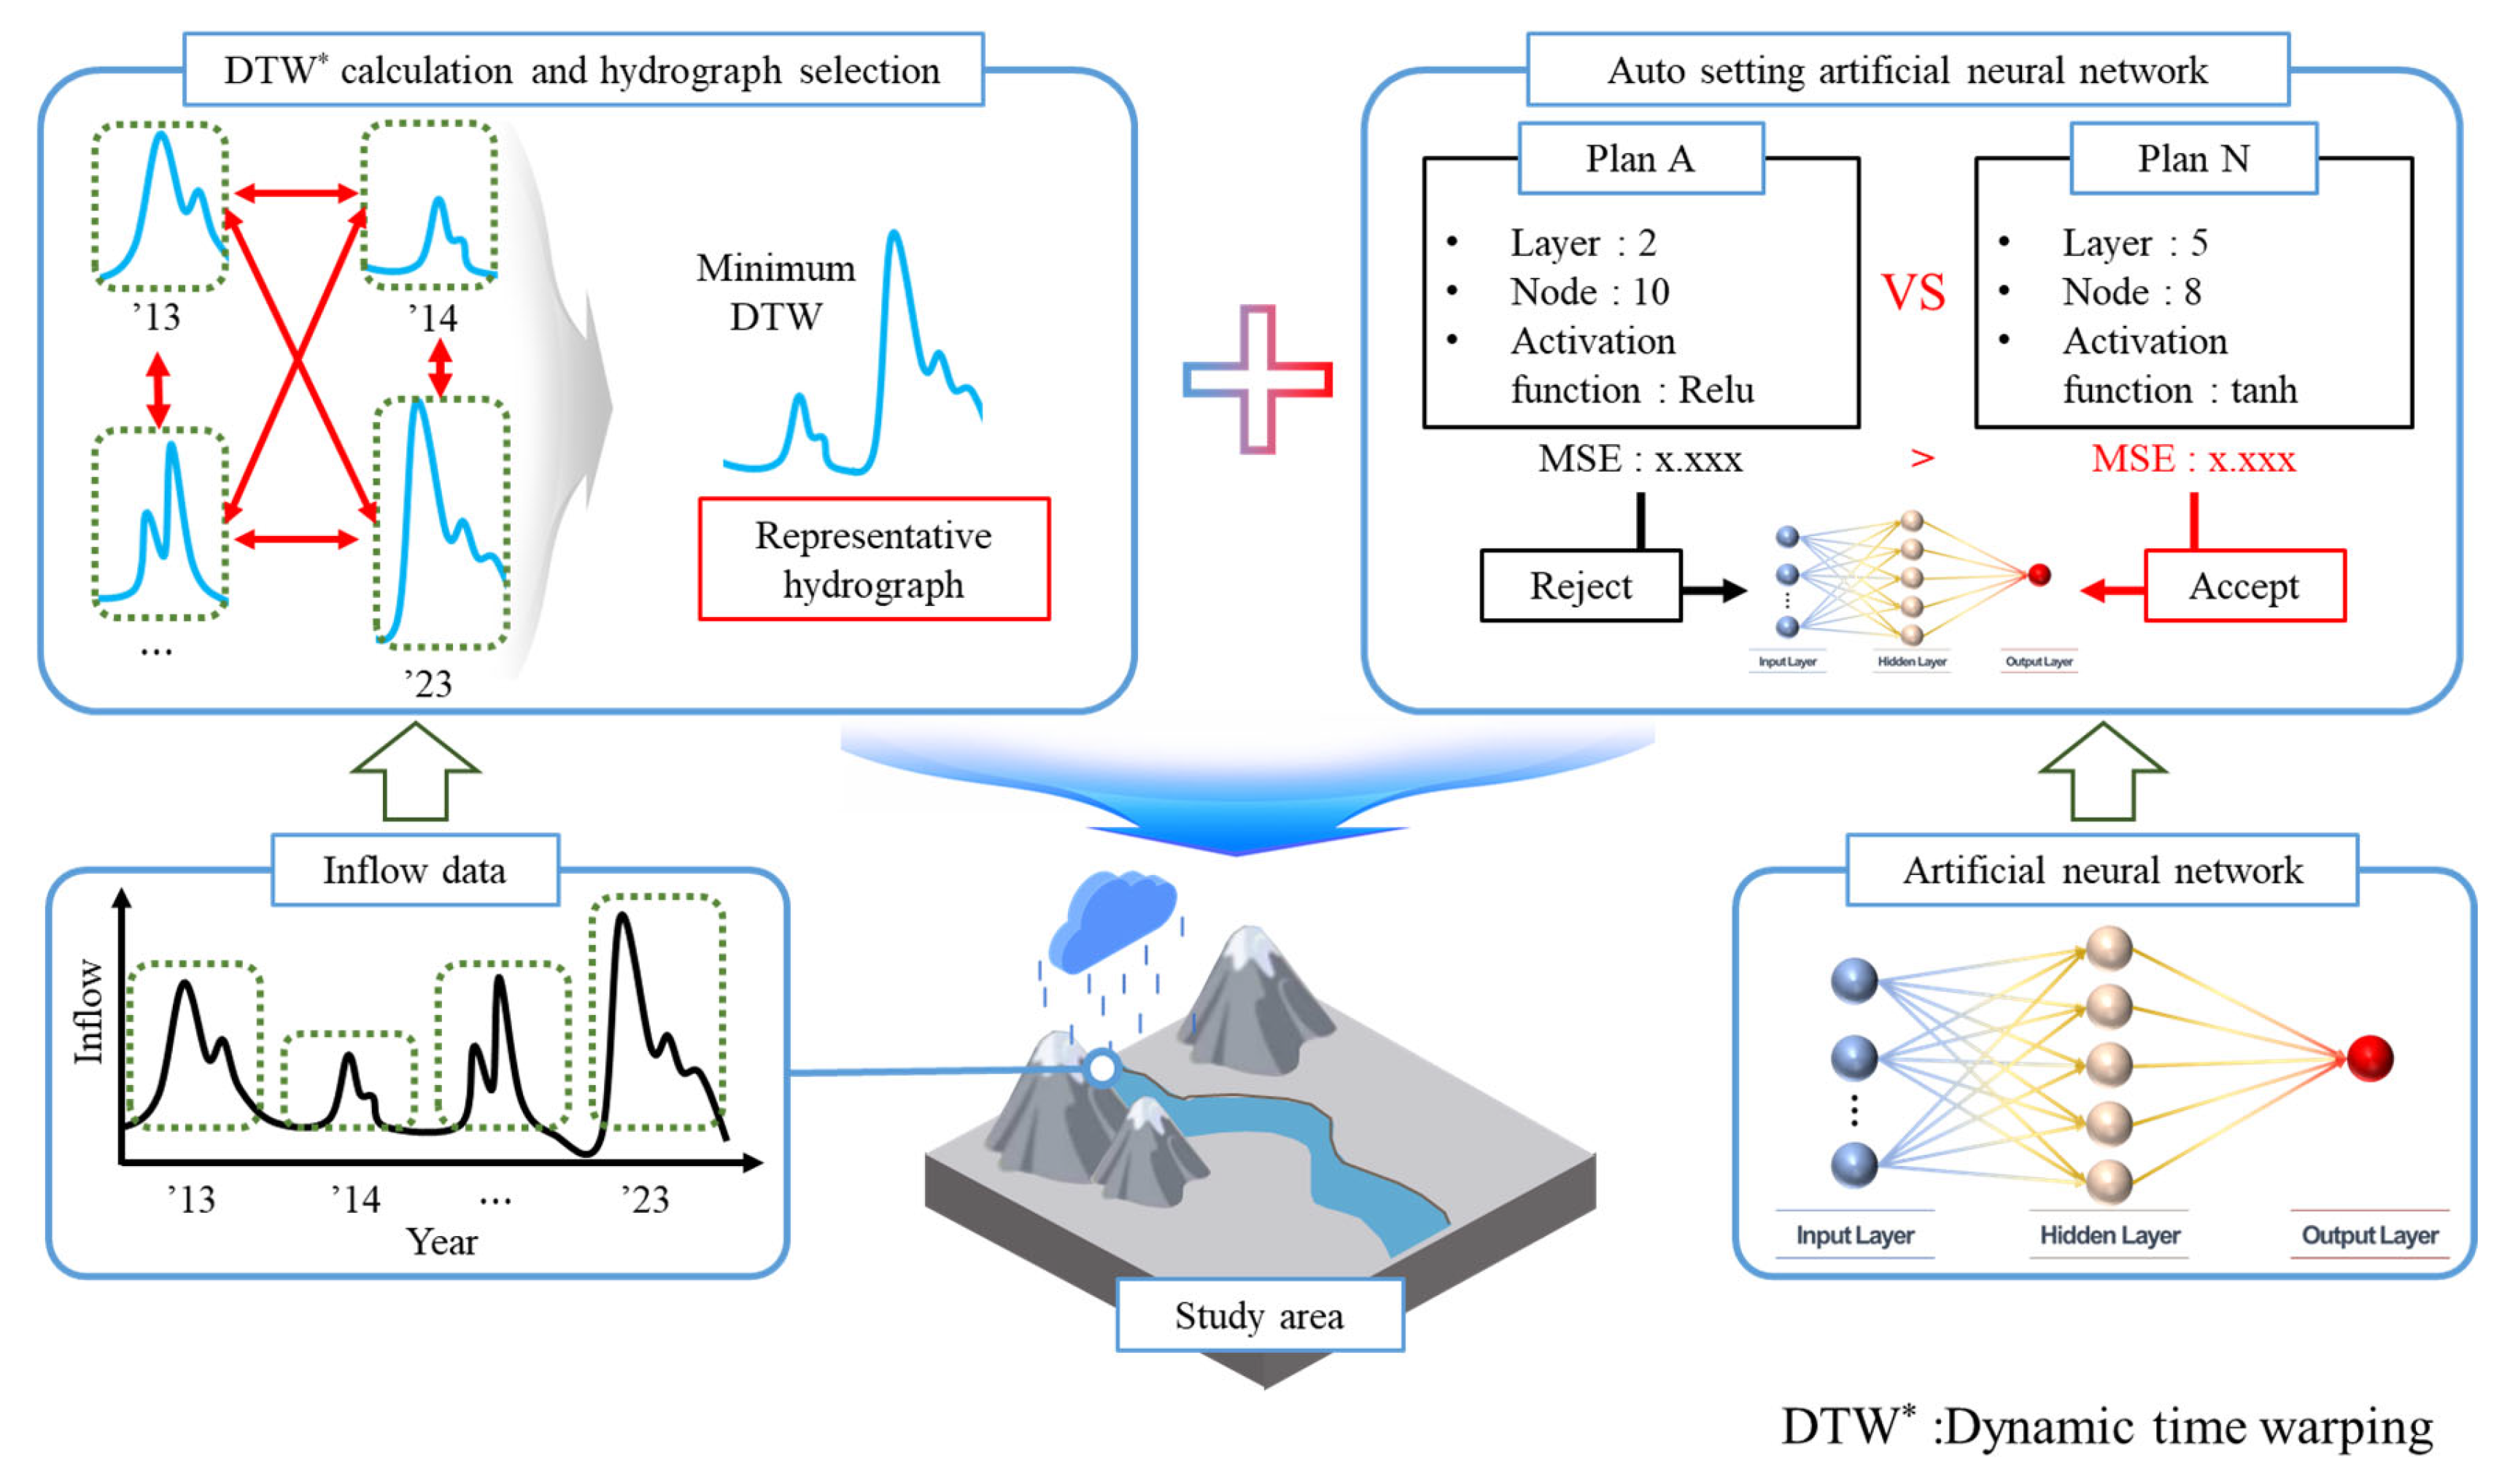
Figure 1. Conceptual diagram of production of representative hydrograph and AS-ANN.
Water 17 02689 g001
Figure 2. Overfitting situation caused by data.
Water 17 02689 g002
Figure 3. Centroid and medoid derivation results using K-mean clustering and K-medoids clustering.
Water 17 02689 g003
Figure 4. Conceptual diagram of representative data selection method of RHET with DTW and K-medoids clustering applied.
Water 17 02689 g004
Figure 5. Study area and observation station status.
Water 17 02689 g005
Figure 6. Application results of RHET.
Water 17 02689 g006
Figure 7. Verification results of ANN and AS-ANN by time.
Water 17 02689 g007
Figure 8. Prediction results of ANN and AS-ANN by time.
Water 17 02689 g008
Table 1. Category and description by DL parameters.
CategoryParameterDescription
Structure parameterHidden nodeA node existing in the hidden layer, one of the variables that determines the complexity of DL during the learning and prediction process.
Hidden layerA layer added between the input and output layers for nonlinear learning and high-accuracy learning of DL (a layer containing hidden nodes)
Internal operatorActivation functionAn operator that determines whether information is transmitted during the process of transmitting information from node to node.
OptimizerOperator that searches for weights and biases that produce minimum errors during the learning process of DL based on training data
Table 2. Pseudo code of AS-ANN.
Input: Input data (X), Output data (Y)
Output: Optimal (Layer, Node, Activation, Optimizer) combination with lowest RMSE

Step 1: Determine optimal number of nodes
For node = 1 to max_node:
   For r = 1 to Number of repeats:
     Build ANN with 1 hidden layer of size ‘node’, activation = ‘ReLU’
     Compute RMSE on validation set
   Compute average RMSE for this node
   If RMSE decreases 4 times and increases once:
     Break
Select node with lowest average RMSE → best_node

Step 2: Determine optimal number of layers
For layer = 1 to max_layer:
   For r = 1 to Number of repeats:
     Build ANN with ‘layer’ hidden layers using best_node and activation = ‘ReLU’
     Compute RMSE on validation set
   Compute average RMSE for this layer
   If RMSE decreases 4 times and increases once:
     Break
Select layer with lowest average RMSE → best_layer

Step 3: Search best activation and optimizer
For activation in {ReLU, tanh, sigmoid}:
   For optimizer in {Adam, Nadam, SGD}:
     For r = 1 to R:
       Build ANN with best_layer hidden layers and best_node per layer
       Use given activation and optimizer
       Compute RMSE on validation set
     Compute average RMSE for this combination
Select (activation, optimizer) with lowest average RMSE → best_act, best_opt

Return: best_layer, best_node, best_act, best_opt
Table 3. Input data for predicting Daecheong dam inflow.
Category
(Number of Input Data)
Input Data
Dam discharge
(1)
Yongdam dam
Water level data
(4)
Sangyegyo
Yangganggyo
Choganggyo
Yeouigyo
Rainfall data
(12)
Boeun
Cheongnamdae
Secheon
Okcheon
Geumsan
Jucheon
Jinan
Cheongsan
Yeongdong
Gagok
Muju
Donghyang
Table 4. Specifications of ANN and AS-ANN [18].
ParameterANNAS-ANN
Number of hidden nodes10Auto setting
Number of hidden layers5Auto setting
OptimizerAdamAuto setting
Activation functionReluAuto setting
Epochs12001200
Table 5. Verification results using ANN and AS-ANN.
MethodMin RMSE (m3/day)Max RMSE (m3/day)Average RMSE (m3/day)
ANN467.03583.14520.74
AS-ANN199.52644.50276.67
Table 6. Difference in peak inflow using ANN and AS-ANN in verification results.
MethodDifference in Peak Inflow (m3/day)
ANN1784.55
AS-ANN1358.14
Table 7. Prediction results using ANN and AS-ANN.
MethodMin RMSE (m3/day)Max RMSE (m3/day)Average RMSE (m3/day)
ANN401.27655.73537.45
AS-ANN348.24492.63403.02
Table 8. Difference in peak inflow using ANN and AS-ANN in prediction results.
MethodDifference in Peak Inflow (m3/day)
ANN1797.21
AS-ANN823.94
Table 9. Results of NOR for ANN and AS-ANN.
MethodNOR
ANN729
AS-ANN108
Disclaimer/Publisher’s Note: The statements, opinions and data contained in all publications are solely those of the individual author(s) and contributor(s) and not of MDPI and/or the editor(s). MDPI and/or the editor(s) disclaim responsibility for any injury to people or property resulting from any ideas, methods, instructions or products referred to in the content.