Article

Impact of Climate and Landscape on the Spatial Patterns of Soil Moisture Variation on the Tibetan Plateau

1
School of Environment and Energy Engineering, Anhui Jianzhu University, Hefei 230601, China
2
Land-Atmosphere Interaction and Its Climatic Effects Group, State Key Laboratory of Tibetan Plateau Earth System, Environment and Resources (TPESER), Institute of Tibetan Plateau Research, Chinese Academy of Sciences, Beijing 100101, China
3
College of Hydraulic & Environmental Engineering, China Three Gorges University, Yichang 443002, China
4
College of Earth and Planetary Sciences, University of Chinese Academy of Sciences, Beijing 100049, China
5
College of Atmospheric Science, Lanzhou University, Lanzhou 730000, China
6
National Observation and Research Station for Qomolongma Special Atmospheric Processes and Environmental Changes, Dingri 858200, China
7
Kathmandu Center of Research and Education, Chinese Academy of Sciences, Beijing 100101, China
8
China-Pakistan Joint Research Center on Earth Sciences, Chinese Academy of Sciences, Islamabad 45320, Pakistan
*
Author to whom correspondence should be addressed.
Water 2025, 17(17), 2625; https://doi.org/10.3390/w17172625
Submission received: 23 July 2025 / Revised: 29 August 2025 / Accepted: 3 September 2025 / Published: 5 September 2025

Abstract

Soil moisture is a critical variable linking the land surface and atmosphere over the Tibetan Plateau. Identifying its spatial variability is essential for understanding the regional water cycle, particularly how landscape features shape soil moisture patterns. While previous studies emphasized climate, topography, and vegetation, the role of land-cover morphology has been largely overlooked. Here, we combined TerraClimate reanalysis and satellite data from 2018 to 2022 with morphological analysis and the GeoDetector method to examine 14 factors affecting soil moisture heterogeneity. Results show that precipitation and vegetation dominate soil moisture distribution, yet the influence of landscape morphology in forests and barren lands exceeds that of temperature. Forest cores retain extremely high soil moisture, while transitional zones such as edges, perforations, and islets play a critical role in grasslands and croplands. Interaction analysis indicates that forests and barren morphologies mainly respond to linear climatic drivers, whereas croplands, grasslands, urban areas, and water morphologies are shaped by nonlinear multi-factor effects. Perturbation experiments further reveal that warming weakens the buffering capacity of forests and enhances drying in grasslands and barren areas. These findings highlight the importance of landscape morphology for predicting soil moisture resilience and improving ecological management on the Tibetan Plateau.

1. Introduction

Soil moisture serves as a vital link between the land surface and the atmosphere, regulating surface energy partitioning, freeze–thaw dynamics, and runoff through hydrothermal exchange [1,2]. As a fundamental variable in hydrological modeling [3,4], numerical weather prediction [5,6], and land surface processes [2], its spatial heterogeneity has become increasingly pronounced under the combined influences of climate change and land-cover modification [5,7,8]. This growing variability intensifies the sensitivity of the water cycle to global warming, making a thorough understanding of soil moisture heterogeneity essential for revealing hydrological feedbacks within the climate system [9].
The Tibetan Plateau, with an average elevation exceeding 4000 m, is often referred to as the “Third Pole” and the “Water Tower of Asia.” [10,11]. Its water cycle plays a central role in shaping regional climate and supporting freshwater resources for billions of people across the Asian continent [10,11]. Spatial variations in soil moisture over the Tibetan Plateau significantly influence alpine ecosystem productivity, regional carbon budgets, surface energy fluxes, and downstream river discharge [12]. Observational studies have documented a clear southeast-to-northwest gradient in soil moisture [13], with maximum values found in the Yarlung Tsangpo–Hengduan Mountains and minimum values in the Qiangtang–Qaidam deserts [12]. Vegetation types contribute further to this heterogeneity: forests, with approximately 80%, are dominated by transitional soil moisture regimes, whereas deserts exhibit only about 30% [13]. At finer spatial scales, alpine shrubs and meadows show amplified soil moisture contrasts even under identical precipitation conditions, driven by differences in root structure and canopy interception [14,15]. Meanwhile, human activities and climate change continue to reshape these patterns. For example, grassland restoration has led to wetting in arid areas but drying in semi-humid zones, thereby increasing spatial disparities in soil moisture [16].
The drivers of soil moisture spatial variability can generally be grouped into three categories: climate [17], topography [18], and land or vegetation cover [13,19]. At broad spatial scales, precipitation and temperature are the primary controls through their influence on water budgets and evapotranspiration [19]. In North America, these climatic variables account for over 80% of soil moisture variability across humid subtropical, semi-arid, and arid regions [20]. Similar sensitivities are observed in China, where soil moisture in humid zones is strongly influenced by both precipitation elasticity and temperature fluctuations, whereas arid regions exhibit muted responses due to persistent water limitations [4]. Topography modifies this climate-induced variability through mechanisms such as solar radiation redistribution, runoff concentration, and soil depth variation. Concave fluvial terrains with steep gradients and dense drainage networks exhibit nearly double the soil moisture variability observed in convex landscapes [21]. Even within similar climatic conditions, slope and aspect can produce up to 25% differences in soil moisture between adjacent grid cells [21]. Elevation also plays a role in redistributing precipitation and evapotranspiration, thereby shaping dry and wet zones [22]. Land cover further modulates soil moisture patterns. In northeastern parts of the Tibetan Plateau, alpine meadows with continuous organic layers retain more surface moisture than patchy shrublands, although shrubs tend to store more moisture in the subsurface layers [14]. In arid grasslands, bare-soil perforations and sparse vegetation can accelerate rainwater redistribution through rock fissures, increasing moisture availability within grass patches [16].
Although previous studies have extensively examined the roles of climate, topography, and vegetation in shaping soil moisture variability on the Tibetan Plateau, important gaps remain. In particular, most research has focused on climatic and biophysical controls while largely overlooking the contribution of land-cover landscape morphology, such as patch configuration, connectivity, and fragmentation, to soil water distribution. Furthermore, limited attention has been given to how the interactive effects of morphology with climate and topography jointly regulate soil moisture heterogeneity. Addressing these gaps is crucial for developing a more mechanistic understanding of soil–atmosphere coupling and hydrological feedback on the Plateau.
To fill these gaps, this study integrates reanalysis and remote sensing data with Morphological Spatial Pattern Analysis (MSPA) and the GeoDetector method to systematically examine how climate, topography, vegetation, and, especially, landscape morphology influence the spatial variability of soil moisture. By quantifying both individual and interactive effects, our work provides new insights into the underexplored role of land-cover morphology in regulating soil moisture patterns across the Tibetan Plateau.

2. Materials and Methods

2.1. Data

(1) Reanalysis data: We utilized the TerraClimate reanalysis dataset (https://developers.google.com/earth-engine/datasets/catalog/IDAHO_EPSCOR_TERRACLIMATE (accessed on 2 September 2025)) to obtain soil moisture and key climatic variables (precipitation, actual evapotranspiration, shortwave radiation, and minimum/maximum temperature) over the Tibetan Plateau [23]. TerraClimate provides global monthly climate and water balance data at ~0.5° resolution. Soil moisture estimates derived from a one-dimensional soil water balance model were used to characterize spatial variability (Figure 1). (2) MODIS data: Land cover information was derived from the MODIS MCD12Q1 product (500 m, annual) [24], and reclassified into six major types: forest, grassland, barren land, cropland, urban, and water/ice (Table 1). NDVI was obtained from the MODIS MYD13A2 product (1 km, 16-day) and aggregated to 0.5° using bicubic interpolation. (3) Topography data: Elevation and slope were extracted from the HydroSHEDS DEM (1 km, https://developers.google.com/earth-engine/datasets/catalog/WWF_HydroSHEDS_30CONDEM (accessed on 2 September 2025)) and resampled to 0.5° [25].

2.2. Methods

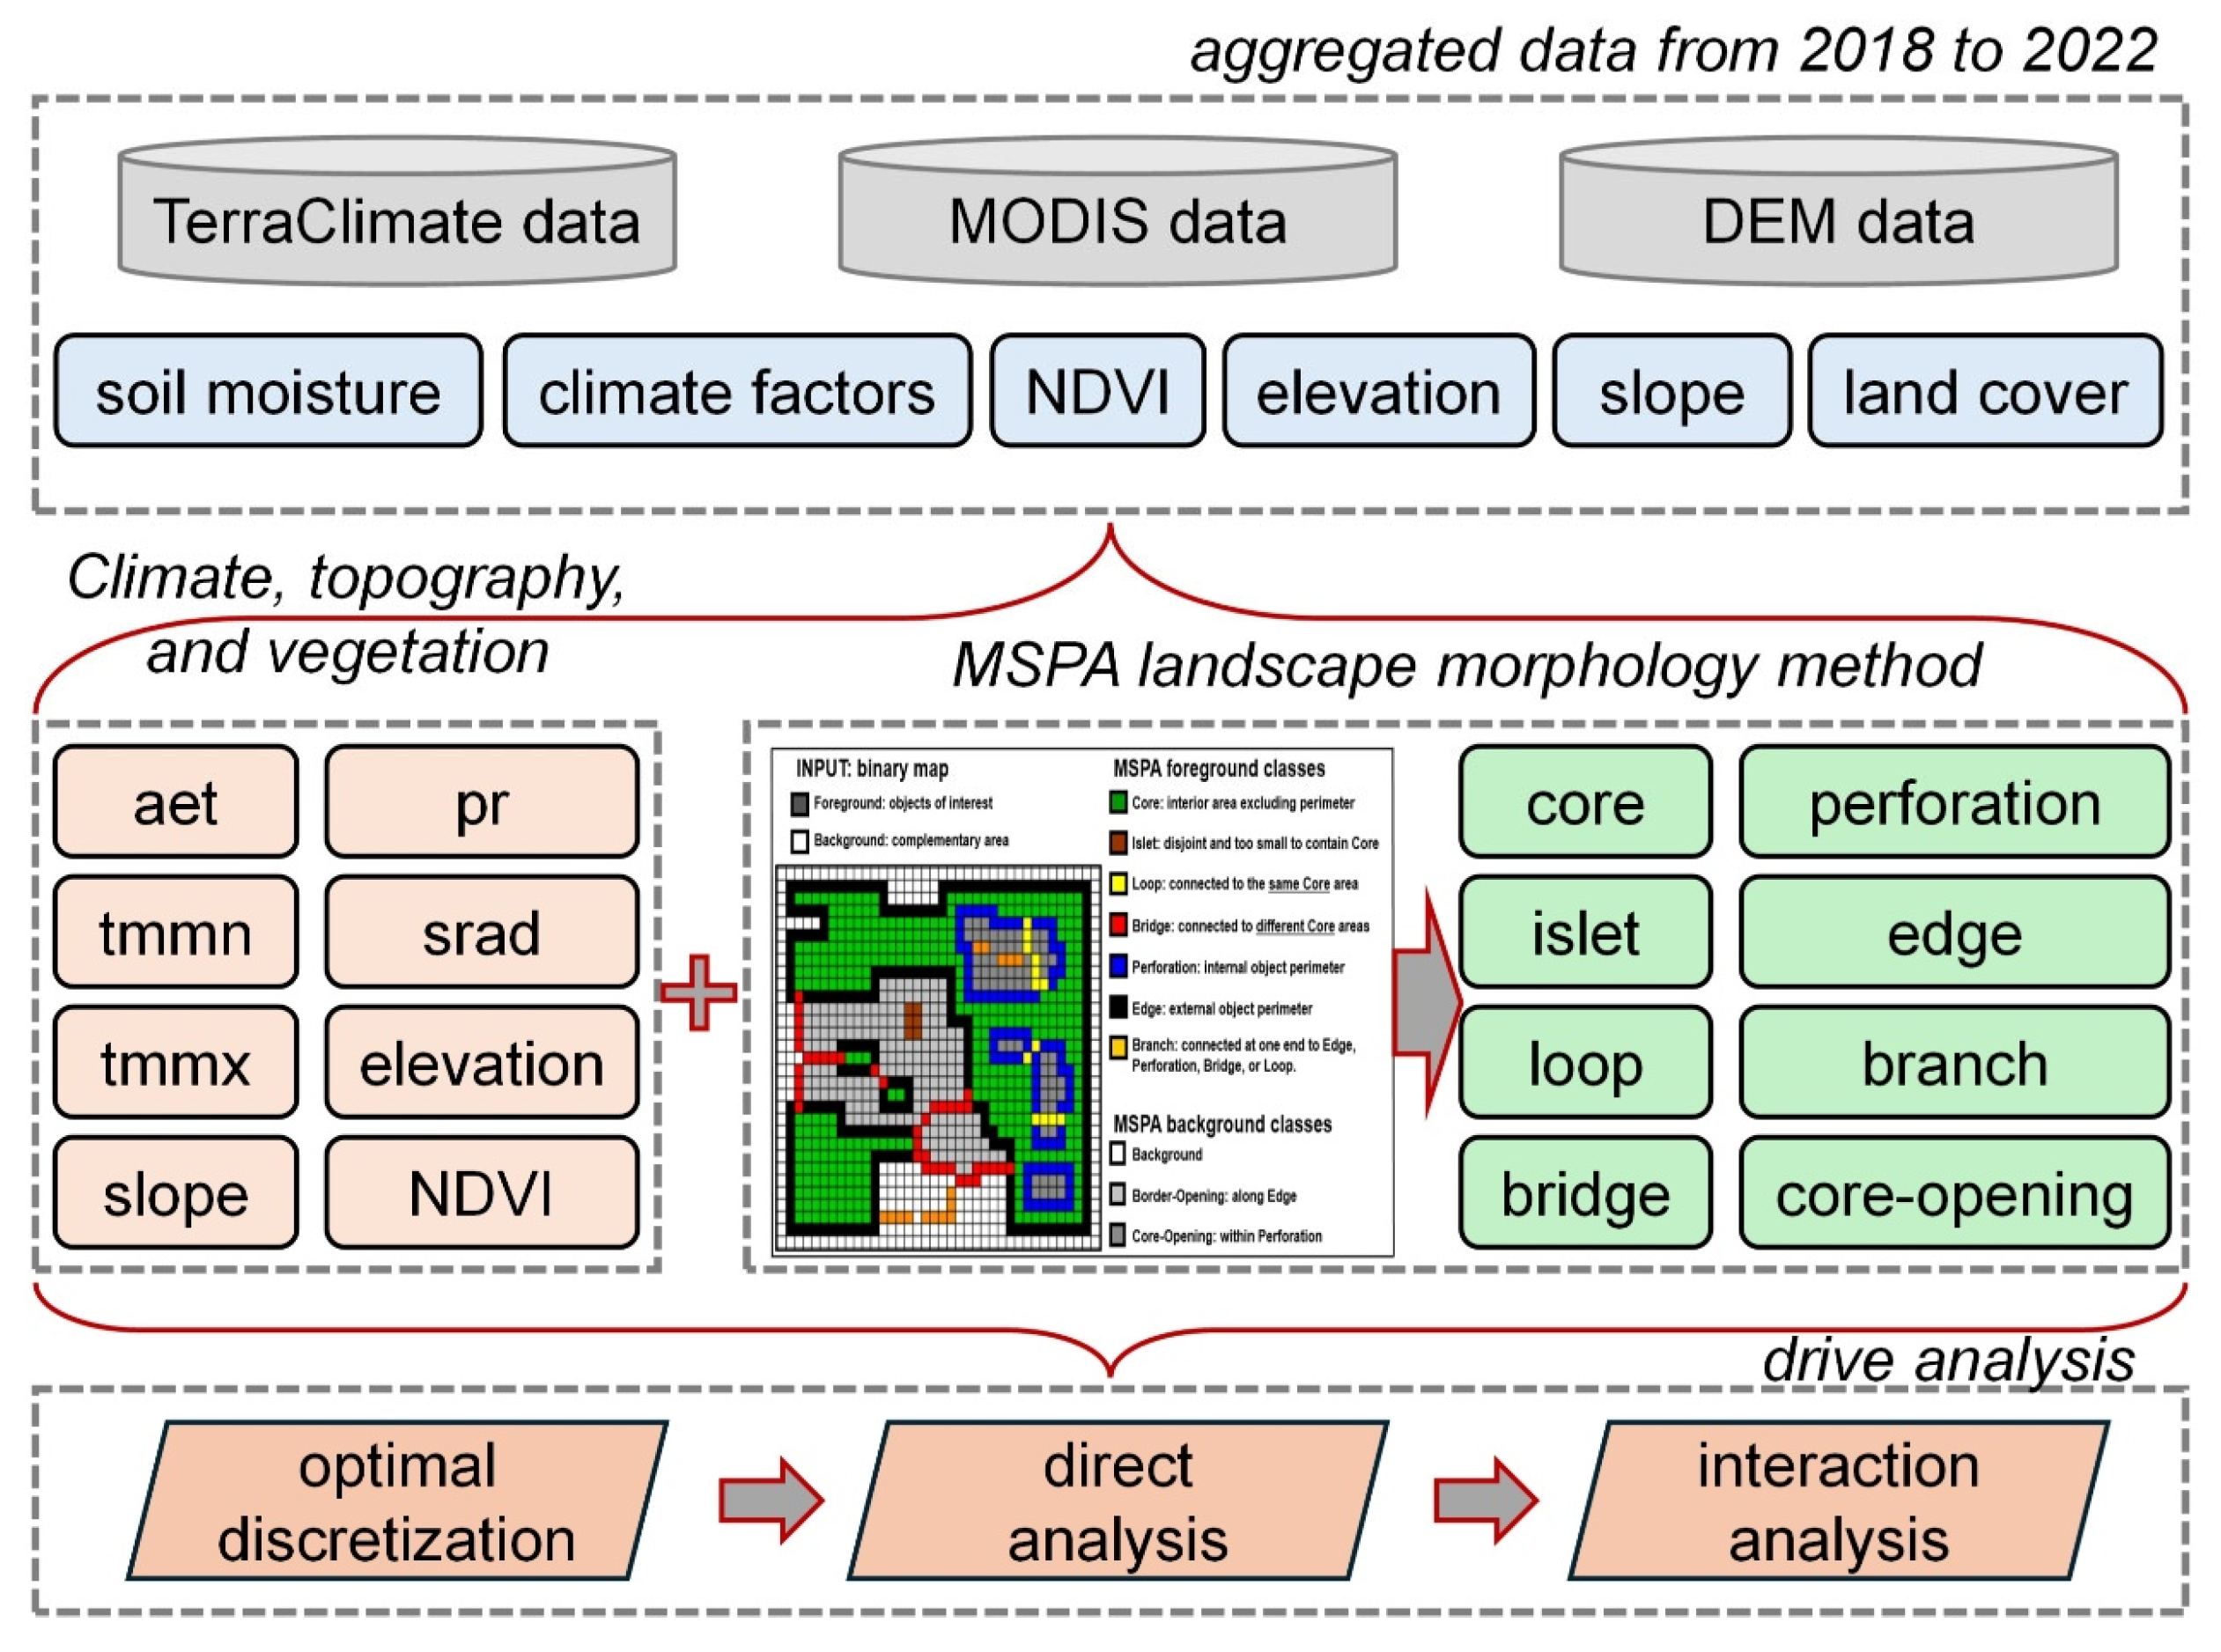
Our investigation of soil moisture heterogeneity followed three steps. First, soil moisture, climate, vegetation, and topographic variables were aggregated into 5-year means (2018–2022). Second, land-cover morphologies were classified using Morphological Spatial Pattern Analysis (MSPA) [26]. Finally, we applied the GeoDetector model [27,28] to quantify the explanatory power of climate, vegetation, topography, and land-cover morphology, as well as their interactions. The overall framework is illustrated in Figure 2.
Specifically, (1) Data preprocessing and classification: Climate, vegetation, and topographic variables were discretized using the optimal classification method provided in the GD package. This ensures compatibility with GeoDetector analysis. Detailed classification parameters are summarized in Table 2. (2) Landscape morphology classification for land covers: For each land-cover type, landscape morphology was categorized into eight structural classes using the MSPA tool (https://forest.jrc.ec.europa.eu/en/activities/lpa/gtb (accessed on 2 September 2025)), including core (interior area excluding perimeter), islet (disjoint patches too small to contain core areas), loop (connecting the same core area), bridge (linking different core areas), perforation (internal perimeter of objects), edge (external perimeter of objects), branch (connected at one end to edge, perforation, bridge, or loop), and core-opening (within perforation). (3) Driver Analysis: First, we employed the GeoDetector method to evaluate the spatial influence of each factor and their pairwise interactions. This approach is extensively used in environmental and hydrological studies for detecting spatial heterogeneity and identifying driving mechanisms. Second, temperature anomaly analysis and perturbation experiment: To assess the effects of temperature anomalies on soil moisture and the role of land-cover morphologies, we extended the GeoDetector framework with two complementary approaches. Monthly temperature anomalies during 2018–2022 were calculated and samples were stratified into cold, normal, and warm terciles. GeoDetector was then applied separately within each group to evaluate changes in factor explanatory power (q-values) under different thermal conditions. Third, a deterministic perturbation experiment was designed by adjusting maximum and minimum temperatures (tmmx and tmmn) by +1 °C (S1) and +2 °C (S2), and by increasing actual evapotranspiration (aet) by 7% per °C following the Clausius–Clapeyron relation. Soil moisture was subsequently recalculated using a water balance adjustment, and GeoDetector was re-run to quantify the responses of major land-cover morphologies (forest, grassland, barren land) across elevation bands and seasons. This combined anomaly stratification and perturbation design enabled us to isolate the sensitivity of soil moisture to warming and to identify where morphological structures dampen or amplify temperature-driven drying.

3. Results

3.1. Spatial Variations in Climate, Topography, and Vegetation Across the Tibetan Plateau

The interplay between climate, topography, and vegetation shapes the distinctive ecosystem characteristics of the Tibetan Plateau and collectively drives the spatial heterogeneity of soil moisture.
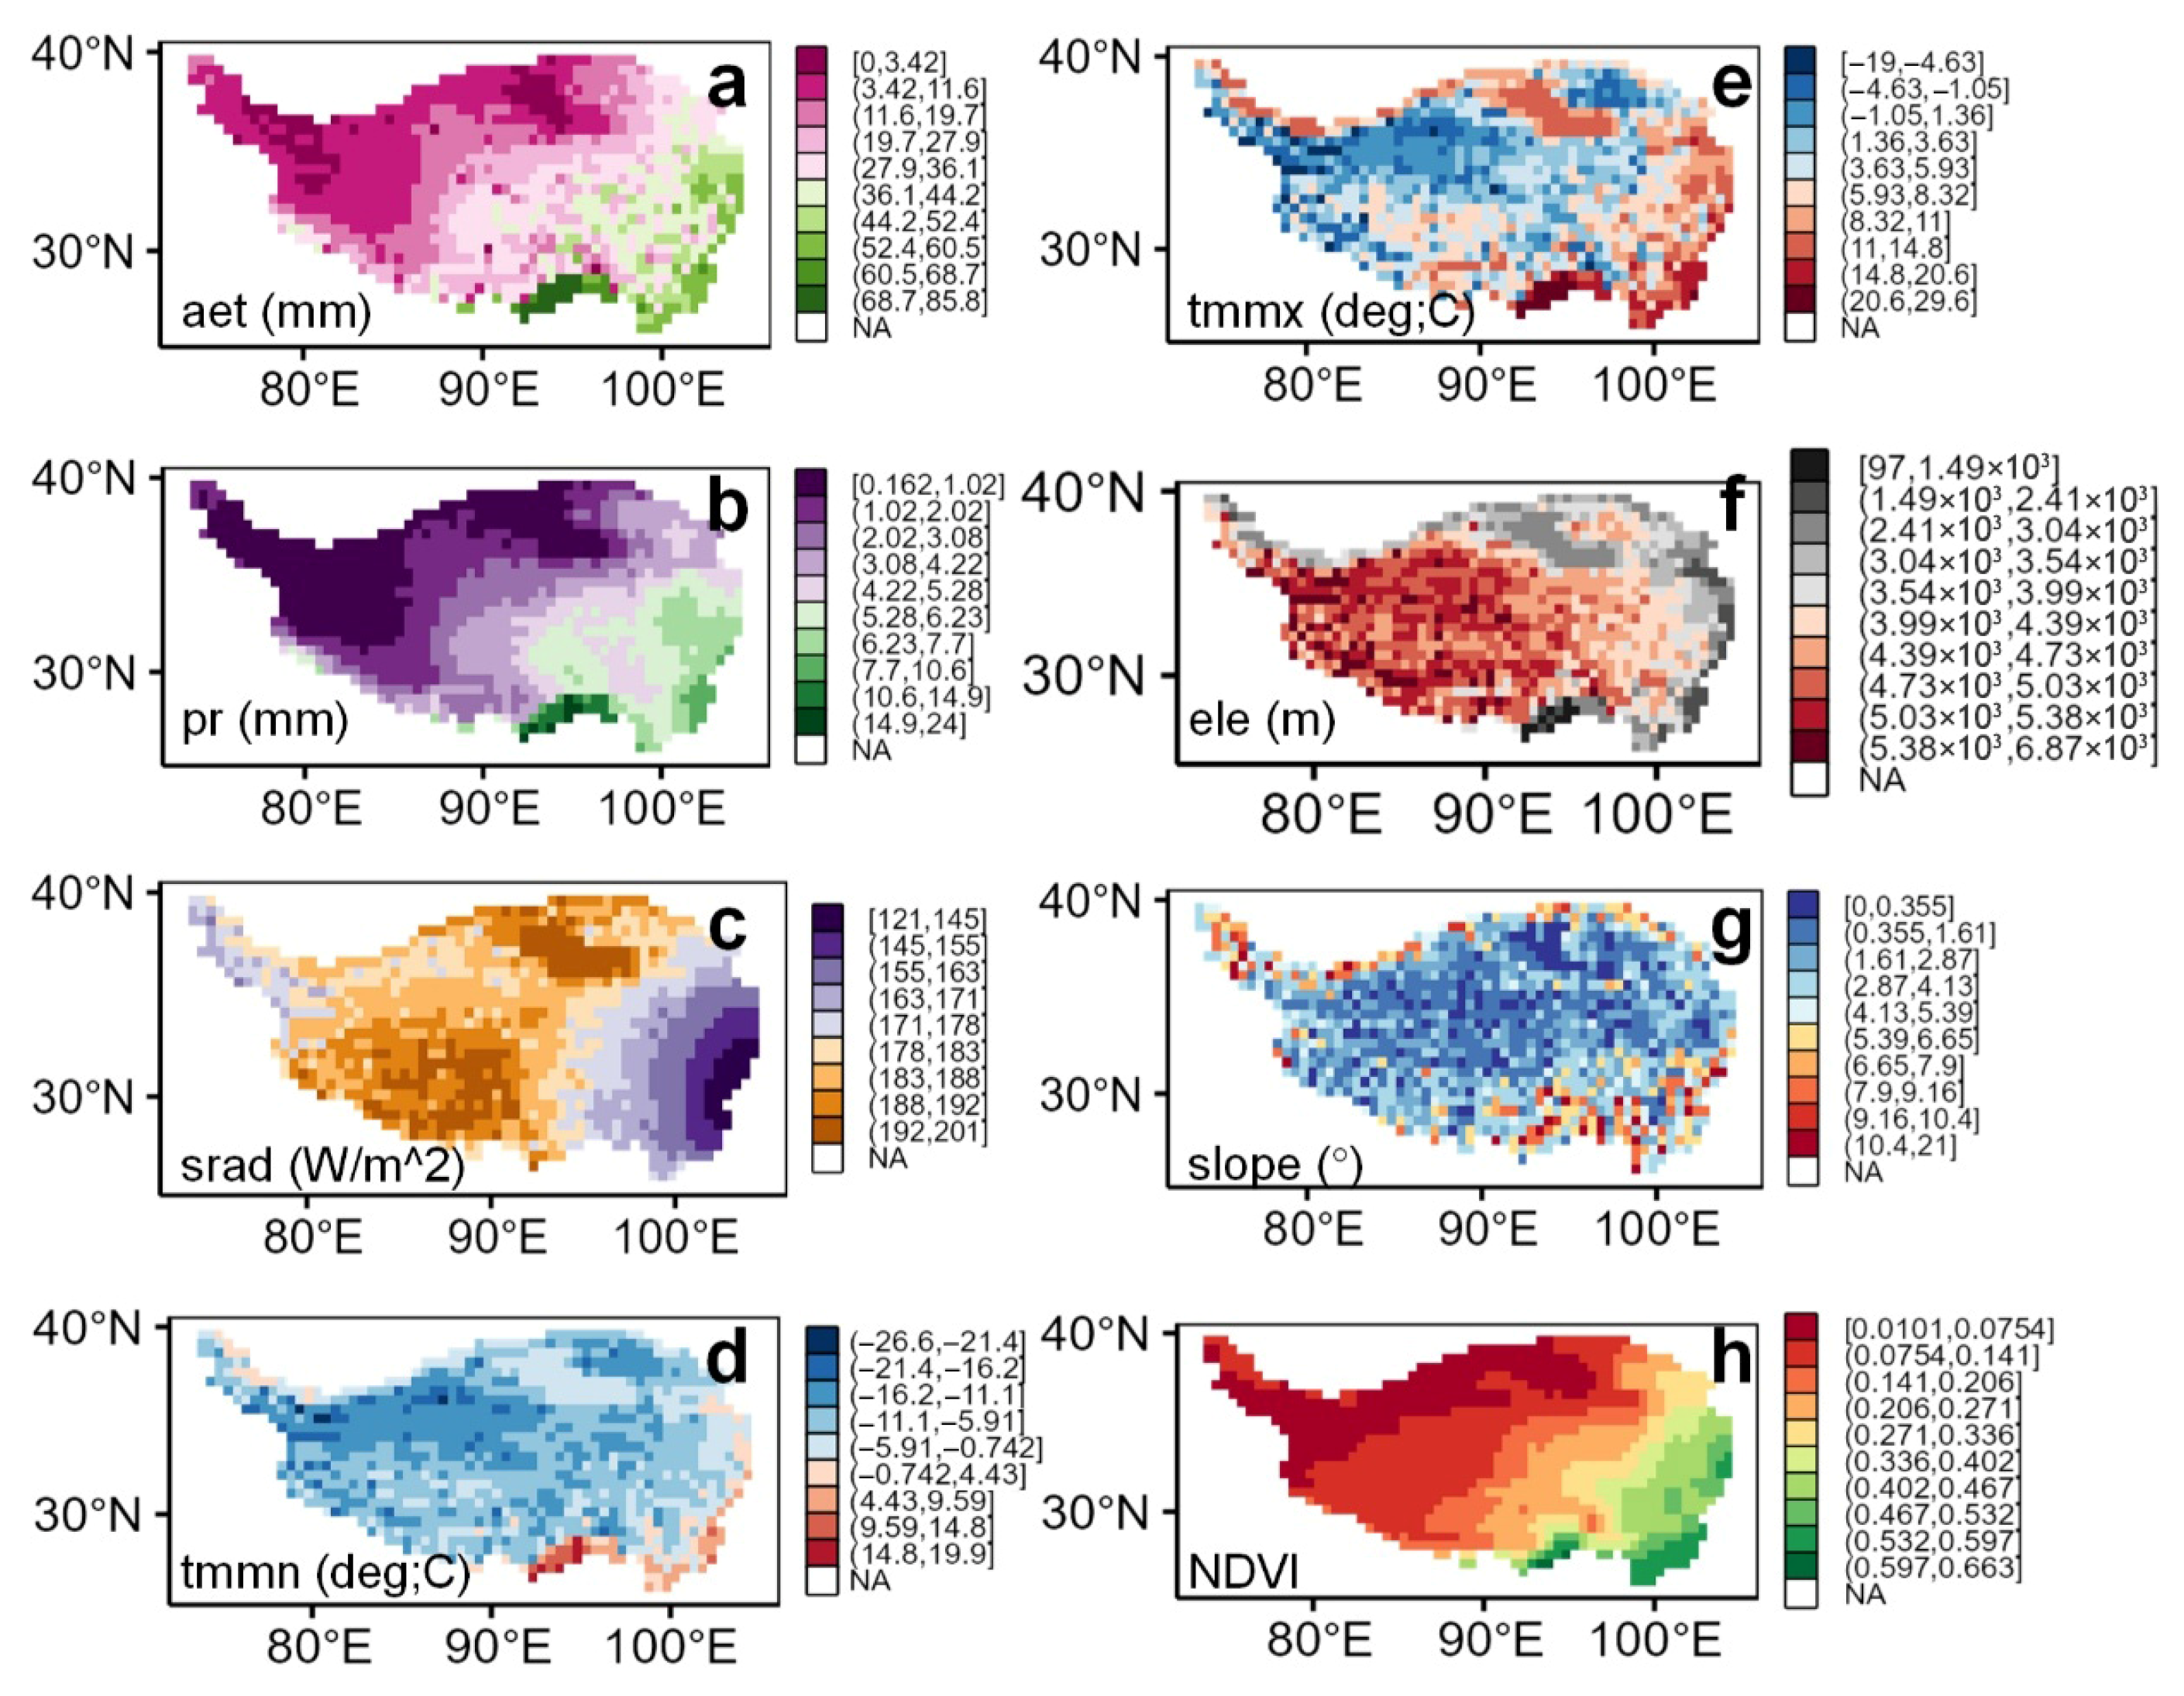
Climatic factors exhibit pronounced spatial gradients across the plateau. Actual evapotranspiration (AET) displays higher values in the western regions, indicating relatively abundant water availability and greater evapotranspiration potential, while lower AET in the eastern and southern regions reflects drier conditions (Figure 3a). Precipitation follows a distinct southeast-to-northwest declining gradient, closely tied to monsoon dynamics (Figure 3b). In contrast, downward solar radiation shows an inverse pattern, with more intense radiation in the central and western regions (Figure 3c). Temperature distributions reveal clear latitudinal and elevational gradients, with colder conditions in northern and high-altitude areas constraining vegetation growth (Figure 3d,e).
Topography further modulates these climatic and vegetation patterns. Elevation emerges as a critical control on ecosystem dynamics, with higher altitudes exhibiting lower temperatures and sparser vegetation cover, particularly in the northern and central plateau (Figure 3f). Slope gradients influence hydrological processes and soil erosion, where steeper terrain promotes water and nutrient loss, limiting plant establishment (Figure 3g). Vegetation distribution, as reflected by NDVI, integrates these climatic and topographic influences (Figure 3h). Lush vegetation in the southeast aligns with higher precipitation and milder temperatures, while the central and northern plateau show minimal vegetation cover due to synergistic effects of cold temperatures, low moisture availability, and high elevation.

3.2. Spatial Variation in Landscape Morphology for Land Covers on the Tibetan Plateau

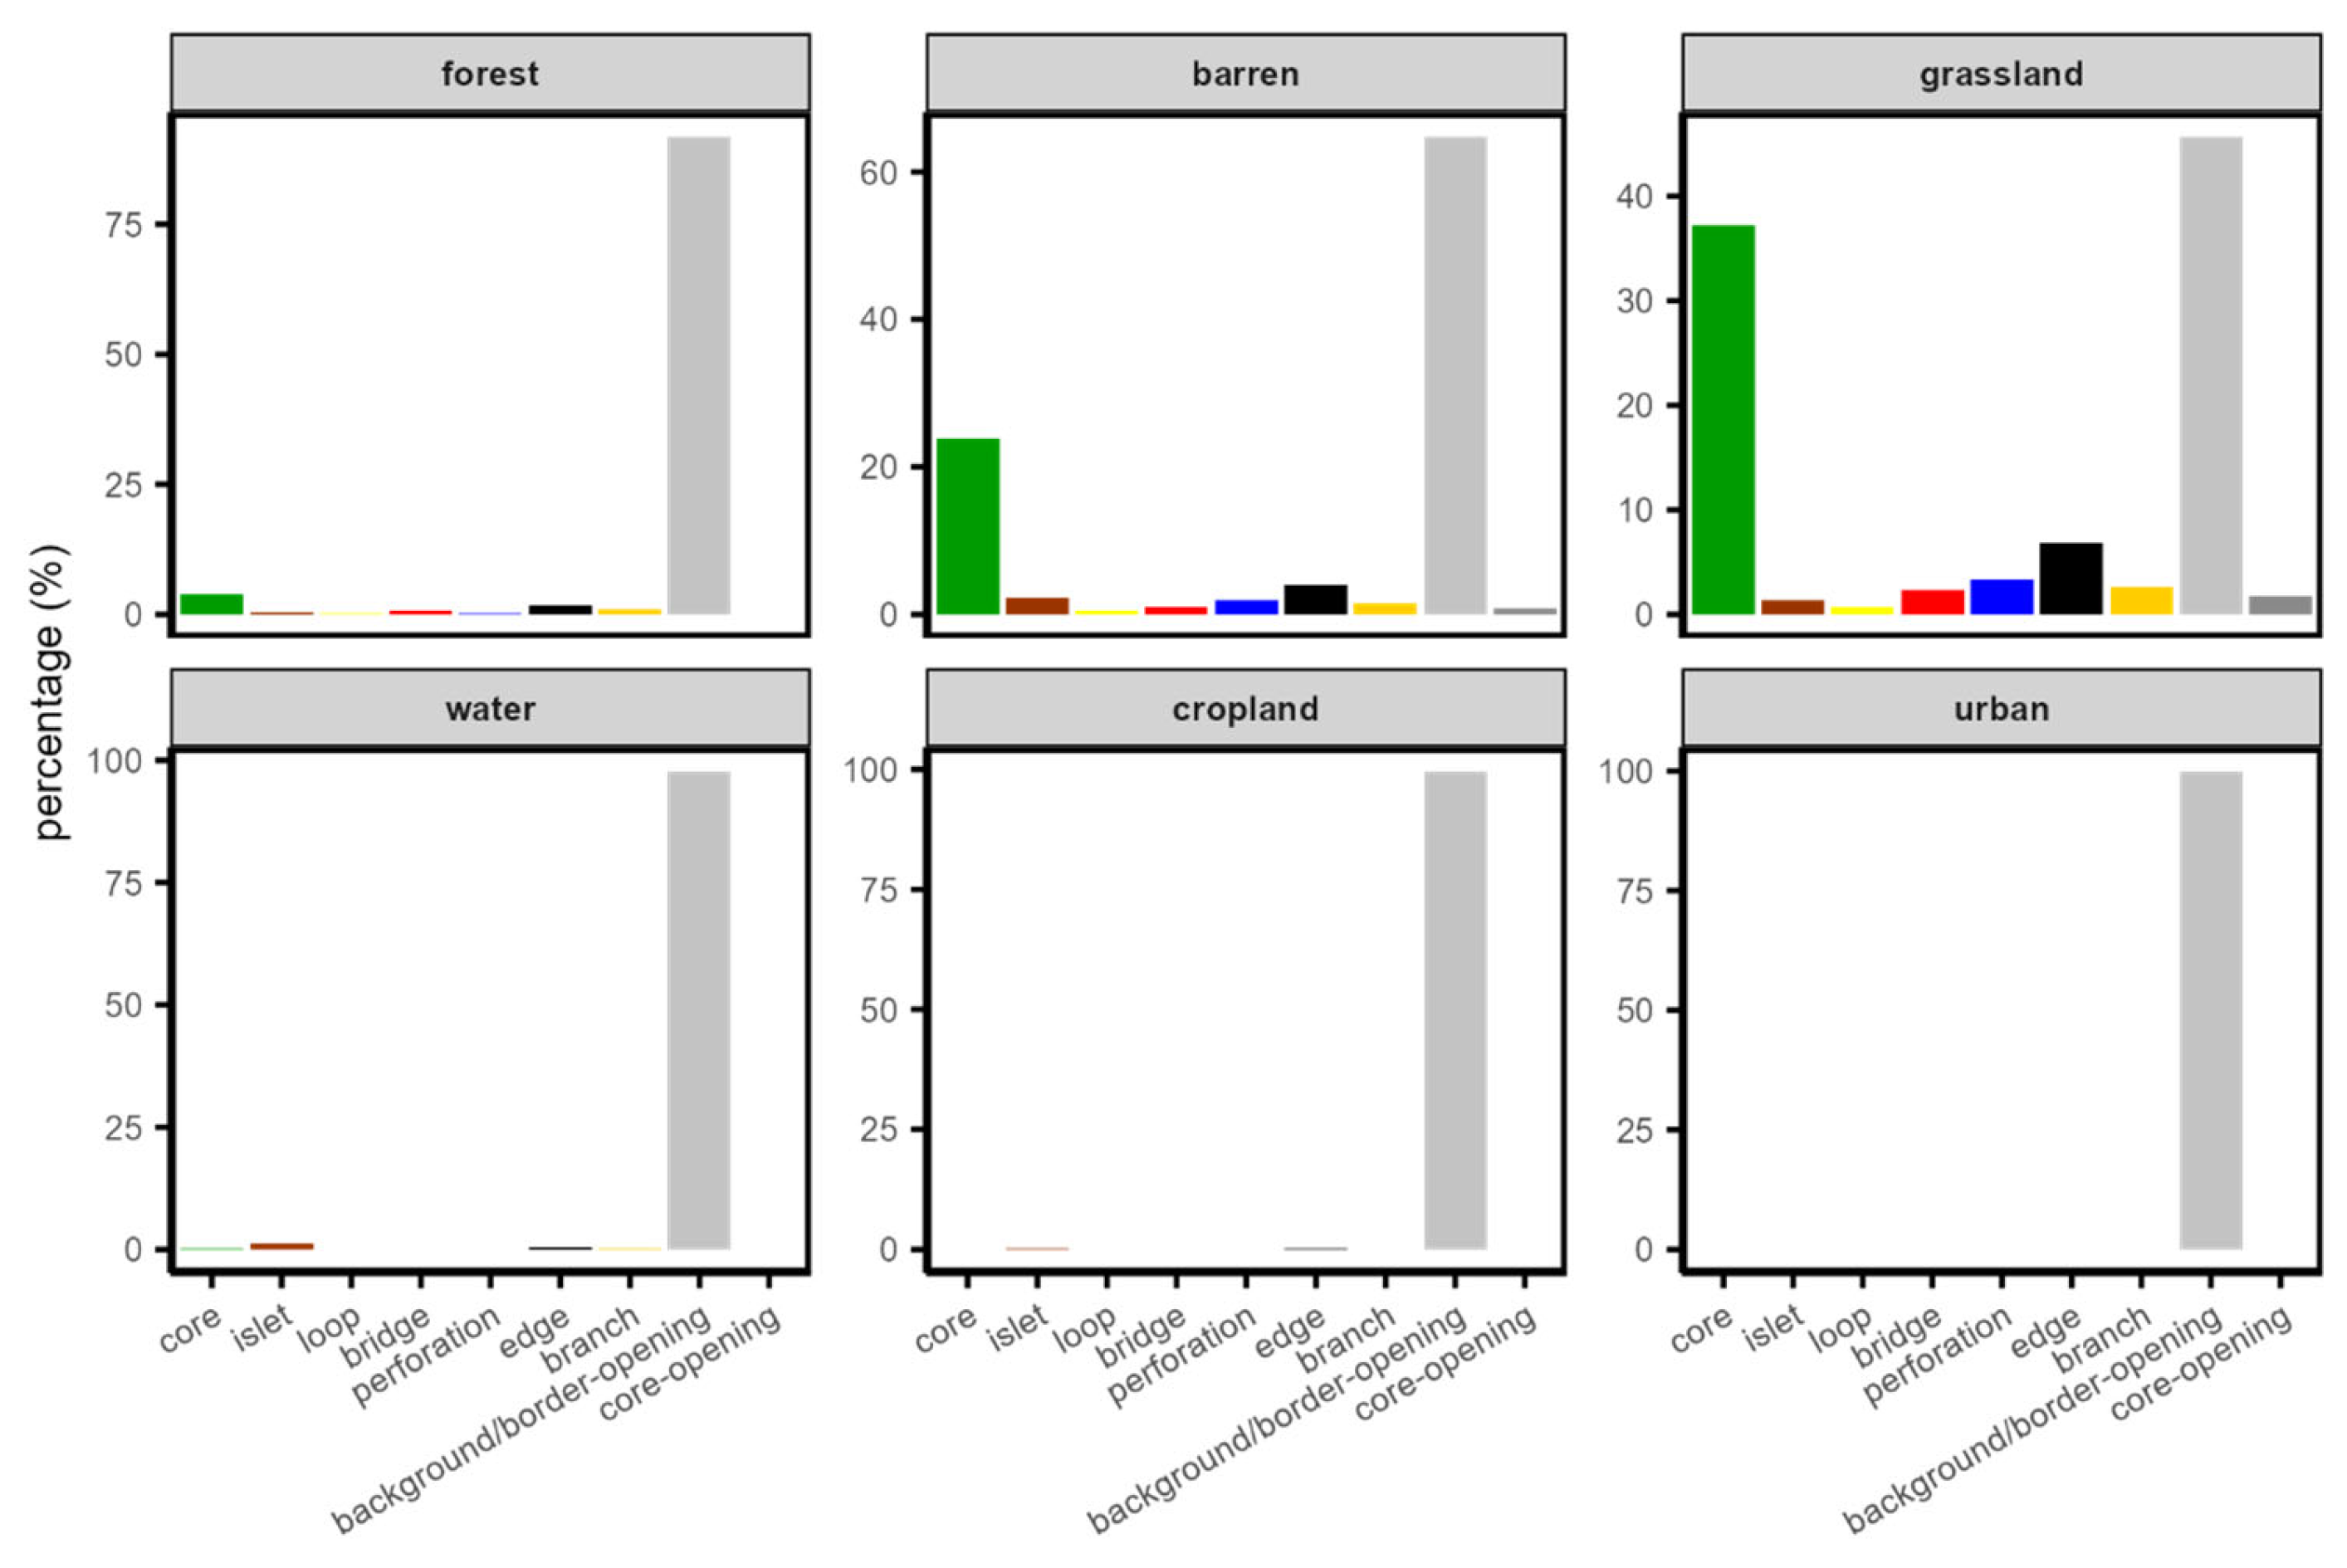
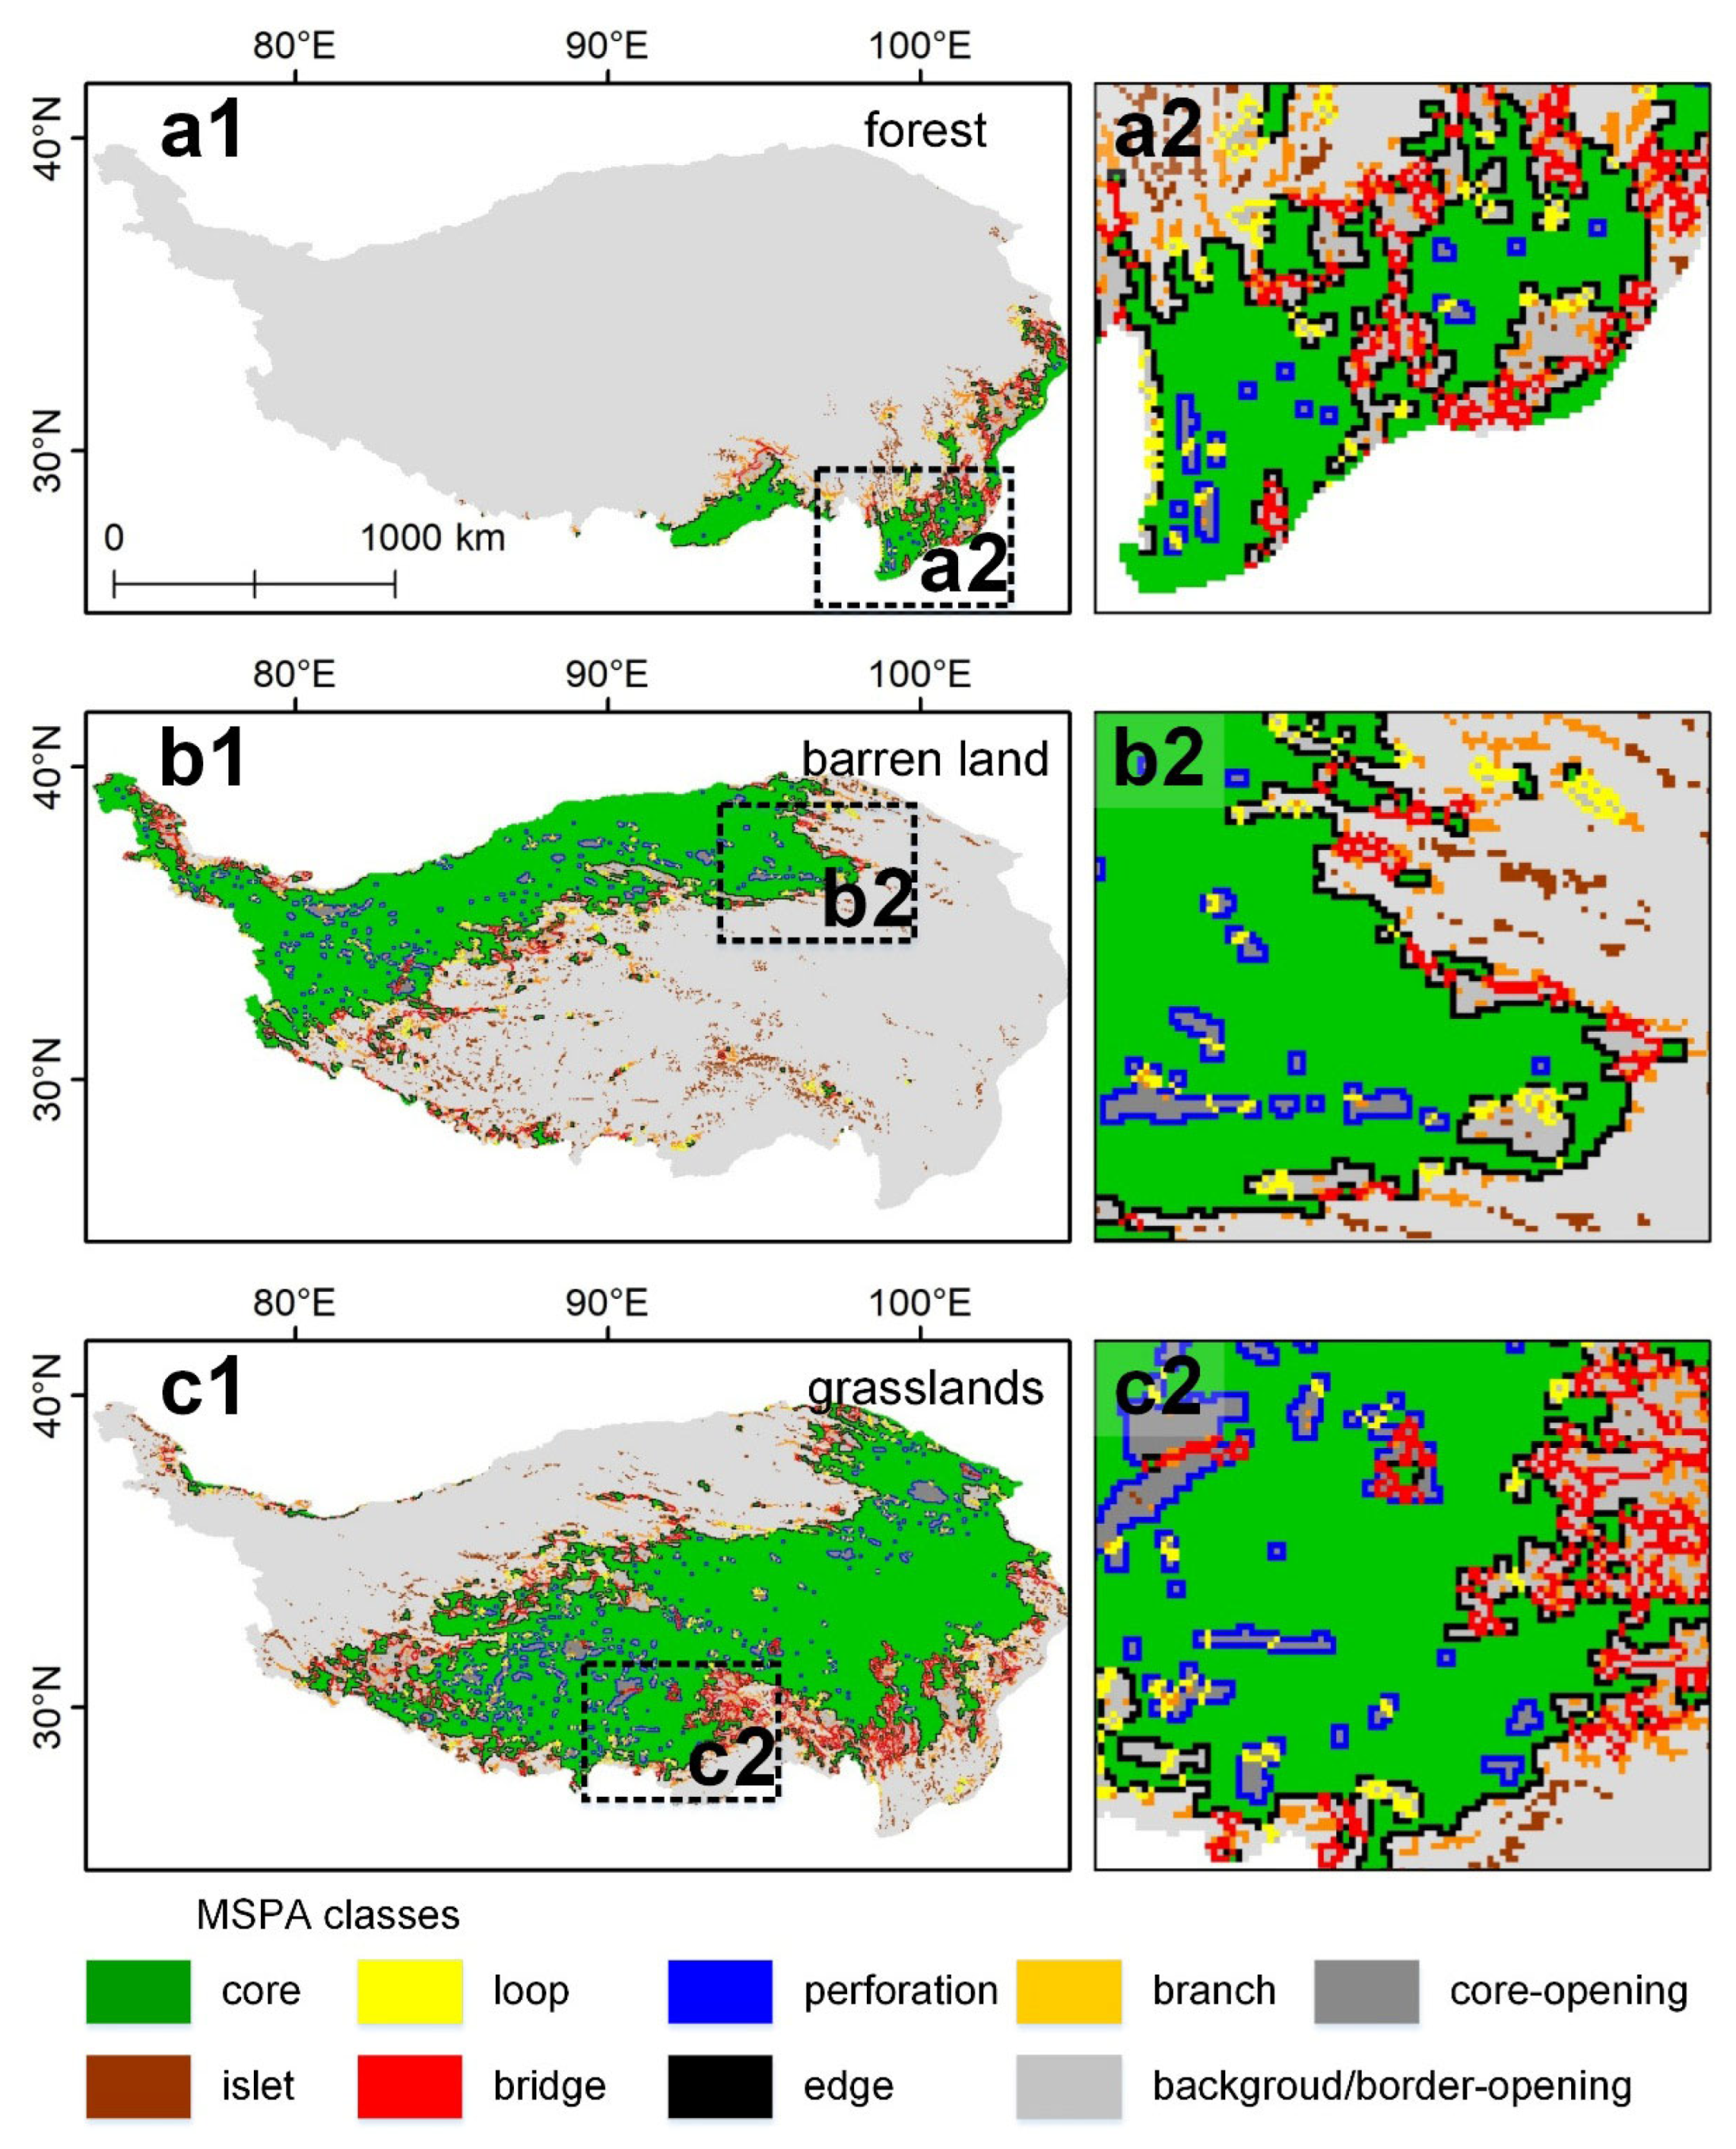
MSPA results revealed distinct spatial distributions of different landscape types. Forest core areas, representing the most contiguous forest patches, accounted for 3.84% of the total area (Figure 4) and were predominantly distributed in the northeastern plateau (Figure 5(a1,a2)), indicating relatively high connectivity of forest ecosystems in this region. Forest edge (1.79%) and branch (1.04%) zones surrounded these core areas (Figure 4), while other MSPA classes each represented less than 1% of forest cover. For barren land, core areas constituted 23.83% of coverage (Figure 4), primarily concentrated in the northwestern plateau (Figure 5(b1,b2)). Barren land edge zones accounted for 4.02%, with islets (2.19%) reflecting the fragmented nature of barren patches. Grassland exhibited the most extensive core distribution (37.21%; Figure 4), covering large portions of the plateau and demonstrating high connectivity (Figure 5(c1,c2)). The grassland landscape showed considerable complexity, with edge (6.81%), perforation (3.31%), branch (2.6%), and bridge (2.31%) zones all prominently represented.
Water bodies displayed a dispersed spatial pattern, with islets (1.18%, Figure 4) dominating and core areas (0.33%, Figure 4) mainly located in the northeastern plateau (Figure 6(a1,a2)). Agricultural landscapes, concentrated in the southeast (Figure 6(b1,b2)), were characterized by edge (0.12%, Figure 4) and loop (0.1%, Figure 4) configurations. Urban areas showed minimal landscape development, represented only by sparse islets (0.02% within Figure 4 and Figure 6(c1,c2)).

3.3. Impacts of Factors on Soil Moisture Variation Across the Tibetan Plateau

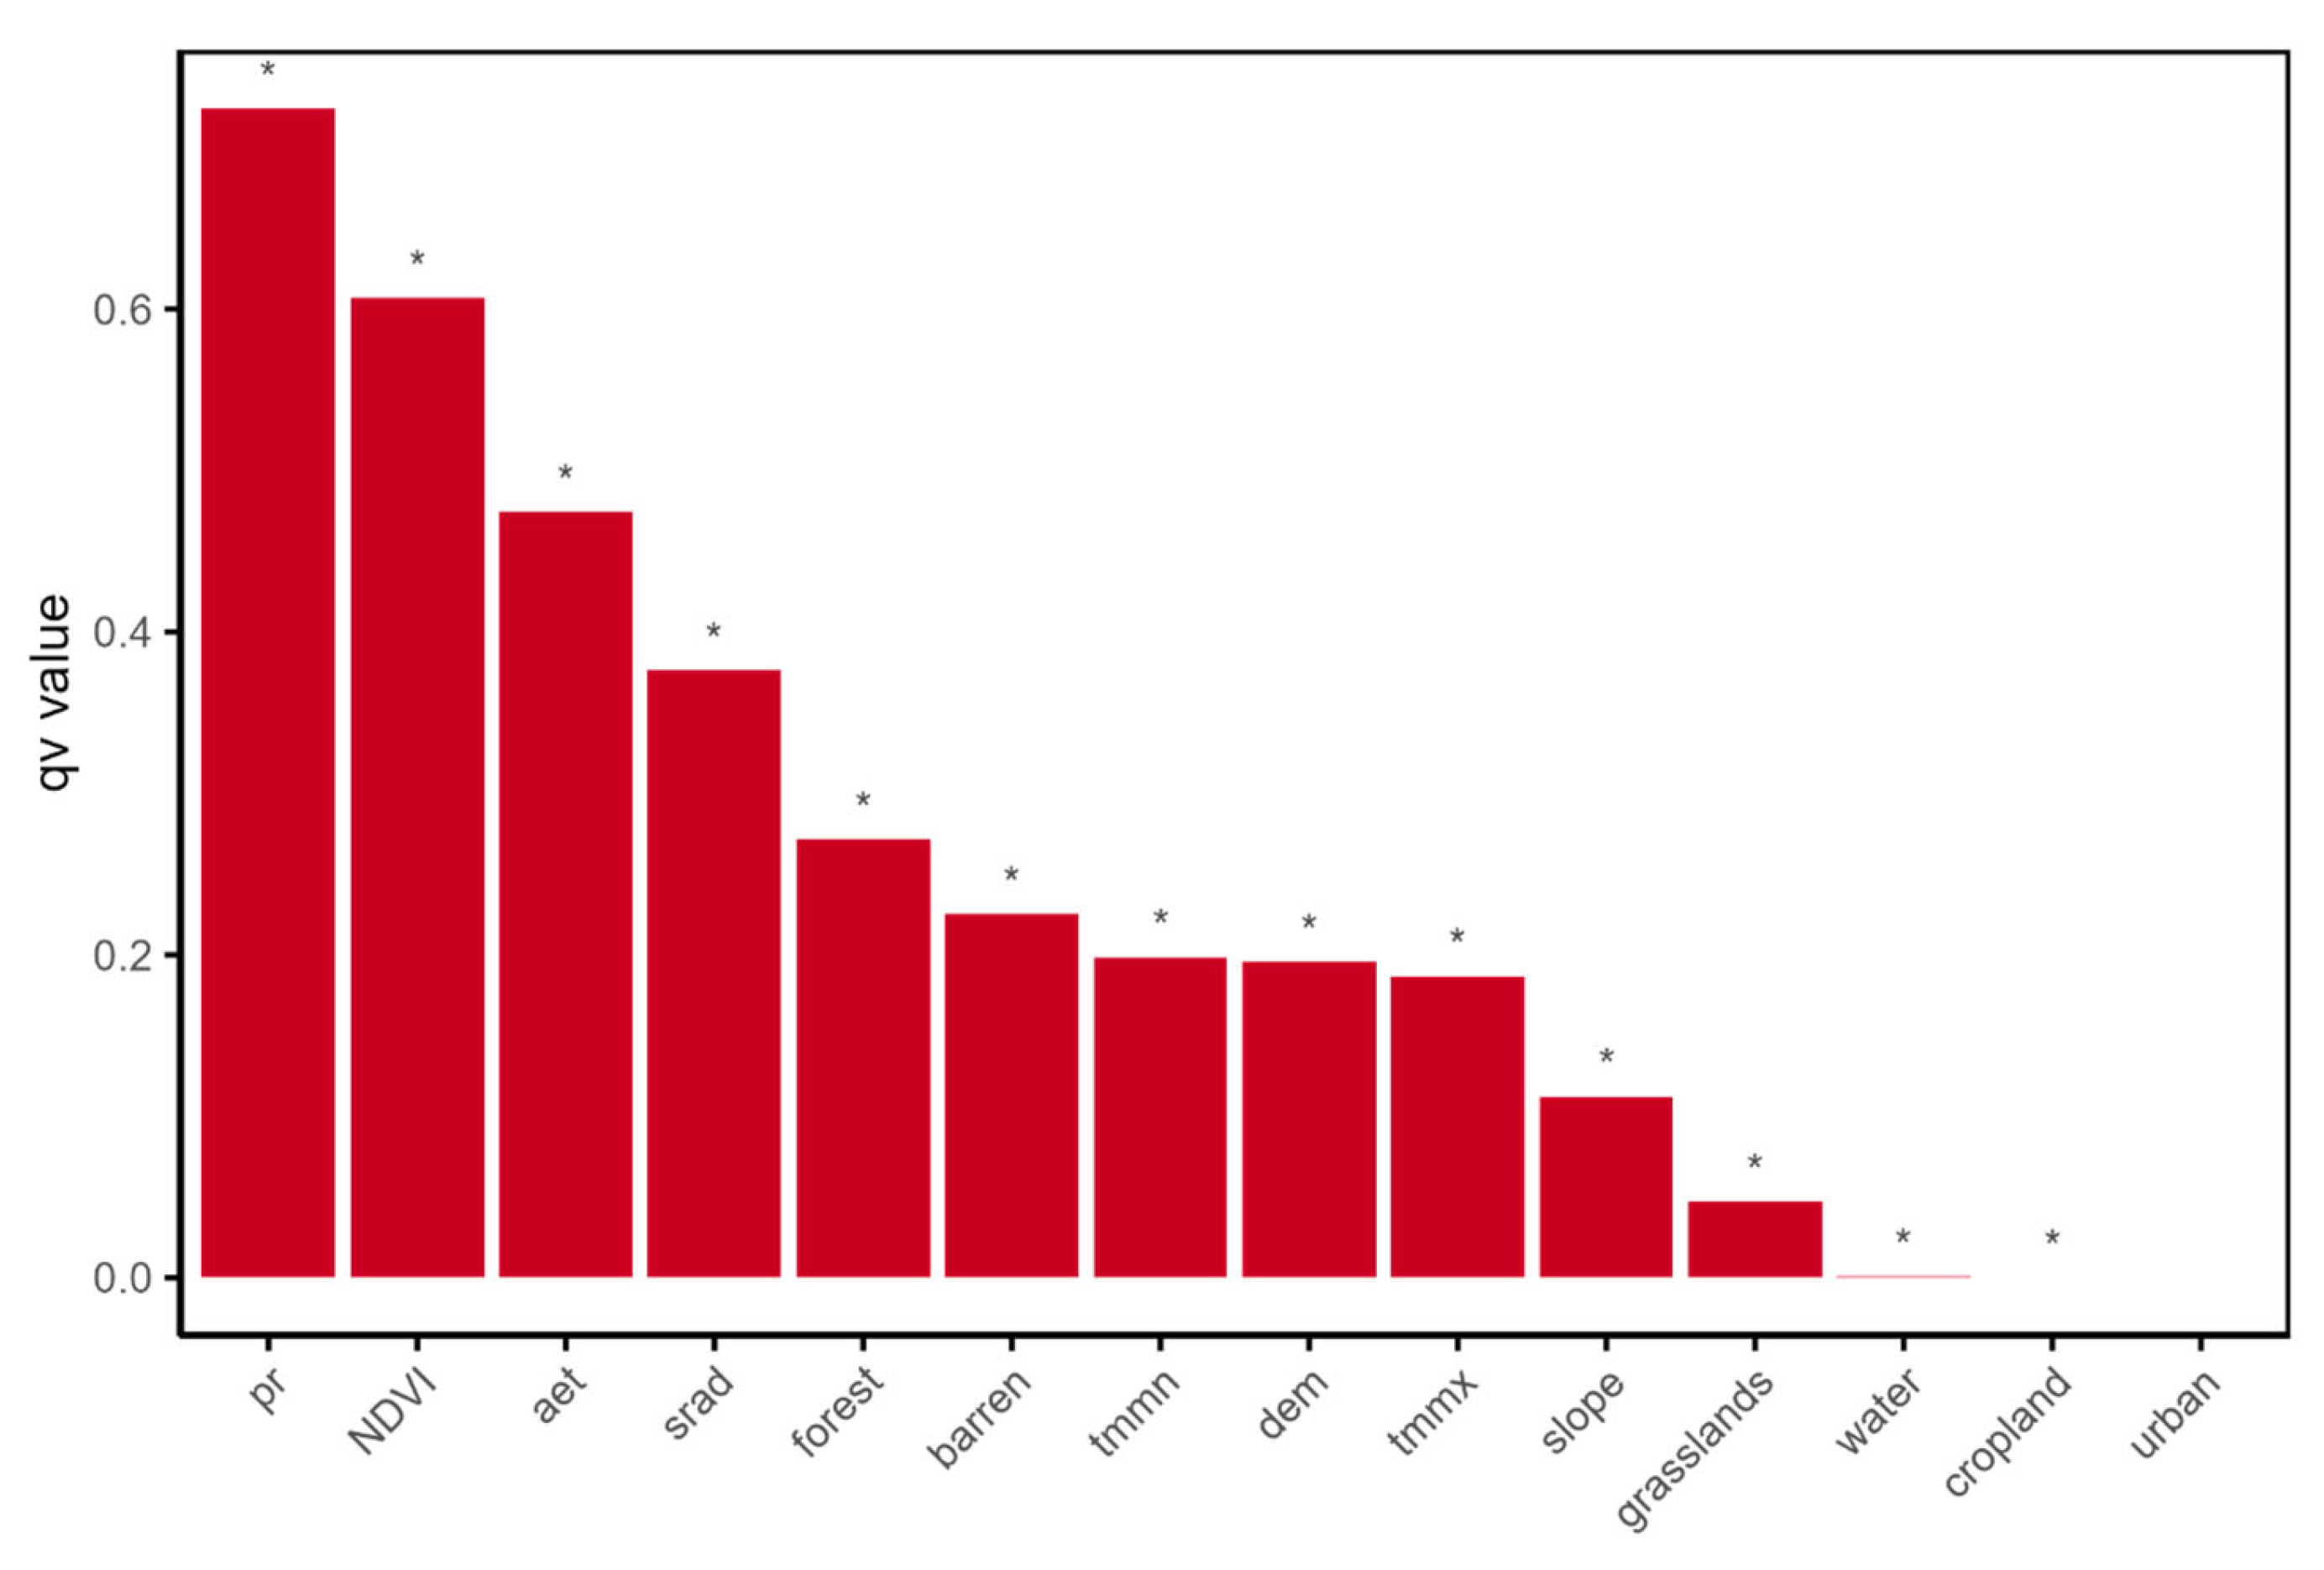
Using the GeoDetector method, we quantified the explanatory power (qv value) of various driving factors influencing the spatial variability of soil moisture across the Tibetan Plateau (see the Supplementary Materials for the qv value changes in population density level). The results (Figure 7) indicate that climatic variables are the dominant contributors to soil moisture heterogeneity. Among them, precipitation is the most influential factor, with qv value of 0.7242, substantially higher than all other variables and consistent with previous findings [17,29]. This finding highlights the primary role of precipitation patterns in determining the spatial distribution of soil moisture. In addition, the spatial variability of NDVI (qv value = 0.6069) and actual evapotranspiration (qv value = 0.4744) also shows strong explanatory power, emphasizing the significant influence of vegetation dynamics [19] and hydrological processes [17,30]. Solar radiation (qv value = 0.3759), as a major energy input, indirectly affects soil moisture distribution by regulating evapotranspiration rates.
Landscape morphology is also an important factor affecting soil moisture patterns (Figure 7). The morphological characteristics of forests (qv value = 0.2714) and barren land (qv value = 0.2251) have a stronger impact on soil moisture variation than temperature and topographic factors. This suggests that the geometric configuration of these land cover types may influence regional soil moisture by altering water retention capacity, evaporation intensity, and local microclimatic conditions. Fragmentation and edge effects within these landscapes may further affect water storage and movement pathways. In contrast, grasslands, although the most widespread land cover on the plateau, show relatively low explanatory power (qv value = 0.0472). This likely reflects variations in how different surface types mediate hydrological processes such as interception, infiltration, and evaporation. Water bodies and ice areas (qv value = 0.0009), along with croplands (qv value = 0.0002), contribute minimally to soil moisture variability. Urban areas were excluded from the analysis due to statistical insignificance, likely because of their limited spatial extent on the plateau.

4. Discussion

4.1. Gradient Effects of Climate, Topography, and Vegetation on Soil Moisture Variability

We systematically investigated extreme soil moisture variability in relation to threshold values of key environmental drivers, revealing clear linear gradient responses to climatic, topographic, and vegetation influences. Among climatic variables, precipitation, NDVI, actual evapotranspiration (aet), and solar radiation emerged as dominant determinants of soil moisture extremes [31] (Figure 8a–c,h). High values of these factors were spatially aligned with moisture-rich regions, particularly when aet exceeded 68.7 mm, precipitation surpassed 14.9 mm, and NDVI values were above 0.597. These conditions corresponded to significantly elevated mean soil moisture levels, suggesting a synergistic effect of favorable hydrothermal conditions that promote water accumulation across the plateau.
In contrast, extreme temperature conditions such as minimum temperatures below −26.6 °C or maximum temperatures below −4.63 °C, combined with elevated solar radiation above 192 W/m2, were consistently associated with drier regions (Figure 8c–e), indicating that high energy inputs contribute to moisture depletion. Notably, slope gradient exhibited the strongest linear control over soil moisture distribution (Figure 8g). The highest mean moisture levels were observed on gentle slopes less than 3 degrees, while soil moisture declined rapidly with increasing slope angle, dropping by nearly half within the range of 10.4 to 21 degrees. This pattern highlights the role of topography in promoting runoff over water retention. Additionally, higher elevations were associated with progressively reduced soil moisture extremes (Figure 8f), reflecting the constraints imposed by elevation on moisture availability.

4.2. Contrasting Effects of Landscape Morphology for Land Covers on Soil Moisture Variation

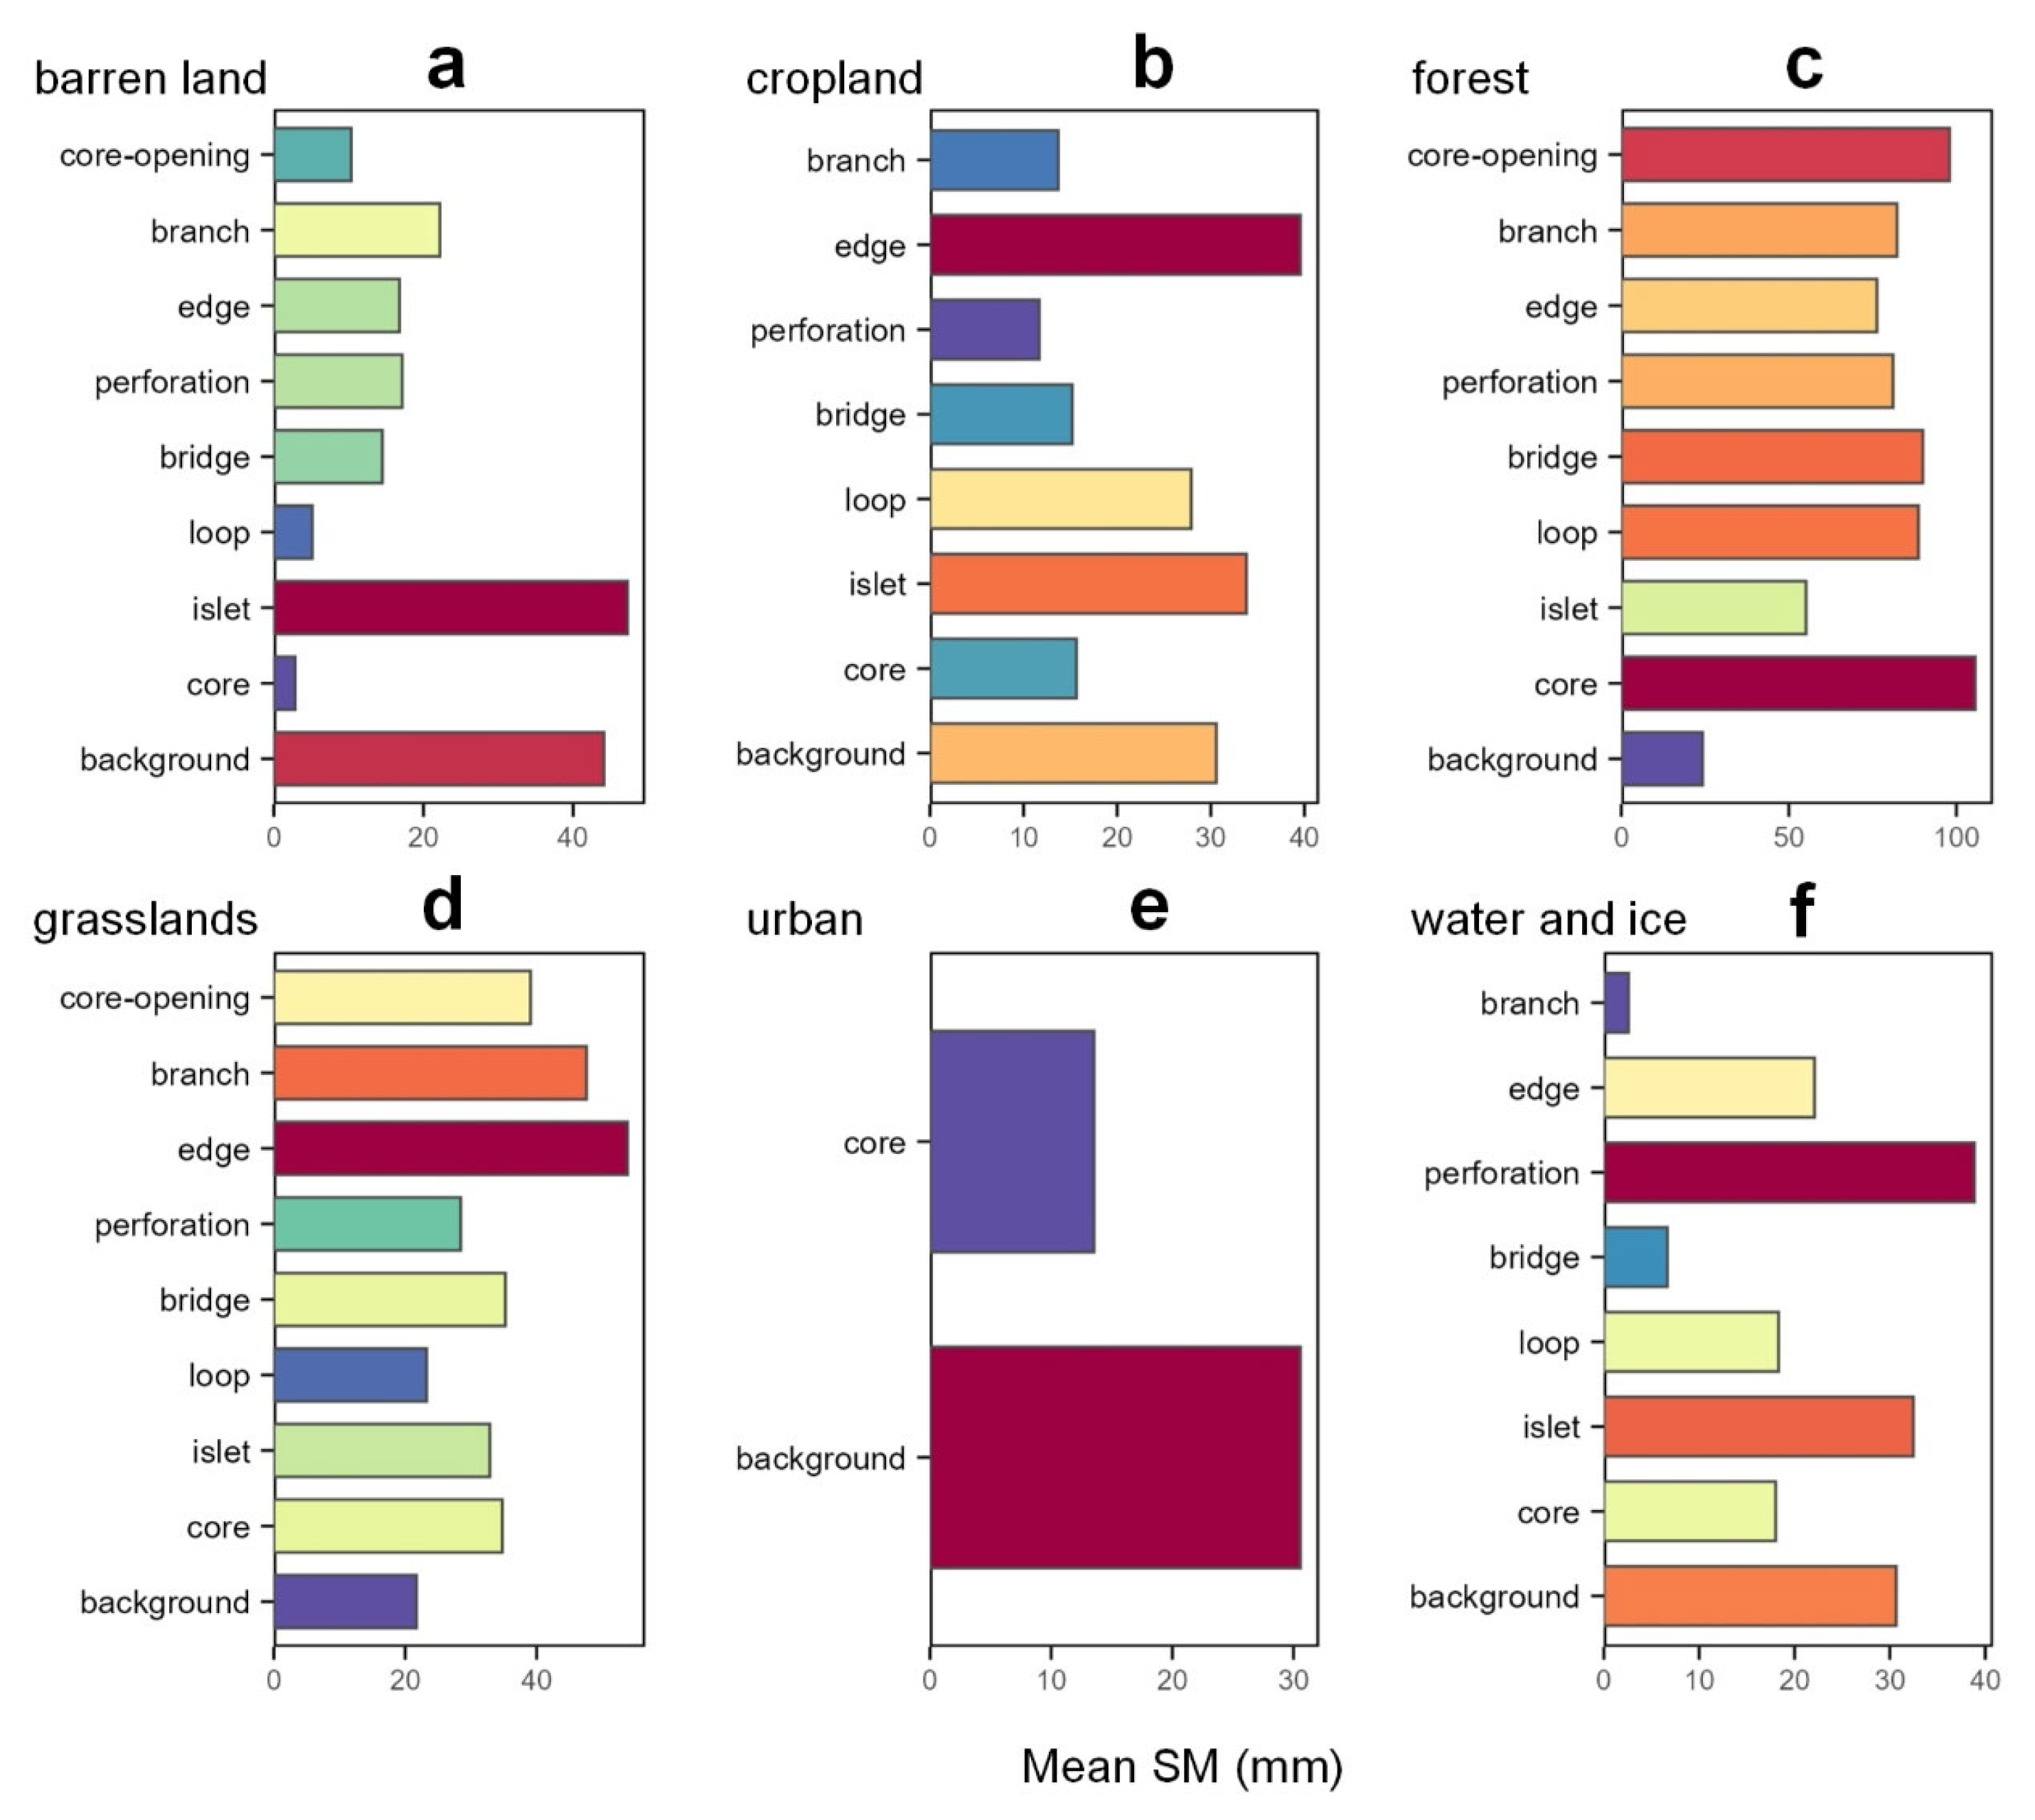
The spatial configuration of land cover types plays a critical role in shaping soil moisture extremes. In forested landscapes, high soil moisture is primarily found within “core” areas and transitional structures such as “core-opening” and “bridge” zones (Figure 9c). This pattern suggests that intact or well-connected forest patches enhance water retention capacity [32]. In contrast, “edge” and “islet” components are associated with lower soil moisture levels, indicating that increased fragmentation may elevate the risk of water loss [33,34] (Figure 9c).
In grassland areas, elevated moisture levels are observed in “edge”, “branch”, and “core-opening” structures (Figure 9d). These patterns are likely driven by dense root networks and preferential flow paths along vegetation margins, which form hydrological “interception nets” that reduce surface runoff and promote infiltration [35]. In barren landscapes, higher moisture levels are concentrated in “islet” and “branch” units (Figure 9a), possibly due to localized microtopographic depressions that facilitate water accumulation [36,37].
Agricultural areas show significantly higher soil moisture in “islet” and “edge” units (Figure 9b), which may reflect the influence of irrigation practices. Urban and water body landscapes display sharp spatial contrasts (Figure 9e,f). Urban “core” zones tend to experience pronounced drying, while water-related features such as “perforation” and “loop” elements maintain localized moisture hotspots. These observations highlight the distinctive soil–water interface dynamics that regulate local moisture conditions across different land cover morphologies [38].

4.3. Interactive Effects of Landscape Morphology and Other Factors on Soil Moisture Variation

As shown in Figure 10, landscape morphologies for forest and barren land predominantly exhibit linear enhancement effects, with relatively high qv, especially in relation to precipitation, evapotranspiration, and NDVI. This suggests that soil moisture variations in these landscapes are largely driven by individual factors through relatively straightforward response mechanisms.
In contrast, grassland, cropland, and urban landscape morphologies tend to exhibit nonlinear enhancement effects, characterized by high q-values across multiple factors, particularly in their interactions with temperature (both minimum and maximum) and topographic variables such as elevation and slope. These patterns indicate that soil moisture distribution in these landscapes is governed by complex, nonlinear interactions among multiple drivers, likely reflecting marginal habitat suitability or anthropogenic disturbances that contribute to system instability. Water and ice morphologies also display predominantly nonlinear enhancement effects, suggesting that spatial variations in adjacent soil moisture are more strongly influenced by the combined effects of thermal regulation and topographic convergence.
Overall, these findings highlight clear divergences in the mechanisms governing soil moisture variability across different land cover types on the Tibetan Plateau. Natural and relatively stable systems, such as forest and barren lands, are primarily influenced by climate-driven linear responses. In contrast, anthropogenic or transitional systems, including urban areas, croplands, grasslands, and water bodies, are more affected by multifactorial, nonlinear dynamics. These insights underscore the importance of incorporating complex interactive processes into soil moisture modeling and ecological restoration planning.

4.4. Effects of Temperature Anomalies on the Role of Key Land Cover Morphologies in Soil Moisture Regulation

Under temperature anomalies, precipitation remains the dominant and stable driver of soil moisture, while other factors show stronger variability. Actual evapotranspiration weakens under cold anomalies but slightly strengthens under warm conditions, NDVI gains explanatory power particularly during warming, and shortwave radiation loses much of its influence. Temperature itself becomes more relevant in warm conditions, while elevation effects diminish. Among land covers, forests increase in sensitivity under warming, whereas grasslands and barren land tend to lose their regulatory capacity (Table 3).
Landscape morphology reveals further contrasts (Table 4). Forest cores consistently decline under both anomalies, reflecting weakened buffering of intact patches, while forest islets retain more moisture in cold conditions but suffer losses under warming. Transitional structures such as loops and perforations help conserve soil moisture across anomalies, whereas grassland cores and barren cores decline markedly in warm states, indicating high vulnerability to heat stress.
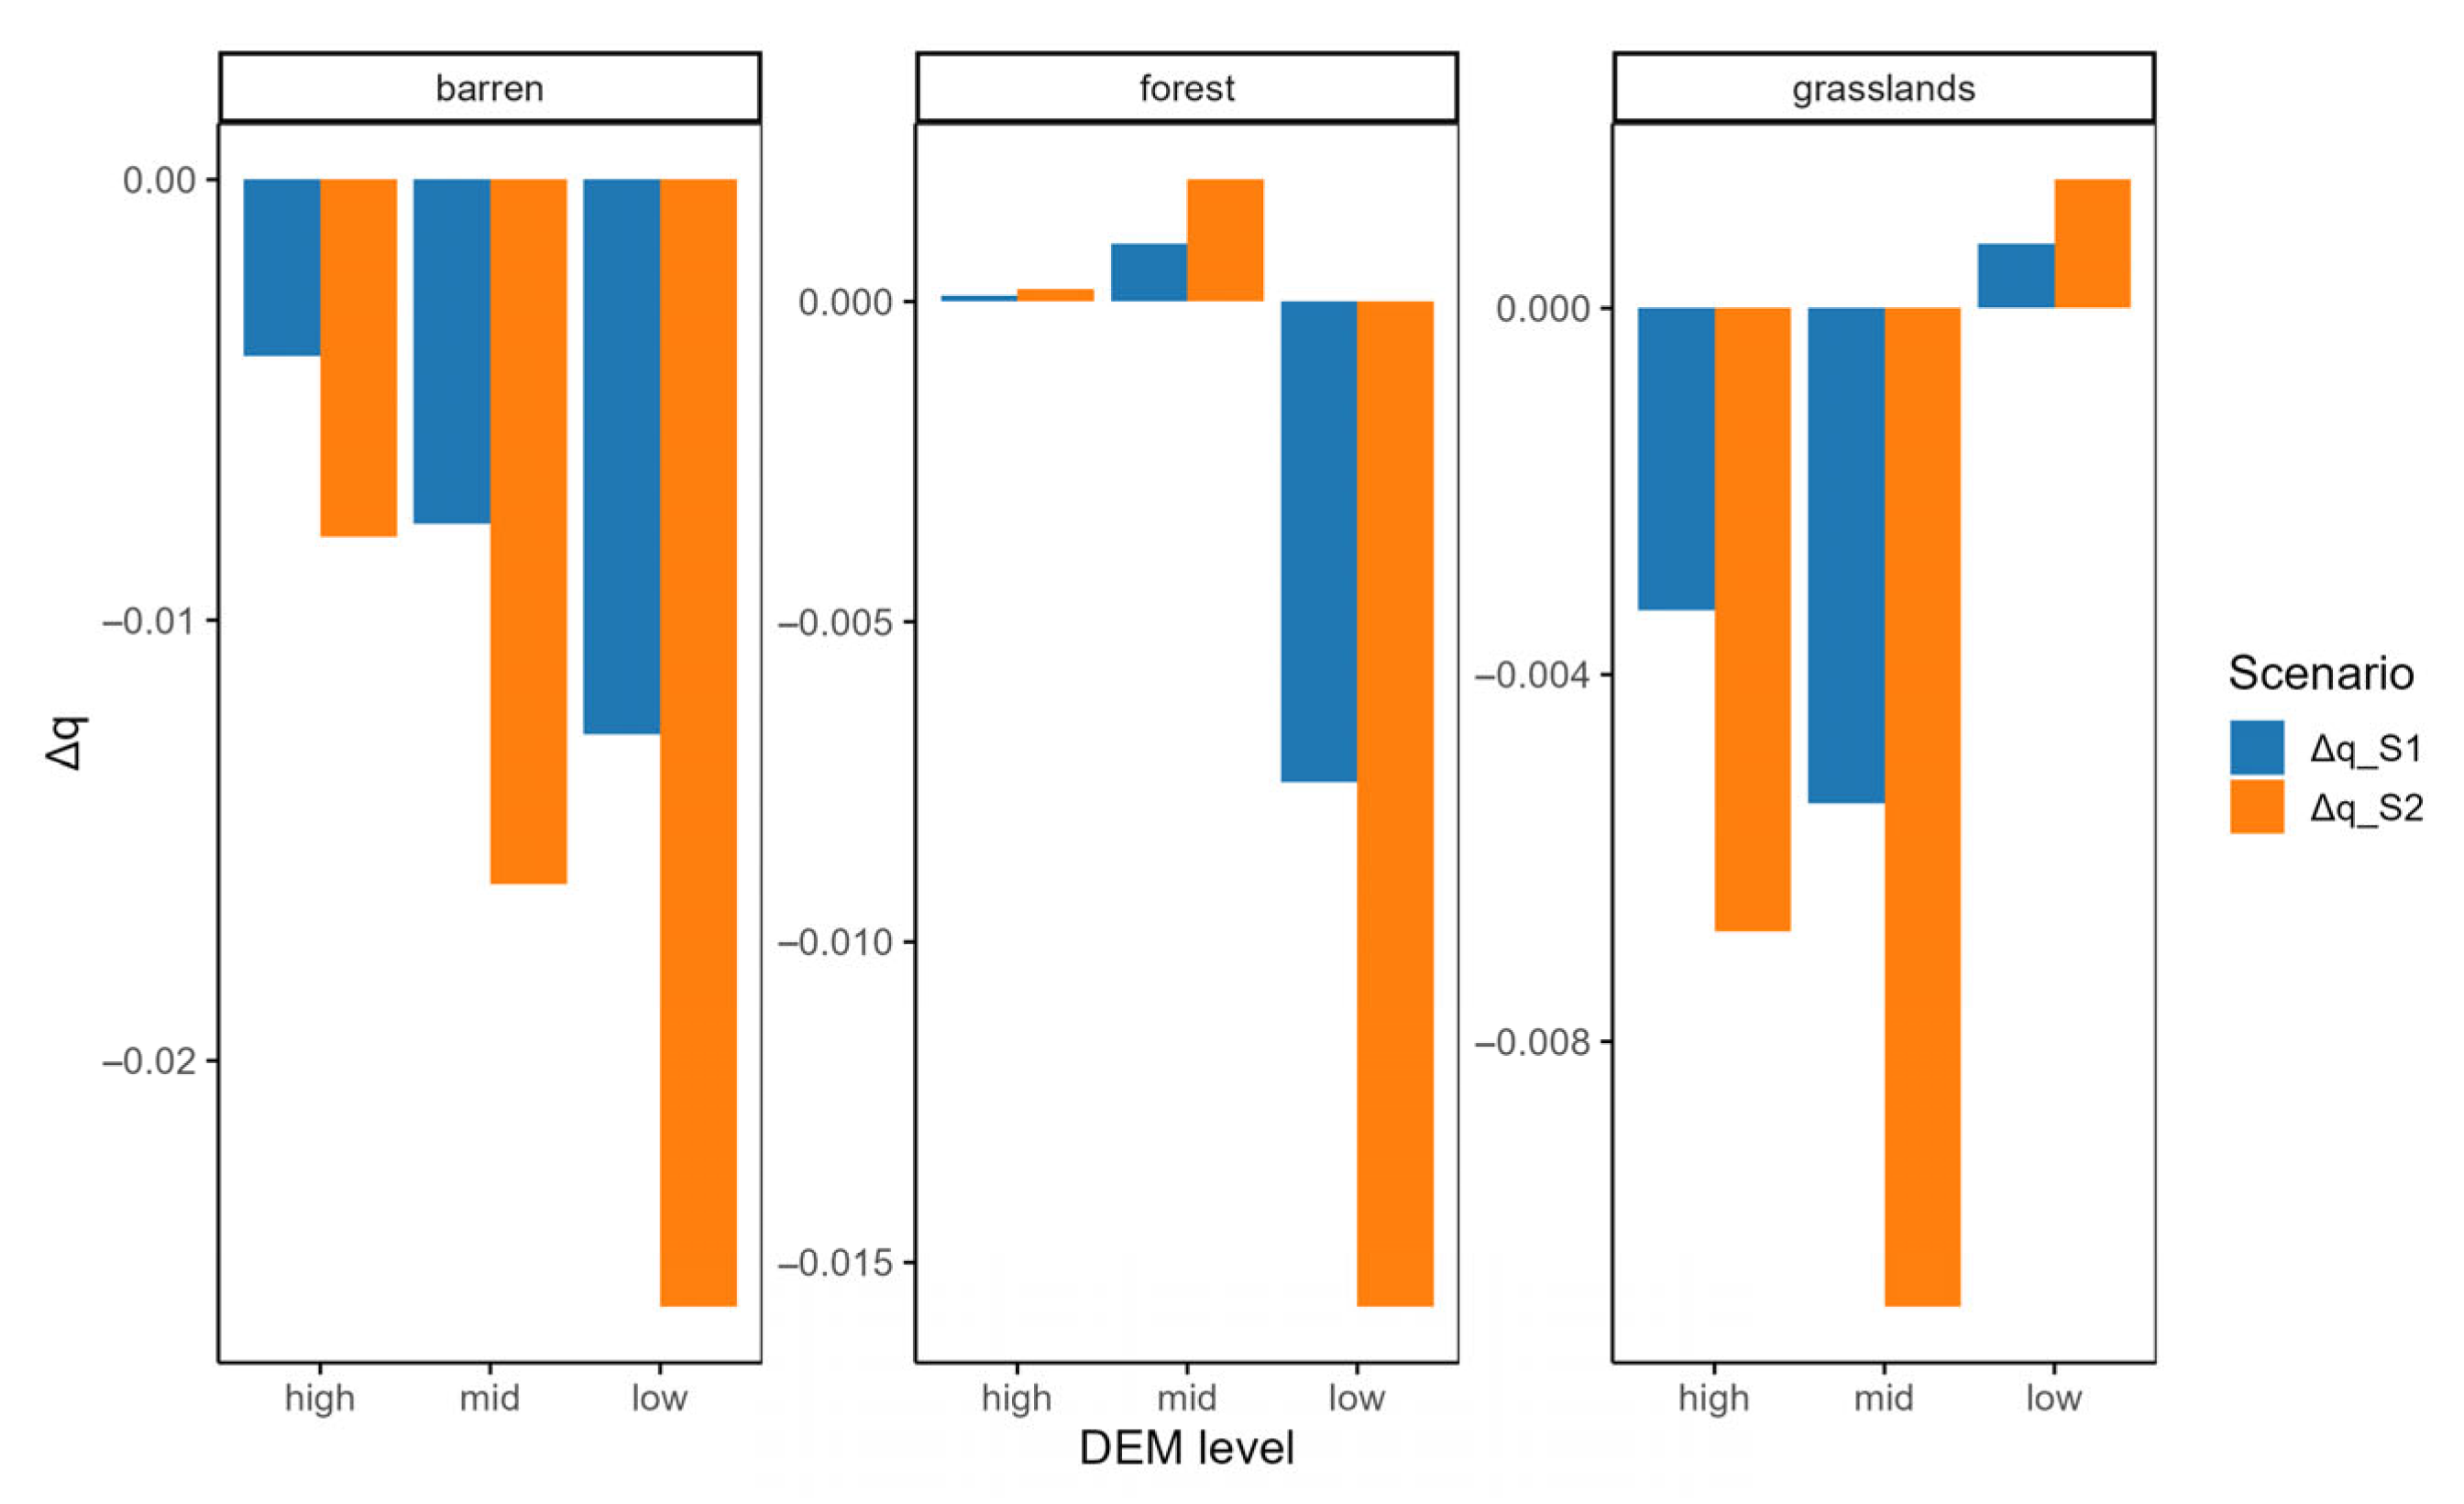
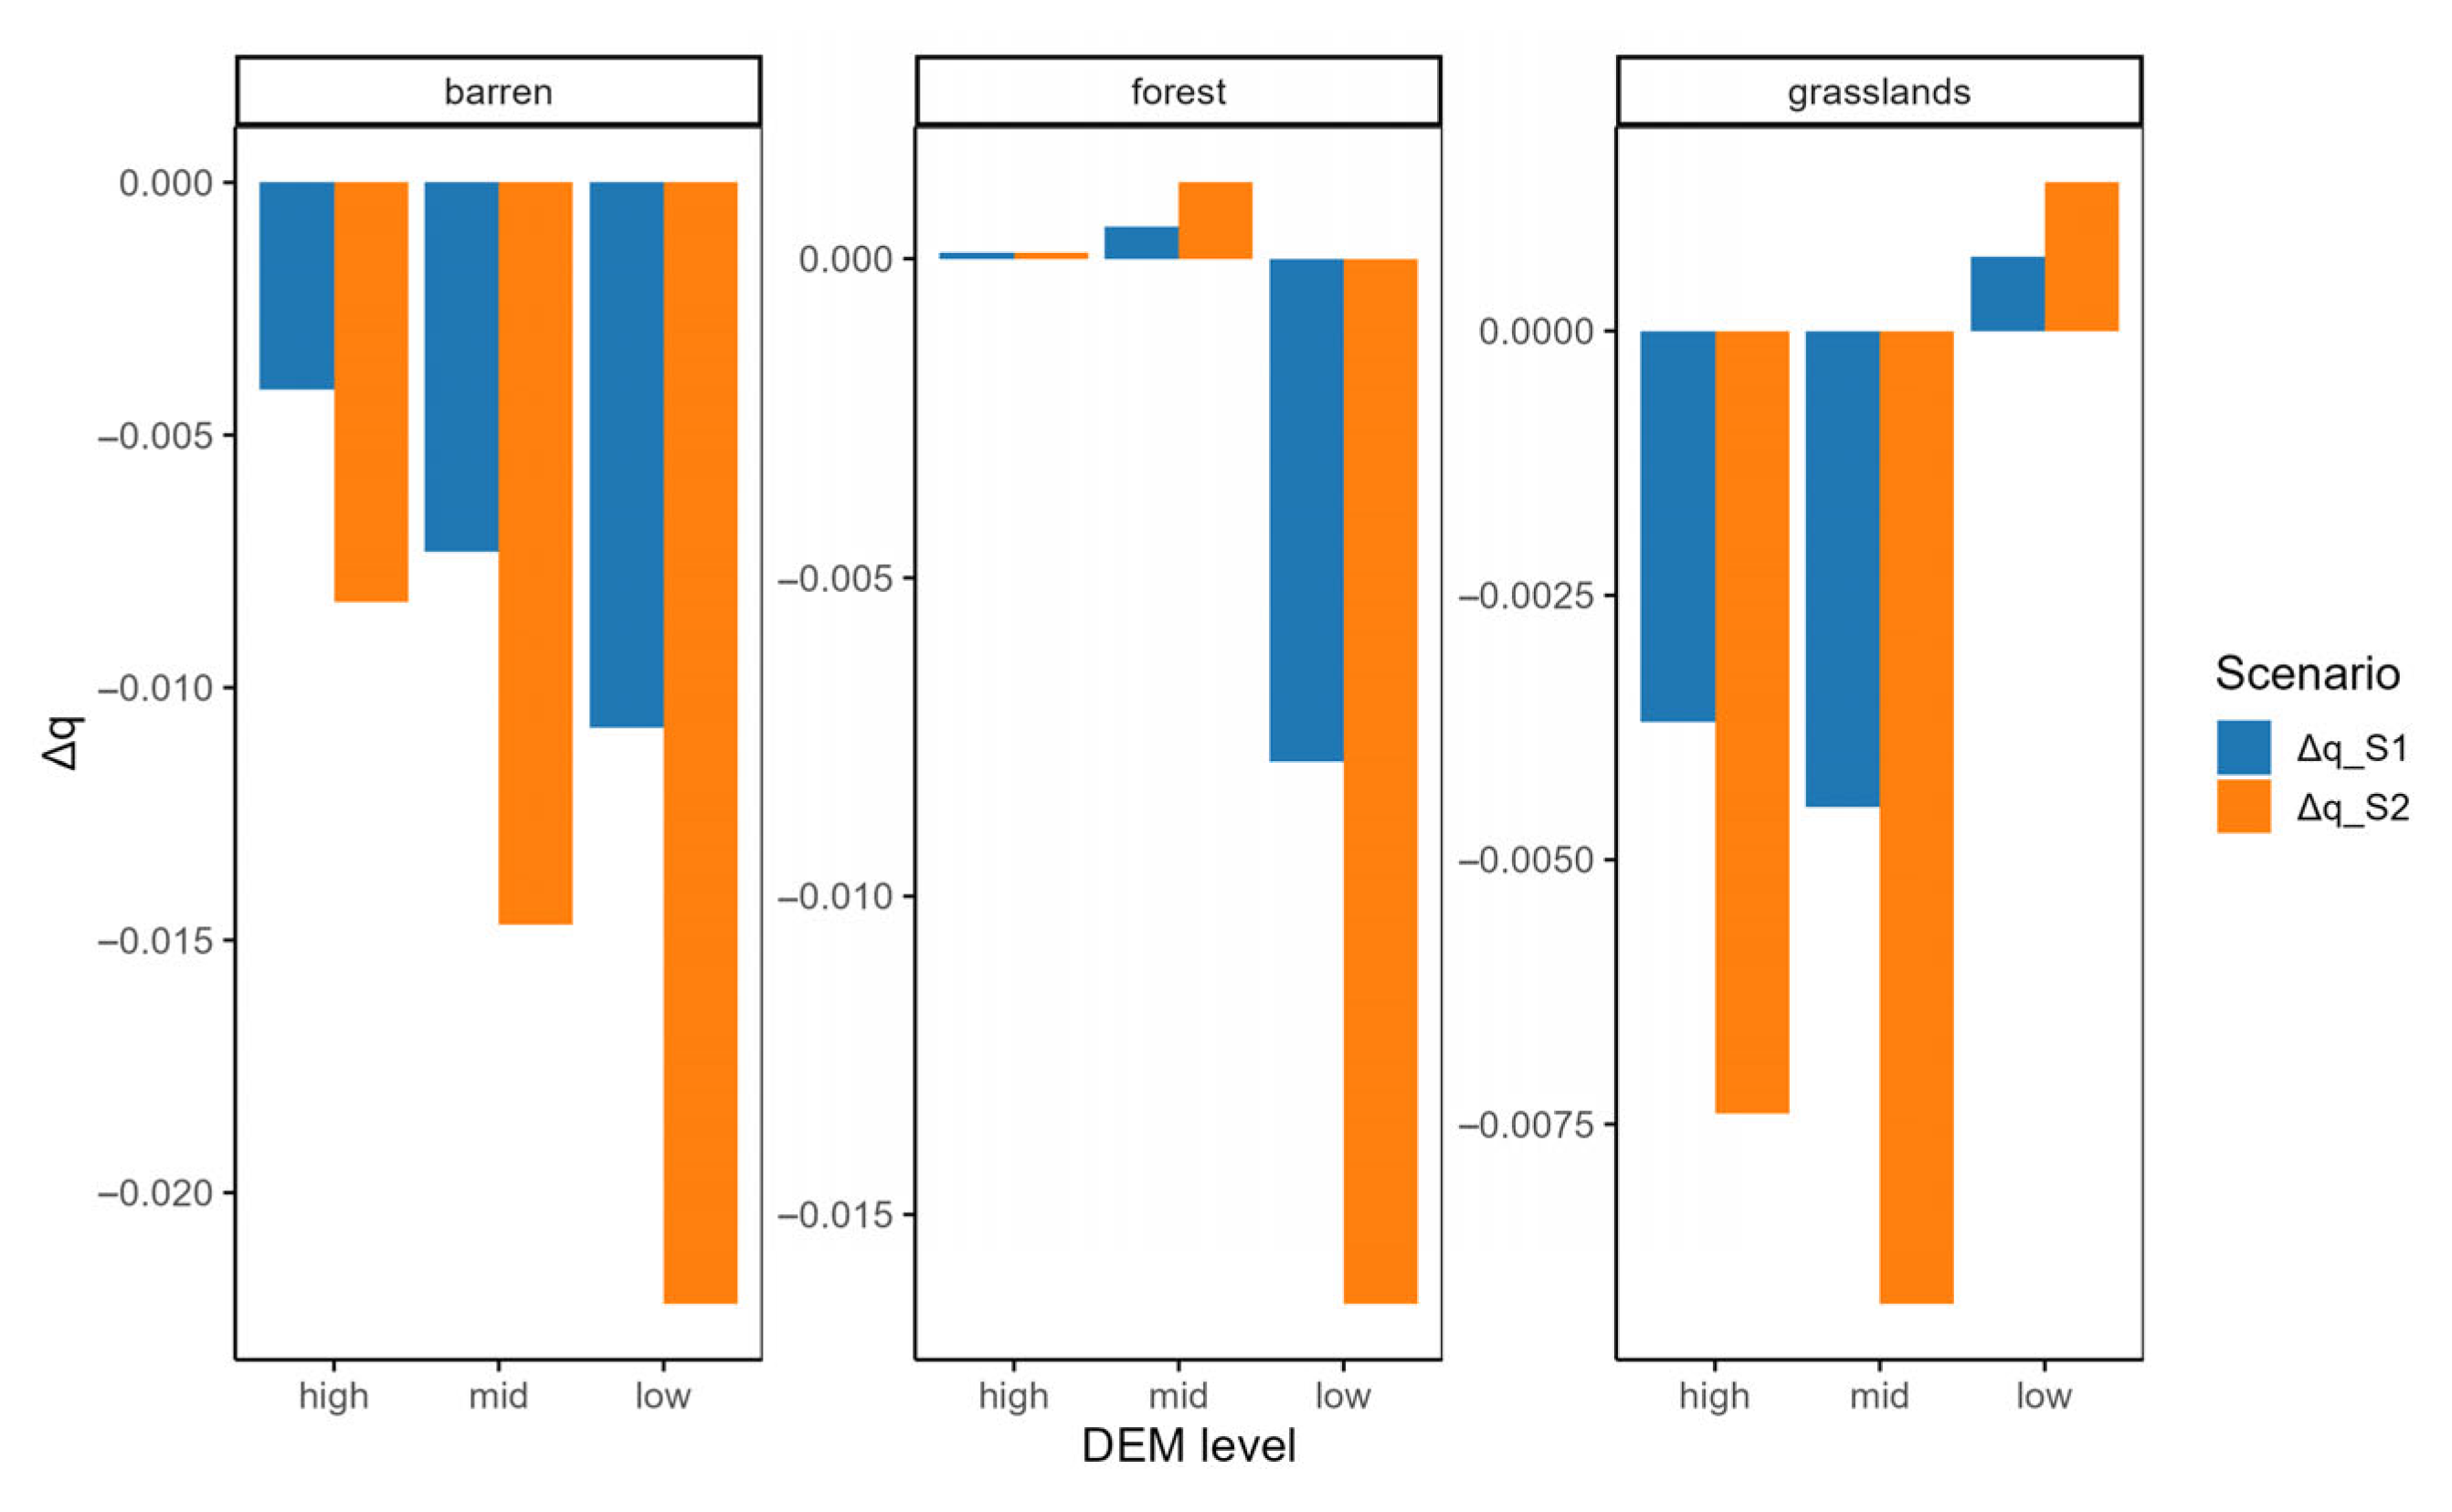
The perturbation experiments confirm these patterns across elevation and season (Figure 11 and Figure 12). Lowland forests and barren land amplify warming-induced drying, while forests at higher elevations display slight buffering effects. Grasslands show elevation-dependent responses, with upland systems most vulnerable and lowland grasslands occasionally offsetting winter warming through freeze–thaw processes. Taken together, these results highlight that warming substantially reshapes the role of land-cover morphologies in regulating soil moisture, with upland forests acting as stabilizers, lowland forests and barren land amplifying aridification, and grasslands emerging as the most sensitive and elevation-dependent systems.

5. Conclusions

This study integrated reanalysis, satellite data, and landscape morphology analysis to uncover the drivers of soil moisture heterogeneity across the Tibetan Plateau. Beyond confirming the dominant role of precipitation and vegetation, our findings emphasize the overlooked but substantial influence of land-cover morphology, particularly in forests and barren lands, where spatial configuration surpassed temperature in shaping soil water patterns. The gradient responses of climate, topography, and vegetation, together with the distinct effects of morphological units such as cores, edges, and islets, illustrate that soil moisture heterogeneity is jointly determined by both environmental gradients and structural features of the landscape.
Importantly, the analysis of interactions revealed divergent regulatory pathways: relatively undisturbed systems (forests and barren land) are shaped by climate-driven linear responses, whereas transitional or human-influenced systems (croplands, grasslands, urban areas, and water bodies) depend on nonlinear, multi-factor dynamics. The perturbation experiments under temperature anomalies further demonstrate that warming modifies these relationships, weakening the buffering capacity of forests and exposing grasslands and barren land to pronounced drying risks.
Taken together, these results underscore that landscape morphology acts not merely as a background modifier but as an active determinant of soil moisture resilience and vulnerability. By integrating climate gradients, land-cover morphologies, and their interactions, this study provides new mechanistic insights into how the Tibetan Plateau’s ecosystems respond to climate variability. These insights offer valuable guidance for ecological restoration, land management, and water resource sustainability in fragile high-altitude regions.

Supplementary Materials

The following supporting information can be downloaded at: https://www.mdpi.com/article/10.3390/w17172625/s1, Figure S1: Explanatory power (q-value) of land-cover morphologies for soil moisture under different intensities of human activity.

Author Contributions

Conceptualization, Y.M. and F.W.; methodology, F.W.; original draft, F.W., Q.Z. and Y.M.; funding acquisition, F.W. and Y.M.; Writing—review and editing, F.W., Q.Z. and Y.M. All authors have read and agreed to the published version of the manuscript.

Funding

This research was funded by the National Natural Science Foundation of China (U2442213, 42505089) and the Postdoctoral Special Program of Anhui Jianzhu University in Natural Sciences (grant number 2025QDHZ07).

Data Availability Statement

The original contributions presented in this study are included in the article. Further inquiries can be directed to the corresponding author.

Acknowledgments

The authors would like to acknowledge all members of the Land–Atmosphere Interaction and its Climatic Effects Group, as well as all anonymous reviewers.

Conflicts of Interest

The authors declare no conflicts of interest.

Abbreviations

The following abbreviations are used in this manuscript:
aetactual evapotranspiration
prprecipitation accumulation
sraddownward surface shortwave radiation
tmmnminimum temperature
tmmxmaximum temperature
eleelevation
NDVInormalized difference vegetation index
SMsoil moisture

References

  1. Su, Z.; De Rosnay, P.; Wen, J.; Wang, L.; Zeng, Y. Evaluation of ECMWF’s Soil Moisture Analyses Using Observations on the Tibetan Plateau. J. Geophys. Res. Atmos. 2013, 118, 5304–5318. [Google Scholar] [CrossRef]
  2. Cui, Y.; Zeng, C.; Zhou, J.; Xie, H.; Wan, W.; Hu, L.; Xiong, W.; Chen, X.; Fan, W.; Hong, Y. A Spatio-Temporal Continuous Soil Moisture Dataset over the Tibet Plateau from 2002 to 2015. Sci. Data 2019, 6, 247. [Google Scholar] [CrossRef]
  3. Yohannes, H.; Soromessa, T.; Argaw, M.; Dewan, A. Impact of Landscape Pattern Changes on Hydrological Ecosystem Services in the Beressa Watershed of the Blue Nile Basin in Ethiopia. Sci. Total Environ. 2021, 793, 148559. [Google Scholar] [CrossRef]
  4. Zhu, B.; Xie, X.; Meng, S.; Lu, C.; Yao, Y. Sensitivity of Soil Moisture to Precipitation and Temperature over China: Present State and Future Projection. Sci. Total Environ. 2020, 705, 135774. [Google Scholar] [CrossRef]
  5. Berg, A.; Sheffield, J.; Milly, P.C.D. Divergent Surface and Total Soil Moisture Projections under Global Warming. Geophys. Res. Lett. 2017, 44, 236–244. [Google Scholar] [CrossRef]
  6. Grillakis, M.G. Increase in Severe and Extreme Soil Moisture Droughts for Europe under Climate Change. Sci. Total Environ. 2019, 660, 1245–1255. [Google Scholar] [CrossRef]
  7. Deng, Q.; Yang, J.; Zhang, L.; Sun, Z.; Sun, G.; Chen, Q.; Dou, F. Analysis of Seasonal Driving Factors and Inversion Model Optimization of Soil Moisture in the Qinghai Tibet Plateau Based on Machine Learning. Water 2023, 15, 2859. [Google Scholar] [CrossRef]
  8. Wang, L.; Lu, J.; Zhou, R.; Duan, G.; Wen, Z. Analysis of Soil Moisture Change Characteristics and Influencing Factors of Grassland on the Tibetan Plateau. Remote Sens. 2023, 15, 298. [Google Scholar] [CrossRef]
  9. Wang, T.; Franz, T.E.; Li, R.; You, J.; Shulski, M.D.; Ray, C. Evaluating Climate and Soil Effects on Regional Soil Moisture Spatial Variability Using EOFs. Water Resour. Res. 2017, 53, 4022–4035. [Google Scholar] [CrossRef]
  10. Pan, X.; Guo, X.; Li, X.; Niu, X.; Yang, X.; Feng, M.; Che, T.; Jin, R.; Ran, Y.; Guo, J.; et al. National Tibetan Plateau Data Center: Promoting Earth System Science on the Third Pole. Bull. Am. Meteorol. Soc. 2021, 102, E2062–E2078. [Google Scholar] [CrossRef]
  11. Yao, T.; Bolch, T.; Chen, D.; Gao, J.; Immerzeel, W.; Piao, S.; Su, F.; Thompson, L.; Wada, Y.; Wang, L.; et al. The Imbalance of the Asian Water Tower. Nat. Rev. Earth Environ. 2022, 3, 618–632. [Google Scholar] [CrossRef]
  12. Bai, W.; Chen, X.; Tang, Y.; He, Y.; Zheng, Y. Temporal and Spatial Changes of Soil Moisture and Its Response to Temperature and Precipitation over the Tibetan Plateau. Hydrol. Sci. J. 2019, 64, 1370–1384. [Google Scholar] [CrossRef]
  13. Fan, K.; Zhang, Q.; Singh, V.P.; Sun, P.; Song, C.; Zhu, X.; Yu, H.; Shen, Z. Spatiotemporal Impact of Soil Moisture on Air Temperature across the Tibet Plateau. Sci. Total Environ. 2019, 649, 1338–1348. [Google Scholar] [CrossRef] [PubMed]
  14. Dai, L.; Fu, R.; Guo, X.; Du, Y.; Zhang, F.; Cao, G. Soil Moisture Variations in Response to Precipitation Across Different Vegetation Types on the Northeastern Qinghai-Tibet Plateau. Front. Plant Sci. 2022, 13, 854152. [Google Scholar] [CrossRef]
  15. Tian, J.; Zhang, B.; He, C.; Han, Z.; Bogena, H.R.; Huisman, J.A. Dynamic Response Patterns of Profile Soil Moisture Wetting Events under Different Land Covers in the Mountainous Area of the Heihe River Watershed, Northwest China. Agric. For. Meteorol. 2019, 271, 225–239. [Google Scholar] [CrossRef]
  16. Zhang, E.; Liu, Y.; Pan, T.; Tan, Q.; Ma, Z. Evaluating the Effects of Climate Change and Human Activities on the Seasonal Trends and Spatial Heterogeneity of Soil Moisture. Remote Sens. 2022, 14, 4862. [Google Scholar] [CrossRef]
  17. Liu, Y.; Yang, Y. Spatial-Temporal Variability Pattern of Multi-Depth Soil Moisture Jointly Driven by Climatic and Human Factors in China. J. Hydrol. 2023, 619, 129313. [Google Scholar] [CrossRef]
  18. Zhang, K.; Wang, Q.; Chao, L.; Ye, J.; Li, Z.; Yu, Z.; Yang, T.; Ju, Q. Ground Observation-Based Analysis of Soil Moisture Spatiotemporal Variability across a Humid to Semi-Humid Transitional Zone in China. J. Hydrol. 2019, 574, 903–914. [Google Scholar] [CrossRef]
  19. Ye, L.; Fang, L.; Shi, Z.; Deng, L.; Tan, W. Spatio-Temporal Dynamics of Soil Moisture Driven by ‘Grain for Green’ Program on the Loess Plateau, China. Agric. Ecosyst. Environ. 2019, 269, 204–214. [Google Scholar] [CrossRef]
  20. Wu, D.; Wang, T.; Di, C.; Wang, L.; Chen, X. Investigation of Controls on the Regional Soil Moisture Spatiotemporal Patterns across Different Climate Zones. Sci. Total Environ. 2020, 726, 138214. [Google Scholar] [CrossRef]
  21. Srivastava, A.; Saco, P.M.; Rodriguez, J.F.; Kumari, N.; Chun, K.P.; Yetemen, O. The Role of Landscape Morphology on Soil Moisture Variability in Semi-arid Ecosystems. Hydrol. Process. 2021, 35, e13990. [Google Scholar] [CrossRef]
  22. Feng, H.; Liu, Y. Combined Effects of Precipitation and Air Temperature on Soil Moisture in Different Land Covers in a Humid Basin. J. Hydrol. 2015, 531, 1129–1140. [Google Scholar] [CrossRef]
  23. Abatzoglou, J.T.; Dobrowski, S.Z.; Parks, S.A.; Hegewisch, K.C. TerraClimate, a High-Resolution Global Dataset of Monthly Climate and Climatic Water Balance from 1958–2015. Sci. Data 2018, 5, 170191. [Google Scholar] [CrossRef] [PubMed]
  24. Friedl, M.A.; McIver, D.K.; Hodges, J.C.F.; Zhang, X.Y.; Muchoney, D.; Strahler, A.H.; Woodcock, C.E.; Gopal, S.; Schneider, A.; Cooper, A.; et al. Global Land Cover Mapping from MODIS: Algorithms and Early Results. Remote Sens. Environ. 2002, 83, 287–302. [Google Scholar] [CrossRef]
  25. Lehner, B.; Verdin, K.; Jarvis, A. New Global Hydrography Derived From Spaceborne Elevation Data. EoS Trans. 2008, 89, 93–94. [Google Scholar] [CrossRef]
  26. Soille, P.; Vogt, P. Morphological Spatial Pattern Analysis: Open Source Release. Int. Arch. Photogramm. Remote Sens. Spat. Inf. Sci. 2022, XLVIII-4/W1-2022, 427–433. [Google Scholar] [CrossRef]
  27. Wang, J.; Li, X.; Christakos, G.; Liao, Y.; Zhang, T.; Gu, X.; Zheng, X. Geographical Detectors-Based Health Risk Assessment and Its Application in the Neural Tube Defects Study of the Heshun Region, China. Int. J. Geogr. Inf. Sci. 2010, 24, 107–127. [Google Scholar] [CrossRef]
  28. Cao, F.; Ge, Y.; Wang, J.-F. Optimal Discretization for Geographical Detectors-Based Risk Assessment. GISci. Remote Sens. 2013, 50, 78–92. [Google Scholar] [CrossRef]
  29. Peng, C.; Zeng, J.; Chen, K.-S.; Li, Z.; Ma, H.; Zhang, X.; Shi, P.; Wang, T.; Yi, L.; Bi, H. Global Spatiotemporal Trend of Satellite-Based Soil Moisture and Its Influencing Factors in the Early 21st Century. Remote Sens. Environ. 2023, 291, 113569. [Google Scholar] [CrossRef]
  30. Li, Y.-X.; Leng, P.; Kasim, A.A.; Li, Z.-L. Spatiotemporal Variability and Dominant Driving Factors of Satellite Observed Global Soil Moisture from 2001 to 2020. J. Hydrol. 2025, 654, 132848. [Google Scholar] [CrossRef]
  31. Wu, S.; Wei, Z.; Li, X.; Ma, L. Land—atmosphere Coupling Effects of Soil Temperature and Moisture on Extreme Precipitation in the Arid Regions of Northwest China. Front. Earth Sci. 2023, 10, 1079131. [Google Scholar] [CrossRef]
  32. Pulido-Esquivel, A.Y.; Prado-Hernández, J.V.; Buendía-Espinoza, J.C.; García-Núñez, R.M. Agroforestry Systems Enhance Soil Moisture Retention and Aquifer Recharge in a Semi-Arid Mexican Valley. Water 2025, 17, 1488. [Google Scholar] [CrossRef]
  33. Nemésio, A.; Silva, D.P.; Nabout, J.C.; Varela, S. Effects of Climate Change and Habitat Loss on a Forest-dependent Bee Species in a Tropical Fragmented Landscape. Insect Conserv. Divers. 2016, 9, 149–160. [Google Scholar] [CrossRef]
  34. Yu, H.; Cui, W.; He, Z.; Yang, M.; Tan, H.; Yang, Q. Soil Moisture Loss in Planted Forests and Its Driving Factors: A Case Study of the Nanpan River Basin. Forests 2025, 16, 665. [Google Scholar] [CrossRef]
  35. Chen, L.; Zhang, K.; Wang, G. Dynamic Response of Soil Water to Rainfall for Different Runoff Plots on a Karst Hillslope. Geoderma 2025, 460, 117394. [Google Scholar] [CrossRef]
  36. Lin, M.; Zhang, J.; Cao, G.; Han, H.; Jin, Z.; Luo, D.; Zeng, G. Responses of Soil Moisture to Gully Land Consolidation in Asian Areas with Monsoon Climate. Water 2024, 16, 2001. [Google Scholar] [CrossRef]
  37. Grant, R.F.; Mekonnen, Z.A.; Riley, W.J.; Wainwright, H.M.; Graham, D.; Torn, M.S. Mathematical Modelling of Arctic Polygonal Tundra with Ecosys: 1. Microtopography Determines How Active Layer Depths Respond to Changes in Temperature and Precipitation. JGR Biogeosci. 2017, 122, 3161–3173. [Google Scholar] [CrossRef]
  38. Li, S.; Birk, S.; Xue, L.; Ren, H.; Chang, J.; Yao, X. Seasonal Changes in the Soil Moisture Distribution around Bare Rock Outcrops within a Karst Rocky Desertification Area (Fuyuan County, Yunnan Province, China). Environ. Earth Sci. 2016, 75, 1482. [Google Scholar] [CrossRef]
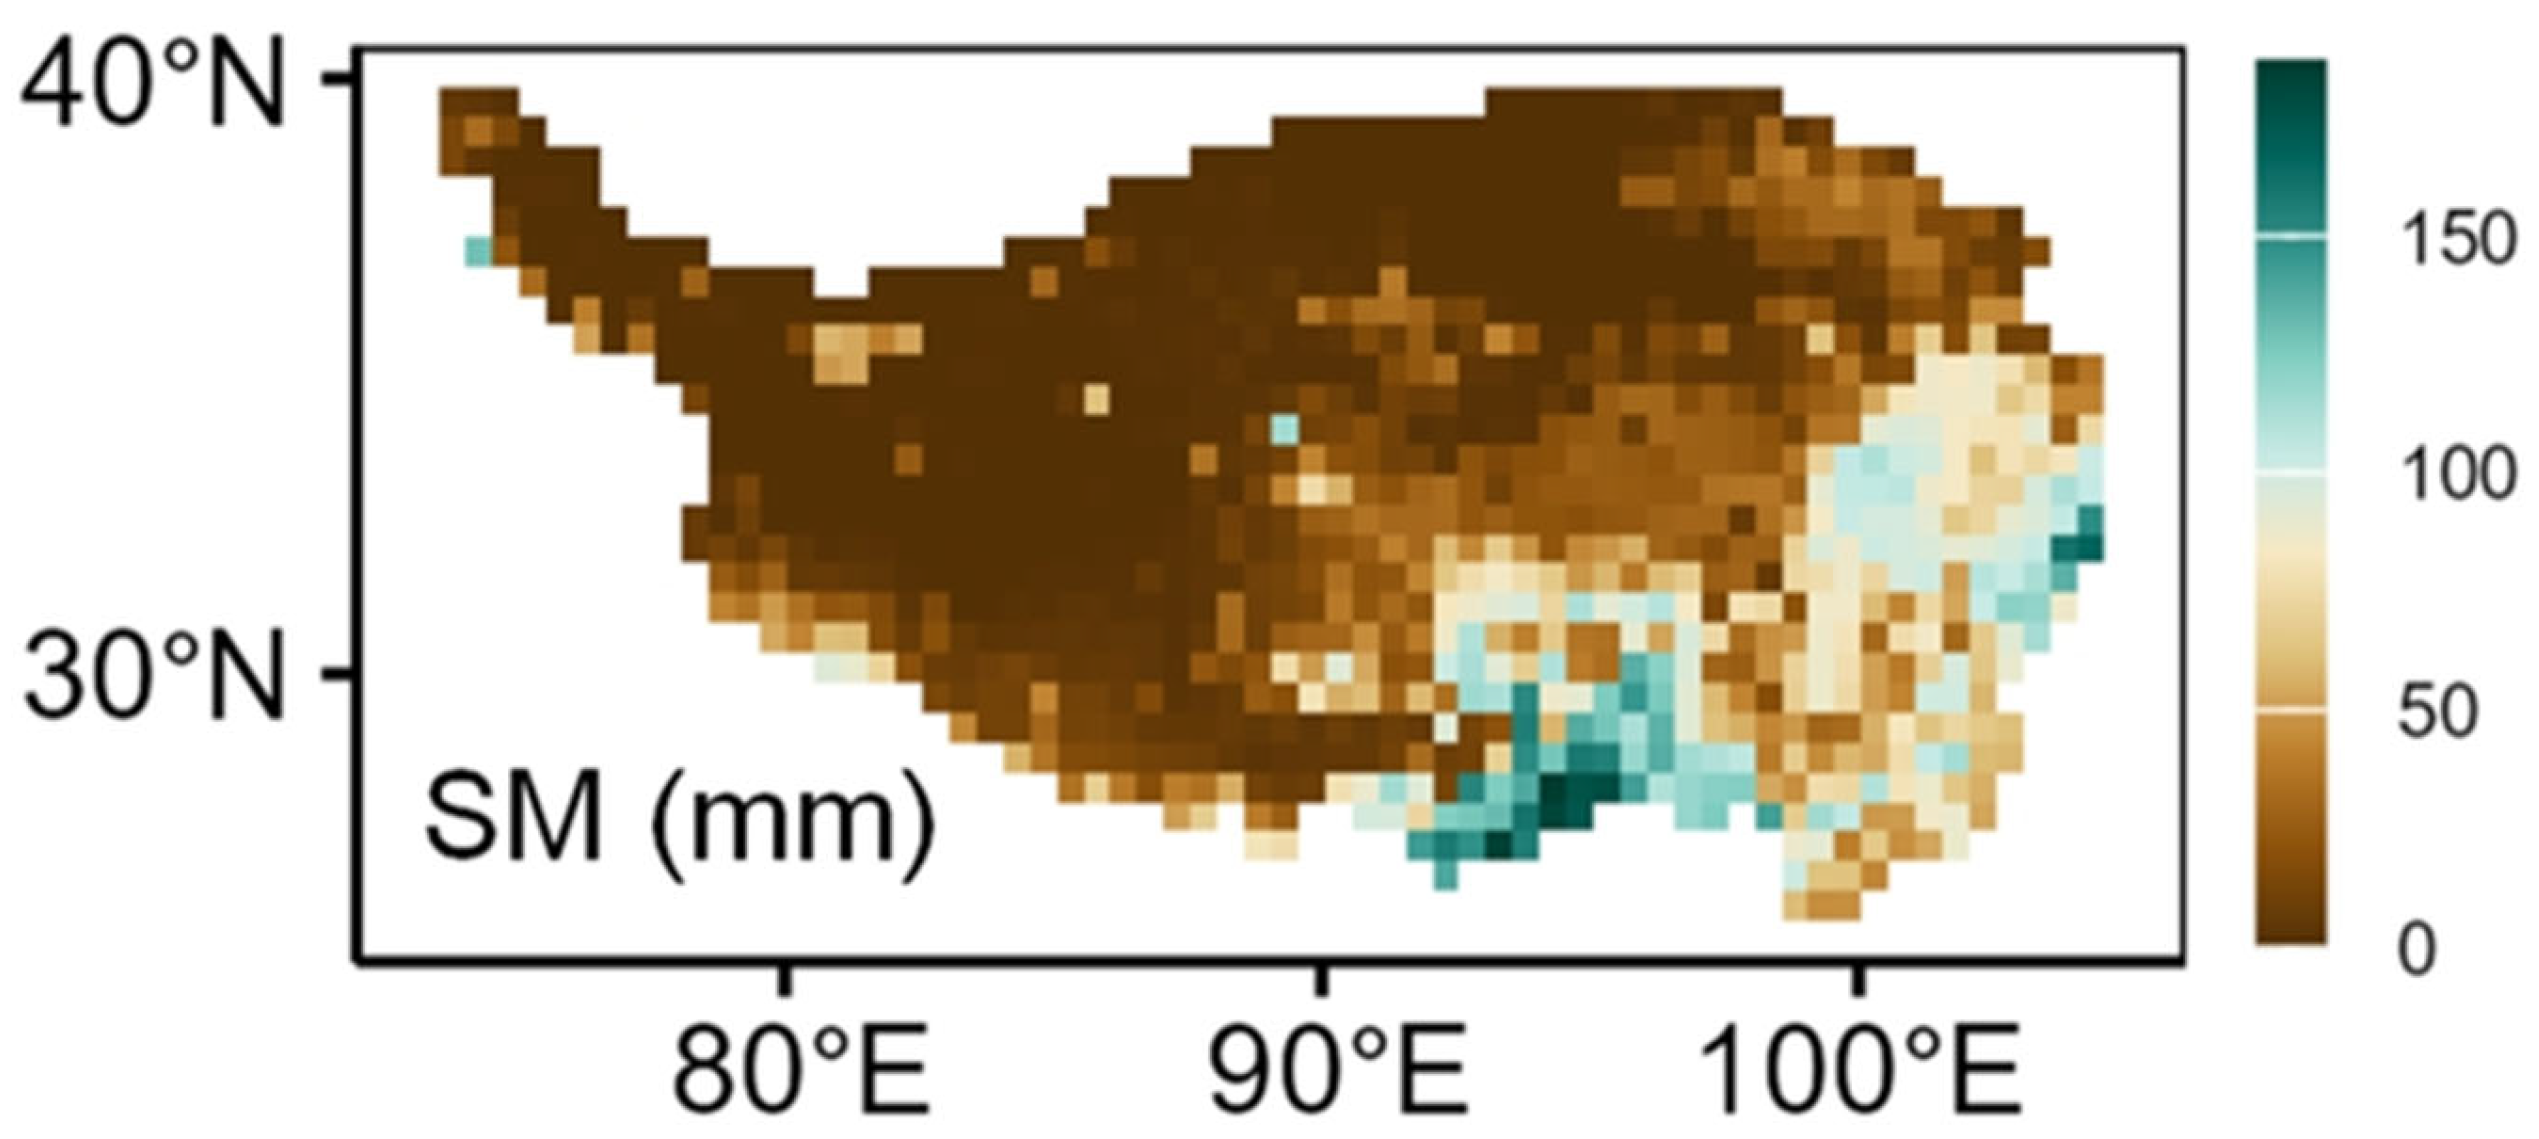
Figure 1. Spatial distribution of mean soil moisture over the Tibetan Plateau from 2018 to 2022. SM refers to soil moisture.
Water 17 02625 g001
Figure 2. A framework used to investigate the factors influencing soil moisture.
Water 17 02625 g002
Figure 3. Spatial patterns of climate, topography, and vegetation across the Tibetan Plateau. (a) aet; (b) pr; (c) srad; (d) tmmn; (e) tmmx; (f) ele; (g) slope; and (h) NDVI. aet, pr, srad, tmmn, tmmx, ele, and NDVI refer to actual evapotranspiration, precipitation accumulation, downward surface shortwave radiation, minimum temperature, maximum temperature, elevation, and normalized difference vegetation index, respectively.
Water 17 02625 g003
Figure 4. Proportional distribution of landscape morphology within each land-cover type.
Water 17 02625 g004
Figure 5. Spatial distribution of landscape morphology for forest, barren land, and grassland across the Tibetan Plateau. (a1,a2) represent the forest morphology and its enlarged area, respectively; (b1,b2) represent the barren land morphology and its enlarged area, respectively; and (c1,c2) represent the grasslands morphology and its enlarged area, respectively.
Water 17 02625 g005
Figure 6. Spatial distribution of landscape morphology for water and ice, cropland, and urban land across the Tibetan Plateau. (a1,a2) represent the water and ice morphology and its enlarged area, respectively; (b1,b2) represent the cropland morphology and its enlarged area, respectively; and (c1,c2) represent the urban morphology and its enlarged area, respectively.
Water 17 02625 g006
Figure 7. Impacts of different factors on the spatial variability of soil moisture across the Tibetan Plateau. aet, pr, srad, tmmn, tmmx, ele, and NDVI refer to actual evapotranspiration, precipitation accumulation, downward surface shortwave radiation, minimum temperature, maximum temper-ature, elevation, and normalized difference vegetation index, respectively. * represents the significant level with p < 0.05.
Water 17 02625 g007
Figure 8. Gradient effects of climate, topography, and vegetation on the spatial variability of soil moisture across the Tibetan Plateau. (a) aet; (b) pr; (c) srad; (d) tmmn; (e) tmmx; (f) ele; (g) slope; and (h) NDVI. aet, pr, srad, tmmn, tmmx, ele, NDVI, and SM refer to actual evapotranspiration, precipitation accumulation, downward surface shortwave radiation, minimum temperature, maximum temperature, elevation, normalized difference vegetation index, and soil moisture, respectively.
Water 17 02625 g008
Figure 9. Impacts of various landscape morphologies under each land-cover type on the soil moisture variation across the Tibetan Plateau. SM refers to soil moisture. (a) barren land; (b) cropland; (c) forest; (d) grasslands; (e) urban; and (f) water and ice.
Water 17 02625 g009
Figure 10. Interactive effects of landscape morphologies in different land-cover types and other factors on soil moisture variation across the Tibetan Plateau. aet, pr, srad, tmmn, tmmx, ele, and NDVI refer to actual evapotranspiration, precipitation accumulation, downward surface shortwave radiation, minimum temperature, maximum temperature, elevation, and normalized difference vegetation index, respectively.
Water 17 02625 g010
Figure 11. Explanatory power changes (Δq) of landscape morphological factors for soil moisture under warming scenarios across elevations in the warm season. S1 and S2 represent warming scenarios of +1 °C and +2 °C, respectively.
Water 17 02625 g011
Figure 12. Same as Figure 11, but for cold season.
Water 17 02625 g012
Table 1. MODIS Land Cover Types and Landscape Classification.
IGBP Land CoverLandscape Class
Evergreen Needleleaf Forestforest
Evergreen Broadleaf Forest
Deciduous Needleleaf Forest
Deciduous Broadleaf Forest
Mixed Forest
Woody Savanna
Closed Shrublandgrasslands
Open Shrubland
Savanna
Grassland
Croplandcropland
Cropland/Natural Vegetation Mosaic
Urban and Built-up Landurban land
Barren or Sparsely Vegetated Landbarren land
Permanent Wetlandwater and ice
Snow and Ice
Water Bodies
Table 2. Discretization of factors based on the optimal method and number of groups recommended by the optidisc function.
FactorsOptimal
Discretization Method
Number
of Groups
climateactual evapotranspiration (aet)sd10
precipitation accumulation (pr)natural10
downward surface shortwave radiation (srad)natural9
minimum temperature (tmmn)equal10
maximum temperature (tmmx)natural10
vegetationnormalized difference vegetation index (NDVI)equal10
topographyelevation (ele)natural10
slopesd10
Table 3. Factor explanatory power (q) and changes (Δq) under temperature anomalies relative to normal conditions (* refers to p < 0.05).
Variableq_Coldq_Normalq_WarmΔq_ColdΔq_Warm
pr0.7058 *0.7016 *0.7043 *0.00430.0028
aet0.4233 *0.4825 *0.4945 *−0.05920.012
NDVI0.4043 *0.387 *0.4323 *0.01730.0453
srad0.2711 *0.5704 *0.2919 *−0.2993−0.2785
forest0.2637 *0.2643 *0.2835 *−0.00050.0192
barren0.2343 *0.2278 *0.2104 *0.0066−0.0173
tmmn0.1932 *0.1886 *0.2000 *0.00460.0114
tmmx0.1904 *0.1811 *0.1859 *0.00930.0048
dem0.183 *0.2062 *0.1968 *−0.0233−0.0094
slope0.1124 *0.109 *0.1142 *0.00340.0052
grasslands0.0521 *0.0487 *0.0409 *0.0034−0.0077
water0.0008 *0.0009 *0.0011 *−0.00010.0002
cropland0.00010.0002 *0.0002 *−0.00010.0000
urban0.00000.0000 *0.0000 *0.00000.0000
Table 4. Soil moisture (SM, mm) and its changes in landscape morphology under temperature anomalies relative to normal conditions.
Land CoverMorphologyColdNormalWarmΔSM_ColdΔSM_Warm
forestbackground24.9425.2522.56−0.31−2.69
core104.10108.48104.29−4.38−4.19
islet59.6655.6250.044.05−5.58
loop90.2586.6789.053.582.38
bridge90.4390.7588.74−0.32−2.01
perforation83.1681.2978.791.86−2.51
edge76.6177.5374.63−0.92−2.90
branch83.5983.9079.33−0.31−4.58
core-opening98.4298.6896.83−0.26−1.85
grasslandsbackground21.6622.2921.21−0.63−1.08
core36.0536.3331.93−0.28−4.39
islet32.7033.0532.83−0.35−0.21
loop24.3924.0821.260.31−2.83
bridge35.5436.7733.38−1.23−3.38
perforation28.8329.5326.95−0.70−2.58
edge54.7855.2951.35−0.51−3.95
branch47.7348.8646.08−1.13−2.78
core-opening40.2239.8237.100.40−2.72
barrenbackground45.0845.6441.64−0.56−4.00
core2.953.072.56−0.12−0.51
islet47.2447.9346.60−0.70−1.33
loop5.335.374.77−0.04−0.60
bridge14.7815.2313.51−0.45−1.72
perforation17.3117.6816.49−0.37−1.18
edge16.8417.4216.11−0.57−1.31
Disclaimer/Publisher’s Note: The statements, opinions and data contained in all publications are solely those of the individual author(s) and contributor(s) and not of MDPI and/or the editor(s). MDPI and/or the editor(s) disclaim responsibility for any injury to people or property resulting from any ideas, methods, instructions or products referred to in the content.