1. Introduction
Landslides are among the most frequent and damaging natural hazards in Japan, particularly in mountainous regions where steep terrain and intense seasonal rainfall often lead to widespread slope failures. The country’s steep mountainous terrain, covering approximately 70% of its land area, combined with frequent typhoons and extreme rainfall events, makes it especially vulnerable to rainfall-induced landslides. This vulnerability was exemplified by the July 2018 storm event on Omishima Island in western Japan, which recorded 446.5 mm of rainfall over 10 days and triggered over 500 shallow landslides, primarily in forested [
1]. Many residential areas are located along unstable slopes, further increasing both exposure and vulnerability. Rainfall-triggered landslides are especially common during the rainy season (June–July) and typhoon season (August–October), and recent studies suggest that climate change is intensifying the frequency and magnitude of extreme rainfall events [
2].
Recent high-impact events, including the 2018 Hiroshima landslides, which resulted in over 400 slope failures and more than 220 fatalities [
3], as well as the devastating debris flow in Atami City in 2021 [
4] and the widespread sediment disasters in Kumamoto Prefecture during the 2020 torrential rains [
5], have underscored the urgent need to improve landslide hazard assessment and preparedness. In response, Japan has made notable advances in landslide risk mitigation, including the deployment of real-time monitoring systems, the use of rainfall thresholds for early warning, and the promotion of community-based awareness programs [
6,
7]. However, the increasing unpredictability of weather patterns due to climate change calls for continuous refinement of hazard mapping techniques, early warning systems, and land-use planning tools.
Among various landslide triggers, prolonged and intense rainfall remains the most prevalent in Japan. It contributes to increased pore water pressure and reduced slope stability, particularly in weathered or densely vegetated terrains [
8]. While rainfall thresholds have been widely adopted for early warning systems [
9], a major challenge remains in producing spatially consistent and regionally scalable landslide susceptibility assessments, especially in complex terrain such as 0-order basins. These small, unchanneled hollows, also known as colluvial hollows or swales, serve as critical initiation zones for shallow landslides and debris flows. Located primarily in the upper catchments, they play an important role in sediment dynamics and hydrological connectivity [
10,
11,
12,
13]. Despite their significance, 0-order basins are notoriously difficult to detect and delineate due to their subtle morphological characteristics and dense vegetation cover, which limit the effectiveness of conventional visual interpretation and remote sensing techniques [
14].
Although several techniques have been proposed to identify critical slip surfaces within 0-order basins, many are computationally intensive, require high-resolution input data, or are unsuitable for large-scale applications. Several studies have explored alternative modeling approaches to improve landslide susceptibility assessments. For example, Shen [
15] proposed a hybrid model combining support vector regression with the grasshopper optimization algorithm for susceptibility mapping in Iran’s Kalaleh Basin. Pasang [
16] utilized Information Value (IV), Weight of Evidence (WOE), and Logistic Regression (LR) to assess landslide susceptibility along Bhutan’s Asian Highway. Mersha [
17] applied FR and WOE models in Ethiopia, highlighting the stronger predictive performance of FR. Similarly, Putriani [
18] developed a multi-criteria statistical approach using AHP, SAW, and FR in Indonesia. Reichenbach [
19], in a review of 565 studies, identified LR, WoE, and machine learning techniques as the most frequently used statistical models and emphasized the need for methodological standardization and uncertainty analysis.
Each of these methods presents specific strengths and limitations. FR is straightforward to apply and interpret but assumes variable independence, a condition often violated in complex terrains. WOE, which is based on Bayesian probability, also assumes conditional independence and can be less effective in landscapes where variables interact. LR, while capable of modeling interdependent variables, is constrained by its assumption of linearity in the logit function and its sensitivity to multicollinearity. Integrating these methods allows researchers to combine the spatial interpretability of FR and WOE with the multivariate strength of LR, thereby improving the reliability and precision of landslide susceptibility predictions.
Given the increasing impact of climate change and the growing need for efficient assessment strategies, there is a clear demand for scalable, data-driven, and statistically rigorous approaches to evaluate slope failure potential in high-risk micro-catchments. This study addresses that need by comparing and integrating bivariate and multivariate statistical models to assess and map landslide susceptibility specifically within 0-order basins and to identify areas most prone to slope failure.
Unlike most regional susceptibility studies that generalize across broader terrain units, this research develops a hybrid modeling framework tailored to the geomorphological features of 0-order basins. Specifically, it applies FR, WOE, and LR—each with different capacities for handling spatial data and interpreting the relationships among conditioning factors. Additionally, a custom threshold optimization algorithm is introduced to enhance the classification of susceptibility maps. Traditional classification schemes, such as natural breaks or equal intervals, often fail to delineate meaningful hazard boundaries. The proposed algorithm improves zoning accuracy, map interpretability, and supports more informed decision-making.
This study applies the integrated modeling framework to a 242.94 km2 area in Fukuoka Prefecture, encompassing parts of Asakura City, Ukiha City, and Toho Village—regions that experienced extensive landslides and debris flows during the extreme rainfall event of 5 and 6 July 2017. Matrix-based validation confirmed that all methods effectively identified high-susceptibility zones in the upper catchments. Among them, the integration of the FR + LR model demonstrated the best performance, achieving a success rate of 84.30%, a false alarm rate of 17.88%, and a missed alarm rate of 12.30%. The model’s robustness was further validated using a visually interpreted landslide inventory corresponding to the 6 July 2017 event. In this validation, the LR + FR model successfully detected 79.43% of documented landslide occurrences, with a false alarm rate of 25.56% and a miss rate of 10.34%.
Compared to single-method approaches, the hybrid model significantly improved classification accuracy, enabling more precise identification of unstable slopes. The resulting hazard zonation map provides critical support for disaster mitigation, land-use planning, and targeted risk reduction strategies within vulnerable 0-order basins. Furthermore, by facilitating efficient hazard mapping in rainfall-sensitive terrains, this study directly contributes to the United Nations Sustainable Development Goals (SDGs)—particularly SDG 11 (Sustainable Cities and Communities) and SDG 13 (Climate Action)—by promoting safer, more resilient communities in the face of increasing climate-related threats.
2. Data Collection and Preparation
The study area spans approximately 242.94 km
2 and is situated in the southeastern part of Fukuoka Prefecture, encompassing portions of Asakura City, Ukiha City, and Toho Village (
Figure 1). This region was severely impacted by widespread slope failures and debris flows triggered by intense rainfall on 5 and 6 July 2017 [
14].
The 1-m resolution Digital Elevation Model (DEM) data were obtained from Asia Air Survey Co., Ltd. Terrain-related conditioning factors, including slope, aspect, landform, curvature, Topographic Wetness Index (TWI), and Stream Power Index (SPI), were derived from the DEM and used in the susceptibility analysis. These factors were selected based on their well-documented influence on slope instability and their widespread use in landslide susceptibility mapping [
19,
20].
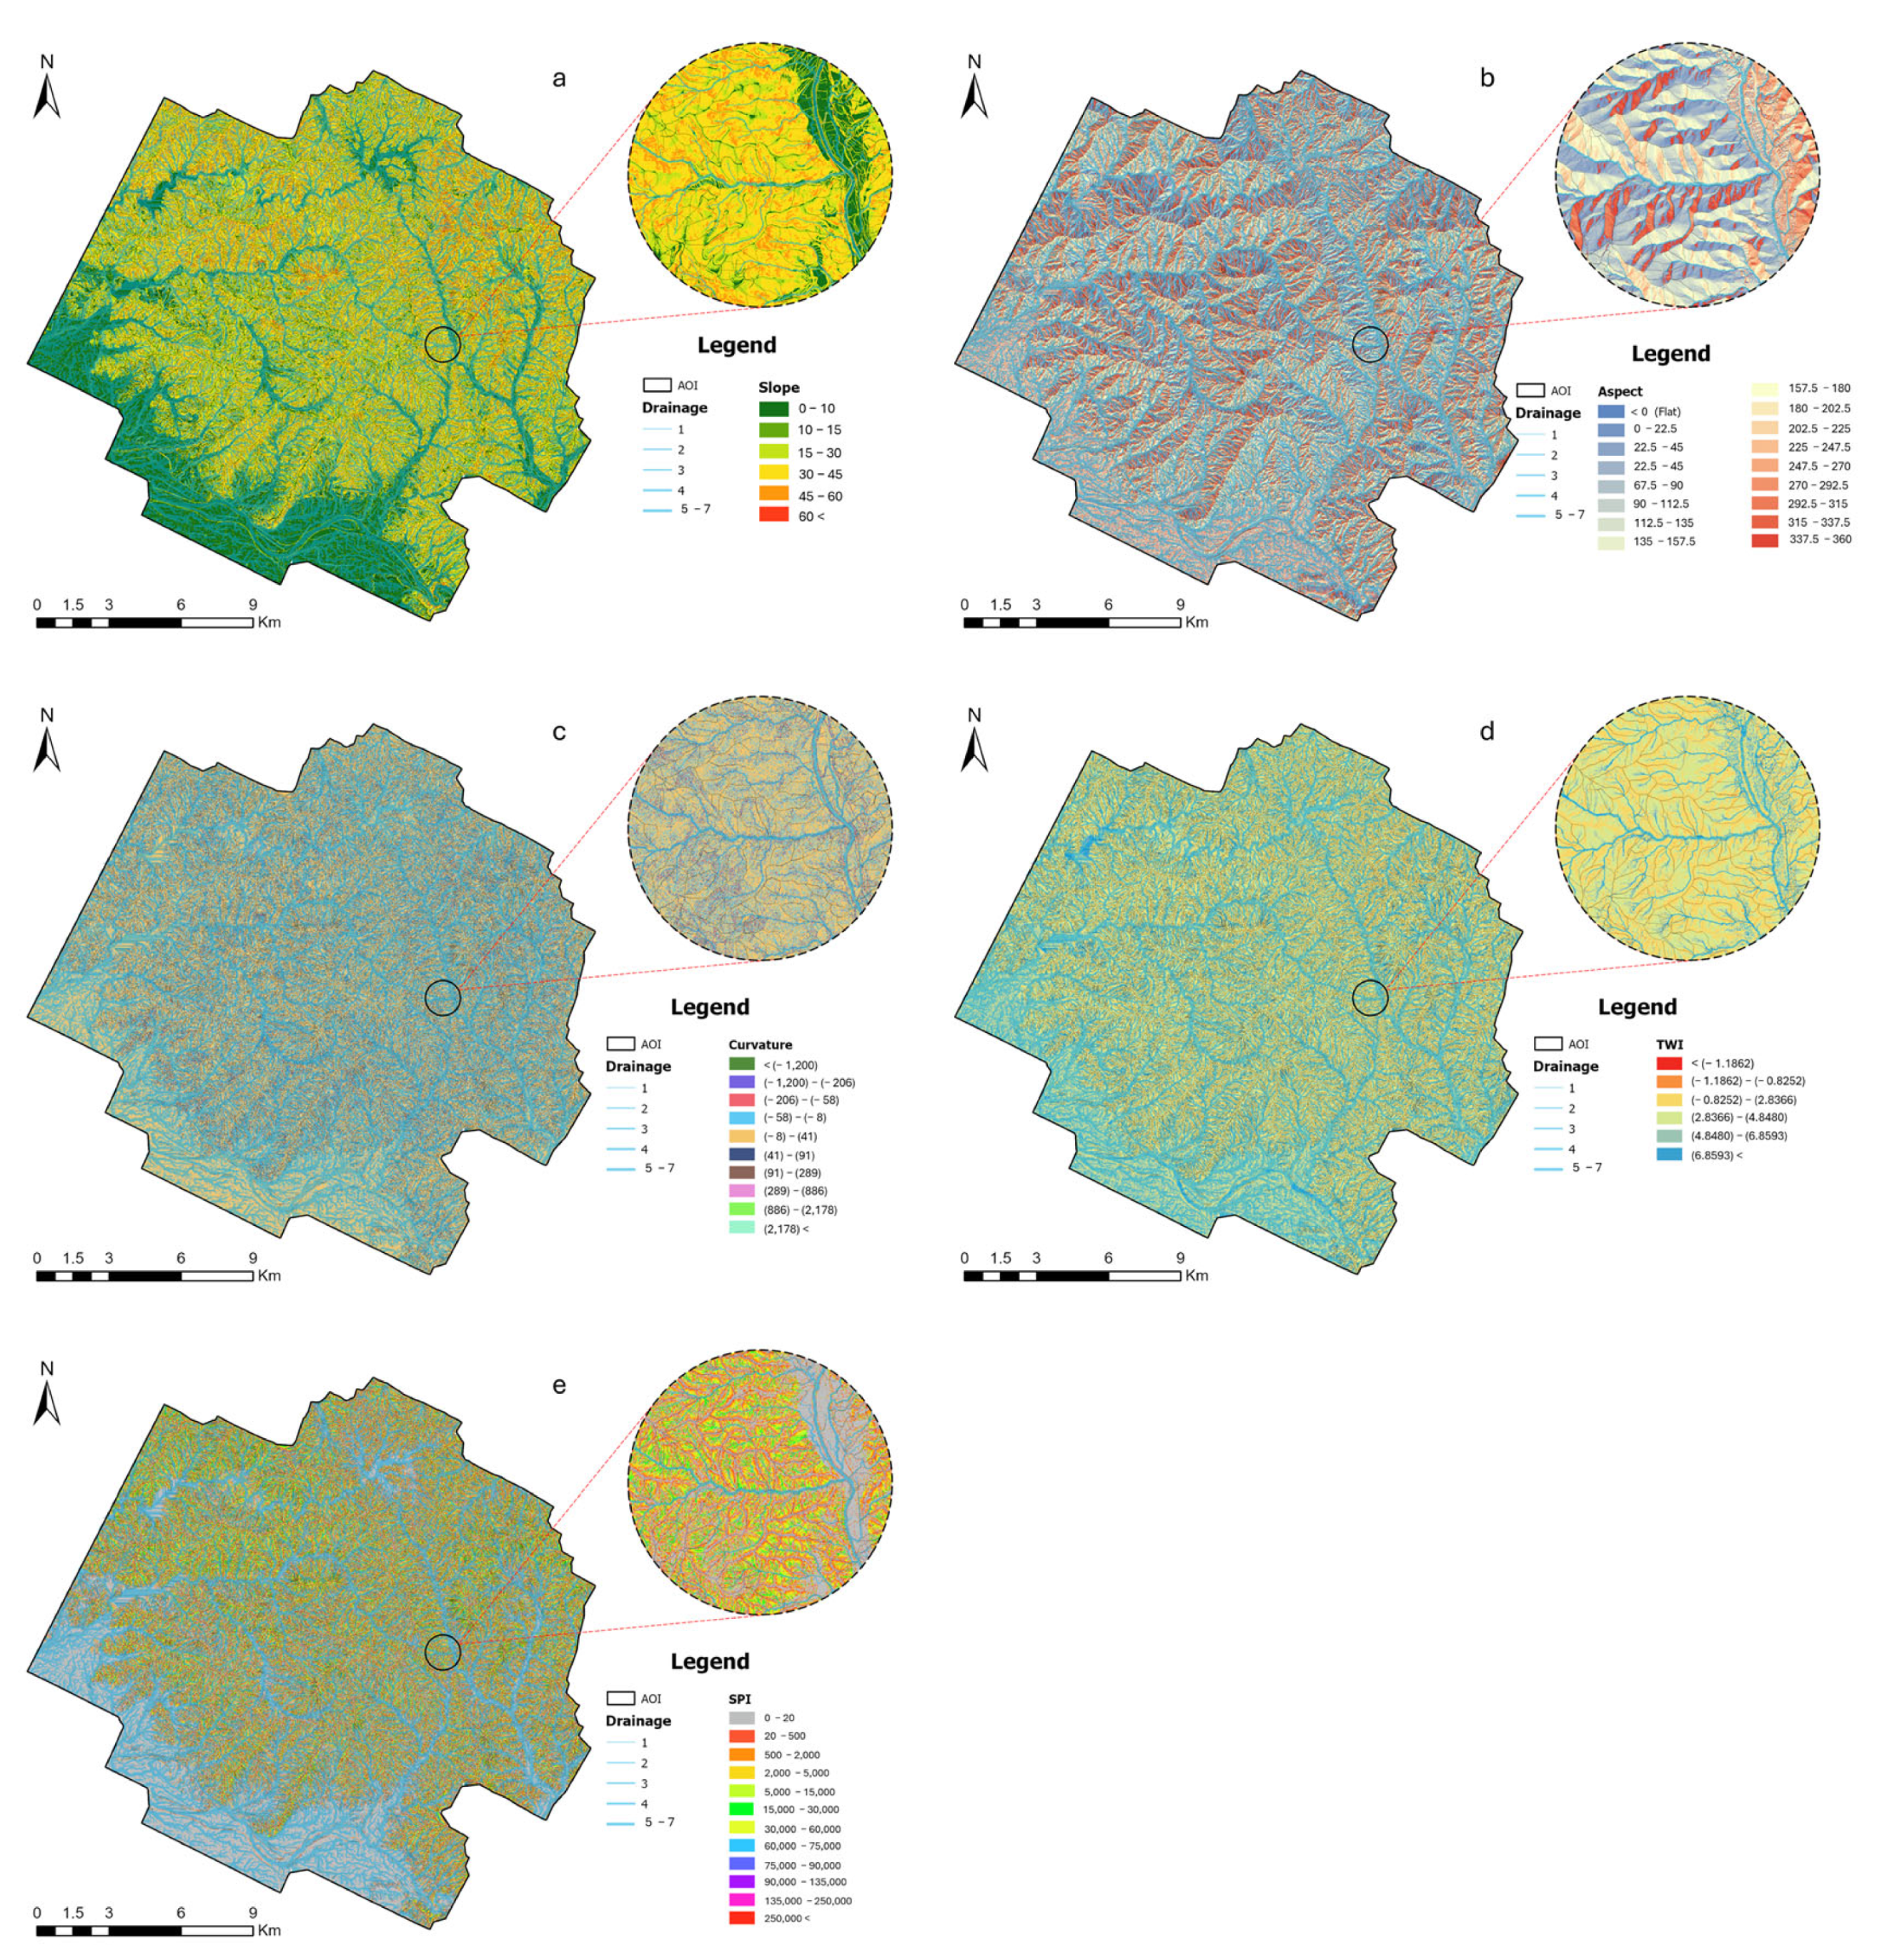
Slope reflects the steepness of the terrain and directly influences the gravitational forces acting on the soil mass; steeper slopes are generally more prone to failure [
21] (
Figure 2a). Aspect affects local microclimatic conditions such as solar radiation and moisture retention, which in turn influence vegetation cover and soil strength [
22] (
Figure 2b). Curvature, which quantifies the rate of change in slope, plays a critical role in surface water flow. Concave (negative) curvature zones tend to accumulate water, increasing pore pressure and susceptibility to failure, while convex (positive) curvature zones are associated with flow divergence and erosion [
23] (
Figure 2c).
The TWI represents the spatial distribution of soil moisture by integrating slope and the upslope contributing area and is commonly used to assess hydrological control on slope instability (
Figure 2d). It is calculated using the following equation:
where
upslope contributing area per unit contour length (usually in m
2/m),
is the slope angle in radians.
Higher TWI values indicate areas of increased soil saturation, which are often associated with reduced shear strength and a higher likelihood of slope failure [
24].
The SPI quantifies the erosive power of surface runoff by incorporating both slope and drainage area (
Figure 2e). It is calculated using the following equation:
where
upslope contributing area per unit contour length (usually in m
2/m),
is the slope angle in radians.
Low SPI values indicate limited erosive power, while high SPI values correspond to areas with greater runoff energy, making them more susceptible to erosion and mass movement processes [
23].
Moreover, additional data layers, including the drainage network, channel head points, 1st-order drainage catchments, approximate 0-order basins, and a landform classification raster, were incorporated from our previous study [
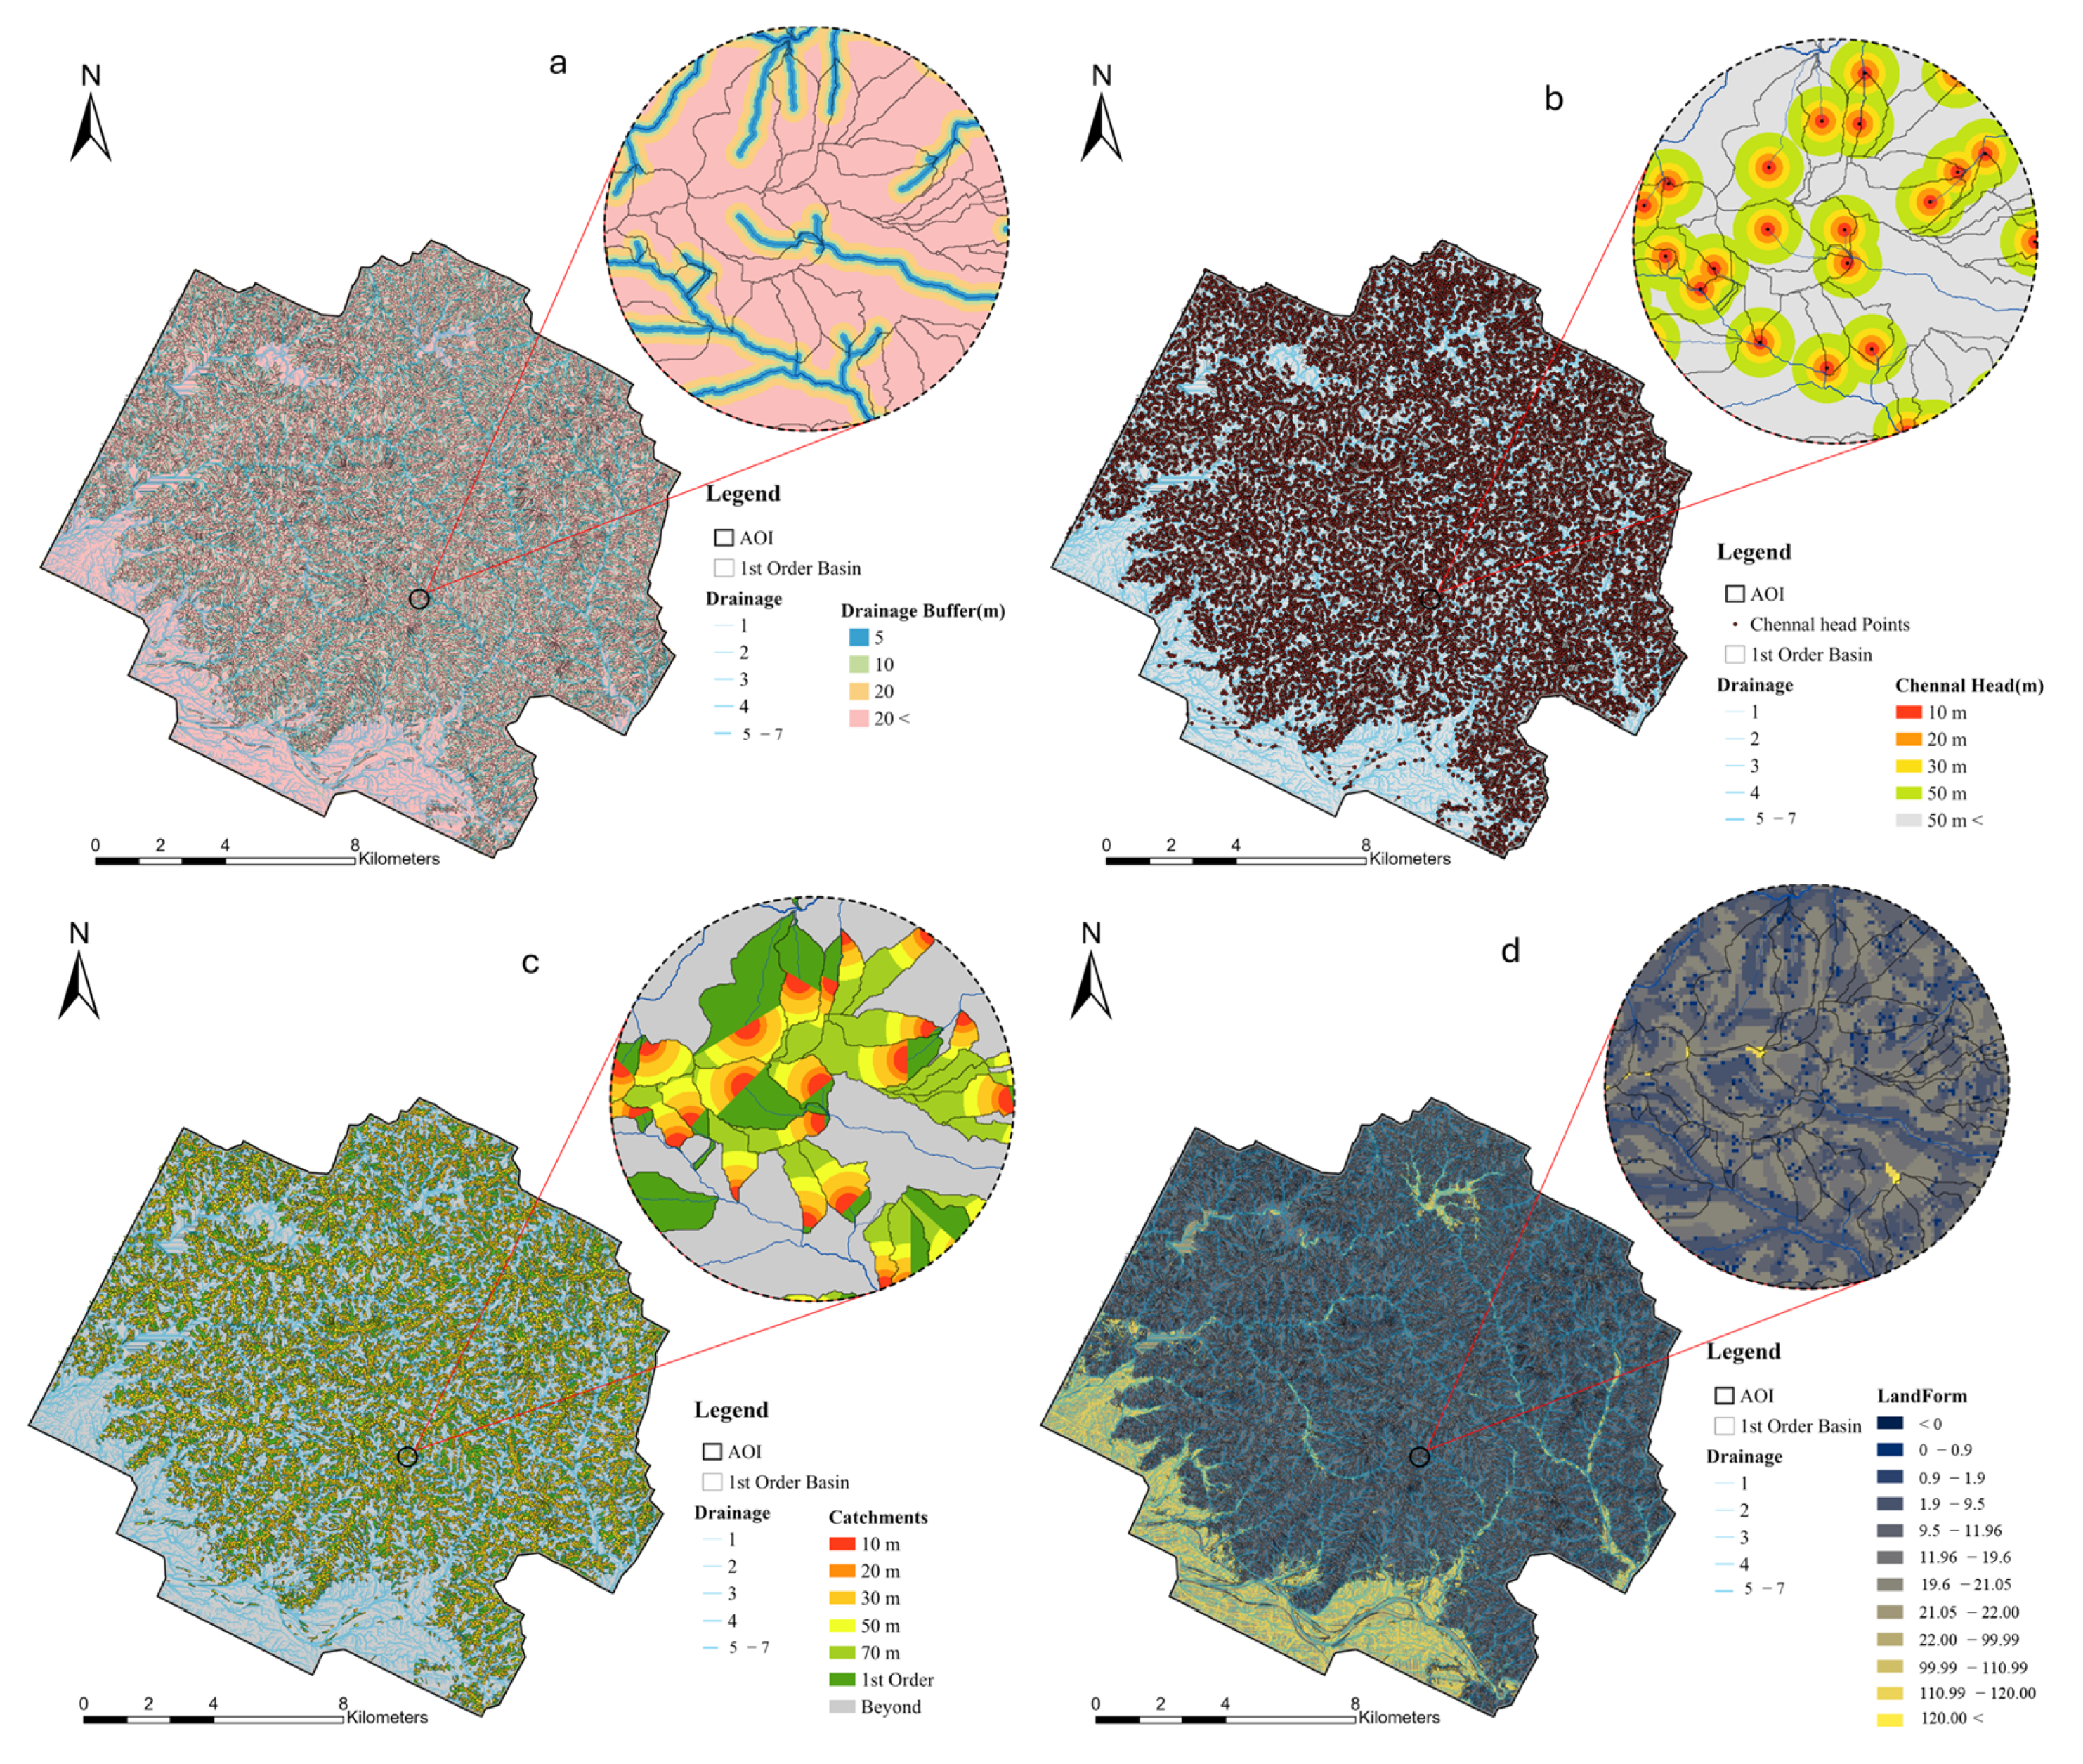
14]. These layers were selected for their geomorphological relevance and their role in influencing slope failure initiation in mountainous terrain. The drainage network represents the spatial configuration of surface water flow paths and is essential for identifying hydrologically active areas (
Figure 3a). Proximity to streams often corresponds with increased soil saturation and erosive forces, both of which contribute to slope instability [
25]. Channel head points denote the upstream origin of perennial or ephemeral streams and typically represent zones of hydrological convergence (
Figure 3b). These locations, which mark the transition from unchanneled hillslopes to defined fluvial channels, are frequently associated with debris flow initiation due to concentrated subsurface and surface flow [
26].
First-order drainage catchments represent the smallest units within a stream network and are typically situated in headwater regions (
Figure 3c). These catchments often consist of small, steep, and hydrologically active sub-basins (0 basin) that play a critical role in sediment transport and slope failure processes [
27]. Approximate 0-order basins are located within 1st-order drainage catchments and are characterized as small, unchanneled hollows situated upslope of defined channels (
Figure 3c). These areas are widely recognized as key source areas for shallow landslides and debris flows due to their tendency to accumulate colluvial material and subsurface water [
13].
The landform raster captures key geomorphological features such as ridges, slopes, valleys, and hollows, providing a spatial representation of terrain types associated with varying erosion and deposition dynamics (
Figure 3d). In general, lower landform values correspond to elevated features such as ridges or peaks, whereas higher values typically represent depressions or valley bottoms [
28].
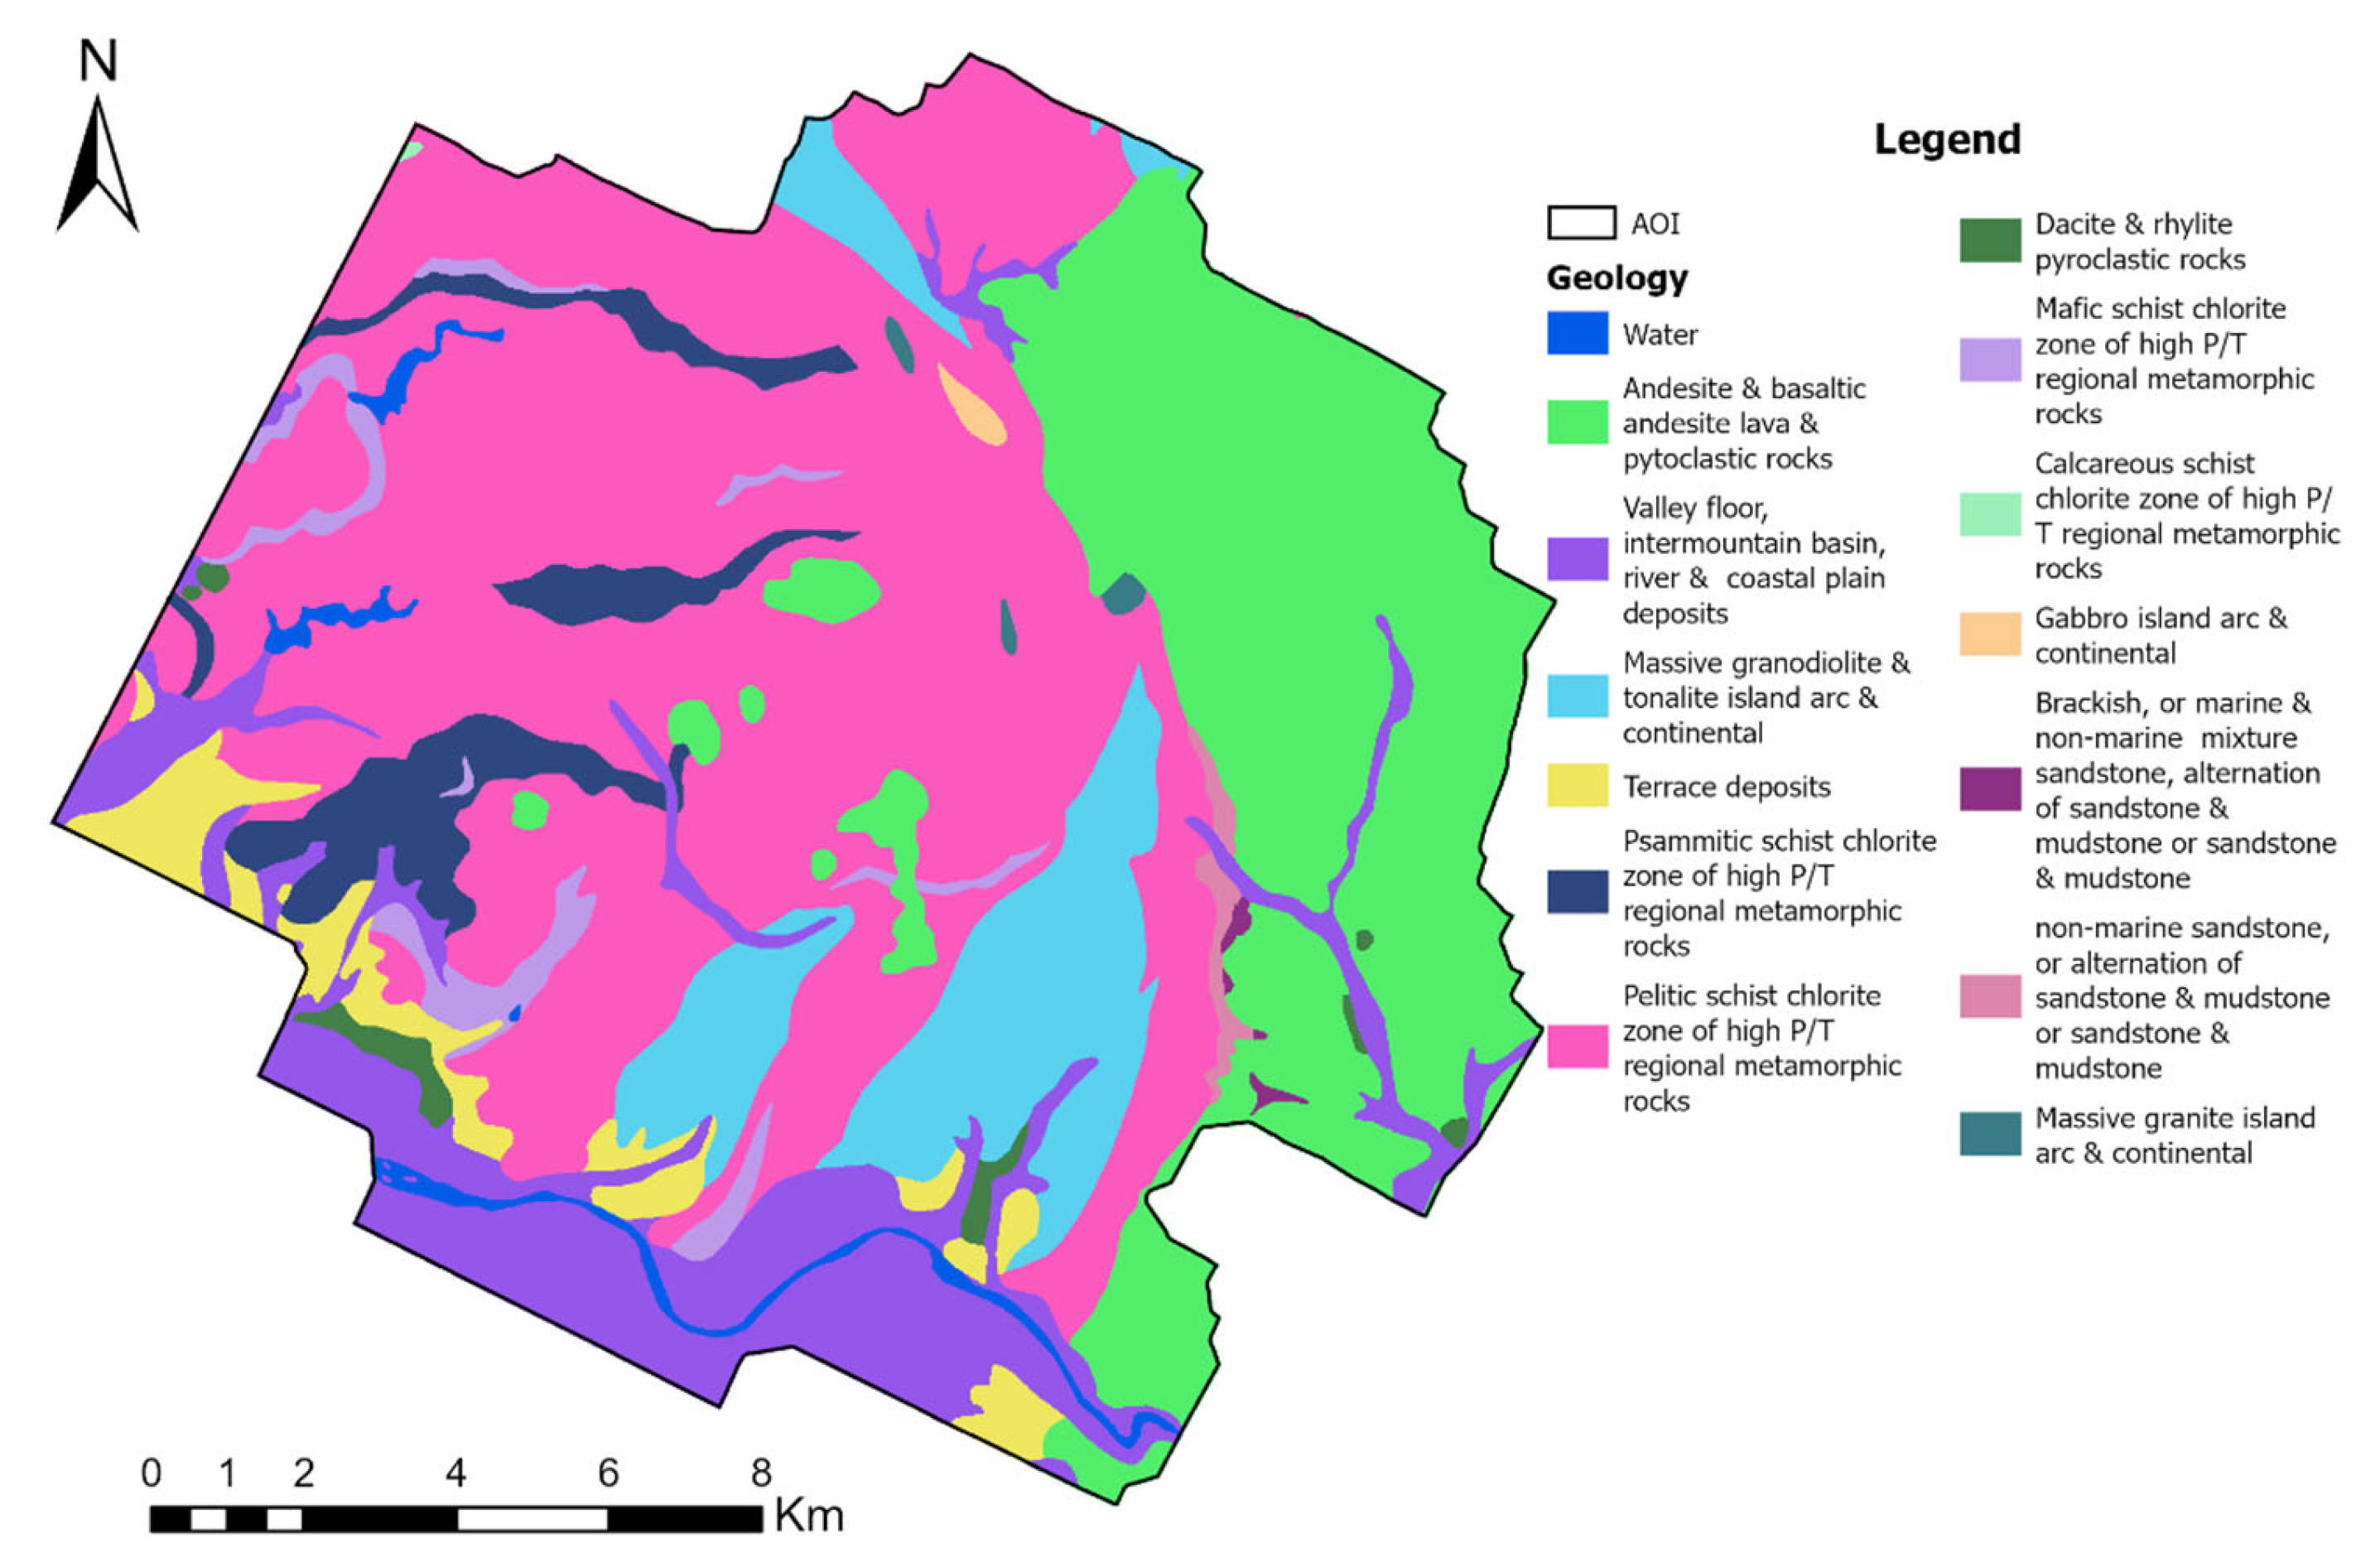
The geological setting and physical characteristics of surface sediments play a critical role in determining the spatial distribution and likelihood of slope failures. To evaluate the potential for sediment mobilization, a lithological map at a 1:200,000 scale—published by the Geological Survey of Japan—was utilized in this study (
Figure 4). This map illustrates the major sediment types present in the study area, each of which carries distinct implications for landslide susceptibility.
Weakly consolidated units, such as terrace deposits and valley floor sediments, are particularly prone to erosion and shallow slope failure due to their low shear strength and high permeability. Similarly, pyroclastic rocks (e.g., dacite and rhyolite) and altered volcanic deposits (e.g., andesite, basaltic lava, and tuff) tend to weather rapidly, forming loose colluvium that is highly susceptible to mobilization under intense rainfall. Comparable mineral transformation and geochemical weakening processes have been observed in pegmatite-bearing terrains, where late-stage hydrothermal activity promotes structural disintegration and enhanced weathering [
29,
30,
31]. In contrast, massive igneous rocks such as granodiorite, tonalite, and granite are generally more resistant to weathering but may still fail along pre-existing joints or fractures, particularly in steep terrain.
Metamorphic units—including psammitic and pelitic schists—exhibit significant variability in strength depending on the orientation of foliation and moisture content. These rocks are often prone to planar failure under saturated conditions. Calcareous and chloritic schists also present structural weaknesses, especially in areas where mechanical weathering has produced regolith or loosened surface material.
Incorporating lithological information into the susceptibility model improves accuracy by accounting for the mechanical properties and weathering behavior of each geological unit. These factors directly influence both the initiation and mobility of landslides in shallow and deep-seated failure scenarios. The integration of mineralogical and geochemical insights, such as those provided by [
29,
30,
31], underscores the importance of rock composition and alteration in understanding slope instability.
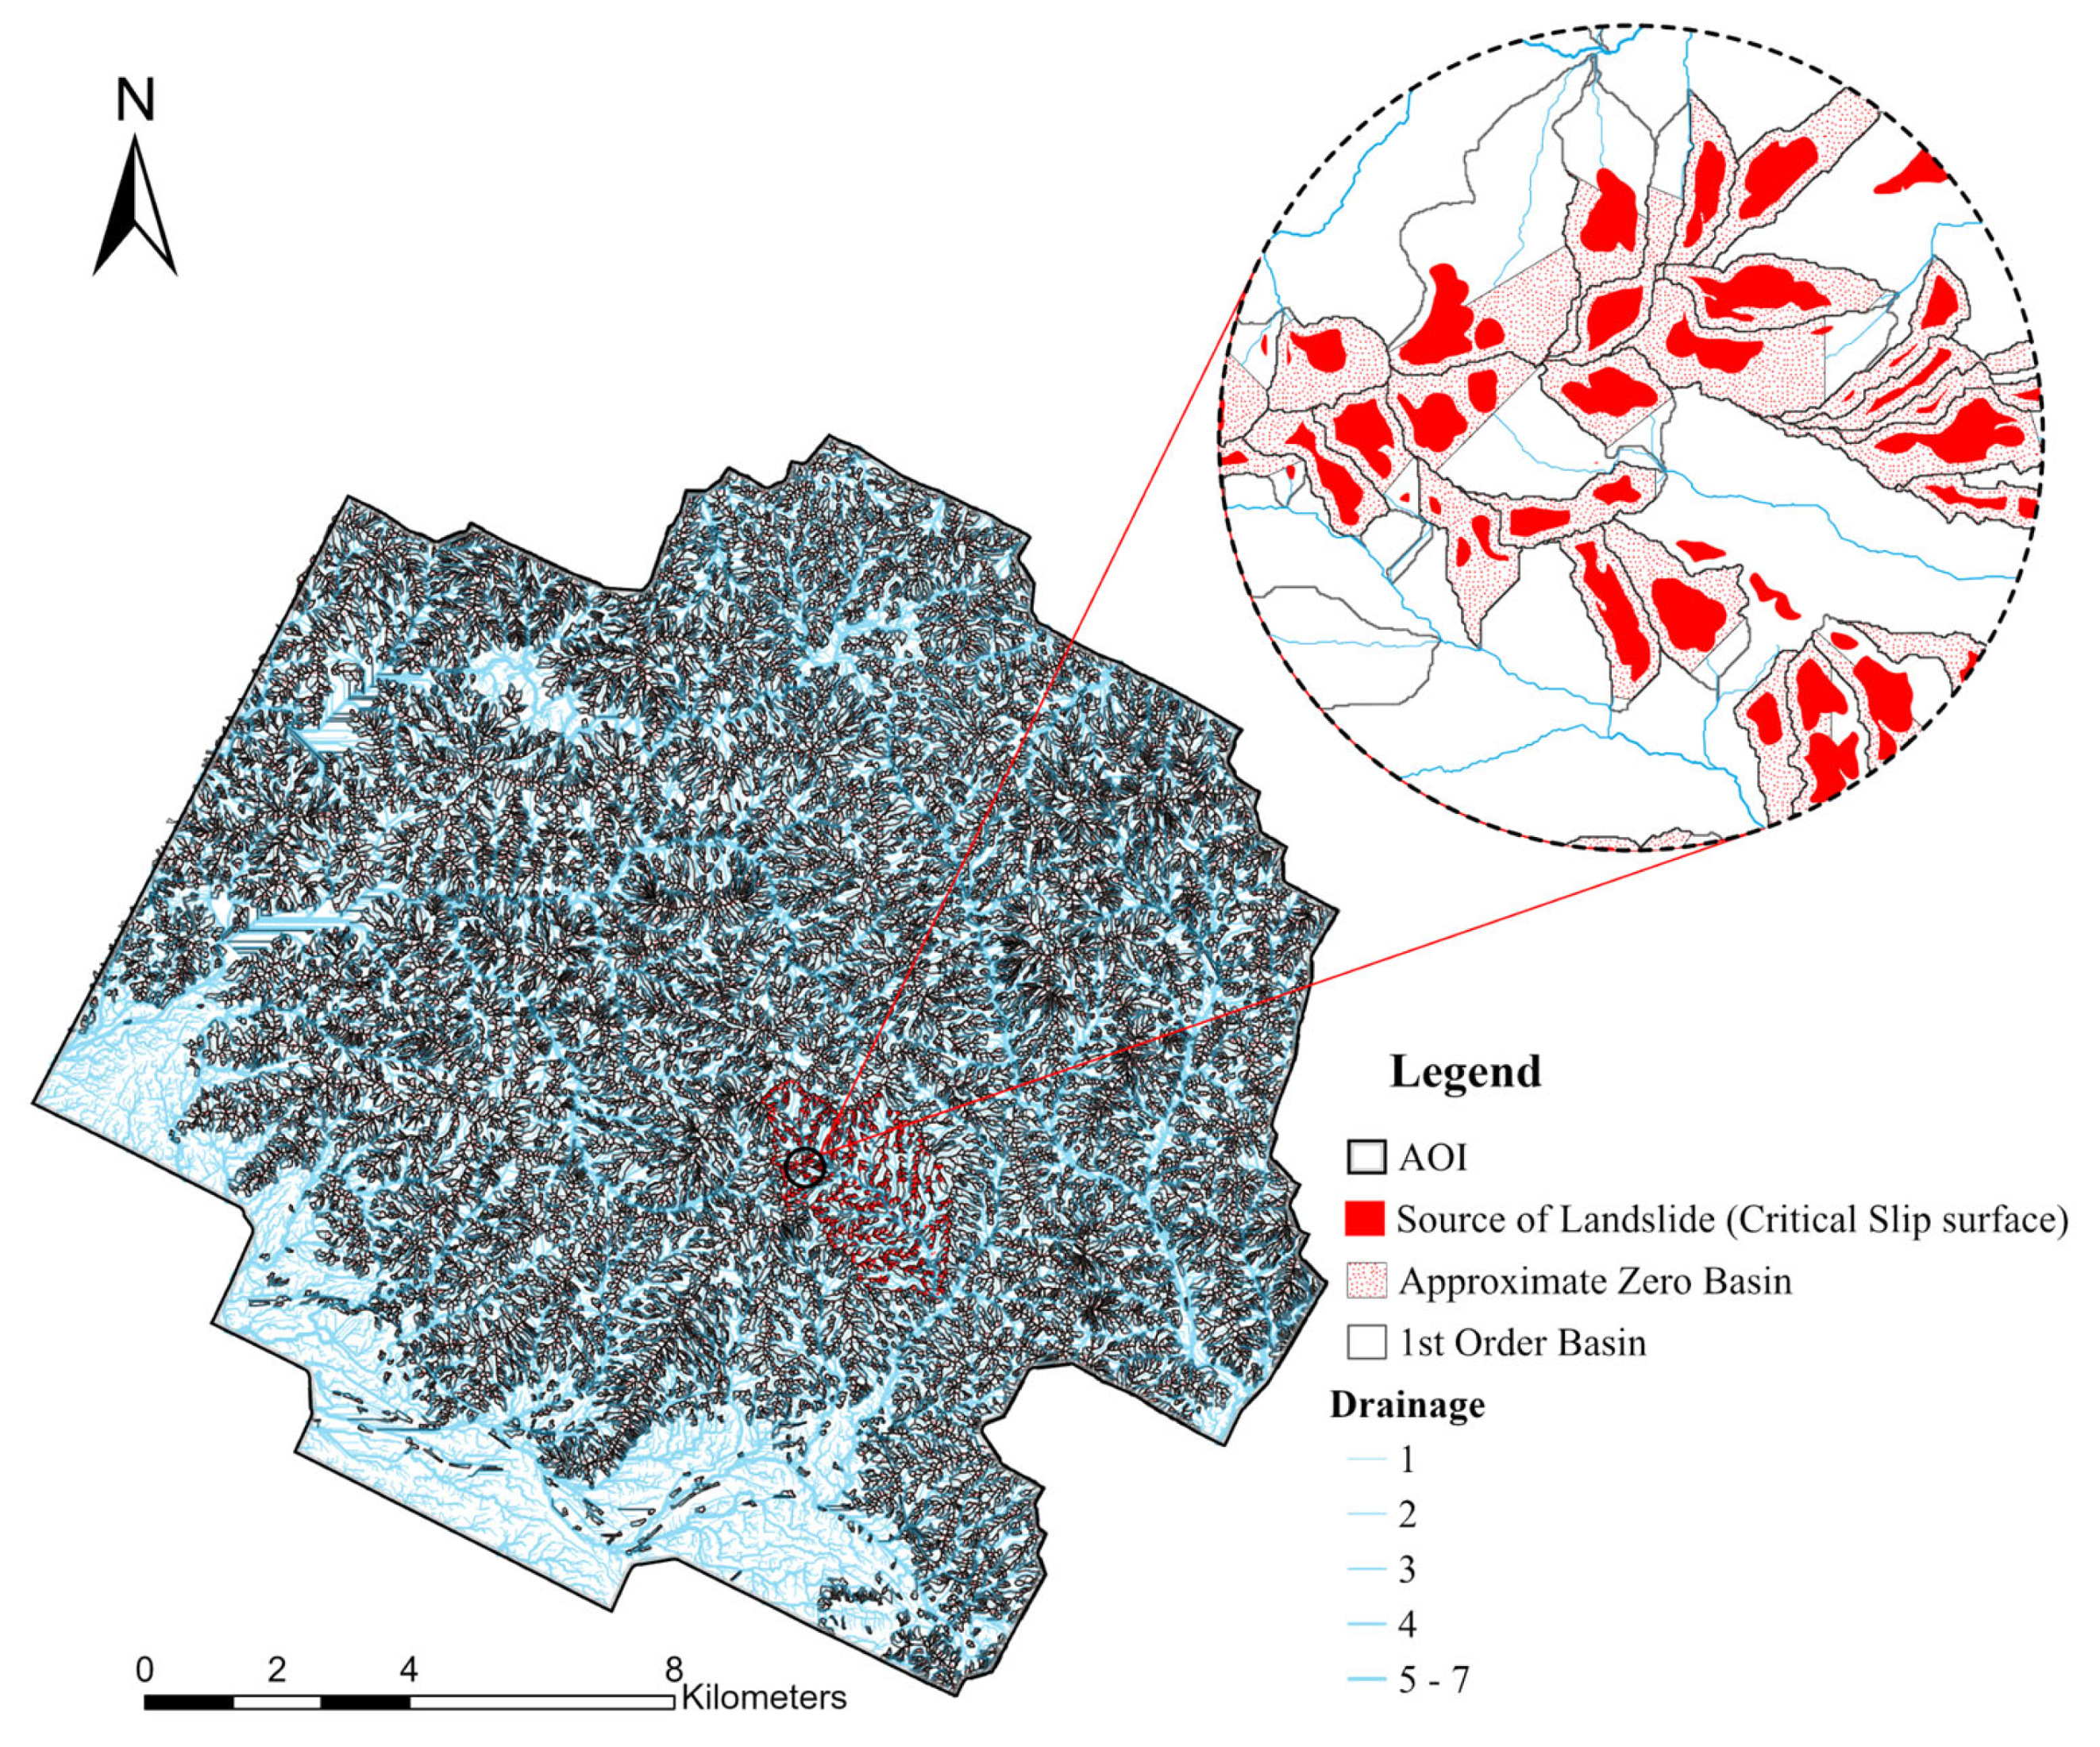
Statistical methodologies are based on the premise that the spatial distribution of past events can serve as a proxy for predicting future occurrences. In this study, debris flow source areas in the approximate 0-order basin previously identified in the Otoishi River catchment (
Figure 5) were used as historical reference data or training samples [
14,
32]. Building upon these prior findings, the analysis was expanded to a broader region to evaluate slope failure susceptibility in the upper catchment. The objective was to identify potentially hazardous areas that exhibit similar geomorphological and environmental characteristics, thereby enabling targeted risk mitigation and early warning efforts.
3. Methodologies
To assess the susceptibility of mass movement in the upper catchment area, several statistical models were employed and compared. These methods include both traditional and hybrid approaches to ensure a comprehensive analysis of spatial and causal relationships between landslides and their conditioning factors. The selected models—Frequency Ratio (FR), Weight of Evidence (WOE), and Logistic Regression (LR)—were also integrated in hybrid forms to enhance their predictive performance and interpretability. Each methodology offers distinct advantages in terms of data handling, model transparency, and predictive accuracy. The following subsections detail the theoretical background, implementation procedures, and evaluation criteria for each method used in this study.
3.1. Frequency Ratio (FR)
The FR method is a widely used bivariate statistical technique for hazard assessment, particularly in the context of landslides, debris flows, and floods. It operates on the assumption that future events are likely to occur under environmental conditions similar to those in which past events have taken place [
33,
34]. The method evaluates the spatial correlation between historical events and conditioning factors. By comparing the distribution of past event occurrences with the distribution of each class of a conditioning factor, the FR method quantifies the relative likelihood of hazard occurrence within each class [
35].
According to Sheng [
34], the frequency ratio for a given class is computed as the ratio of the percentage of hazard occurrences within that class to the percentage of the area that the class occupies within the entire study area. This relationship is mathematically expressed as Equation (3), as follows:
(
LPC) refers to the number of landslide cells within a specific class. (
TPC) represents the total number of cells in that class. (
TLP) denotes the total number of landslide cells in the entire study area, while (
TP) indicates the total number of cells in the study area.
An FR value greater than 1 indicates that the class has a higher than average probability of landslide occurrence, suggesting a positive correlation between that class and landslide events. Conversely, an FR value less than 1 implies a lower likelihood of landslide occurrence in that class [
36,
37].
While the FR method is relatively simple and interpretable, it assumes statistical independence among conditioning factors and does not consider interactions between them [
34].
Once the FR weight is calculated for each class of the conditioning factors, the results are integrated into a GIS platform to visualize the spatial susceptibility of each factor to landslides. Each class is assigned a corresponding FR weight. To generate the final landslide susceptibility map, the
values of all relevant factor classes are summarised, as shown in the following Equation (4):
The represents the Landslide Susceptibility Index, and denotes the frequency ratio weight for the i-th class of each conditioning factor.
3.2. Weight of Evidence (WOE)
The WOE method is a widely used statistical approach in landslide susceptibility mapping, grounded in Bayesian probability theory. It evaluates the spatial relationship between historical landslide occurrences and conditioning. Assuming conditional independence among variables, WOE quantifies the contribution of each factor class to landslide susceptibility [
38].
In this framework, each class of a conditioning factor is assigned a weight based on the presence or absence of landslides. Positive weights indicate a higher likelihood of landslide occurrence, negative weights reflect lower susceptibility, and a weight of zero denotes no significant association. The positive weight (
) and negative weight (
) for a given class are computed as Equations (5) and (6), as follows:
LPC refers to the number of landslide cells within a specific class of a conditioning factor, while
TPC represents the total number of cells (both landslide and non-landslide) in that class.
TLP denotes the total number of landslide cells across the entire study area, and
TP indicates the total number of cells in the study area.
The Weight Contrast (
), indicating the strength and direction of the relationship between the factor class and landslide occurrence, is determined by Equation (7), as follows:
A positive
suggests a strong association between the factor class and landslide occurrence, whereas a negative
indicates a weaker or inverse relationship where zero is neutral. The Landslide Susceptibility Index (LSI) for each spatial unit is computed by summing the weight contrasts of all relevant factors using Equation (8), as follows:
where
is the Landslide Susceptibility Index,
is the Weight contrast of
i-th factor class, and
is the total number of conditioning factor classes. This index facilitates the classification of the study area into different susceptibility zones, aiding in hazard assessment and risk management.
3.3. Logistic Regression (LR)
The LR method is a multivariate statistical method, and it is based on the principles of generalized linear models. LR estimates the probability of landslide occurrence by modeling the relationship between a binary dependent variable (i.e., presence or absence of landslides) and multiple independent variables such as slope angle, aspect, lithology, and land use [
39].
Unlike bivariate methods such as FR and WOE, LR does not assign weights to individual classes of conditioning factors. Instead, it determines how variations in the independent variables influence the likelihood of landslide occurrence through regression coefficients, which are derived using maximum likelihood estimation. These coefficients reflect both the strength and direction of each variable’s effect. The probability of landslide occurrence is then computed using the logistic function, which transforms the linear combination of predictors into a value between 0 and 1, representing the likelihood of a landslide at a given location. The Logistic Regression model estimates the probability of landslide occurrence using the following Equation (9):
where
is the probability of the dependent variable, with
being 1 (i.e., landslide occurrence),
represents the odds ratio or likelihood ratio,
is the intercept,
are the regression coefficients, and
are the independent variables (conditioning factors) that contribute to the variations in
.
Each coefficient quantifies the strength and direction of the influence of the corresponding factor on landslide susceptibility. A positive coefficient indicates a direct relationship, meaning that an increase in the value of the factor increases the probability of landslide occurrence. Conversely, a negative coefficient suggests an inverse relationship, where higher values of the factor reduce landslide likelihood.
3.4. Combination of Frequency Ratio and Logistic Regression
The integration of FR and LR provides a robust hybrid approach for landslide susceptibility mapping. FR is a bivariate statistical method that evaluates the relationship between landslide occurrences and individual classes of conditioning factors, while LR is a multivariate technique that models the probability of landslide occurrence based on multiple variables simultaneously. By combining these methods, the model benefits from the interpretability and class-level insight provided by FR, along with the predictive power and multivariate analysis capability of LR.
In this integrated approach, FR values are first computed for each class of the conditioning factors using Equation (3) and subsequently used as input variables in the LR model. This transformation not only standardizes the input data but also enhances the statistical significance of each factor, enabling the logistic model to more effectively capture complex, non-linear relationships. The FR–LR integration has been shown to improve both model performance and interpretability, particularly in regions characterized by complex terrain and interacting environmental variables [
40,
41]. The Logistic Regression model, after transformation with FR values, is mathematically expressed as Equation (10), as follows:
where
is the probability of the dependent variable
being 1 (i.e., landslide occurrence),
represents the odds ratio or likelihood ratio,
is the intercept,
are the regression coefficients, and
are the independent variables (conditioning factors) that contribute to the variations in
.
The FR–LR model offers a robust and interpretable framework for landslide susceptibility mapping, particularly in regions characterized by diverse topography and complex geological conditions.
3.5. Combination of Weight of Evidence and Logistic Regression
The integration of WOE and Logistic LR combines the spatial interpretability of a bivariate statistical model with the multivariate predictive strength of Logistic Regression, offering a robust approach to landslide susceptibility mapping. WOE, a probabilistic technique based on Bayesian statistics, evaluates the relationship between landslide presence and specific classes of conditioning factors by calculating positive or negative weights that represent the log-odds of landslide occurrence [
42]. LR estimates the probability of a binary outcome (e.g., landslide presence or absence) based on multiple predictor variables, producing coefficients that quantify each factor’s influence [
43].
In the WOE–LR approach, WOE values are first computed for each class of the conditioning factors and assigned to the corresponding spatial units using Equations (5)–(7). These values are then used as transformed input variables in the Logistic Regression model, replacing raw or categorical data. This step standardizes the inputs and enhances the model’s capacity to analyze interactions among factors, while preserving the statistical relevance of each variable. The Logistic Regression model is then expressed as Equation (11), as follows:
where
is the probability of the dependent variable, with
being 1 (i.e., landslide occurrence),
represents the odds ratio or likelihood ratio,
is the intercept,
are the regression coefficients, and
are the independent variables (conditioning factors) that contribute to the variations in
.
This hybrid method offers several advantages. WOE provides statistically meaningful, spatially derived inputs that are well-suited to both categorical and continuous data. LR then evaluates the combined influence of all variables in a multivariate context. Studies have demonstrated that the WOE–LR model improves prediction accuracy compared to either method used independently [
43,
44]. However, the approach assumes conditional independence in the WOE calculation and requires careful handling of multicollinearity and overfitting during the Logistic Regression phase.
3.6. Validation Method
The matrix validation method is employed to assess the accuracy of the analysis. It uses a set of control points, equally sampled from both landslide and non-landslide (stable) areas, to construct a contingency table from which three key performance metrics are derived: success rate, false alarm rate, and miss alarm rate.
Based on the contingency
Table 1, three performance indices can be evaluated to assess model efficiency: (1) success rate (Equation (12)), (2) miss alarm rate (Equation (13)), and (3) false alarm rate (Equation (14)).
The success rate represents the proportion of control points that are correctly classified by the model. The miss alarm rate indicates the percentage of actual landslide locations incorrectly predicted as non-landslide, which is particularly critical in hazard mapping, as it reflects the model’s failure to detect real events. A higher miss alarm rate implies greater risk to public safety and reduced effectiveness in hazard prevention. In contrast, the false alarm rate refers to the proportion of stable areas mistakenly classified as landslides, leading to misleading hazard information and potentially inefficient allocation of mitigation resources.
However, these three values alone are insufficient for fully evaluating the quality of a landslide susceptibility map. The classification threshold, which defines the boundary between hazardous and non-hazardous zones, plays a pivotal role in shaping model performance. Commonly used classification schemes, such as natural breaks or equal interval thresholds, often fail to achieve optimal accuracy and may introduce systematic errors that reduce the map’s reliability.
The performance of the model, as reflected in the success, false alarm, and miss alarm rates, is highly sensitive to the chosen threshold value. Even small adjustments in threshold selection can lead to significantly different classification results. Moreover, natural break classifications do not adequately address the specific requirements of hazard management, particularly in differentiating risk levels with precision.
To overcome these limitations and enhance classification accuracy, this study developed an improved validation tool. The tool not only computes the success, false alarm, and miss alarm rates but also identifies the optimal threshold value based on the specific objectives of the study. This allows for a more informed and context-sensitive classification of hazard zones, thereby increasing the practical applicability and reliability of the resulting landslide susceptibility map for decision-making in disaster risk reduction.
4. Results and Validation
The methodologies described were applied to the study area as detailed below.
4.1. Bivariate Methodologies
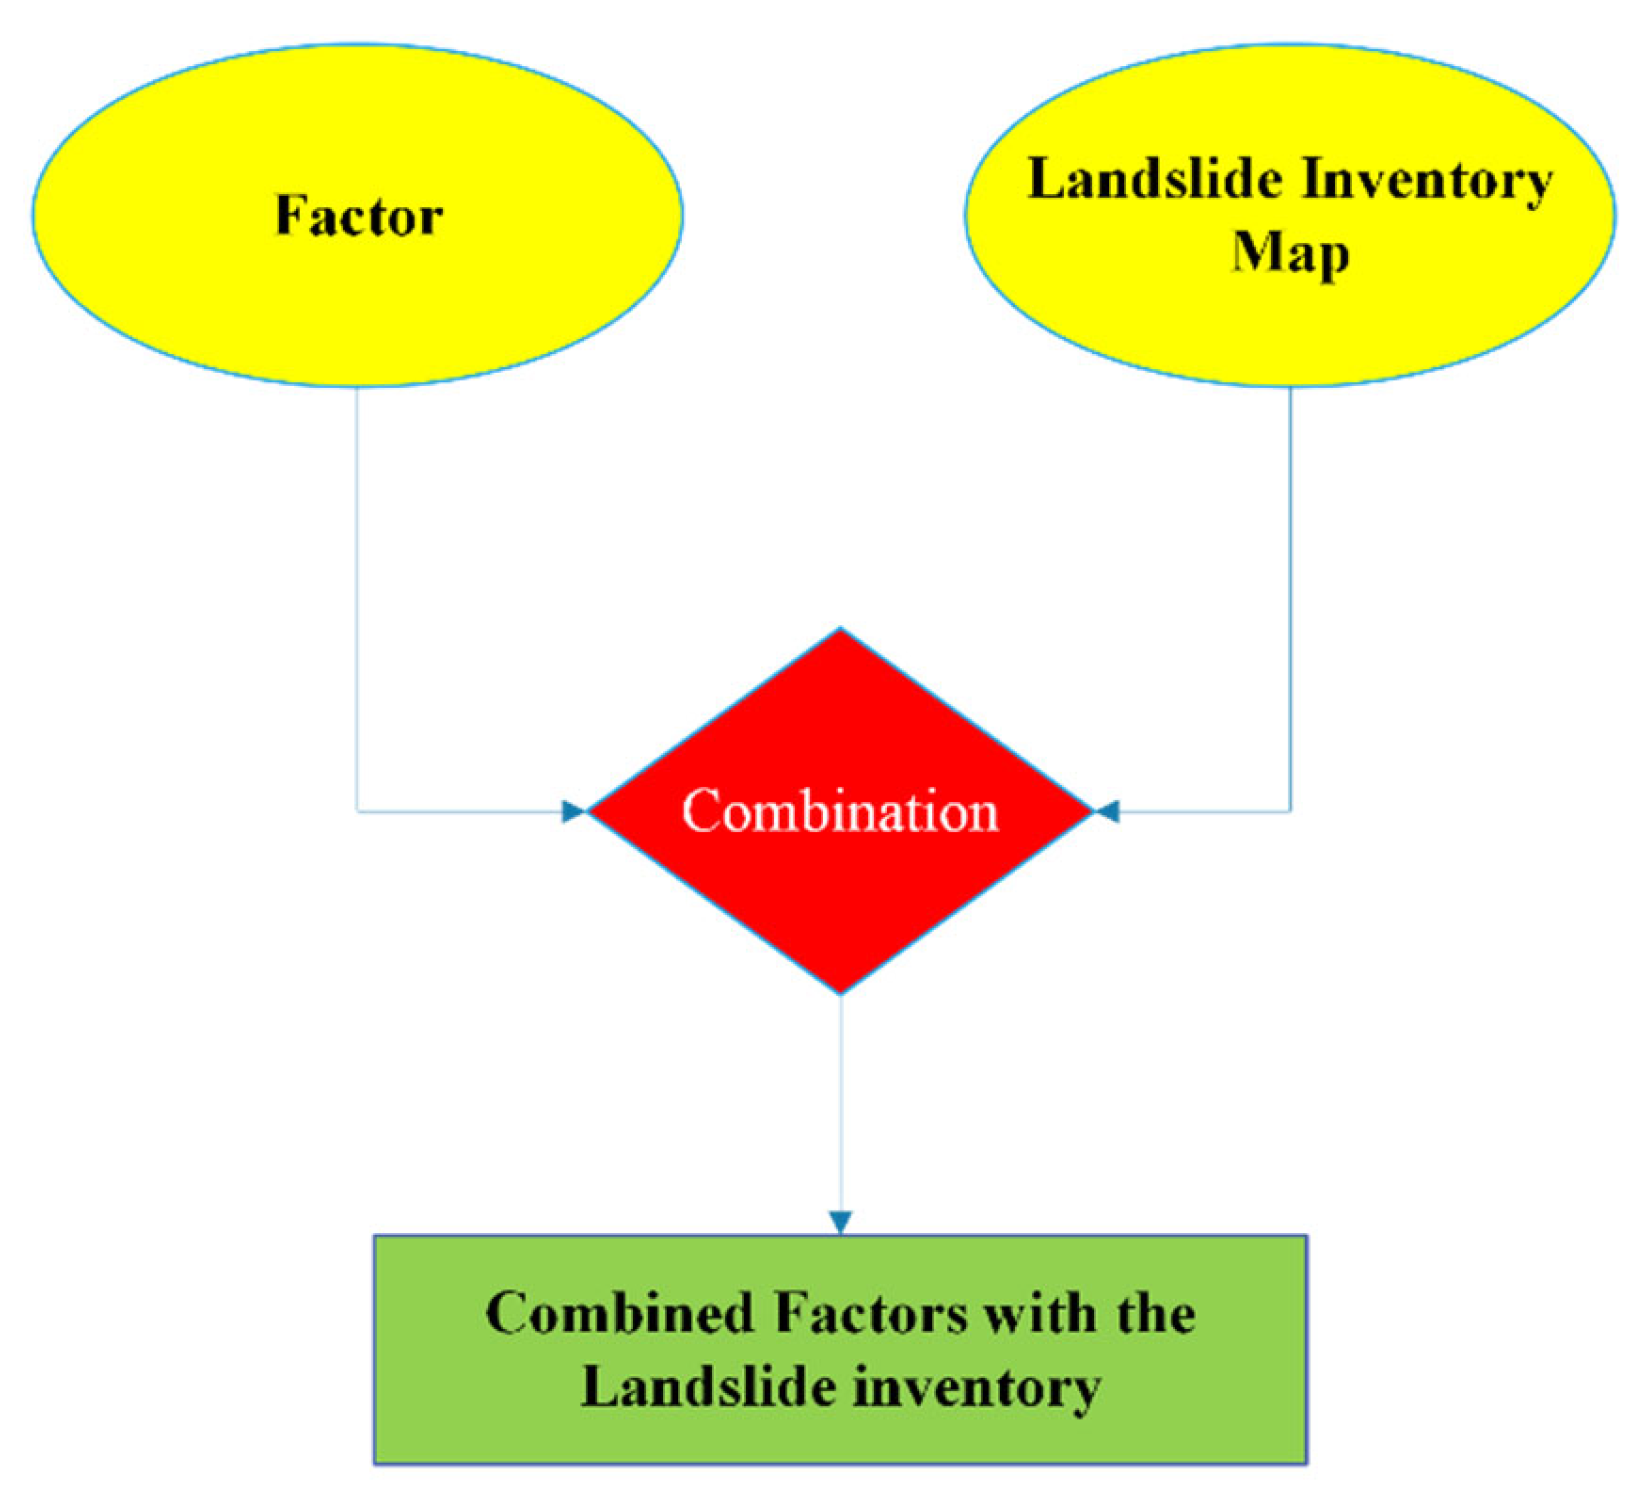
As previously explained, the bivariate methods—FR and WOE—analyze each conditioning factor independently in the context of landslide susceptibility. Before conducting the analysis, it is essential to spatially overlay the landslide inventory with each thematic factor layer to calculate the frequency of landslide occurrences within each class. To streamline and automate this process, a custom preprocessing algorithm was developed (
Figure 6) to prepare the input data required for bivariate analysis.
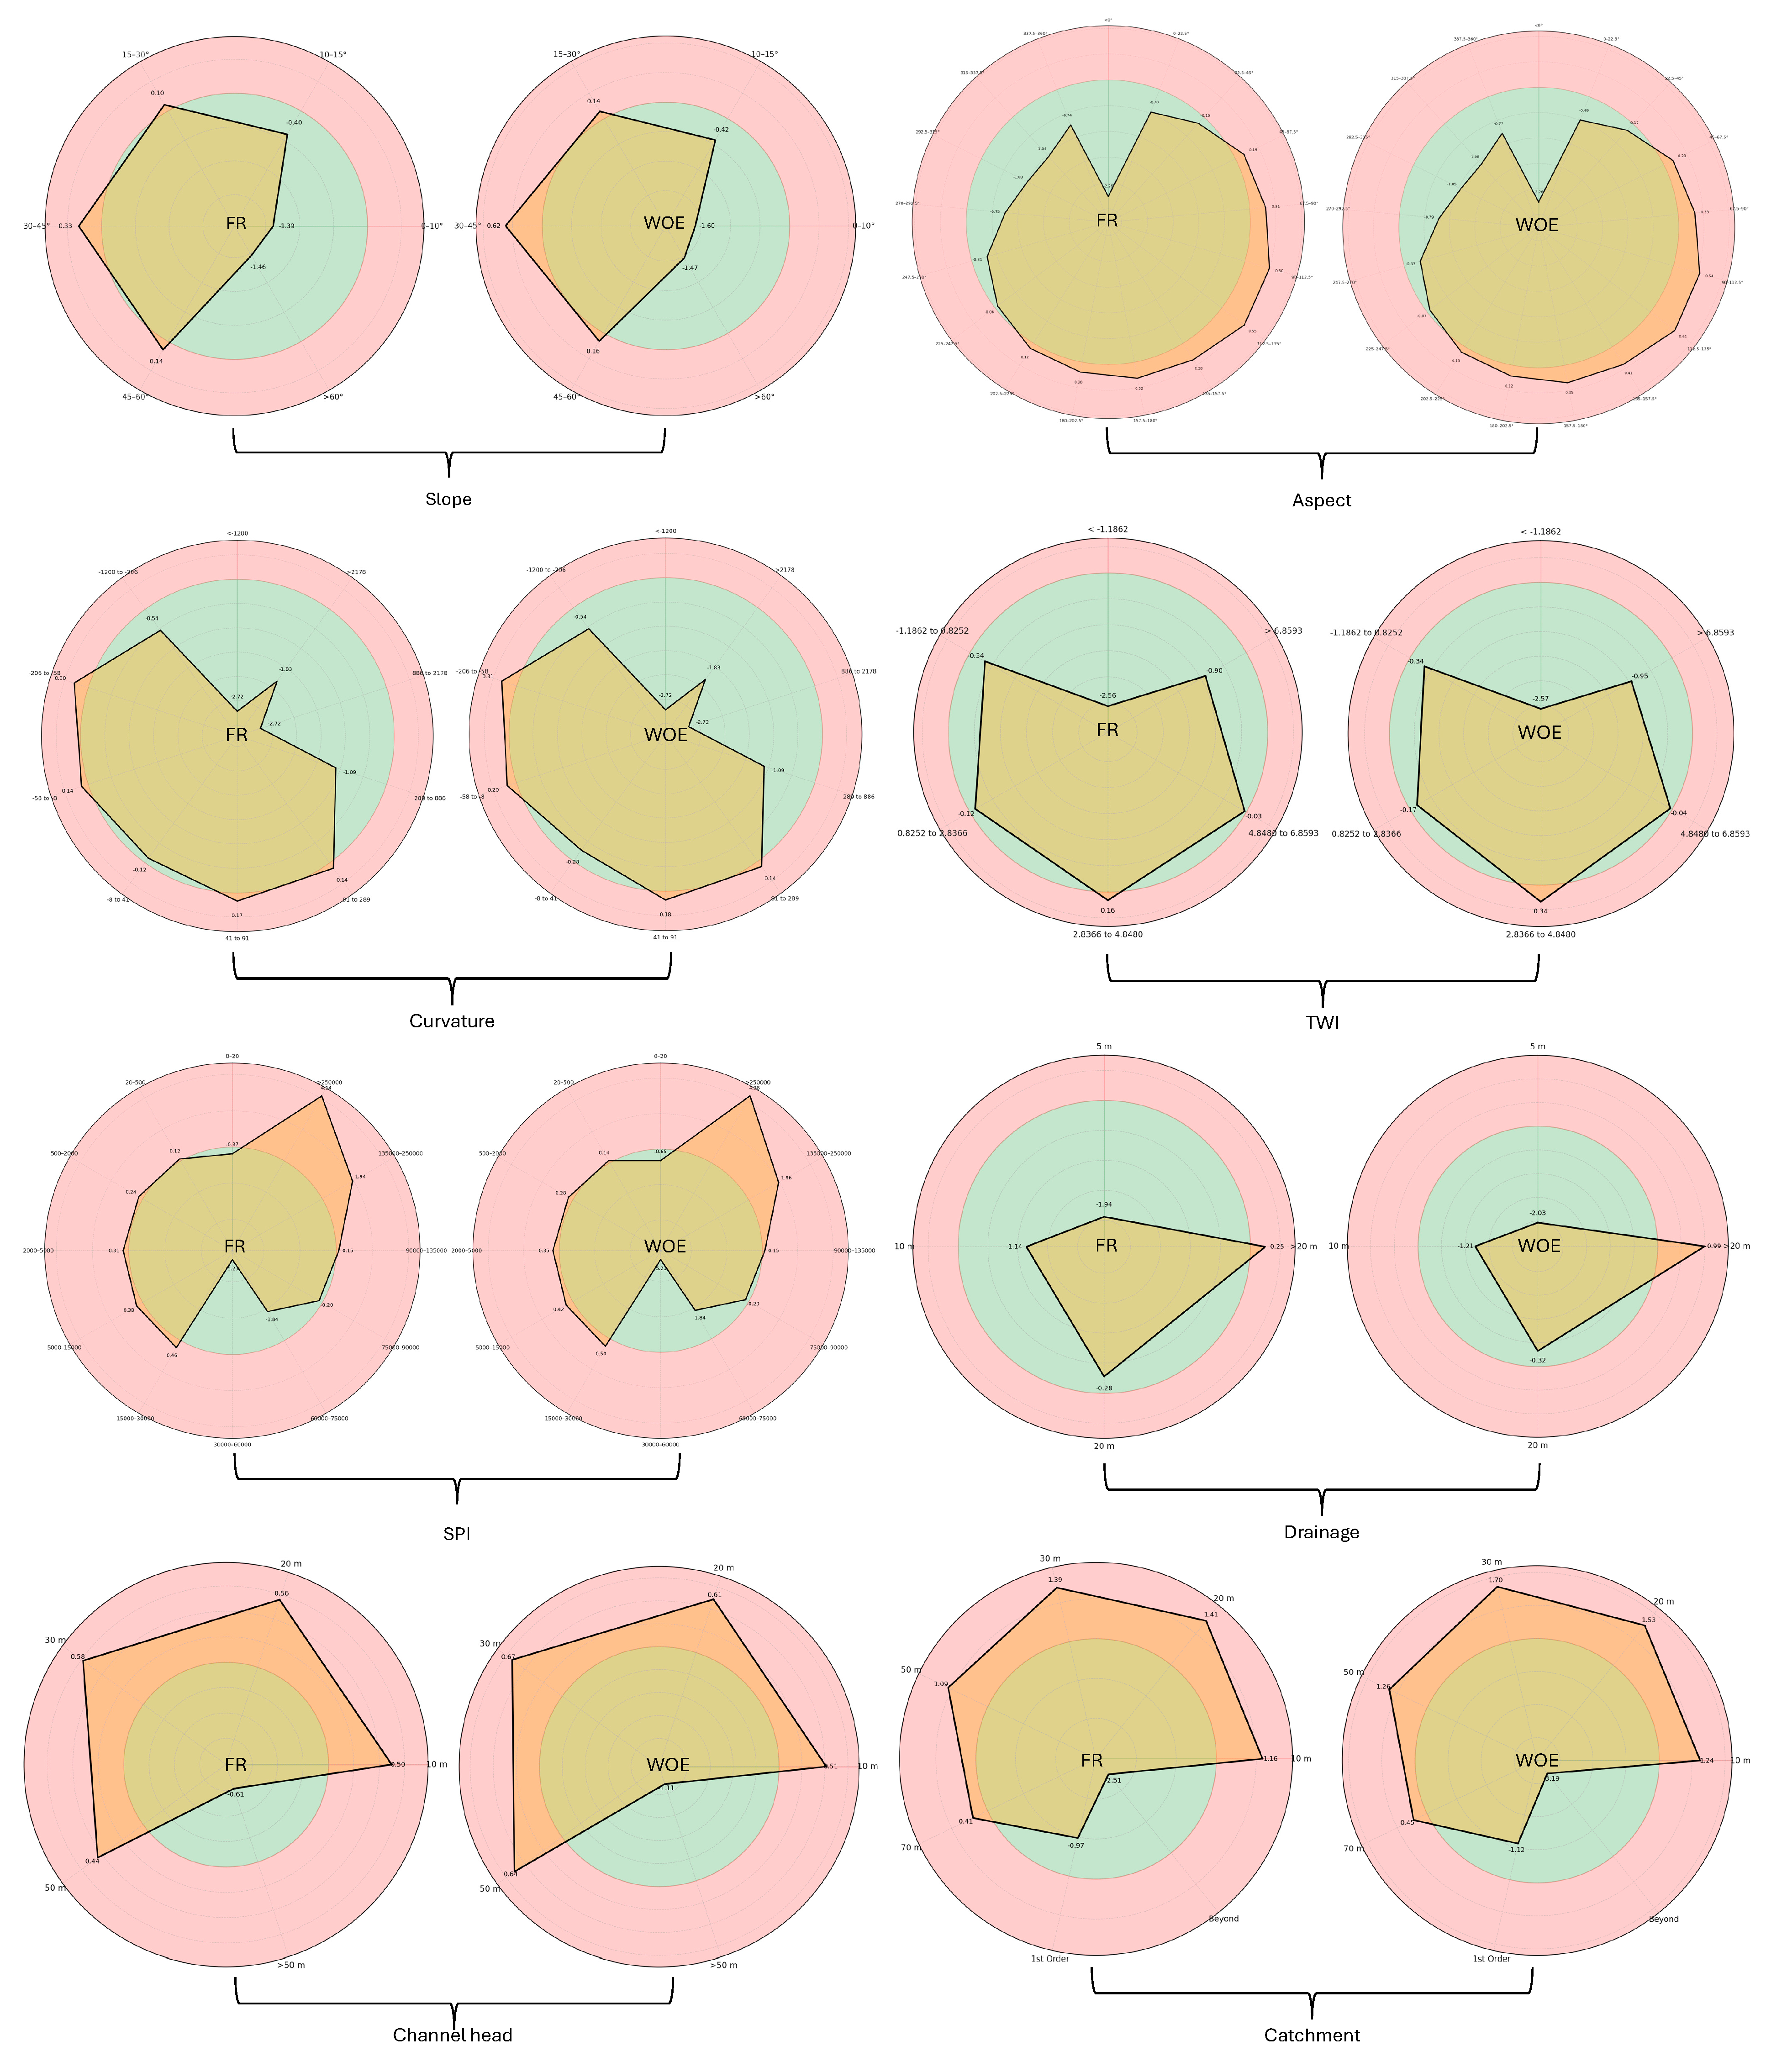
The preprocessor algorithm overlays the landslide inventory map with each factor separately and determines the relationship of each factor to the inventory map. The result provides the number of landslide pixels in each factor class. After the data were prepared, the methodologies were applied to the pre-processed output. The results from the FR and WOE methods show the probability of landslide occurrence associated with each factor class, as illustrated in
Figure 7.
Despite relying on different mathematical formulations, the interpretations of Frequency Ratio FR and WOE are largely consistent. In general, positive values ( or ) indicate that a specific class of a conditioning factor is positively associated with landslide occurrences, suggesting higher susceptibility. Conversely, negative values ( or ) imply a lower likelihood of landslide occurrence, indicating lower susceptibility. A neutral value ( or ) denotes no significant relationship.
As illustrated in
Figure 7, values greater than 0 (highlighted in red) represent classes that are more susceptible to mass movement, particularly those originating from 0-order basins. By quantifying these relationships, both methods help identify terrain attributes that contribute most significantly to slope instability.
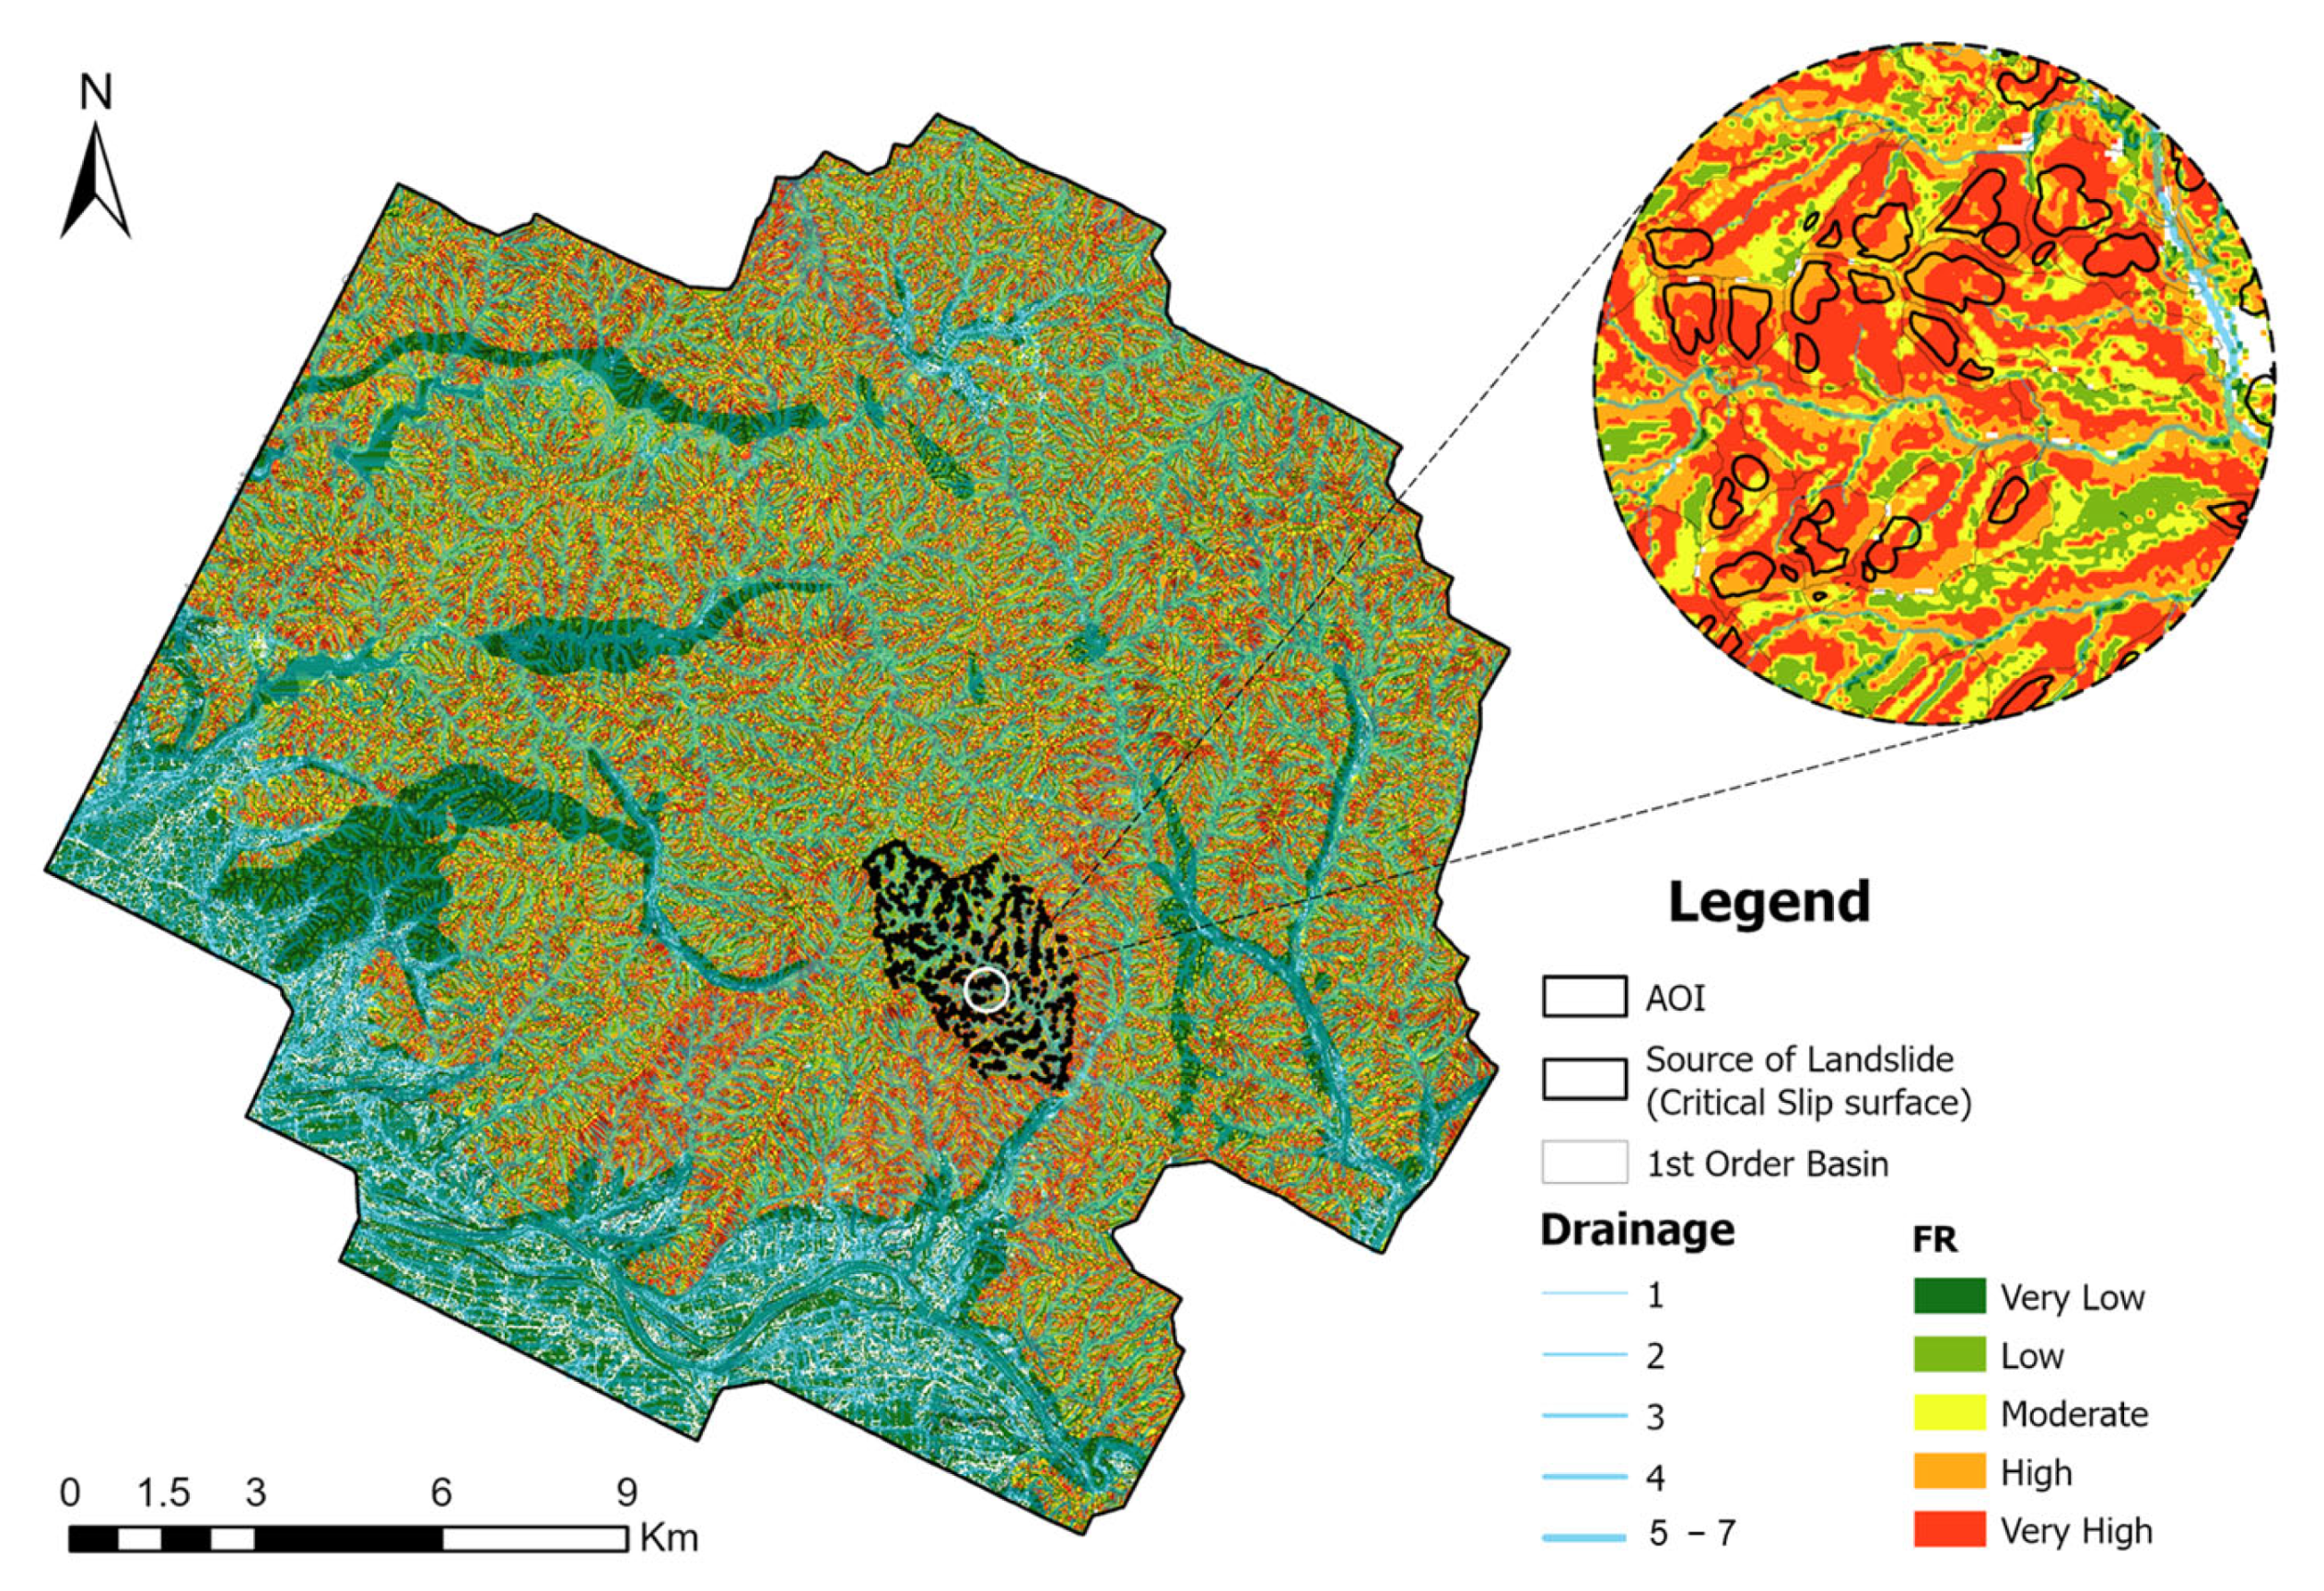
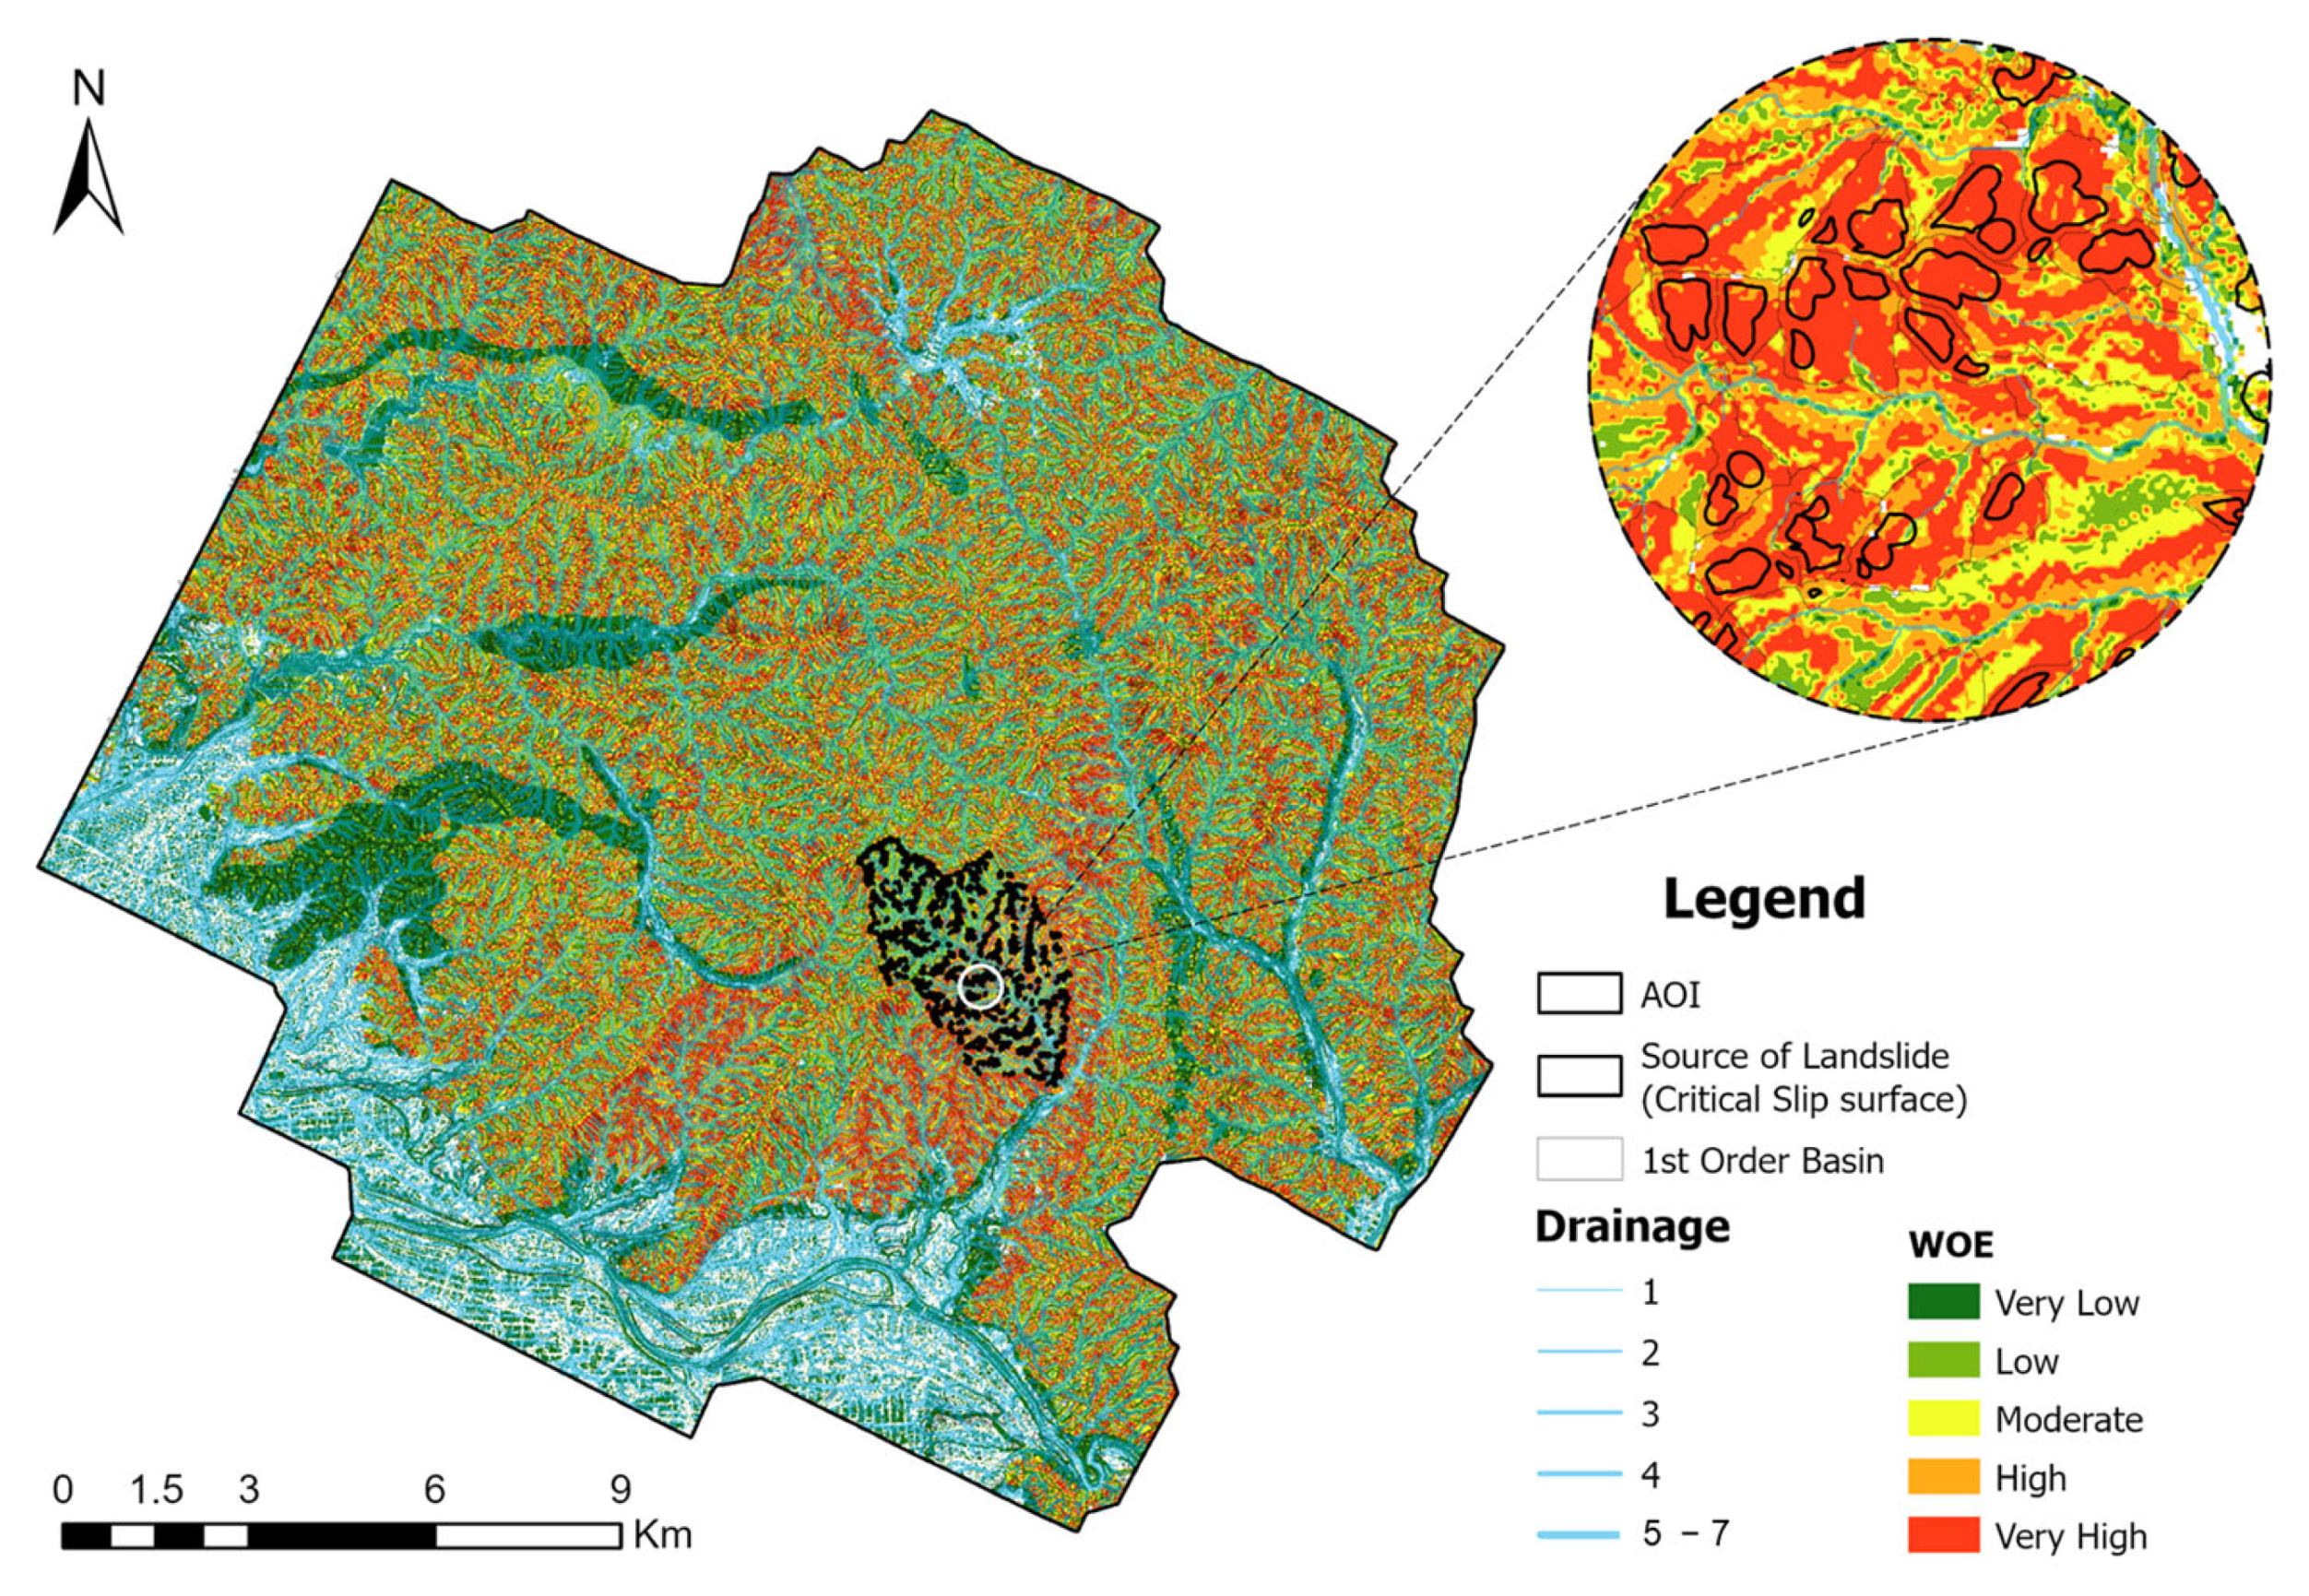
Finally, the results from all contributing factors were integrated according to Equations (4) and (8), and the resulting susceptibility outputs are presented in
Figure 8 and
Figure 9.
The results indicate that both the FR and WOE methods effectively identified areas with a high risk of mass movement in the upper catchment. Nearly all the critical slip surfaces or source zones of mass movement are located within the ‘High’ to ‘Very High’ susceptibility classes, demonstrating the reliability of these methods in delineating hazardous zones.
4.2. Multivariate Methodology
Multivariate methods differ fundamentally from bivariate approaches. While bivariate techniques evaluate the relationship between landslide occurrence and each conditioning factor class independently, multivariate methods consider all contributing factors simultaneously to develop a best-fit model that distinguishes landslide-prone areas from stable zones. To support this analysis, a preprocessing algorithm was developed (
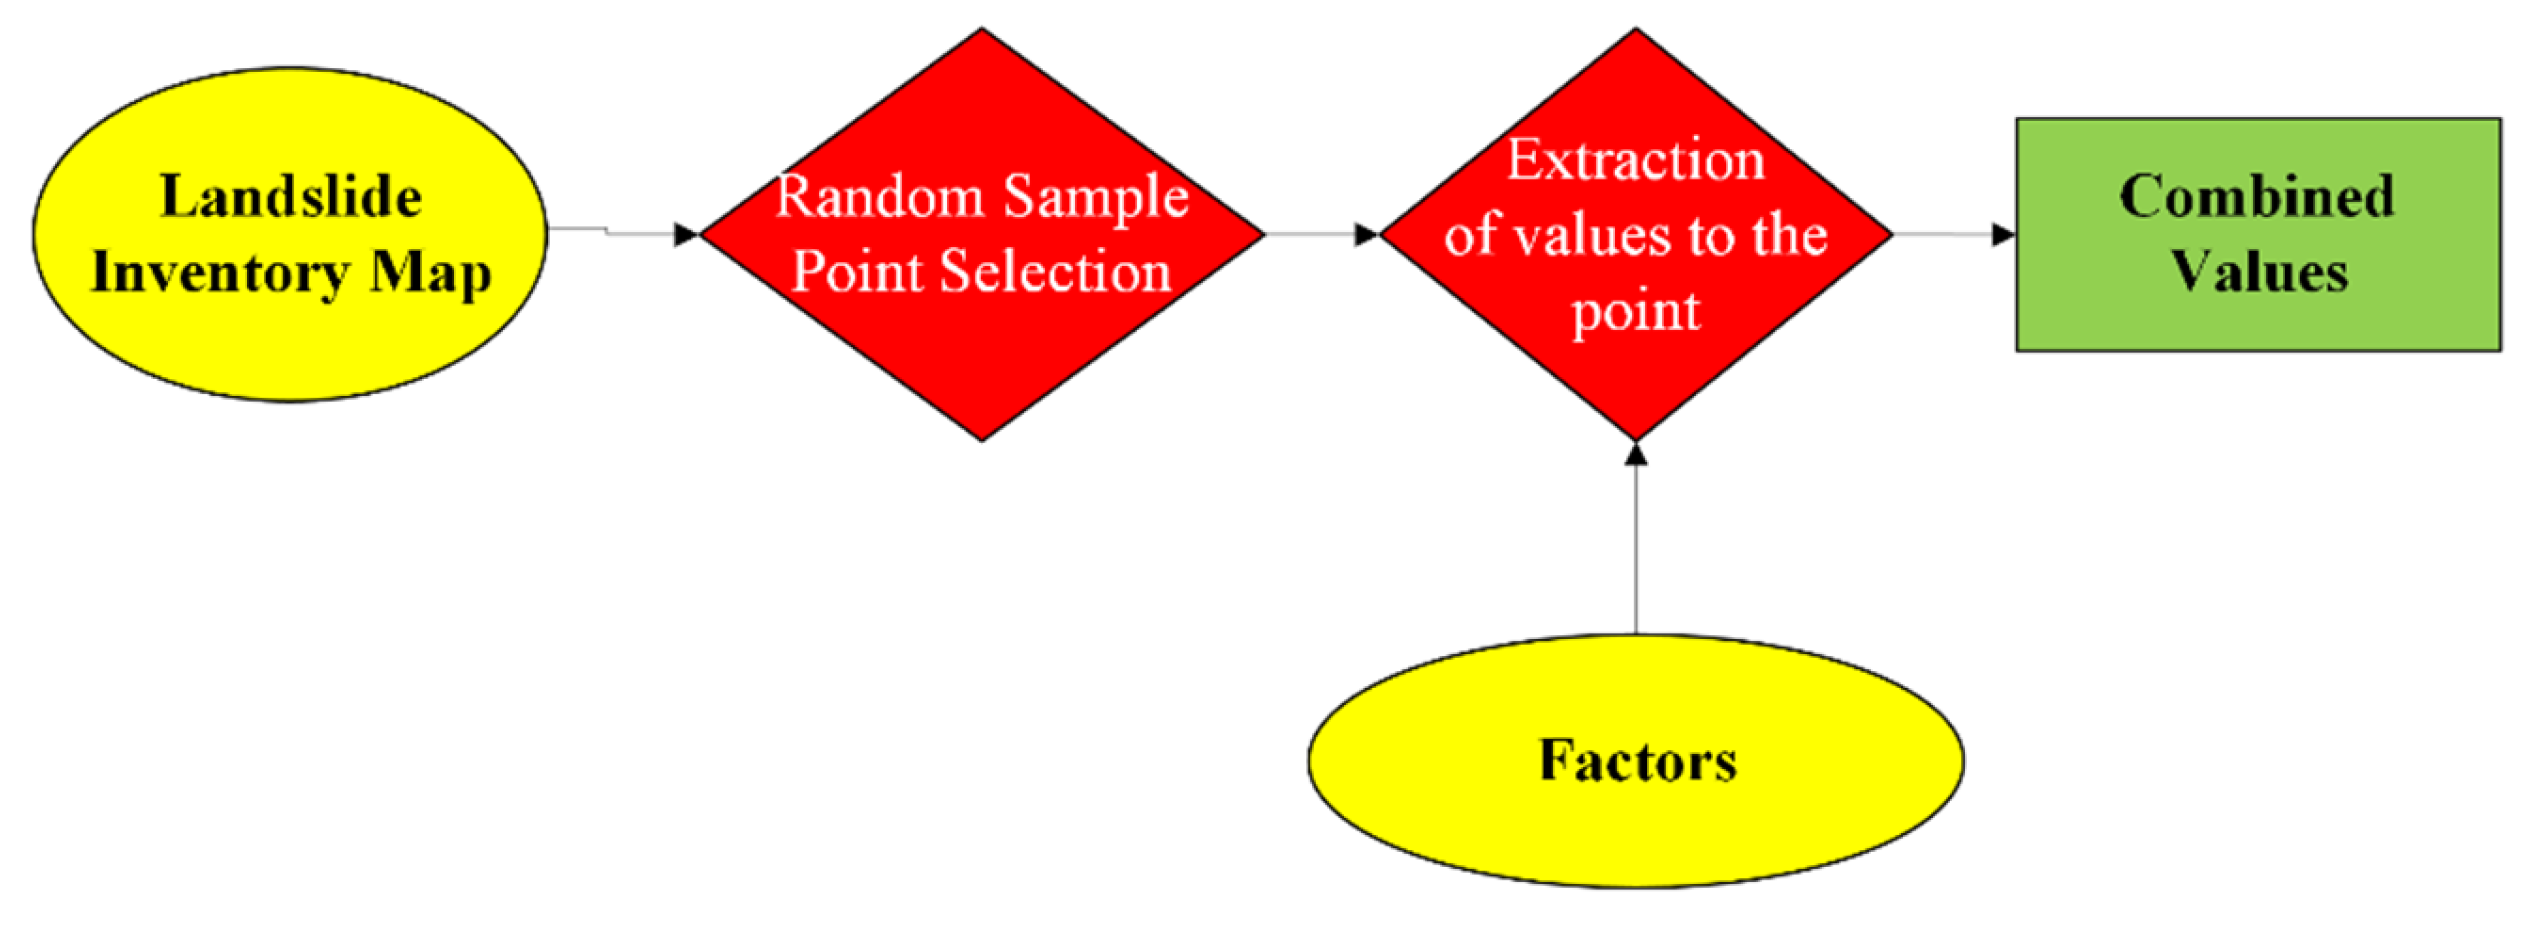
Figure 10).
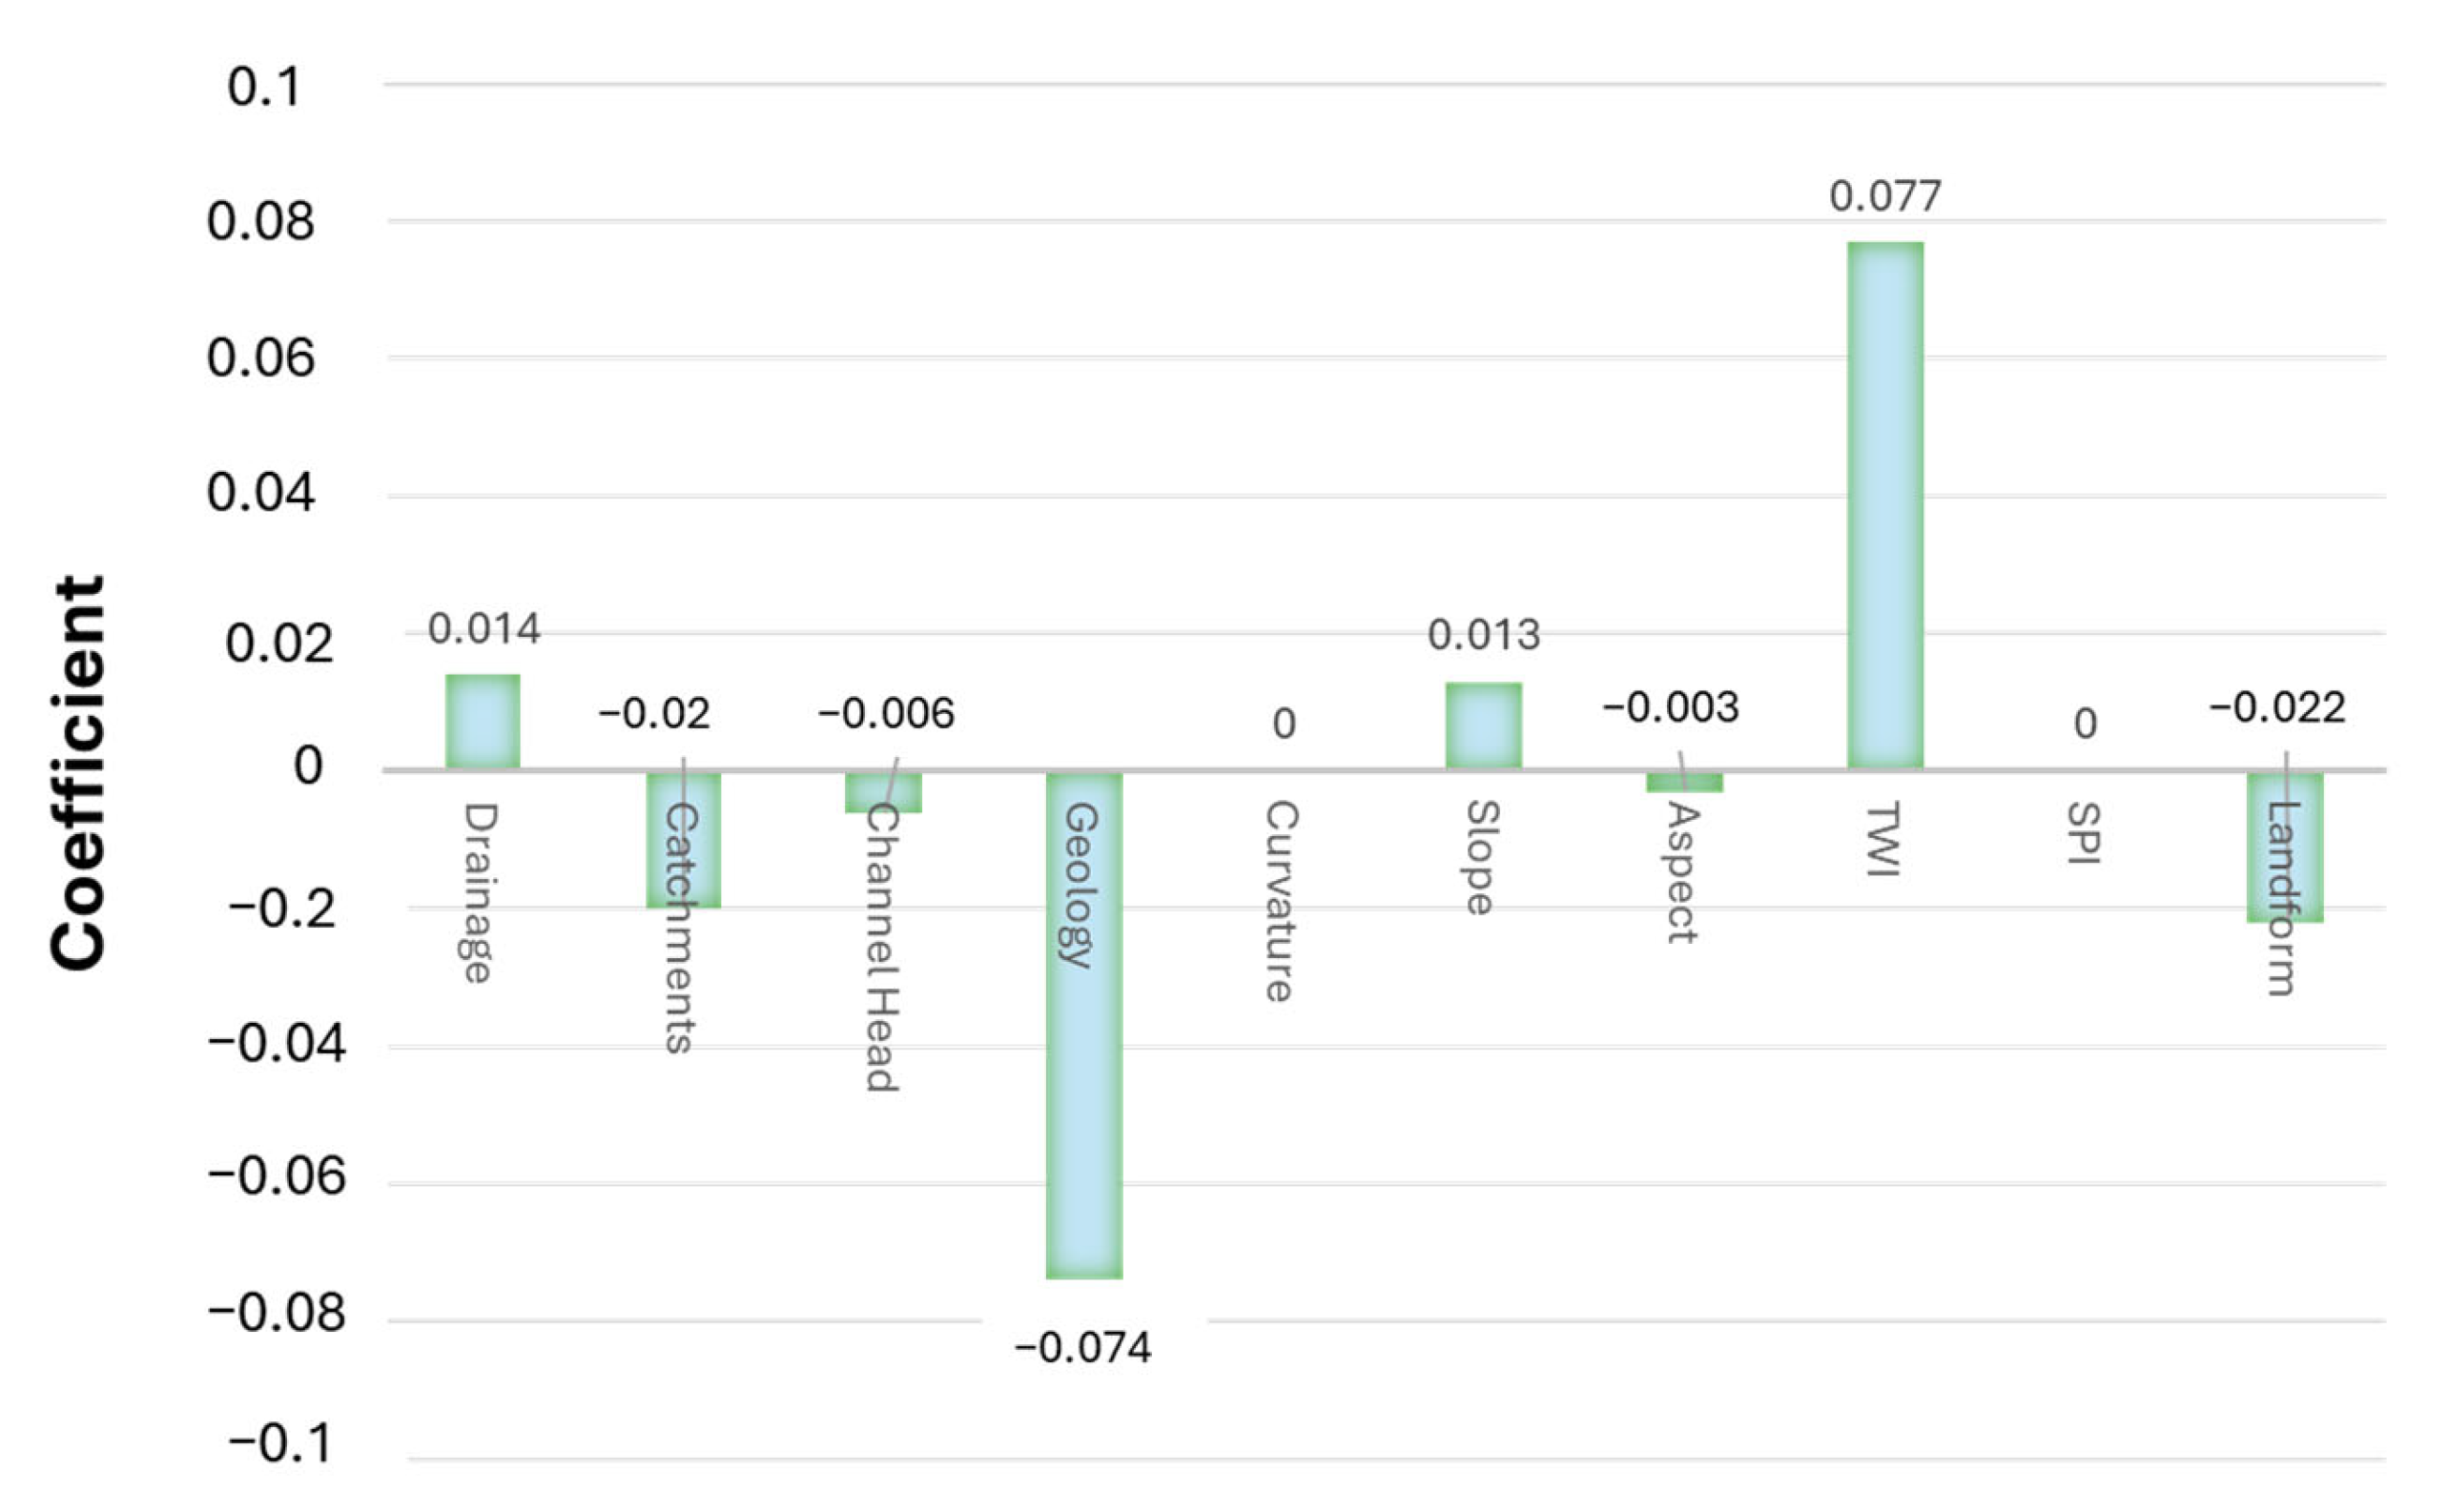
The multivariate preprocessor algorithm extracts a predefined number of random sample points from both landslide and non-landslide areas, ensuring a representative distribution across the entire study area. These points are overlaid onto each factor layer to obtain the corresponding factor values for use in the analysis. The LR method then evaluates all contributing factors simultaneously to develop a best-fit model that distinguishes landslide-prone areas from stable zones. In this study, the LR model, as defined, was applied to a dataset of 30,000 randomly selected sample points, and the resulting regression coefficients for the conditioning factors are presented below. For each point, the values of all relevant conditioning factors, such as slope, aspect, landform, curvature, TWI, SPI, lithology, and others, were extracted and compiled into a structured dataset suitable for multivariate modeling; afterward, the LR model was applied.
Positive coefficients (e.g., TWI, drainage, and slope) indicate a direct relationship with landslide susceptibility, meaning that an increase in these values corresponds to a higher likelihood of landslide occurrence. Conversely, negative coefficients (e.g., geology and landform) suggest an inverse relationship, where higher values are associated with lower susceptibility. Factors with larger absolute coefficient values have a stronger influence on the model’s predictive performance. These results were incorporated into the model to produce the final susceptibility output, as illustrated in
Figure 11.
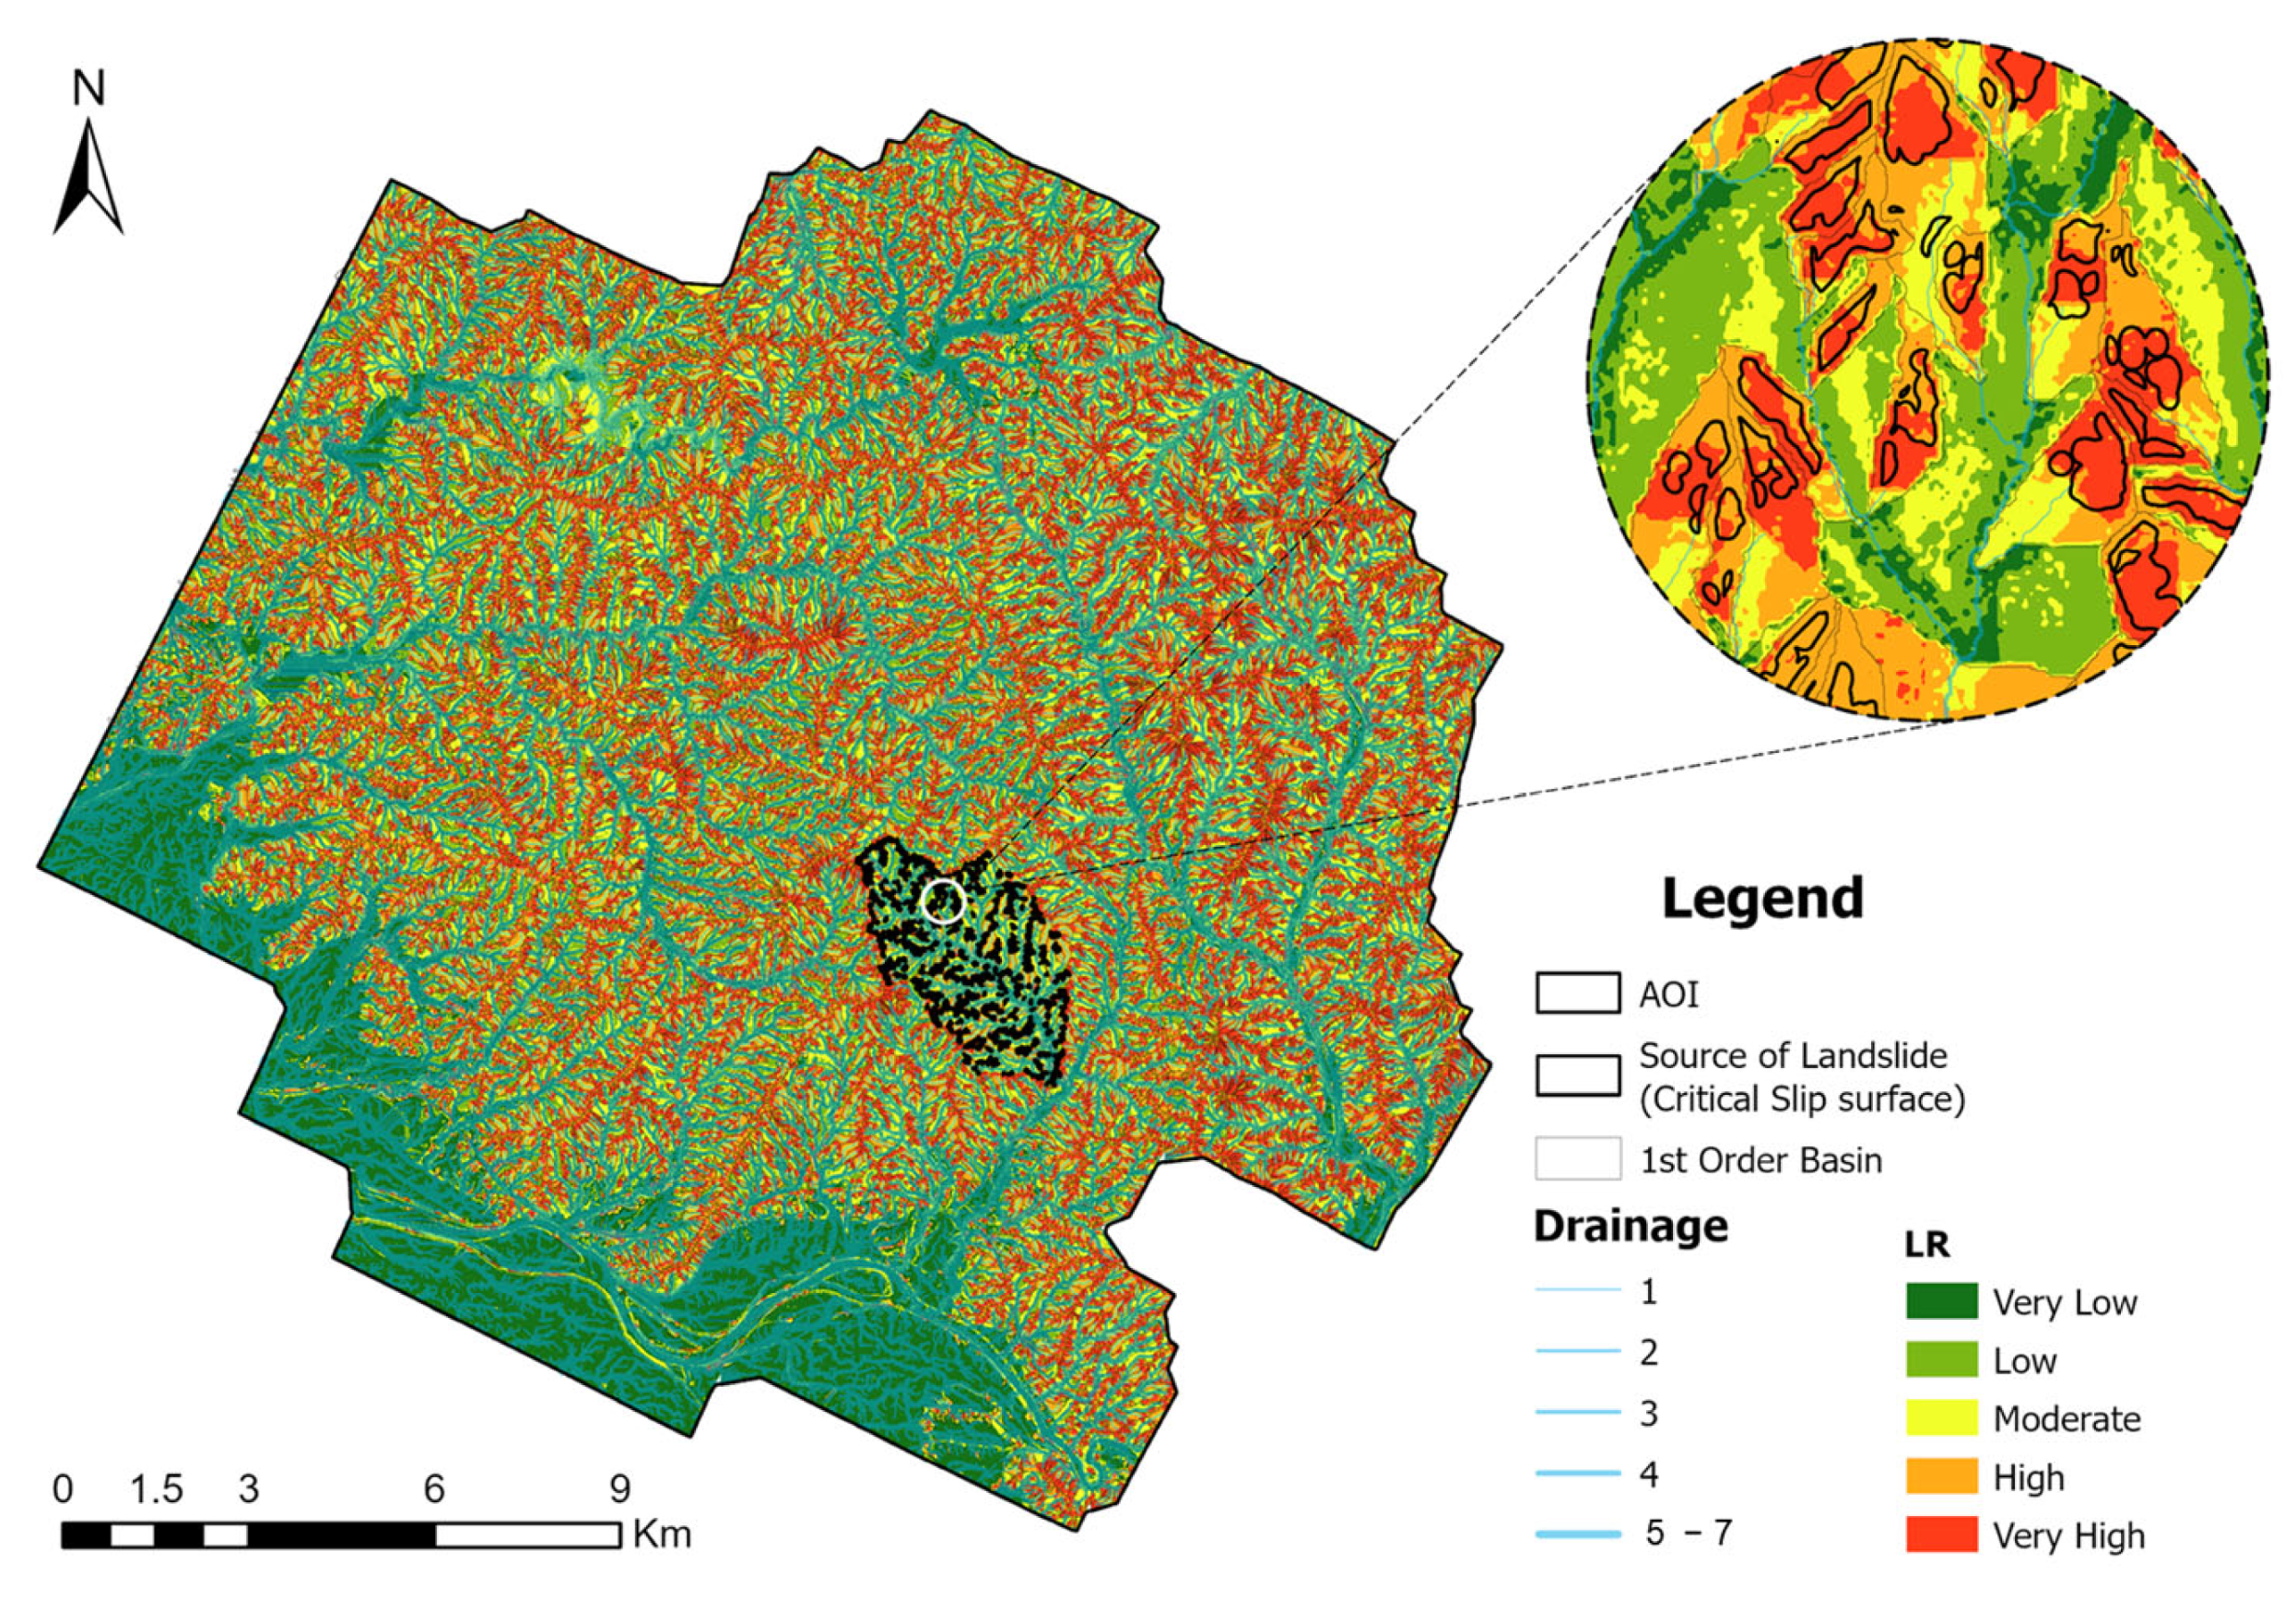
After applying the Logistic Regression model, the spatial distribution of landslide susceptibility was generated, as shown in
Figure 12.
The results indicate that all critical slip surfaces are located within the ‘High’ to ‘Very High’ risk zones, demonstrating the effectiveness of the methodology in accurately identifying high-risk areas within the 0-order basins.
4.3. Integration of Bivariate and Multivariate Methodology
Integrating bivariate and multivariate methodologies combines the strengths of both approaches to improve the accuracy and reliability of landslide susceptibility assessments.
As mentioned above, to address the respective limitations of each method and enhance overall model performance, this study integrates FR with LR (FR–LR) and WOE with LR (WOE–LR) following the methodology outlined earlier. In these hybrid approaches, FR and WOE values are first calculated for each class of the conditioning factors and then used as transformed inputs in the LR model. This preprocessing step standardizes the data and improves the logistic model’s ability to capture non-linear and multivariate relationships while preserving the statistical relevance of each factor.
A total of 30,000 sample points were randomly selected. The corresponding FR and WOE values were extracted for each point and used to apply Equation (11) (FR–LR) and Equation (12) (WOE–LR). These integrated models aim to improve classification accuracy, reduce the miss alarm rate, and enhance model reliability—especially in topographically complex and geologically diverse regions.
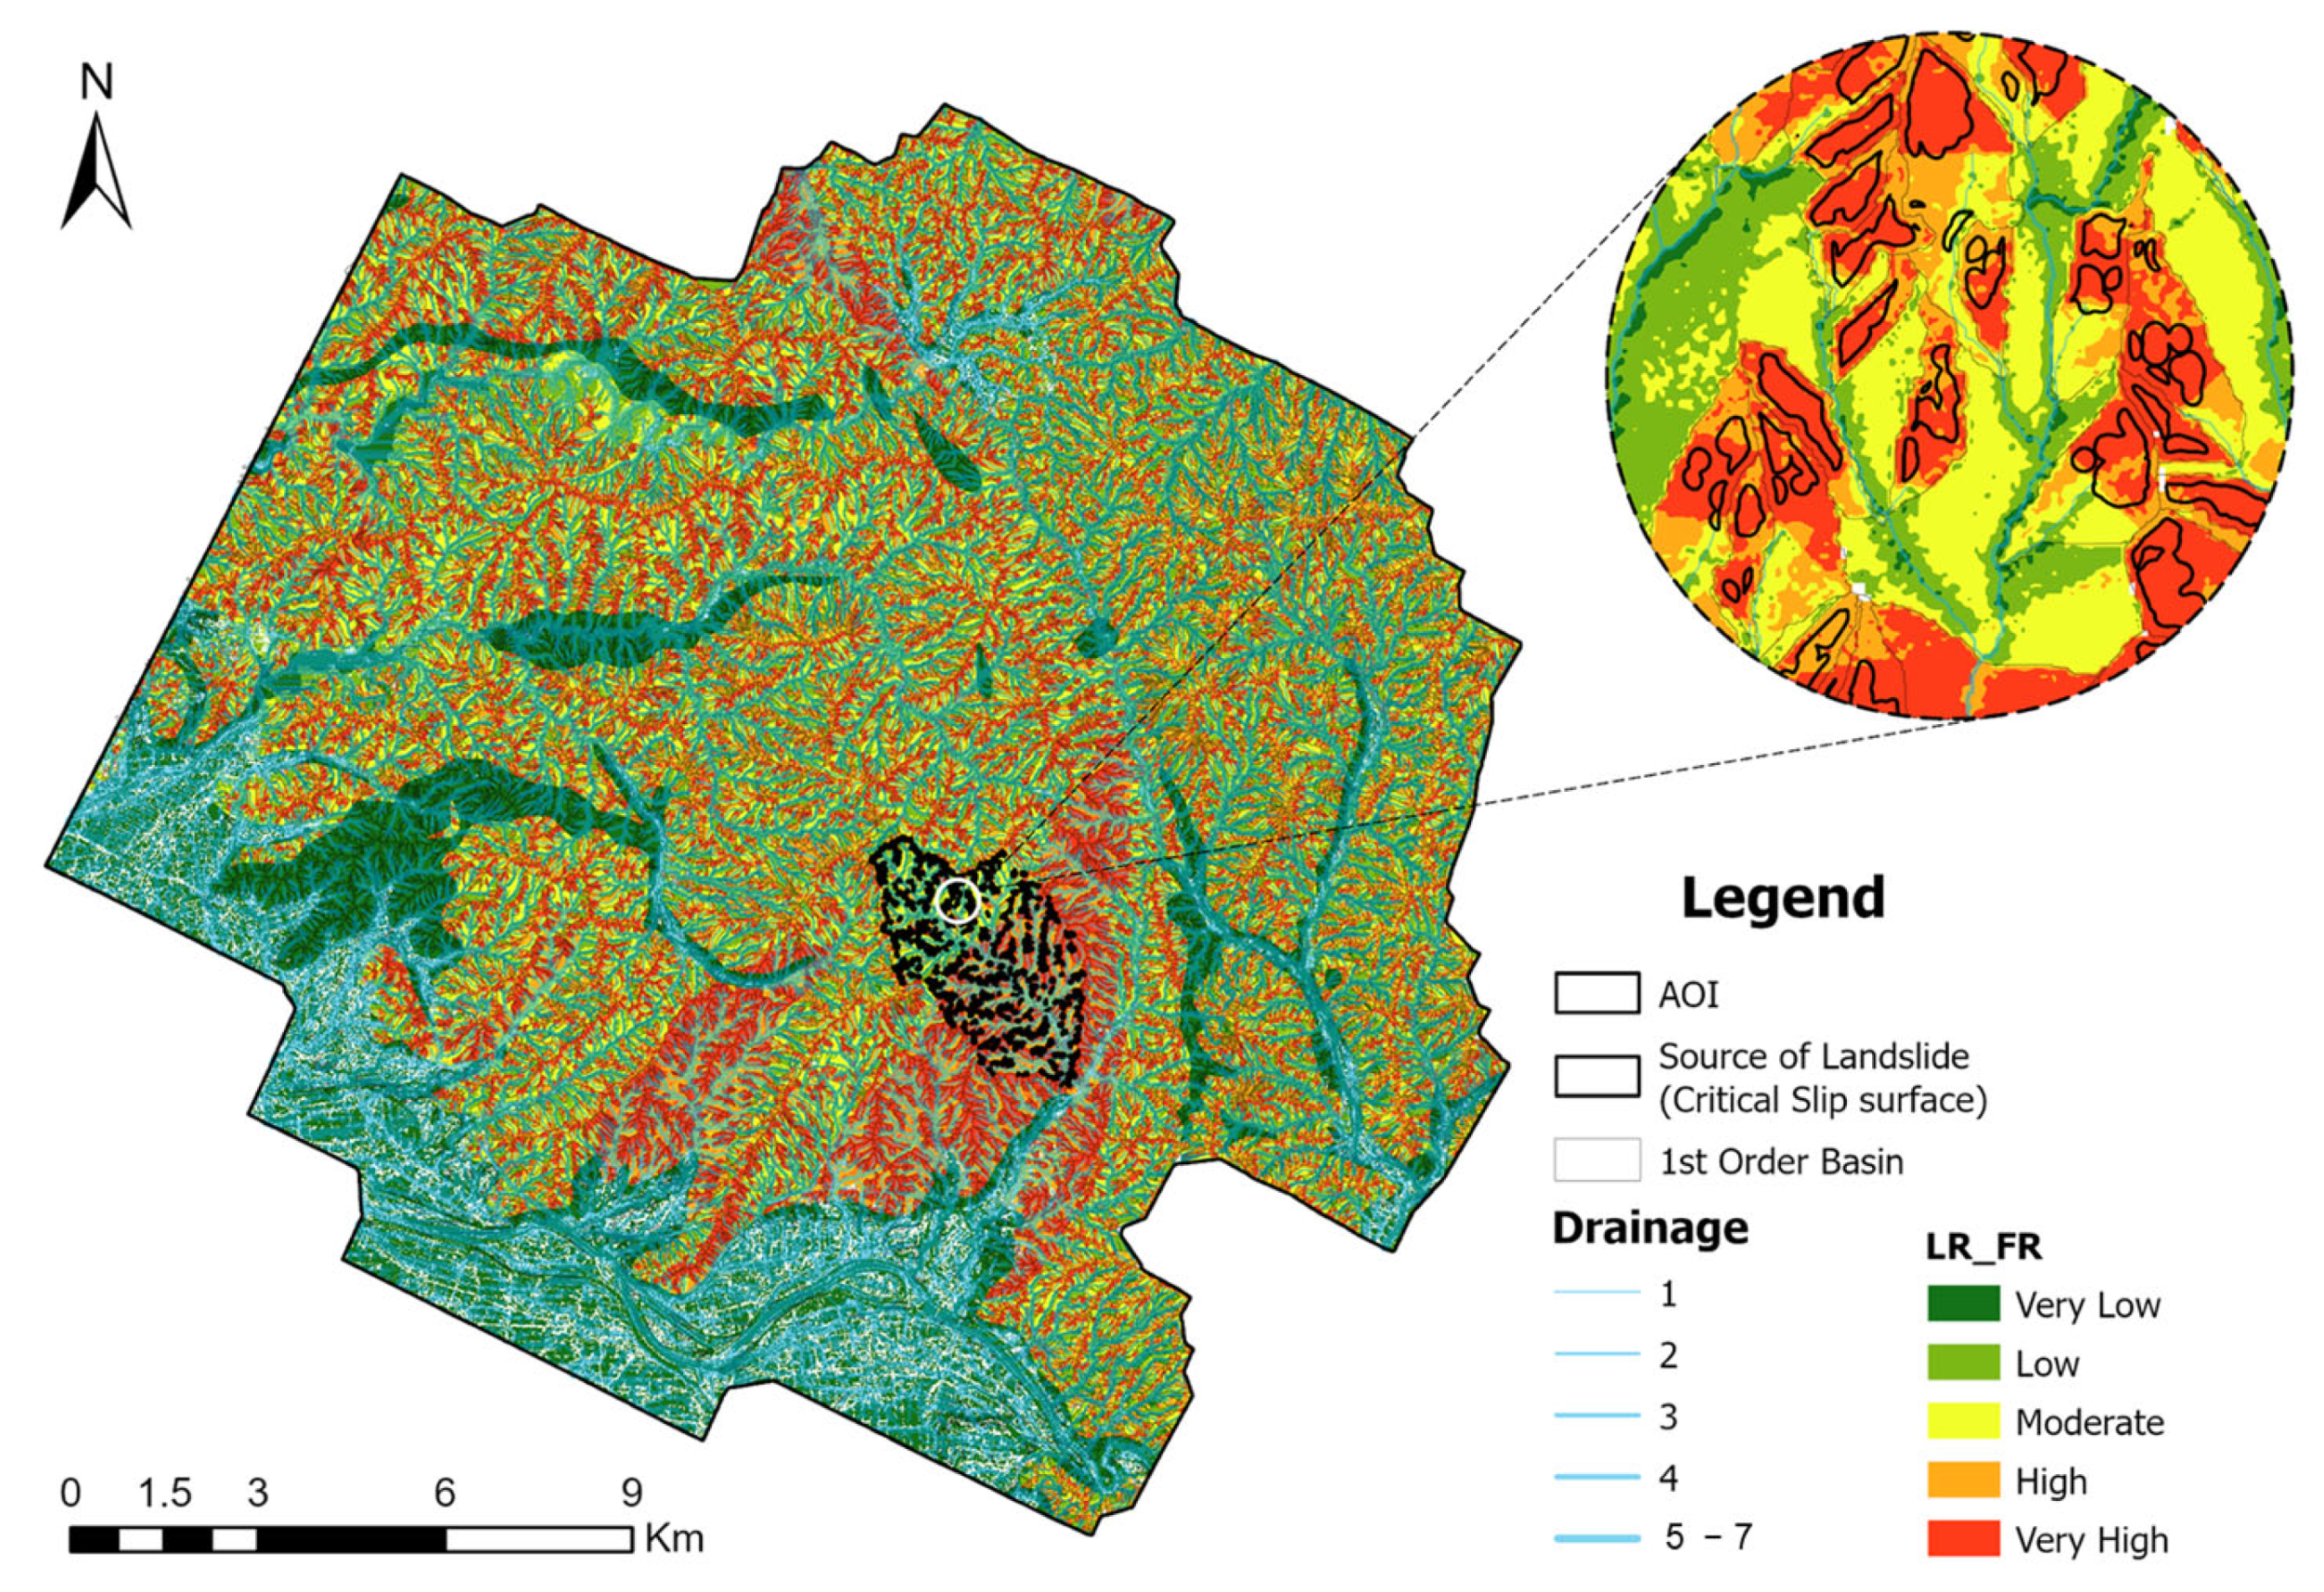
Following the application of Equations (11) and (12), the resulting values were derived and analyzed. These outcomes reflect the integrated effects of the bivariate and multivariate methods and are presented in
Figure 13 and
Figure 14.
Figure 13 and
Figure 14 clearly demonstrate that integrating LR with FR and WOE enhances the predictive performance of the model. As shown, the critical slip surfaces within the approximate 0-order basins are predominantly located in the ‘High’ to ‘Very High’ susceptibility zones, validating the effectiveness of the integrated approaches.
4.4. Validation
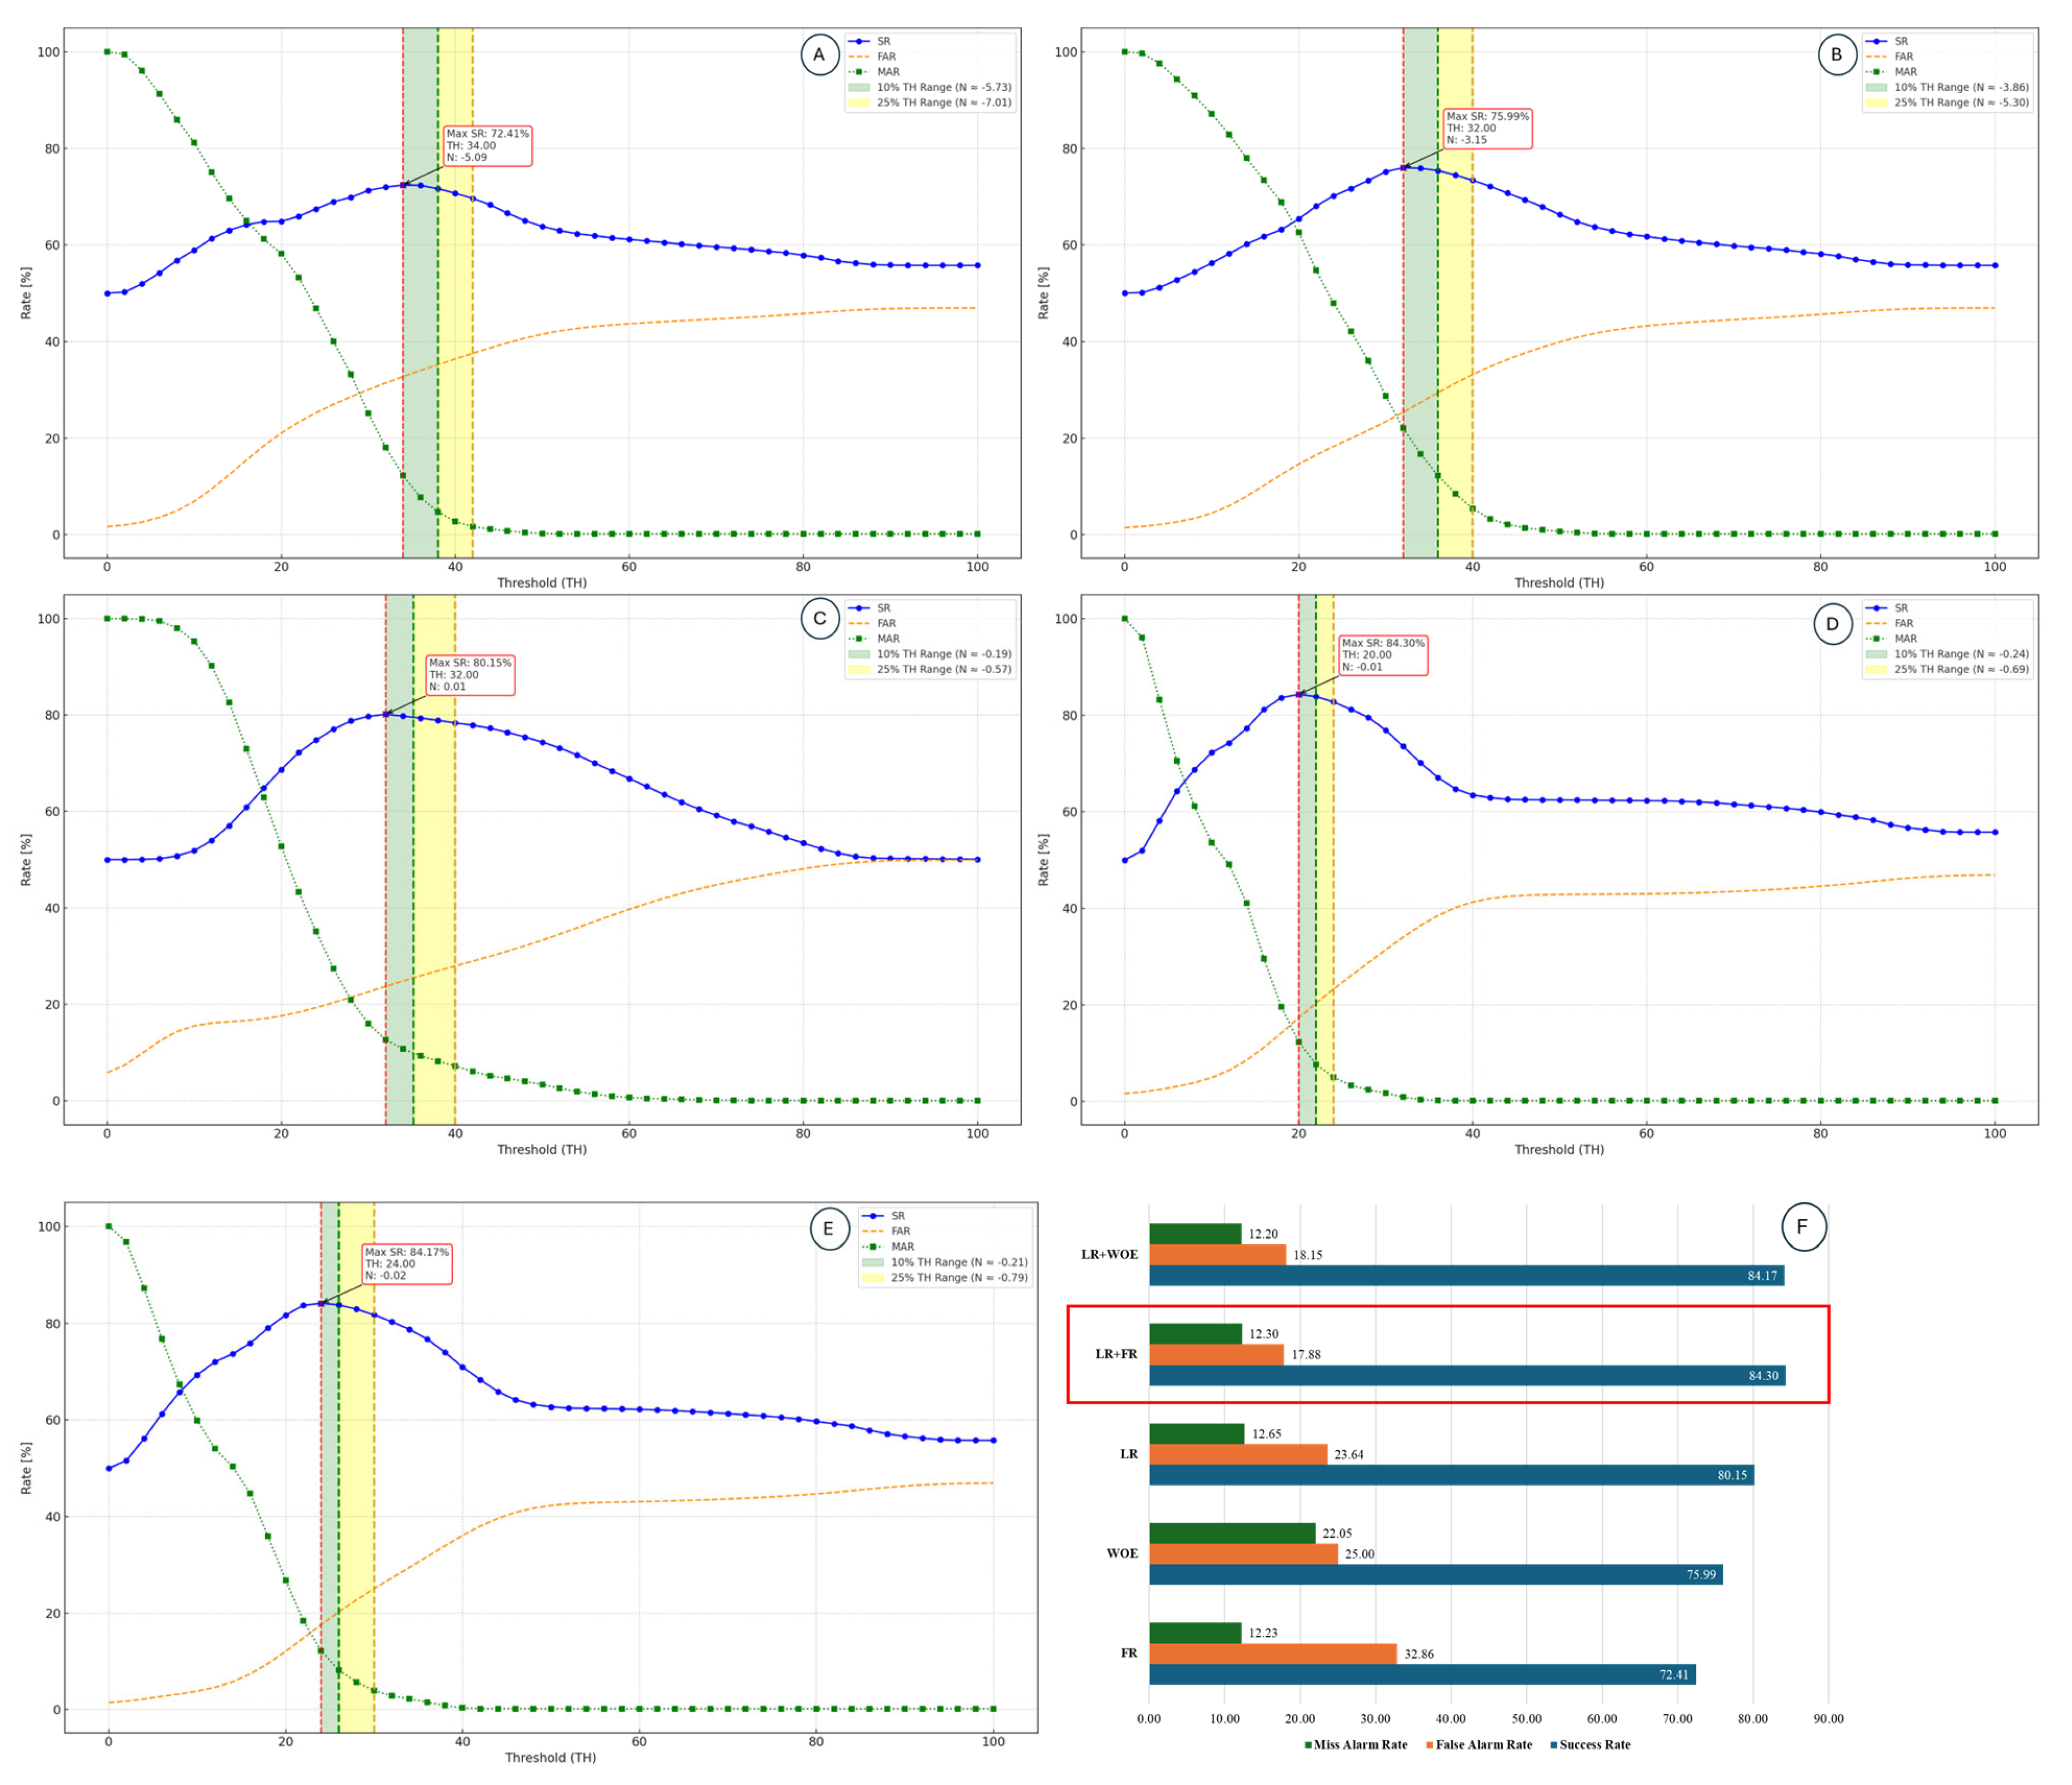
The results were validated using the matrix validation method. To enhance its utility, the validation process was further improved in this study—not only to identify the model with the highest success rate and the lowest associated error rates but also to support the classification of susceptibility maps by determining optimal threshold values for high-risk zones, depending on the application context.
For instance, in remote areas lacking settlements and infrastructure, a higher miss alarm rate may be acceptable due to lower exposure and risk. However, in urban or densely populated areas, a higher false alarm rate is often more tolerable than a high miss alarm rate, since failing to detect actual landslide-prone zones poses significant threats to life and property. A miss alarm rate reflects the proportion of true landslide locations that were incorrectly classified as stable, highlighting critical gaps in model prediction.
To perform this validation, a total of 30,000 randomly selected sample points were used. The susceptibility values generated by each methodology were extracted at these points, and the improved validation algorithm was applied. The results of this analysis are presented in
Figure 15.
Based on the results, it can be concluded that all of the applied methodologies produced acceptable levels of predictive accuracy. However, the integration of methods significantly improved model performance, particularly by increasing accuracy and reducing the miss alarm rate. Among the tested approaches, the combination of LR and FR yielded the best performance, achieving a success rate of 84.30%, a miss alarm rate of 12.30%, and a false alarm rate of 17.88%. In addition to the overall performance metrics, the algorithm provided valuable insights into the classification thresholds for landslide susceptibility. For the combined LR + FR model, a threshold value of –0.24 was associated with the ‘Very High’ risk zone, while –0.69 marked the lower boundary of the ‘Moderate’ risk zone. Values below this range were classified as ‘Low’ or ‘Safe’ zones.
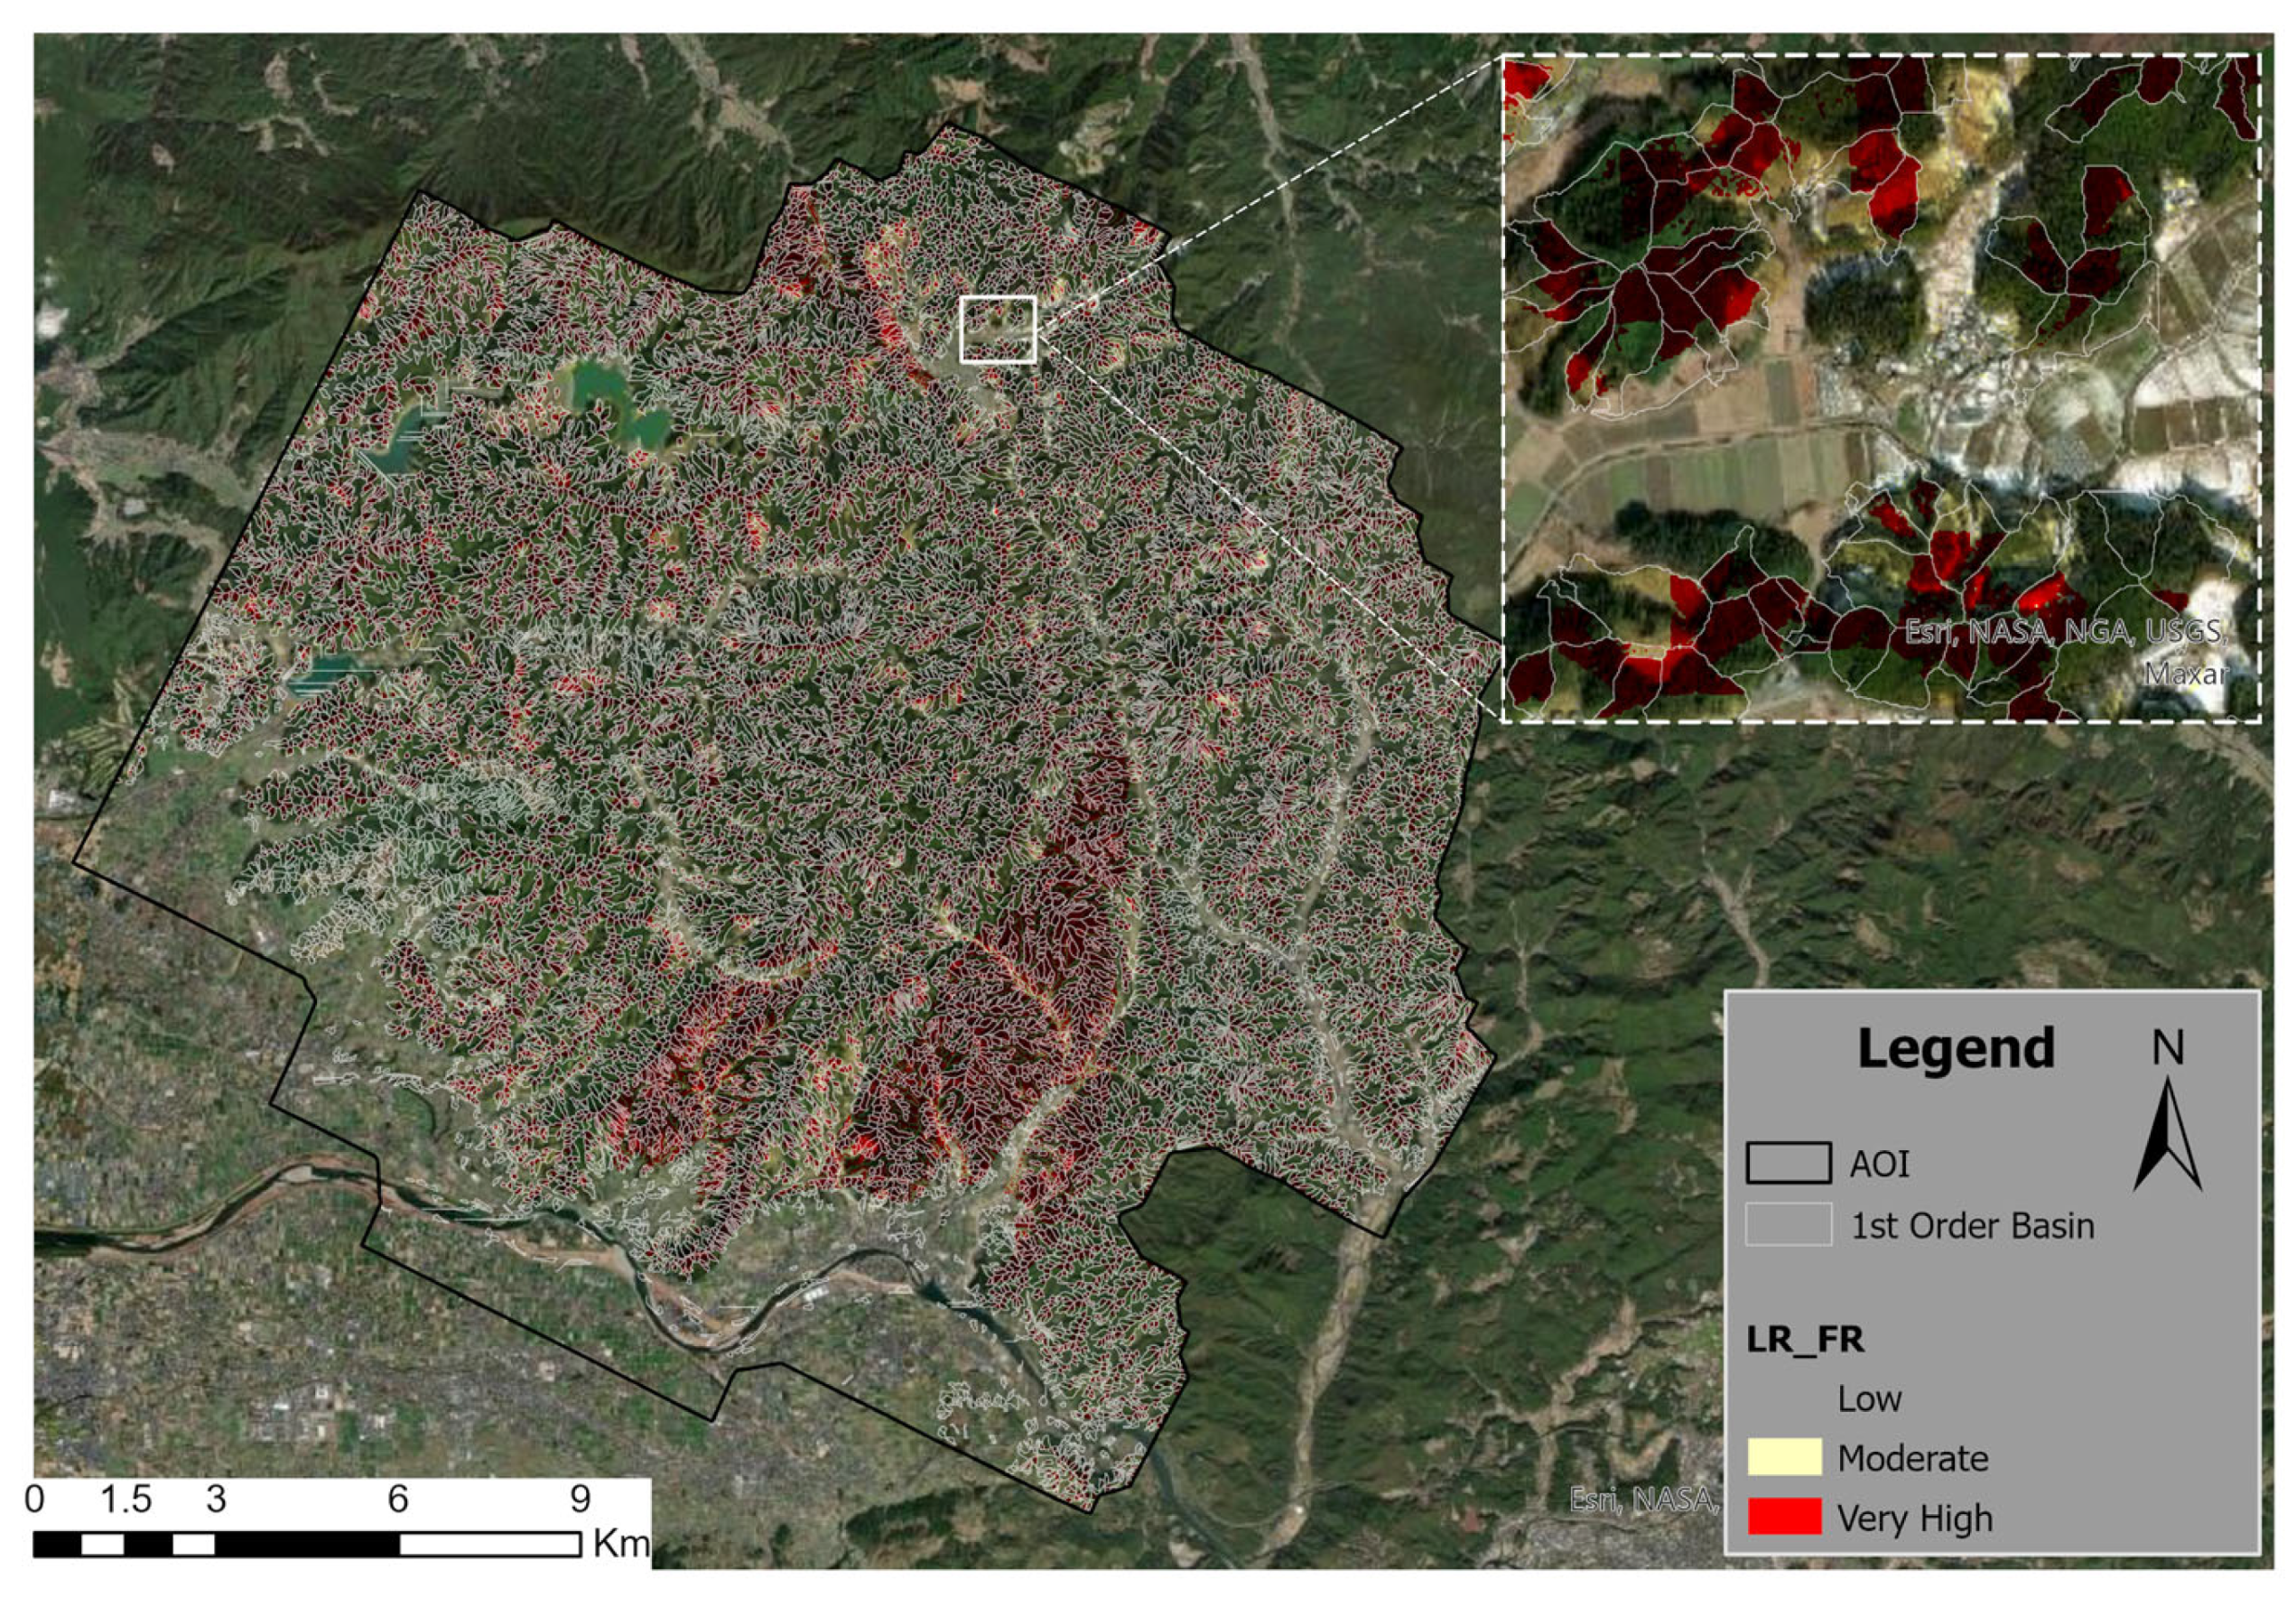
Furthermore, the model’s performance was validated using a visually interpreted landslide inventory corresponding to the 6 July 2017 event. The LR + FR model successfully detected 79.43% of documented landslide occurrences, with a false alarm rate of 25.56% and a miss rate of 10.34%. It should be noted that the accuracy of the landslide inventory may be compromised due to dense vegetation cover, which can obscure the visibility of landslide sources and hinder accurate detection
Figure 16.
These results are particularly significant for practical applications, including risk zoning, land-use planning, and the development of early warning systems in landslide-prone regions.
5. Discussion
This study demonstrates that integrating bivariate and multivariate statistical methods provides a robust and spatially interpretable framework for landslide susceptibility mapping, particularly within 0-order basins. These concave, unchanneled headwater basins are highly susceptible to mass movements such as debris flows but are challenging to delineate using conventional remote sensing or visual interpretation because of their subtle morphology and dense vegetation cover.
The proposed hybrid models combine the strengths of both strategies. Bivariate methods, such as FR and WOE, are widely used for their simplicity, transparency, and efficiency, particularly in data-limited environments. They effectively quantify the influence of individual conditioning factor classes by comparing the spatial distribution of landslide and non-landslide occurrences. However, a key limitation of these methods is the assumption of conditional independence among variables—a condition rarely met in natural landscapes, where terrain attributes such as slope, curvature, and hydrological indices (e.g., TWI, SPI) are often correlated [
17,
45]. LR, by contrast, can account for the combined effects of multiple interrelated variables and assess the statistical significance of each factor while addressing multicollinearity. Nevertheless, LR, on its own, may lack spatial interpretability and is sensitive to the scale and format of the input data [
20]. By standardizing FR or WOE values and using them as LR inputs, the hybrid frameworks preserve the interpretability of bivariate methods while adding the predictive strength and interaction modeling capacity of multivariate analysis. This is consistent with previous findings that hybrid approaches can improve model performance [
40,
46].
Among the five models tested, FR + LR achieved the highest performance, with a success rate of 84.30%, a miss alarm rate of 12.30%, and a false alarm rate of 17.88%. All critical slip surfaces within the study area’s 0-order basins were classified in the “High” to “Very High” susceptibility zones, indicating strong potential for identifying slope failure risks in steep, hydrologically active micro-catchments. The superior performance of the hybrid models—particularly FR + LR and WoE + LR—can be attributed to their integration of the spatial interpretability of bivariate statistics with the predictive capacity of multivariate analysis. This finding aligns with [
39], who reported that hybrid WoE + LR and WoE + RF models improved AUC values from 0.720 (WoE alone) to 0.773 and 0.802, respectively, confirming the advantage of combining complementary methods. In the present study, FR + LR achieved an improvement of 4.15–11.89 percentage points in success rate compared to the single models (FR: 72.41%, WoE: 75.99%, LR: 80.15%), while WoE + LR reached 84.17% with similarly low false and miss alarm rates. Such gains are consistent with previous studies in diverse geological settings, where hybrid frameworks outperformed single models by mitigating the conditional independence limitations of bivariate approaches and reducing the sensitivity of LR to variable scaling and class imbalance. Comparable conclusions were drawn by [
47], who demonstrated that hybrid modeling enhanced predictive performance in geomorphologically complex terrains, and by Abdelkader and [
48], who emphasized the value of hybrid or ensemble strategies in balancing interpretability with predictive robustness.
A custom threshold optimization algorithm was developed to address the limitations of conventional classification methods, such as natural breaks or fixed intervals. This algorithm identifies threshold values tailored to the study objectives and terrain characteristics, thereby improving both the accuracy and interpretability of susceptibility maps. For instance, in the FR + LR model, a threshold of –0.24 defines the “Very High” risk zone, while –0.69 marks the boundary for “Moderate” susceptibility. These threshold values are particularly valuable for hazard zoning, risk communication, and land-use planning at both local and regional scales.
Model reliability was further evaluated by comparing results with a landslide inventory from the 6 July 2017 event, created through visual interpretation of high-resolution satellite imagery. Although visual interpretation can be prone to substantial errors—especially in densely vegetated areas and depending on interpreter expertise—the FR + LR model detected 79.43% of documented landslides, with a false alarm rate of 25.56% and a miss rate of 10.34%. These results further confirm the hybrid model’s capability to identify actual landslide events and its suitability for hazard assessment in complex topographic settings.
The susceptibility maps and classification thresholds produced in this study have practical applications for early warning systems, slope stabilization planning, and land-use regulation, especially in highly exposed mountainous regions. The approach is also aligned with global disaster risk reduction frameworks, such as the Sendai Framework and the United Nations Sustainable Development Goals—specifically SDG 11 (Sustainable Cities and Communities) and SDG 13 (Climate Action)—by enabling spatially targeted, data-driven resilience strategies.
Despite the promising results, several limitations should be noted. Model performance depends on the quality and resolution of input data, including the completeness of the landslide inventory and the accuracy of the DEM. The assumption that past landslide patterns can predict future susceptibility may not hold under rapidly changing climatic or land-use conditions. While the proposed hybrid models performed well, this study did not include a formal uncertainty quantification for the susceptibility maps. The Monte Carlo simulations used here were designed to identify potential debris flow sources within 0-order basins [
14], rather than to evaluate prediction uncertainty. Although the high success rate and validation results indicate that the models are reliable for practical use, incorporating a formal uncertainty framework in future studies would further improve interpretability and robustness. Such a framework could be implemented using probabilistic or ensemble-based approaches to produce confidence intervals for susceptibility values. Additionally, systematic sensitivity analyses could be used to assess the effects of DEM resolution, landslide inventory completeness, and threshold selection on model outputs. These extensions would strengthen the framework, providing decision-makers with accurate hazard maps and a clearer understanding of prediction stability under varying data and methodological conditions.
From a multi-hazard perspective, the integrated statistical framework developed here—although specifically designed for rainfall-induced slope failures and debris flows originating in 0-order basins—could be extended to include coseismic landslide triggering and reactivation. In mountainous catchments, prolonged and intense rainfall can initiate debris flows and increase soil saturation in colluvial hollows, reducing shear strength and making slopes more vulnerable to failure under additional dynamic loading. Earthquakes occurring under such saturated conditions can significantly raise the likelihood of slope reactivation and mass movement initiation. Future work could therefore combine rainfall-based susceptibility mapping with earthquake-triggering assessments, for instance by incorporating a pseudo-dynamic Newmark displacement model capable of simulating coseismic displacements over large areas while accounting for variations in antecedent soil saturation. Advances in GIS-based automation make such coupling feasible, enabling comprehensive multi-hazard frameworks. This combined approach would be particularly valuable in hazard-prone 0-order basins, where the interaction of prolonged rainfall, rapid pore pressure buildup, and seismic shaking can produce cascading debris flow events with severe downstream consequences [
49].
Vegetation cover plays a dual role in landslide susceptibility. On one hand, dense vegetation—particularly deep-rooted forest species—can enhance slope stability by reinforcing soils, reducing runoff, and increasing evapotranspiration, thereby lowering pore-water pressure during rainfall events. This stabilizing influence is especially important in 0-order basins, where root reinforcement can help resist shallow failures that may initiate debris flows. On the other hand, dense canopy cover can obscure microtopographic features in high-resolution DEMs and hinder the accurate visual interpretation of landslide inventories. As a result, slopes that appear stable in model outputs may in fact contain underrepresented terrain features, such as micro-hollows, scarps, or subtle concavities, leading to non-conservative predictions. To address this limitation, future studies could integrate multi-temporal imagery or vegetation-penetrating remote sensing to improve the representation of heavily forested areas while explicitly incorporating vegetation’s stabilizing effects into the susceptibility model.
To further strengthen predictive capability and model robustness, future research should also integrate dynamic variables such as rainfall thresholds, soil moisture, and land cover change. Incorporating uncertainty analysis will improve the reliability and transparency of susceptibility assessments, particularly in areas where data are sparse or incomplete.
6. Conclusions
This study demonstrated the effectiveness of integrating bivariate and multivariate statistical approaches—specifically FR, WoE, and LR—for regional-scale landslide susceptibility mapping, with a particular focus on 0-order basins. These basins, often the initiation points for debris flows, represent critical hazard zones due to their geomorphological complexity and high sensitivity to rainfall-induced failures.
Customized preprocessing algorithms were developed to automate data preparation, model training, and spatial classification for both bivariate and multivariate models. The bivariate methods offered clear interpretability by evaluating the influence of individual conditioning factors, while the multivariate methods captured complex interdependencies among variables.
When applied individually, FR achieved a success rate of 72.41% with a false alarm rate of 32.86% and a miss alarm rate of 12.23%; WoE achieved 75.99%, 25.00%, and 22.05%; and LR achieved 80.15%, 23.64%, and 12.65%, respectively. While these single models performed reasonably well, the hybrid approaches consistently outperformed them. The FR + LR model achieved the highest predictive performance, with a success rate of 84.30%, a false alarm rate of 17.88%, and a miss alarm rate of 12.30%, while the WoE + LR model achieved 84.17%, 18.15%, and 12.20%, respectively. Both hybrid models also consistently classified critical slip surfaces within the ‘Very High’ susceptibility zone, validating their applicability for hazard identification in complex terrains.
The identification of threshold values (e.g., −0.24 for ‘Very High’ and −0.69 for ‘Moderate’) provides a transparent and actionable basis for decision-making in risk management and land-use planning. The proposed framework is scalable, interpretable, and statistically robust, making it adaptable to other mountainous regions vulnerable to landslides and debris flows. It offers valuable support for early warning systems, urban planning, and infrastructure development, particularly in data-limited or topographically complex areas. In alignment with global disaster risk reduction initiatives, this study contributes to the realization of several United Nations Sustainable Development Goals, particularly SDG 11 and SDG 13, by promoting resilient infrastructure and evidence-based planning for climate-sensitive hazards.
Author Contributions
A.Q.A., R.N., H.H., H.T. and I.D. made significant contributions to various aspects of the research, including its conceptualization, methodology, algorithm development, data collection, writing the original draft, visualization, and conducting the research. Y.M. was responsible for the supervision, conceptualization, methodology development, investigation, review, and editing. All authors have read and agreed to the published version of the manuscript.
Funding
This research was supported by JST SPRING, Japan, grant number JPMJSP2136.
Data Availability Statement
Since this research aims to provide useful insights into disaster prevention and assist authorities and researchers in achieving the SDGs, the algorithms developed in this study will be made available as a package to authorities and researchers working for humanitarian and educational purposes upon request. The corresponding author is obligated to make the datasets and algorithms used in this research available.
Acknowledgments
The authors sincerely thank JST SPRING, Japan; Council for Science, Technology and Innovation (CSTI) of the Cabinet Office, Government of Japan; Cross-ministerial Strategic Innovation Promotion Program (SIP), “Enhancement of National Resilience against Natural Disasters”; and all organizations and individuals who provided the necessary support.
Conflicts of Interest
The authors hereby declare that there are no conflicts of interest associated with the publication of this manuscript. They affirm that they have no financial, personal, or other relationships with other people or organizations that could inappropriately influence or bias the content of this work. This declaration ensures the integrity and transparency of the research and its findings.
References
- Kimura, T. Effects of Land Cover Changes and Rainfall Variation on the Landslide Size–Frequency Distribution in a Mountainous Region of Western Japan. Geosciences 2024, 14, 59. [Google Scholar] [CrossRef]
- JMA. Climate Change Monitoring Report 2021. Available online: https://www.jma.go.jp/jma/en/NMHS/ccmr/ccmr2021.pdf (accessed on 11 May 2025).
- Hashimoto, R.; Tsuchida, T.; Moriwaki, T.; Kano, S. Hiroshima Prefecture geo-disasters due to Western Japan Torrential rainfall in July 2018. Soils Found. 2020, 60, 283–299. [Google Scholar] [CrossRef]
- Yanagawa, Y.; Nagasawa, H.; Morishima, K.; Tada, S.; Katsumata, T.; Iida, T.; Sakurai, M.; Kato, H.; Nozawa, Y.; Nagasawa, Y.; et al. Activity of a Medical Relief Team from Shizuoka Hospital that was Dispatched to the Atami Debris Flow in 2021. Juntendo Med. J. 2021, 67, 542–546. [Google Scholar] [CrossRef]
- Jitousono, T.; Igura, M.; Ue, H.; Ohishi, H.; Kakimoto, T.; Kitou, K.-I.; Koga, S.; Sakai, Y.; Sakashima, T.; Shinohara, Y.; et al. The July 2020 Rainfall-Induced Sediment Disasters in Kumamoto Prefecture, Japan. Jpn. Soc. Eros. Control. Eng. (SABO) 2021, 13, 93–100. [Google Scholar] [CrossRef]
- Sassa, K. Implementation of the ISDR-ICL Sendai Partnerships 2015–2025 for Global Promotion of Understanding and Reducing Landslide Disaster Risk; Springer: Berlin/Heidelberg, Germany, 2016. [Google Scholar] [CrossRef][Green Version]
- Fathani, T.F.; Karnawati, D.; Wilopo, W. An integrated methodology to develop a standard for landslide early warning systems. Nat. Hazards Earth Syst. Sci. 2016, 16, 2123–2135. [Google Scholar] [CrossRef]
- Iverson, R.M. Landslide triggering by rain infiltration. Water Resour. Res. 2000, 36, 1897–1910. [Google Scholar] [CrossRef]
- Segoni, S.; Piciullo, L.; Gariano, S.L. A review of the recent literature on rainfall thresholds for landslide occurrence. Landslides 2018, 15, 1483–1501. [Google Scholar] [CrossRef]
- Iverson, R.M. Geomorphic and hydrologic dynamics of zero-order basins. Eos Trans. Am. Geophys. Union 1987, 68, 1808. [Google Scholar] [CrossRef]
- Parker, R.N.; Hales, T.C.; Mudd, S.M.; Grieve, S.W.D.; Constantine, J.A. Colluvium supply in humid regions limits the frequency of storm-triggered landslides. Sci. Rep. 2016, 6, 34438. [Google Scholar] [CrossRef]
- Hales, T.C.; Scharer, K.M.; Wooten, R.M. Southern Appalachian hillslope erosion rates measured by soil and detrital radiocarbon in hollows. Geomorphology 2012, 138, 121–129. [Google Scholar] [CrossRef]
- Sidle, R.C.; Gomi, T.; Tsukamoto, Y. Discovery of zero-order basins as an important link for progress in hydrogeomorphology. Hydrol. Process. 2018, 32, 3059–3065. [Google Scholar] [CrossRef]
- Akbar, A.Q.; Mitani, Y.; Nakanishi, R.; Djamaluddin, I.; Sugahara, T. Impact Assessment of Digital Elevation Model (DEM) Resolution on Drainage System Extraction and the Evaluation of Mass Movement Hazards in the Upper Catchment. Geosciences 2024, 14, 223. [Google Scholar] [CrossRef]
- Shen, Z.J.; Wang, D.; Arabameri, A.; Santosh, M.; Egbueri, J.C.; Arora, A. Landslide susceptibility assessment and mapping using new ensemble model. Adv. Space Res. 2024, 74, 2859–2882. [Google Scholar] [CrossRef]
- Pasang, S.; Kubíček, P. Landslide susceptibility mapping using statistical methods along the asian highway, Bhutan. Geosciences 2020, 10, 430. [Google Scholar] [CrossRef]
- Mersha, T.; Meten, M. GIS-based landslide susceptibility mapping and assessment using bivariate statistical methods in Simada area, northwestern Ethiopia. Geoenviron. Disasters 2020, 7, 20. [Google Scholar] [CrossRef]
- Putriani, E.; Wu, Y.M.; Chen, C.W.; Ismulhadi, A.; Fadli, D.I. Development of landslide susceptibility mapping with a multi-variance statistical method approach in Kepahiang Indonesia. Terr. Atmos. Ocean. Sci. 2023, 34, 18. [Google Scholar] [CrossRef]
- Reichenbach, P.; Rossi, M.; Malamud, B.D.; Mihir, M.; Guzzetti, F. A Review of Statistically-Based Landslide Susceptibility Models; Elsevier B.V.: Amsterdam, The Netherlands, 2018. [Google Scholar] [CrossRef]
- Ayalew, L.; Yamagishi, H. The application of GIS-based logistic regression for landslide susceptibility mapping in the Kakuda-Yahiko Mountains, Central Japan. Geomorphology 2005, 65, 15–31. [Google Scholar] [CrossRef]
- Dai, F.C.; Lee, C.F. Landslide Characteristics and Slope Instability Modeling Using GIS, Lantau Island, Hong Kong. Geomorphology 2002, 42, 213–228. [Google Scholar] [CrossRef]
- Lee, S.; Min, K. Statistical analysis of landslide susceptibility at Yongin, Korea. Environ. Geol. 2001, 40, 1095–1113. [Google Scholar] [CrossRef]
- Moore, I.D.; Grayson, R.B.; Ladson, A.R. Digital Terrain Modelling: A Review of Hydrological, Geomorphological, and Biological Applications. Hydrol. Process. 1991, 5, 3–30. [Google Scholar] [CrossRef]
- Beven, K.J.; Kirkby, M.J. A physically based, variable contributing area model of basin hydrology. Hydrol. Sci. Bull. 1979, 24, 43–69. [Google Scholar] [CrossRef]
- Montgomery, D.R.; Dietrich, W.E.; Torres, R.; Anderson, S.P.; Heffner, J.T.; Loague, K. Hydrologic response of a steep, unchanneled valley to natural and applied rainfall. Water Resour. Res. 1997, 33, 91–109. [Google Scholar] [CrossRef]
- Tarboton, D.G.; Bras, R.L.; Rodriguez-Iturbe, I. On the extraction of channel networks from digital elevation data. Hydrol. Process. 1991, 5, 81–100. [Google Scholar] [CrossRef]
- Ardizzone, F.; Esposito, G.; Cavalli, M.; Crema, S.; Fiorucci, F. Sediment connectivity as a key to understand geomorphic effects of the Storm Alex in two mountain catchments of the Mediterranean Alps (Italy). Geomorphology 2024, 455, 109176. [Google Scholar] [CrossRef]
- Iwahashi, J.; Pike, R.J. Automated classifications of topography from DEMs by an unsupervised nested-means algorithm and a three-part geometric signature. Geomorphology 2007, 86, 409–440. [Google Scholar] [CrossRef]
- Evdokimov, A.N.; Yosufzai, A. Geological Position of Rare-Metal Pegmatites of the Laghman Granitoid Complex, Afghanistan. Russ. J. Earth Sci. 2025, 25, 1–23. [Google Scholar] [CrossRef]
- Sergeeva, N.A.; Rizvanova, N.G.; Yosufzai, A.; Kuznetsov, A.B.; Skublov, S.G.; Galankina, O.L.; Evdokimov, A.N. The First Data on the Age of Spodumene Pegmatites from the Kolatan Deposit (Nuristan Province, Afganistan) on the Basis of U–Pb (ID-TIMS) Dating of Columbite. Dokl. Earth Sci. 2025, 522, 35. [Google Scholar] [CrossRef]
- Skublov, S.G.; Yosufzai, A.; Evdokimov, A.N.; Galankina, O.L. Composition of Cs-Rich Analcime in Spodumene Pegmatites of Afghanistan (Kolatan Deposit, Nuristan Province). Russ. Cent. Sci. Inf. 2024, 6, 122–140. [Google Scholar] [CrossRef]
- Akbar, A.Q.; Mitani, Y.; Nakanishi, R.; Honda, H.; Taniguchi, H. Development of a New Method for Debris Flow Runout Assessment in 0-Order Catchments: A Case Study of the Otoishi River Basin. Geosciences 2025, 15, 41. [Google Scholar] [CrossRef]
- Silalahi, F.E.S.; Pamela; Arifianti, Y.; Hidayat, F. Landslide susceptibility assessment using frequency ratio model in Bogor, West Java, Indonesia. Geosci. Lett. 2019, 6, 10. [Google Scholar] [CrossRef]
- Sheng, M.; Zhou, J.; Chen, X.; Teng, Y.; Hong, A.; Liu, G. Landslide Susceptibility Prediction Based on Frequency Ratio Method and C5.0 Decision Tree Model. Front. Earth Sci. 2022, 10, 918386. [Google Scholar] [CrossRef]
- Thapa, D.; Bhandari, B.P. GIS-Based Frequency Ratio Method for Identification of Potential Landslide Susceptible Area in the Siwalik Zone of Chatara-Barahakshetra Section, Nepal. Open J. Geol. 2019, 09, 873–896. [Google Scholar] [CrossRef]
- Pradhan, B.; Lee, S. Delineation of landslide hazard areas on Penang Island, Malaysia, by using frequency ratio, logistic regression, and artificial neural network models. Environ. Earth Sci. 2010, 60, 1037–1054. [Google Scholar] [CrossRef]
- Habumugisha, J.M.; Chen, N.; Rahman, M.; Islam, M.; Ahmad, H.; Elbeltagi, A.; Sharma, G.; Liza, S.N.; Dewan, A. Landslide Susceptibility Mapping with Deep Learning Algorithms. Sustainability 2022, 14, 1734. [Google Scholar] [CrossRef]
- Getachew, N.; Meten, M. Weights of evidence modeling for landslide susceptibility mapping of Kabi-Gebro locality, Gundomeskel area, Central Ethiopia. Geoenviron. Disasters 2021, 8, 6. [Google Scholar] [CrossRef]
- Chen, W.; Sun, Z.; Han, J. Landslide susceptibility modeling using integrated ensemble weights of evidence with logistic regression and random forest models. Appl. Sci. 2019, 9, 171. [Google Scholar] [CrossRef]
- Youssef, A.M.; Pradhan, B.; Jebur, M.N.; El-Harbi, H.M. Landslide susceptibility mapping using ensemble bivariate and multivariate statistical models in Fayfa area, Saudi Arabia. Environ. Earth Sci. 2015, 73, 3745–3761. [Google Scholar] [CrossRef]
- Pourghasemi, H.R.; Rahmati, O. Prediction of the landslide susceptibility: Which algorithm, which precision? Catena 2018, 162, 177–192. [Google Scholar] [CrossRef]
- Regmi, N.R.; Giardino, J.R.; Vitek, J.D. Modeling susceptibility to landslides using the weight of evidence approach: Western Colorado, USA. Geomorphology 2010, 115, 172–187. [Google Scholar] [CrossRef]
- Wang, G.; Lei, X.; Chen, W.; Shahabi, H.; Shirzadi, A. Hybrid computational intelligence methods for landslide susceptibility mapping. Symmetry 2020, 12, 325. [Google Scholar] [CrossRef]
- Bhandari, B.P.; Dhakal, S.; Tsou, C.Y. Assessing the Prediction Accuracy of Frequency Ratio, Weight of Evidence, Shannon Entropy, and Information Value Methods for Landslide Susceptibility in the Siwalik Hills of Nepal. Sustainability 2024, 16, 2092. [Google Scholar] [CrossRef]
- Yilmaz, I. Landslide susceptibility mapping using frequency ratio, logistic regression, artificial neural networks and their comparison: A case study from Kat landslides (Tokat-Turkey). Comput. Geosci. 2009, 35, 1125–1138. [Google Scholar] [CrossRef]
- Rabby, Y.W.; Li, Y. Landslide susceptibility mapping using integrated methods: A case study in the chittagong hilly areas, Bangladesh. Geosciences 2020, 10, 483. [Google Scholar] [CrossRef]
- Zhou, X.; Wen, H.; Zhang, Y.; Xu, J.; Zhang, W. Landslide susceptibility mapping using hybrid random forest with GeoDetector and RFE for factor optimization. Geosci. Front. 2021, 12, 101211. [Google Scholar] [CrossRef]
- Abdelkader, M.M.; Csámer, Á. Comparative assessment of machine learning models for landslide susceptibility mapping: A focus on validation and accuracy. Nat. Hazards 2025, 121, 10299–10321. [Google Scholar] [CrossRef]
- Giannini, L.M.; Varone, C.; Esposito, C.; Marmoni, G.M.; Mugnozza, G.S.; Schilirò, L. Earthquake-induced reactivation of landslides under variable hydrostatic conditions: Evaluation at regional scale and implications for risk assessment. Landslides 2022, 19, 2005–2019. [Google Scholar] [CrossRef]
Figure 1.
Study area location map.
Figure 1.
Study area location map.
Figure 2.
Illustrates the classified terrain-related conditioning factors where (a) Slope, (b) Aspect, (c) Curvature, (d) TWI, and (e) SPI.
Figure 2.
Illustrates the classified terrain-related conditioning factors where (a) Slope, (b) Aspect, (c) Curvature, (d) TWI, and (e) SPI.
Figure 3.
Illustrates hydrological and geomorphological classified layer. (a) Drainage, (b) Chenal Head Points, (c) Catchment (Consists of approximately 0 order basin and 1st order basin), (d) Landform.
Figure 3.
Illustrates hydrological and geomorphological classified layer. (a) Drainage, (b) Chenal Head Points, (c) Catchment (Consists of approximately 0 order basin and 1st order basin), (d) Landform.
Figure 4.
Illustrates 1:200,000 geological map of the study area.
Figure 4.
Illustrates 1:200,000 geological map of the study area.
Figure 5.
Illustrates the critical slip surface or source of landslide used in past incidents.
Figure 5.
Illustrates the critical slip surface or source of landslide used in past incidents.
Figure 6.
Bivariate preprocessor algorithm.
Figure 6.
Bivariate preprocessor algorithm.
Figure 7.
Illustrate the result of FR and WOE for each factor.
Figure 7.
Illustrate the result of FR and WOE for each factor.
Figure 8.
Spatial distribution of landslide susceptibility based on the FR analysis.
Figure 8.
Spatial distribution of landslide susceptibility based on the FR analysis.
Figure 9.
Spatial distribution of landslide susceptibility based on the WOE analysis.
Figure 9.
Spatial distribution of landslide susceptibility based on the WOE analysis.
Figure 10.
Multivariate preprocessor algorithm.
Figure 10.
Multivariate preprocessor algorithm.
Figure 11.
Illustrate the Logistic Regression (LR) coefficient values for the landslide conditioning factors.
Figure 11.
Illustrate the Logistic Regression (LR) coefficient values for the landslide conditioning factors.
Figure 12.
Landslide susceptibility map generated using Logistic Regression (LR) analysis.
Figure 12.
Landslide susceptibility map generated using Logistic Regression (LR) analysis.
Figure 13.
Landslide susceptibility map generated using the integrated LR + FR method.
Figure 13.
Landslide susceptibility map generated using the integrated LR + FR method.
Figure 14.
Landslide susceptibility map generated using the integrated LR + WoE method.
Figure 14.
Landslide susceptibility map generated using the integrated LR + WoE method.
Figure 15.
Performance metrics (Success Rate, False Alarm Rate, and Missed Alarm Rate) plotted against threshold (TH) values. The red dashed line marks the threshold at which SR is maximized. The green and yellow shaded areas represent threshold ranges of +10% and +25% from the optimal threshold, respectively. (A) Result of FR, (B) Result of WOE, (C) Result of LR, (D) Result of LR + FR, (E) Result of LR + WOE, and (F) Comparison of the results obtained from all methods.
Figure 16.
Illustrates the results of the combined LR and FR method with the high-risk zone defined.
Figure 16.
Illustrates the results of the combined LR and FR method with the high-risk zone defined.
Table 1.
Contingency table is used to validate the result.
Table 1.
Contingency table is used to validate the result.
| | Predicted |
| | Landslide | Non Landslide |
| Actual | Landslide | Success (A) | Miss Alarm (B) |
| Non Landslide | False Alarm(C) | Success (A) |
| Disclaimer/Publisher’s Note: The statements, opinions and data contained in all publications are solely those of the individual author(s) and contributor(s) and not of MDPI and/or the editor(s). MDPI and/or the editor(s) disclaim responsibility for any injury to people or property resulting from any ideas, methods, instructions or products referred to in the content. |
© 2025 by the authors. Licensee MDPI, Basel, Switzerland. This article is an open access article distributed under the terms and conditions of the Creative Commons Attribution (CC BY) license (https://creativecommons.org/licenses/by/4.0/).

