Article

Spatial Distribution, Key Influencing Factors, and Ecological Risk of Microplastics in Pearl River Estuary Water and Sediments

School of Civil and Transportation Engineering, Guangdong University of Technology, Guangzhou 510006, China
*
Author to whom correspondence should be addressed.
Water 2025, 17(17), 2572; https://doi.org/10.3390/w17172572
Submission received: 21 July 2025 / Revised: 28 August 2025 / Accepted: 29 August 2025 / Published: 31 August 2025

Abstract

Microplastic (MP) pollution in aquatic ecosystems poses significant ecological and public health risks. A comprehensive understanding of estuarine MP pollution, influenced by multiple anthropogenic and environmental factors, remains elusive in current research. This study investigated the spatial distribution patterns and dominant factors influencing MP abundance (MPA) and physicochemical diversity in the river water and sediments of the Pearl River Estuary (PRE), while also assessing the associated ecological risks. The dominant MP categories in river water and sediments were fibers, clear in color, <1 mm in length, and composed of polyethylene terephthalate and polypropylene. Whereas inland regions showed higher MPA, nearshore regions exhibited marginally greater physicochemical diversity. Multivariate statistical analysis identified population density as the primary driver of both MPA in river water and MP physicochemical diversity in sediments. MP physicochemical diversity in river water was predominantly governed by the synergistic effect of salinity and the vegetation land. MPA in sediments depended on the synergistic effect of flow rate and watershed area. Ecological risk assessment identified elevated risks in the eastern study area driven by the presence of polymethyl methacrylate. This study establishes a scientific basis for PRE region MP management and provides global comparative data for estuarine MP research.

1. Introduction

Microplastics (MPs), conventionally defined as plastic particles <5 mm in diameter [1], have emerged as pervasive environmental contaminants, demonstrating ubiquitous presence across diverse aquatic systems including groundwater, marine, fluvial, lacustrine, and wetland ecosystems [2,3,4,5]. Global estimates suggest cumulative MP emissions into surface waters exceed 236,000 metric tons, originating from multiple anthropogenic pathways including industrial effluent, municipal wastewater, agricultural plastic degradation, and tire wear particles, with current trends indicating accelerating contamination rates [6,7,8,9,10]. MPs bioaccumulate through trophic transfer and ultimately enter the human body via dietary exposure [11], leading to irreversible damage to the circulatory, respiratory, digestive, and reproductive systems [12,13,14]. Furthermore, MPs transport both intrinsic additives and adsorbed environmental pollutants, which are released during ingestion [15]. This bio-accessible release triggers chemical toxicity through endocrine disruption and oxidative stress, amplifying ecological and health risks in aquatic systems [16]. In light of MPs environmental persistence and complex source matrices, systematic quantification of their fate, migrated mechanisms, and cumulative ecological impacts has become a research priority.
Estuaries serve as critical interfaces between terrestrial and marine ecosystems, functioning as major pathways for land-to-ocean MPs transfer [17,18]. These dynamic transition zones also act as significant MP accumulation hotspots due to concentrated anthropogenic pressures from coastal development and riverine inputs [19,20]. Estuarine MP abundance (MPA) is strongly mediated by watershed characteristics, with land use patterns and urbanization degree dictating terrestrial MP inputs through their control of pollution source distribution [21,22]. Concurrently, hydrological dynamics and water chemistry parameters govern MPs spatial distribution by regulating particle transport pathways, aggregation behavior, and depositional patterns within the estuarine environment [23,24]. However, current research on estuarine MPs remains predominantly focused on analyzing single influencing factors (IFs) in isolation, neglecting the complex synergistic or antagonistic interactions among multiple environmental drivers [25,26,27].
The degree of MP pollution in estuarine systems exhibits significant global variability, as evidenced by comparative studies [28,29,30]. The Pearl River Estuary (PRE), ranking as China’s second-largest estuary by discharge volume, receives substantial MPs from its densely urbanized watershed, with annual inputs exceeding 1100 metric tons [31]. This massive MPs influx not only jeopardizes regional potable water supplies and commercial fisheries [32,33], but also contributes disproportionately to the South China Sea’s marine plastic burden [34]. This study hypothesizes that the distribution and ecological risk of MPs in estuarine regions are not governed by single environmental drivers but emerge from the complex synergies between land use type, urbanization degree, hydrology, and water chemistry. Specifically, these interacting factors will jointly dictate both the abundance and the physicochemical diversity of MPs, thereby amplifying the overall ecological risk in the estuary. Consequently, this study systematically collects river water and co-located sediment samples from the PRE region to (1) characterize the spatial distribution of MPs in both river water and sediments; (2) quantify the relative contributions and interaction effects of various IFs on both MPA and MP physicochemical diversity; and (3) perform ecological risk assessment incorporating polymer-specific toxicity thresholds for estuarine biota. This study establishes a scientific basis for MP pollution control strategies in the PRE region, while generating a benchmark dataset for comparative analyses of estuarine MP distribution globally.

2. Study Area and Data Source

2.1. Study Area

The study area (113°00′ E–113°40′ E, 22°00′ N–22°30′ N) occupies the western shore of the PRE region. It encompasses the urban core of Zhuhai City, southern Zhongshan City, and eastern Jiangmen City, forming a critical component of the western Guangdong-Hong Kong-Macao Greater Bay Area. The terrain consists of Quaternary silty alluvial plains in the river delta, interspersed with low hills and coastal wetlands, forming a continuous terrestrial-marine transition zone. The area experiences a subtropical monsoon climate, with most precipitation occurring between April and September. Located in the lower reaches of the Xijiang River mainstream, the area receives an average annual river discharge of approximately 230 billion m3. As a densely populated region, the study area recorded a permanent resident population of 7.18 million in 2021 (National Bureau of Statistics data, http://www.stats.gov.cn/), with key industries including textile manufacturing, packaging industry, coastal fisheries, and maritime shipping.

2.2. MPs Sampling and Testing

In 2021, a total of 20 paired river water and sediment samples were collected from the study area. The 5 km buffer is a widely adopted distance in hydrological and land use studies for capturing critical environmental gradients and anthropogenic pressures [35,36,37,38]. Therefore, a 5 km buffer was applied to distinguish nearshore and inland regions in this study (Figure 1). At each sampling site, duplicate 1 L river water samples were filtered on-site using 400-mesh stainless steel sieves. The filtered residue was rinsed with ultrapure water, sealed in 50 mL pre-cleaned amber glass bottles, and transported to the laboratory within 48 h for refrigeration at 4 °C. Salinity (SAL), total dissolved solids (TDSs), and potential of hydrogen (pH) were measured in situ simultaneously with river water collection using a portable multiparameter probe (Aqua TROLL400, In-Situ Inc., Fort Collins, CO, USA). Concurrently, duplicate 1 kg sediment samples were collected using a stainless steel trowel, sealed in aluminum foil pouches, and transported alongside the water samples.
MPs in river water samples were initially vacuum-filtered through a 0.45 μm glass fiber filter. The filtered residue was then transferred to an evaporating dish, and 30% hydrogen peroxide was added to dissolve the organic matter in the residue [39]. After a 24 h incubation, the mixture was re-filtered through a glass fiber filter and subsequently dried in an oven at 60 °C. Finally, the dried residue was stored in a filter storage case for further analysis [40]. For sediment MP samples, pretreatment was conducted following a density-based separation protocol adapted from previous studies [41]. Briefly, the samples were dried to a constant weight in an oven at 60 °C and then homogenized. Next, a saturated NaCl solution (1.2 g/cm3) was added to the sample, and the mixture was stirred thoroughly with a glass rod until the sediment was well-dispersed in the solution; the mixture was then centrifuged for 10 min. Finally, the post-centrifugation supernatant was vacuum-filtered onto a glass fiber filter, resulting in a filter containing suspected MPs. To avoid contamination, the filters were carefully stored in filter storage cases until further analysis.
To prevent sample contamination by environmental MPs, all laboratory analyses were conducted in closed laboratories equipped with laminar flow hoods. The MP content in ultrapure water was quantified before the experiment; vacuum filtration of 2 L of ultrapure water yielded 0 n/L. During the experiment, all researchers wore cotton laboratory coats and nitrile gloves, and laboratory windows remained closed to prevent contamination. Additionally, to minimize visual counting errors, each sample was enumerated at least three times, and the MP separation step was repeated thrice. Once all samples were available for analysis, suspected MPs in the filters were screened using a stereomicroscope (CX43, Olympus, Tokyo, Japan) and identified with a Fourier Transform Infrared (FTIR) spectrometer (Nicolet iN10, Thermo Fisher Scientific, Waltham, MA, USA). Acquired spectra were further compared with polymer spectra in the OMNIC Spectra database to identify MPs. A similarity score >70% was considered indicative of MP presence. The obtained IR spectra and their comparison with standard polymer spectra are provided in Supplementary Materials Figure S1. The total abundance of all MP types was then recorded as MPA, and results from two parallel samples at each sampling site were averaged.

2.3. IFs Data and Characteristics

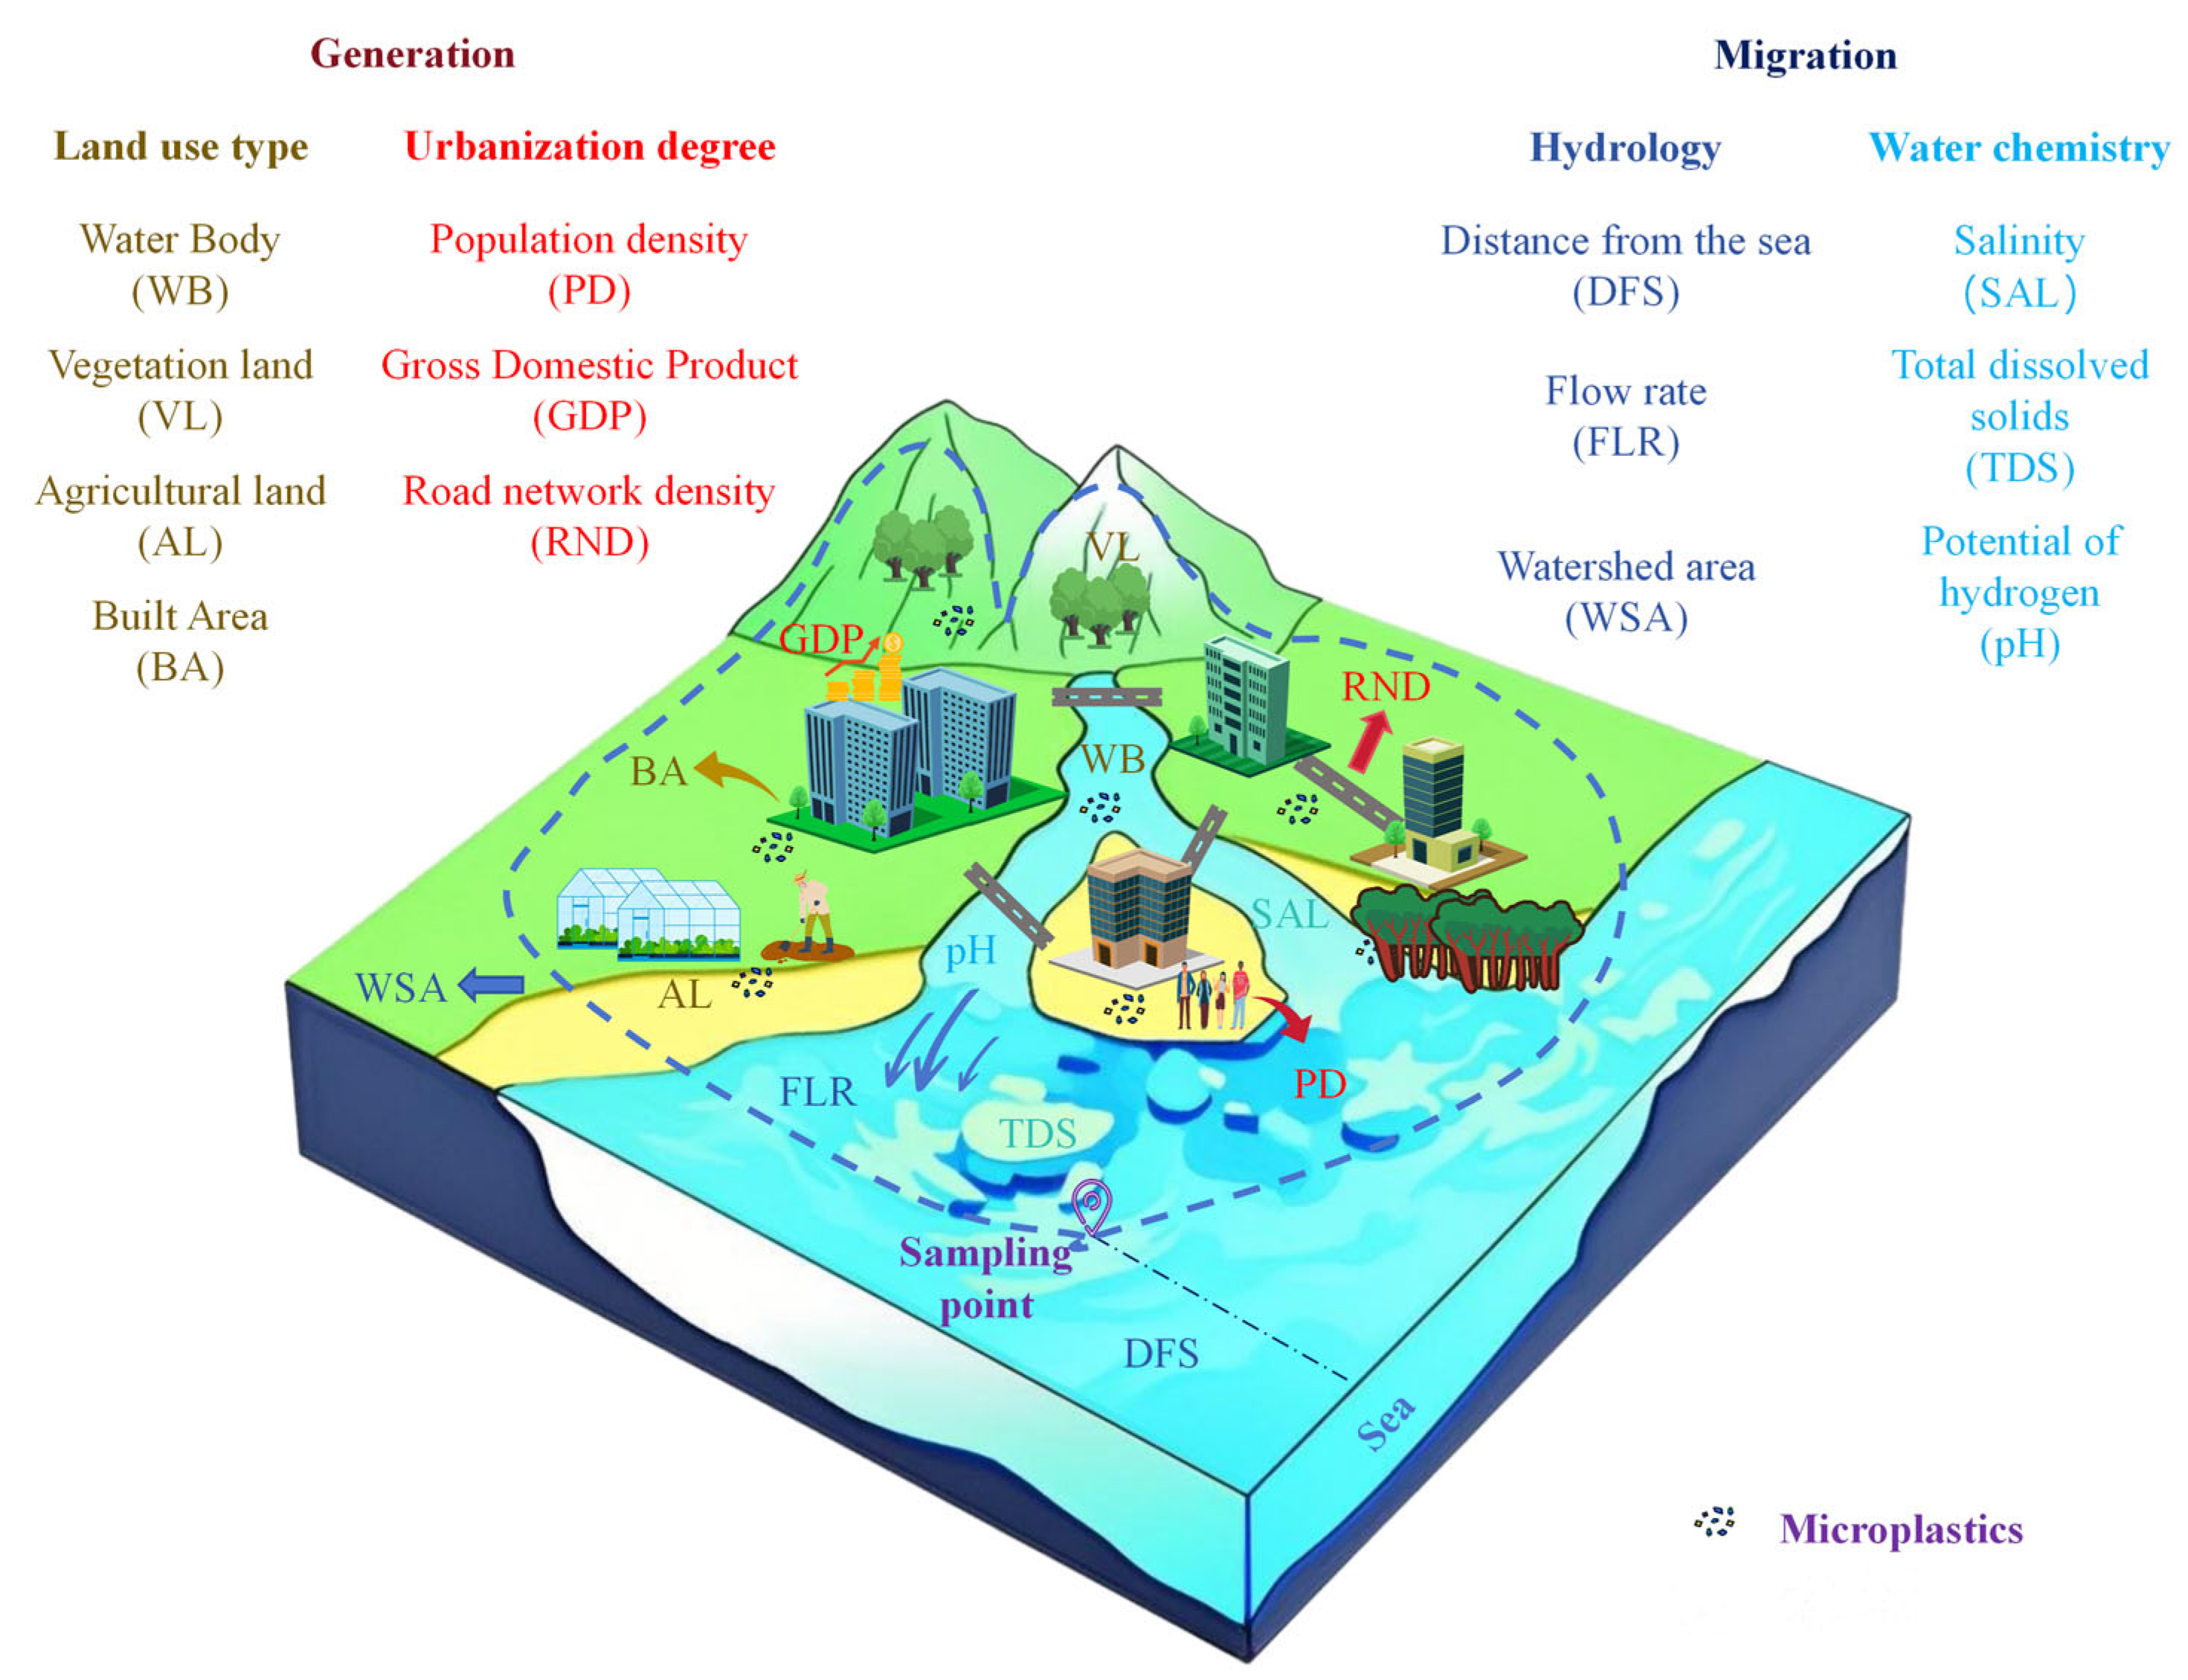
To elucidate the regulatory mechanisms of MP distribution in the PRE region, this study classified IFs according to a generation–migration framework quantified in Figure 2. Land use types and urbanization degree IFs primarily govern MP generation. Specifically, agricultural land (AL), vegetation land (VL), water body (WB), and built areas (BAs) directly affect MPs emissions from agriculture, forestry, and industrial activities [42,43]. Concurrently, urbanization degree IFs including population density (PD), gross domestic product (GDP), and road network density (RND) further modulate anthropogenic MP inputs [44,45,46]. In contrast, hydrology and water chemistry IFs control MP migration processes. Key hydrological drivers such as distance to the sea (DFS), flow rate (FLR), and watershed area (WSA) influence MPs migration through river networks [47,48,49]. Water chemistry parameters, including SAL, TDS, and pH, influence MP settling and aggregation [16,50,51]. Detailed information on the IFs (including the processes involved, categories, descriptions, data sources, and resolution) can be found in Supplementary Materials Table S1. All hydrology IFs were calculated using the hydrological analysis tool in ArcMap 10.8, and the resolution of Digital Elevation Model (DEM) data used for the calculation was 30 m (data source: http://www.gscloud.cn). The testing results of chemical characteristics mentioned before were used as the water chemistry parameters in this study.
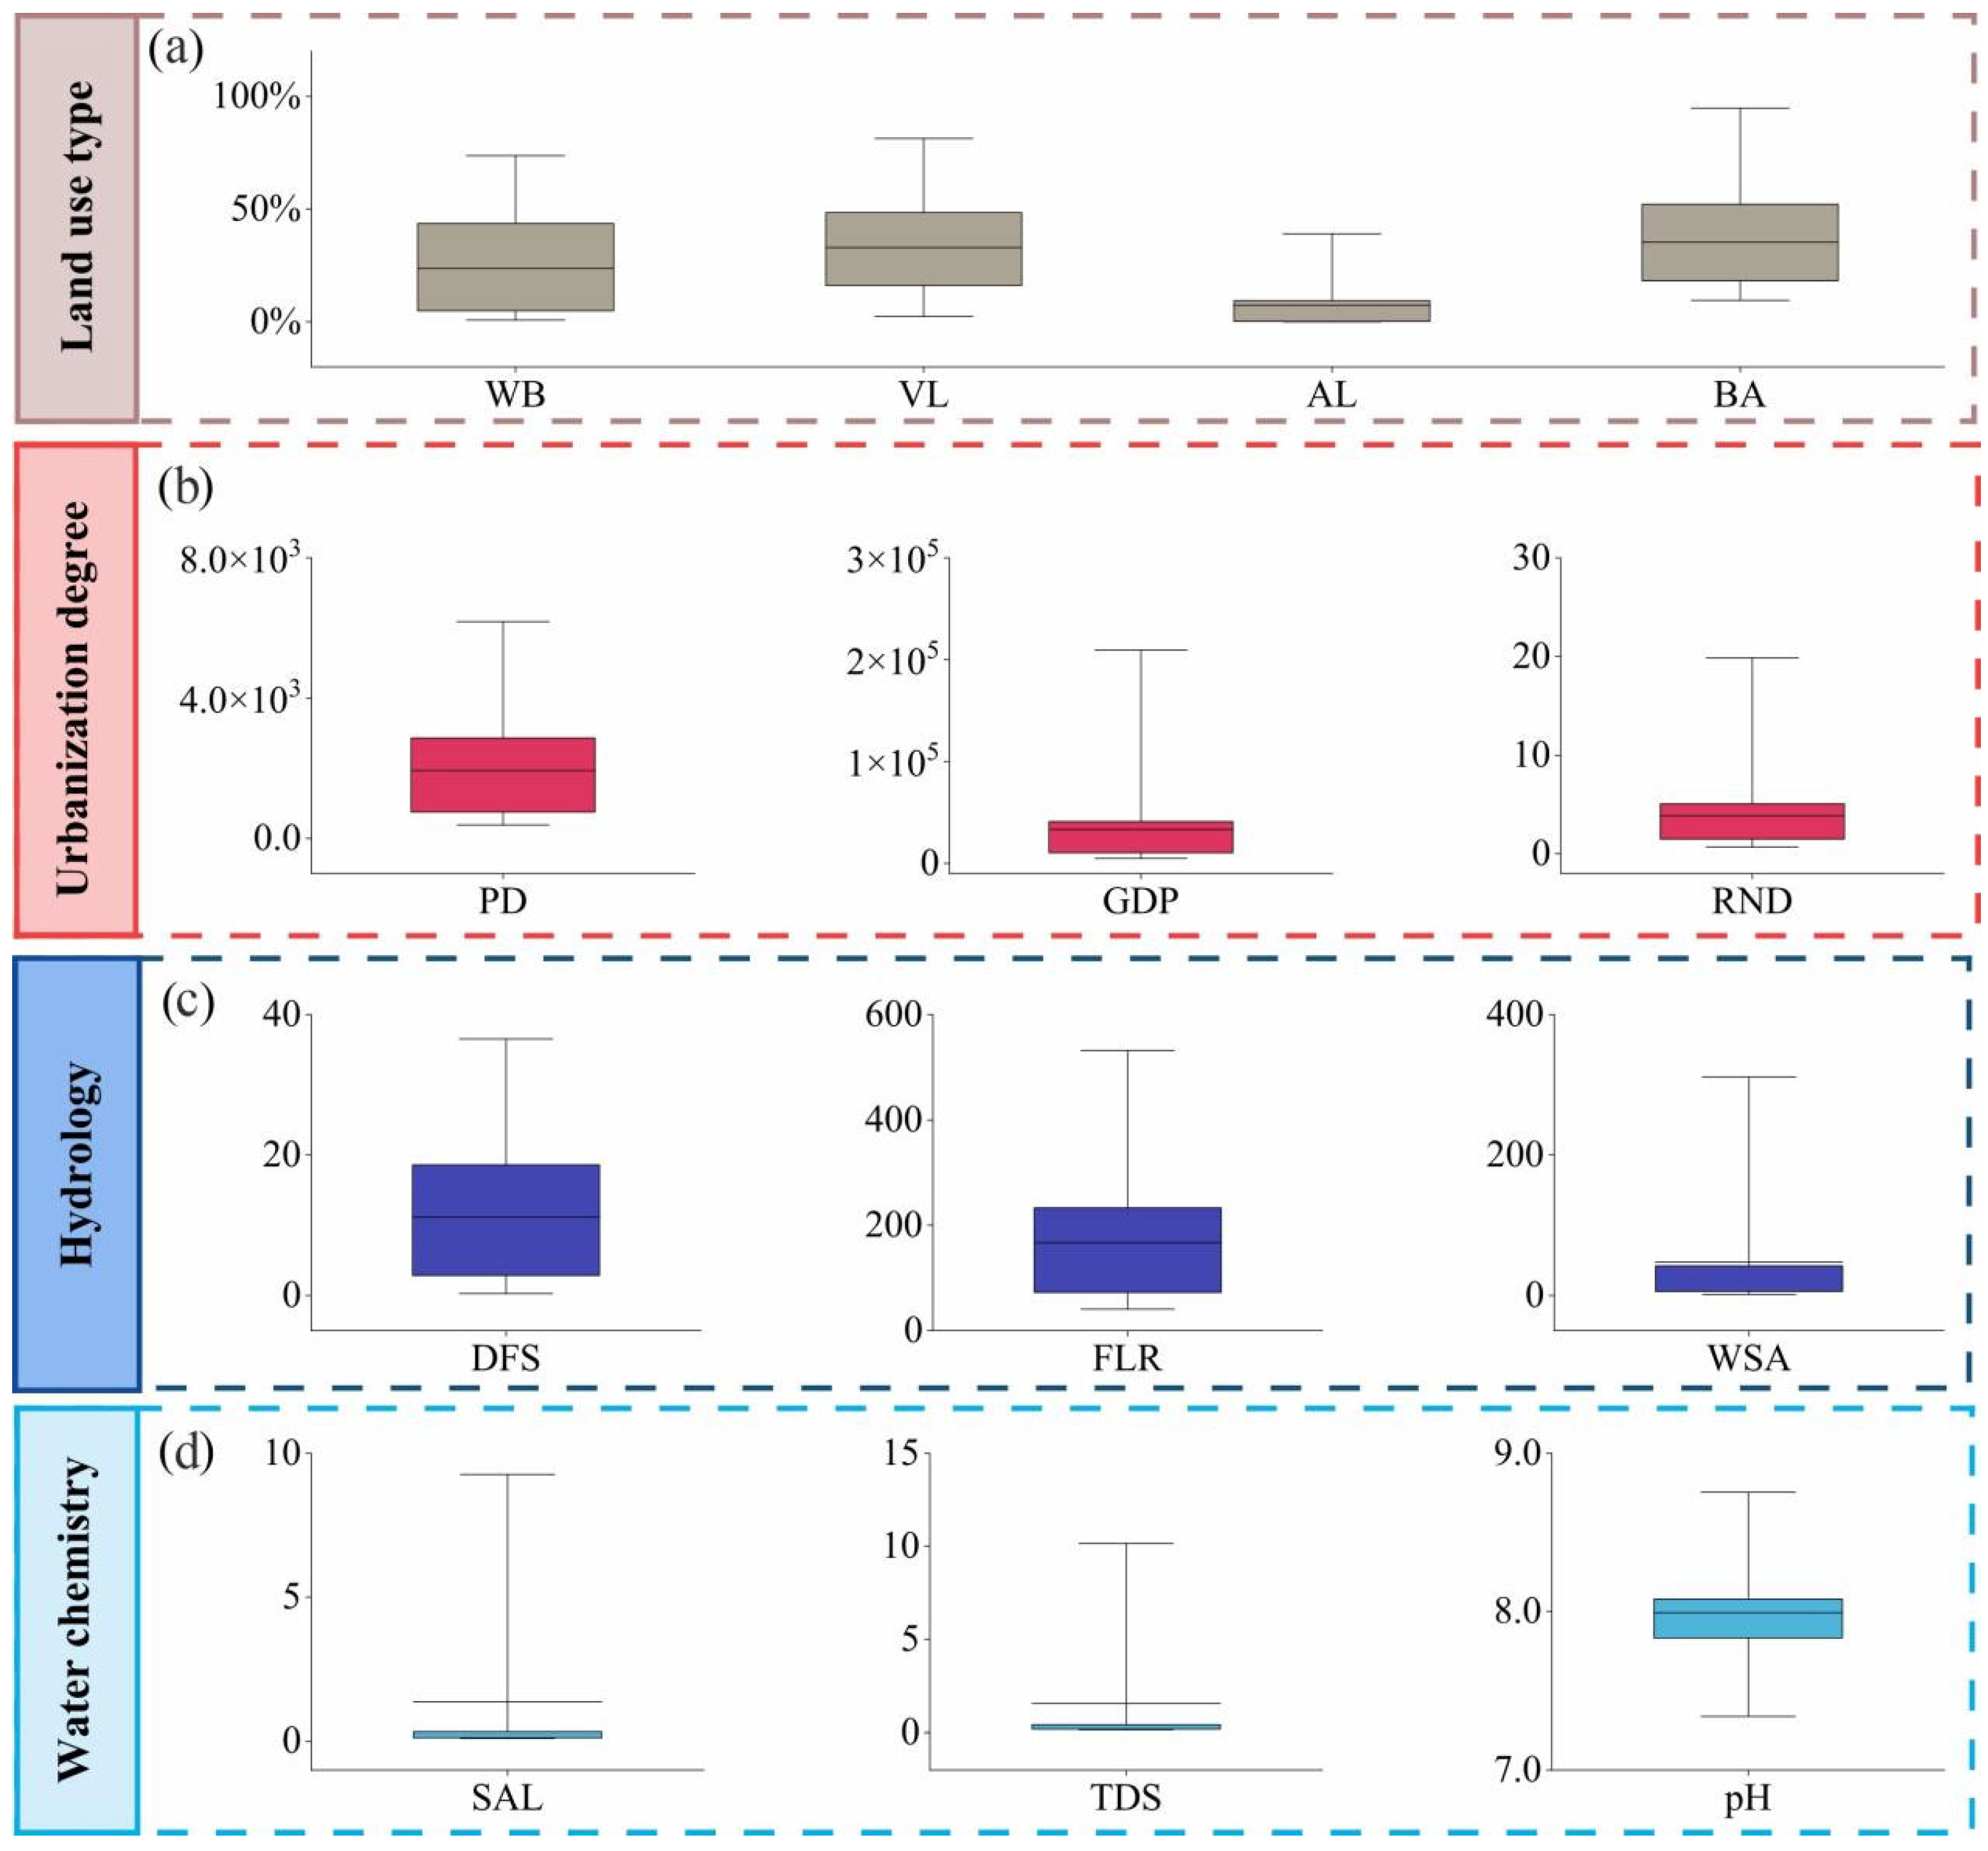
The statistical characteristics of four types of IFs were shown in Figure 3. Land use IFs exhibited substantial value ranges, with the exception of AL, which was concentrated at lower values (Figure 3a). Urbanization degree IFs data displayed clustered distributions with disproportionately high maximum values (Figure 3b). This statistical distribution resulted from the socioeconomic agglomeration and industrial clustering in the Pearl River Delta, which influences PD, GDP, and RND distribution [52,53]. Regarding hydrology IFs, DFS data are relatively evenly distributed, whereas FLR and WSA data exhibit clustered patterns with lower value ranges (Figure 3c). This statistical distribution is associated with the placement of sampling sites along the main river channels and tributaries. Among water chemistry IFs, SAL and TDS concentrate in lower ranges under limited oceanic influence, contrasting with uniformly distributed pH (Figure 3d). The pronounced variability observed across the various IFs provides robust support for multivariate statistical analysis.

3. Analytical Methods

3.1. Microplastic Diversity Integrated Index (MDII)

The Simpson diversity index (SDI) is a comprehensive tool for assessing species richness and evenness [54]. With the proposal of the concept of “microplastic communities”, SDI is commonly used to assess MP diversity in microplastic communities [55,56,57]. In this study, MPs in river water and sediment were defined as two communities. Each community was characterized by four diversity dimensions: microplastic shape (MPS), microplastic color (MPC), microplastic length (MPL), and microplastic polymer type (MPT). The MDII integrates these four dimensions to reflect MP community composition and the number of pollution sources [58]. The calculation of SDI and MDII is shown in Equations (1) and (2).
S D I = 1 ( n i N ) 2
M D I I = S D I s h a p e × S D I c o l o r × S D I l e n g t h × S D I p o l y m e r 1 / 4
where ni represents the number of MPs within the ith category (e.g., color, shape, length, and polymer type) and N is the total number of MPs analyzed. SDIshape, SDIolor, SDIlength, and SDIpolymer represent the SDI values of shape, color, length, and polymer type, respectively, and are denoted as MPS’, MPC’, MPL’, and MPT’ in this study. The SDI and MDII have values in the range from 0 to 1.

3.2. Multivariate Statistical Analysis Methods

Three multivariate statistical methods were adopted in a tiered framework to address collinearity and robustly identify key factors controlling MPA and MDII. Redundancy Analysis was first employed to visualize the overall multivariate relationships between all IFs and the two response variables (MPA and MDII). Subsequently, Partial Least Squares Regression was applied to filter key IFs from the multicollinear dataset. Finally, Ridge Regression was utilized to quantify the precise contributions of these key IFs and their interactions.

3.2.1. Redundancy Analysis (RDA)

RDA, as an extension of multiple regression, integrates the strengths of principal component analysis and can handle multiple explanatory variables and multiple response variables simultaneously [59]. The Variance Inflation Factor (VIF) served as the standard diagnostic tool for detecting variable collinearity [60]. This study applied RDA to examine the correlations between IFs and both MPA and MDII. The VIF was computed within the RDA framework to diagnose multicollinearity among all IFs prior to variable selection.

3.2.2. Partial Least Squares Regression (PLSR)

PLSR offers a significant advantage when dealing with multicollinear data in small-sample scenarios [61,62]. Consequently, PLSR has been widely applied in environmental pollutant detection and analysis [63,64]. In PLSR models, Variable Importance in the Projection (VIP) has been widely used to quantify the relative contribution of variables in predicting responses [65,66]. This index serves as a key variable selection tool, retaining features with VIP >1 [67]. In this study, all IFs were included in the initial PLSR model. Key IFs were then selected based on a VIP threshold of >1.

3.2.3. Ridge Regression (RR)

RR mitigates multicollinearity effects through its L2 penalty [68], proving particularly suitable for analyses containing interaction terms [69]. The weight coefficient (β) of RR models has been applied to quantify contributions of predictors and their interactions to pollutant dynamics [70]. In this study, pairwise interaction terms were generated between key IFs (pre-selected by PLSR) that exhibited severe collinearity (VIF > 10). These key IFs and their interaction terms were then jointly analyzed using RR to determine their individual and interactive effects on MPA and MDII.

3.3. Ecological Risk Assessment

3.3.1. Pollution Load Index (PLI)

PLI is a quantitative index that indicates the degree of pollution caused by MPs. It considers the MPA and the potential risks it poses to the environment. The calculation of PLI is shown in Equations (3) and (4).
C F i = C i / C 0 i
P L I i = C F i
where PLIi represents the pollution load of MPs at each sampling site, CFi represents the pollution load factor of MPs at the sampling site, Ci is the MPA at the sampling site, and C0i is the minimum MPA in the sample. The risk category is classified into five levels based on its corresponding values of the pollution load index (Supplementary Materials Table S2).

3.3.2. Polymer Hazardous Index (PHI)

PHI is a method developed by Lithner et al. [71] to assess the potential ecotoxicological risks posed by diverse polymers, which has been validated and applied in recent regional risk assessments [72,73,74]. The calculation of PHI is shown in Equation (5).
P H I i = i = 1 n P i × S i
where Pi is the proportion of each polymer at each sampling site. Si is the hazard score of polymer types of MPs derived from Lithner et al. [71]. The hazard scores of several common polymers were given in Supplementary Materials Table S3. PHIi represents the combined polymer risk factor for MPs at a given sampling site. The PHI evaluation criteria are shown in Supplementary Materials Table S2.

3.3.3. Polymer Ecological Risk Index (PERI)

PERI is a method developed to evaluate the potential ecological risk associated with MPs. It integrates the MPA and MP toxicity and persistence. The calculation of PERI is shown in Equations (6) and (7).
C F i = C i / C 0 i
P E R I i = C F i × P H I i
where PERIi represents the potential ecological risk of MPs at each sampling site. Similar to PLI and PHI, CFi and PHIi, respectively, denote the pollution load factor and the polymer risk index at the sampling site. The PERI evaluation criteria are shown in Supplementary Materials Table S2.

4. Results and Discussion

4.1. Spatial Distribution of MPs in the River Water and Sediments

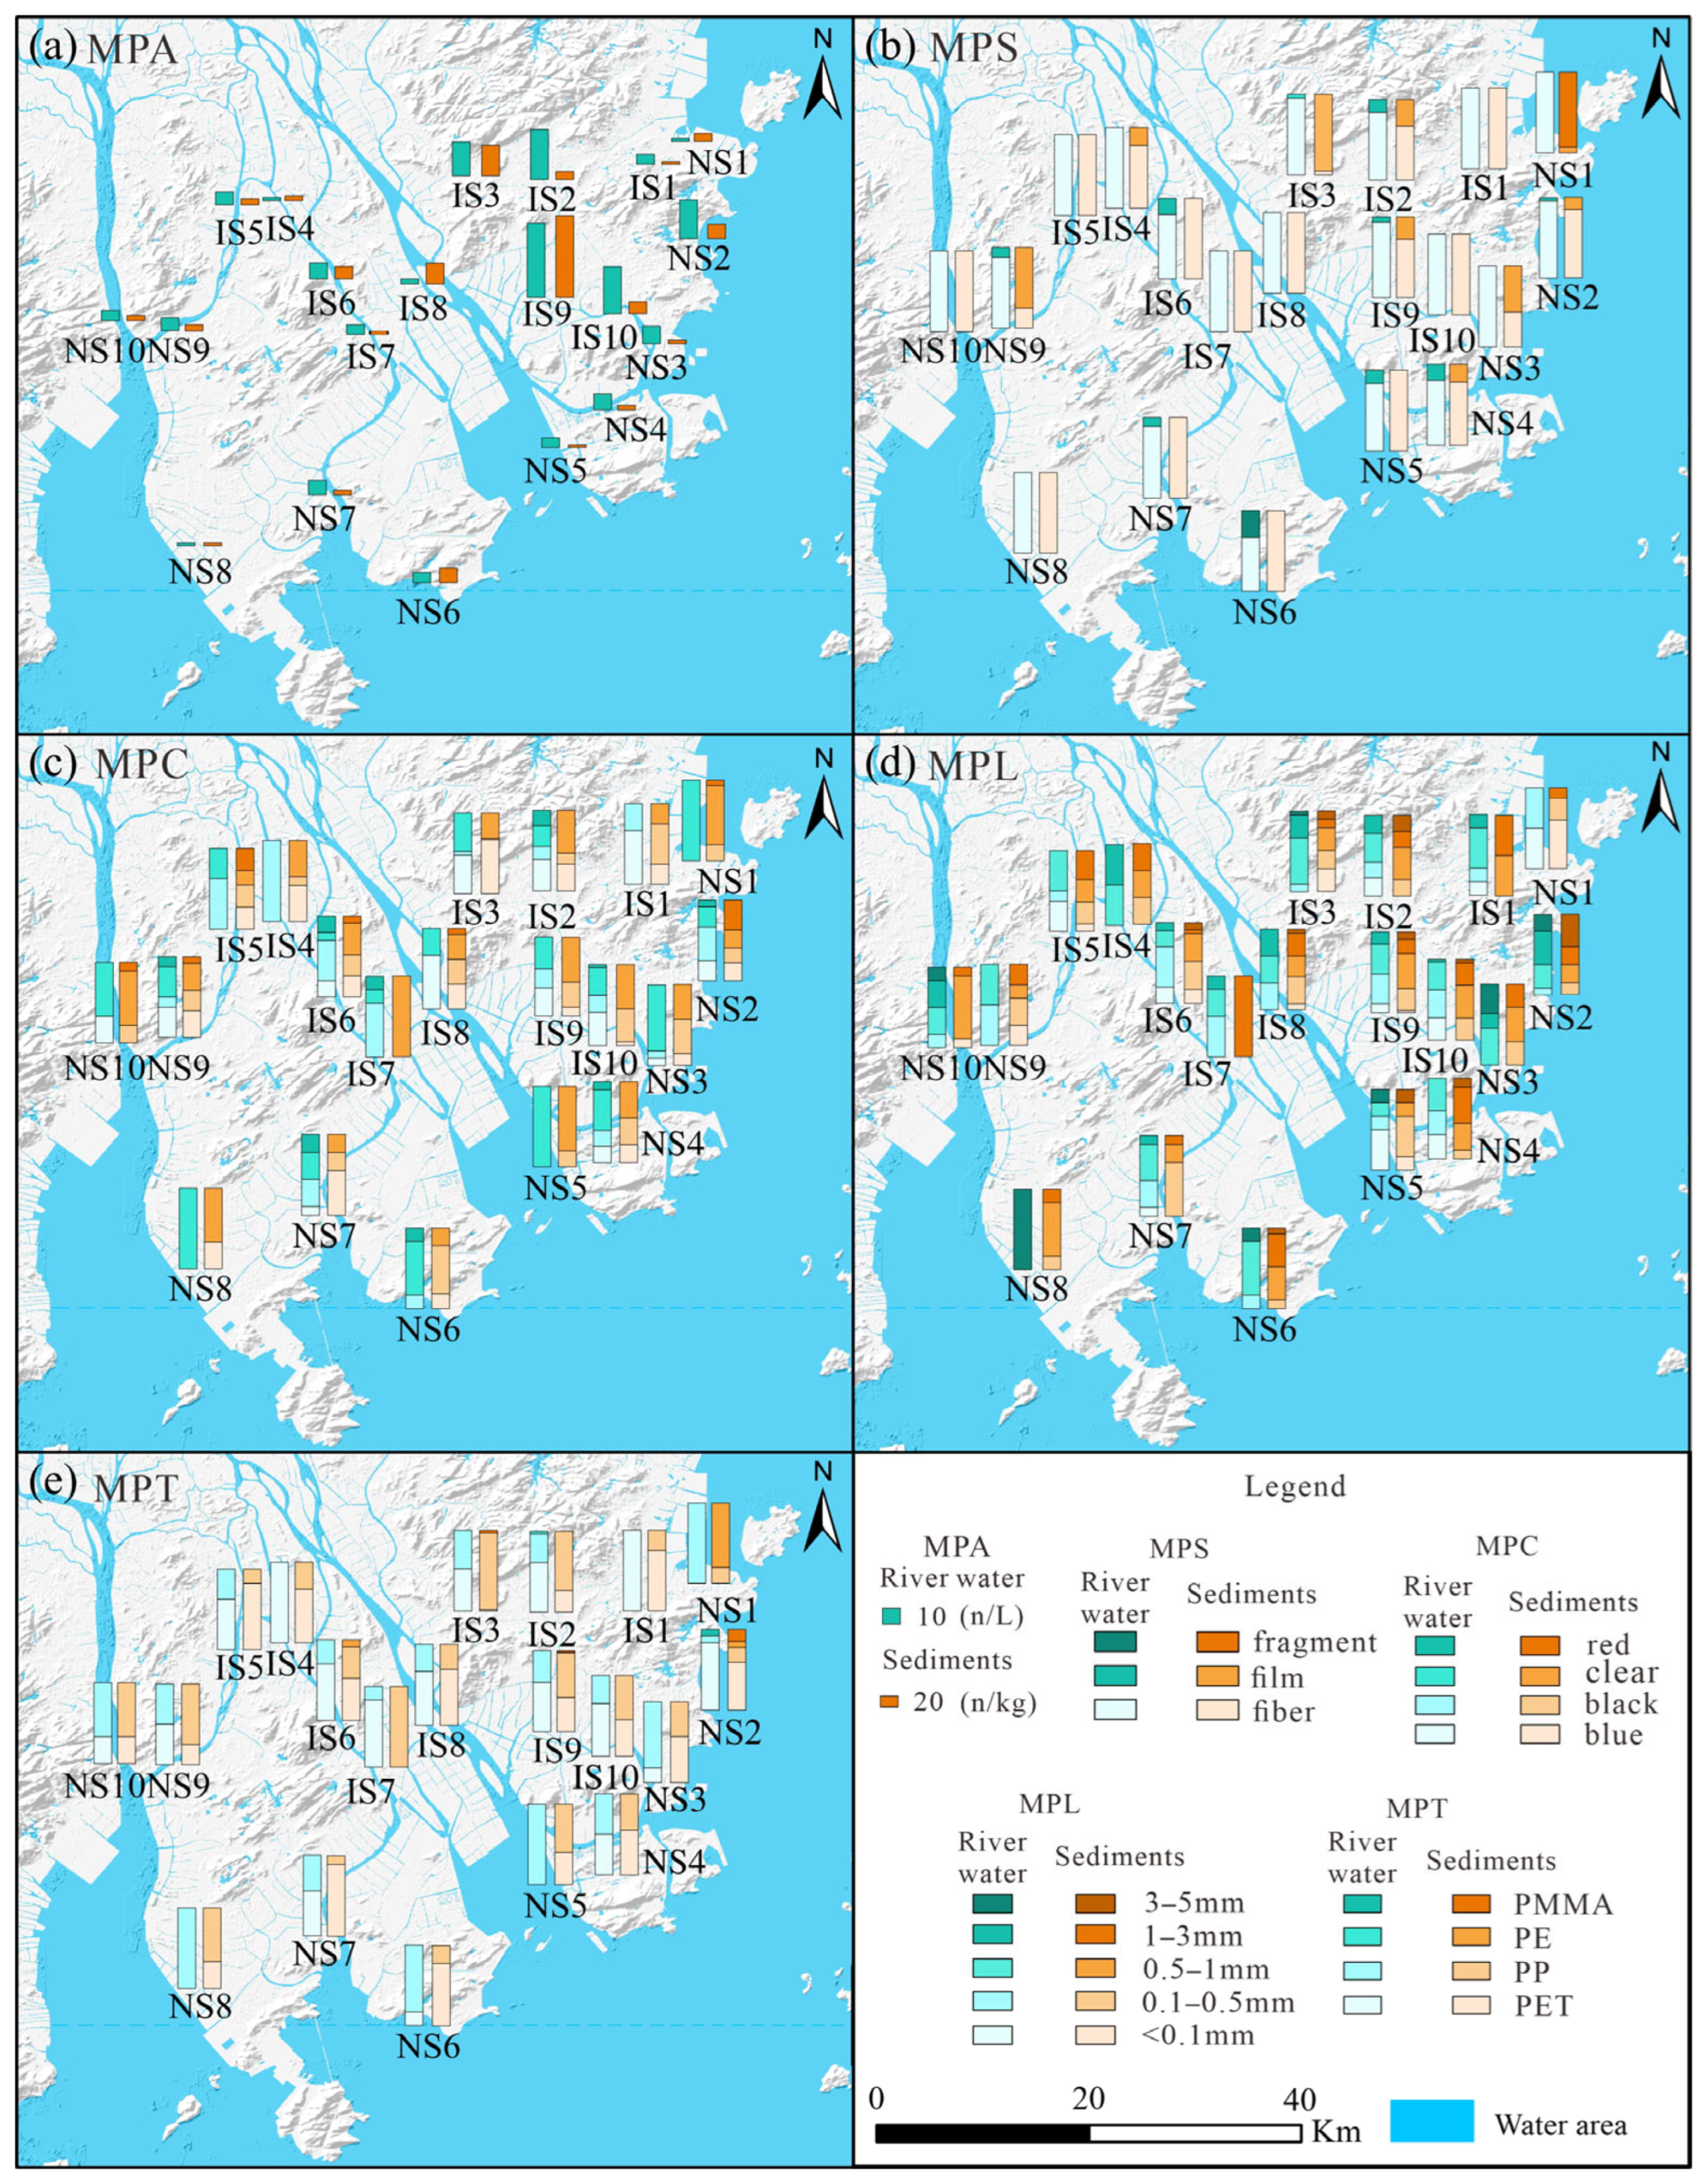
MPs were detected in river water and sediments at all sampling sites in the PRE region (Figure 4). MPA values in both river water and sediments were higher in inland regions than in nearshore regions, peaking at site IS9 (46 n/L in river water; 152 n/kg in sediments). In contrast, nearshore sites exhibited consistently lower values (Figure 4a). This pattern may be linked to pollution source distribution and local hydrodynamic conditions. Inland areas showed elevated MPA, likely due to their proximity to terrestrial MP sources. Although nearshore regions receive inputs from multiple pollution sources at river confluences, strong dilution effects and complex hydrodynamics reduce MPA accumulation in both water and sediments [75,76].
Fibers dominated MPs in both river water and sediment samples, accounting for average proportions of 92.7% and 77.6%, respectively. Fragments and films were only sporadically detected at limited sites (Figure 4b). Clear MPs constituted the dominant color fraction in both river water (45.3%) and sediments (46.3%), followed by black and blue as commonly observed secondary colors (Figure 4c). MPL revealed a predominance of particles < 1 mm, constituting 74.4% in river water and 67.1% in sediments (Figure 4d). High river flow velocities and tide-induced friction likely accelerate the fragmentation of larger plastics [77]. PET and PP dominated the MPT in both river water and sediments, together accounting for >90% of the total, while other polymers constituted minor proportions (Figure 4e). MP physicochemical characteristics showed no significant differences between river water and sediments, suggesting a potential homogeneity of sources.
Statistically, MPA and MDII exhibited similar spatial distribution patterns in river water and sediments (Figure 5a,b). Mean MPA values were lower in nearshore regions (8.4 n/L in river water; 12.6 n/kg in sediments) compared to inland regions (16.2 n/L in river water; 33.3 n/kg in sediments). In contrast, mean MDII values were slightly higher in nearshore regions (0.22 in river water; 0.24 in sediments) than in inland regions (0.17 in river water; 0.18 in sediments). Higher nearshore MDII values indicate a greater diversity of MP sources converging in estuarine zones, which could increase ecological risks, as different polymer types may contain various toxic additives that impact biota in diverse ways [78,79]. This clarifies that even small absolute differences in the MDII index represent meaningful variations in pollution sources and associated ecological risks. Due to the dominance of fibers, mean MPS’ values remained low in both river water and sediments, with means below 0.2 across both nearshore and inland regions (Figure 5c). MPs in sediments exhibited greater color diversity than those in river water, leading to higher MPC’ values (Figure 5d). The lower mobility of sediments allows them to trap denser or biofouled MPs, resulting in higher polymer diversity compared to the dynamic water column where lighter particles are preferentially transported [80]. Elevated mean MPL’ values were observed in both nearshore and inland regions (Figure 5e), suggesting uniform dispersion throughout particle length groups. Elevated mean MPT values were observed in sediments relative to river water (Figure 5f). The enrichment of MPs in sediments is attributed to their role as a sink that accumulates contaminants from diverse sources, in contrast to river water, which primarily enables active transport with shorter residence times [81,82,83]. The statistical characteristics of MPA and MDII data reflected actual differences in MPs, providing reliable dimension-reduced datasets for subsequent PLSR and RR analyses.

4.2. Dominant IFs for MPA and MDII Variation

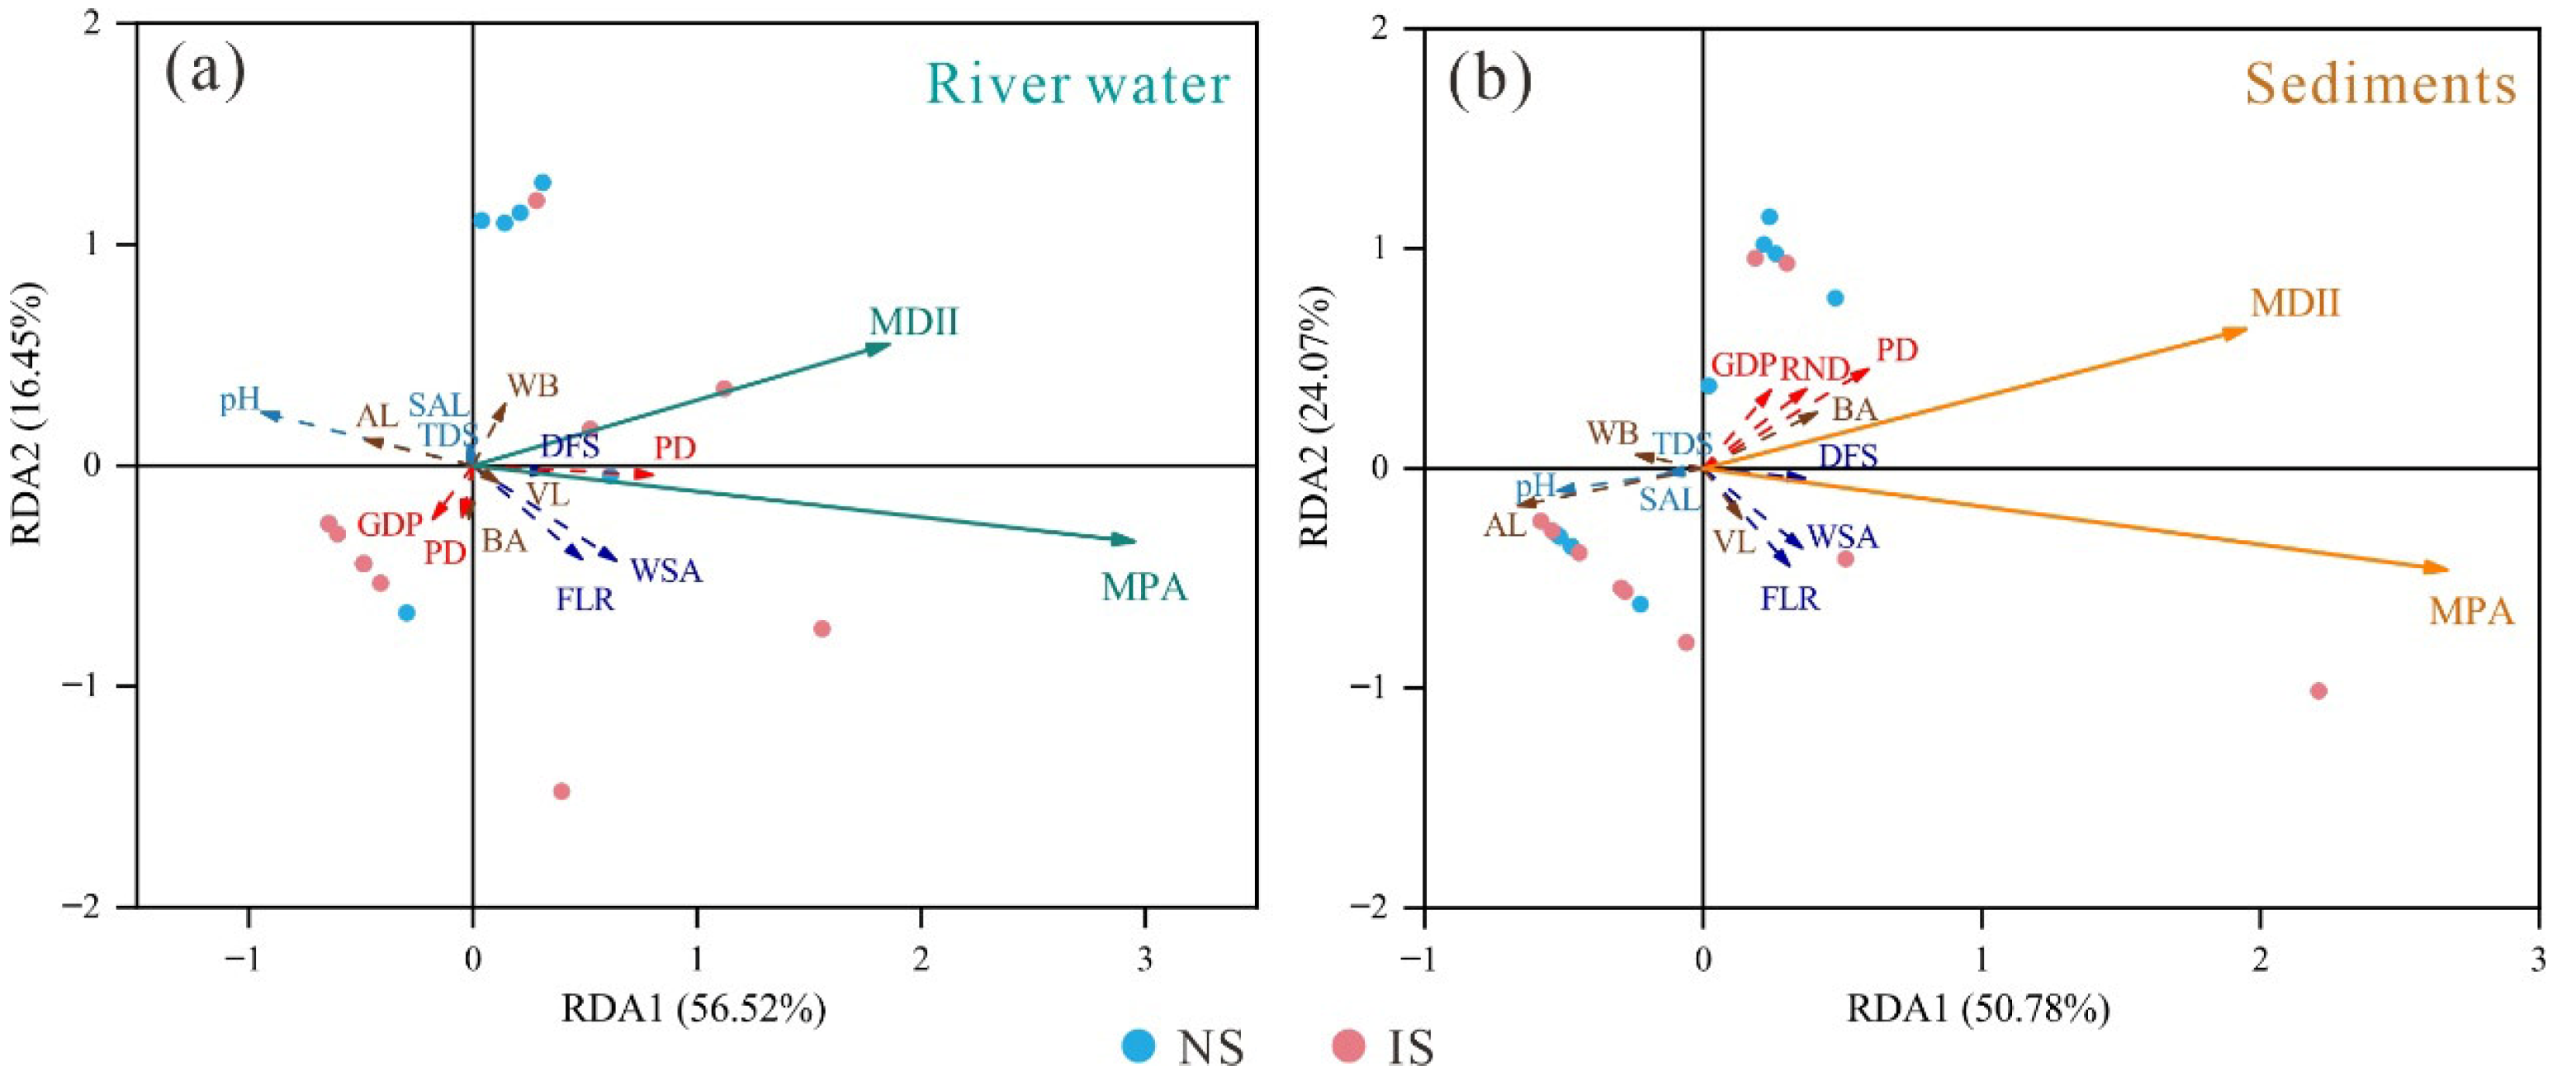
The RDA results revealed complex relationships between MPA, MDII, and IFs in both river water and sediments (Figure 6). In river water samples, RDA explained 72.97% of the total variance. MPA was primarily driven by hydrological IFs and PD, whereas MDII exhibited stronger associations with WB (Figure 6a). For sediment samples, RDA explained 74.85% of the total variance. MPA remained predominantly influenced by hydrological IFs, while MDII was primarily controlled by urbanization degree IFs (Figure 6b). Hydrological IFs and VL clustered similarly along MPA vectors in both river water and sediments, while urbanization degree IFs and BA clustered in parallel along sediment MDII vectors. These patterns suggest that the synergistic effect among these IFs may enhance MPA and MDII (Figure 6). Additional VIF calculations showed that most factors had VIF values exceeding 10 (see Supplementary Materials Table S4), indicating significant collinearity among these IFs [84].
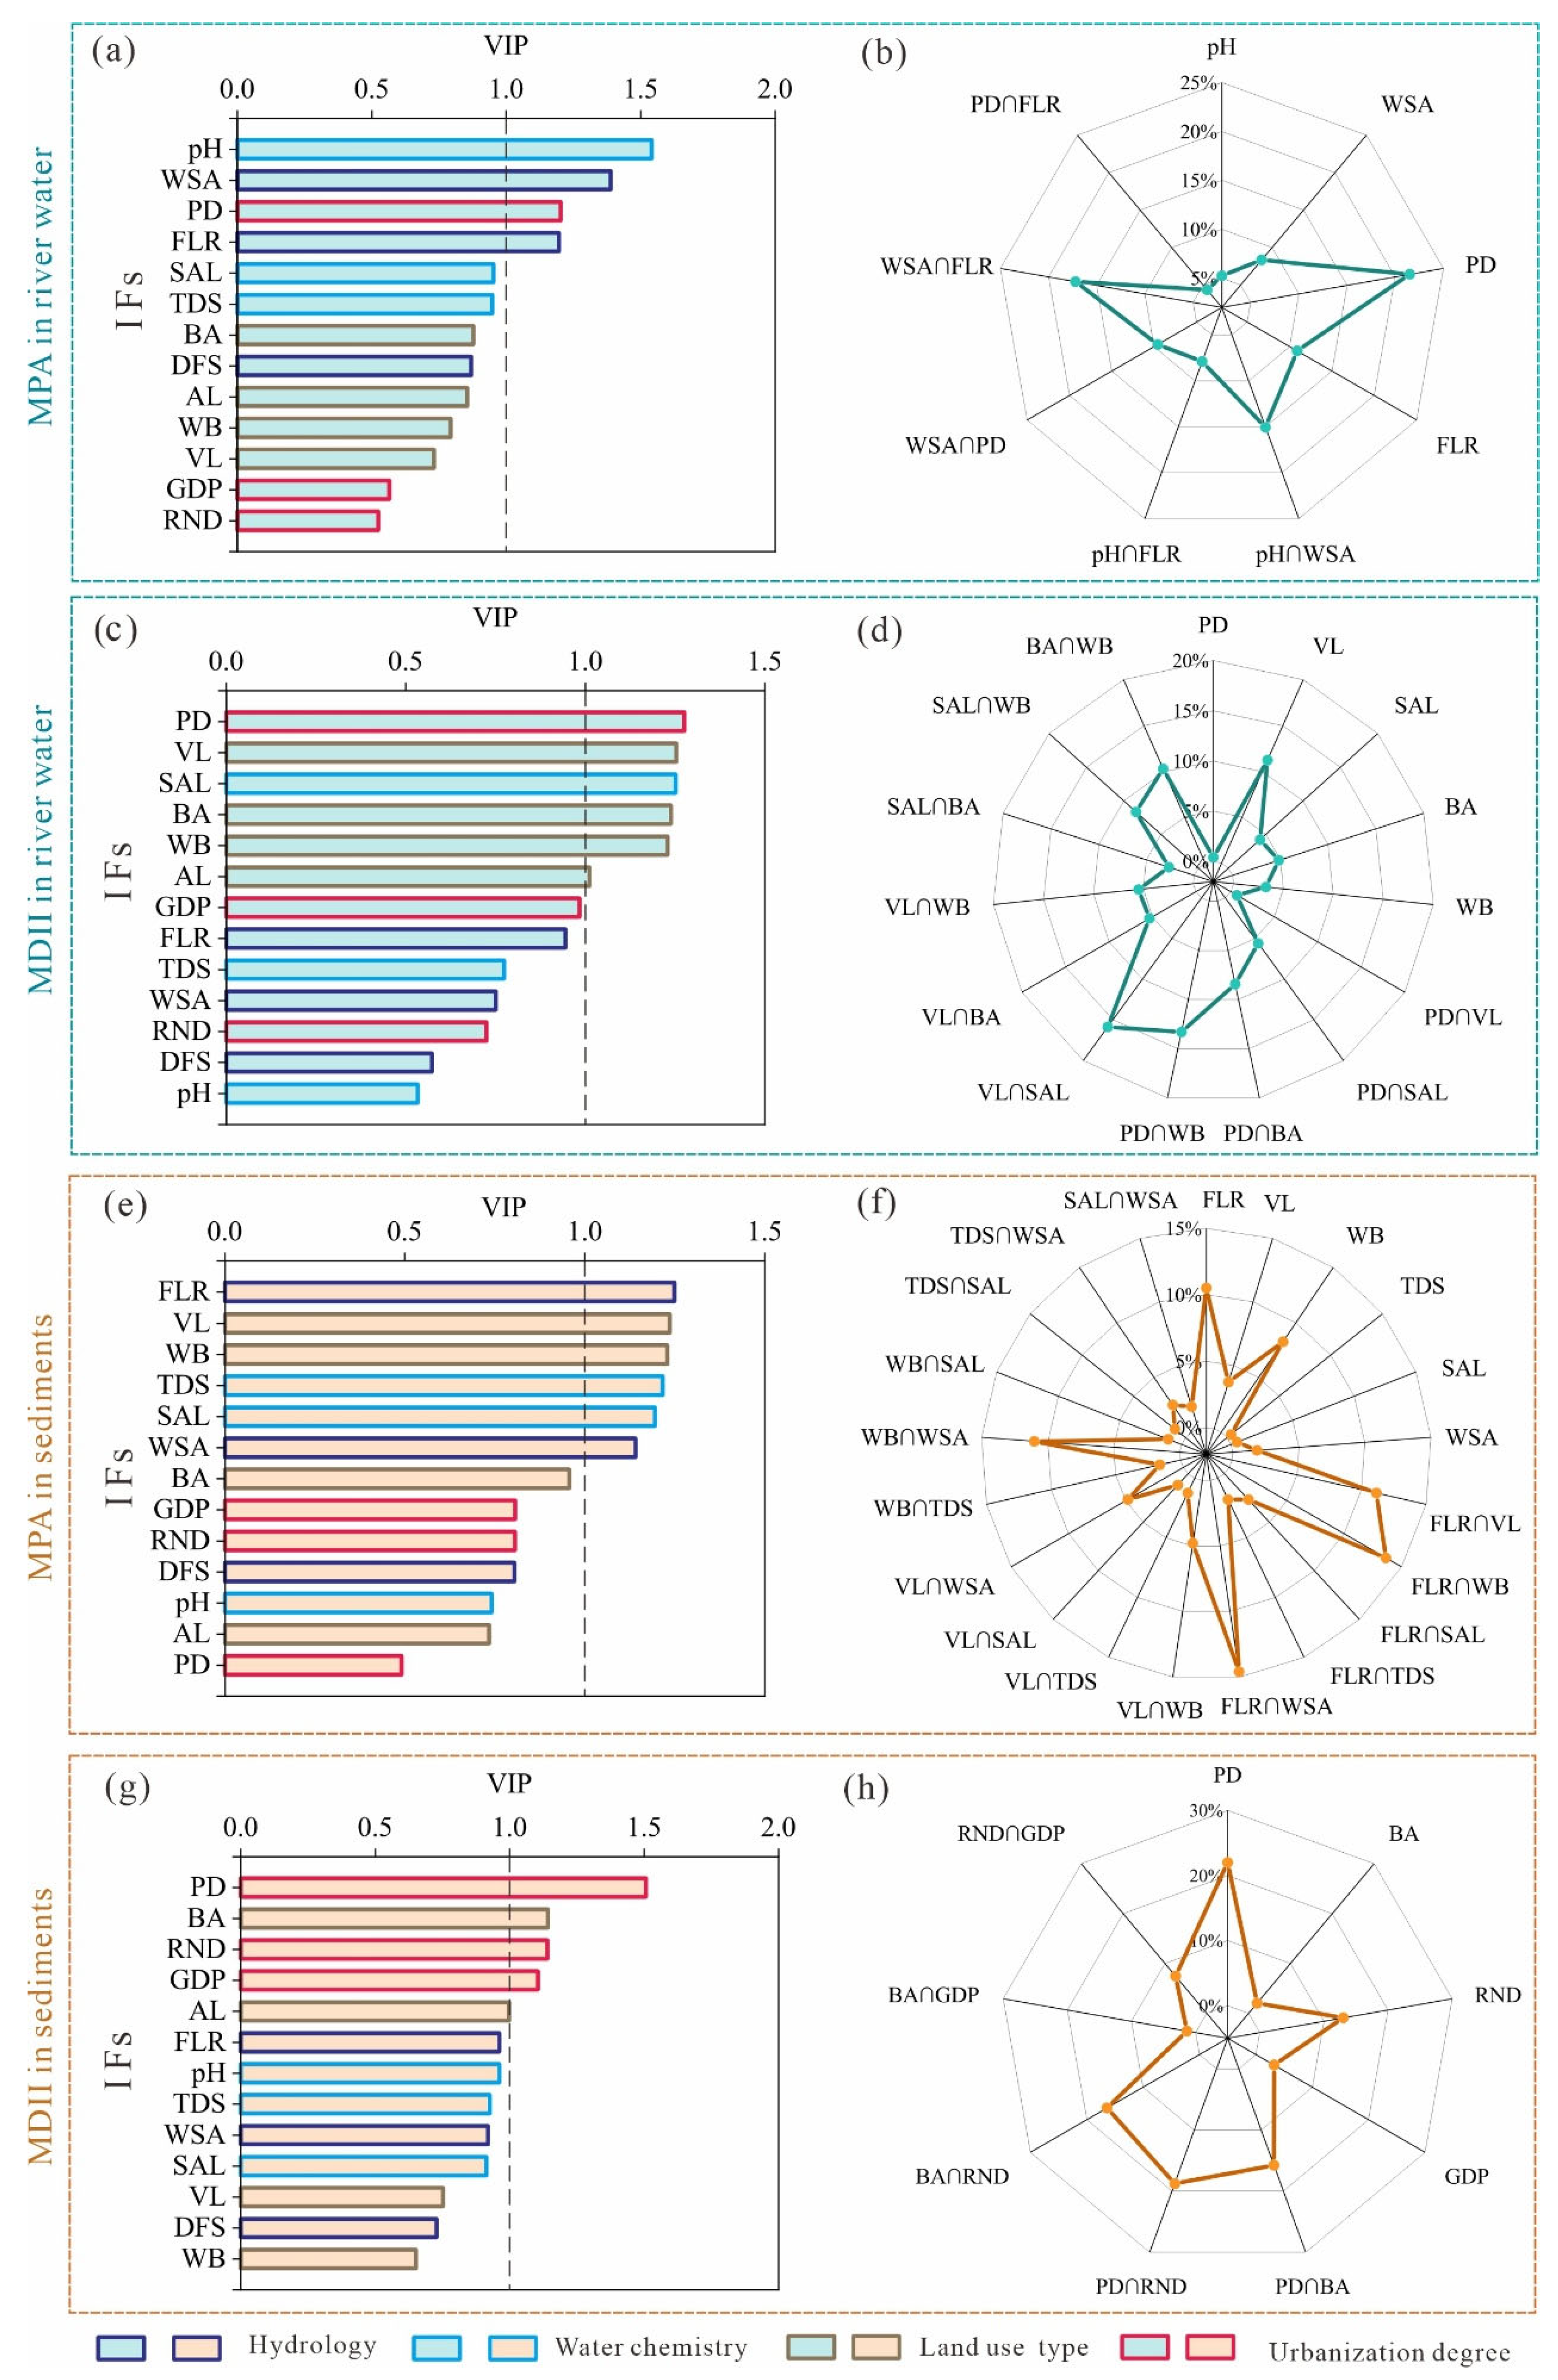
Given the collinearity among IFs, the PLSR model showed high accuracy in predicting both MPA and MDII and reliably identified key IFs (Supplementary Materials Figure S2). Based on the key IFs identified by PLSR, the RR model further revealed interactions among factors (Figure 7). pH, WSA, PD, and FLR contributed significantly to predicting MPA in river water (Figure 7a), with PD having the most significant individual effect (Figure 7b). PD significantly affected river water MPA by directly influencing the occurrence and distribution of MPs [26]. MDII in river water was primarily controlled by land use type IFs (Figure 7c), with the synergistic effect of VL and SAL identified as the dominant regulatory factor (Figure 7d). Coastal mangroves enhanced MDII in river water through multi-source MP retention [85], while SAL further influenced MDII in river water by mediating the sedimentation behavior of MPs with distinct characteristics [86,87]. Hydrology, land use type, and water chemistry significantly influenced MPA in sediments (Figure 7e). The synergistic effect of FLR and WSA exerted the strongest influence (Figure 7f), consistent with their roles in expanding source coverage and accelerating transport [88,89]. Urbanization degree IFs dominated sediment MDII (Figure 7g). PD emerged as the primary driver, significantly controlling MDII through both direct effects and interactions with co-factors (Figure 7h). This may be due to direct regulation of MP physicochemical diversity in sediments by human activities [90].

4.3. Ecological Risk Assessment for MPs Pollution

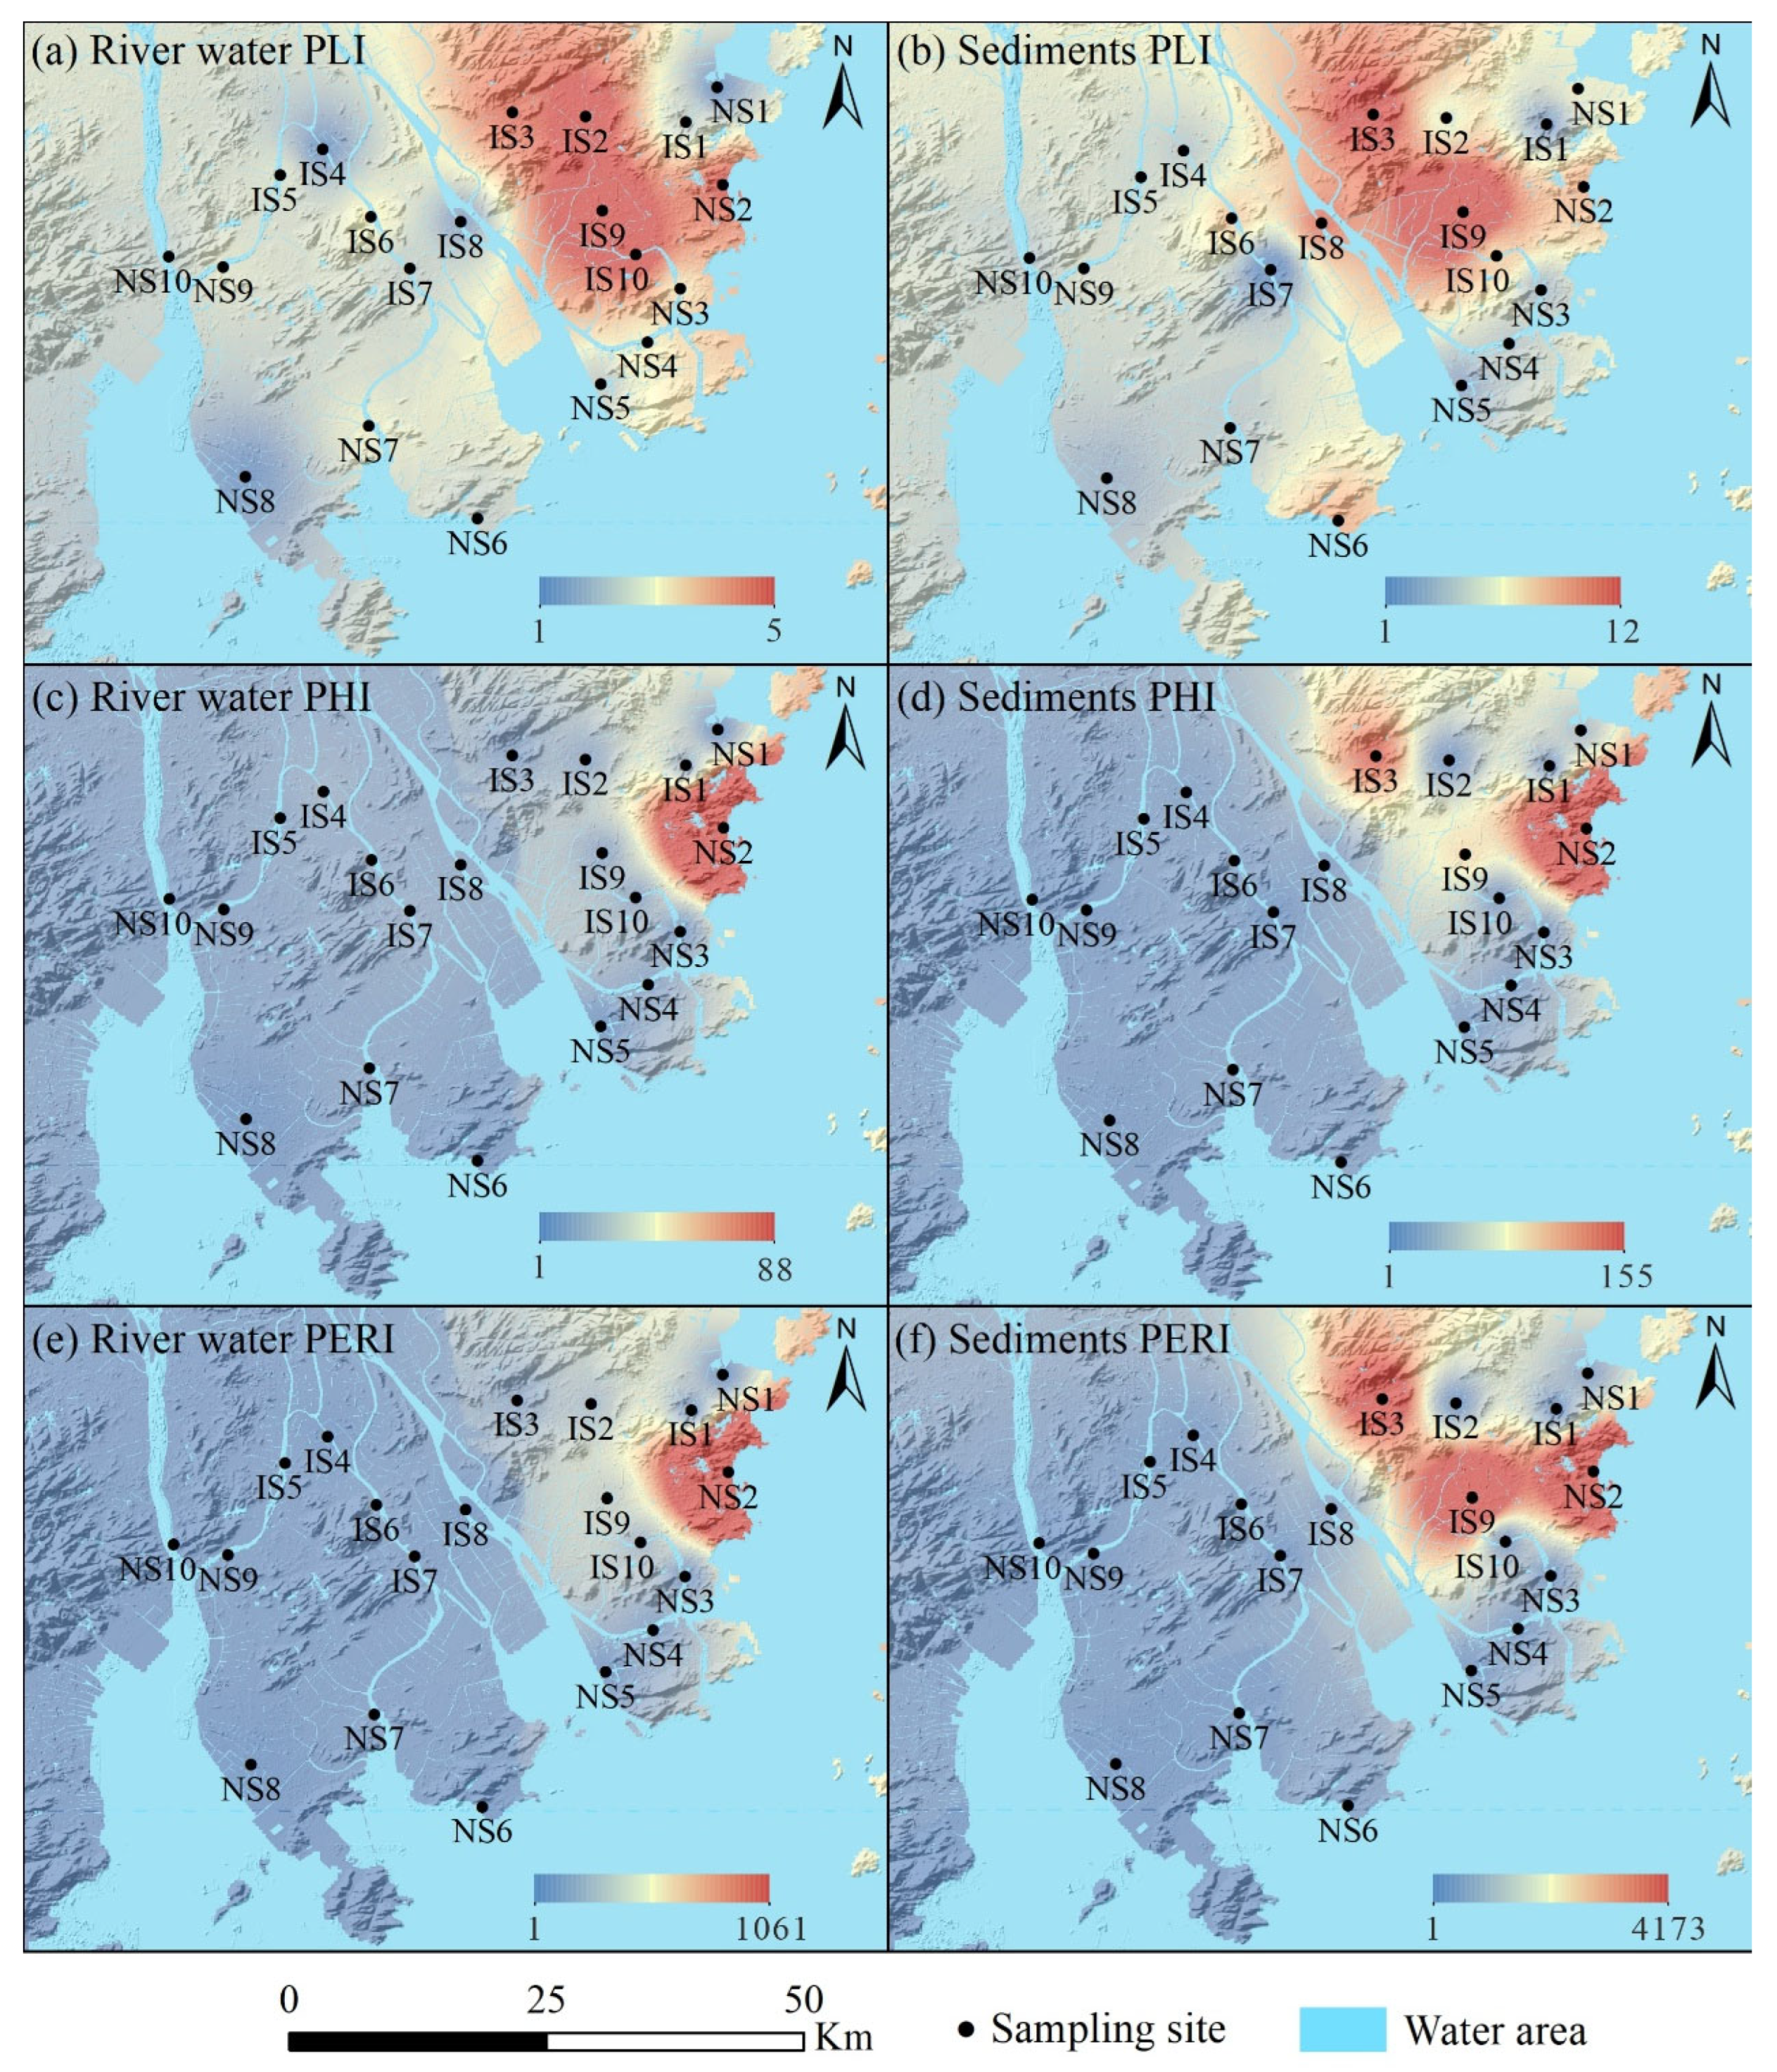
The spatial distributions of PLI showed concordance between river water and sediments in the PRE region, with elevated values concentrated in eastern inland regions (Figure 8a,b). PLI values classified MP pollution in river water as Risk Level I throughout the study area (Supplementary Materials Table S2). In sediments, Risk Level II occurred exclusively at IS9, with all other sites retaining Risk Level I. Notably, the PLI model solely evaluates ecological risk based on MPA, omitting the compositional toxicity of polymer types. Consequently, low PLI values do not necessarily indicate low inherent risk [91]. The PHI model, which incorporates compositional toxicity of polymer types, exhibited parallel spatial distributions in river water and sediments but significant divergence from PLI. NS2 demonstrated peak PHI values despite low PLI values, reaching Risk Level II in river water and Risk Level III in sediments (Figure 8c,d). This discrepancy rose from the detection of PMMA with high hazard scores in NS2 river water and sediments (Supplementary Materials Table S3). As a low-density, cost-effective polymer, PMMA is extensively utilized in automotive, construction, textile, and electronic industries [92]. Its confirmed ecotoxicological risks to aquatic biota [93,94] necessitate targeted regulation of inputs to mitigate MP ecological risks in the PRE region.
PERI integrated MPA and compositional toxicity inputs, generating spatial risk patterns that aligned with PLI and PHI distributions. In the PRE region river water, PERI exhibited spatial patterns similar to those of PHI, peaking at NS2 (Risk Level III) while showing lower values at other sites (Figure 8e). This pattern stemmed from consistently low MPA across the PRE region river water, where compositional toxicity of polymer types emerged as the dominant driver. In PRE region sediments, PERI combined spatial patterns from both PLI and PHI. Peak values reached Risk Level IV at IS3, IS9, and NS2, with lower values elsewhere (Figure 8f). This confirms that synergistic evaluation of multiple parameters yields superior risk delineation over single-trait approaches, providing implementable management frameworks for targeted environmental governance. Critically, all three ecological risk models consistently identified elevated ecological risk in the eastern study area compared to the western study area. Consequently, mitigation efforts should prioritize enhanced source control of MP pollution within the eastern study area.

5. Conclusions

This study investigated the spatial distribution patterns and their dominant IFs for MPA and MDII in river water and sediments in the PRE region, and evaluated associated ecological risks of MP pollution. Fibers were the dominant MPs in both river water and sediments in the PRE region, characterized by predominantly clear coloration, typical lengths below 1 mm, and polymer types dominated by PET and PP. The physicochemical characteristics of MPs exhibited no significant differences between river water and sediments, suggesting potential source homogeneity. Nearshore river water and sediments exhibited lower MPA but slightly higher MDII compared to inland regions. Multivariate statistical analyses identified PD as the primary driver of both MPA in river water and MDII in sediments. MDII in river water was mainly influenced by the synergistic effect of SAL and VL, while MPA in sediments depended on the synergistic effect of FLR and WSA. Ecological risk assessments revealed that the presence of PMMA amplified ecological risks in NS2 river water and sediments, necessitating targeted control of its input pathways. Elevated risks were also identified in IS3 and IS9 sediments. Regionally, the eastern study area exhibited significantly higher cumulative ecological risks than the western zone, highlighting the urgent need for prioritized mitigation measures in eastern hotspots. This study establishes a scientific foundation for MPs pollution control strategies in the PRE region and provides critical baseline data for understanding global estuarine MPs distribution.
Oceanographic dynamic processes have well-documented influences on the transport and sequestration of MPs in estuarine river water and sediments [95,96]. However, quantifying their mechanistic roles requires high-resolution spatiotemporal monitoring data [97]. The current sampling design and modeling framework limit the comprehensive integration of these key oceanographic drivers. The use of a low-density NaCl solution (1.2 g/cm3), though practical for its cost-effectiveness and safety, likely underestimates denser polymer abundances and may lead to biased interpretations of their oceanographic transport and accumulation [2]. Future research will address these limitations by (1) expanding spatial coverage and conducting dynamic monitoring across broader spatiotemporal scales; (2) employing higher-density separation methods to achieve more comprehensive polymer recovery; and (3) systematically incorporating region-specific pollution sources, waste management systems, and oceanographic dynamics that require long-term monitoring. These improvements will enhance the robustness of model predictions and facilitate more systematic validation of generalizable patterns and region-specific drivers governing MP accumulation.

Supplementary Materials

The following supporting information can be downloaded at: https://www.mdpi.com/article/10.3390/w17172572/s1. Table S1 Impact factors of MPs in river water and sediment. Table S2 Risk level criteria for MPs based on the PLI, PHI, and PERI. Table S3 The hazardous scores of polymer types. Table S4 VIF values of each IFs. Figure S1 Comparison of representative measured microplastic spectra with standard spectra from the OMNIC Spectra database. Figure S2 PLS fitting results for MPA and MDII in river water and sediment. References [98,99] are cited in the Supplementary Materials file.

Author Contributions

Methodology, visualization, writing—original draft, J.H.; formal analysis, investigation, C.L.; data curation, L.D. and Z.Y.; conceptualization, writing—review and editing, fund acquisition, X.G. All authors have read and agreed to the published version of the manuscript.

Funding

This research was funded by the Joint Fund Program of Natural Science Foundation of Hunan Province, China (Grant No. 2025JJ80030), National Natural Science Foundation of China (Grant No. 42002249), Special Project for Research and Development in Key Areas of Guangdong Province (Grant No. 2019B110207001).

Data Availability Statement

The original contributions presented in this study are included in the article and Supplementary Materials. Further inquiries can be directed to the corresponding authors.

Conflicts of Interest

The authors declare no conflict of interest.

References

  1. Thompson, R.C.; Olsen, Y.; Mitchell, R.P.; Davis, A.; Rowland, S.J.; John, A.W.G.; McGonigle, D.; Russell, A.E. Lost at Sea: Where Is All the Plastic? Science 2004, 304, 838. [Google Scholar] [CrossRef]
  2. Alam, F.C.; Sembiring, E.; Muntalif, B.S.; Suendo, V. Microplastic Distribution in Surface Water and Sediment River around Slum and Industrial Area (Case Study: Ciwalengke River, Majalaya District, Indonesia). Chemosphere 2019, 224, 637–645. [Google Scholar] [CrossRef]
  3. Fu, L.; Guo, Y.; Tang, J.; Yang, M.; Huang, L.; Xiao, J.; Fan, Z.; Wang, Z.; Zhi, J.; Huang, Z.; et al. Comparative Analysis of Microplastic and Microbial Communities in Varied Aquatic Environments: Disparities in Occurrence, Interconnections, and Ecological Implications. J. Hazard. Mater. 2025, 495, 138795. [Google Scholar] [CrossRef]
  4. Hoang, V.-H.; Nguyen, M.-K.; Hoang, T.-D.; Nguyen, H.-L.; Lin, C.; Yousaf, B.; Ha, M.C.; Bui, V.K.H.; Pham, M.-T.; Chang, S.W.; et al. Global Occurrence and Environmental Fate of Microplastics in Stormwater Runoff: Unlock the In-Depth Knowledge on Nature-Based Removal Strategies. Rev. Environ. Contam. Toxicol. 2025, 263, 5. [Google Scholar] [CrossRef]
  5. Lee, J.-Y.; Cha, J.; Ha, K.; Viaroli, S. Microplastic Pollution in Groundwater: A Systematic Review. Environ. Pollut. Bioavailab. 2024, 36, 2299545. [Google Scholar] [CrossRef]
  6. Buteler, M.; Fasanella, M.; Alma, A.M.; Silva, L.I.; Langenheim, M.; Tomba, J.P. Lakes with or without Urbanization along Their Coasts Had Similar Level of Microplastic Contamination, but Significant Differences Were Seen between Sampling Methods. Sci. Total Environ. 2023, 866, 161254. [Google Scholar] [CrossRef] [PubMed]
  7. Kurniawan, T.A.; Haider, A.; Ahmad, H.M.; Mohyuddin, A.; Umer Aslam, H.M.; Nadeem, S.; Javed, M.; Othman, M.H.D.; Goh, H.H.; Chew, K.W. Source, Occurrence, Distribution, Fate, and Implications of Microplastic Pollutants in Freshwater on Environment: A Critical Review and Way Forward. Chemosphere 2023, 325, 138367. [Google Scholar] [CrossRef]
  8. Ren, S.-Y.; Kong, S.-F.; Ni, H.-G. Contribution of Mulch Film to Microplastics in Agricultural Soil and Surface Water in China. Environ. Pollut. 2021, 291, 118227. [Google Scholar] [CrossRef]
  9. Siegfried, M.; Koelmans, A.A.; Besseling, E.; Kroeze, C. Export of Microplastics from Land to Sea. A Modelling Approach. Water Research 2017, 127, 249–257. [Google Scholar] [CrossRef] [PubMed]
  10. Trindade, L.d.S.; Gloaguen, T.V.; Benevides, T.d.S.F.; Valentim, A.C.S.; Bomfim, M.R.; Gonzaga Santos, J.A. Microplastics in Surface Waters of Tropical Estuaries around a Densely Populated Brazilian Bay. Environ. Pollut. 2023, 323, 121224. [Google Scholar] [CrossRef]
  11. Barceló, D.; Picó, Y.; Alfarhan, A.H. Microplastics: Detection in Human Samples, Cell Line Studies, and Health Impacts. Environ. Toxicol. Pharmacol. 2023, 101, 104204. [Google Scholar] [CrossRef]
  12. Çıtar Dazıroğlu, M.E.; Bilici, S. The Hidden Threat to Food Safety and Human Health: Microplastics. Environ. Dev. Sustain. 2024, 26, 21913–21935. [Google Scholar] [CrossRef]
  13. Eze, C.G.; Nwankwo, C.E.; Dey, S.; Sundaramurthy, S.; Okeke, E.S. Food Chain Microplastics Contamination and Impact on Human Health: A Review. Environ. Chem. Lett. 2024, 22, 1889–1927. [Google Scholar] [CrossRef]
  14. Lu, L.; Luo, T.; Zhao, Y.; Cai, C.; Fu, Z.; Jin, Y. Interaction between Microplastics and Microorganism as Well as Gut Microbiota: A Consideration on Environmental Animal and Human Health. Sci. Total Environ. 2019, 667, 94–100. [Google Scholar] [CrossRef] [PubMed]
  15. Hermabessiere, L.; Dehaut, A.; Paul-Pont, I.; Lacroix, C.; Jezequel, R.; Soudant, P.; Duflos, G. Occurrence and Effects of Plastic Additives on Marine Environments and Organisms: A Review. Chemosphere 2017, 182, 781–793. [Google Scholar] [CrossRef]
  16. Purwiyanto, A.I.S.; Suteja, Y.; Trisno; Ningrum, P.S.; Putri, W.A.E.; Rozirwan; Agustriani, F.; Fauziyah; Cordova, M.R.; Koropitan, A.F. Concentration and Adsorption of Pb and Cu in Microplastics: Case Study in Aquatic Environment. Mar. Pollut. Bull. 2020, 158, 111380. [Google Scholar] [CrossRef]
  17. Han, X.; Wu, H.; Li, Q.; Cai, W.; Hu, S. Assessment of Heavy Metal Accumulation and Potential Risks in Surface Sediment of Estuary Area: A Case Study of Dagu River. Mar. Environ. Res. 2024, 196, 106416. [Google Scholar] [CrossRef]
  18. Makhinov, A.N. Mouth Areas of Rivers on the Southwestern Coast of the Sea of Okhotsk and Role of Ice in the Formation of Their Channels under Conditions of High Tides. Water Resour. 2022, 49, 860–868. [Google Scholar] [CrossRef]
  19. Preston-Whyte, F.; Silburn, B.; Meakins, B.; Bakir, A.; Pillay, K.; Worship, M.; Paruk, S.; Mdazuka, Y.; Mooi, G.; Harmer, R.; et al. Meso- and Microplastics Monitoring in Harbour Environments: A Case Study for the Port of Durban, South Africa. Mar. Pollut. Bull. 2021, 163, 111948. [Google Scholar] [CrossRef] [PubMed]
  20. Sousa, M.C.; deCastro, M.; Gago, J.; Ribeiro, A.S.; Des, M.; Gómez-Gesteira, J.L.; Dias, J.M.; Gomez-Gesteira, M. Modelling the Distribution of Microplastics Released by Wastewater Treatment Plants in Ria de Vigo (NW Iberian Peninsula). Mar. Pollut. Bull. 2021, 166, 112227. [Google Scholar] [CrossRef]
  21. Soltani, N.; Keshavarzi, B.; Moore, F.; Busquets, R.; Nematollahi, M.J.; Javid, R.; Gobert, S. Effect of Land Use on Microplastic Pollution in a Major Boundary Waterway: The Arvand River. Sci. Total Environ. 2022, 830, 154728. [Google Scholar] [CrossRef]
  22. Trusler, M.M.; Moss-Hayes, V.L.; Cook, S.; Lomax, B.H.; Vane, C.H. Microplastics Pollution in Sediments of the Thames and Medway Estuaries, UK: Organic Matter Associations and Predominance of Polyethylene. Mar. Pollut. Bull. 2024, 208, 116971. [Google Scholar] [CrossRef] [PubMed]
  23. Kumar, R.; Sharma, P.; Verma, A.; Jha, P.K.; Singh, P.; Gupta, P.K.; Chandra, R.; Prasad, P.V.V. Effect of Physical Characteristics and Hydrodynamic Conditions on Transport and Deposition of Microplastics in Riverine Ecosystem. Water 2021, 13, 2710. [Google Scholar] [CrossRef]
  24. Wu, J.; Ye, Q.; Sun, L.; Liu, J.; Huang, M.; Wang, T.; Wu, P.; Zhu, N. Impact of Persistent Rain on Microplastics Distribution and Plastisphere Community: A Field Study in the Pearl River, China. Sci. Total Environ. 2023, 879, 163066. [Google Scholar] [CrossRef]
  25. Malli, A.; Corella-Puertas, E.; Hajjar, C.; Boulay, A.-M. Transport Mechanisms and Fate of Microplastics in Estuarine Compartments: A Review. Mar. Pollut. Bull. 2022, 177, 113553. [Google Scholar] [CrossRef]
  26. Ta, A.T.; Babel, S. Occurrence and Spatial Distribution of Microplastic Contaminated with Heavy Metals in a Tropical River: Effect of Land Use and Population Density. Mar. Pollut. Bull. 2023, 191, 114919. [Google Scholar] [CrossRef]
  27. Zuo, L.; Sun, Y.; Li, H.; Hu, Y.; Lin, L.; Peng, J.; Xu, X. Microplastics in Mangrove Sediments of the Pearl River Estuary, South China: Correlation with Halogenated Flame Retardants’ Levels. Sci. Total Environ. 2020, 725, 138344. [Google Scholar] [CrossRef] [PubMed]
  28. Defontaine, S.; Sous, D.; Tesan, J.; Monperrus, M.; Lenoble, V.; Lanceleur, L. Microplastics in a Salt-Wedge Estuary: Vertical Structure and Tidal Dynamics. Mar. Pollut. Bull. 2020, 160, 111688. [Google Scholar] [CrossRef] [PubMed]
  29. Ta, A.T.; Babel, S. Microplastics Pollution with Heavy Metals in the Aquaculture Zone of the Chao Phraya River Estuary, Thailand. Mar. Pollut. Bull. 2020, 161, 111747. [Google Scholar] [CrossRef]
  30. Zhao, S.; Zhu, L.; Wang, T.; Li, D. Suspended Microplastics in the Surface Water of the Yangtze Estuary System, China: First Observations on Occurrence, Distribution. Mar. Pollut. Bull. 2014, 86, 562–568. [Google Scholar] [CrossRef]
  31. Chau, H.S.; Xu, S.; Ma, Y.; Wang, Q.; Cao, Y.; Huang, G.; Ruan, Y.; Yan, M.; Liu, M.; Zhang, K.; et al. Microplastic Occurrence and Ecological Risk Assessment in the Eight Outlets of the Pearl River Estuary, a New Insight into the Riverine Microplastic Input to the Northern South China Sea. Mar. Pollut. Bull. 2023, 189, 114719. [Google Scholar] [CrossRef]
  32. Li, Q.; Zhu, L.; Wei, N.; Bai, M.; Liu, K.; Wang, X.; Jiang, C.; Zong, C.; Zhang, F.; Li, C.; et al. Transport Mechanism of Microplastics from a Still Water System to a Dynamic Estuarine System: A Case Study in Macao SAR. Mar. Pollut. Bull. 2025, 218, 118223. [Google Scholar] [CrossRef]
  33. Zhang, C.; Wang, S.; Sun, D.; Pan, Z.; Zou, J. Investigation of Microplastics in Surface Water and Estuarine Mullet Mugil Cephalus from 23 Estuary Areas, South China. Sustainability 2023, 15, 4193. [Google Scholar] [CrossRef]
  34. van der Mheen, M.; van Sebille, E.; Pattiaratchi, C. Beaching Patterns of Plastic Debris along the Indian Ocean Rim. Ocean Science 2020, 16, 1317–1336. [Google Scholar] [CrossRef]
  35. Gao, W.; Xiong, F.; Lu, Y.; Qu, X.; Xin, W.; Chen, Y. Development of a Phytoplankton-Based Index of Biotic Integrity for Ecological Health Assessment in the Yangtze River. Ecol. Process. 2023, 12, 41. [Google Scholar] [CrossRef]
  36. Maurya, P.K.; Ali, S.A.; Alharbi, R.S.; Yadav, K.K.; Alfaisal, F.M.; Ahmad, A.; Ditthakit, P.; Prasad, S.; Jung, Y.-K.; Jeon, B.-H. Impacts of Land Use Change on Water Quality Index in the Upper Ganges River near Haridwar, Uttarakhand: A GIS-Based Analysis. Water 2021, 13, 3572. [Google Scholar] [CrossRef]
  37. Raduła, M.W.; Szymura, T.H.; Szymura, M.; Swacha, G.; Kącki, Z. Effect of Environmental Gradients, Habitat Continuity and Spatial Structure on Vascular Plant Species Richness in Semi-Natural Grasslands. Agric. Ecosyst. Environ. 2020, 300, 106974. [Google Scholar] [CrossRef]
  38. Yao, S.; Chen, C.; He, M.; Cui, Z.; Mo, K.; Pang, R.; Chen, Q. Land Use as an Important Indicator for Water Quality Prediction in a Region under Rapid Urbanization. Ecol. Indic. 2023, 146, 109768. [Google Scholar] [CrossRef]
  39. Masura, J.; Baker, J.; Foster, G.; Arthur, C.; Herring, C. Laboratory Methods for the Analysis of Microplastics in the Marine Environment: Recommendations for Quantifying Synthetic Particles in Waters and Sediments; NOAA Marine Debris Program; National Oceanic and Atmospheric Administration, U.S. Department of Commerce: Washington, DC, USA, 2015; pp. 1–29. [Google Scholar]
  40. Gong, X.; Tian, L.; Wang, P.; Wang, Z.; Zeng, L.; Hu, J. Microplastic Pollution in the Groundwater under a Bedrock Island in the South China Sea. Environ. Res. 2023, 239, 117277. [Google Scholar] [CrossRef]
  41. Hidalgo-Ruz, V.; Gutow, L.; Thompson, R.C.; Thiel, M. Microplastics in the Marine Environment: A Review of the Methods Used for Identification and Quantification. Environ. Sci. Technol. 2012, 46, 3060–3075. [Google Scholar] [CrossRef]
  42. Liu, Y.; Wu, L.; Shi, G.; Cao, S.; Li, Y. Characteristics and Sources of Microplastic Pollution in the Water and Sediments of the Jinjiang River Basin, Fujian Province, China. China Geol. 2022, 5, 429–438. [Google Scholar] [CrossRef]
  43. Shu, X.; Xu, L.; Yang, M.; Qin, Z.; Zhang, Q.; Zhang, L. Spatial Distribution Characteristics and Migration of Microplastics in Surface Water, Groundwater and Sediment in Karst Areas: The Case of Yulong River in Guilin, Southwest China. Sci. Total Environ. 2023, 868, 161578. [Google Scholar] [CrossRef] [PubMed]
  44. de Carvalho, A.R.; Garcia, F.; Riem-Galliano, L.; Tudesque, L.; Albignac, M.; ter Halle, A.; Cucherousset, J. Urbanization and Hydrological Conditions Drive the Spatial and Temporal Variability of Microplastic Pollution in the Garonne River. Sci. Total Environ. 2021, 769, 144479. [Google Scholar] [CrossRef] [PubMed]
  45. Grbić, J.; Helm, P.; Athey, S.; Rochman, C.M. Microplastics Entering Northwestern Lake Ontario Are Diverse and Linked to Urban Sources. Water Res. 2020, 174, 115623. [Google Scholar] [CrossRef] [PubMed]
  46. Li, S.; Wang, H.; He, Y.; Liang, D.; Shen, Y.; Gu, Q.; Zeng, Y. How Microplastic Loads Relate to Natural Conditions and Anthropogenic Activities in the Yangtze River Basin. Chemosphere 2023, 342, 140146. [Google Scholar] [CrossRef]
  47. D’Hont, A.; Gittenberger, A.; Leuven, R.S.E.W.; Hendriks, A.J. Dropping the Microbead: Source and Sink Related Microplastic Distribution in the Black Sea and Caspian Sea Basins. Mar. Pollut. Bull. 2021, 173, 112982. [Google Scholar] [CrossRef]
  48. Mani, T.; Burkhardt-Holm, P. Seasonal Microplastics Variation in Nival and Pluvial Stretches of the Rhine River—From the Swiss Catchment towards the North Sea. Sci. Total Environ. 2020, 707, 135579. [Google Scholar] [CrossRef]
  49. Sang, W.; Chen, Z.; Mei, L.; Hao, S.; Zhan, C.; Zhang, W.b.; Li, M.; Liu, J. The Abundance and Characteristics of Microplastics in Rainwater Pipelines in Wuhan, China. Sci. Total Environ. 2021, 755, 142606. [Google Scholar] [CrossRef]
  50. An, X.; Li, W.; Lan, J.; Adnan, M. Preliminary Study on the Distribution, Source, and Ecological Risk of Typical Microplastics in Karst Groundwater in Guizhou Province, China. Int. J. Environ. Res. Public Health 2022, 19, 14751. [Google Scholar] [CrossRef]
  51. Lu, S.; Zhu, K.; Song, W.; Song, G.; Chen, D.; Hayat, T.; Alharbi, N.S.; Chen, C.; Sun, Y. Impact of Water Chemistry on Surface Charge and Aggregation of Polystyrene Microspheres Suspensions. Sci. Total Environ. 2018, 630, 951–959. [Google Scholar] [CrossRef]
  52. Cao, Y.; Li, Q.; Yang, Z. Identifying the Spatial Range of the Pearl River Delta Urban Agglomeration from a Differentiated Perspective of Population Distribution and Population Mobility. Appl. Sci. 2025, 15, 945. [Google Scholar] [CrossRef]
  53. He, J.; Yang, S.; Deng, S.; Ye, J.; Chen, H. Research on the Decoupling Relationship between Transportation Land and Population Growth: A Case of Guangdong Province in China. Land 2024, 13, 484. [Google Scholar] [CrossRef]
  54. Simpson, E.H. Measurement of Diversity. Nature 1949, 163, 688. [Google Scholar] [CrossRef]
  55. Ding, X.; Zhang, B.; Shen, C.; Wang, R.; Yin, S.; Li, F.; Xu, C. Are We Underestimating the Driving Factors and Potential Risks of Freshwater Microplastics from in Situ and in Silico Perspective? Water Res. 2025, 281, 123568. [Google Scholar] [CrossRef]
  56. Fang, Q.; Niu, S.; Yu, J. Characterising Microplastic Pollution in Sediments from Urban Water Systems Using the Diversity Index. J. Clean. Prod. 2021, 318, 128537. [Google Scholar] [CrossRef]
  57. Guo, S.; Xiao, G.; Chen, Y.; Zhang, J.; Zhang, B.; Ru, S.; Zhao, M. Unraveling the Characteristics of Microplastics in Agricultural Soils upon Long-Term Organic Fertilizer Application: A Comprehensive Study Using Diversity Indices. Chemosphere 2024, 364, 143235. [Google Scholar] [CrossRef] [PubMed]
  58. Li, C.; Gan, Y.; Zhang, C.; He, H.; Fang, J.; Wang, L.; Wang, Y.; Liu, J. “Microplastic Communities” in Different Environments: Differences, Links, and Role of Diversity Index in Source Analysis. Water Res. 2021, 188, 116574. [Google Scholar] [CrossRef] [PubMed]
  59. Jiang, J.; He, L.; Liu, J.; Liu, X.; Huang, J.; Rong, L. Experimental Study of Interception Effect by Submerged Dam on Microplastics. J. Hazard. Mater. 2024, 480, 135924. [Google Scholar] [CrossRef]
  60. Maity, S.; Maiti, R.; Mukherjee, S. Catchment Scale Land Use and Hydrogeomorphology Relationship in Assessing River Water Quality Using SWAT and RDA Modelling in the Damodar River Basin, West Bengal, India. Adv. Space Res. 2025, 75, 7889–7902. [Google Scholar] [CrossRef]
  61. Nakar, A.; Schmilovitch, Z.; Vaizel-Ohayon, D.; Kroupitski, Y.; Borisover, M.; Sela, S. Quantification of Bacteria in Water Using PLS Analysis of Emission Spectra of Fluorescence and Excitation-Emission Matrices. Water Res. 2020, 169, 115197. [Google Scholar] [CrossRef]
  62. Wang, X.; Zhao, C.; Li, Z.; Huang, J. Modeling Risk Assessment of Soil Heavy Metal Pollution Using Partial Least Squares and Fuzzy Logic: A Case Study of a Gully Type Coal-Based Solid Waste Dumpsite. Environ. Pollut. 2024, 352, 124147. [Google Scholar] [CrossRef]
  63. Cui, S.; Adamowski, J.F.; Wu, M.; Zhang, P.; Yue, Q.; Cao, X. An Integrated Framework for Improving Green Agricultural Production Sustainability in Human-Natural Systems. Sci. Total Environ. 2024, 945, 174153. [Google Scholar] [CrossRef]
  64. Zhu, L.; Xiong, Q. Key Influencing Factor and Future Scenario Simulation of China’s CO2 Emissions from Road Freight Transportation. Sustain. Prod. Consum. 2023, 37, 11–25. [Google Scholar] [CrossRef]
  65. Gélinas, A.; Profili, J.; Fotouhiardakani, F.; Caceres Ferreira, W.M.; Laurent, M.; Ravichandran, S.; Laroche, G. Toward a Better Interpretation of the Partial Least Squares Regression Models for Fluoropolymers Treated by Dielectric Barrier Discharges at Atmospheric Pressure. Plasma Process. Polym. 2024, 21, 2300098. [Google Scholar] [CrossRef]
  66. Li, C.; Shi, Y.; Luo, D.; Kang, M.; Li, Y.; Huang, Y.; Bai, X. Interventions of River Network Structures on Urban Aquatic Microplastic Footprint from a Connectivity Perspective. Water Res. 2023, 243, 120418. [Google Scholar] [CrossRef] [PubMed]
  67. Mahieu, B.; Qannari, E.M.; Jaillais, B. Extension and Significance Testing of Variable Importance in Projection (VIP) Indices in Partial Least Squares Regression and Principal Components Analysis. Chemom. Intell. Lab. Syst. 2023, 242, 104986. [Google Scholar] [CrossRef]
  68. Ahn, J.J.; Kim, Y.M.; Yoo, K.; Park, J.; Oh, K.J. Using GA-Ridge Regression to Select Hydro-Geological Parameters Influencing Groundwater Pollution Vulnerability. Environ. Monit. Assess. 2012, 184, 6637–6645. [Google Scholar] [CrossRef]
  69. Wen, L.; Shao, H. Analysis of Influencing Factors of the Carbon Dioxide Emissions in China’s Commercial Department Based on the STIRPAT Model and Ridge Regression. Environ. Sci. Pollut. Res. 2019, 26, 27138–27147. [Google Scholar] [CrossRef] [PubMed]
  70. Chen, J.; Zhang, F.; Li, Y.; Tan, W.; Yuan, Y.; Jiang, Y. Influence of Landfill Leachate Microenvironment on the Occurrence of Microplastics: TOC Changes Are the Main Driving Factor. J. Hazard. Mater. 2025, 492, 138080. [Google Scholar] [CrossRef]
  71. Lithner, D.; Larsson, Å.; Dave, G. Environmental and Health Hazard Ranking and Assessment of Plastic Polymers Based on Chemical Composition. Sci. Total Environ. 2011, 409, 3309–3324. [Google Scholar] [CrossRef]
  72. Dong, Y.; Qiao, Y.; Lin, H. Insights into Microplastics in the Soil Environment: Migration, Biodegradation, Toxicity and Risk Assessment. Process Saf. Environ. Prot. 2024, 189, 1450–1463. [Google Scholar] [CrossRef]
  73. Huang, L.; Li, Q.P.; Li, H.; Lin, L.; Xu, X.; Yuan, X.; Koongolla, J.B.; Li, H. Microplastic Contamination in Coral Reef Fishes and Its Potential Risks in the Remote Xisha Areas of the South China Sea. Mar. Pollut. Bull. 2023, 186, 114399. [Google Scholar] [CrossRef]
  74. Wu, L.; Li, C.; Huang, C.; Luo, Y.; Huang, J.; Chen, F.; Huang, X.; Sun, R. Ocean Current Modulation of the Spatial Distribution of Microplastics in the Surface Sediments of the Beibu Gulf, China. J. Hazard. Mater. 2025, 488, 137332. [Google Scholar] [CrossRef]
  75. Corlett, W.B.; Geyer, W.R. Frontogenesis at Estuarine Junctions. Estuaries Coasts 2020, 43, 722–738. [Google Scholar] [CrossRef]
  76. Vibhatabandhu, P.; Srithongouthai, S. Influence of Seasonal Variations on the Distribution Characteristics of Microplastics in the Surface Water of the Inner Gulf of Thailand. Mar. Pollut. Bull. 2022, 180, 113747. [Google Scholar] [CrossRef]
  77. Browne, M.A.; Galloway, T.; Thompson, R. Microplastic—An Emerging Contaminant of Potential Concern? Integr. Environ. Assess. Manag. 2007, 3, 559–561. [Google Scholar] [CrossRef]
  78. da Costa, J.P.; Avellan, A.; Mouneyrac, C.; Duarte, A.; Rocha-Santos, T. Plastic Additives and Microplastics as Emerging Contaminants: Mechanisms and Analytical Assessment. TrAC Trends Anal. Chem. 2023, 158, 116898. [Google Scholar] [CrossRef]
  79. Naidu, B.C.; Xavier, K.A.M.; Shukla, S.P.; Jaiswar, A.K.; Nayak, B.B. Comparative Study on the Microplastics Abundance, Characteristics, and Possible Sources in Yellow Clams of Different Demographic Regions of the Northwest Coast of India. J. Hazard. Mater. Lett. 2022, 3, 100051. [Google Scholar] [CrossRef]
  80. Nizzetto, L.; Bussi, G.; Futter, M.N.; Butterfield, D.; Whitehead, P.G. A Theoretical Assessment of Microplastic Transport in River Catchments and Their Retention by Soils and River Sediments. Environ. Sci. Process. Impacts 2016, 18, 1050–1059. [Google Scholar] [CrossRef] [PubMed]
  81. Faisal, M.; Lipi, J.A.; Rima, N.N.; Riya, K.K.; Hossain, M.K.; Paray, B.A.; Arai, T.; Yu, J.; Hossain, M.B. Microplastic Contamination and Ecological Risk Assessment in Sediments and Waters of Ship-Dismantling Yards along the Bay of Bengal. Mar. Pollut. Bull. 2025, 217, 118032. [Google Scholar] [CrossRef]
  82. Li, J.; Liu, H.; Paul Chen, J. Microplastics in Freshwater Systems: A Review on Occurrence, Environmental Effects, and Methods for Microplastics Detection. Water Res. 2018, 137, 362–374. [Google Scholar] [CrossRef]
  83. Rochman, C.M.; Hoellein, T. The Global Odyssey of Plastic Pollution. Science 2020, 368, 1184–1185. [Google Scholar] [CrossRef]
  84. Groß, J. Variance Inflation Factors. R News 2003, 3, 13–15. [Google Scholar]
  85. Yang, T.; Zeng, Y.; Kang, Z.; Cai, M.; Chen, K.; Zhao, Q.; Lin, J.; Liu, R.; Xu, G. Enrichment and Ecological Risks of Microplastics in Mangroves of Southern Hainan Island, China. Sci. Total Environ. 2023, 889, 164160. [Google Scholar] [CrossRef]
  86. Pinheiro, L.M.; Agostini, V.O.; Lima, A.R.A.; Ward, R.D.; Pinho, G.L.L. The Fate of Plastic Litter within Estuarine Compartments: An Overview of Current Knowledge for the Transboundary Issue to Guide Future Assessments. Environ. Pollut. 2021, 279, 116908. [Google Scholar] [CrossRef] [PubMed]
  87. Vermeiren, P.; Muñoz, C.C.; Ikejima, K. Sources and Sinks of Plastic Debris in Estuaries: A Conceptual Model Integrating Biological, Physical and Chemical Distribution Mechanisms. Mar. Pollut. Bull. 2016, 113, 7–16. [Google Scholar] [CrossRef] [PubMed]
  88. Fischer, E.K.; Gahrau, T.; Tamminga, M. Identification and Assessment of Potential Microplastic Emissions within the Lake Tollense Catchment Area, Mecklenburg-Western Pomerania, Germany. Sustainability 2023, 15, 15048. [Google Scholar] [CrossRef]
  89. Han, N.; Zhao, Q.; Wu, C. Threshold Migration Conditions of (Micro) Plastics under the Action of Overland Flow. Water Res. 2023, 242, 120253. [Google Scholar] [CrossRef]
  90. Yin, Z.; Zhao, Y. Microplastics Pollution in Freshwater Sediments: The Pollution Status Assessment and Sustainable Management Measures. Chemosphere 2023, 314, 137727. [Google Scholar] [CrossRef]
  91. Prarat, P.; Hongsawat, P.; Chouychai, B. Microplastic Occurrence in Surface Sediments from Coastal Mangroves in Eastern Thailand: Abundance, Characteristics, and Ecological Risk Implications. Reg. Stud. Mar. Sci. 2024, 71, 103389. [Google Scholar] [CrossRef]
  92. Chen, H.; Zhang, X.; Wang, H.; Xing, S.; Yin, R.; Fu, W.; Rillig, M.C.; Chen, B.; Zhu, Y. Arbuscular Mycorrhizal Fungi Can Inhibit the Allocation of Microplastics from Crop Roots to Aboveground Edible Parts. J. Agric. Food Chem. 2023, 71, 18323–18332. [Google Scholar] [CrossRef] [PubMed]
  93. Niu, L.; Hu, J.; Li, Y.; Wang, C.; Zhang, W.; Hu, Q.; Wang, L.; Zhang, H. Effects of Long-Term Exposure to Silver Nanoparticles on the Structure and Function of Microplastic Biofilms in Eutrophic Water. Environ. Res. 2022, 207, 112182. [Google Scholar] [CrossRef] [PubMed]
  94. Trifuoggi, M.; Pagano, G.; Oral, R.; Pavičić-Hamer, D.; Burić, P.; Kovačić, I.; Siciliano, A.; Toscanesi, M.; Thomas, P.J.; Paduano, L.; et al. Microplastic-Induced Damage in Early Embryonal Development of Sea Urchin Sphaerechinus granularis. Environ. Res. 2019, 179, 108815. [Google Scholar] [CrossRef] [PubMed]
  95. Jiang, J.; He, L.; Zheng, S.; Liu, J.; Gong, L. A Review of Microplastic Transport in Coastal Zones. Mar. Environ. Res. 2024, 196, 106397. [Google Scholar] [CrossRef]
  96. Wu, F.; Reding, L.; Starkenburg, M.; Leistenschneider, C.; Primpke, S.; Vianello, A.; Zonneveld, K.A.F.; Huserbråten, M.B.O.; Versteegh, G.J.M.; Gerdts, G. Spatial Distribution of Small Microplastics in the Norwegian Coastal Current. Sci. Total Environ. 2024, 942, 173808. [Google Scholar] [CrossRef]
  97. Ducklow, H.W.; Doney, S.C.; Steinberg, D.K. Contributions of Long-Term Research and Time-Series Observations to Marine Ecology and Biogeochemistry. Annu. Rev. Mar. Sci. 2009, 1, 279–302. [Google Scholar] [CrossRef]
  98. Karra, K.; Kontgis, C.; Statman-Weil, Z.; Mazzariello, J.C.; Mathis, M.; Brumby, S.P. Global Land Use/Land Cover with Sentinel 2 and Deep Learning. In Proceedings of the 2021 IEEE International Geoscience and Remote Sensing Symposium IGARSS, Brussels, Belgium, 11–16 July 2021; pp. 4704–4707. [Google Scholar] [CrossRef]
  99. Xu, X. China GDP Spatial Distribution Kilometre Grid Dataset; Resource and Environmental Science Data Registration and Publishing System: Beijing, China, 2017. [Google Scholar] [CrossRef]
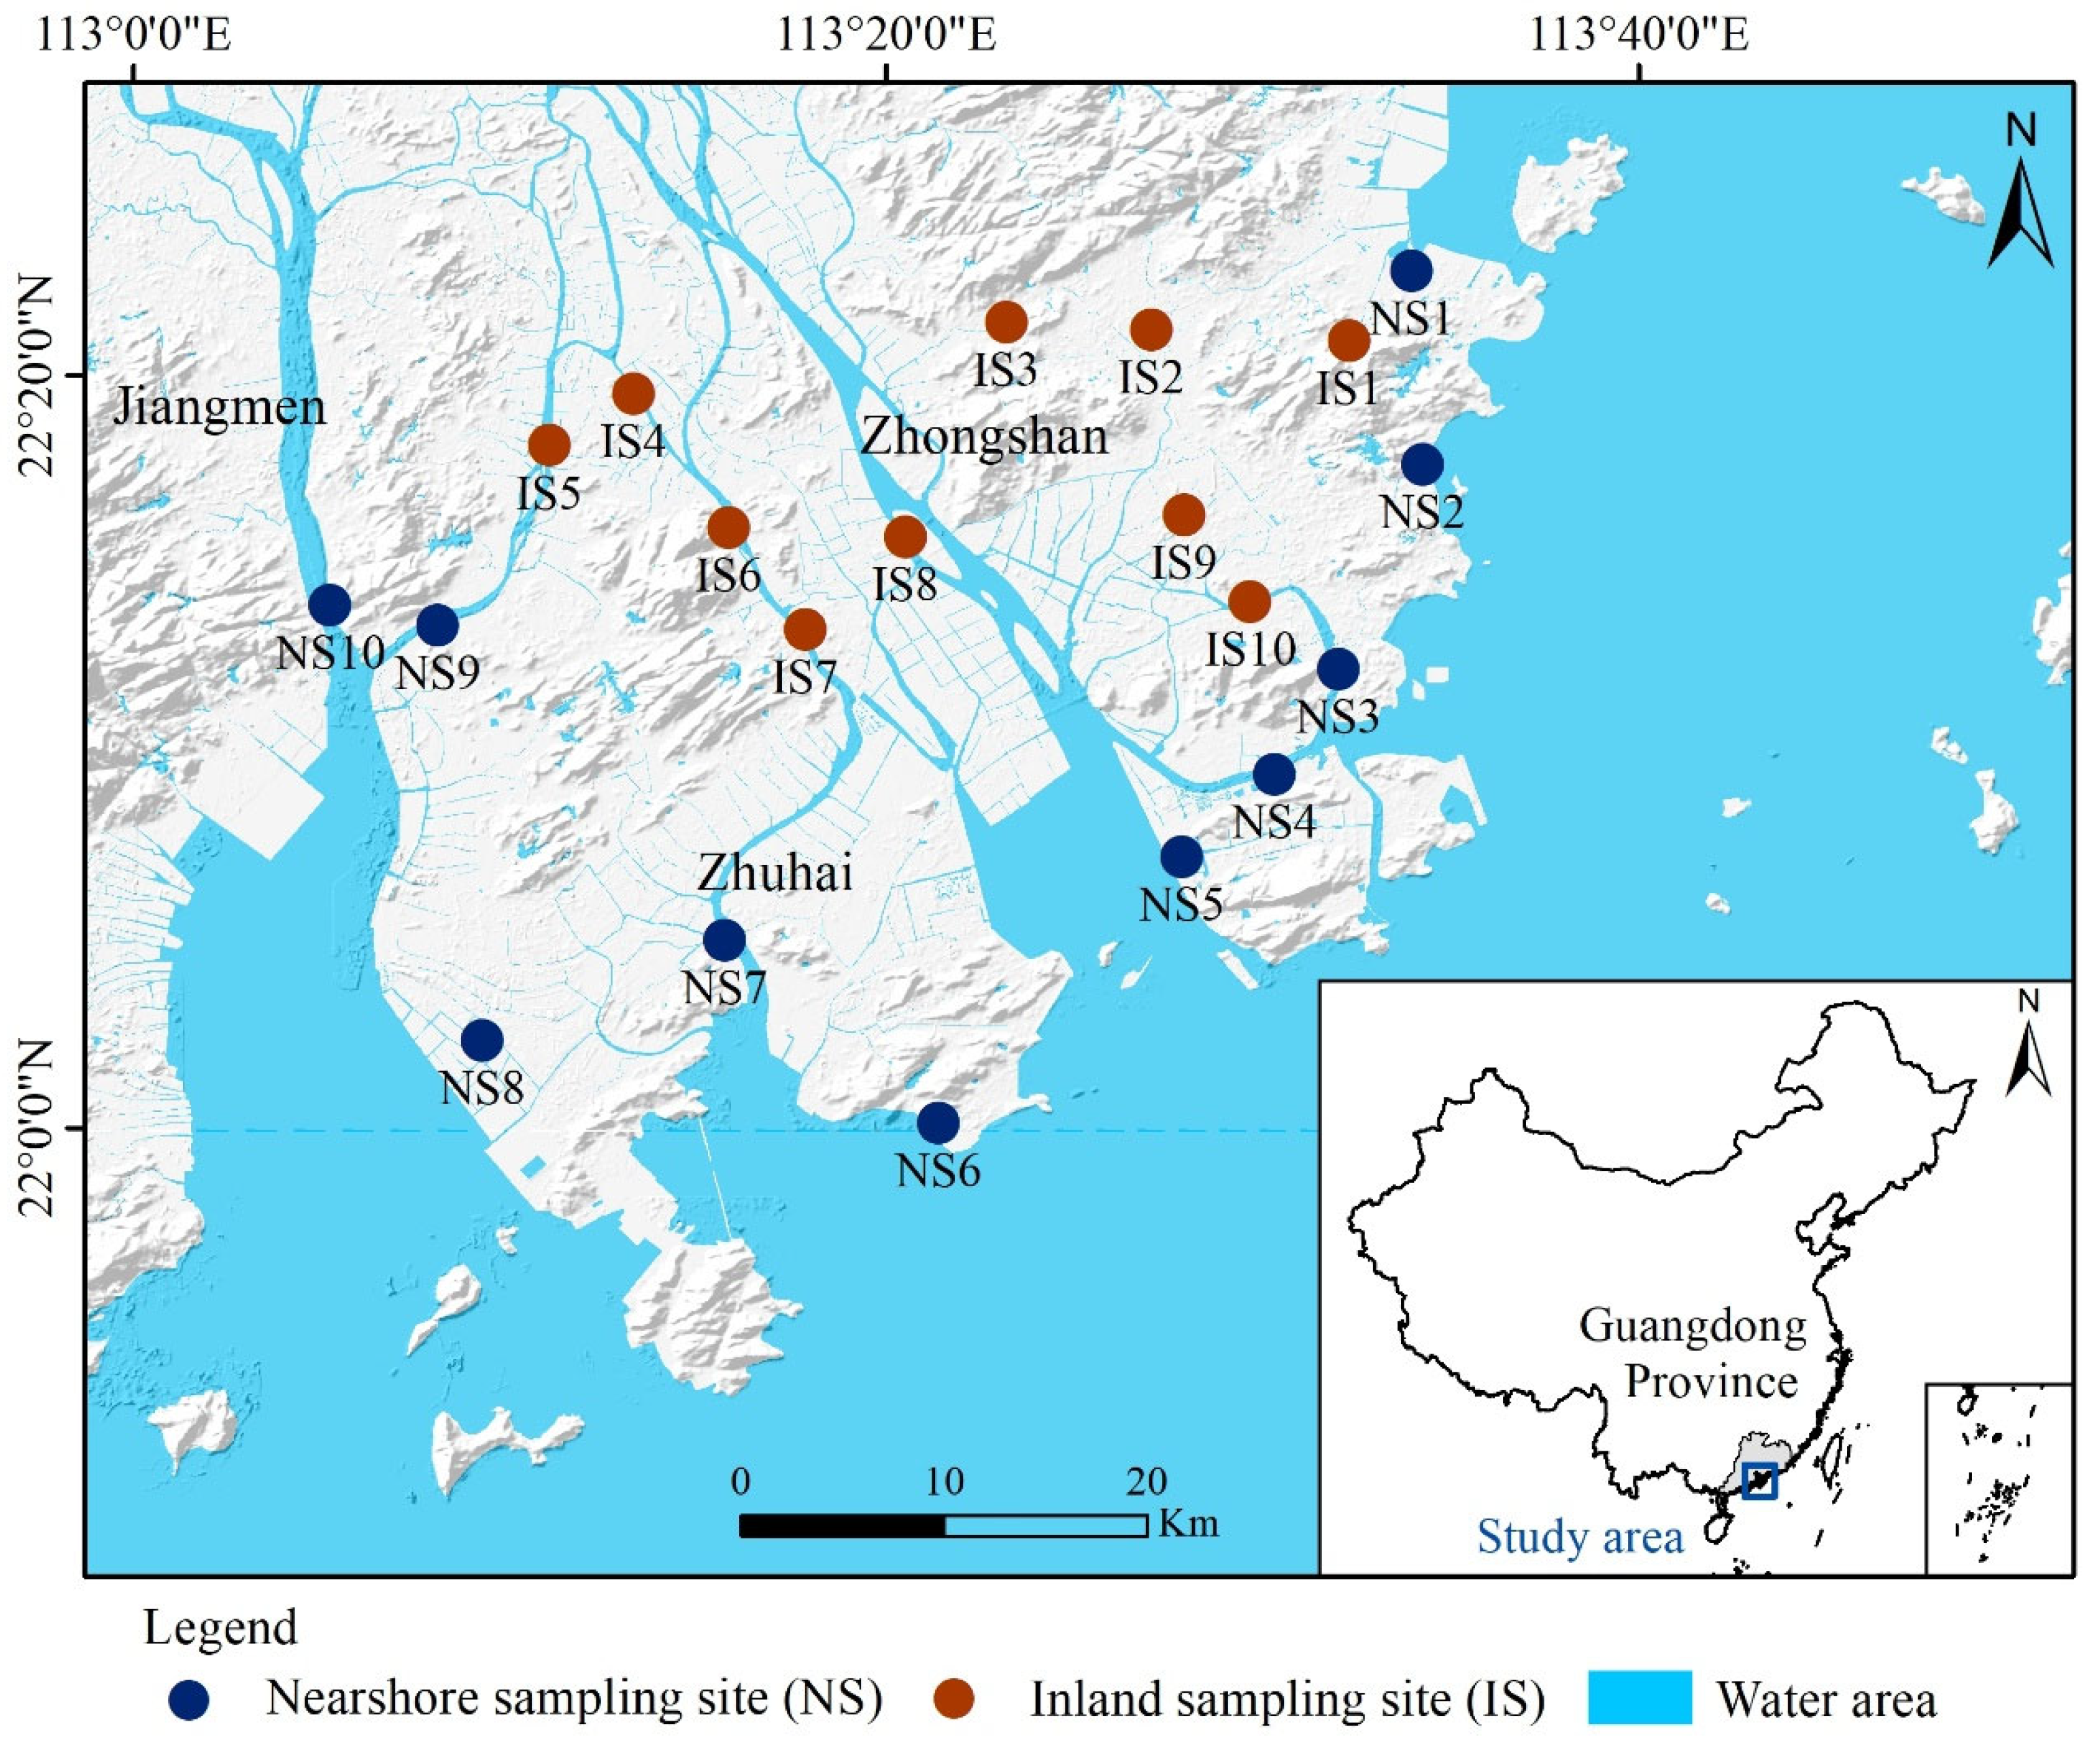
Figure 1. Location of river water and sediment samples for MPs investigation in the PRE region.
Water 17 02572 g001
Figure 2. IFs for MPs generation and migration in the river water and sediments of the PRE region.
Water 17 02572 g002
Figure 3. Statistical characteristics for IFs of MP pollution in the PRE region (The box represents the 25th–75th percentiles, the horizontal line represents the mean, and whiskers represent the maximum and minimum values).
Water 17 02572 g003
Figure 4. Spatial distribution of MPs in river water and sediments of the PRE region (PMMA: polymethyl methacrylate, PE: polyethylene, PP: polypropylene, PET: polyethylene terephthalate).
Water 17 02572 g004
Figure 5. Statistical characteristics of MPA and MDII indices in river water and sediments of the PRE region: (a) MPA; (b) MDII; (c) MPS’; (d) MPC’; (e) MPL’; (f) MPT’. (The box represents the interquartile range (25th–75th percentiles), the horizontal line indicates the median, and the whiskers represent the maximum and minimum values. A Mann–Whitney U test was conducted to assess differences between MPA and MDII. No significant differences (p > 0.05) were found between NS and IS, nor between river water and sediments.)
Water 17 02572 g005
Figure 6. RDA of IFs with MPA and MDII in river water (a) and sediments (b) of the PRE region.
Water 17 02572 g006
Figure 7. Identification of dominant IFs for MPA and MDII in river water and sediments of the PRE region based on PLSR (left column) and RR (right column). Results are shown for: (a,b) MPA in river water; (c,d) MDII in river water; (e,f) MPA in sediments; (g,h) MDII in sediments.
Water 17 02572 g007
Figure 8. PLI, PHI, and PERI degrees for MP pollution in river water and sediments of the PRE region.
Water 17 02572 g008
Disclaimer/Publisher’s Note: The statements, opinions and data contained in all publications are solely those of the individual author(s) and contributor(s) and not of MDPI and/or the editor(s). MDPI and/or the editor(s) disclaim responsibility for any injury to people or property resulting from any ideas, methods, instructions or products referred to in the content.