Article

Optimal Water Resource Allocation for Urban Water Systems in the Context of Greenhouse Gas Emission Reduction and Recycled Water Utilization

1
College of Hydraulic Engineering, Zhejiang Tongji Vocational College of Science and Technology, Hangzhou 311200, China
2
Zhejiang Institute of Hydraulics and Estuary (Zhejiang Institute of Marine Planning and Design), Hangzhou 310020, China
3
College of Hydrology and Water Resources, Hohai University, Nanjing 211100, China
4
School of Hydraulic Engineering, Zhejiang University of Water Resources and Electric Power, Hangzhou 310018, China
*
Author to whom correspondence should be addressed.
Water 2025, 17(17), 2568; https://doi.org/10.3390/w17172568
Submission received: 16 July 2025 / Revised: 22 August 2025 / Accepted: 28 August 2025 / Published: 30 August 2025

Abstract

Recycled water is commonly considered an environmentally friendly alternative water source for urban water systems, which can not only serve as a solution for water scarcity, but also reduce wastewater discharge from sewage systems. However, owing to the high degree of energy consumption during recycled water production, the utilization of recycled water may be detrimental to greenhouse gas emission reduction. In this work, we conduct a detailed investigation into greenhouse gas emissions from different sources in a typical multisource urban water system in China. Furthermore, we develop an optimization model for water resource allocation based on the rime optimization algorithm and regret theory. The results show that although greenhouse gas emissions from recycled water exceed those from other sources, their impact can be eliminated through rational water resource allocation. Specifically, compared with the original water resource allocation, the optimal results effectively reduce pollutant emissions by 7.6~11.1% without excessively increasing water resource shortages and greenhouse gas emissions. Additionally, both subjective preferences and recycled water utilization conditions have significant impacts on the optimization results, which should be carefully selected according to practical situations and technologies. Overall, the methods developed in this study provide a new general framework for the water resource allocation of multisource urban water systems in the context of greenhouse gas emission reduction and recycled water utilization, which can be employed in other areas.

1. Introduction

The continuous acceleration of global industrialization in recent decades has not only benefited humanity, but also adversely affected environmental systems, both in various ways, especially in densely populated urban areas. As indispensable systems for maintaining the operation of cities, urban water systems generally consist of water sources, water treatment facilities, distribution networks, and wastewater collection and treatment systems. However, the operation of urban water systems inevitably creates several adverse effects on the environment. First, the transmission and treatment of water resources require energy, which is relevant factor concerning greenhouse gas emissions [1,2,3,4]. Furthermore, wastewater from urban sewage systems is discharged into natural water bodies [5]. Although wastewater is treated before discharging, its water quality is still poorer than that of natural water bodies in most areas, thereby damaging the local environment [6]. Energy consumption and wastewater discharge during the operation of urban water systems are among the main causes of greenhouse gas emissions and the deterioration of water environments [7,8,9]. Moreover, with the economic development and population growth of recent decades, water resource demand in urban areas has increased, causing water resource shortages in many areas [10,11]. Unfortunately, due to the unique role of water resources in human socioeconomic activities, it is likely that such demand will continue to increase in the future, leading to more serious water shortages and environmental problems [12].
To overcome water shortages and problems with wastewater discharge, recycled water is used in many areas as a supplementary source for urban water systems; thus, these areas have multisource urban water systems [13,14]. Recycled water refers to water that has been treated to meet certain water quality standards and requirements for a specific purpose [15]. Moreover, recycled water can be reused. From the perspective of water supply and environmental protection, recycled water is an ideal water source that does not increase wastewater discharge and can partially meet water demands [16]. However, treating wastewater with recycled water consumes more energy than treating it with dischargeable wastewater, resulting in more greenhouse gas emissions [17]. Specifically, the utilization of recycled water is a double-edged sword; on the one hand, it is beneficial for improving the safety of urban water systems, preserving natural water resources, and protecting the environment, but on the other hand, it is not conducive to reducing greenhouse gas emissions. Many former studies have pointed out that optimal water resource allocation is an effective way of balancing different objectives in multisource urban water systems due to the difference in the characteristics of water resources from different sources [18,19,20].
Optimal water resource allocation refers to the rational distribution of limited water resources among time, space, and users in specific regions. Mathematical methods such as linear programming, nonlinear programming, and dynamic programming are often used in the research of optimal water resource allocation in early stages [21,22]. However, with social and economic development, urban water systems have become increasingly complex, leading to an increase in decision variables in optimal water resource allocation. These traditional mathematical methods are generally troubled by the curse of dimensionality. To solve this problem, several metaheuristic algorithms, such as genetic algorithm and particle swarm optimization, are used for optimizing water resource allocation [23,24]. In addition, early water resource allocation optimization only focuses on water shortage issues, which is a single-objective optimization problem. In recent years, increasing awareness of environmental protection has led hydrological researchers to pay attention to the environmental influence of optimal water resource allocation, which has transformed it into a multiobjective optimization problem [25,26,27]. Although there have been many studies on multiobjective water resources optimization, few have considered the contradiction between greenhouse gas emissions and recycled water utilization. Therefore, there is still an urgent need for urban water systems to develop a feasible method of balancing water supply, water environment protection, and greenhouse gas reduction; this will need to be done by rationally allocating multiple water sources according to their unique characteristics, considering greenhouse gas emission reduction and the utilization of recycled water.
In this work, a general optimization framework for water resource allocation in urban water systems is developed to alleviate these three contradicting objectives, that is, water supply, water environmental protection and greenhouse gas emissions. First, a detailed investigation is conducted to estimate the greenhouse gas emissions produced by various processes that are conducted in a multisource urban water system in Yiwu city, China. Then, the optimization framework is established via a new physics-based optimization algorithm and regret theory to solve the multiobjective optimization problem. In addition, several possible scenarios for water resource allocation are analyzed and discussed to provide additional information for the formulation of water resource management policies. In the next section, an overview of our study area, data sources, and methodology are provided. Detailed information about the results is given in Section 3, while Section 4 provides a detailed discussion. Finally, the conclusions are provided in Section 5.

2. Materials and Methods

2.1. Study Area and Data Sources

2.1.1. Study Area

Yiwu city is located in Zhejiang Province, southeast China, with an area of 1105.48 km2 (Figure 1). The city is famous for having the world’s largest small commodity market, which has a very large population and developed industries. According to the government report of Yiwu city, the permanent population and gross domestic product (GDP) of the city in 2023 were 1.903 million and CNY 20.5562 billion (about USD 2.8630 billion), respectively. The concentrated population and industry have increased the demand for water resources, thereby threatening the safety of water supply. To address this problem, multiple countermeasures have been formulated by the local government. First, two large cross-regional water diversion projects have been built, which can supply 90 million m3 of water resources to Yiwu city per year. Second, a fully connected urban water system has been built in Yiwu city, indicating that water resources can be uniformly allocated throughout it. Finally, many recycled water facilities, including water reclamation plants and corresponding pipe networks, have already been applied to meet part of the demand for residential, municipal, and industrial water consumption [28]. Currently, the recycled water has been widely used by different users in Yiwu city. For example, by residential users for flushing toilets, by industrial users for cleaning plants or cooling equipment, and by municipal users for watering green spaces or firefighting. The above characteristics make the urban water system of Yiwu city a suitable case for this study.

2.1.2. Urban Water System in Yiwu City

Generally, urban water systems feature four main processes: water intake, water supply, water use, and drainage (Figure 2). Specifically, the system first intakes raw water resources from various sources to water plants (the water intake process). Second, they are treated in water plants (the water supply process) and supplied to users through a pipe network (the water use process). Finally, the users’ wastewater is collected by the sewage treatment plant for drainage or water reclamation (the drainage process). In addition, the urban water system of Yiwu city has two main water sources, which can be classified as high-quality or recycled water. High-quality water is sourced from local reservoirs and water diversion projects, and is mainly used to meet water demands with high quality requirements. Conversely, recycled water is produced by wastewater treatment and can be used as an alternative to high-quality water to fulfill demands with low quality requirements. It is also worth noting that recycled water is delivered by dedicated infrastructure, independent to that used for supplying high-quality water. Therefore, it is feasible to clearly distinguish between the consumption of the two different types of water in this system.

2.1.3. Data Sources

In previous studies, scholars have noted that urban water systems emit greenhouse gas throughout their lifecycles, including their construction, operation, and demolition. However, since the urban water system of Yiwu city has already been built, only greenhouse gas emissions in the operation phase are considered in this work. Data on the engineering, water supply, and energy consumption involved in the urban water system used in this work are collected through a detailed field survey conducted by the local government, which ensures its authenticity and comprehensiveness.

2.2. Methodology

2.2.1. Estimation of Greenhouse Gas Emission

Since there is no uniform definition of the range of greenhouse gases, three different greenhouse gases, namely, carbon dioxide (CO2), methane (CH4) and nitrous oxide (N2O), are used in this study because of their contributions to the greenhouse effect. In this study, the global warming potential (GWP) proposed by the Intergovernmental Panel on Climate Change (IPCC) is employed to make different greenhouse gases comparable and interconvertible. According to the report from the IPCC, the GWP for CO2 is set to 1, whereas the GWPs for CH4 and N2O are set to 28 and 26.5, respectively. Therefore, the equivalent value of CO2 is used as a calculation unit in this work [29].
The greenhouse gas emissions per cubic meter of water consumed from different sources in the operation phase are estimated via life cycle assessment (LCA). More detailed information about the LCA can be found in the literature [30,31,32].
(1)
High-quality water
The greenhouse gas emission process that occurs during the consumption of high-quality water consists of four procedures, i.e., water intake, water supply, water use and drainage. This process can be written in the form of the following equation:
E H Q = E H Q I n t a k e + E H Q S u p p l y + E H Q U s e + E H Q D r a i n a g e
Here, E H Q represents the greenhouse gas emissions per cubic meter of high-quality water consumption and E H Q I n t a k e , E H Q S u p p l y , E H Q U s e , and E H Q D r a i n a g e represent the greenhouse gas emissions per cubic meter of high-quality water consumption in the water intake, supply, use, and drainage processes, respectively.
Notably, there are two main sources of high-quality water in the urban water system of Yiwu city: local reservoirs and cross-regional water diversion projects. The E H Q S u p p l y , E H Q U s e , and E H Q D r a i n a g e values for the two sources are the same and can be estimated by the energy consumption per cubic meter of water (Equation (2)):
E H Q S u p p l y E H Q U s e E H Q D r a i n a g e = δ · W H Q S u p p l y W H Q U s e W H Q D r a i n a g e
where δ represents the regional electricity emission factor, with a value of 0.7921 kgCO2eq/kWh (obtained from the General Rules for Comprehensive Energy Consumption Calculation (GB/T 2589-2008)) [33] and W H Q S u p p l y , W H Q U s e , and W H Q D r a i n a g e represent the energy consumption per cubic meter of water from different processes in the operation phase.
For the water intake process, the greenhouse gas emissions of high-quality water from reservoirs and water diversion projects can be estimated via Equations (3a) and (3b), respectively.
E H Q I n t a k e , R = δ W H Q I n t a k e , R
E H Q I n t a k e , L = i = 1 n ( W l l i + g h i ρ 3.6 × 10 6 η i ) δ
where W H Q I n t a k e , R represents the energy consumption per cubic meter of water from the local reservoir; W l represents the water diversion energy intensity, with a value of 9.73 × 10 6 kWh/(m3·km); l i represents the distance for the i th consecutive ascending segment of the water diversion project (km); n represents the number of consecutive ascending segments of the water diversion project; g represents the gravitational acceleration, i.e., 9.8 m/s2; h i represents the pumping height for the i th consecutive ascending segment of the water diversion project (m); ρ represents the density of water (1000 kg/m3); and η i represents the efficiency of the pump for the i th consecutive ascending segment of the water diversion project, which generally ranges from 75% to 85%.
(2)
Recycled water
Unlike high-quality water, recycled water does not come from natural water bodies; it is produced in recycled water plants. Therefore, there is no water intake process during the application of recycled water. The greenhouse gas emissions from recycled water consumption can be estimated as:
E R = E R S u p p l y + E R U s e + E R D r a i n a g e
where E R represents the greenhouse gas emissions per cubic meter of recycled water consumption, and where E R S u p p l y , E R U s e , and E R D r a i n a g e represent the greenhouse gas emissions per cubic meter of recycled water consumption in the water supply, use, and drainage processes, respectively.
Similarly, E R S u p p l y , E R U s e , and E R D r a i n a g e can be estimated from the level of energy consumption, as in Equation (2).

2.2.2. Estimation of Available Water Resources from Sources

Unlike greenhouse gas emissions from water sources, which can be considered constant over temporal scale, the available resources from water sources are constantly changing over time and are affected by hydrological wet and dry cycles as well as regional water consumption. For convenience of optimization calculation, the typical-year method is employed in this work to calculate the available water resources under several specific guaranteed rates, which are a hydrological statistical concept. For a specific value of an available water resource, its corresponding guaranteed rate is the proportion of years with larger available water resources than it in a long-term series. Let a w t represent the available water resources in the t th year; its corresponding guaranteed rates can be calculated as:
α i = 1 , a w i > a w t 0 , o t h e r w i s e , i = 1 , 2 , , n P = i = 1 n α i n + 1
where a w i represents the available water resources in the i th year; n is the total number of years, and P is the corresponding guaranteed rate for a w t .
According to long-term available water resource series, it is possible to generate the corresponding guaranteed rate series via Equation (5), and mutual calculations between specific water resources and guarantee rates can be performed based on this series through linear interpolation. Generally, several specific representative guaranteed rates are selected for further analysis in practical applications, where the years selected are called typical years.

2.2.3. Rime Optimization Algorithm

The rime optimization algorithm (RIME) is a powerful physics-based optimization algorithm proposed in 2023, and it has been commonly used in solving optimal problems from different fields [34,35]. The basic concept of the RIME comes from the simulation of the soft-rime and hard-rime growth processes of rime-ice. Compared to other optimizers, there are three main improvements in RIME, i.e., the soft-rime search strategy, the hard-rime puncture mechanism, and the improved greedy selection mechanism. Like other various population optimization algorithms, such as gene algorithms, the first step of RIME is to initialize the whole rime population R . For an optimal problem with m dimensions, the whole rime population is composed of n rime agents S i ( i = 1,2 , , n ) with m rime particles x i , j ( j = 1,2 , , m ) . Therefore, the rime population R can be written as follows:
R = S 1 S 2 S n , S i = x i 1 x i 2 x i m
The position of x i j in the rime population R can be initialized via the following equation:
x i j = L B j + r a n d × ( U B j L B j ) , i = 1 , 2 , , n ; j = 1 , 2 , m
where r a n d is a random value within a range of [0, 1] and L B j and U B j are the lower and upper boundaries of the j th particles, respectively.
(1)
Soft-rime search strategy
The soft-rime search strategy is a search strategy with strong randomness and coverage, which can ensure that the algorithm quickly covers the entire search space in early iterations, but changes slowly in the same direction, thus avoiding becoming stuck in local optimal solutions. The specific formula is as follows:
x i j n e w = x b e s t , j + r 1 cos θ β [ h ( U B j L B j ) + L B j ) , r 2 < E
Here, x i j n e w is the new position for the j th particle of the i th agent; x b e s t , j is the location for the j th particle of the best rime agent in the current iteration; and r 1 is a random value between [−1, 1] used to dictate the direction of rime particle movement with c o s θ , which changes with the number of iterations (Equation (9)); β is the environment factor, which is used to simulate the impact from the external environment to ensure the convergence of the RIME and is related to the number of iterations (Equation (10)); h represents the degree of adhesion, which is a random value from the range of (0, 1) and is used to control the distance between the centers of two rime particles; E is the coefficient of being attached and can be estimated by Equation (11); r 2 is a random value between [0, 1]; and r 2 and E jointly control whether condensation of the rime particle occurs, i.e., whether the position of the rime particles is updated.
θ = π t 10 T
β = 1 f ( w t T ) / w
E = ( t / T )
where t denotes the current number of iterations; T denotes the maximum number of iterations; f ( · ) denotes the rounding function; and w denotes the number of segments of the step function with a default value of 5. Equation (9) to Equation (11) indicate that all three parameters, i.e., θ , β , and E , increase with the current number of iterations, which makes it possible to control the update rate of the position of a rime particle.
(2)
Hard-rime puncture mechanism
The main aim of the hard-rime puncture mechanism is to improve the convergence of the algorithm and the ability to escape from local optimal solutions by exchanging the rime particles. The mathematical expression for the hard-rime puncture mechanism can be written as:
x i j n e w = x b e s t , j , r 3 < F n o r m r ( S i )
where r 3 is a random value between [−1, 1] and F n o r m r ( S i ) is the normalized value of the current agent fitness value. Specifically, the combination of r 3 and F n o r m r ( S i ) controls whether hard-rime puncture occurs.
(3)
Positive greedy selection mechanism
The traditional greedy selection mechanism has been commonly used in various evolutionary algorithms. Technically, the greedy selection mechanism updates the global optimum by comparing the updated fitness values of the agents and the current global optimum after each update of the agents. Specifically, if the updated fitness value of an agent is better than the current global optimum, then the greedy selection mechanism will replace and record the updated fitness value as the new global optimum. Previous studies have shown that the traditional greedy selection mechanism has advantages in computational simplicity and speed, but its impact on the optimization process is quite limited. Therefore, a more aggressive mechanism is developed in the RIME called the positive greedy selection mechanism. Unlike the traditional greedy selection mechanism, which only compares the fitness value of the updated agent with the global optimum, the positive greedy selection mechanism first compares the updated and original fitness values of the agent. Only when the updated fitness value is better than the original fitness value will the agent and its corresponding fitness values be replaced. Then, the same operation as the traditional mechanism is performed. More detailed information about the positive greedy selection mechanism can be found in the literature.
(4)
Multiobjective RIME
The original RIME was developed for single-objective optimization problems; however, practical applications have various multiobjective optimization problems. To solve the above problems, a multiobjective RIME (MORIME) is developed by introducing a nondominated sorting method and a diversity-preserving crowding distance approach from the nondominated sorting genetic algorithm II (NSGA-II) [36]. More detailed information about the MORIME can be found in the literature [37], and the MORIME flowchart is presented in Figure 3.

2.2.4. Regret Theory

For a multiobjective optimization problem, optimization algorithms, like MORIME, can only reveal the Pareto frontier. Therefore, regret theory is also employed in this work to determine the Pareto optimal solution from the Pareto frontier. Regret theory is a descriptive decision-making theory based on the concept of bounded rationality that has been commonly applied to solve multiobjective optimal problems in different studies [38,39]. The core concept of this theory is that decision-makers compare their current situation with a possible situation they might be in if they adopt other feasible decisions that they have not actually chosen. If decision-makers believe that the current situation is not as good as the possible situation that would arise if they had chosen otherwise, they will feel regret; otherwise, they will feel happy. In this work, the generalized random regret minimization (GRRM) model proposed by Chorus in 2014 is employed as a function to estimate the regret levels of decision-makers [40].
It is assumed that there are N different decisions for the current situation and that each decision is composed of M different attributes. x i k ( i = 1,2 , , N ; k = 1,2 , , M ) represents the value of the k th attribute in the i th decision. Additionally, the values of the same attributes between different decisions i and j can be compared. R i j k represents the regret caused by selecting decision i rather than decision j , which can be calculated via the following equation:
R i j k = ln ( γ + exp [ β k ( x j k x i k ) ] )
where β k is the estimable preference parameter for the k th attribute, which represents the influence of the attribute on the regret measurement and can reflect the preferences of decision-makers for different attributes, and γ is the regret weight ranging from 0 to 1, which represents the intensity of regret.
According to Equation (13), a positive R i j k indicates that the decision-maker feels regret in the k th attribute for choosing the i th decision rather than the j th decision. In contrast, if the decision-maker feels happy in choosing the i th decision rather than the j th decision in the k th attribute, then R i j k is negative.

2.2.5. Optimal Water Resource Allocation Model

(1)
Objective Functions
Traditionally, the optimal water resource allocation is a single-objective problem that focuses only on reasonably allocating water resources from different sources to meet the demands of different users as much as possible [41,42,43]. However, with the gradual popularization of the concepts of environmental protection and sustainable development, the problem of optimally allocating water resources has gradually become more complicated and has developed into a multiobjective optimization problem. In accordance with the main aim of this work, the following three objective functions are employed.
The first objective is to ensure the safety of the water supply to meet the water demands of different users as much as possible. Here, we use the minimization of water shortages from different users as the objective function:
min f 1 = i = 1 N j = 1 M ( d j β i , j x i , j ) α j
where N and M are the numbers of water sources and users in the urban water system, respectively; d j is the water demand for the j th user; x i , j is the amount of water resources supplied from the i th source to the j th user; α j is the importance coefficient of the j th user, that can be calculated via Equation (15); and β i , j is a variable with a value of 0 or 1 that represents the relationship between water sources and users. If the water resources from the i th source can be supplied to the j th user, then β i , j = 1 ; otherwise, β i , j = 0 .
α j = 1 + M n j j = 1 J n j
where n j represents the order of the j th water user.
Since one of the main goals of this study is to reduce the greenhouse gas emissions of urban water systems through optimal water resource allocation, the minimization of greenhouse gas emissions during the operation phase is employed as an objective, and can be written as:
min f 2 = i = 1 N j = 1 M β i , j E i , j x i , j
where E i , j is the amount of greenhouse gas emission generated per cubic meter of water from the i th source to the j th user during the operation period.
Previous studies have noted that it is possible to protect the environment through optimal water resource allocation in urban water systems [44,45]. For example, the application of recycled water can effectively reduce the discharge of wastewater, which is beneficial for improving the river environment. Here, the amount of pollutants in wastewater is employed to represent the impact of the urban water system on the environment. Accordingly, a function used to minimize pollutant discharge is selected as an objective:
min f 3 = j = 1 M β i , j p j δ j x i , j
where p j is the sewage discharge coefficient of the j th user and δ j is the content of important pollutant factors in the unit discharge of the j th user. Furthermore, since recycled water is not discharged into the natural environment but is instead reused in the urban water system, its pollutant discharge is zero.
(2)
Constraint conditions
There are two main constraint conditions for the optimal water resource allocation of urban water systems: the water resources that are available and the water demand. The two constraints can be written as:
0 j = 1 M x i , j A i
0 i = 1 N x i , j d j
where A i represents the available water supply of the i th source.

3. Results

3.1. Overview of the Data

3.1.1. Calculation of the Greenhouse Gas Emissions of Different Water Sources

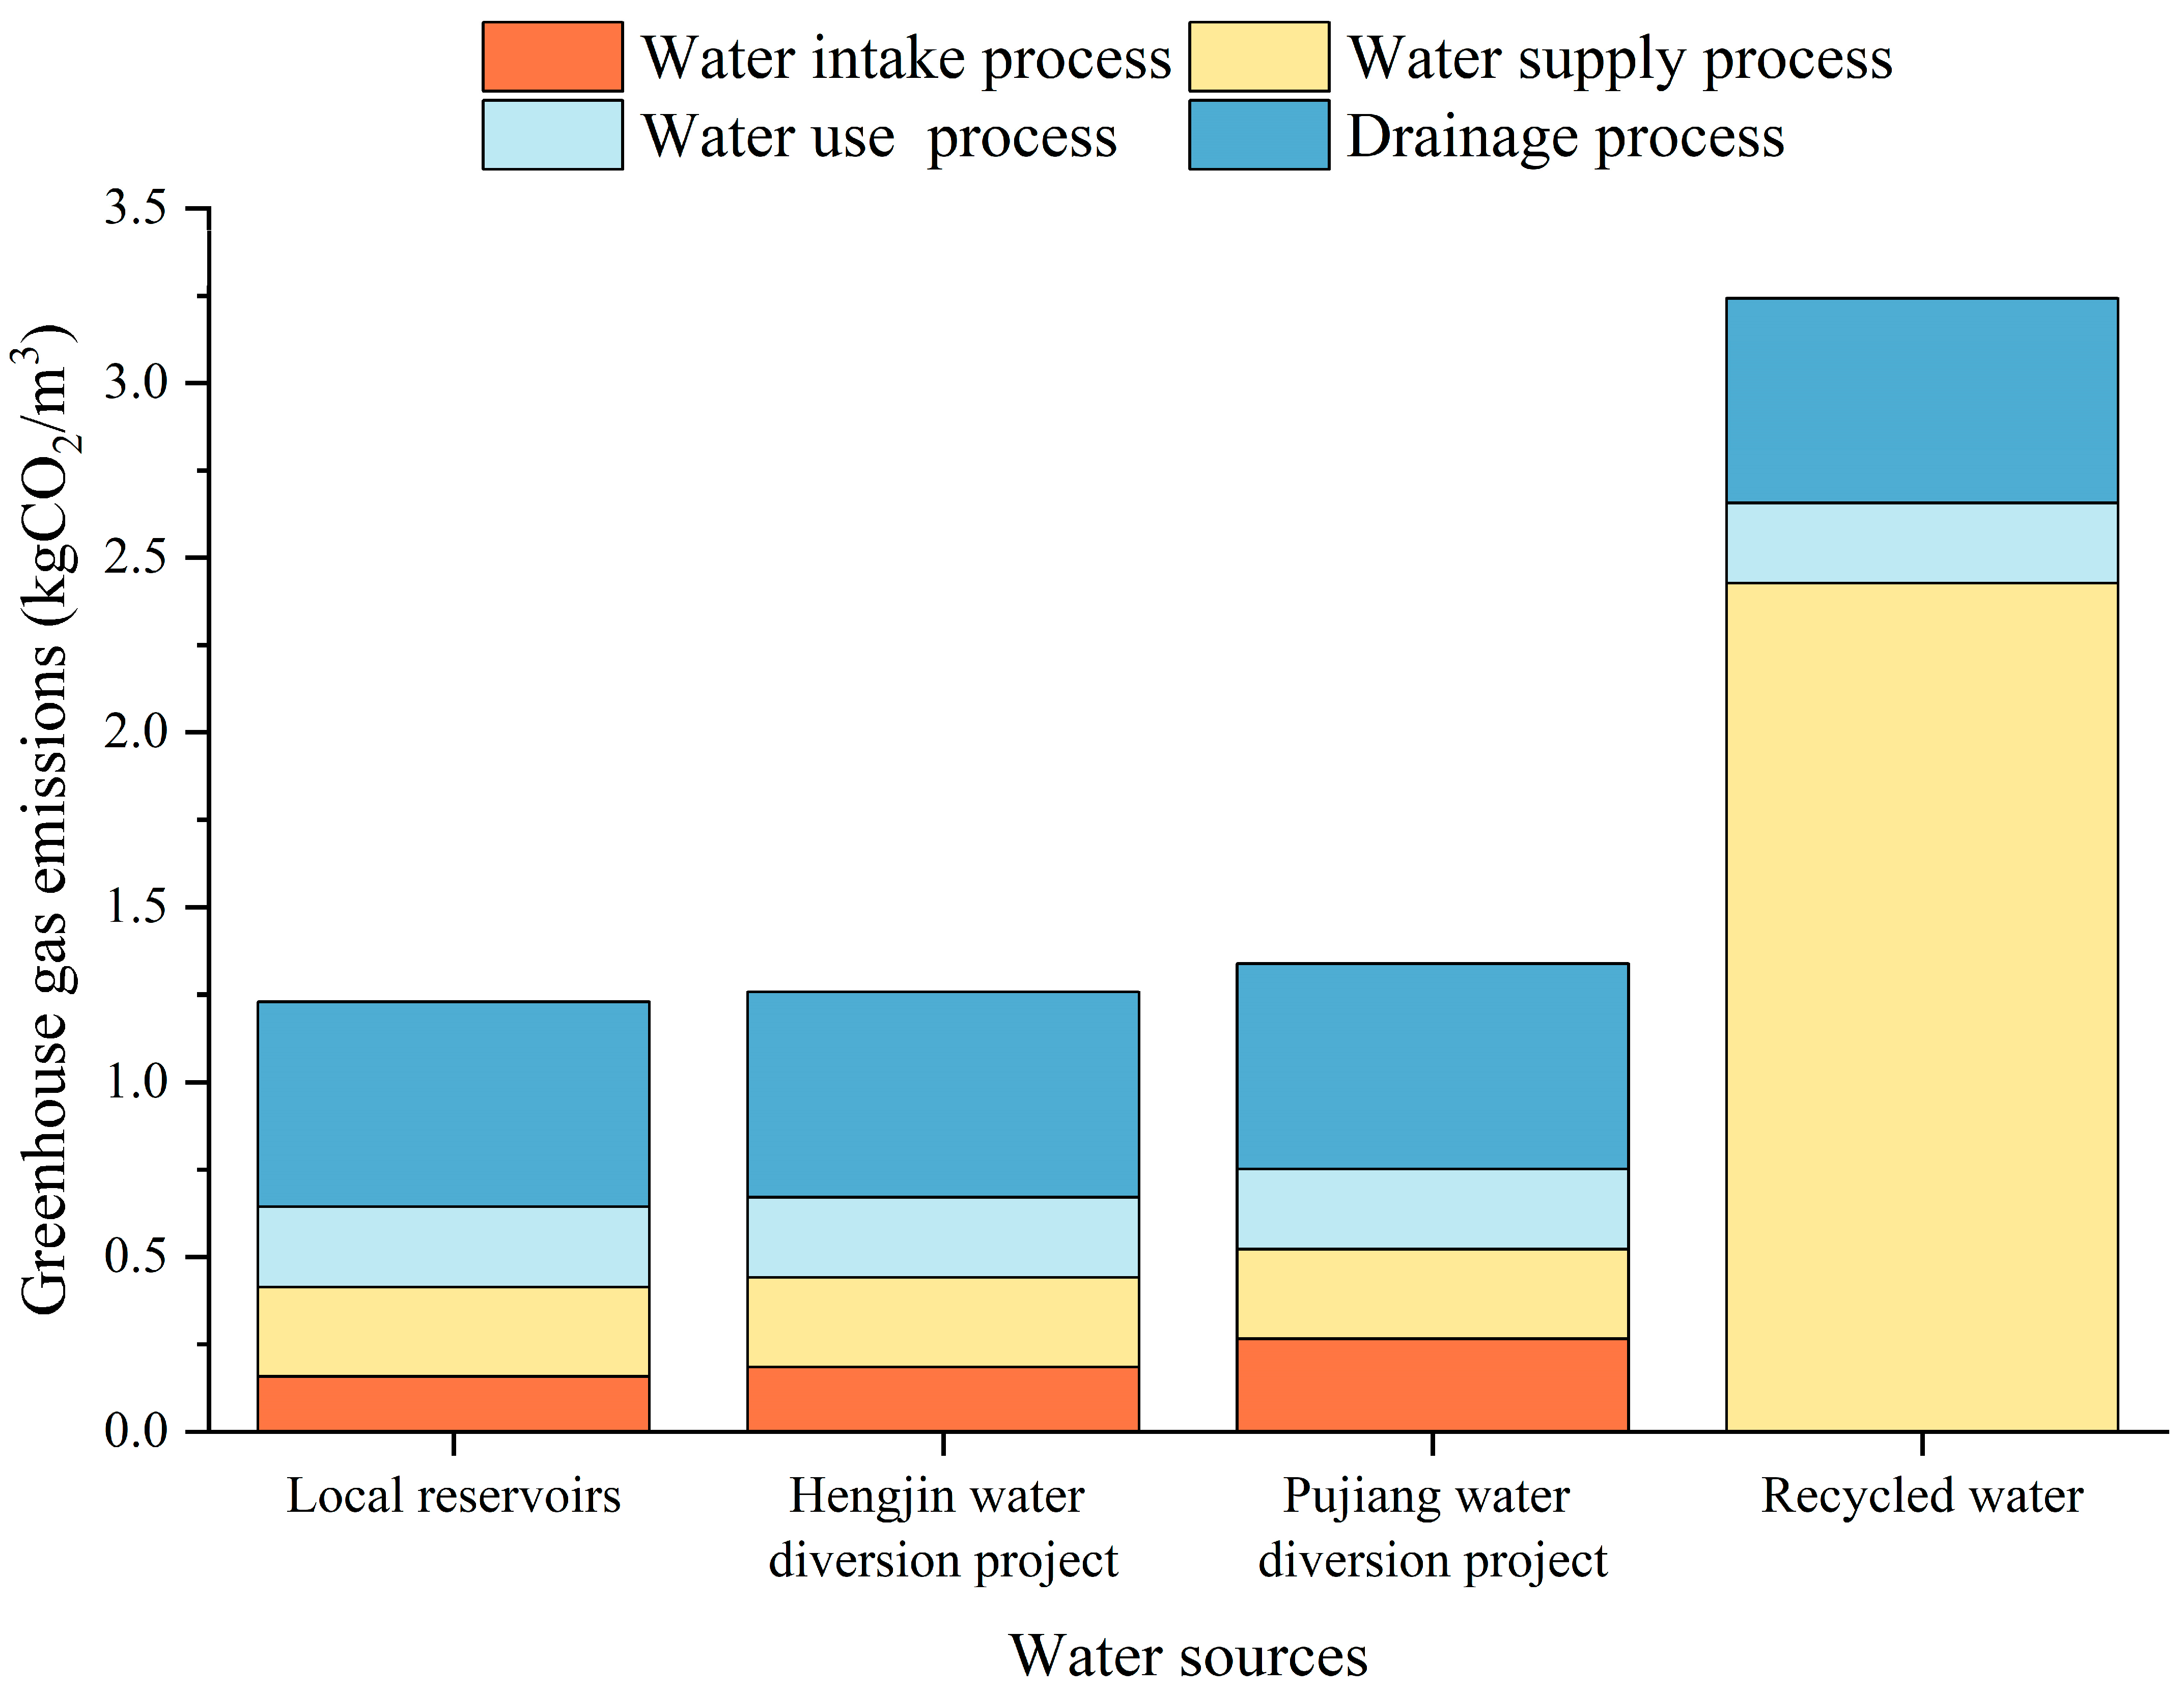
First, the greenhouse gas emissions from different water sources of the Yiwu urban water system are estimated via Equations (1)–(4). Figure 4 presents the estimation results for different processes during the operation phase. As shown in Figure 4, the greenhouse gas emissions from the local reservoirs are the lowest, whereas the water resources from recycled water are the highest. The greenhouse gas emissions sourced from the two water diversion projects are slightly greater than those of local reservoirs, which is caused mainly by the energy consumed during the long-distance water transportation. Furthermore, the compositions of total greenhouse gas emissions are significantly different between high-quality water sources (including local reservoirs and two water diversion projects) and recycled water. Greenhouse gas emissions from recycled water are concentrated in the water supply process, while the drainage process emits more greenhouse gas than other processes for high-quality water. These results indicate that the production of recycled water leads to a large amount of greenhouse gas emissions, even more than the emissions of other water sources throughout the operation process. The main reason for the high greenhouse gas emissions of recycled water is the different treatment processes. The recycled water is generated from wastewater, which is of poorer water quality than other sources. Therefore, it is necessary to employ more complex water treatment technologies to meet the requirements of water users than water from other sources, resulting in more energy consumption in the water supply process.

3.1.2. Data on the Available Water Resources and Water Demand

Since the annual and interannual changes in water resources are natural, the available water resources of reservoirs are constantly changing. In this work, the typical year method is employed to estimate the available water resources of reservoirs under the conditions of different guaranteed rates. Since the water resource shortages are more serious in dry years, meaning that dry years are unfavorable for the urban water system and may aggravate the contradiction between the three objectives, in this work we select three dry years with relatively high guaranteed rates, namely, 75%, 90%, and 95%. It is worth noting that other guaranteed rates are also applicable to the framework developed in this work, and users can select rationale guaranteed rates at their own discretion. The results are presented in Figure 5. Figure 5 shows that the amount of available reservoir water resources decreases with increasing guaranteed rate. Notably, the amounts of water available from the other resources are estimated on the basis of the water supply capacities of the projects and are not affected by annual or interannual changes in water resources.
In this work, three different users of the urban water system are considered: residential, municipal, and industrial water users. The water demand of each user is recorded from local government reports. Furthermore, owing to the different requirements for water quality among different users, it is necessary to clarify the relationships between water sources and water users before conducting optimization calculations. According to a local government survey, high-quality water from local reservoirs and water diversion projects is acceptable to all users, whereas recycled water can only replace some of the high-quality water required for residential, municipal, and industrial water users, accounting for 10%, 30%, and 40%, respectively. Detailed information about water users and their demands is presented in Table 1.
According to the results from Figure 5 and Table 1, the water demands of each kind of water user are close to the available amount of high-quality water at guaranteed rates of 75% and 90%, whereas the available high-quality water can no longer meet their demands at a guaranteed rate of 95%. Therefore, it is necessary for the urban water system in Yiwu city to replace high-quality water with recycled water.

3.2. Optimization of Water Resource Allocation

3.2.1. Optimal Results

For a multiobjective optimization problem, the relationships among objectives should be contradictory. Specifically, multiple objectives cannot be optimized at the same time; if that occurs, the problem can be simplified as a single-objective optimization problem. According to the three objective functions (Equations (13), (15) and (16)) and the data used in this work, the three objectives have contradictions. To minimize the water shortages of different water users, it is necessary to increase the water supply of each source (Equation (14)), which inevitably leads to more greenhouse gas emissions and pollutant discharge and is thus not conducive to the other objectives (Equations (15) and (16)). Additionally, the greenhouse gas emissions of recycled water are greater than those of other water sources. However, the pollutant discharge level of recycled water is 0, which suggests that the objectives of Equations (16) and (17) are contradictory as well.
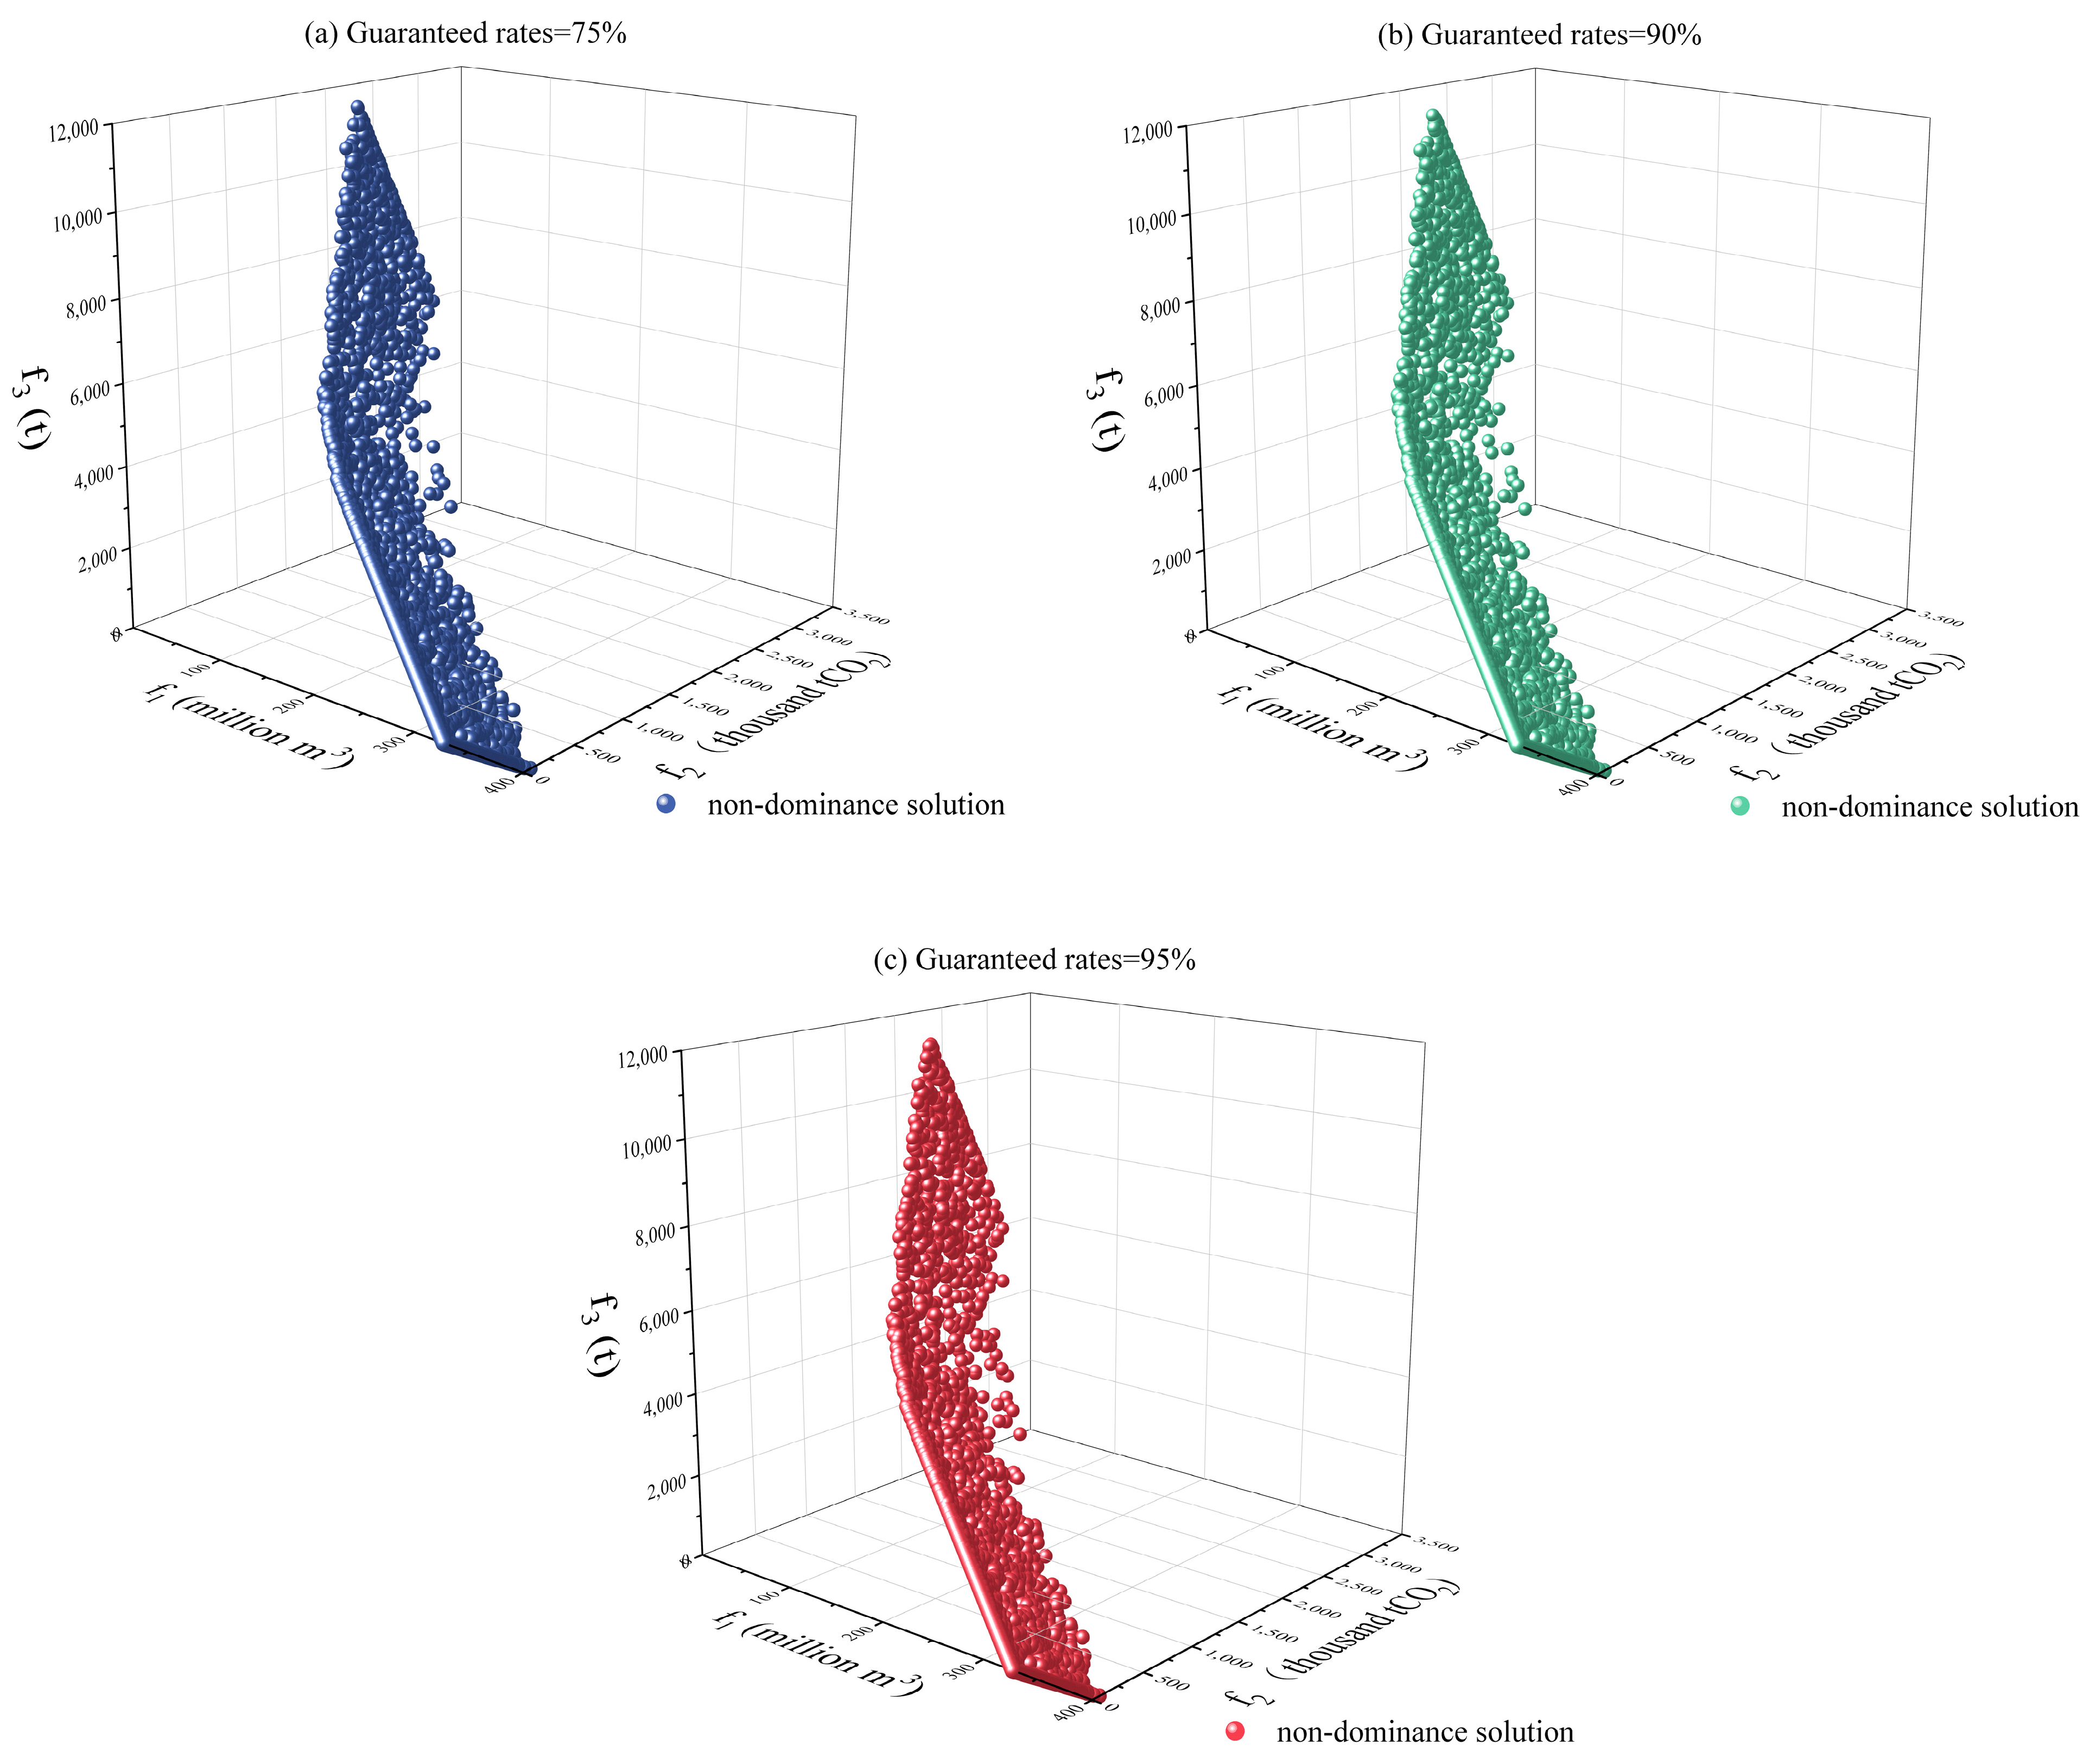
In this work, the whole rime population R is set to 5000, and the maximum number of iterations is 100,000. Furthermore, we did not set conditions for the premature termination of the optimization, which is consistent with the original algorithm of Pandya et al. [29]. In other words, the optimization algorithm will not terminate until 100,000 iterations are completed. The results of the MORIME under different guaranteed rates are presented in Figure 6, which shows that the distributions of the Pareto frontier under different guaranteed rates are quite similar. Furthermore, the results in Figure 6 intuitively demonstrate the contradiction between the three objective functions; that is, it is impossible for the three objective functions to reach the optimal state at the same time.
Although multiobjective decision-making methods have made great progress in recent decades, completely abandoning the subjective preferences of decision-makers is still very difficult, especially for optimization problems such as water resource allocation that are closely related to human life. In regret theory, the preference parameter β k in Equation (13) is employed to express the decision-maker’s preferences. Here, β k values of 0.7, 0.2, and 0.1 for f 1 , f 2 , and f 3 are employed on the basis of the expert opinion of the local water resource management department. Additionally, more discussion about the preference parameters is presented in the next section. Table 2 presents the optimal results of the objective functions for the water resource allocation of the urban water system in Yiwu city under different guaranteed rates.
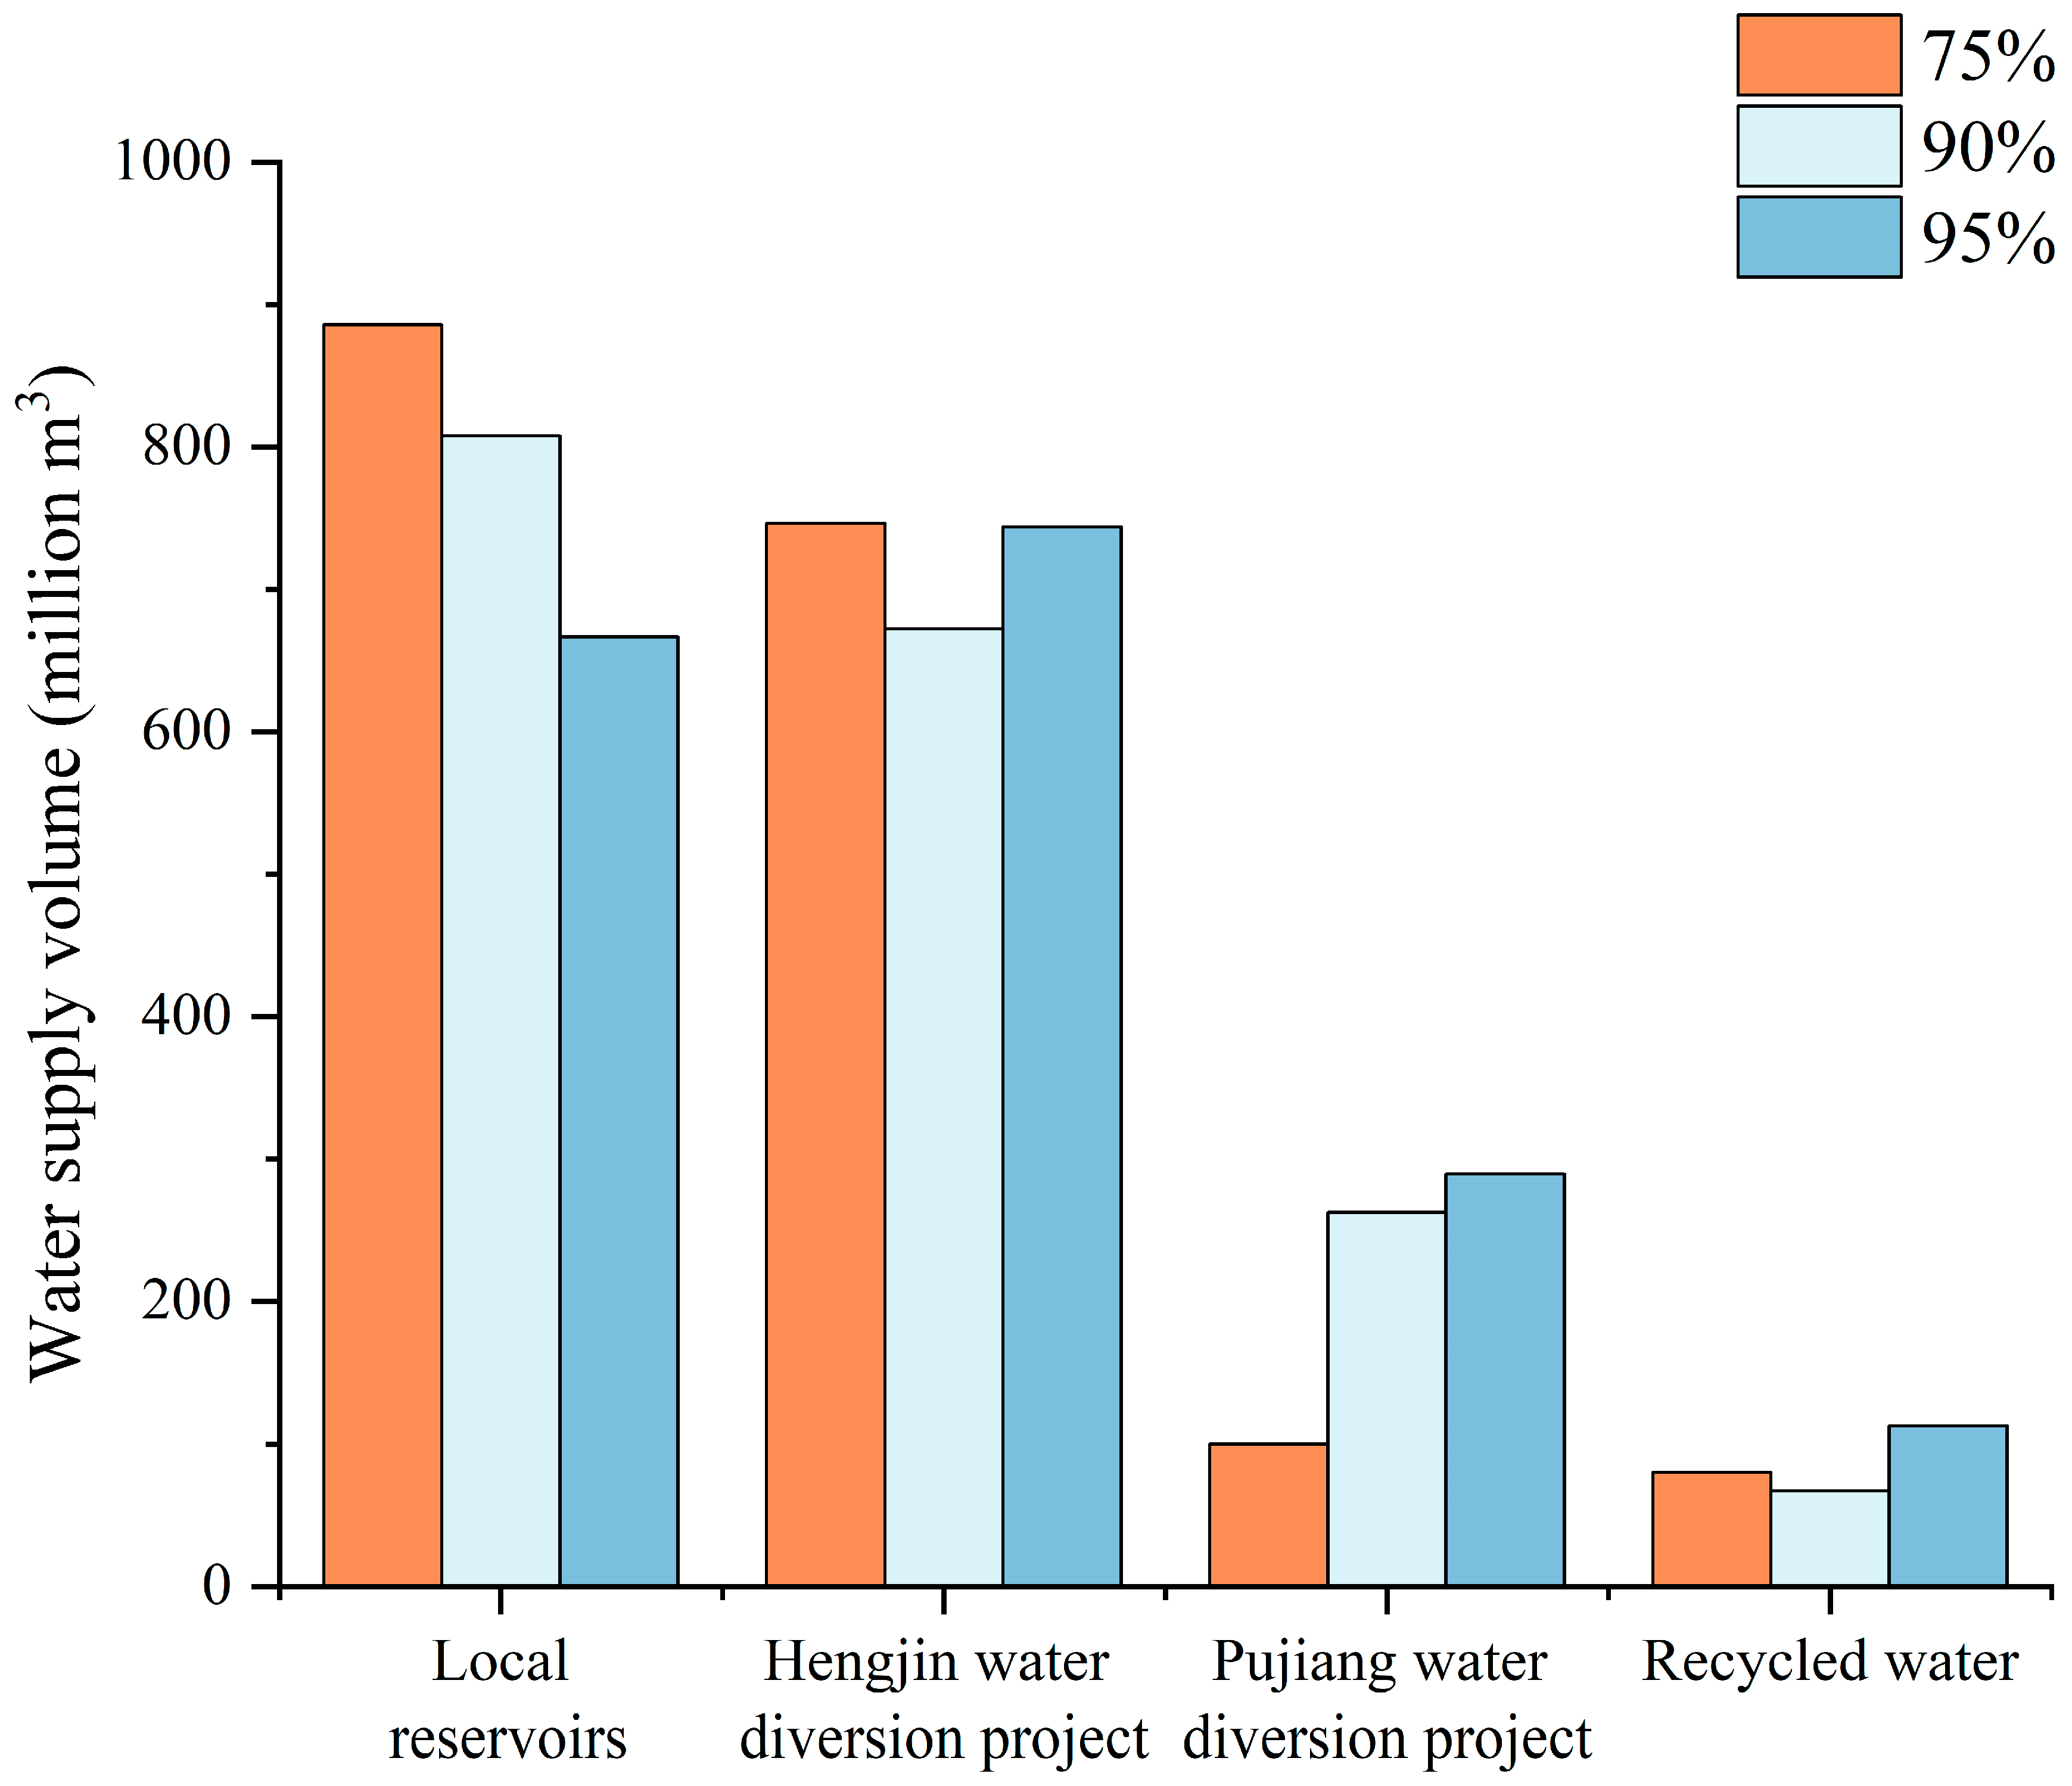
As shown in Table 2, since the first objective function is assigned a larger β k value, the first objective function, i.e., the minimum water shortage level in the urban water system, reaches its optimal value under all the guaranteed rates ( f 1 = 0 ). In addition, as the guaranteed rate increases, the value of objective function 2 ( f 2 ) tends to increase, whereas that of objective function 3 ( f 3 ) decreases, which emphasizes the contradiction between these functions. The optimal water supply volumes (i.e., the decision variable x i , j ) of the four water sources under different guaranteed rates are illustrated in Figure 7.

3.2.2. Comparison with the Original Allocation

To verify the rationality of the optimization results, the original water resource allocation formulated by the local government is employed for comparison. The goal of the original water resource allocation scheme is to supply water for water diversion projects, local reservoirs, and recycled water to meet the demands of all users. Therefore, the water supply volumes of each water source under different guaranteed rates are calculated, as shown in Table 3.
Table 4 compares the three objective functions between the original and optimal water resource allocation schemes. It also shows that the performance characteristics of the two water resource allocation schemes on the first two objective functions ( f 1 and f 2 ) are relatively similar, whereas there is an obvious gap between the first two functions and the third objective function ( f 3 ). Specifically, the results of f 3 from the optimal water resource allocation scheme are significantly better than those from the original water resource allocation scheme. The main reason for this difference is that the optimal water resource allocation scheme involves increasing the supply of recycled water but decreasing the water supply from the two water diversion projects. In summary, these results demonstrate that it is feasible to balance the three objective functions in this work by optimizing the water resource allocation scheme.

4. Discussion

4.1. Impacts of Subjective Preferences on Greenhouse Gas Emission Reductions

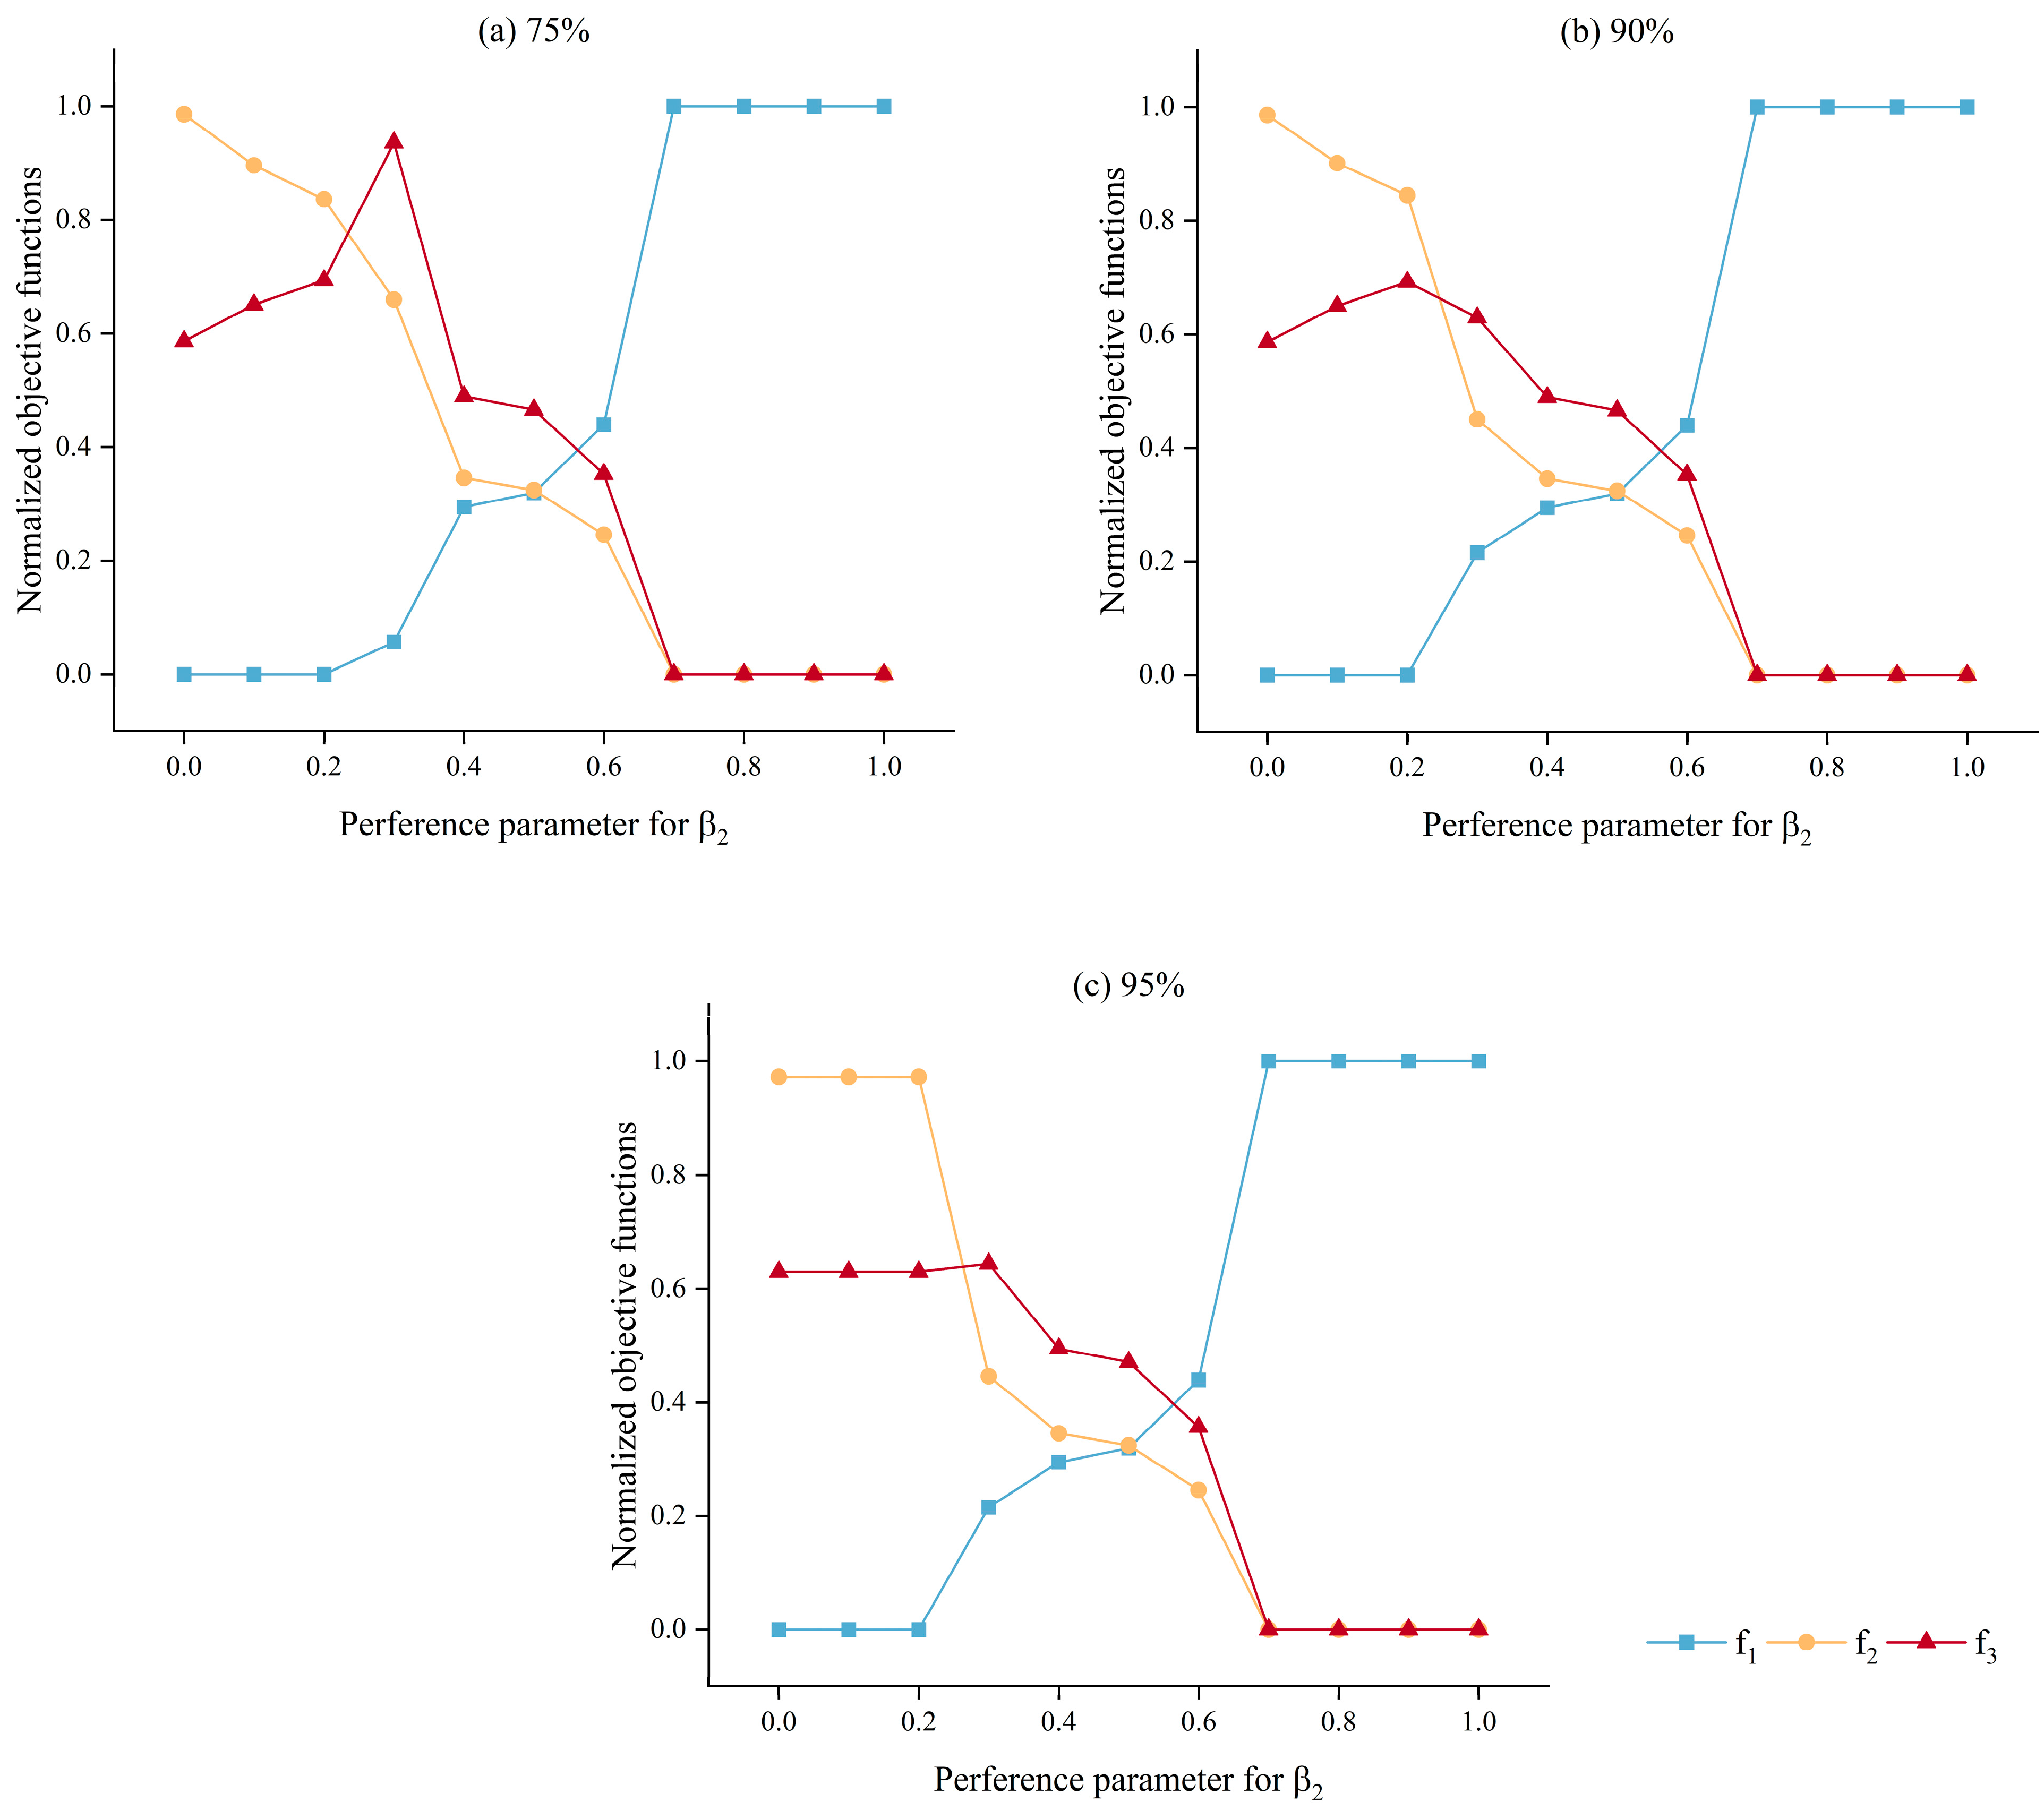
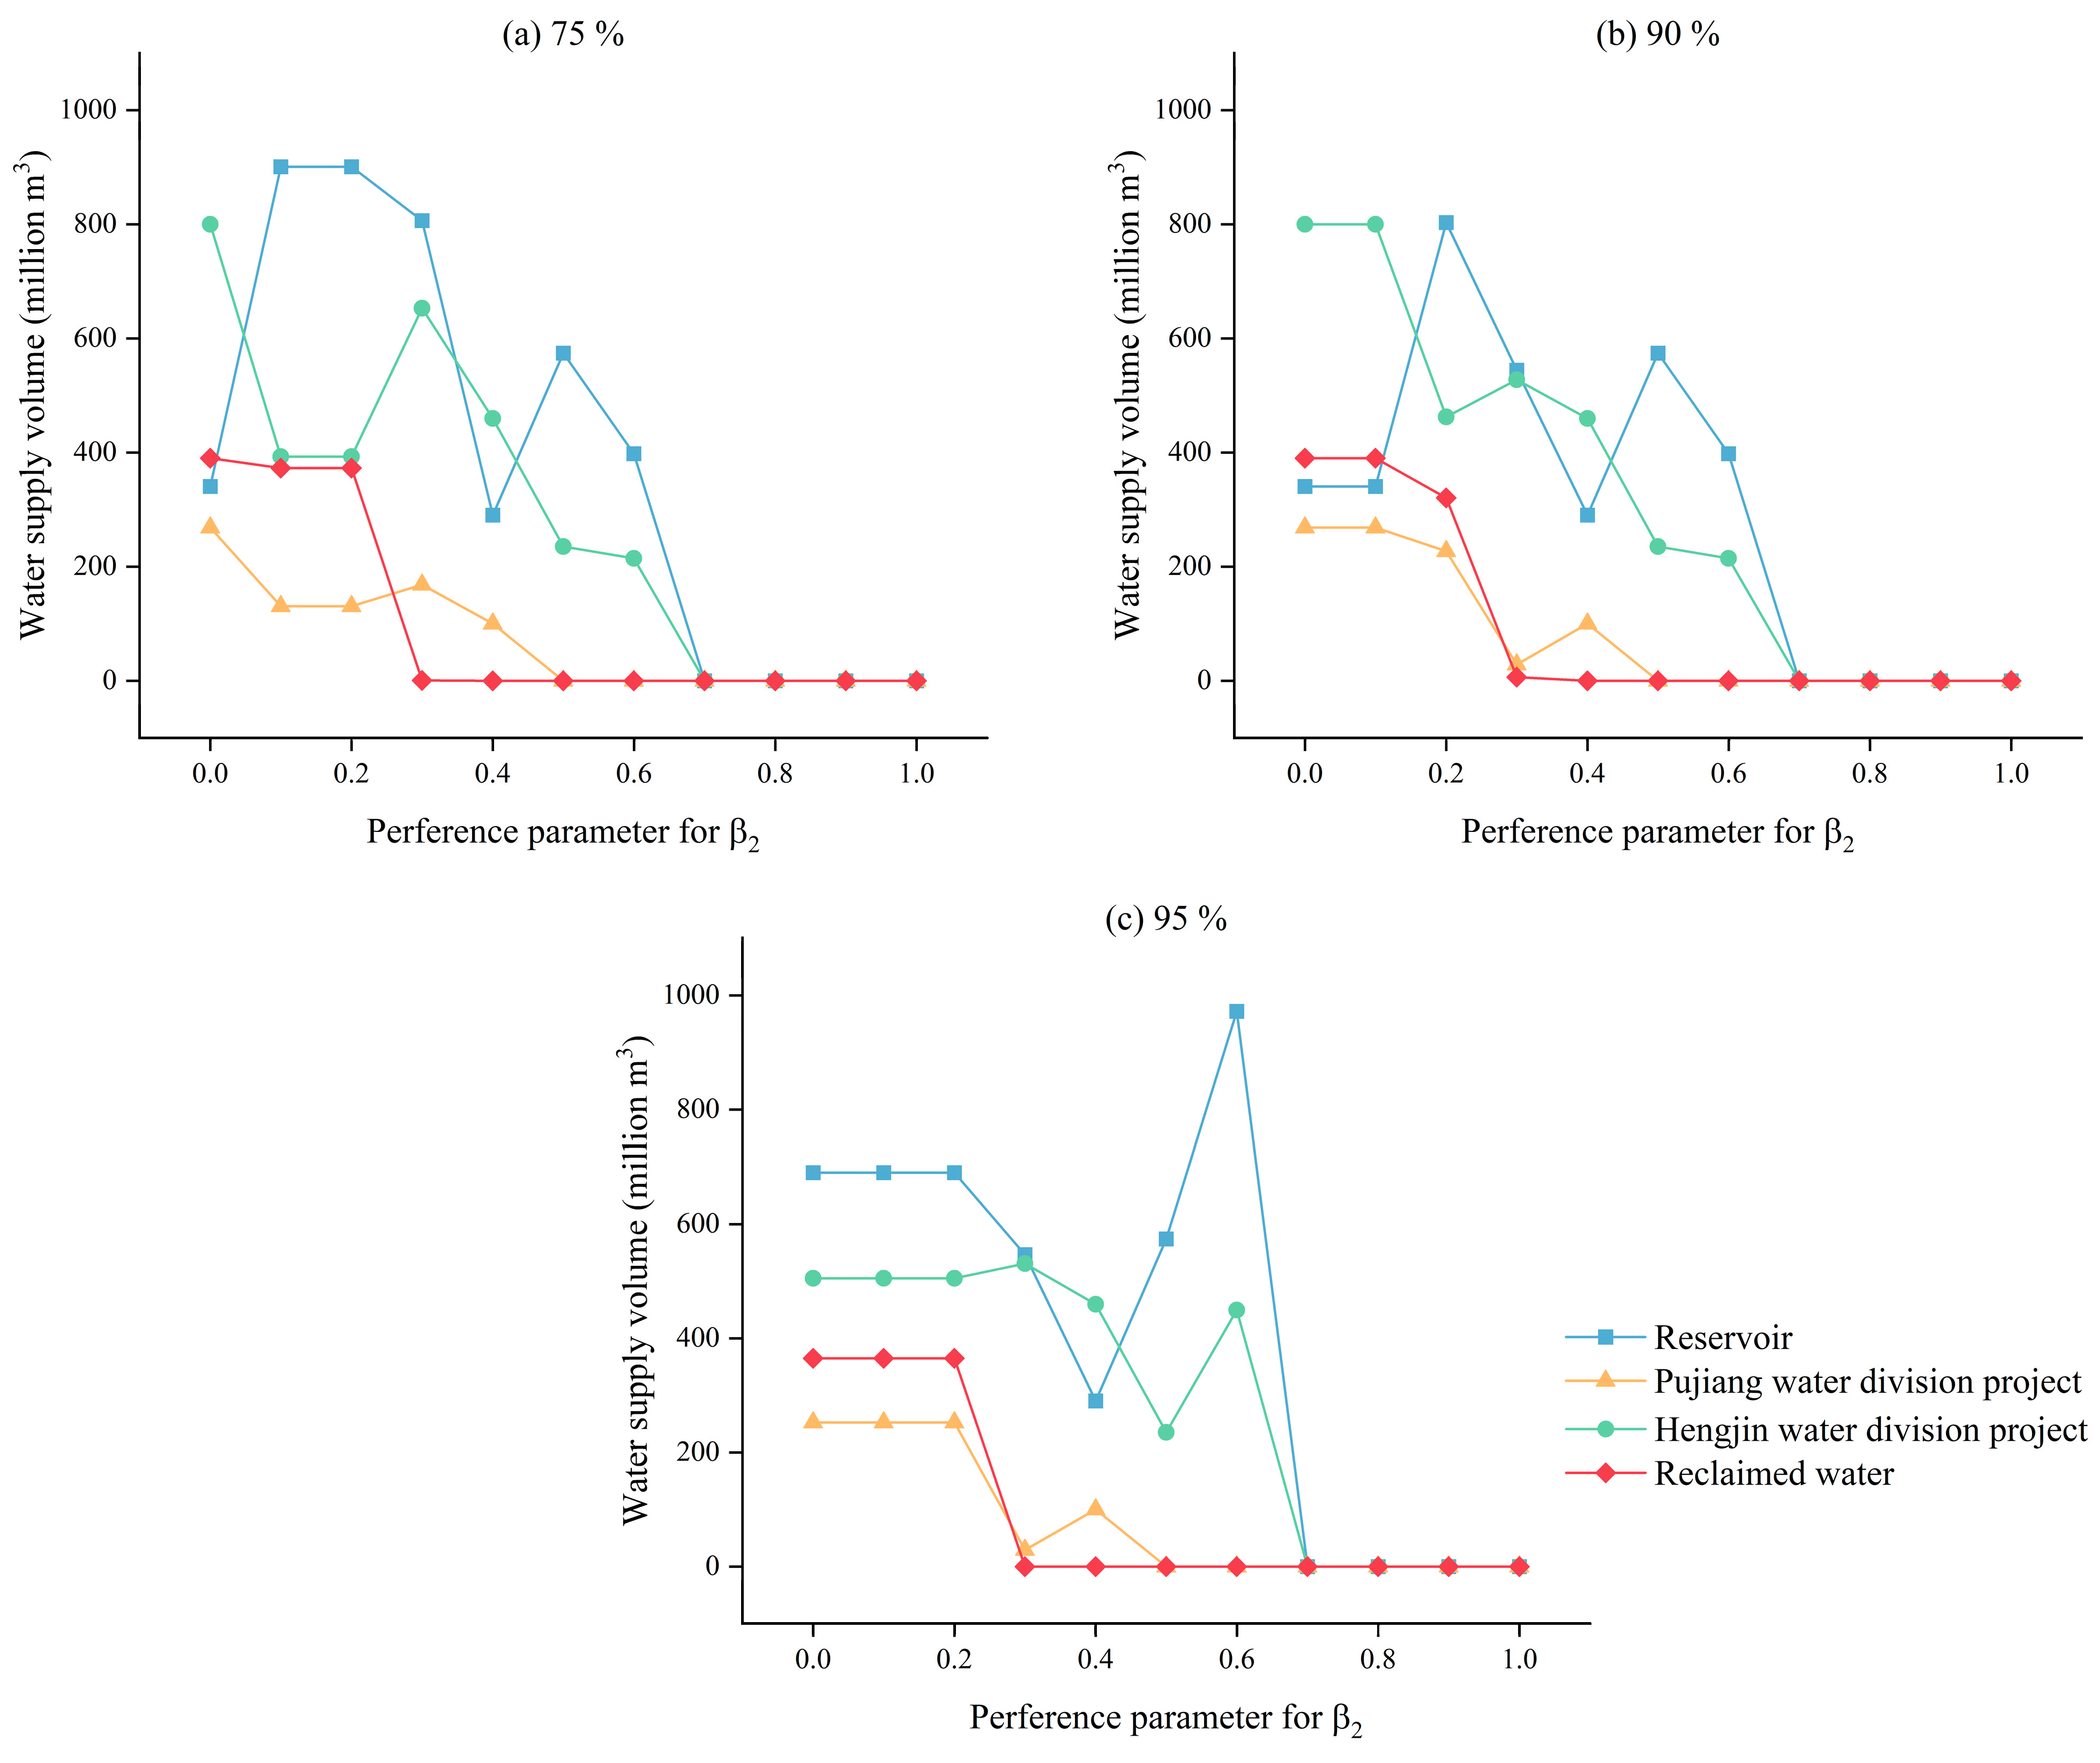
The above results prove that the combined method based on the MORIME and regret theory is an effective strategy for optimizing the water resource allocation scheme for multisource urban water systems while considering both the reduction in greenhouse gas emissions and the utilization of recycled water. However, several topics necessitate further discussion. First, the preference parameter β k for the above results is determined in advance by experts from the local government. However, since β k is a parameter that reflects the subjective preference of the experts, its value may vary among different individuals. Since one of the main aims of this study is to explore the possibility of reducing greenhouse gas emissions through optimal water resource allocation, it is necessary to evaluate the changes in greenhouse gas emissions (i.e., f 2 ) under different preference parameters. To mitigate the impacts of the other two objective functions, the preference parameters of f 2 are set to range from 0 to 1, and the remaining portion is allocated by the preference parameters of the other two objective functions at values of 0.8 and 0.2. Specifically, β 2 = [ 0,0.1,0.2 , , 0.9,1.0 ] , β 1 = ( 1 β 2 ) × 0.8 , and β 3 = ( 1 β 2 ) × 0.2 . The changes in the optimal results for the three objective functions and volumes of water supplied from different water sources are presented in Figure 8 and Figure 9. Notably, the objective functions in Figure 8 have been normalized from 0 to 1 for comparison.
As shown in Figure 8, the value of f 2 decreases as the preference parameter β 2 increases, whereas the value of f 1 increases as β 2 increases. The changes in f 3 are irregular in Figure 8. The main reason for this phenomenon is that the model tends to assume a certain degree of water shortage to reduce greenhouse gas emissions and ultimately stops the entire water supply, which is beneficial for minimizing f 3 . Specifically, it is feasible to reduce greenhouse gas emissions without increasing water shortages by increasing the value of β 2 when it is less than 0.2, and when the available water from local reservoirs and water diversion projects is adequate to meet the water demand (i.e., when the guaranteed rate is 75% and 90%), which undoubtedly increases in the value of f 3 . Furthermore, stopping the water supply of all water sources is the optimal solution for minimizing greenhouse gas emissions when β 2 exceeds 0.7. In this case, both f 2 and f 3 reach their respective minimum values, whereas f 1 reaches its maximum value.
In Figure 9, unlike other water sources, wherein water supply fluctuates when β 2 is relatively small, the water supply of recycled water decreases continuously with increasing β 2 and sharply decreases to 0 when β 2 reaches 0.3, which is caused by its high greenhouse gas emissions. Therefore, it is possible to reduce greenhouse gas emissions from urban water systems through optimal water resource allocation. However, cautious selection of preference parameters is necessary; otherwise, this process may lead to undesirable results that are not in line with the actual demand.

4.2. Impacts of Recycled Water Utilization Conditions

Another topic worth discussing is the utilization of recycled water. With the rapid development of water treatment techniques, it will be possible to obtain recycled water that is more acceptable to the public and takes less energy to produce, thereby producing fewer greenhouse gas emissions. Several such scenarios are discussed in this work, like in Table 5, which presents the greenhouse gas emissions of per m3 of recycled water and the upper limits to which recycled water can replace other water sources.
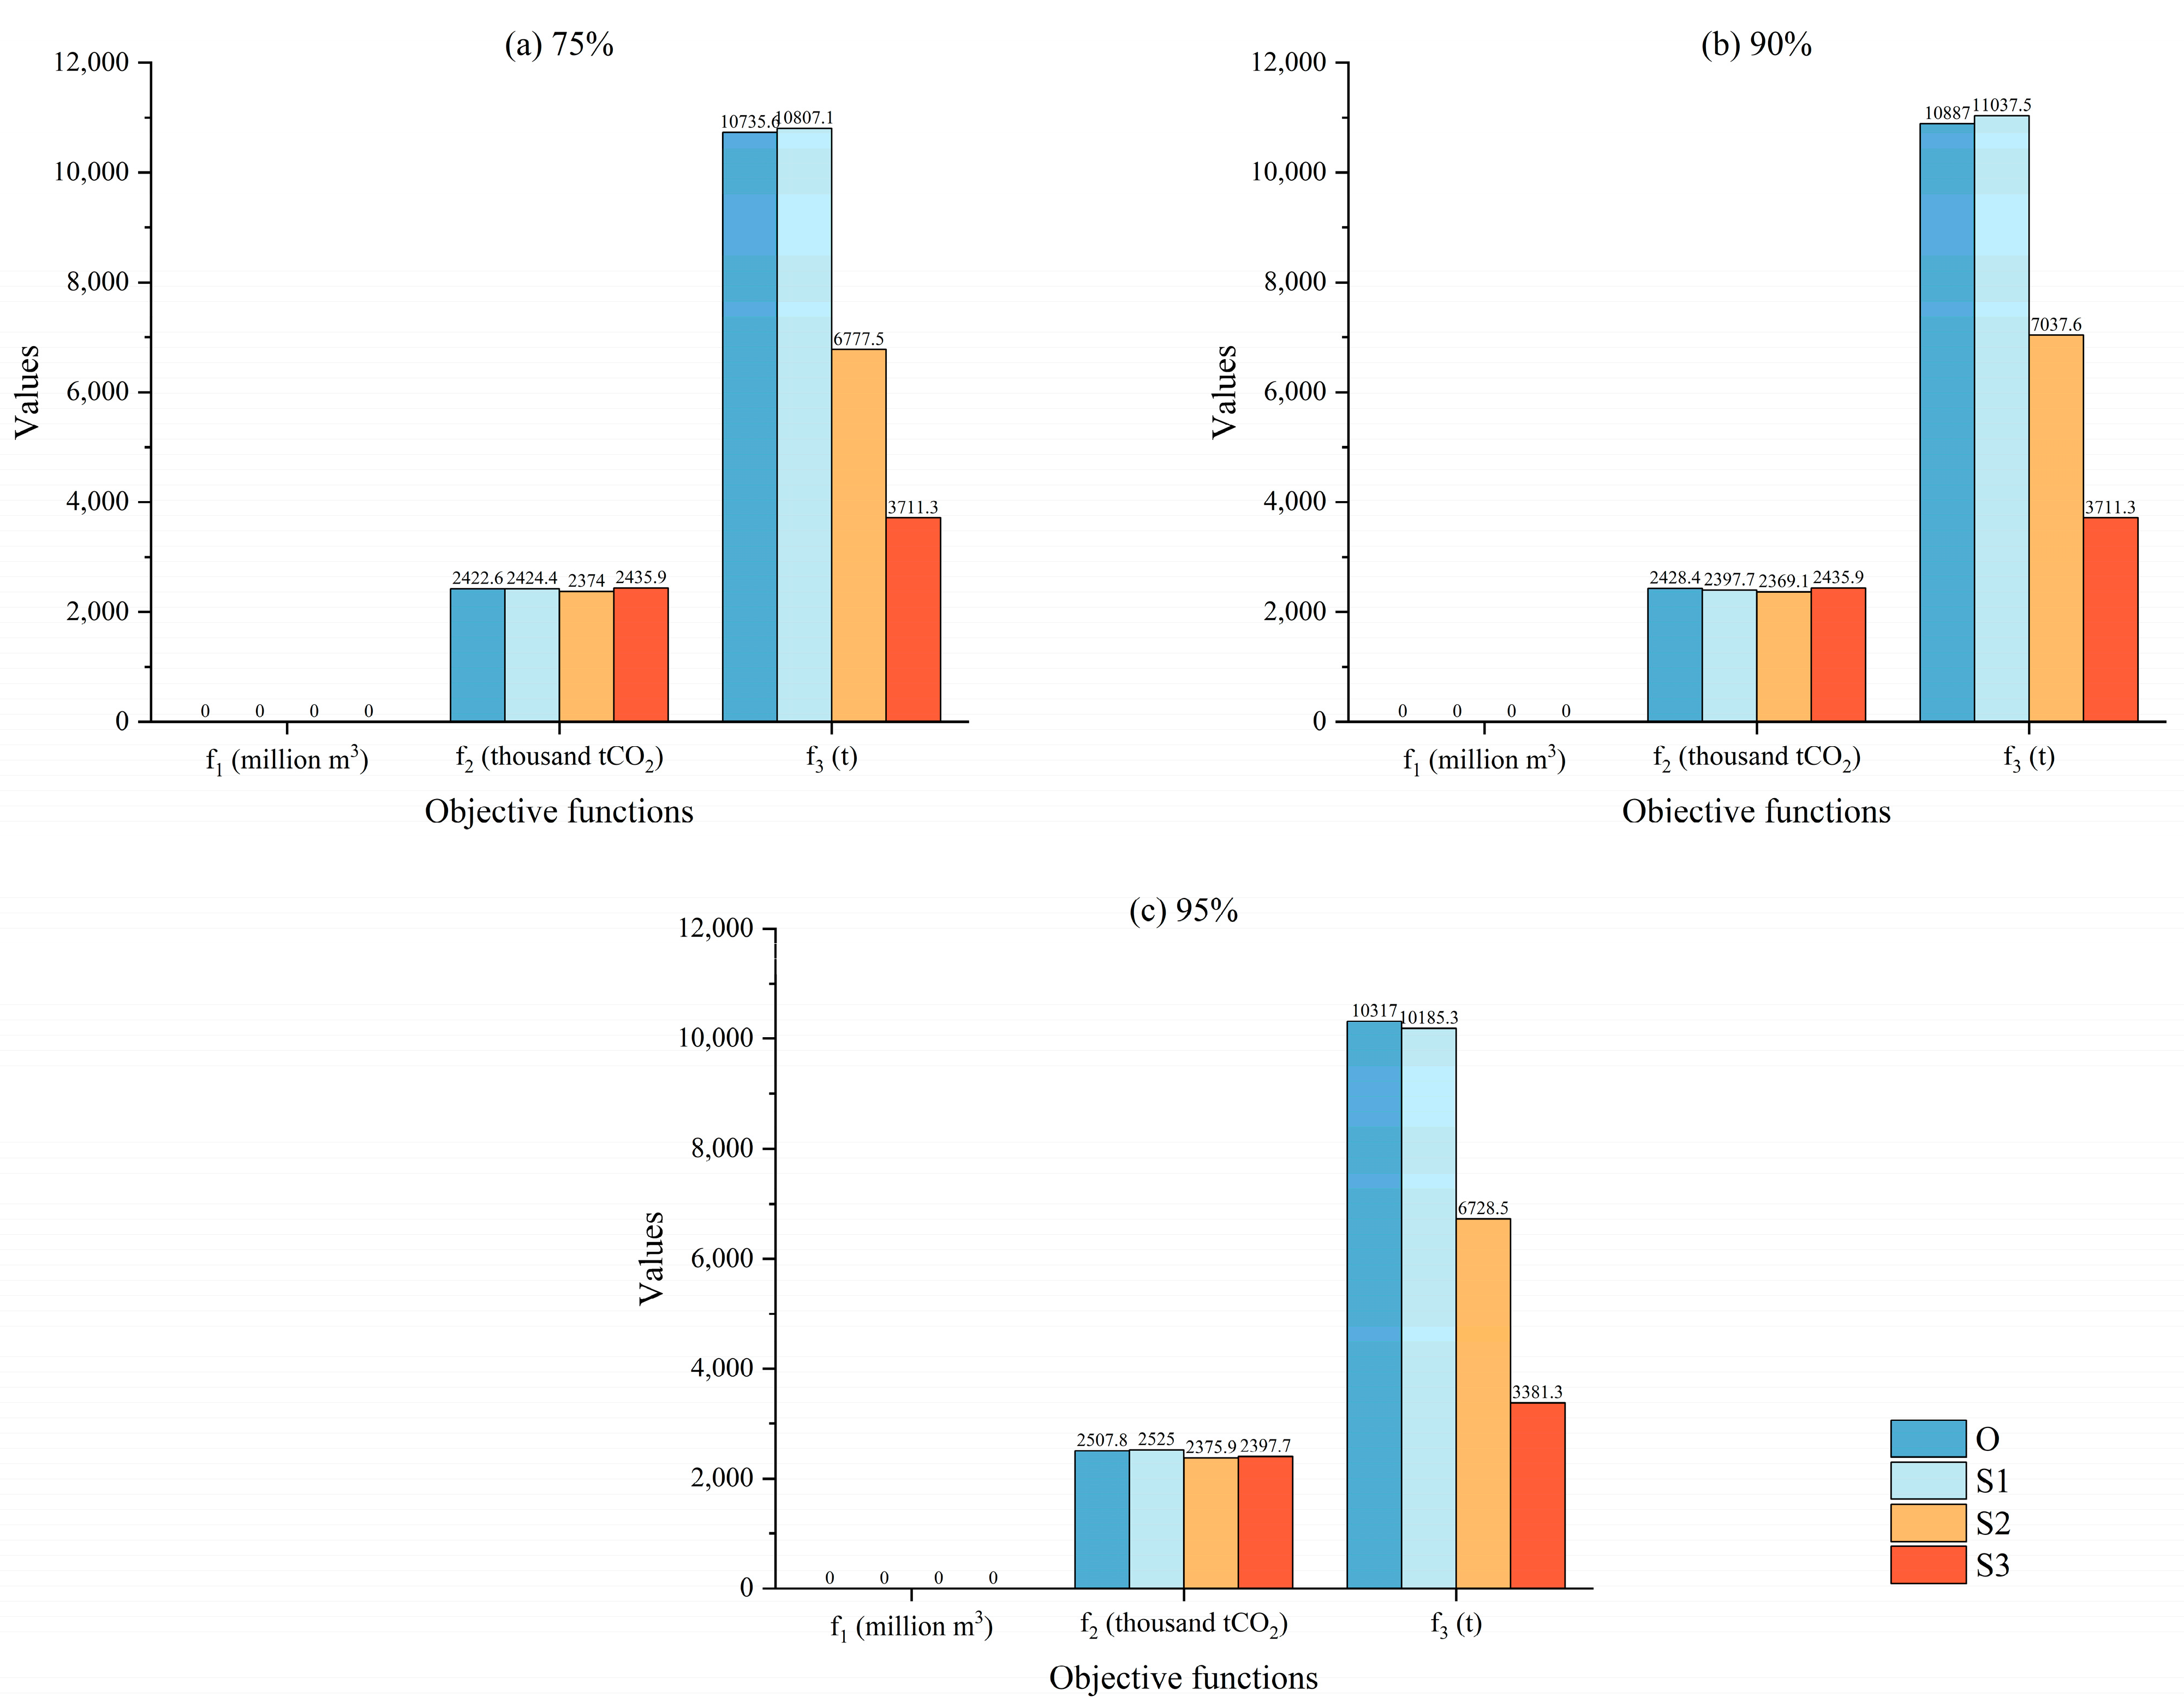
Here, the preference parameters are set to 0.7, 0.2, and 0.1, which is consistent with the results in Figure 6 and Table 3. Notably, although greenhouse gas emissions per m3 of recycled water are greatly reduced, they are still slightly greater than those of other water sources. The optimal results for the scenarios in Table 5 are shown in Figure 10 and Figure 11. In Figure 10, the changes in the three objective functions from different scenarios are quite similar under different guaranteed rates. Due to the high preference parameter, the values of f 1 remain 0 under the four scenarios. The values of f 2 show slight decreases under S2 and S3, whereas the decreases in f 3 values are significant under S2 and S3. The main reason for the decrease in f 3 is the change in the amount of recycled water supply (Figure 11). Specifically, if greenhouse gas emissions from recycled water can be controlled, they can play a more important role in urban water systems to ensure water supply security and protect the water environment.

4.3. Limitations and Future Work

In this study, a general framework is built based on MORIME and regret theory to alleviate contradiction among three different objectives in the context of greenhouse gas emission reduction and recycled water utilization. Certainly, as with all scientific research, this study has several limitations. First, due to the difficulty in collecting data about greenhouse gas emissions, only the urban water system in Yiwu city is analyzed in this study. However, the framework of this study is general and can be employed in other areas. Applying this framework to other areas and analyzing regional differences will make for work in the future. Second, the application of clean natural energy, such as tidal and wind energy, provides an opportunity to reduce the greenhouse gas emissions from energy production. This scenario has been discussed in this paper (Figure 10 and Figure 11), but the analysis is still limited to a few fixed values. More effort is still needed to analyze the quantitative conversion relationship between natural clean energy applications and greenhouse gas emissions from urban water systems. Finally, with the rapid development of computer science, more powerful optimization algorithms have been developed in recent decades, such as reinforcement learning methods, which can also be employed in water resource allocation. It is possible to obtain better results with these new algorithms in the future.

5. Conclusions

The utilization of recycled water is generally considered an effective method for addressing resource shortages and environmental deterioration in urban water systems. However, the high level of energy consumption during recycled water production makes it unfavorable for reducing greenhouse gas emissions. Therefore, reasonably using recycled water in the context of global water resource shortages while reducing greenhouse gas emissions has become one of the main challenges for urban water systems. In this work, the urban water system of Yiwu city, China, is employed as an example, and a multiobjective optimization model for the water resource allocation of urban water systems is developed on the basis of the MORIME and regret theory to reconcile the contradictions between securing the water supply, reducing greenhouse gas emissions and reducing pollutant discharge. The results show that the utilization of recycled water produces more greenhouse gas emissions than that of other water sources. However, the greenhouse gas emissions resulting from the utilization of water from local reservoirs are the lowest. Compared with the original water resource allocation scheme formulated by the local government, the optimized scheme effectively reduces the value of the third objective function (i.e., minimizing pollutant discharge) without significantly changing the first two objective functions (i.e., minimizing water shortages and greenhouse gas emissions). In addition, subjective preferences in regret theory greatly impact the values of the three objective functions of the optimal results, especially for situations with abundant water resources. The conditions for the utilization of recycled water are other influencing factors worth discussing. Recycling water while consuming less energy during production and increasing public acceptance are feasible strategies for alleviating contradictions among the three objective functions. In conclusion, it is possible to reconcile the contradictions between water supply security, greenhouse gas emissions and environmental protection in urban water systems by rationally allocating water resources. Moreover, the framework developed in this paper is general and can be used in other areas. Users can flexibly select various parameters of this framework according to their actual needs, including guaranteed rates, MORIME parameters, and preference parameters.

Author Contributions

C.C.: Methodology, Formal analysis and Writing—original draft; B.Z.: Software, Investigation and Visualization. Z.G.: Data Curation and Validation. J.W.: Project administration and Writing—Review and Editing. H.Q.: Conceptualization and Writing—Review and Editing. All authors have read and agreed to the published version of the manuscript.

Funding

This research is supported by the Project for high-level talents of Zhejiang Tongji Vocational College of Science and Technology (No. G20250401) and the Joint Funds of the Zhejiang Provincial Natural Science Foundation of China (No. LZJWY23E090009).

Data Availability Statement

The original contributions presented in this study are included in the article. Further inquiries can be directed to the corresponding author(s).

Acknowledgments

This study benefited from the data collected by the local government of Yiwu city. We are also grateful to the reviewers of the manuscript for their constructive comments and useful suggestions.

Conflicts of Interest

The authors declare no conflicts of interest.

Abbreviations

The following abbreviations are used in this manuscript:
LCALife cycle assessment
MORIMEMulti-objective rime optimization algorithm

References

  1. Qiu, X.; Zhang, X.; Zhang, P.; He, M.; Li, F.; Fang, D.; Li, K. Analysis of carbon emission in the whole process of urban water supply. J. Environ. Sci. 2025, 155, 573–582. [Google Scholar] [CrossRef]
  2. Segurado, R.; Costa, M.; Duić, N.; Carvalho, M. Integrated analysis of energy and water supply in islands. Case study of S. Vicente, Cape Verde. Energy 2016, 29, 639–648. [Google Scholar] [CrossRef]
  3. He, G.; Zhao, Y.; Wang, J.; Zhu, Y.; Jiang, S.; Li, H.; Wang, Q. The effects of urban water cycle on energy consumption in Beijing, China. J. Geogr. Sci. 2019, 29, 959–970. [Google Scholar] [CrossRef]
  4. Xiang, X.; Jia, S. China’s water-energy nexus: Assessment of water-related energy use. Resour. Conserv. Recycl. 2019, 144, 32–38. [Google Scholar] [CrossRef]
  5. Uche, J.; Martínez-Gracia, A.; Círe, F.; Carmona, U. Environmental impact of water supply and water use in a Mediterranean water stressed region. J. Clean. Prod. 2015, 88, 196–204. [Google Scholar] [CrossRef]
  6. Cho, J.H.; Sung, K.S.; Ha, S.R. A river water quality management model for optimising regional wastewater treatment using a genetic algorithm. J. Environ. Manag. 2004, 73, 229–242. [Google Scholar] [CrossRef]
  7. Chhipi-Shrestha, G.; Hewage, K.; Sadiq, R. Water–Energy–Carbon Nexus Modeling for Urban Water Systems: System Dynamics Approach. J. Water Resour. Plan. Manag. 2017, 143, 4017016. [Google Scholar] [CrossRef]
  8. Valek, A.; Sušnik, J.; Grafakos, S. Quantification of the urban water-energy nexus in México City, México, with an assessment of water-system related carbon emissions. Sci. Total Environ. 2017, 590–591, 258–268. [Google Scholar] [CrossRef]
  9. Venkatesh, G.; Brattebø, H. Assessment of Environmental Impacts of an Aging and Stagnating Water Supply Pipeline Network: City of Oslo, 1991–2006. J. Ind. Ecol. 2012, 16, 722–734. [Google Scholar] [CrossRef]
  10. Cole, M. Economic growth and water use. Appl. Econ. Lett. 2004, 11, 1–4. [Google Scholar] [CrossRef]
  11. Ballesteros-Olza, M.; Blanco-Gutiérrez, I.; Esteve, P.; Gómez-Ramos, A.; Bolinches, A. Using reclaimed water to cope with water scarcity: An alternative for agricultural irrigation in Spain. Environ. Res. Lett. 2022, 17, 125002. [Google Scholar] [CrossRef]
  12. Cai, C.; Yang, C.; Lu, X.; Chen, Y.; Wen, J.; Wang, J.; Wang, R.; Zhang, Z.; Shen, X. Industrial water consumption index: A new bridge between water consumption and socioeconomic development. Water Resour. Ind. 2024, 32, 100270. [Google Scholar] [CrossRef]
  13. Yi, L.; Jiao, W.; Chen, X.; Chen, W. An overview of reclaimed water reuse in China. J. Environ. Sci. 2011, 23, 1585–1593. [Google Scholar] [CrossRef]
  14. Santos, A.; Alvarenga, P.; Gando-Ferreira, L.; Quina, M. Urban Wastewater as a Source of Reclaimed Water for Irrigation: Barriers and Future Possibilities. Environments 2023, 10, 10020017. [Google Scholar] [CrossRef]
  15. Li, X.; Li, X.; Li, Y. Research on reclaimed water from the past to the future: A review. Environ. Dev. Sustain. 2021, 24, 112–137. [Google Scholar] [CrossRef]
  16. Wang, X.; Wu, F. Assessment of reclaimed water utilization in water-scarce regions of China: A multi-dimensional–multi-agent coupling and nesting perspective. J. Clean. Prod. 2024, 450, 141815. [Google Scholar] [CrossRef]
  17. Marinelli, E.; Radini, S.; Akyol, Ç.; Sgroi, M.; Eusebi, A.L.; Bischetti, G.B.; Mancini, A.; Fatone, F. Water-Energy-Food-Climate Nexus in an Integrated Peri-Urban Wastewater Treatment and Reuse System: From Theory to Practice. Sustainability 2021, 13, 131910952. [Google Scholar] [CrossRef]
  18. Li, J.; Qiao, Y.; Lei, X.; Kang, A.; Wang, M.; Liao, W.; Wang, H.; Ma, Y. A two-stage water allocation strategy for developing regional economic-environment sustainability. J. Environ. Manag. 2019, 244, 189–198. [Google Scholar] [CrossRef]
  19. Tian, J.; Guo, S.; Liu, D.; Pan, Z.; Hong, X. A Fair Approach for Multi-Objective Water Resources Allocation. Water Resour. Manag. 2019, 33, 3633–3653. [Google Scholar] [CrossRef]
  20. Valipour, E.; Ketabchi, H.; Shali, R.S.; Morid, S. Water Resources Allocation: Interactions Between Equity/Justice and Allocation Strategies. Water Resour. Manag. 2023, 38, 505–535. [Google Scholar] [CrossRef]
  21. Himmelblau, D. Optimization of a water resources system by non-linear programming. Eng. Optim. 1977, 2, 229–238. [Google Scholar] [CrossRef]
  22. Yakowitz, S. Dynamic programming applications in water resources. Water Resour. Res. 1982, 18, 673–696. [Google Scholar] [CrossRef]
  23. Nicklow, J.; Reed, P.; Savic, D.; Dessalegne, T.; Harrell, L.; Chan-Hilton, A.; Karamouz, M.; Minsker, B.; Ostfeld, A.; Singh, A.; et al. State of the Art for Genetic Algorithms and Beyond in Water Resources Planning and Management. J. Water Resour. Plan. Manag. 2010, 136, 412–432. [Google Scholar] [CrossRef]
  24. Jahandideh-Tehrani, M.; Bozorg-Haddad, O.; Loáiciga, H. Application of particle swarm optimization to water management: An introduction and overview. Environ. Monit. Assess. 2020, 192, 281. [Google Scholar] [CrossRef]
  25. Davijani, M.; Banihabib, M.; Anvar, A.; Hashemi, S. Multi-Objective Optimization Model for the Allocation of Water Resources in Arid Regions Based on the Maximization of Socioeconomic Efficiency. Water Resour. Manag. 2016, 30, 927–946. [Google Scholar] [CrossRef]
  26. Deng, L.; Guo, S.; Yin, J.; Zeng, Y.; Chen, K. Multi-objective optimization of water resources allocation in Han River basin (China) integrating efficiency, equity and sustainability. Sci. Rep. 2022, 12, 798. [Google Scholar] [CrossRef] [PubMed]
  27. Baltar, A.; Fontane, D. Use of Multiobjective Particle Swarm Optimization in Water Resources Management. J. Water Resour. Plan. Manag. 2008, 134, 257–265. [Google Scholar] [CrossRef]
  28. Chen, C.; Zhu, H.; Cai, C.; Wang, S. Research on Impact of Equity Costs and Environmental Costs on Supply-Side Classified Water Pricing. Water 2024, 16, 3275830. [Google Scholar] [CrossRef]
  29. Gui, Z.; Qi, H.; Wang, S. Study on Carbon Emissions from an Urban Water System Based on a Life Cycle Assessment: A Case Study of a Typical Multi-Water County in China’s River Network Plain. Sustainability 2024, 16, 16051748. [Google Scholar] [CrossRef]
  30. Terlouw, T.; Bauer, C.; Rosa, L.; Mazzotti, M. Life cycle assessment of carbon dioxide removal technologies: A critical review. Energy Environ. Sci. 2021, 14, 1701–1721. [Google Scholar] [CrossRef]
  31. Wang, Y.; Pan, Z.; Zhang, W.; Borhani, T.; Li, R.; Zhang, Z. Life cycle assessment of combustion-based electricity generation technologies integrated with carbon capture and storage: A review. Environ. Res. 2022, 207, 112219. [Google Scholar] [CrossRef] [PubMed]
  32. Nassar, Y.; El-Khozondar, H.; El-Osta, W.; Mohammed, S.; Elnaggar, M.; Khaleel, M.; Ahmed, A.; Alsharif, A. Carbon footprint and energy life cycle assessment of wind energy industry in Libya. Energy Convers. Manag. 2024, 300, 117846. [Google Scholar] [CrossRef]
  33. GB/T 2589-2008; General Rules for Comprehensive Energy Consumption Calculation. Chinese Standard: Beijing, China, 2008.
  34. Su, H.; Zhao, D.; Heidari, A.A.; Liu, L.; Zhang, X.; Mafarja, M.; Chen, H. RIME: A physics-based optimization. Neurocomputing 2023, 532, 183–214. [Google Scholar] [CrossRef]
  35. Zhong, R.; Yu, J.; Zhang, C.; Munetomo, M. SRIME: A strengthened RIME with Latin hypercube sampling and embedded distance-based selection for engineering optimization problems. Neural Comput. Appl. 2024, 36, 6721–6740. [Google Scholar] [CrossRef]
  36. Deb, K.; Pratap, A.; Agarwal, S.; Meyarivan, T. A fast and elitist multiobjective genetic algorithm: NSGA-II. IEEE Trans. Evol. Comput. 2002, 6, 182–197. [Google Scholar] [CrossRef]
  37. Pandya, S.; Kalita, K.; Jangir, P.; Cep, R.; Migdady, H.; Chohan, J.S.; Abualigah, L.; Mallik, S. Multi-objective RIME algorithm-based techno economic analysis for security constraints load dispatch and power flow including uncertainties model of hybrid power systems. Energy Rep. 2024, 11, 4423–4451. [Google Scholar] [CrossRef]
  38. Loomes, G.; Sugden, R. Some implications of a more general form of regret theory. J. Econ. Theory 1987, 41, 270–287. [Google Scholar] [CrossRef]
  39. Bleichrodt, H.; Cillo, A.; Diecidue, E. A Quantitative Measurement of Regret Theory. Manag. Sci. 2009, 56, 217. [Google Scholar] [CrossRef]
  40. Chorus, C.G. A Generalized Random Regret Minimization model. Transp. Res. Part. B Methodol. 2014, 68, 224–238. [Google Scholar] [CrossRef]
  41. Wang, L.; Fang, L.; Hipel, K. Basin-wide cooperative water resources allocation. Eur. J. Oper. Res. 2008, 190, 798–817. [Google Scholar] [CrossRef]
  42. Jinyan, L.; Lanbo, C.; Miao, D.; Ali, A. Water resources allocation model based on ecological priority in the arid region. Environ. Res. 2021, 199, 111201. [Google Scholar] [CrossRef] [PubMed]
  43. Wei, F.; Zhang, X.; Xu, J.; Bing, J.; Pan, G. Simulation of water resource allocation for sustainable urban development: An integrated optimization approach. J. Clean. Prod. 2020, 273, 122537. [Google Scholar] [CrossRef]
  44. Zeng, Y.; Liu, D.; Guo, S.; Xiong, L.; Liu, P.; Liu, P.; Yin, J.; Tian, J.; Deng, L.; Zhang, J. Impacts of Water Resources Allocation on Water Environmental Capacity under Climate Change. Water 2021, 13, 1187. [Google Scholar] [CrossRef]
  45. Abdulbaki, D.; Al-Hindi, M.; Yassine, A.; Najm, M.A. An optimization model for the allocation of water resources. J. Clean. Prod. 2017, 164, 994–1006. [Google Scholar] [CrossRef]
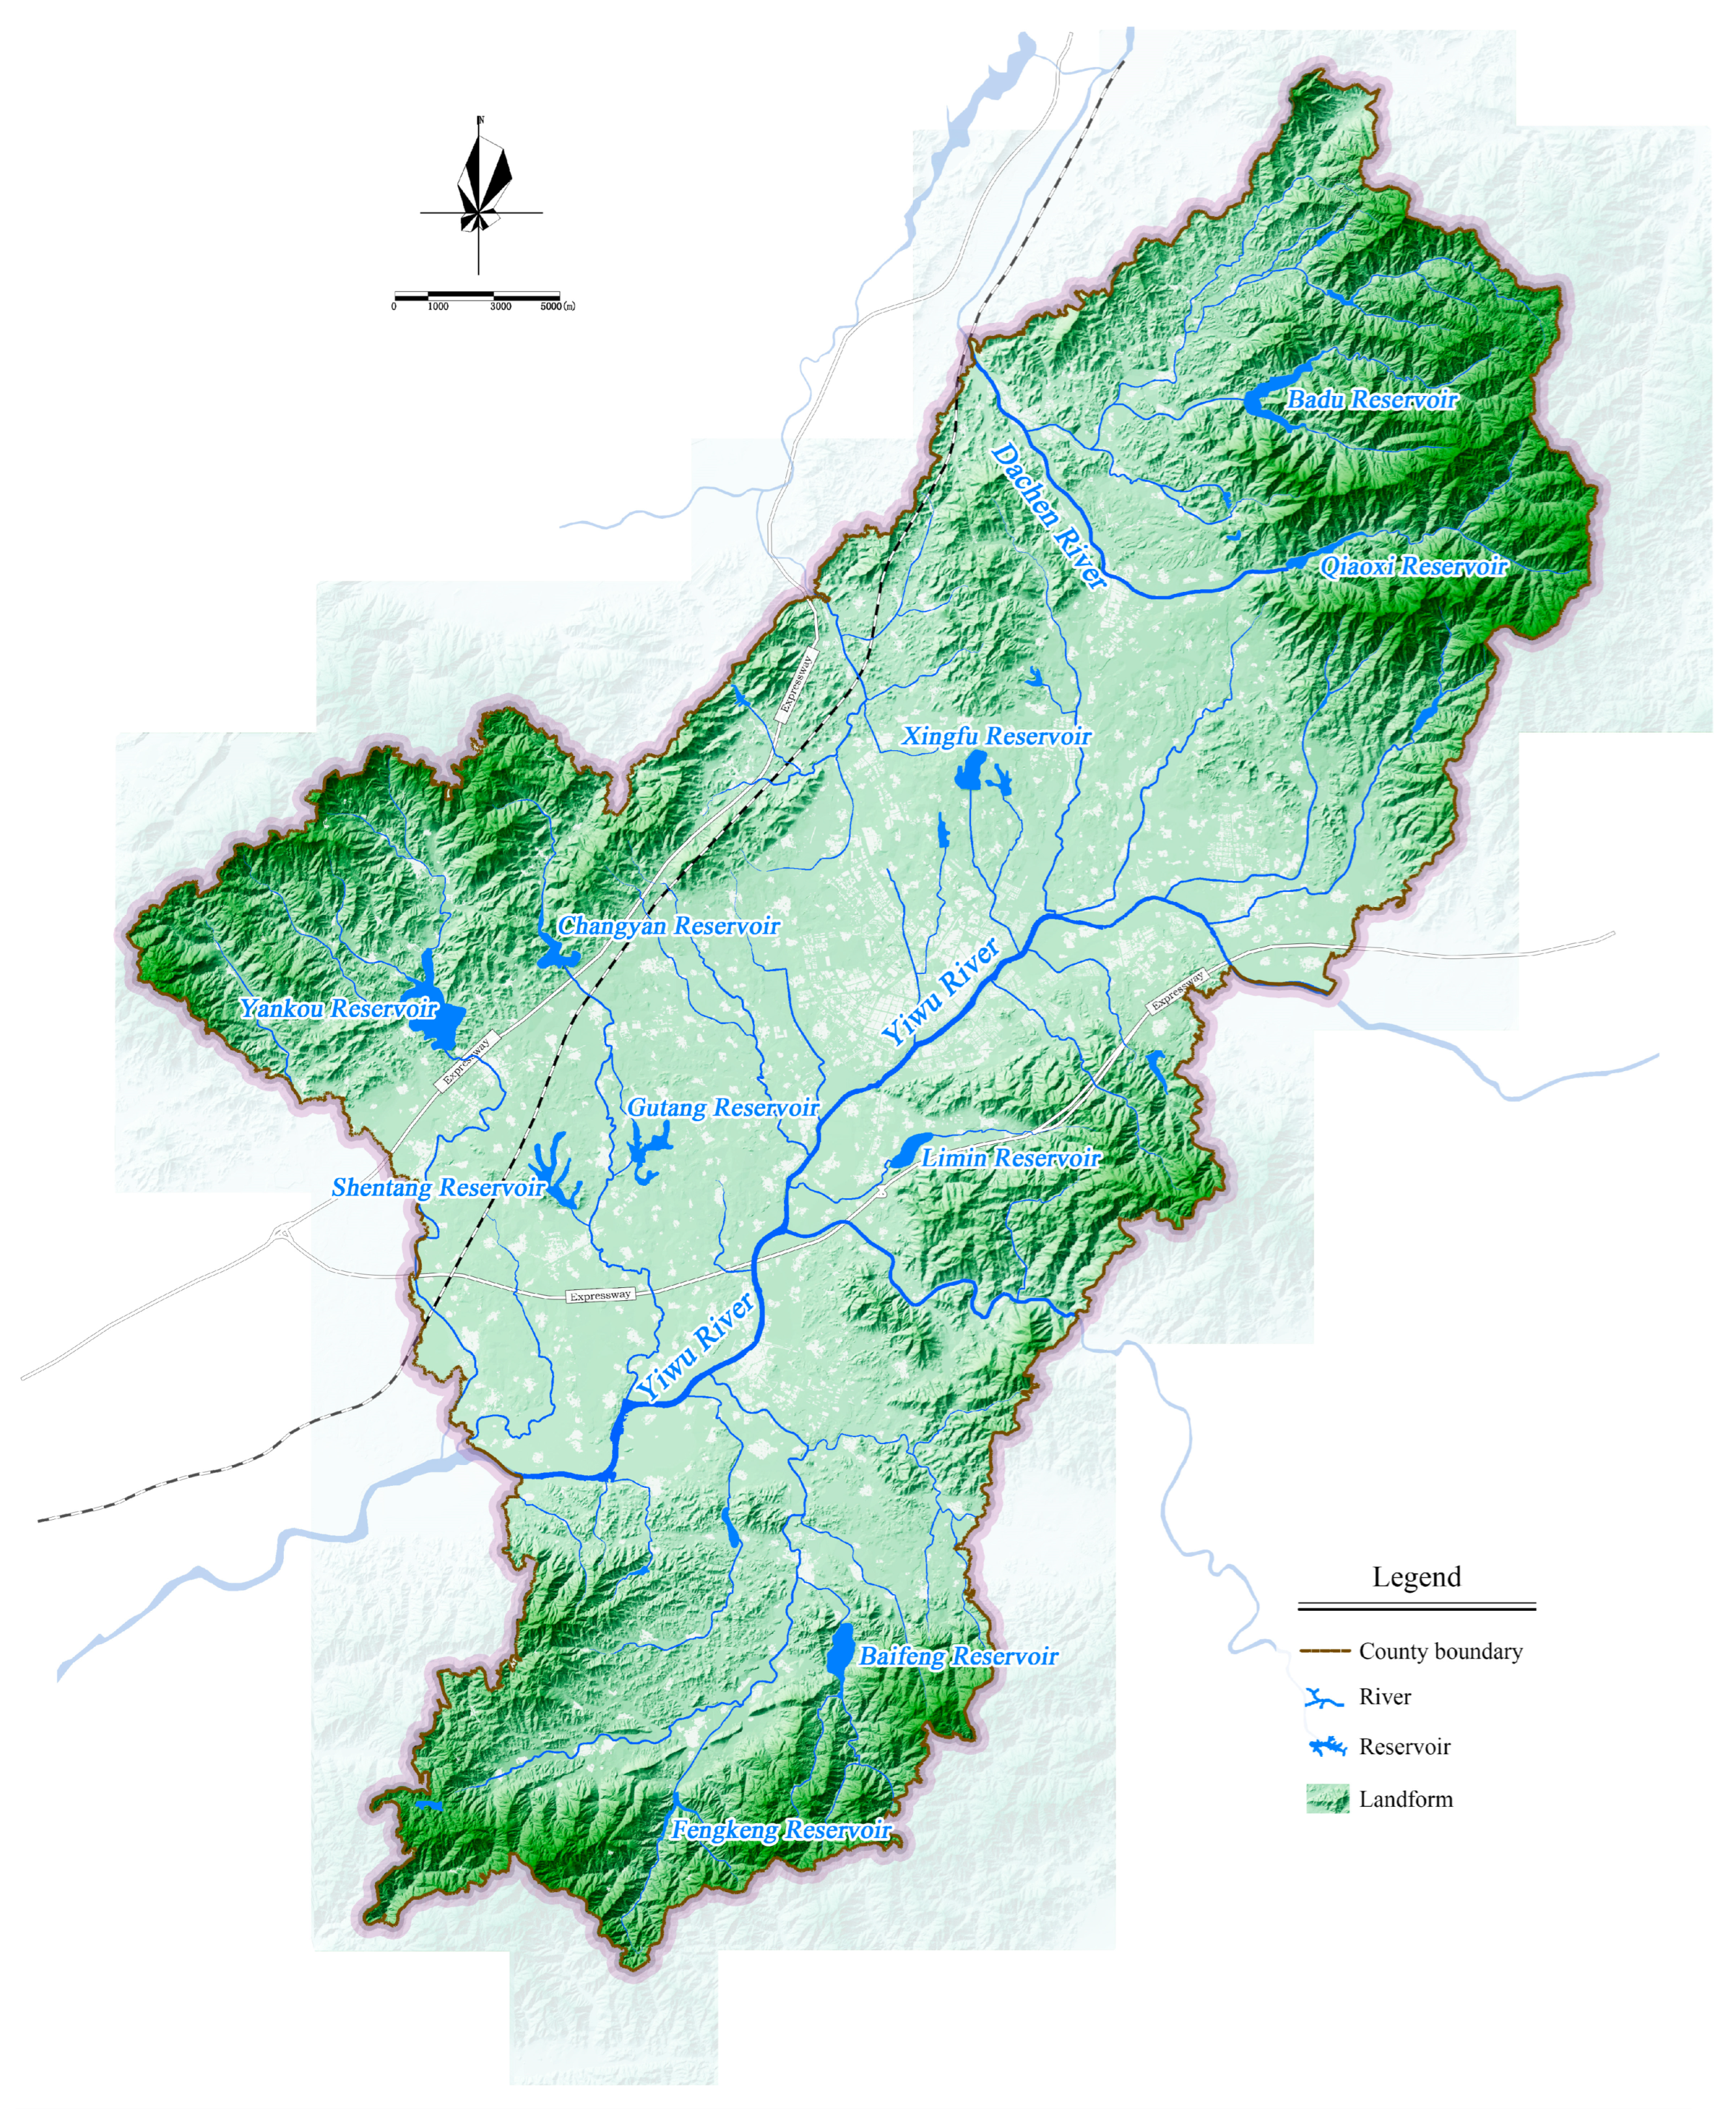
Figure 1. Topographic map of Yiwu city.
Water 17 02568 g001
Figure 2. Overview of the urban water system of Yiwu city. The arrows in the figure indicate the flow direction of water resources between the four main processes.
Water 17 02568 g002
Figure 3. MORIME flowchart.
Water 17 02568 g003
Figure 4. Greenhouse gas emissions from different water sources during the operation phase of the urban water system in Yiwu city.
Water 17 02568 g004
Figure 5. Available water resources of the sources under different guaranteed rates.
Water 17 02568 g005
Figure 6. Results of the MORIME for water allocation under different guaranteed rates: guaranteed rate (a) =75%; (b) =90%; and (c) =95%.
Water 17 02568 g006
Figure 7. Optimal water supply volumes of the four water sources under different guaranteed rates.
Water 17 02568 g007
Figure 8. Optimal results of the three objective functions under different preference parameters and guaranteed rates: guaranteed rate (a) =75%; (b) =90%; and (c) =95%.
Water 17 02568 g008
Figure 9. Optimal results of the water supply volumes from various water sources under different preference parameters and guaranteed rates: guaranteed rate (a) =75%; (b) =90%; and (c) =95%.
Water 17 02568 g009
Figure 10. Optimal objective functions under different scenarios: guaranteed rate (a) =75%; (b) =90%; and (c) =95%.
Water 17 02568 g010
Figure 11. Optimal water supply volumes from various water sources under different scenarios: guaranteed rate (a) =75%; (b) =90%; and (c) =95%.
Water 17 02568 g011
Table 1. Descriptions and demand of different water users.
Water User NameDescriptionWater Demand
(Million m3)
Residential water userWater users from residential daily lives612.3
Municipal water userWater users from construction and tertiary industry239.6
Industrial water userWater users from industry960.6
Table 2. Optimal results of the objective functions for the water resource allocation problem.
Guaranteed Rates f 1 (Million m3) f 2 (Thousand tCO2) f 3 (t)
75%0.0 2422.6 10,735.6
90%0.02428.4 10,587.0
95%0.0 2507.8 10,317.0
Table 3. Water supply volumes of each water source in the original water resource allocation scheme under different guaranteed rates.
Guaranteed RatesWater Supply Volume (million m3)
Local ReservoirsHengjin Water Diversion ProjectPujiang Water Diversion ProjectRecycled Water
75%712.58003000
90%712.58003000
95%699.180030013.4
Table 4. Comparison of the three objective functions between the original and optimal water resource allocation schemes.
Objective FunctionsGuaranteed RatesOptimal Water Resource AllocationOriginal Water Resource Allocation
f 1 (million m3)75%0.00.0
90%0.00.0
95%0.00.0
f 2 (thousand tCO2)75%2422.62423.3
90%2408.42409.3
95%2507.82508.7
f 3 (t)75%10,735.611,781.3
90%10,887.011,781.3
95%10,317.011,607.1
Table 5. Scenarios for recycled water under different conditions.
ScenariosGreenhouse Gas Emission Per m3 of Water (kgCO2/m3)Upper Limitation of Proportion for Different Water Users (%)
Residential Water UsersMunicipal Water UsersIndustrial Water Users
Original scenario (O)3.242910%30%40%
Greenhouse gas emissions reduction scenario (S1)1.510%30%40%
Water quality improve scenario (S2)3.242930%50%60%
Greenhouse gas emissions reduction and water quality improve scenario (S3)1.530%50%60%
Disclaimer/Publisher’s Note: The statements, opinions and data contained in all publications are solely those of the individual author(s) and contributor(s) and not of MDPI and/or the editor(s). MDPI and/or the editor(s) disclaim responsibility for any injury to people or property resulting from any ideas, methods, instructions or products referred to in the content.