Article

Computational Research on the Formation Mechanism of Rotating Stall Induced by Rotor Stator Interaction in a Pump-Turbine Under Pump Mode

1
Marine Design & Research Institute of China, Shanghai 200011, China
2
School of Energy and Power Engineering, Jiangsu University, Zhenjiang 212013, China
*
Author to whom correspondence should be addressed.
Water 2025, 17(17), 2538; https://doi.org/10.3390/w17172538
Submission received: 7 July 2025 / Revised: 21 August 2025 / Accepted: 25 August 2025 / Published: 27 August 2025

Abstract

Rotating stall is an abnormal flow phenomenon in pumps and pump-turbines, which can cause severe vibration, noise, and even cause head hump. A pump-turbine model under pump mode is researched in this study to reveal the formation mechanism of rotating stall. The causes, development laws, and influencing factors of rotating stall is revealed, which can help professionals achieve a deeper understanding of the rotating stall mechanism and suppress it through optimized design. The flow simulation method is mainly adopted in the study, and it is verified through experiment. The research results show that stall in the guide vanes is often caused, maintained and aggravated by rotor–stator interaction (RSI). A stall cell is often difficult to cause the adjacent flow channel to stall. However, under the action of RSI, stall can be induced in the adjacent flow channel, and then rotating stall is gradually formed. Rotating stall can be suppressed by various methods of reducing RSI. To a certain extent, the research makes up for the problem that conventional theory does not fully consider non-uniform and unsteady complex incoming flow when analyzing rotating stall. A connection between rotating stall and RSI is established, which can provide an important basis for further research on how to eliminate rotating stall.

1. Introduction

The pump-turbine is the core component of a pumped storage power station. When pump-turbines run at a small flow rate under pump condition, they are prone to stall [1,2]. Then, the vibration and noise of pump-turbines are aggravated, and the safety and reliability of the system are greatly reduced. In other industrial fields, such as pumps in nuclear power plants and pumps for the chemical industry, stall is a great threat to units and systems as well [3]. For example, the stall in nuclear main pumps of nuclear power plants may cause humps in the head curve [4]. When SBLOCA (small breach loss of coolant) accidents occur in the nuclear power plant, once the operating point of the nuclear main pump enters the hump area, the possibility of core exposure will increase to a certain extent, which is very dangerous [5]. Therefore, the stall formation mechanism and its suppression method have been a research hotspot for a long time.
As early as 1955, Emmons [6] studied rotating stall in blade cascades under steady flow and believed that rotation stall can occur because the stall cell in one flow channel affects the blade incidence angle of the adjacent flow channel. Pedersen et al. [7] used this theory to analyze and concluded that stall rotating can only occur when there is an odd number of blades. However, Yang Honghong [8] and Sano et al. [9] both found rotating stall in the 8-blade vane of a pump. When Yang Honghong [8] increased the number of blades to 9, the stall stopped rotating. It can be seen that it is not enough to explain the stall phenomenon under unsteady flow by relying solely on the research conclusions of Emmons [6], which is based on the steady flow. Therefore, researchers have been conducting extensive research for a long time, trying to more accurately describe the stall formation mechanism. The stall cell generally undergoes the process of “attenuation-splitting-fusion-growth” repeatedly, causing high-amplitude and low-frequency pressure pulsations in the flow channels [10,11]. Leiblein [6] defined the conditions under which stall can occur by defining the diffusion coefficient. However, this method has great limitations in application. Lu Yajun [12] found that by continuously reducing the number of blades and reducing the density of the blade cascade to a certain extent, the stall will automatically disappear. Zhang et al. [13] used LDV (laser Doppler velocimeter) to measure the flow field in the pump and found that stall existed even under the design condition, with a rotation frequency of about 16.5% of the rotation frequency. Lennemann [14] and Krause [15] both found that the stall rotation frequency increases as the flow rate decreases. Lu Guocheng [16] studied the stall of a pump-turbine and found that the stall gradually began to rotate from non-rotation during the flow reduction process. Sano et al. [9] collected pressure pulsation information in the pump and analyzed it through the cross-power spectrum method. They found that the stall rotation was positive at a low flow rate with a frequency of 1–3 Hz. As the flow rate increased, the stall developed into a reverse rotation through alternating stall transition. Yang Honghong [8] also obtained similar conclusions. Miyabi [17] used high-speed photography to observe the stall in the pump and found that the stall cell number increased from 1 to 2 after the flow rate was reduced. Berten et al. [18] found similar conclusions. Lennemann [14] found that the stall rotation frequency increases as the impeller speed increases. When the impeller speed increases, the stall cell number and the stall rotation speed will also increase [10]. The gap between the runner and the guide vane is an important factor affecting stall. Changing the gap size will lead to significant changes in the stall cell number and the stall rotation speed [8,11]. Therefore, the current theoretical explanation of stall formation and rotation phenomena still mainly relies on the Emmons theory, although the applicability of this theory is relatively limited.
This paper studies the formation mechanism of rotating stall in pump-turbines, and specifically, how rotor–stator interaction (referred to as RSI) induces rotating stall is studied. Existing research has increasingly recognized the importance of RSI in stall formation and has sought to mitigate stall by adjusting design parameters to alter RSI levels [19,20]. However, in-depth research into the detailed mechanisms underlying the interaction between RSI and stall remains lacking, which is the focus of this paper. To a certain extent, this paper solves the problem that the Emmons theory does not adequately consider non-uniform and unsteady complex flows in the stall mechanism analysis. Although there are many studies on RSI in pump-turbines, few studies focus on the importance of RSI in stall formation [21,22,23,24]. This study reveals the mechanism of rotating stall induced by RSI in pump-turbines, which is of great significance to improving the design level and ensuring safe and stable operation of pump-turbines.

2. Model and Numerical Schemes

2.1. Introduction to Model and Test

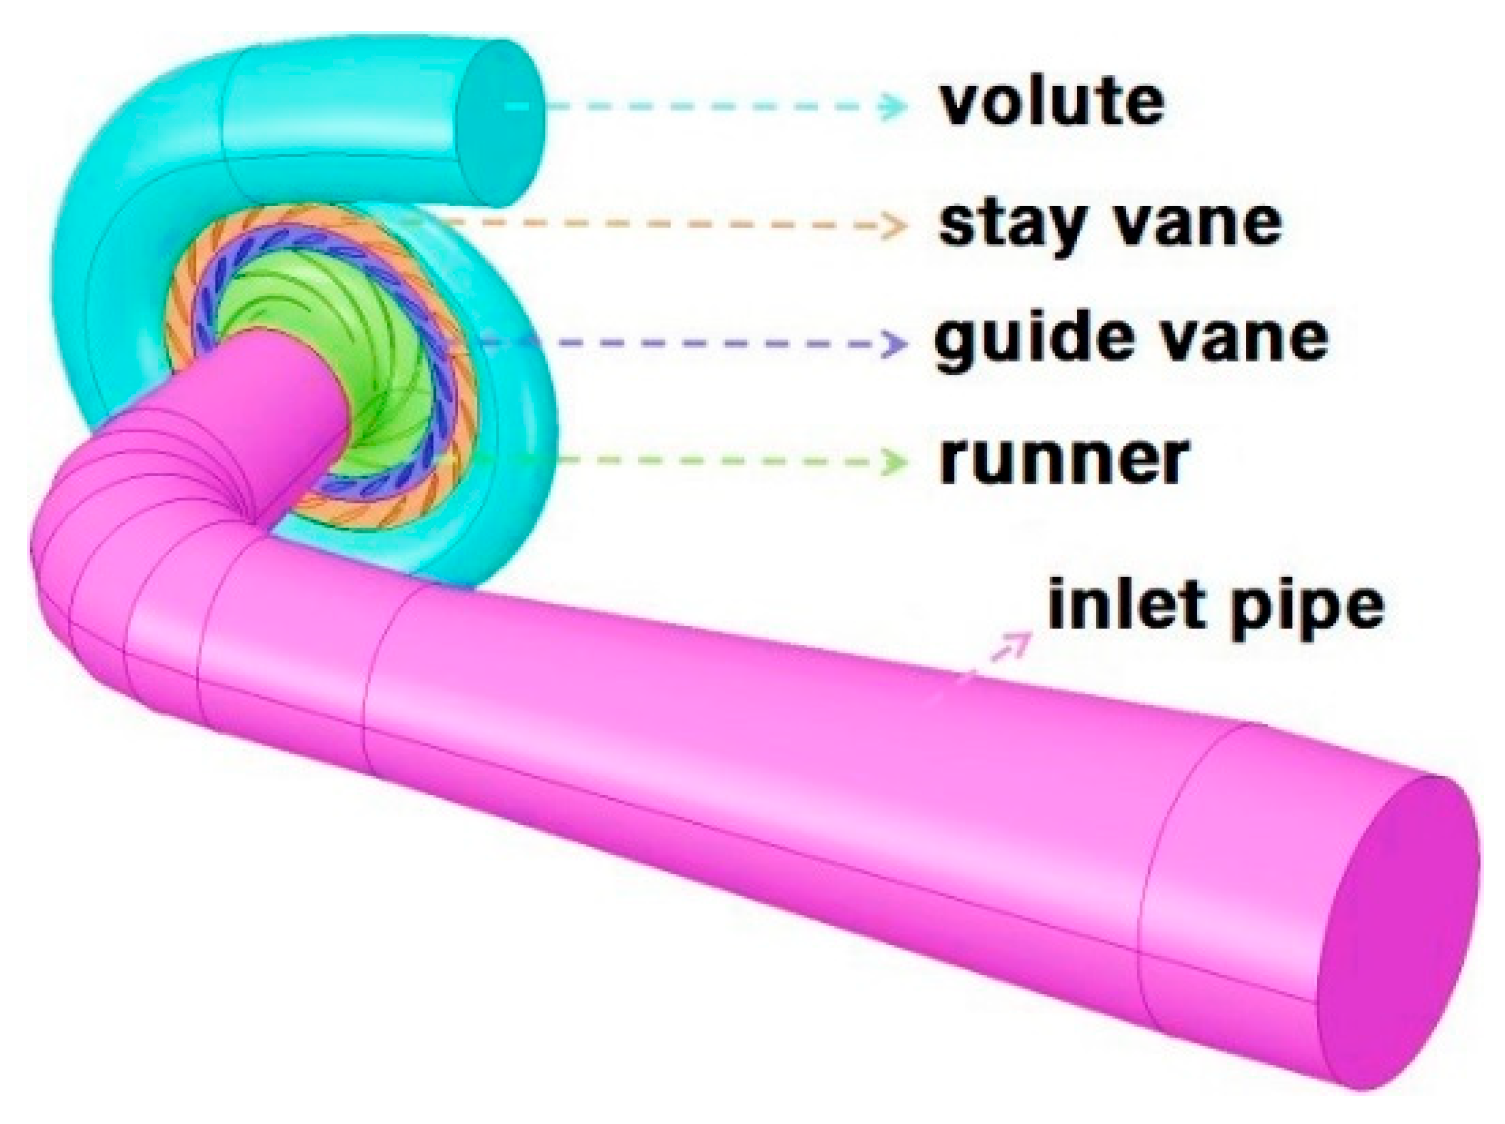
The test prototype consists of an inlet pipe, a runner, guide vanes, stay vanes, and a volute as shown in Figure 1. The volute and the runner shroud are made of plexiglass, and all blades of the runner and vanes are made of engineering plastics, and other parts are made of metal. From the perspective of Figure 2, the runner rotates in a clockwise direction. Figure 2b shows in detail the interface area where the runner and guide vanes move relative to each other.
The main design parameters of the test prototype are shown in Table 1, and the hydraulic performance under the design condition is shown in Table 2.
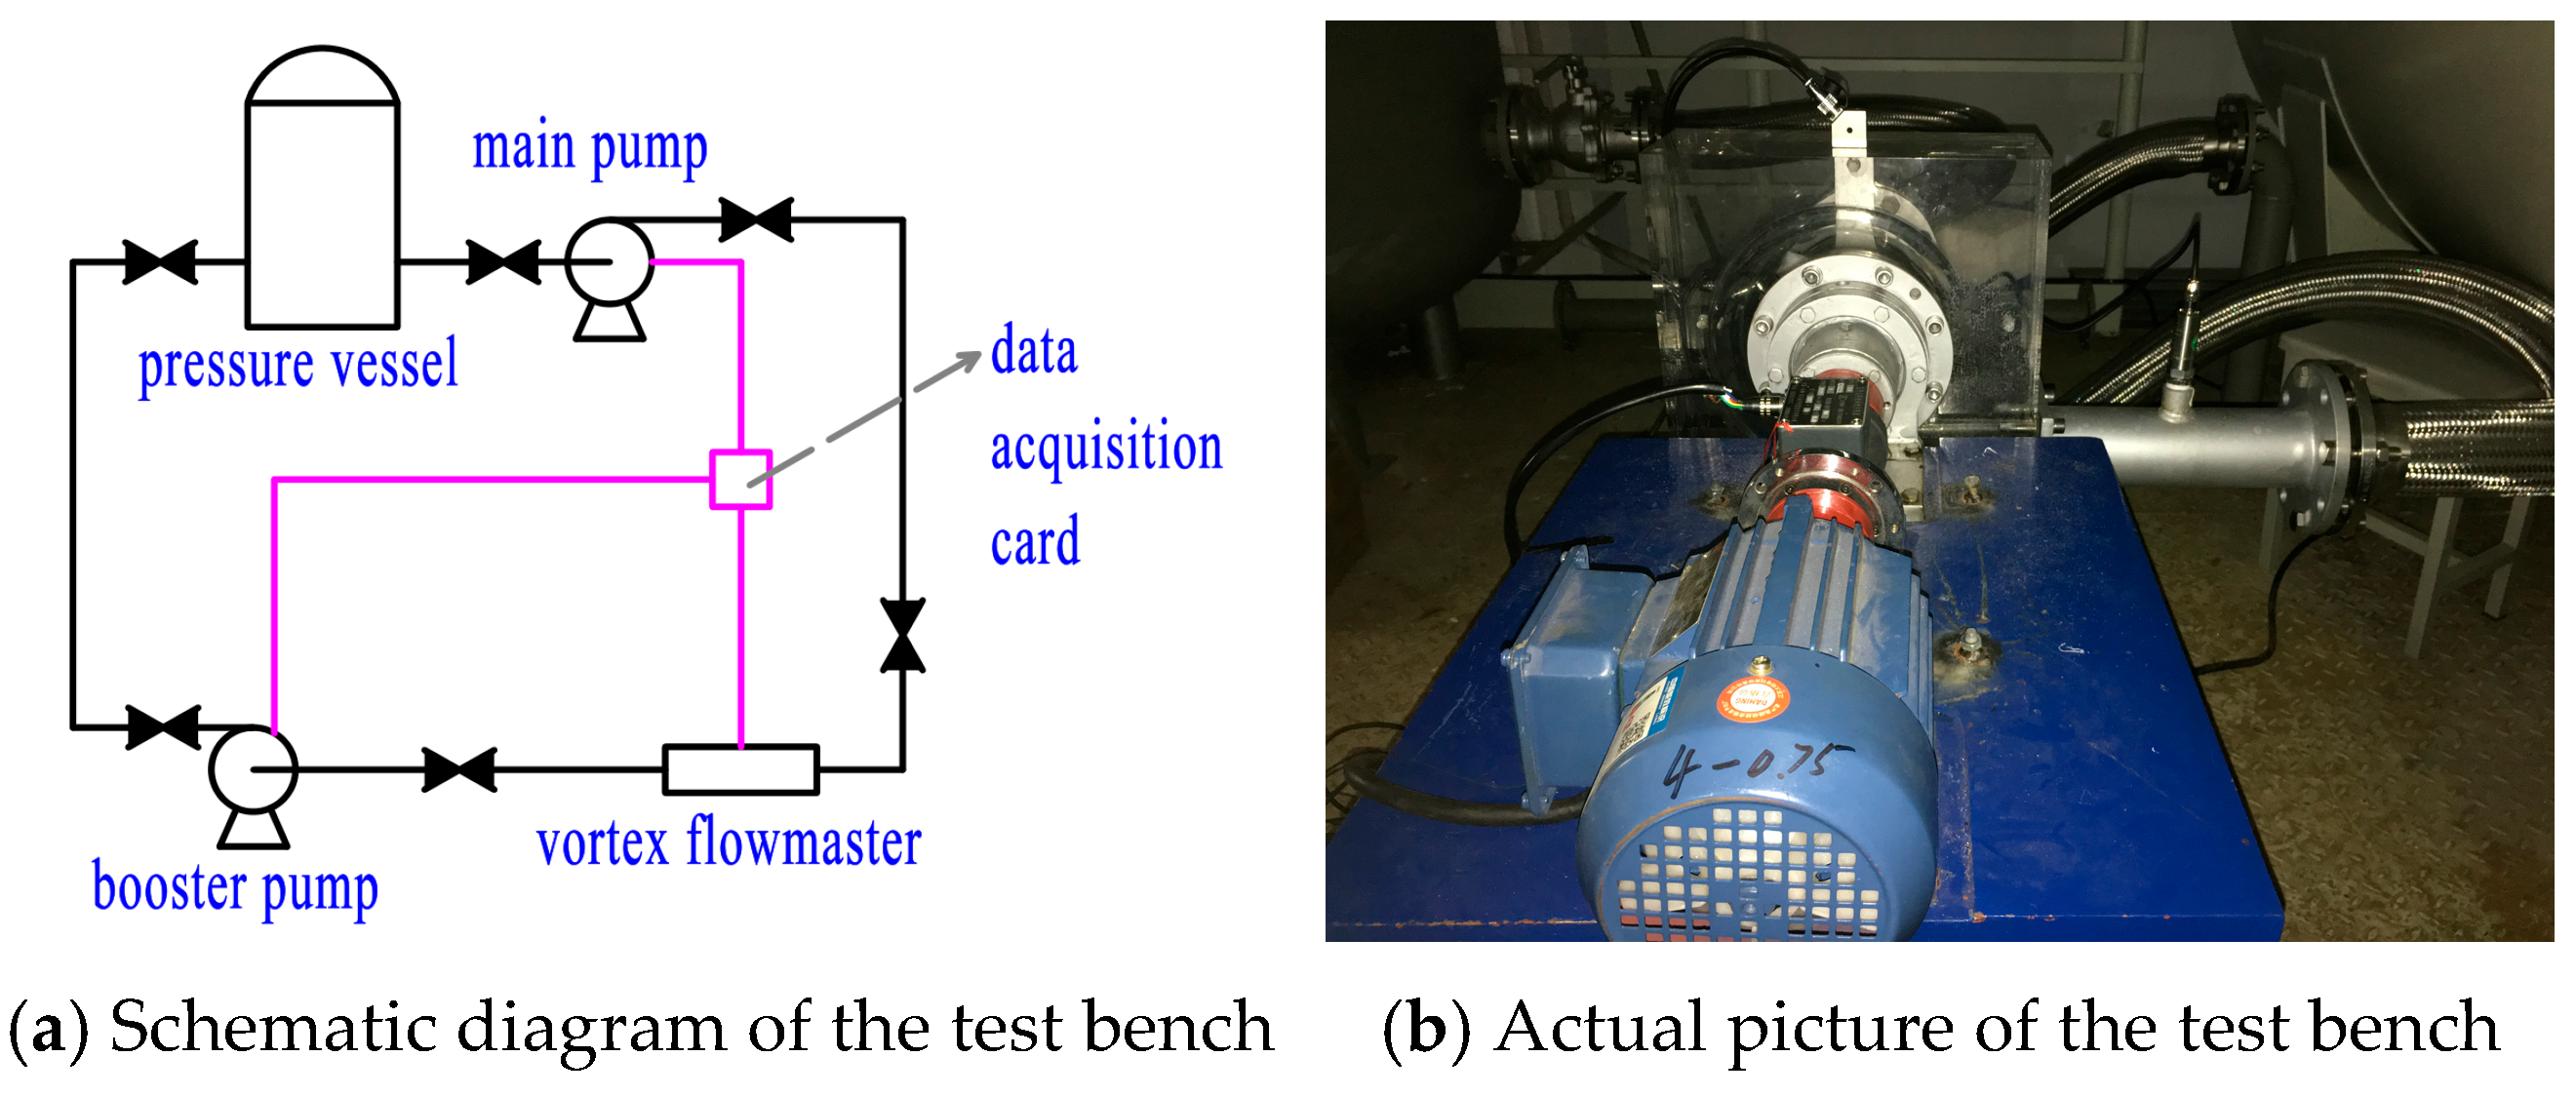
The prototype test was carried out on the hydraulic machinery test bench as shown in Figure 3, and the test results were converted into dimensionless values according to the International Commission for Standardization (IEC) standard. The test pump is installed at the “main pump” in Figure 3a.
Q nD = Q n D 3
E nD = gH n 2 D 2
T nD = T ρ n 2 D 5
The flow coefficient, QnD, energy coefficient, EnD, and torque coefficient, TnD, are dimensionless numbers; flow, Q, is in m3/h, speed, n, is in rev/min, runner nominal diameter, D, is in m, head, H, is in m, gravity acceleration, g, is in m/s2, density, ρ, is in kg/m3, and torque, T, is in N·m. The test results are shown in Figure 4.

2.2. Calculation Method and Verification

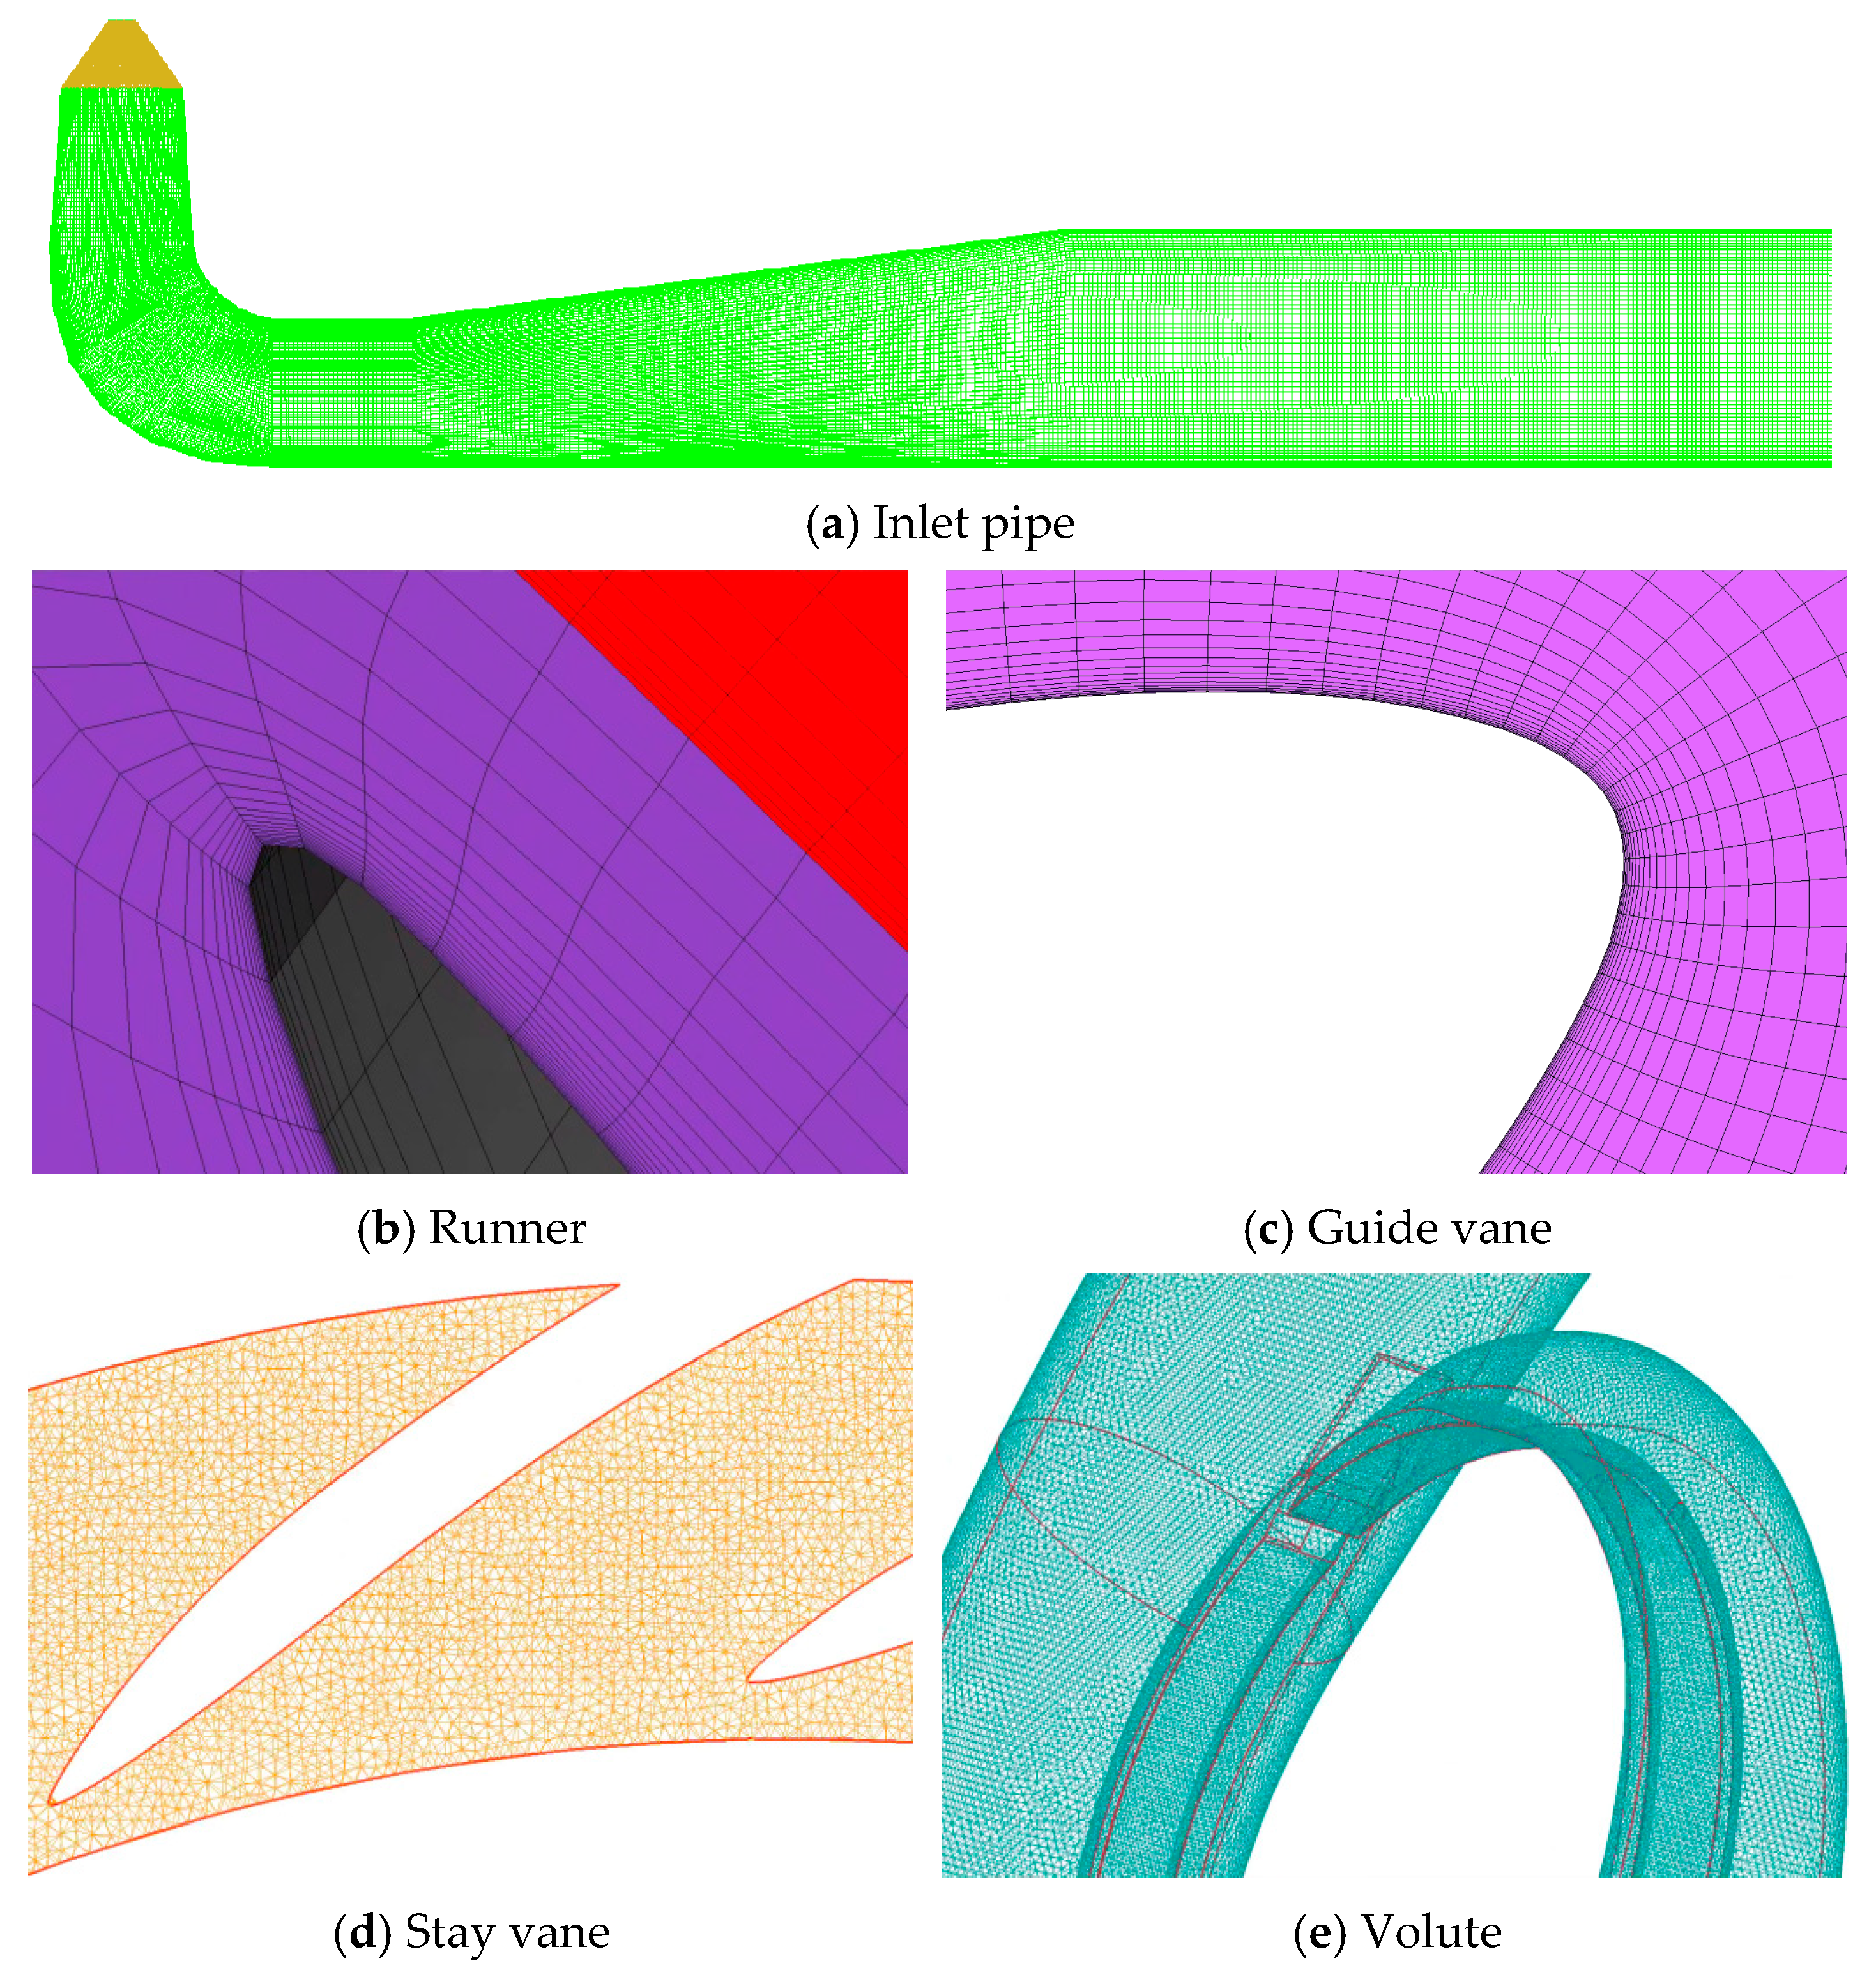
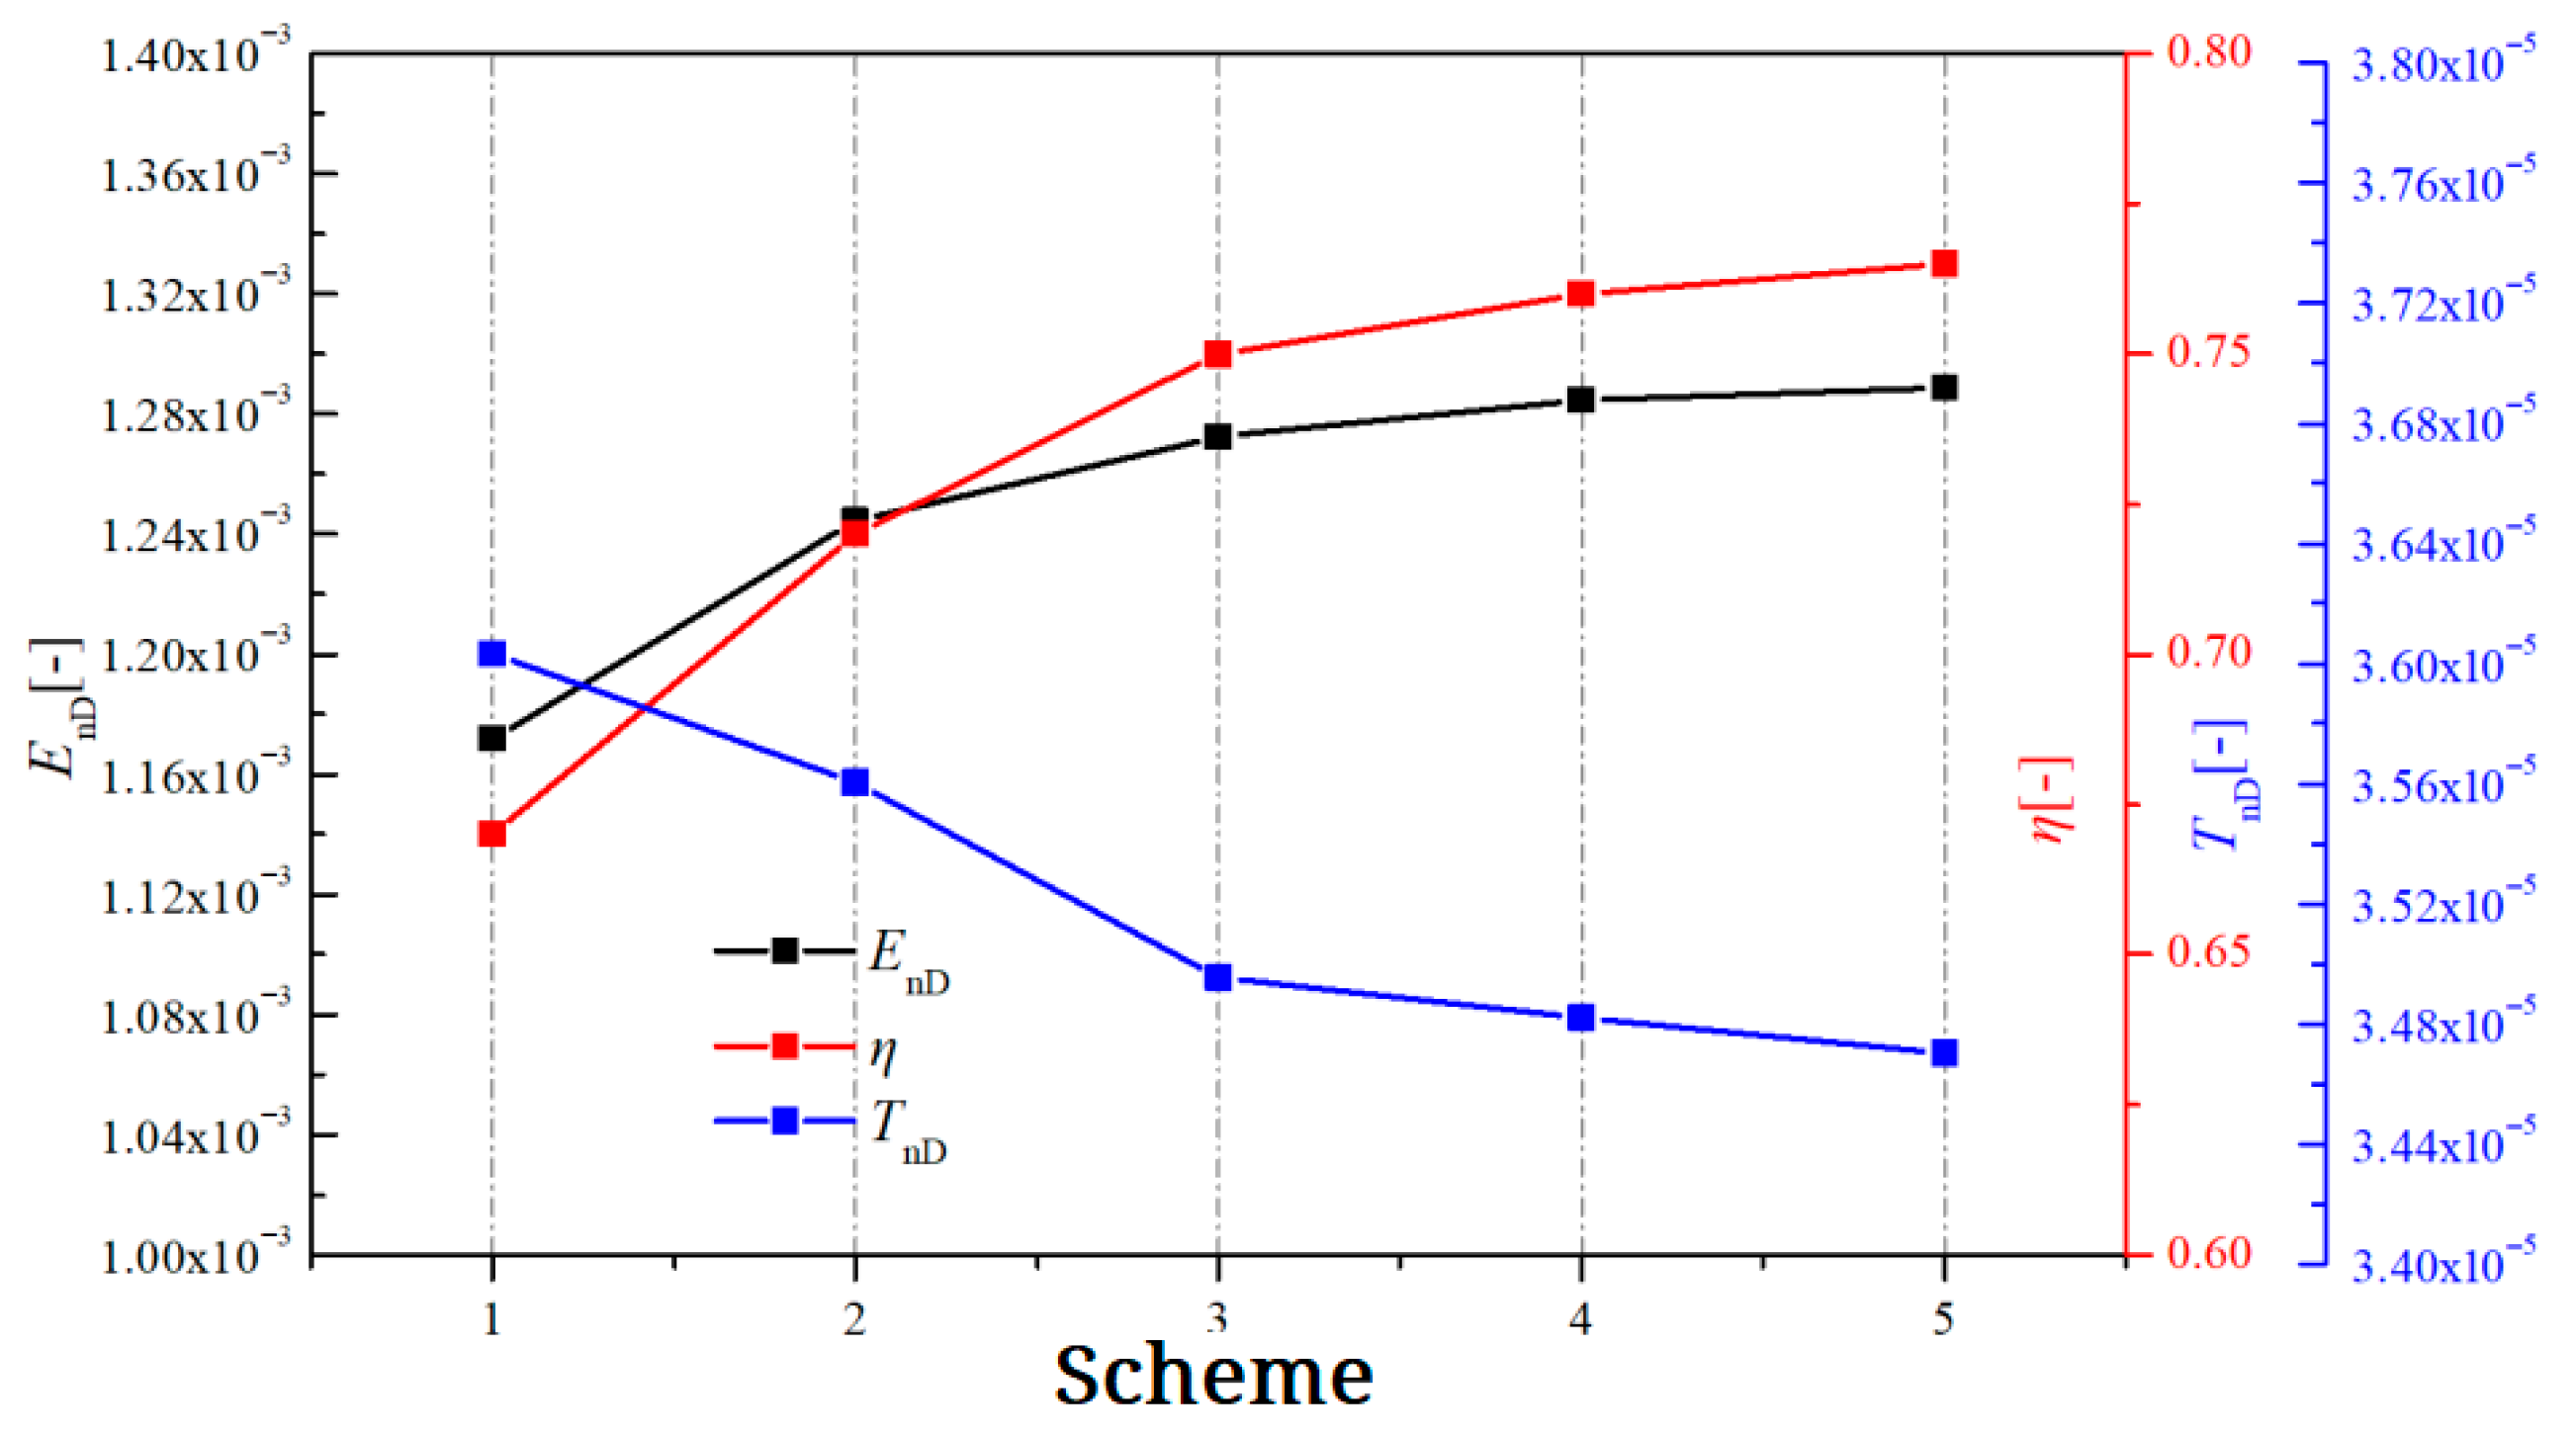
The fluid domain model of the test prototype is established, and the grid is divided by ICEM and TurboGrid as shown in Figure 5. All meshes are adjusted by setting the mesh size near the wall and the number of mesh layers in the boundary layers to ensure that the Y+ magnitude of the wall of key components is 1. The first layer of grids is located in the viscous bottom layer, which meets the requirements of the SST k-ω turbulence model used in this calculation. The SST k-ω turbulence model is more effective in predicting complex flow fields and is more suitable for simulating flow separation phenomena such as stall [25]. Keeping the grid division topology and the height of the first layer of grids on the wall unchanged, 5 sets of grid schemes are generated by increasing the grid density as shown in Figure 6. As the grid is continuously encrypted, after grid scheme 3, the energy coefficient EnD, efficiency, η, and torque coefficient, TnD, tend to be stable, as shown in Figure 7. As the grid is further encrypted, the numerical change is less than 3%. Considering the accuracy and economy of the calculation, grid scheme 4 was finally selected for calculation.
The computational software used in this study is ANSYS CFX 19.0. In the steady calculation, the inlet and outlet boundary conditions of the pump-turbine are set as mass flow rate and static pressure, respectively, the incoming flow turbulence intensity is 5%, and the walls of all components are set as smooth and non-slip. The runner blade jet wake and the guide vane have high-frequency rotor–stator interaction (referred to as RSI), and runner is equivalent to rotor, and stator is equivalent to stator. The “frozen rotor method” is used to achieve interface coupling between the runner and adjacent components. The “frozen rotor method” fully considers the relative positions of the flow domains on both sides of the interface and is suitable for situations where the velocity distribution on the interface is uneven [25]. This paper focuses on the stall, so this setting was chosen for the calculation. The interface between fixed components is set to None. The control equation is discretized in space using the finite volume method. The convergence criterion for the steady-state solution is set to a residual value less than 10−6. The maximum number of iterations is set to 800 steps, and the final result is averaged over the last 400 steps.
The unsteady calculation is based on the above steady calculation results as the initial file, and the total calculation time for each working condition is 1 s (during which the runner rotates about 20 times). The calculation time step is set to 0.00025641 s for the runner to rotate 2°. The solution convergence standard for each time step is that the calculation residual value is less than 10−5, and the maximum number of iterations for each time step is 10 steps.
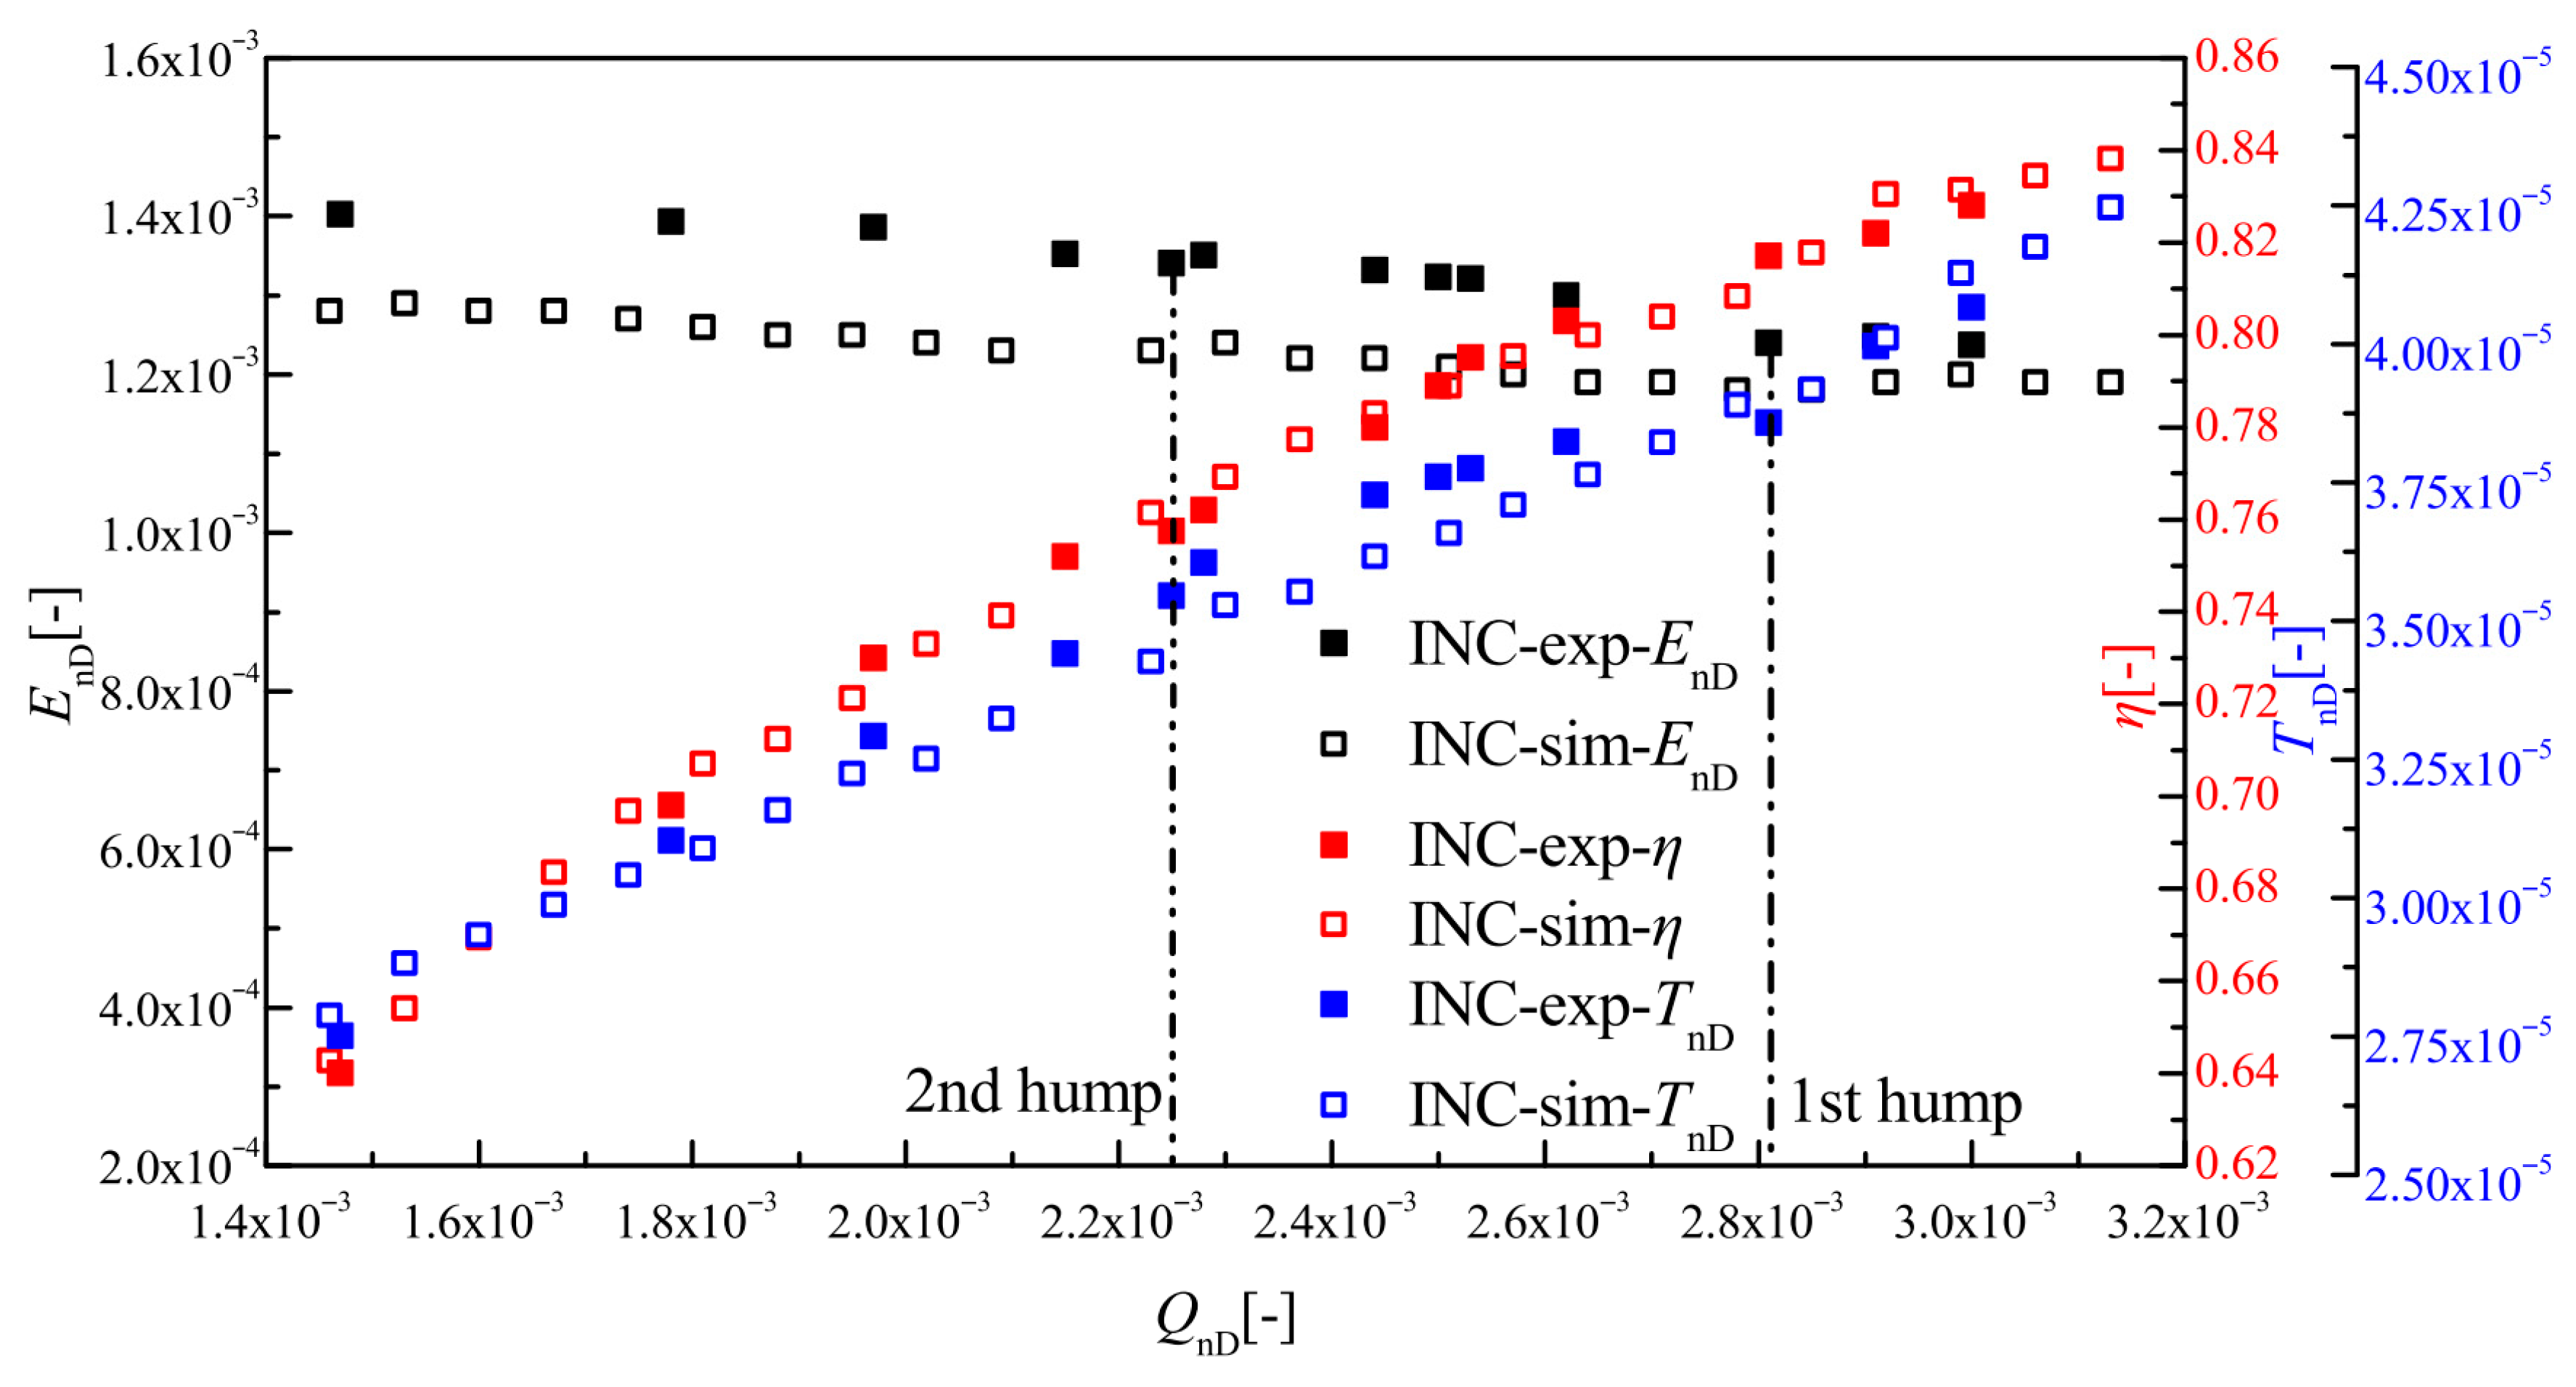
Numerical simulation of flow was carried out in the range of 0.4~1.2 QBEP. In order to verify the rationality of the calculation settings and the accuracy of the calculation results, the calculation values and test results were compared, as shown in Figure 8.
Analyzing the errors between the test results and the calculated values of each parameter in Figure 8, it can be seen that the predicted values near the highest efficiency point are basically consistent with the test values, and the maximum error occurs at the small flow rate far away from the highest efficiency point. The turbulence model overestimates the eddies and energy loss under low-flow conditions. Although gap leakage and disk friction are often ignored in calculations, the calculated EnD is still lower than the experimental value. During the test, there is torque caused by mechanical friction. The high-speed rotation of the runner also generates torque due to flow path deformation. The torque above is ignored in the simulation. Therefore, the calculated TnD is slightly lower than the experimental value. Of course, the error between the calculated and experimental value also depends on the accuracy of the test instrumentation, the accuracy of the measurement method, the accuracy of the 3D model, and the simulation settings. Generally speaking, as long as the error is within a reasonable range, it will not affect further research. From the statistical error, it can be seen that the errors of the energy coefficient, EnD, efficiency, η, and torque, TnD, at the design point are less than 2%, and the errors in the hump area are less than 7%, which are within the acceptable range. The feasibility of the calculation scheme and the credibility of the calculation results are verified.

3. Results and Discussion

3.1. The Influence of the Jet and Wake on Stall Formation

The occurrence of stall on the guide vane depends largely on the inflow velocity of the vane. Figure 9a describes the flow conditions at the runner outlet and the guide vane inlet under the design condition and the low-flow condition. The green and red lines in the figure represent the design condition and the low-flow condition, respectively. U, V, and W represent the circumferential velocity of the runner outlet, the absolute velocity of the runner outlet fluid in the stationary coordinate system, and the relative velocity of the runner outlet flow in the runner rotating coordinate system, respectively. The subscripts D, m, and u, respectively, represent the design working conditions, the axial plane component of the absolute speed, and the circumferential component of the absolute speed. α, β, φ, and θ represent the angle between the runner outlet flow and the circumferential tangent direction, the runner blade outlet placement angle, the guide vane inlet flow angle, and the guide vane inlet attack angle, respectively. Under the design condition, the guide vane inlet φD is basically consistent with the guide vane placement angle, so no obvious stall will occur. When the flow rate decreases from the design point, larger θ is formed between the guide vane inlet flow and the blade placement angle, and stall occurs near the blade. The relative velocity of the runner wake is often lower than that of the mainstream. The analysis of the flow separation of the runner wake at the guide vane inlet is shown in Figure 9b. In Figure 9b, the red lines represent the jet and the yellow lines represent the wake. It can be seen that the attack angle θW is large.
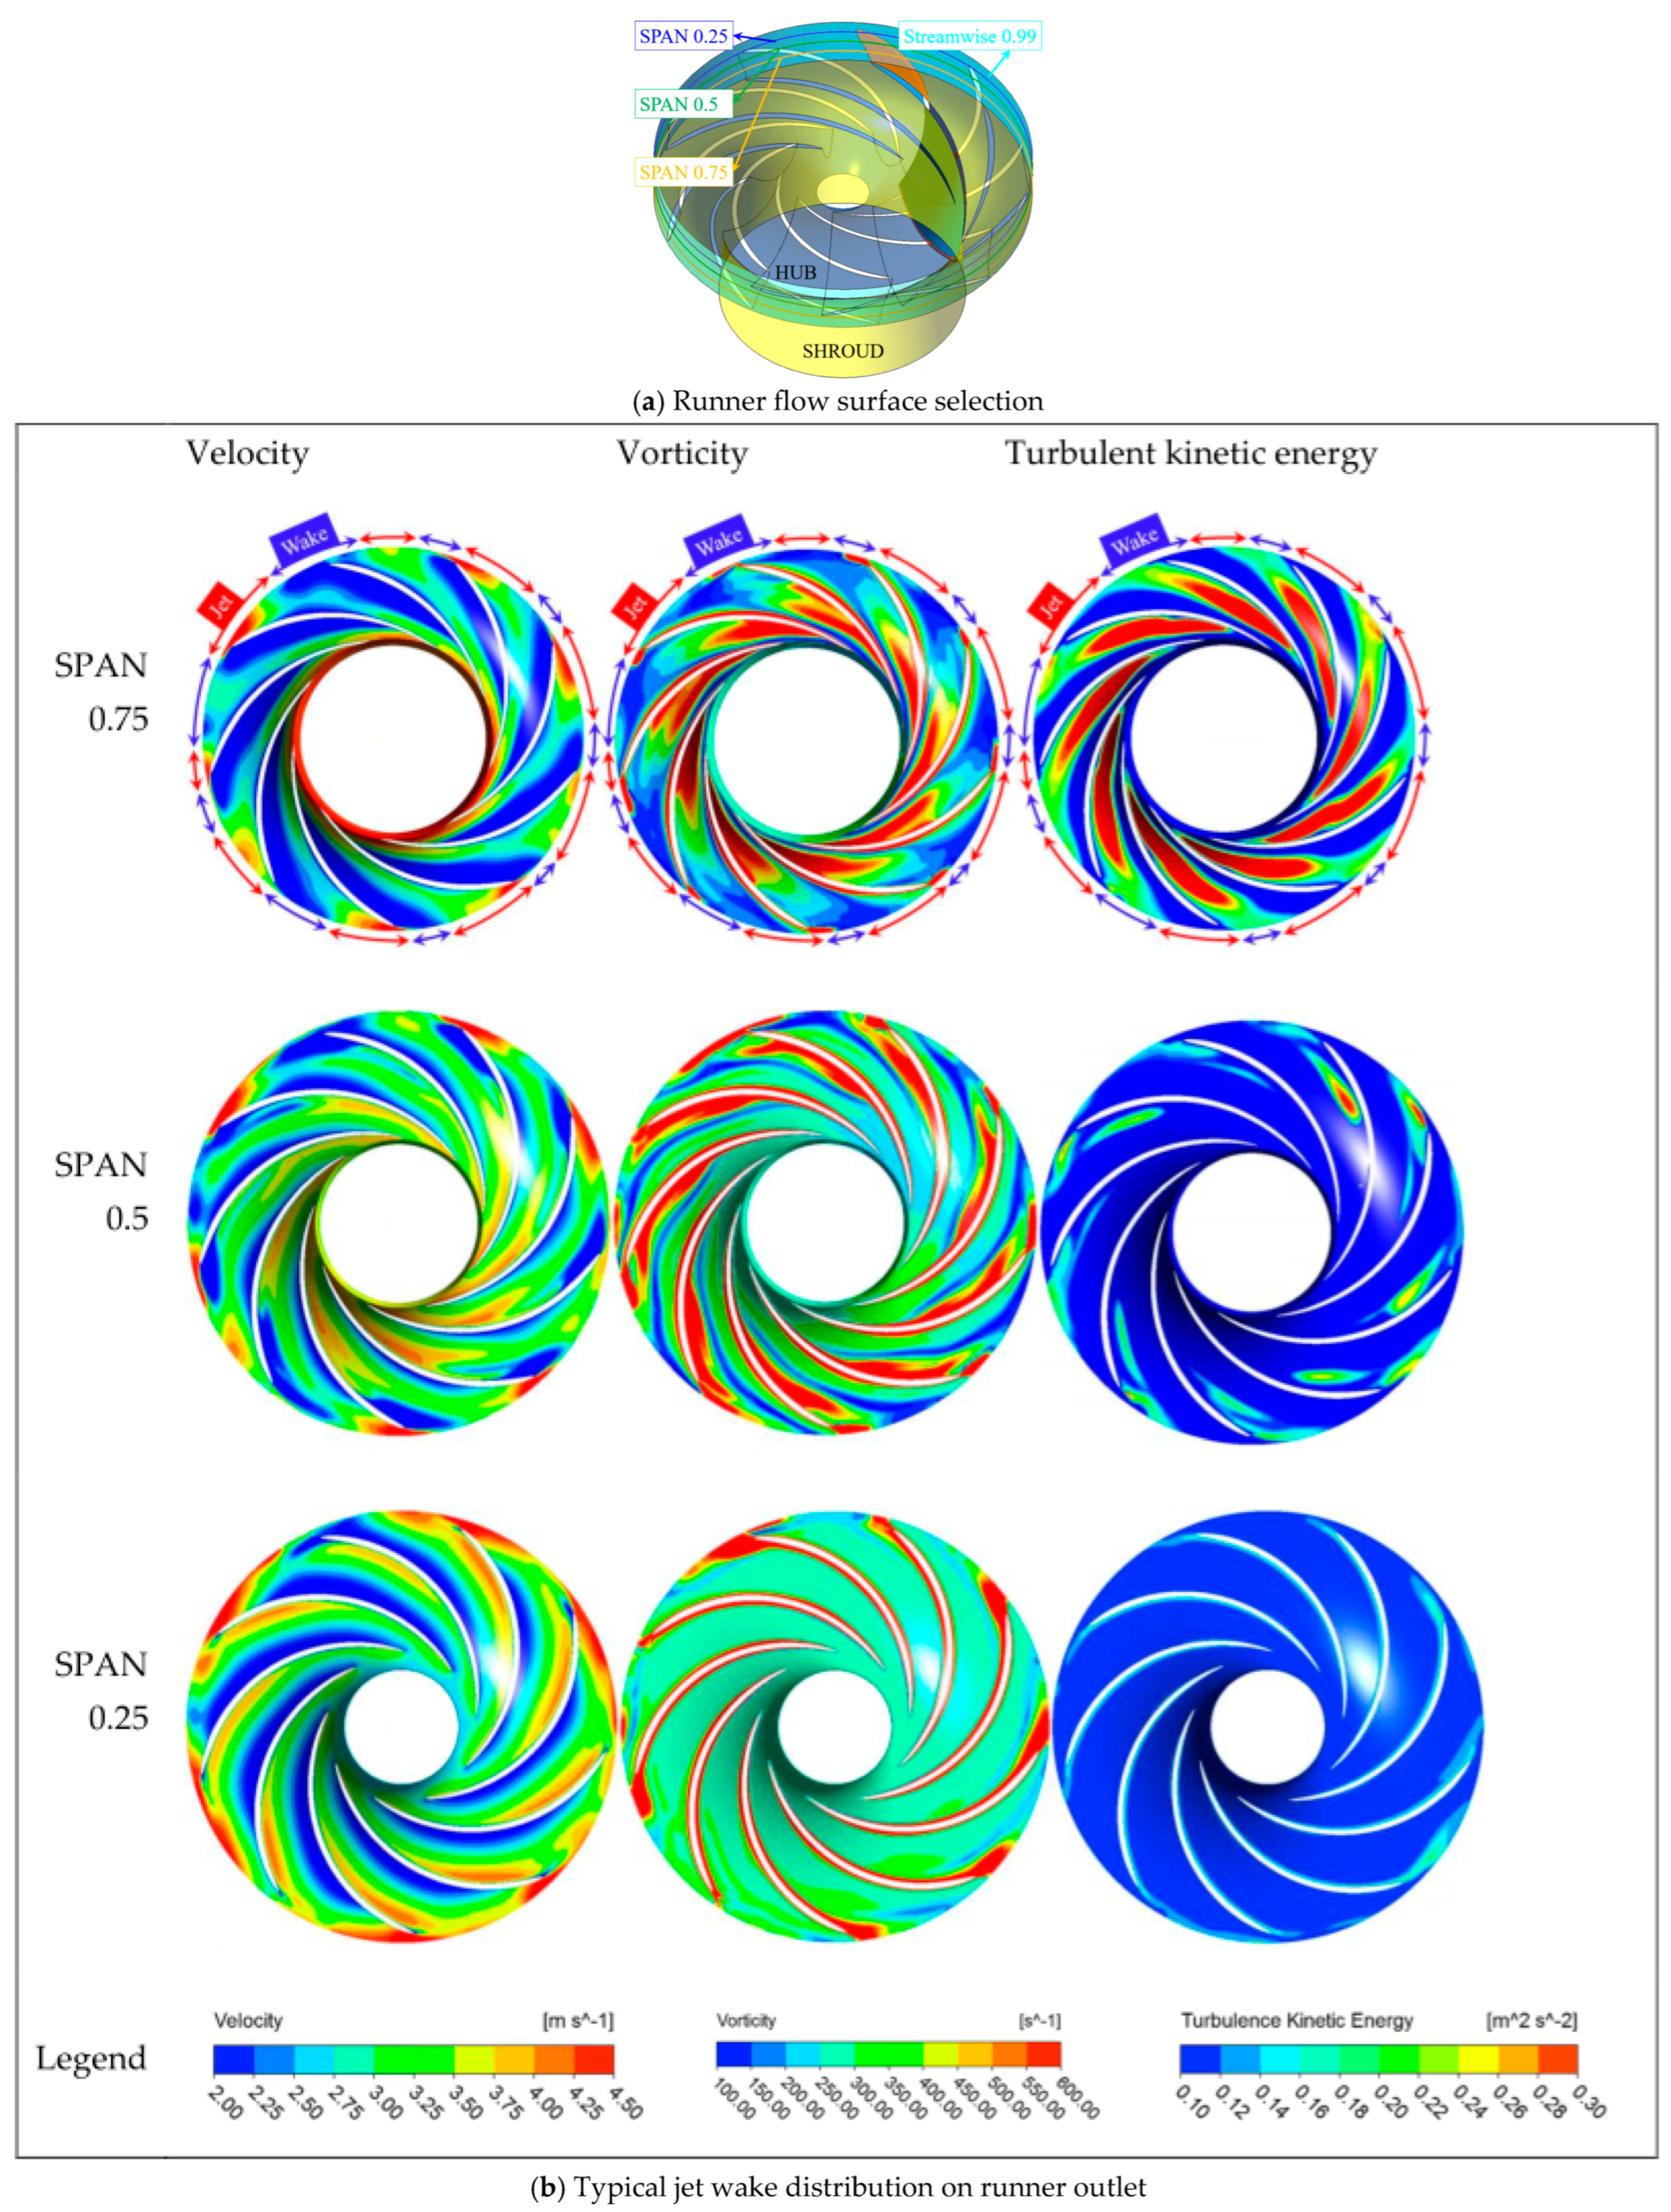
The 0.74 QBEP is selected as an example to analyze the process of stall induced by RSI. The flow distribution at the runner outlet under this condition is shown in Figure 10. Three target flow surfaces in Figure 10a are selected to draw the velocity, vorticity, and turbulent kinetic energy cloud diagram as shown in Figure 10b. On the flow surface near the runner shroud (spanwise position SPAN = 0.75), the runner outlet velocity is unevenly distributed in the circumferential direction, forming an alternating distribution pattern of “high speed-low speed-high speed”. The high-speed area is close to the blade pressure surface, and the low-speed area is close to the blade suction surface. The former is called “jet”, and the latter is called “wake”. From the shroud to the hub, the coverage of the runner outlet wake in the circumferential direction gradually decreases.
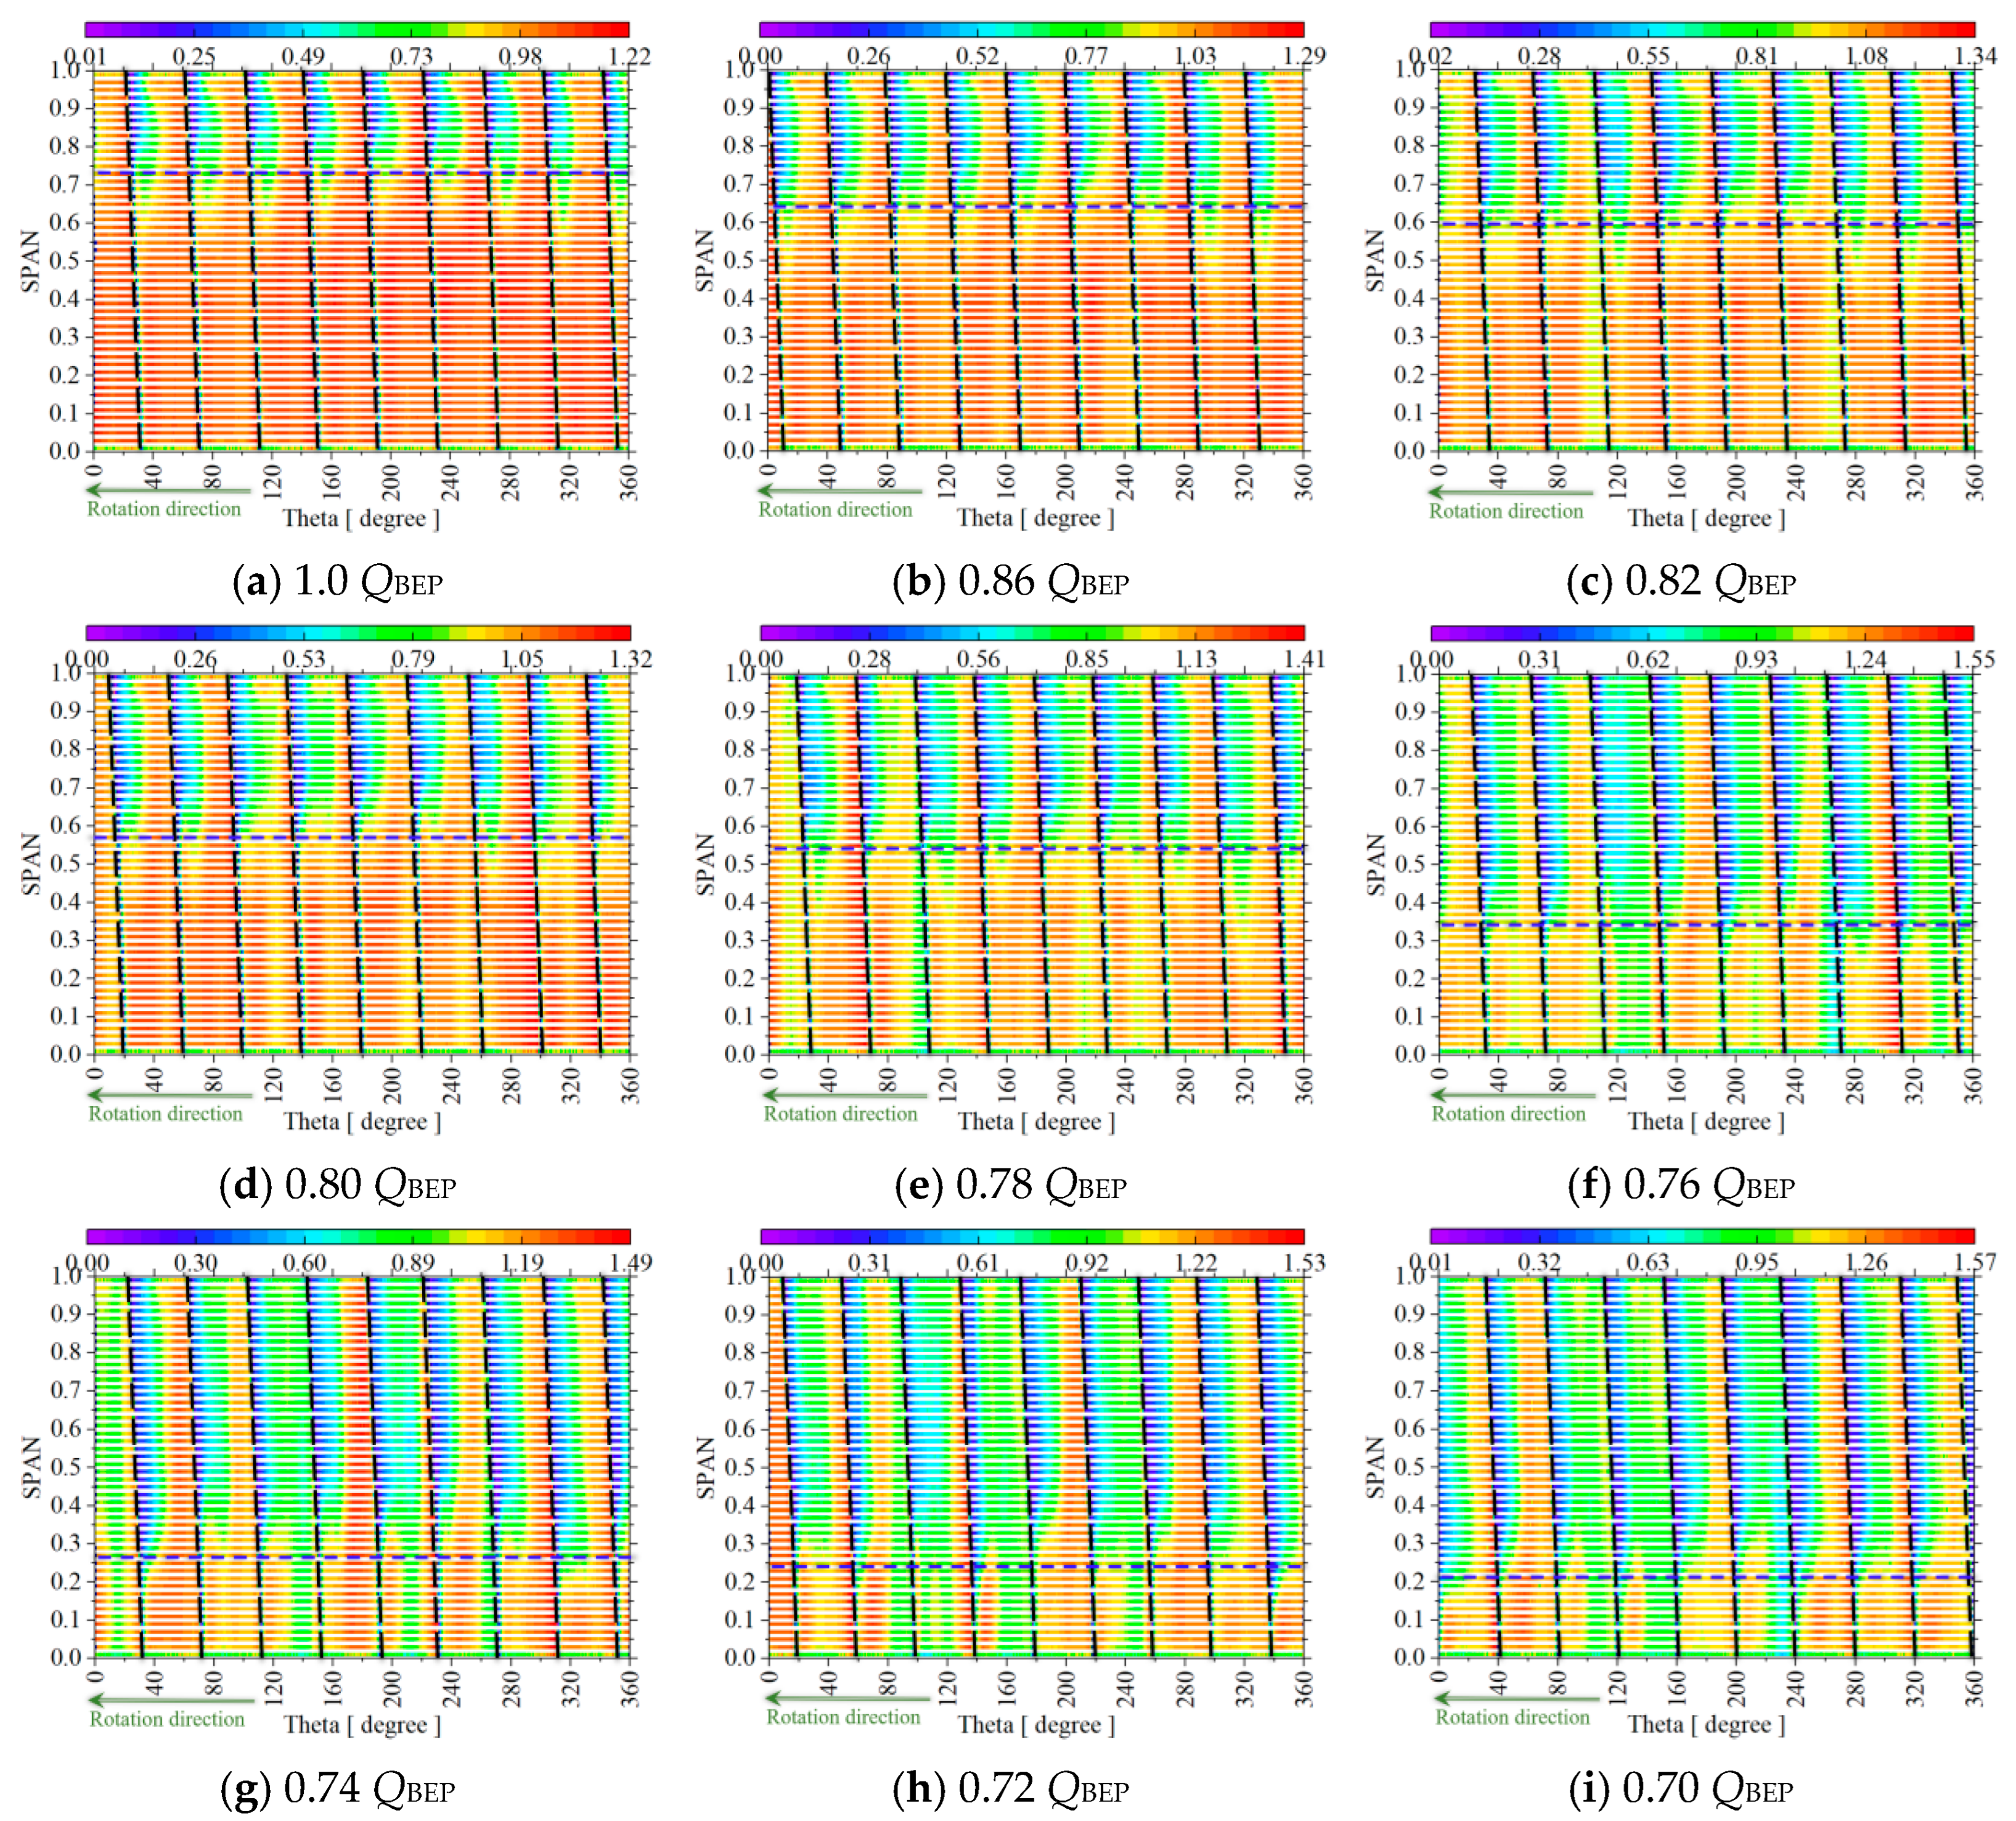
The flow section of the runner outlet (streamwise position Streamwise = 0.99) in Figure 10a is expanded as shown in Figure 11. In the figure, the horizontal axis represents the circumferential angle of the runner outlet, and the vertical axis represents the blade span height from the runner hub to shroud. The color bar from blue to red represents the dimensionless flow velocity v′ from low to high. The black dotted line represents the outlet edge of the runner blade. The blue dotted line box is the wake area, the red dotted line box is the jet area, and the blue horizontal dotted line represents the boundary of the wake area at the entire blade height (hereinafter referred to as the wake boundary), where the definition of v′ is shown in the following formula:
v = v v ¯
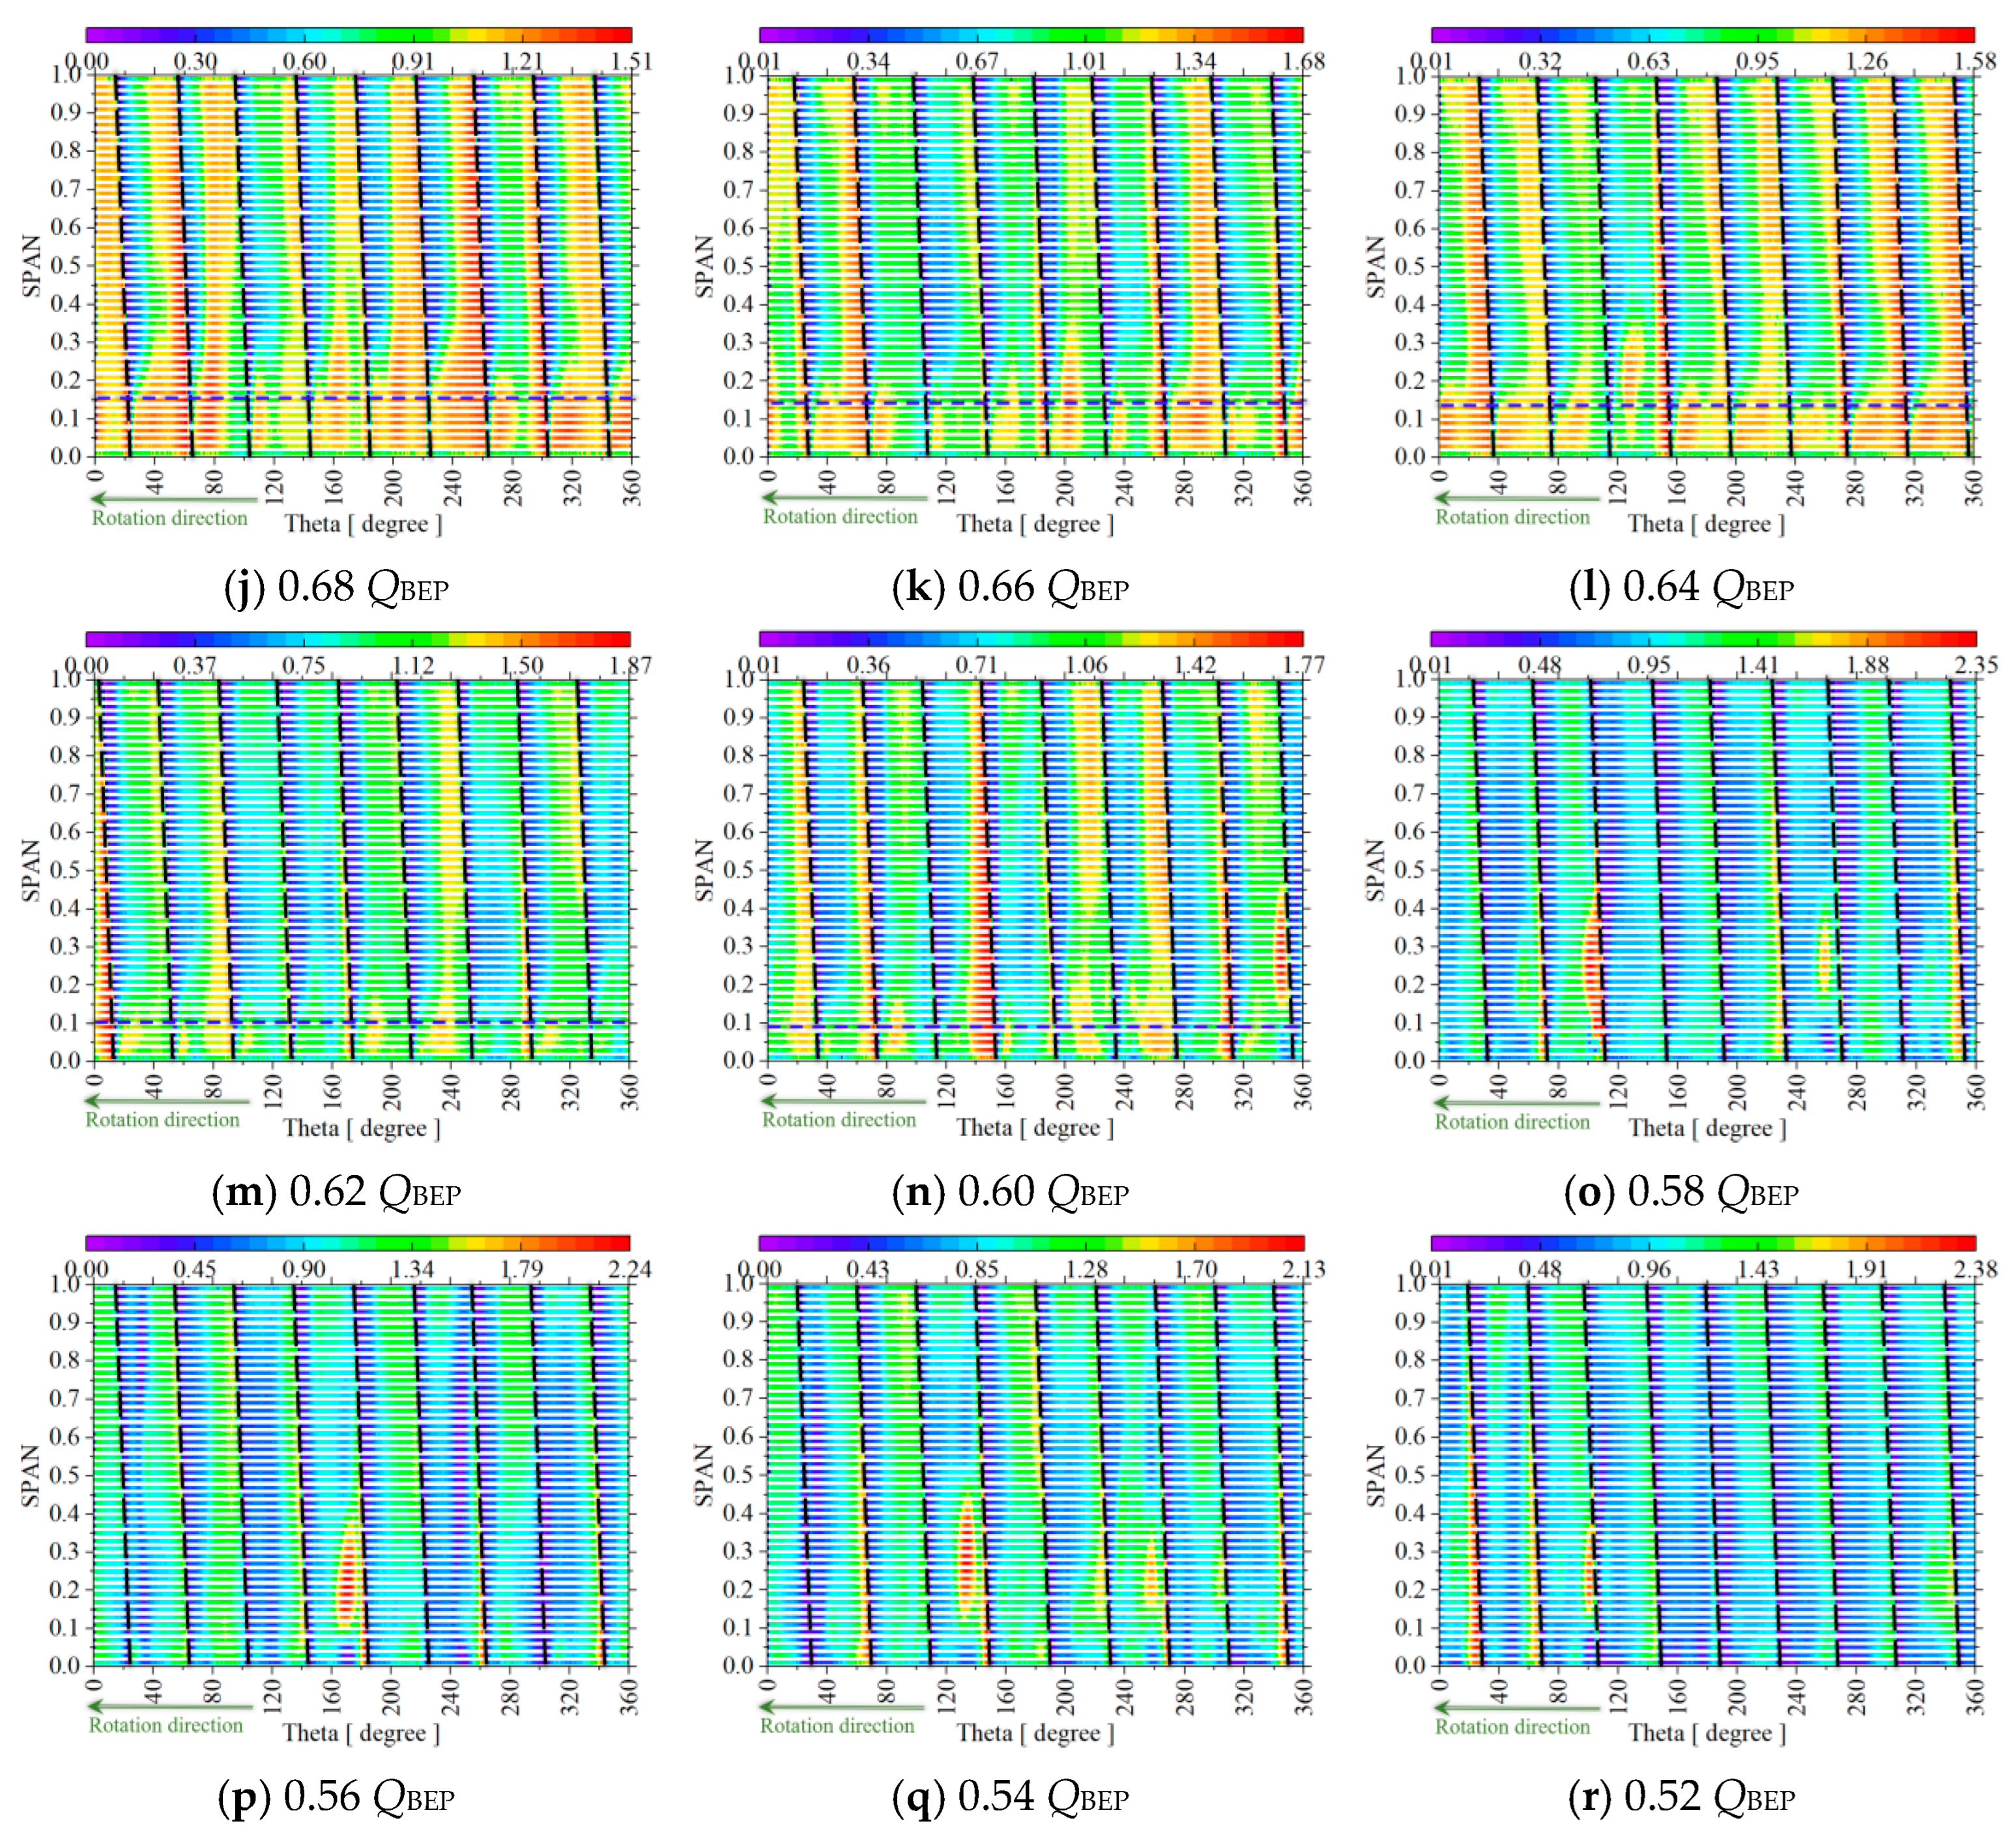
where v represents the flow velocity, and v ¯ represents the average flow velocity on the runner outlet flow section. Figure 11 clearly shows the alternating phenomenon of “wake-jet-wake” between adjacent blades at the runner outlet. In the entire blade span height, the wake mainly exists in the range from the runner shroud to the medium blade span height. Similarly, the jet wakes for all operating conditions are analyzed, as shown in Figure 12. Under the design condition, as shown in Figure 12a, the wake area is concentrated near the impeller outlet near the front shroud, and the wake size and shape near each blade are similar. As the flow rate decreases, the circumferential coverage of the wake (hereinafter referred to as the wake length) does not increase significantly but gradually extends spanwise toward the rear shroud, with the wake size and shape near each blade remaining relatively similar. Starting from 0.60 QBEP, as the flow rate decreases, the wake rapidly extends spanwise and wake length increases rapidly, gradually covering the entire blade span height, and the low-speed wake area gradually covers the entire flow cross-section.
It can be seen that the flow separation generated on the guide vane surface when the runner jet and wake pass through is different. The wake is likely to cause a greater degree of flow separation and stall cell. The mechanism of RSI inducing stall inside the guide vane is analyzed below.
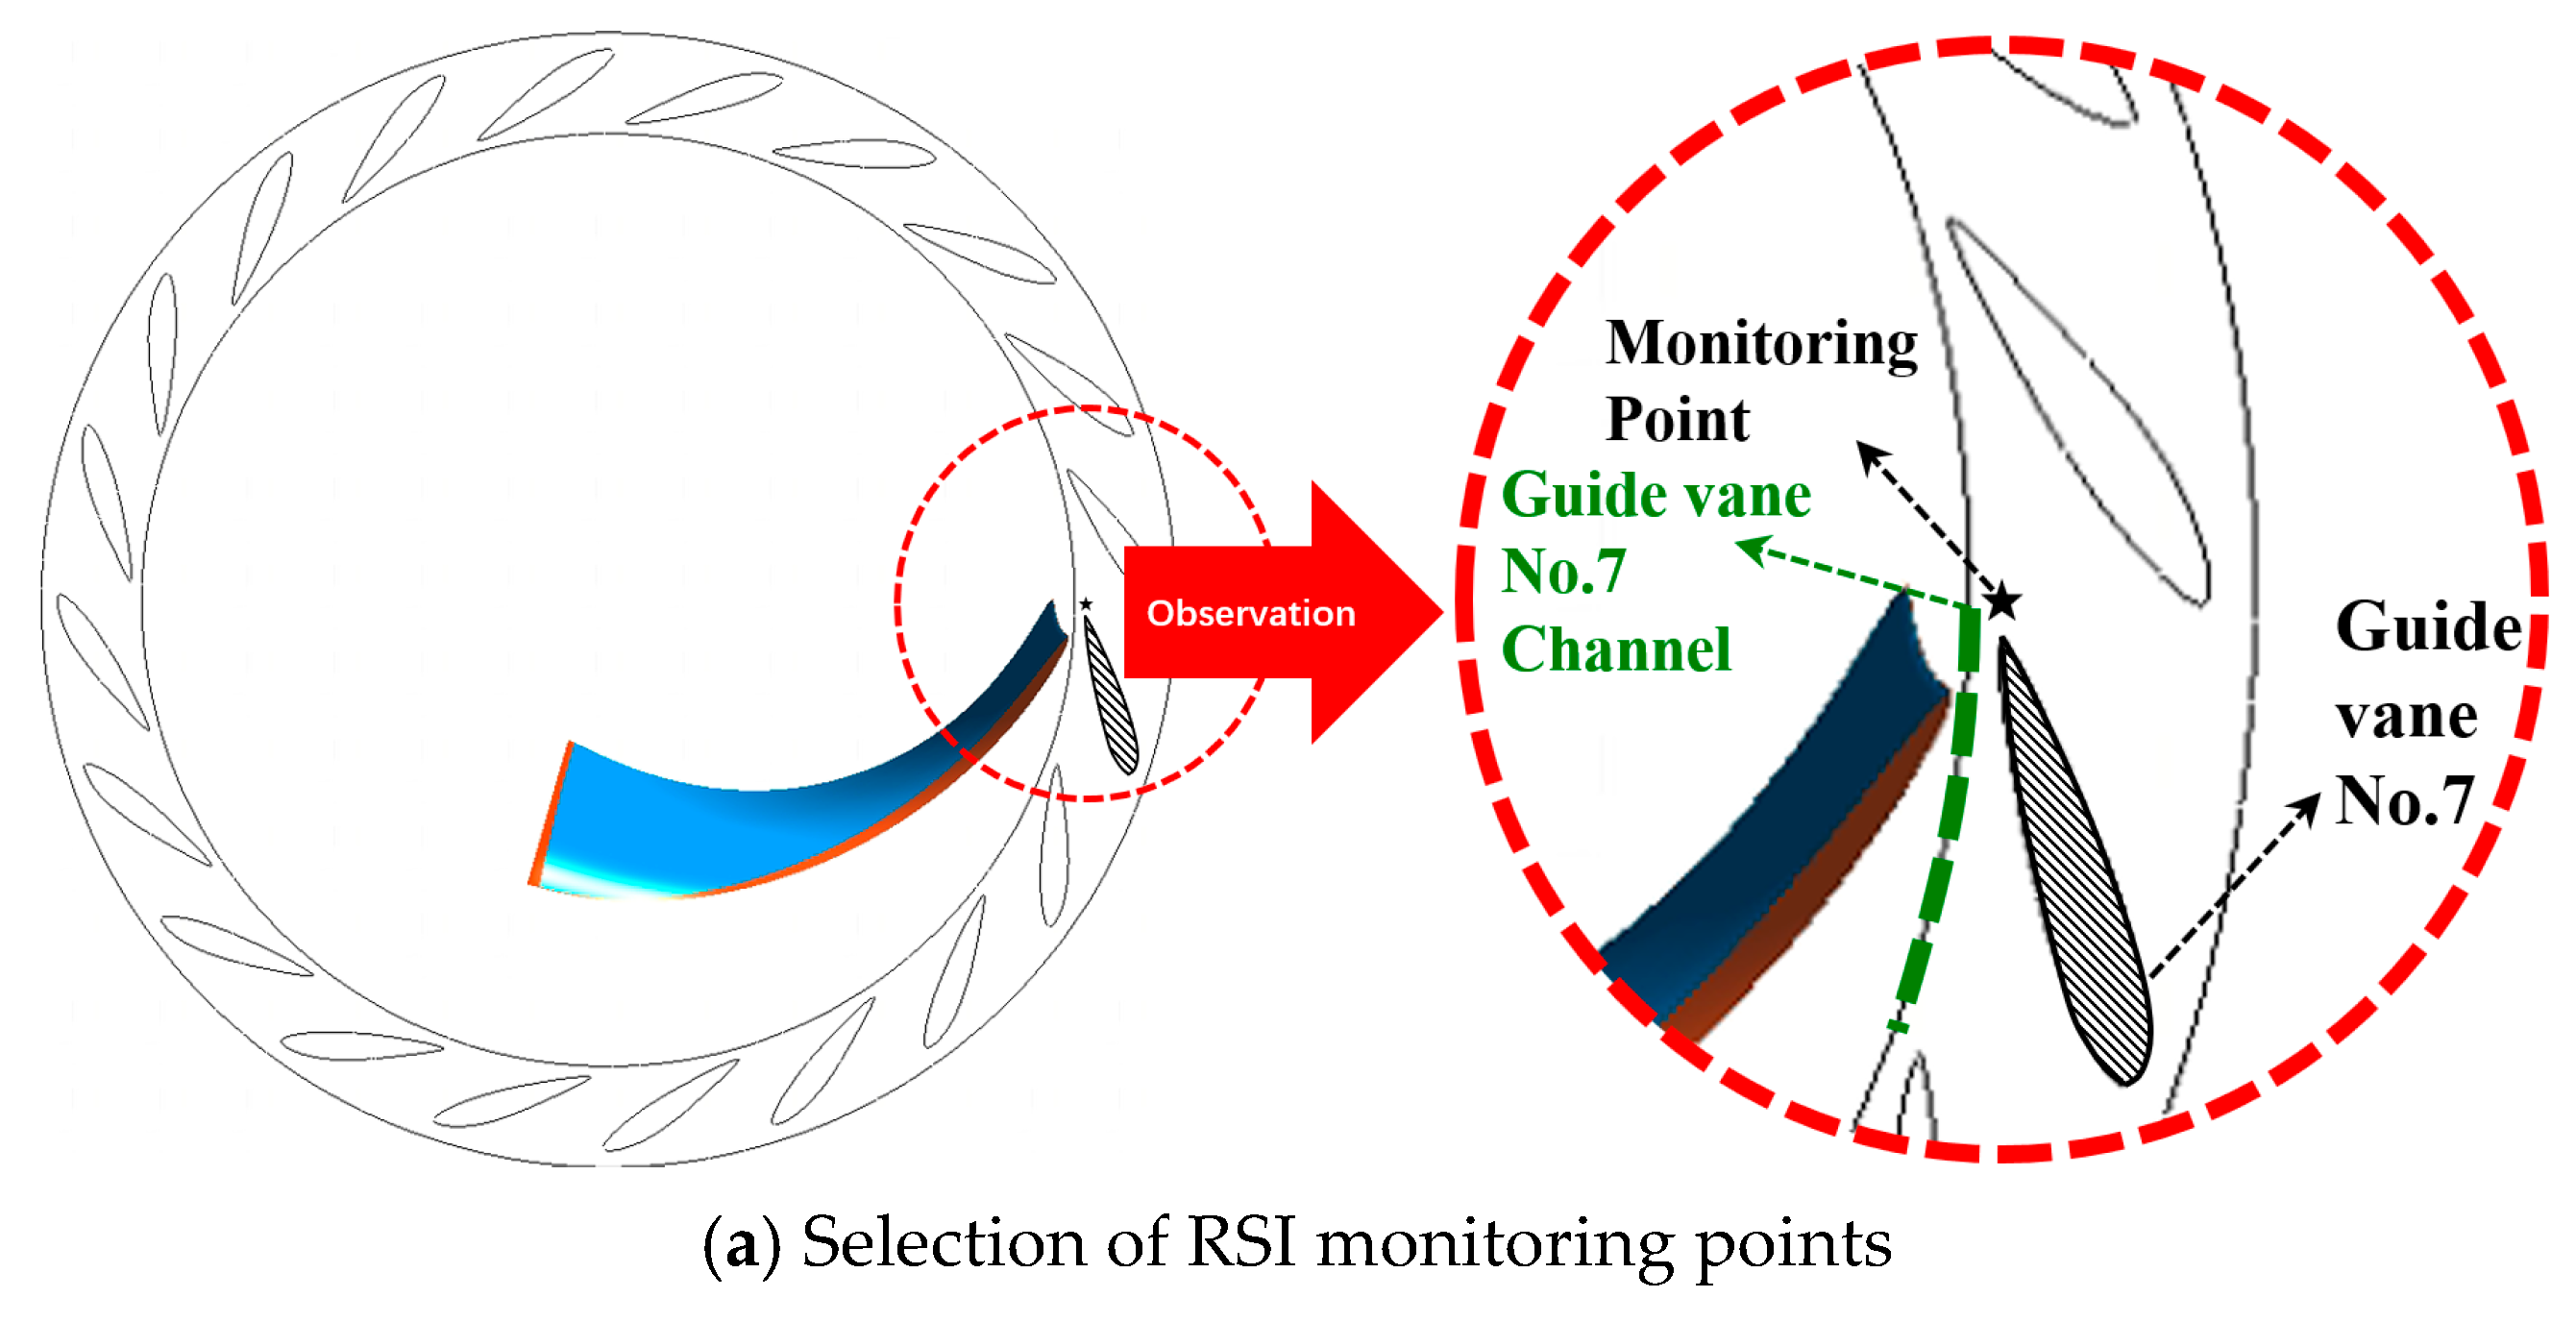
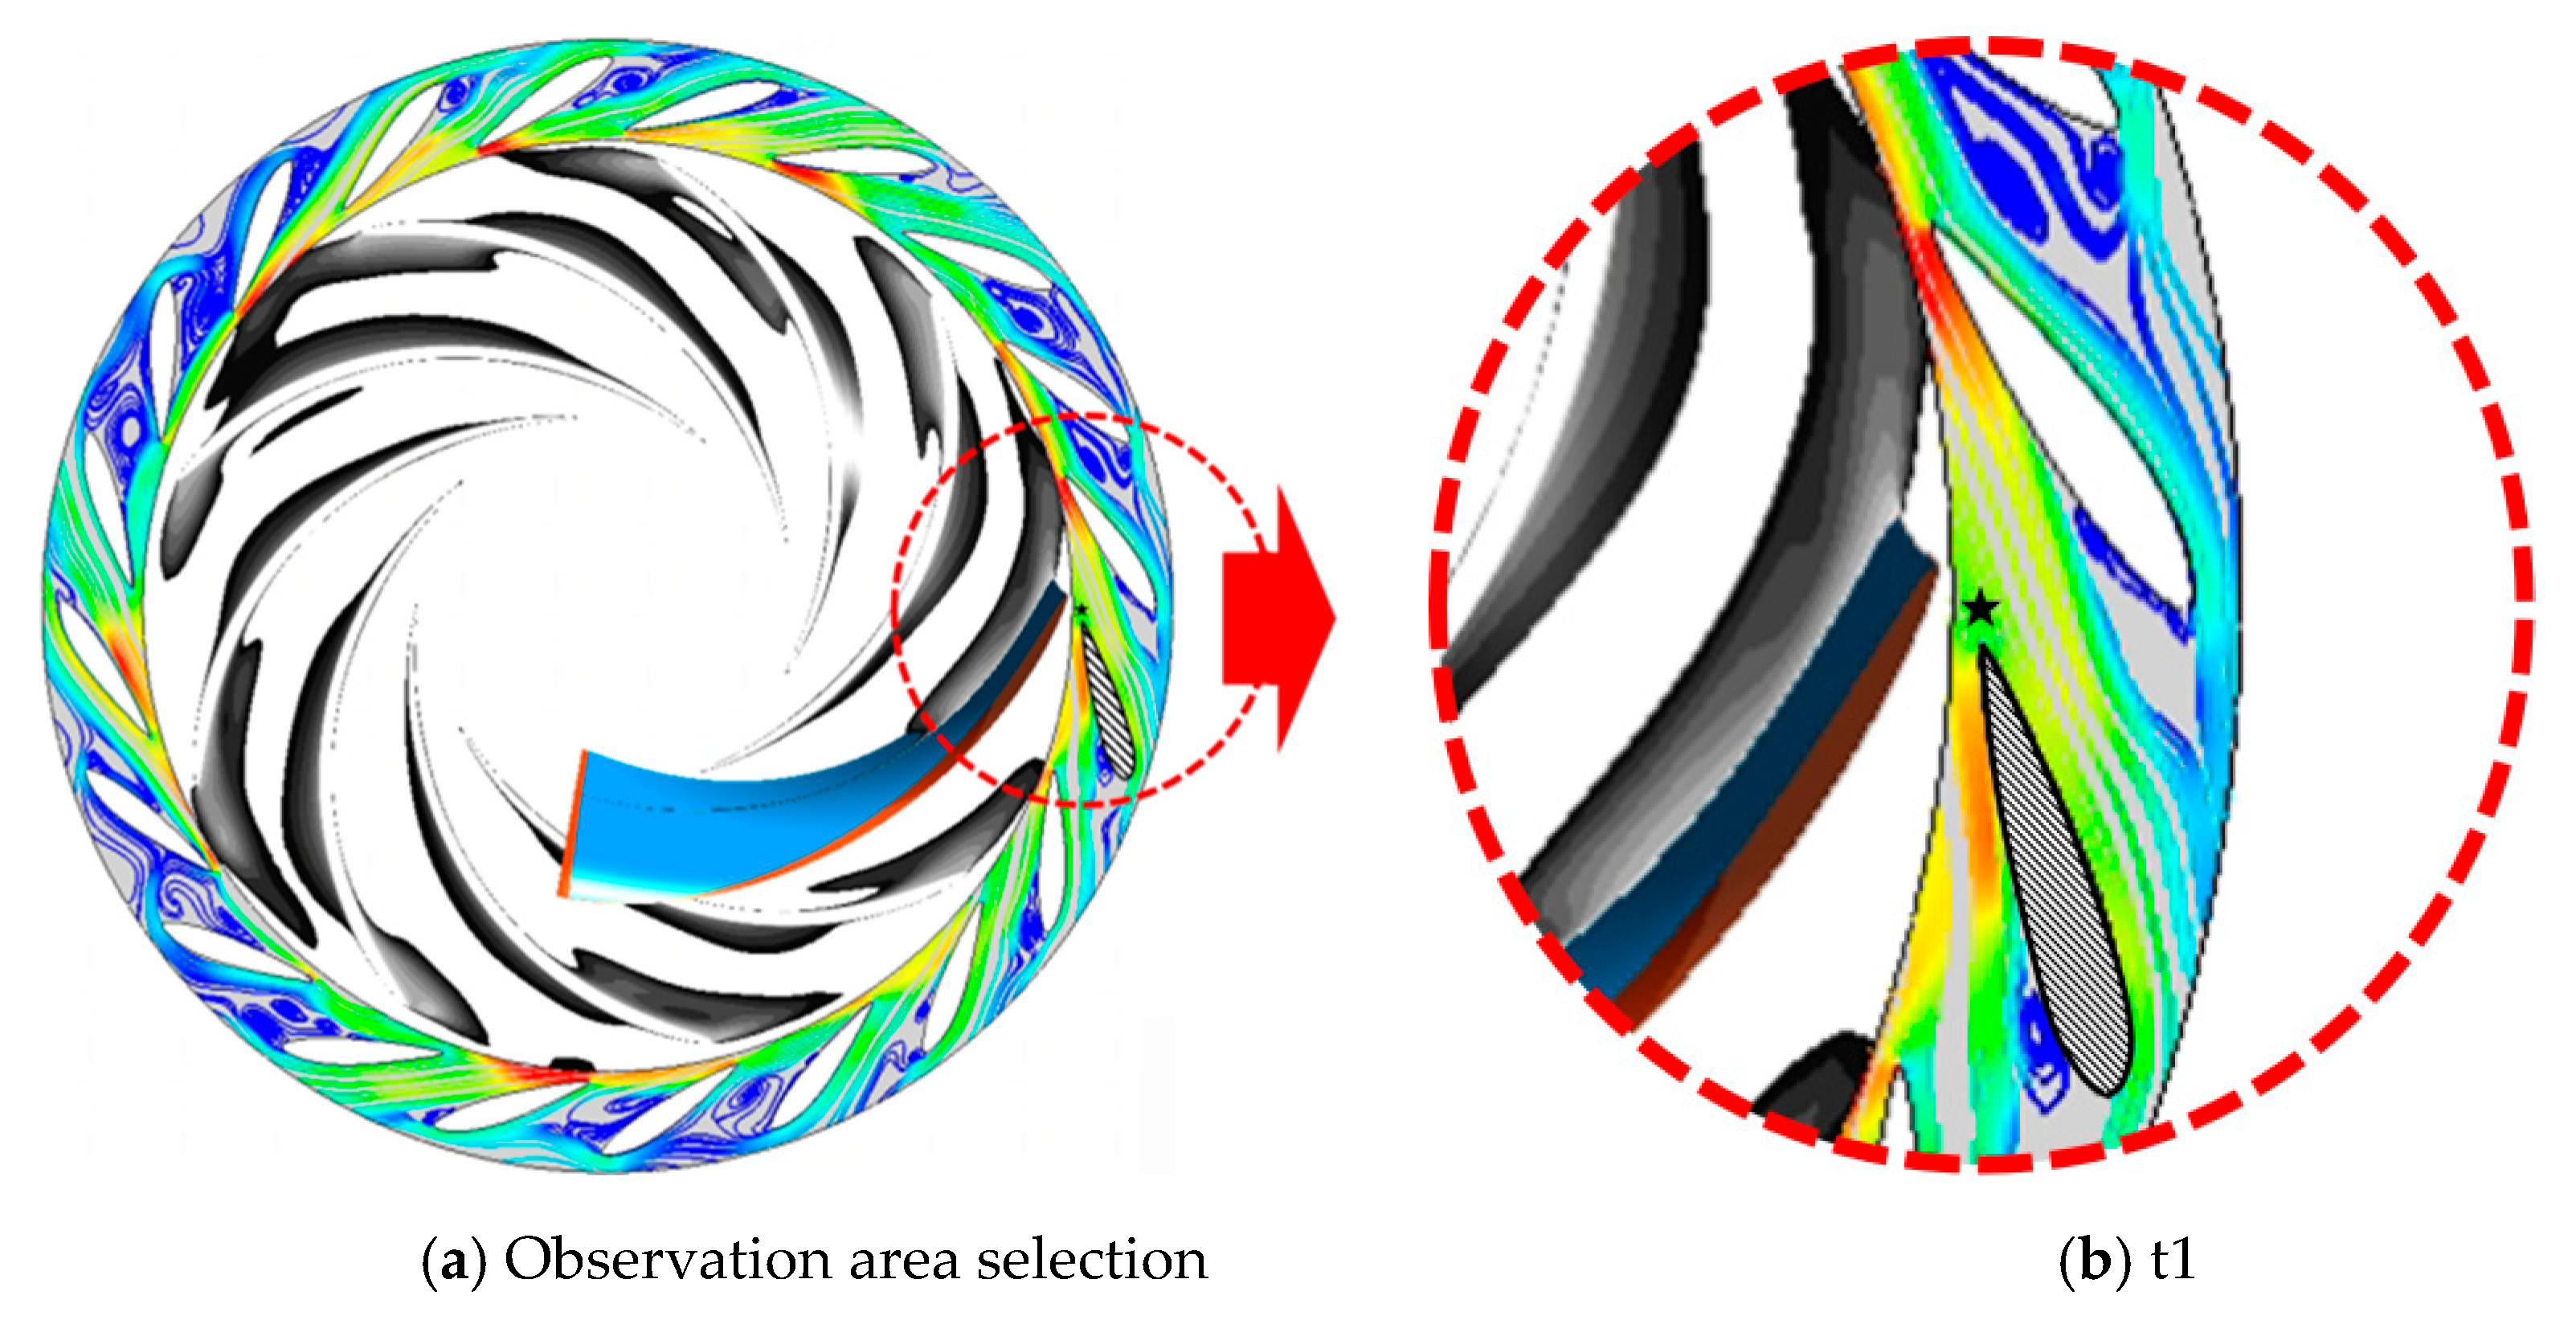
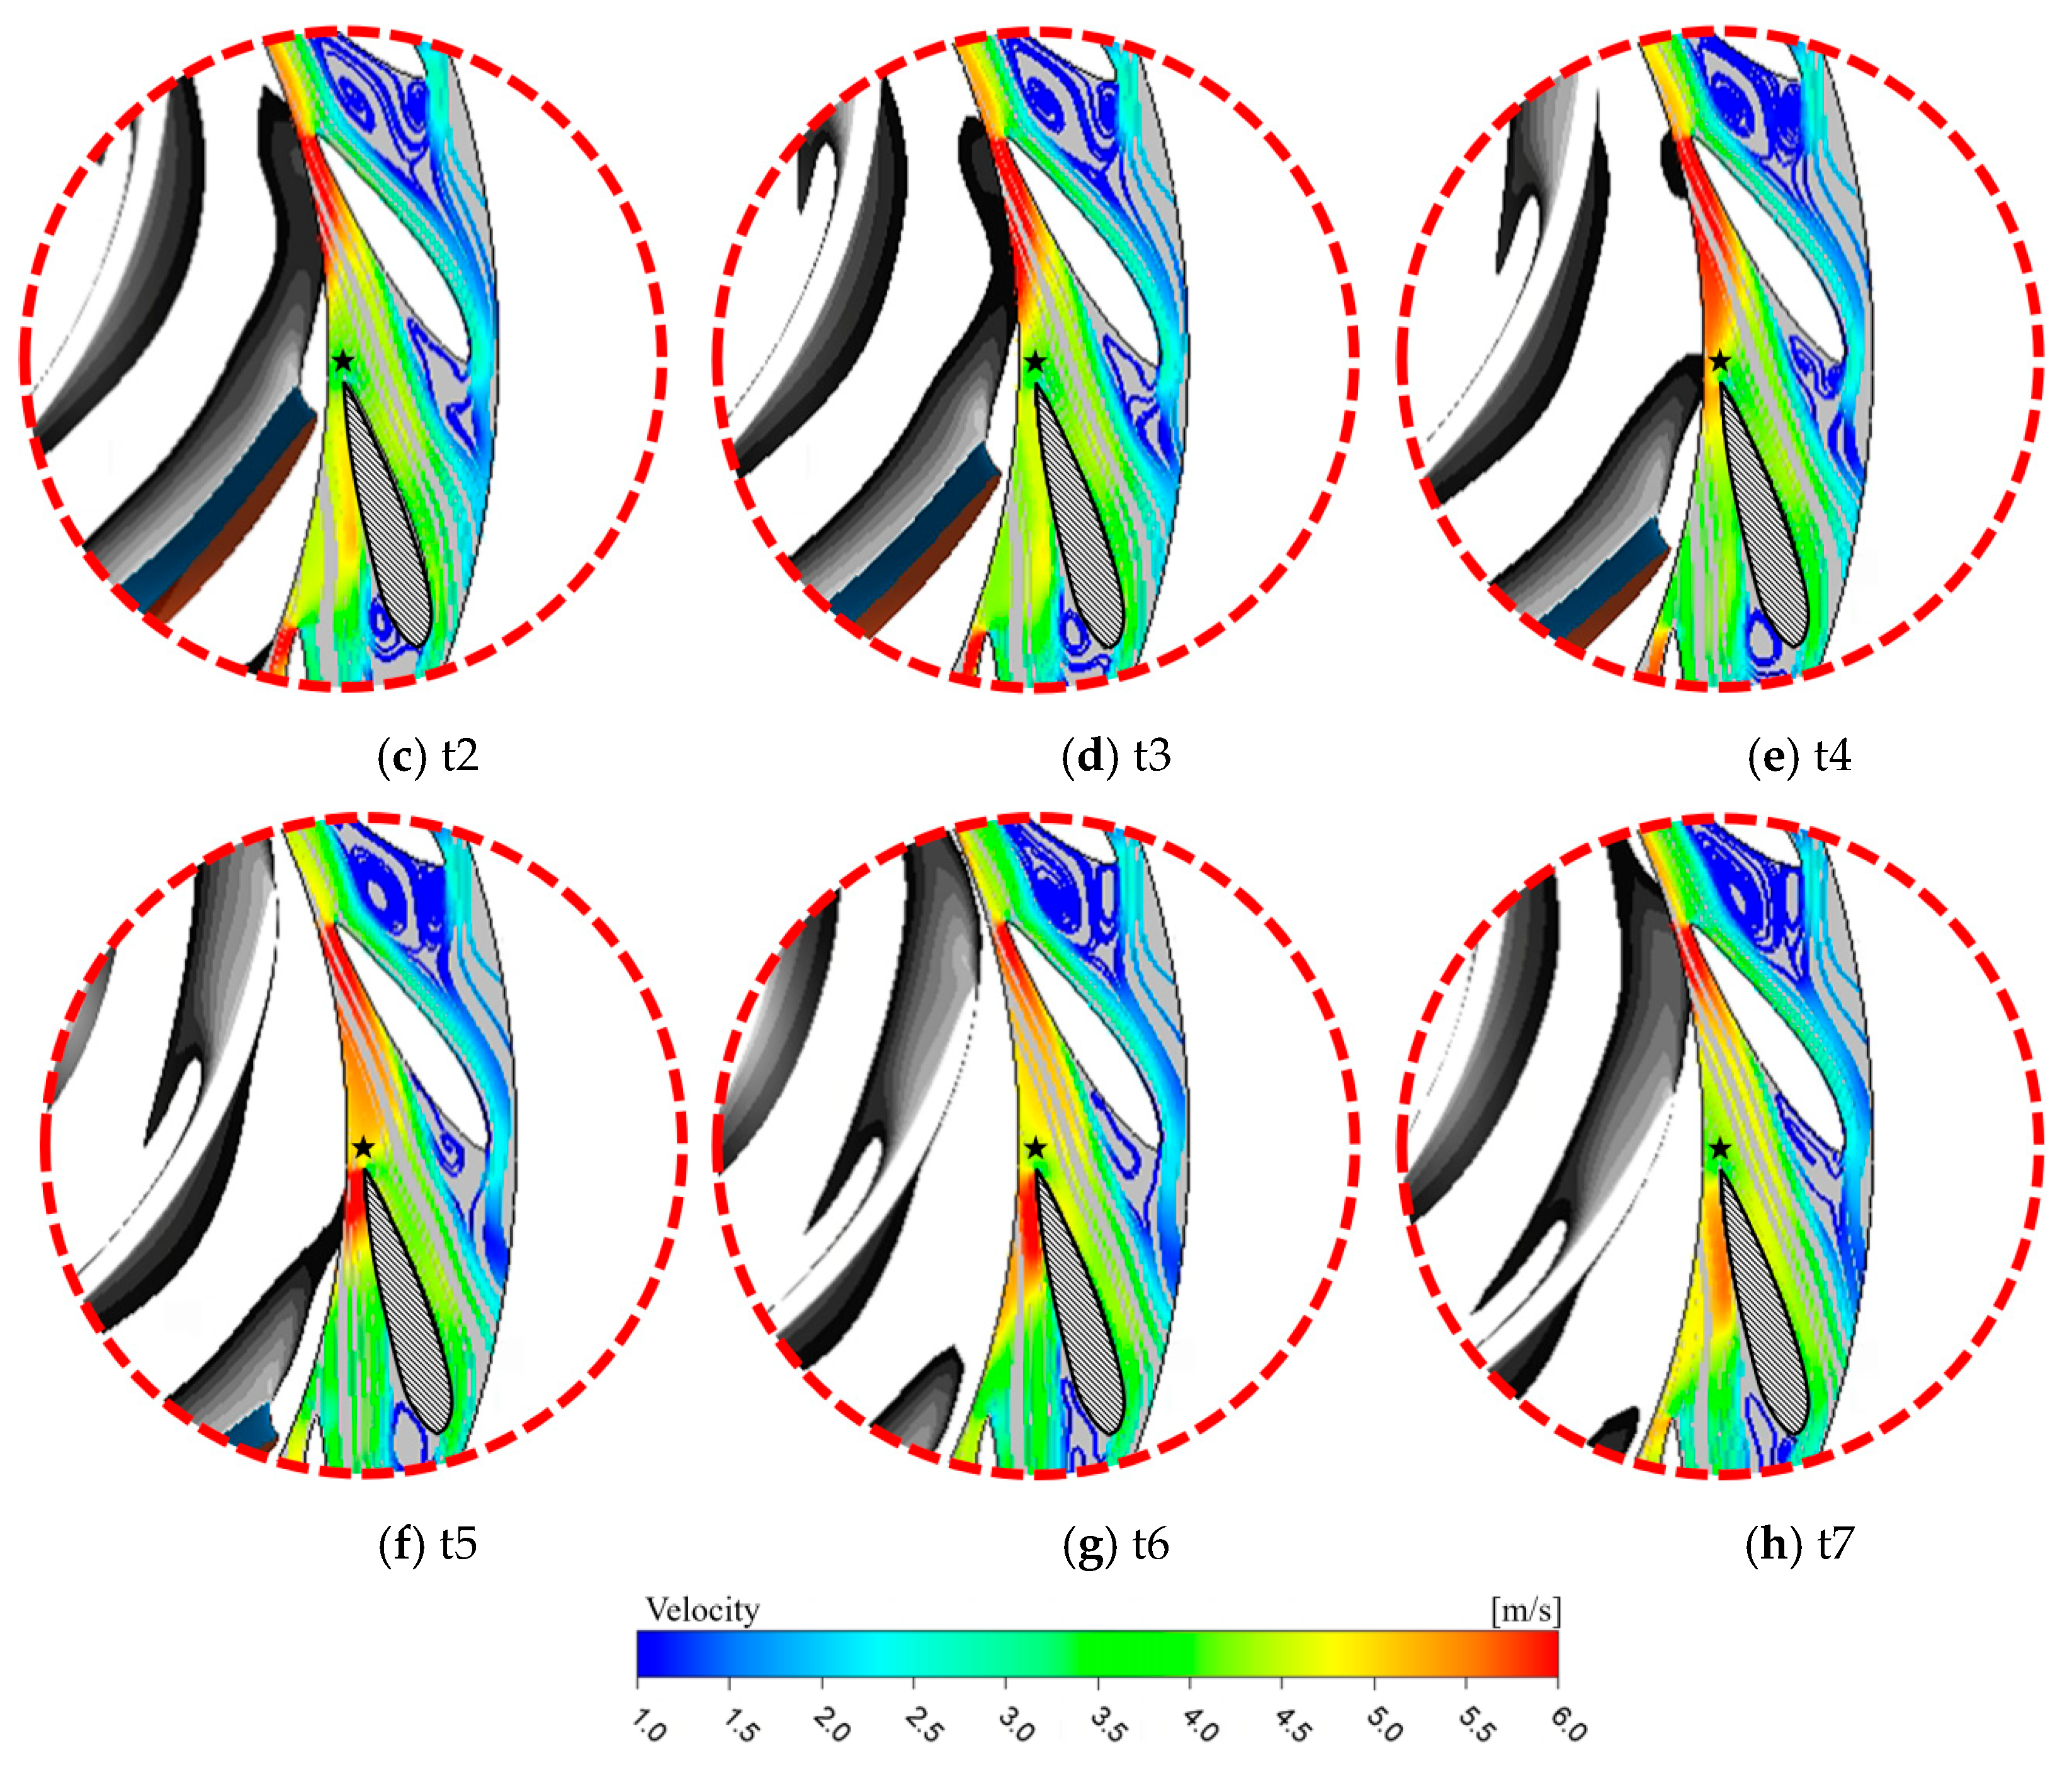
When the runner blade passes over any blade of the guide vane, the latter will interfere with the jet and wake at the runner blade once, respectively. By observing the inlet monitoring point of the active guide vane No. 7 as shown in Figure 13a, it can be found that the change rules of the inflow angle φ, flow velocity, vorticity, pressure, and turbulence kinetic energy (TKE) at this position during one rotation of the runner are shown in Figure 13b. The horizontal axis in the figure represents the entire time interval of the 9th rotation of the runner in the simulation calculation. During this process, the 9 runner blades passed the inlet of the guide vane No. 7 in turn, and the inflow angle φ at the monitoring point fluctuated periodically 9 times. The velocity, vorticity, pressure, and turbulent kinetic energy at the monitoring point all undergo the same periodic changes. The orange background area in Figure 13b is enlarged as shown in Figure 13c. Seven time points, t1–t7, are selected at equal intervals, and the positional relationship between the runner wake and the monitoring point in the wave cycle is analyzed as shown in Figure 14.
Combining Figure 13c and Figure 14, it is found that at time t1, although the monitoring point is very close to the trailing edge of the runner blade, it is far away from the wake area of the blade. At this time, the monitoring point φ takes the maximum value in the fluctuation cycle, and the flow velocity, vorticity, static pressure, and turbulent kinetic energy all take the minimum value; Starting from time t2, the wake area continues to approach the monitoring point as the runner blade rotates and completely covers the monitoring point at time t4. In this process, φ at the monitoring point continues to decrease to the minimum value in the fluctuation cycle, while the pressure, vorticity, and turbulent kinetic energy continue to increase to the maximum value in the fluctuation cycle; from t5 to t7, the wake continues to move away from the monitoring point as the runner rotates, and the next runner blade wake is still far away from the monitoring point. At this time, the monitoring point is least disturbed by the wake. In this process, φ continues to increase to the maximum value in the fluctuation cycle, and the flow velocity, vorticity, pressure, and turbulent kinetic energy continue to decrease to the minimum value in the fluctuation cycle. After time t7, the next runner blade wake will start a similar interference cycle for the monitoring point.
It can be seen that in one RSI cycle, the guide vane inlet undergoes a complete process of the runner blade wake from approaching to moving away. When the wake is closest, the flow angle at the monitoring point is the smallest, while the flow velocity, pressure, vorticity, and turbulent kinetic energy are the largest. When the wake is farthest, the flow angle at the monitoring point is the largest, while the flow velocity, pressure, vorticity, and turbulent kinetic energy are the smallest. This rule can be clearly observed in all 9 RSI fluctuation cycles in Figure 13b.
Since the wake area has the characteristics of high vorticity and high turbulent kinetic energy, the vorticity and turbulent kinetic energy at the monitoring point increase and decrease when the wake approaches and moves away. When the low-velocity wake area approaches, the velocity at the inlet of the guide vane increases. The reason is analyzed as shown in Figure 9b. The subscript W in the figure represents the wake, and the red line and the yellow line represent the velocity triangles of the non-wake area and the wake area at the runner outlet, respectively. The relative velocity WW of the wake is smaller than the W in the non-wake area, and the directions of the two are close. When the wake approaches the guide vane, the VW formed is larger than the V of the non-wake, and the inflow angle φW is smaller. A larger inflow angle θW is formed at the inlet of the guide vane, which is more likely to cause stall. In Figure 13b, the 9 red circles on the φ-t curve mark the moments when the wakes of each runner blade sweep across the monitoring point. At these moments, a higher flow velocity (about 5 m/s) and a smaller inflow angle (about 8°) are formed at the inlet of the guide vane No. 7, and stall is more likely to occur at these moments than at any other time.
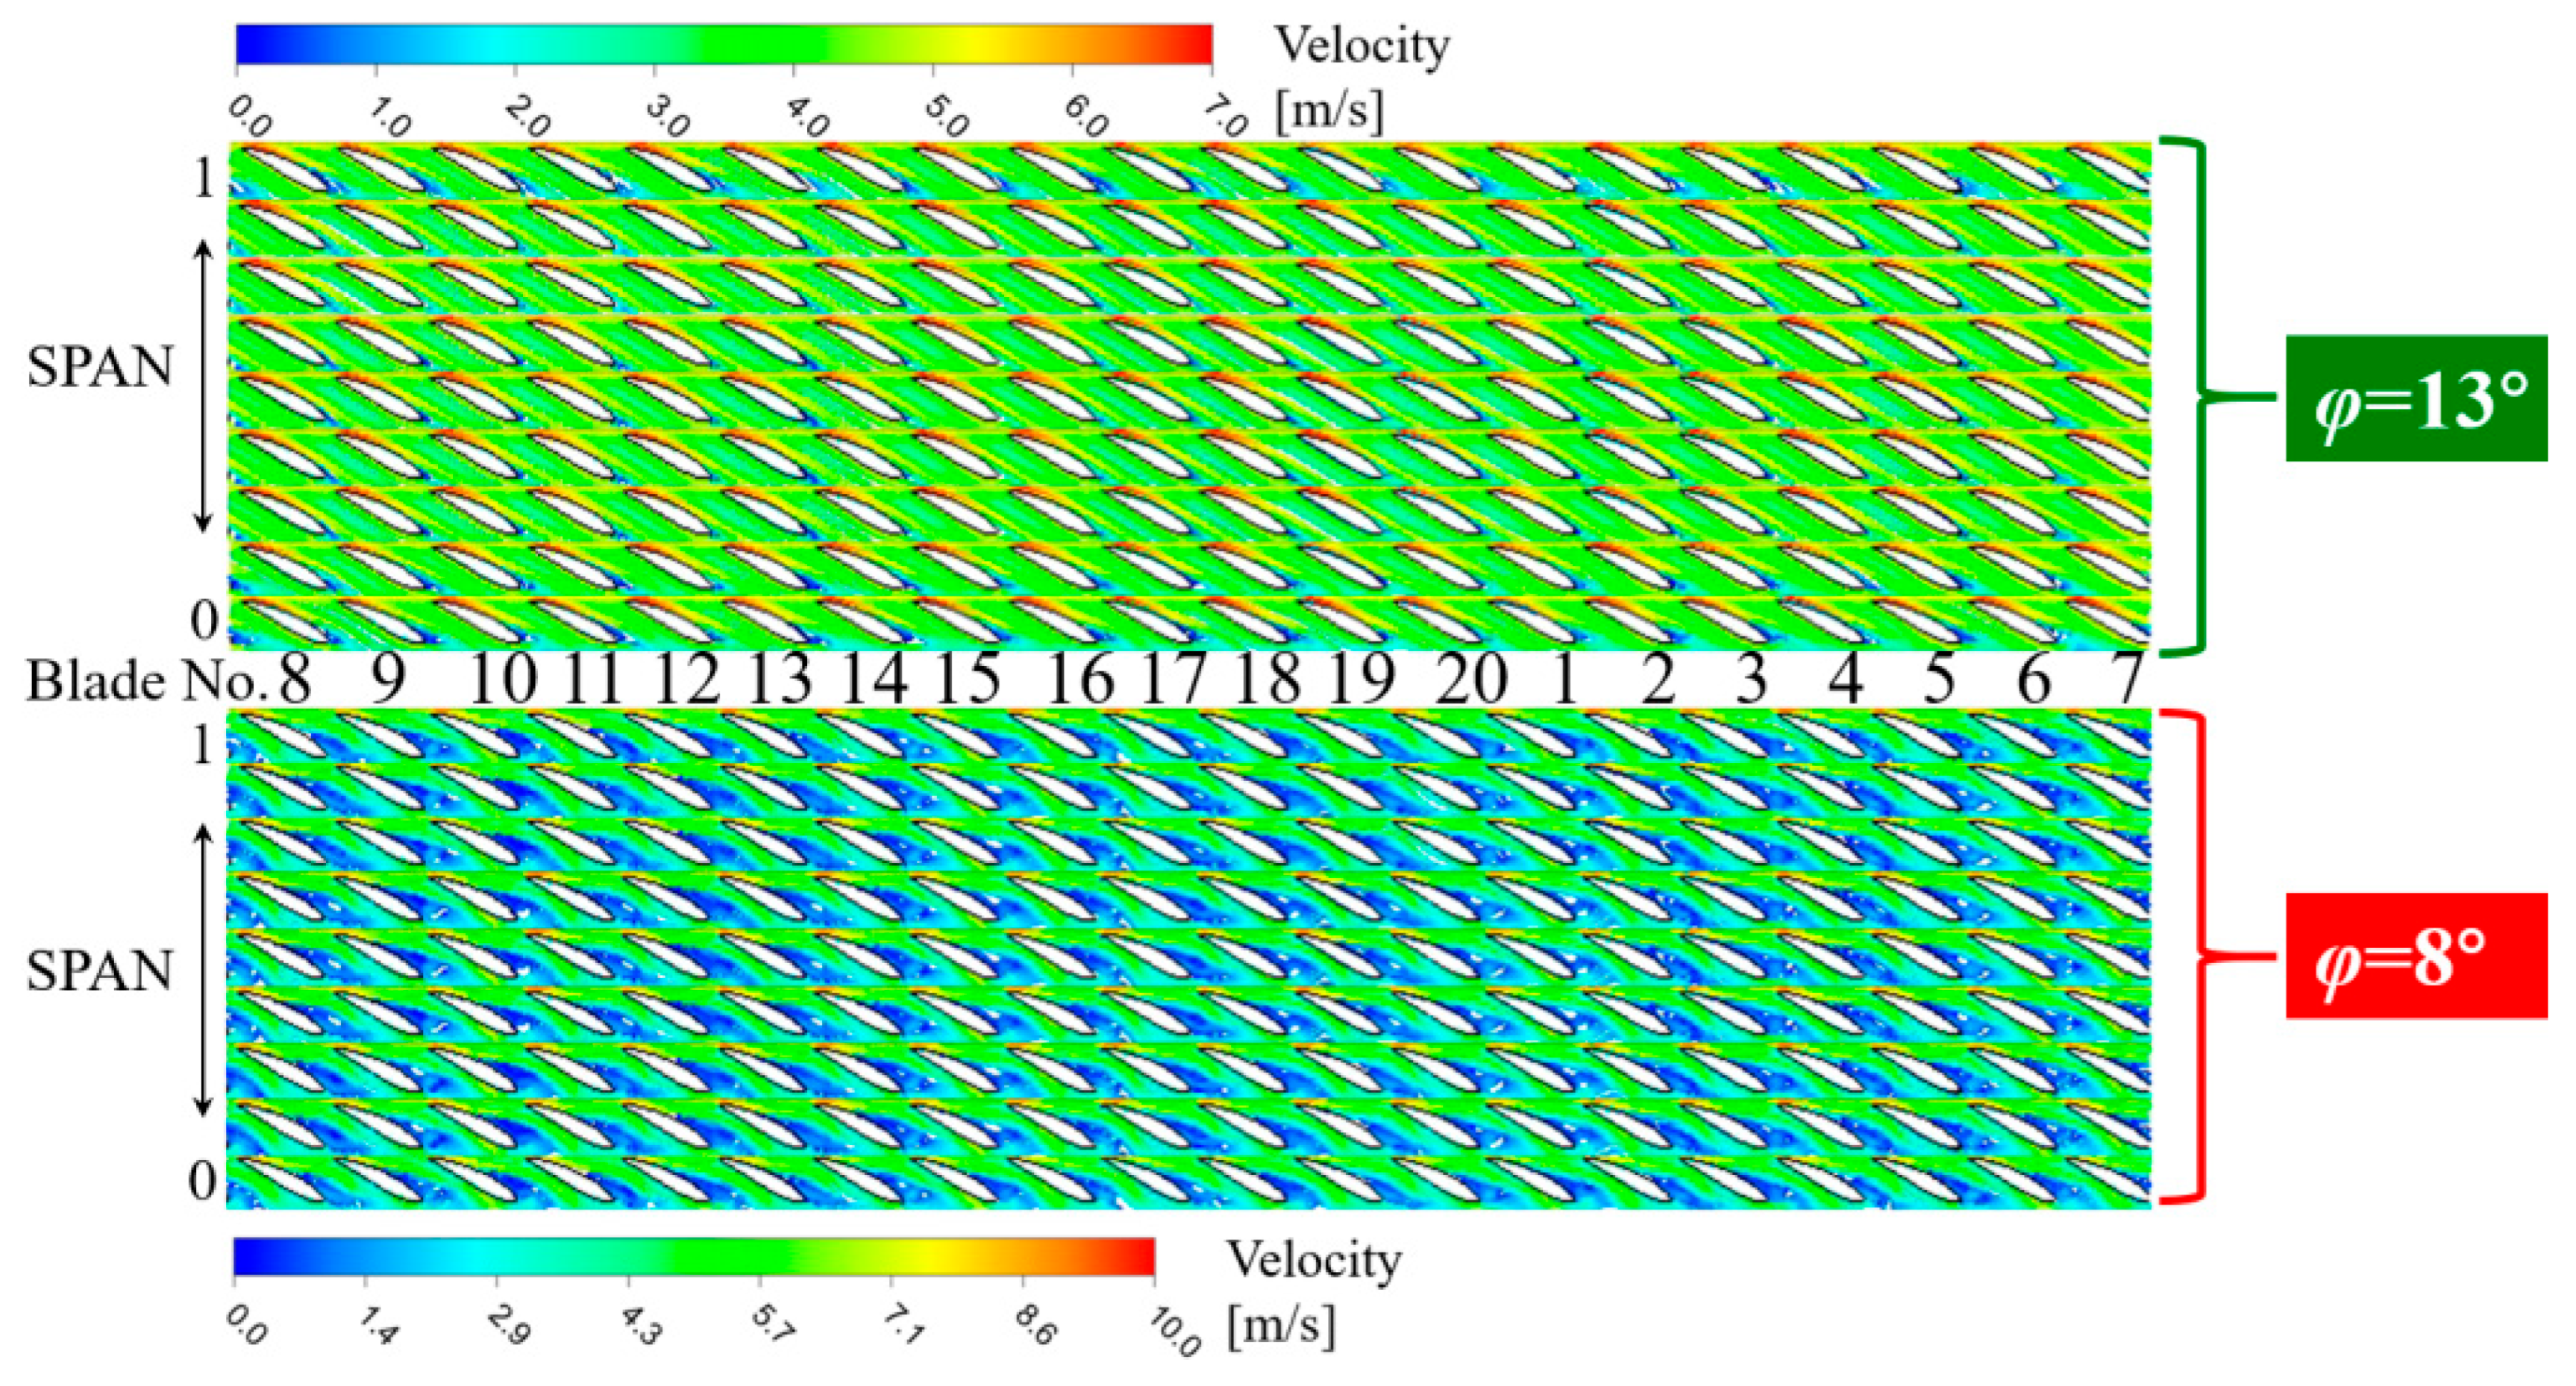
Figure 14 shows that the suction surface of the guide vane No. 7 has stalled. The dark blue vortex representing the stall is clearly visible. In order to analyze the role of RSI in the stall formation, steady flow simulation analysis of the guide vane is performed separately. Under the flow rate of 5 m/s, the flow pattern in the guide vane is calculated using the inflow angles of φ = 13° and φ = 8°, respectively, and the results are shown in Figure 15. When the inflow angle φ = 13°, there is almost no stall inside the annular grid. When the inflow angle φ = 8°, a serious stall occurs inside the annular grid.
It can be seen that RSI is an important cause of stall. When the runner wake passes the inlet of the guide vane, the inflow angle is the smallest and the inflow velocity is the largest, and stall is most likely to occur. The stall in the guide vane is formed, maintained and, enhanced under the action of RSI. At any time, each blade of the guide vane is always in different stages of RSI, namely under different inflow conditions. Therefore, the stall degree in each flow channel of the guide vane is always different at any time. RSI is one of the important reasons why the stall conditions of each flow channel of the guide vane are different.

3.2. Effect of the Jet and Wake on Stall Rotation

Stall inside the guide vane often rotates around the pump-turbine shaft. Specifically, the stall cell in one flow channel slowly moves to the adjacent flow channel, which is the phenomenon of rotating stall. Under low-flow conditions, the high-amplitude low-frequency pressure pulsation caused by rotating stall is the main pressure pulsation component in the pump-turbine. In severe cases, it will not only cause abnormal noise but may also couple with the natural frequency of the pump-turbine system to cause system resonance, threatening system safety.
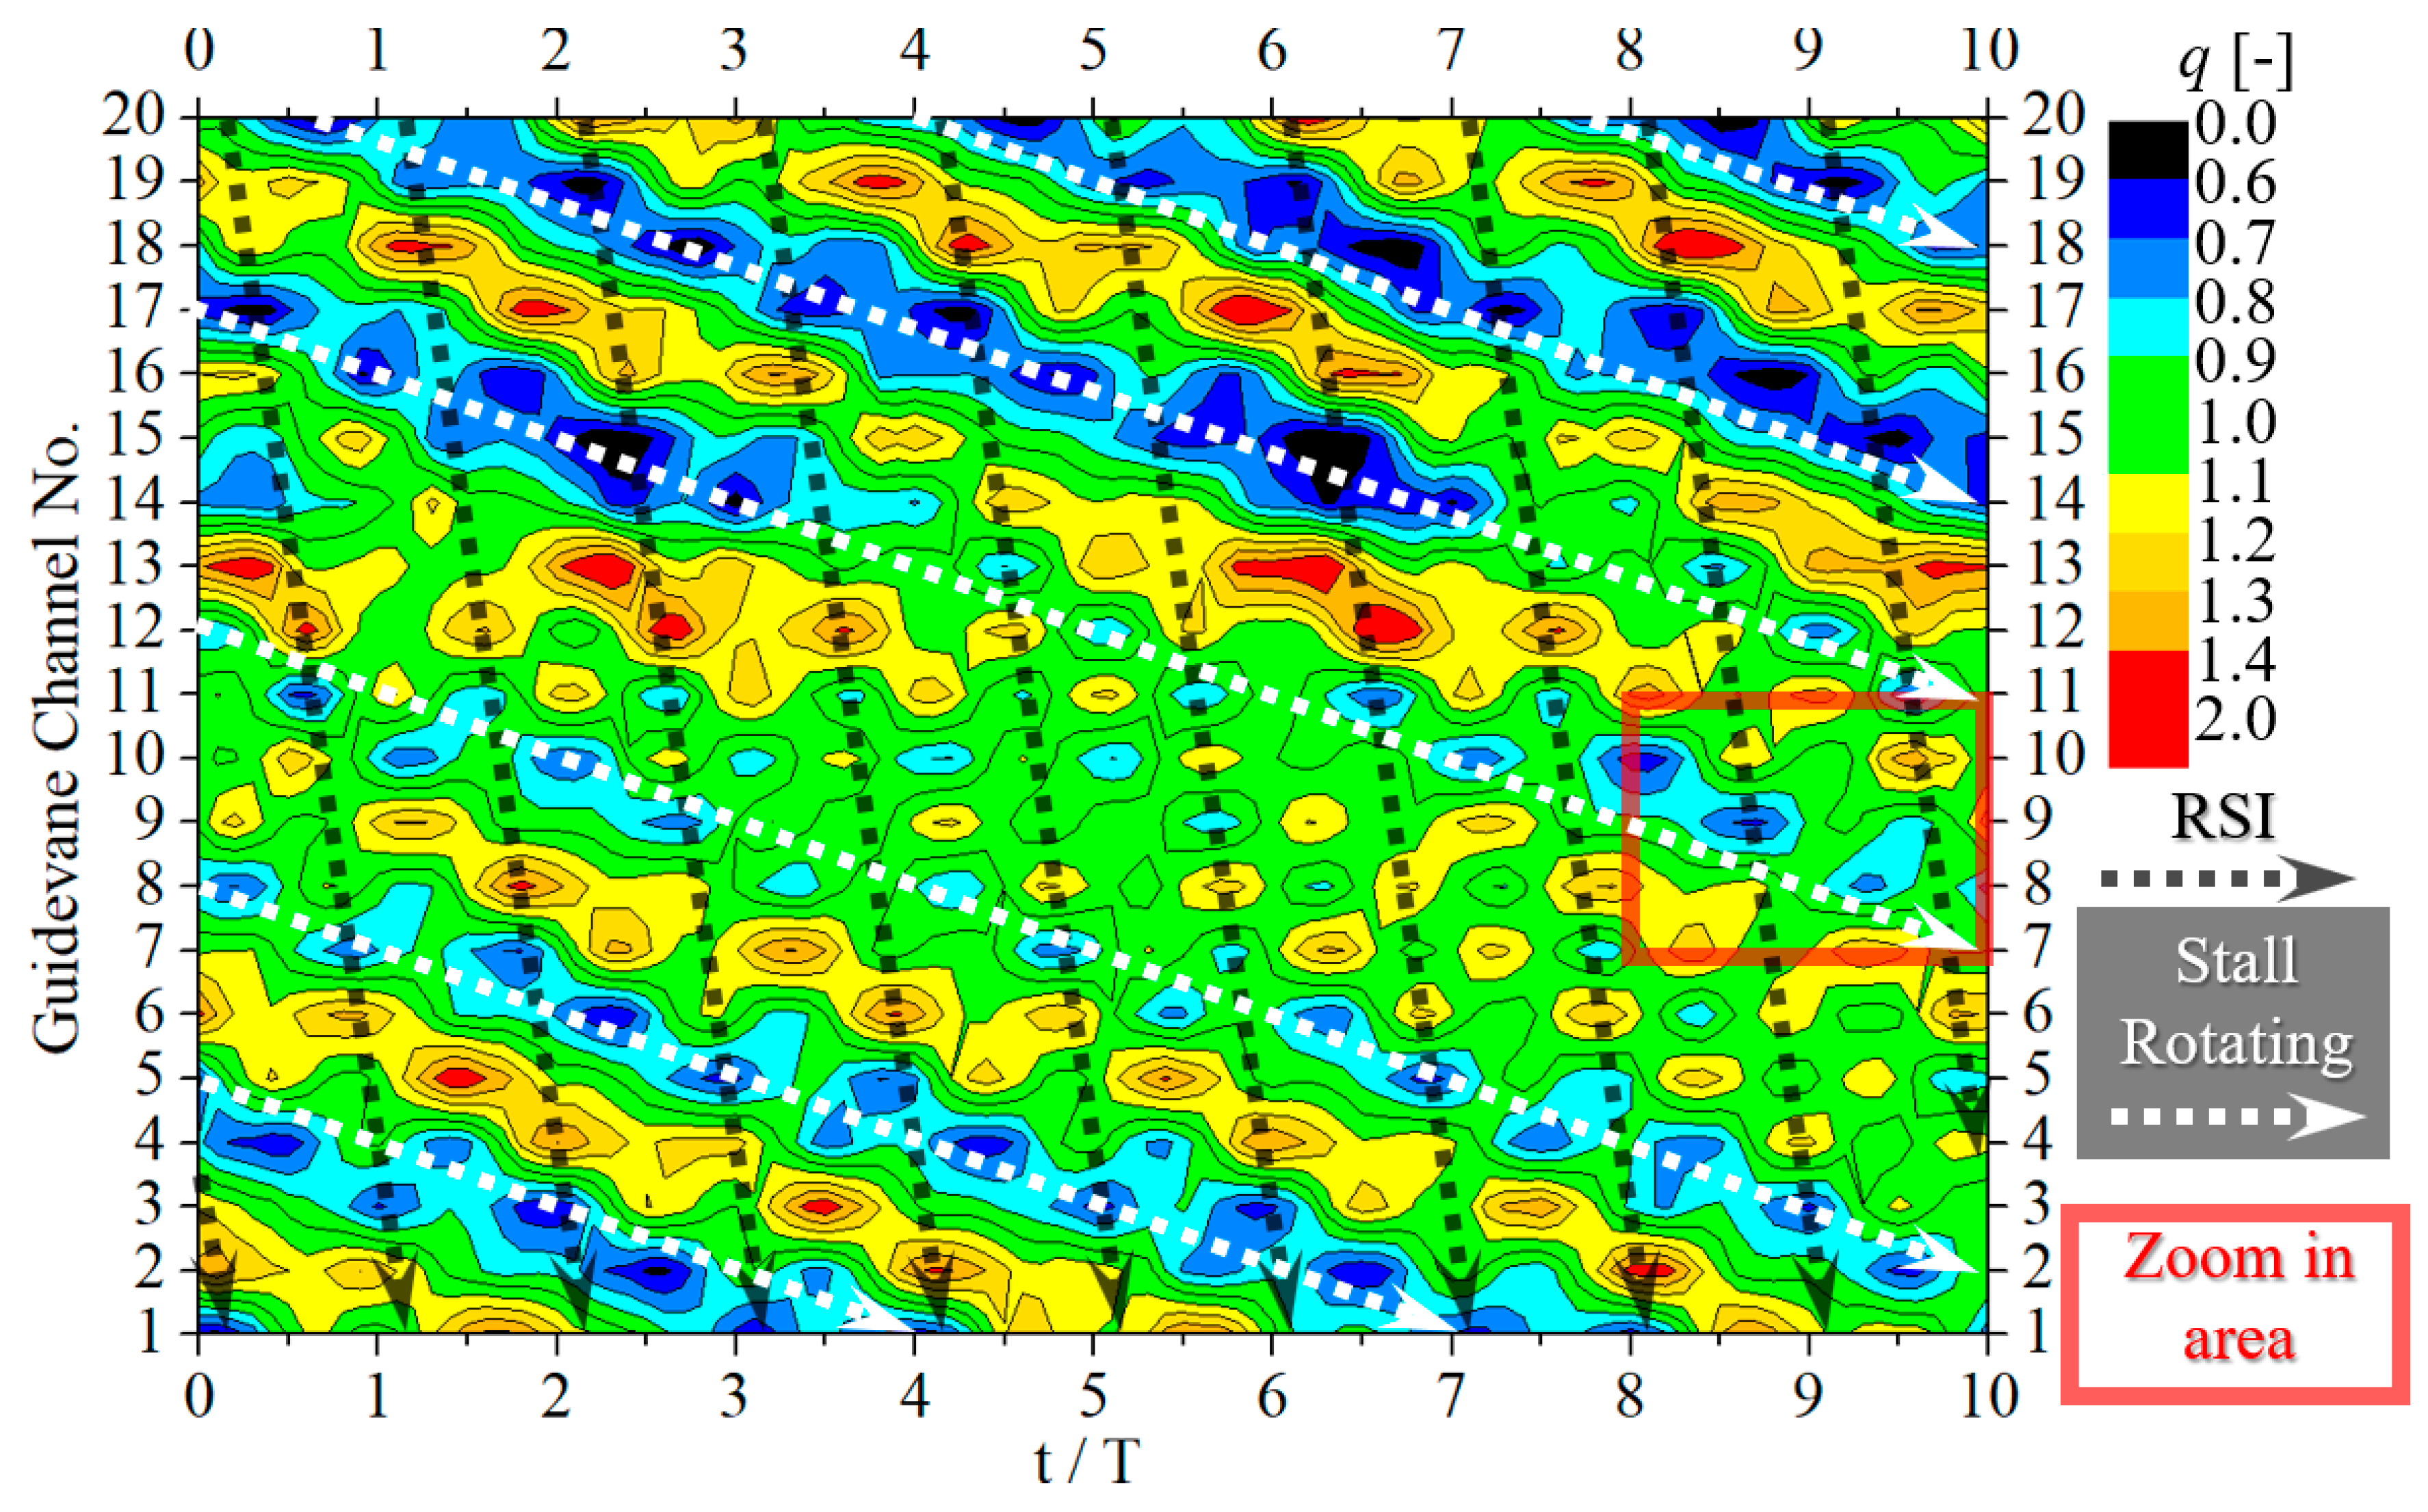
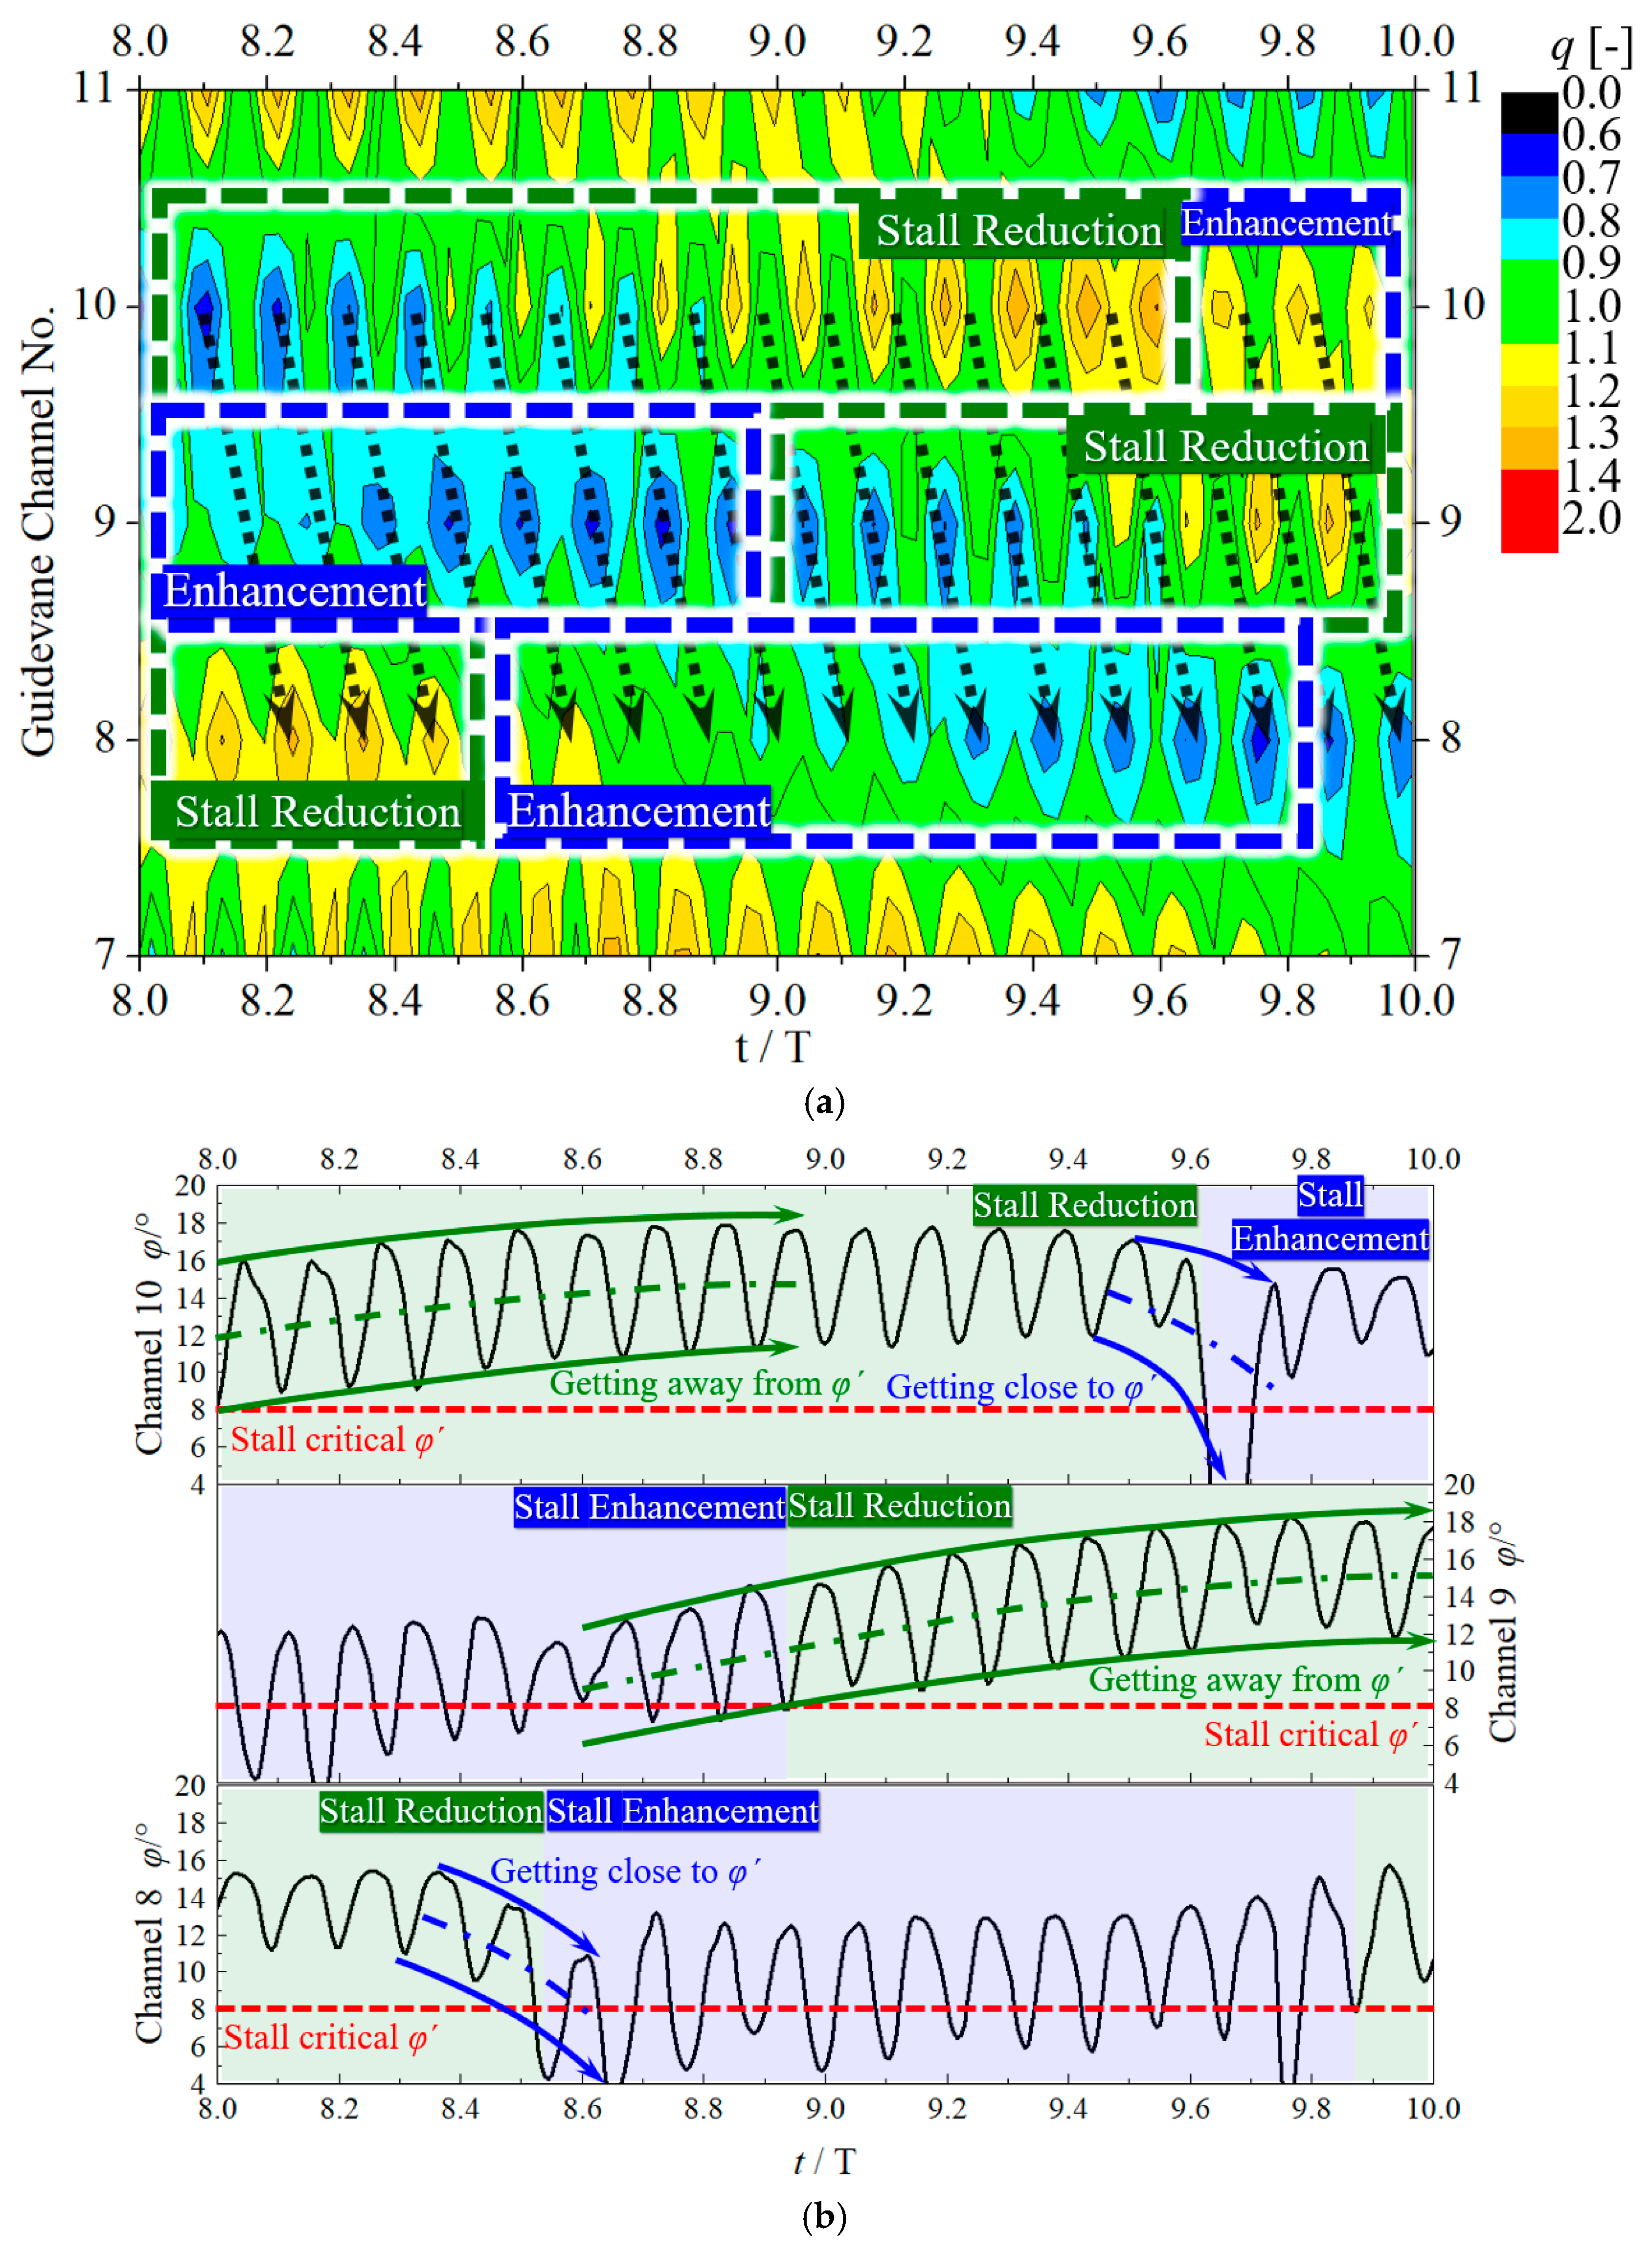
Under the 0.74 QBEP condition, the change in the inlet flow coefficient q of each flow channel in the guide vane is analyzed as shown in Figure 16 (the definition of the inlet position is shown in Figure 13a). The definition of q in Figure 13a is shown in the following formula:
q = Q i Q / Z g
where Qi represents the average flow rate in the i-th flow channel of the guide vane, Q represents the flow rate in the entire guide vane, and Zg represents the vane number of the guide vane. The horizontal axis in the figure is the time interval of 10 revolutions of the runner, and the vertical axis represents all 20 flow channels of the guide vane. Different colors represent the flow coefficient q of the flow channel at that moment, and the black dotted line marks the RSI trajectory of the 9 blades of the runner. As can be seen from Figure 13a, the degree of flow smoothness in each flow channel at any time is different. If the dimensionless parameter q is less than 1, it means that the flow velocity here is lower than the average flow velocity; otherwise it is higher than the average flow velocity. The smaller q is, the more unsmooth the flow is. There is a serious stall in the low-q region from light blue to black, and the flow in the high-q region of yellow and red is relatively smooth. The stalled flow channel and the non-stalled flow channel are distributed alternately, and the stalled flow channel keeps moving over time. The white dotted lines in the figure mark the movement of the five larger stall cells. The white dotted line in the lower left corner shows that during the 4-cycle rotation of the runner, the corresponding stall cell moves from flow channel 5 to flow channel 1. It can be estimated that the moving speed of the stall cell is (5 − 1)/20/4 = 0.05; that is, the rotation frequency of the stall cell is 0.05 times the shaft frequency, and the rotation direction is the same as the runner direction (the runner blades also rotate from blade No. 20 to blade No. 1).
The area in the red box in Figure 16 is enlarged as shown in Figure 17a. The blue dashed box in the figure indicates the area where the stall degree increases, and the green dashed box indicates the area where the stall degree decreases. Figure 17b shows the time variation in the average inflow angle φ at the inlet of the guide vanes No. 8, 9, and 10 flow channels in the corresponding period of Figure 17a. At the initial time of 8.0 T, according to q, it can be seen that there is a serious stall in the No. 10 and No. 9 flow channels, and the flow in the No. 8 flow channel is normal. During the period of 8.0–8.53 T, the inflow angle φ of the No. 9 flow channel is lower than the critical inflow angle φ′ of the stall. According to q, the stall degree in the flow channel is increasing. Affected by the stall of flow channel No. 9, φ of flow channel No. 10 continues to increase and move away from φ′, and the degree of stall inside the flow channel continues to weaken. At the same time, the φ of the No. 8 flow channel continues to decrease and approaches φ′, and q shows a decreasing trend during the period, indicating that stall initiation occurred. During the period of 8.53–9.0 T, affected by the severe stall of the No. 9 flow channel, the φ of the No. 8 flow channel continues to drop below φ′, the internal stall degree increases rapidly and begins to react on the No. 9 flow channel. During this period, φ of flow channel No. 9 begins to rise but is still slightly lower than φ′, and the internal stall degree increases at a slower rate than in the previous period. Affected by the stall of flow channel No. 9, the φ of flow channel No. 10 continues to increase and is farther and farther away from φ′, and the degree of internal stall continues to weaken. During the period of 9.0–9.8 T, the φ of flow channel 8 remains lower than φ′ and slowly increases, and the internal stall degree continues to increase. As a result, the φ of flow channel No. 9 is greater than φ′ and continues to increase, the internal stall enters a continuous weakening stage, and the impact on channel No. 10 is becoming weaker and weaker. At 9.6 T, the No. 10 flow channel began to show a phenomenon of φ lower than φ′ due to the stall of the upstream No. 11 flow channel, and the internal stall increased. The φ′ value is obtained by performing a uniform flow calculation on the guide vane alone.
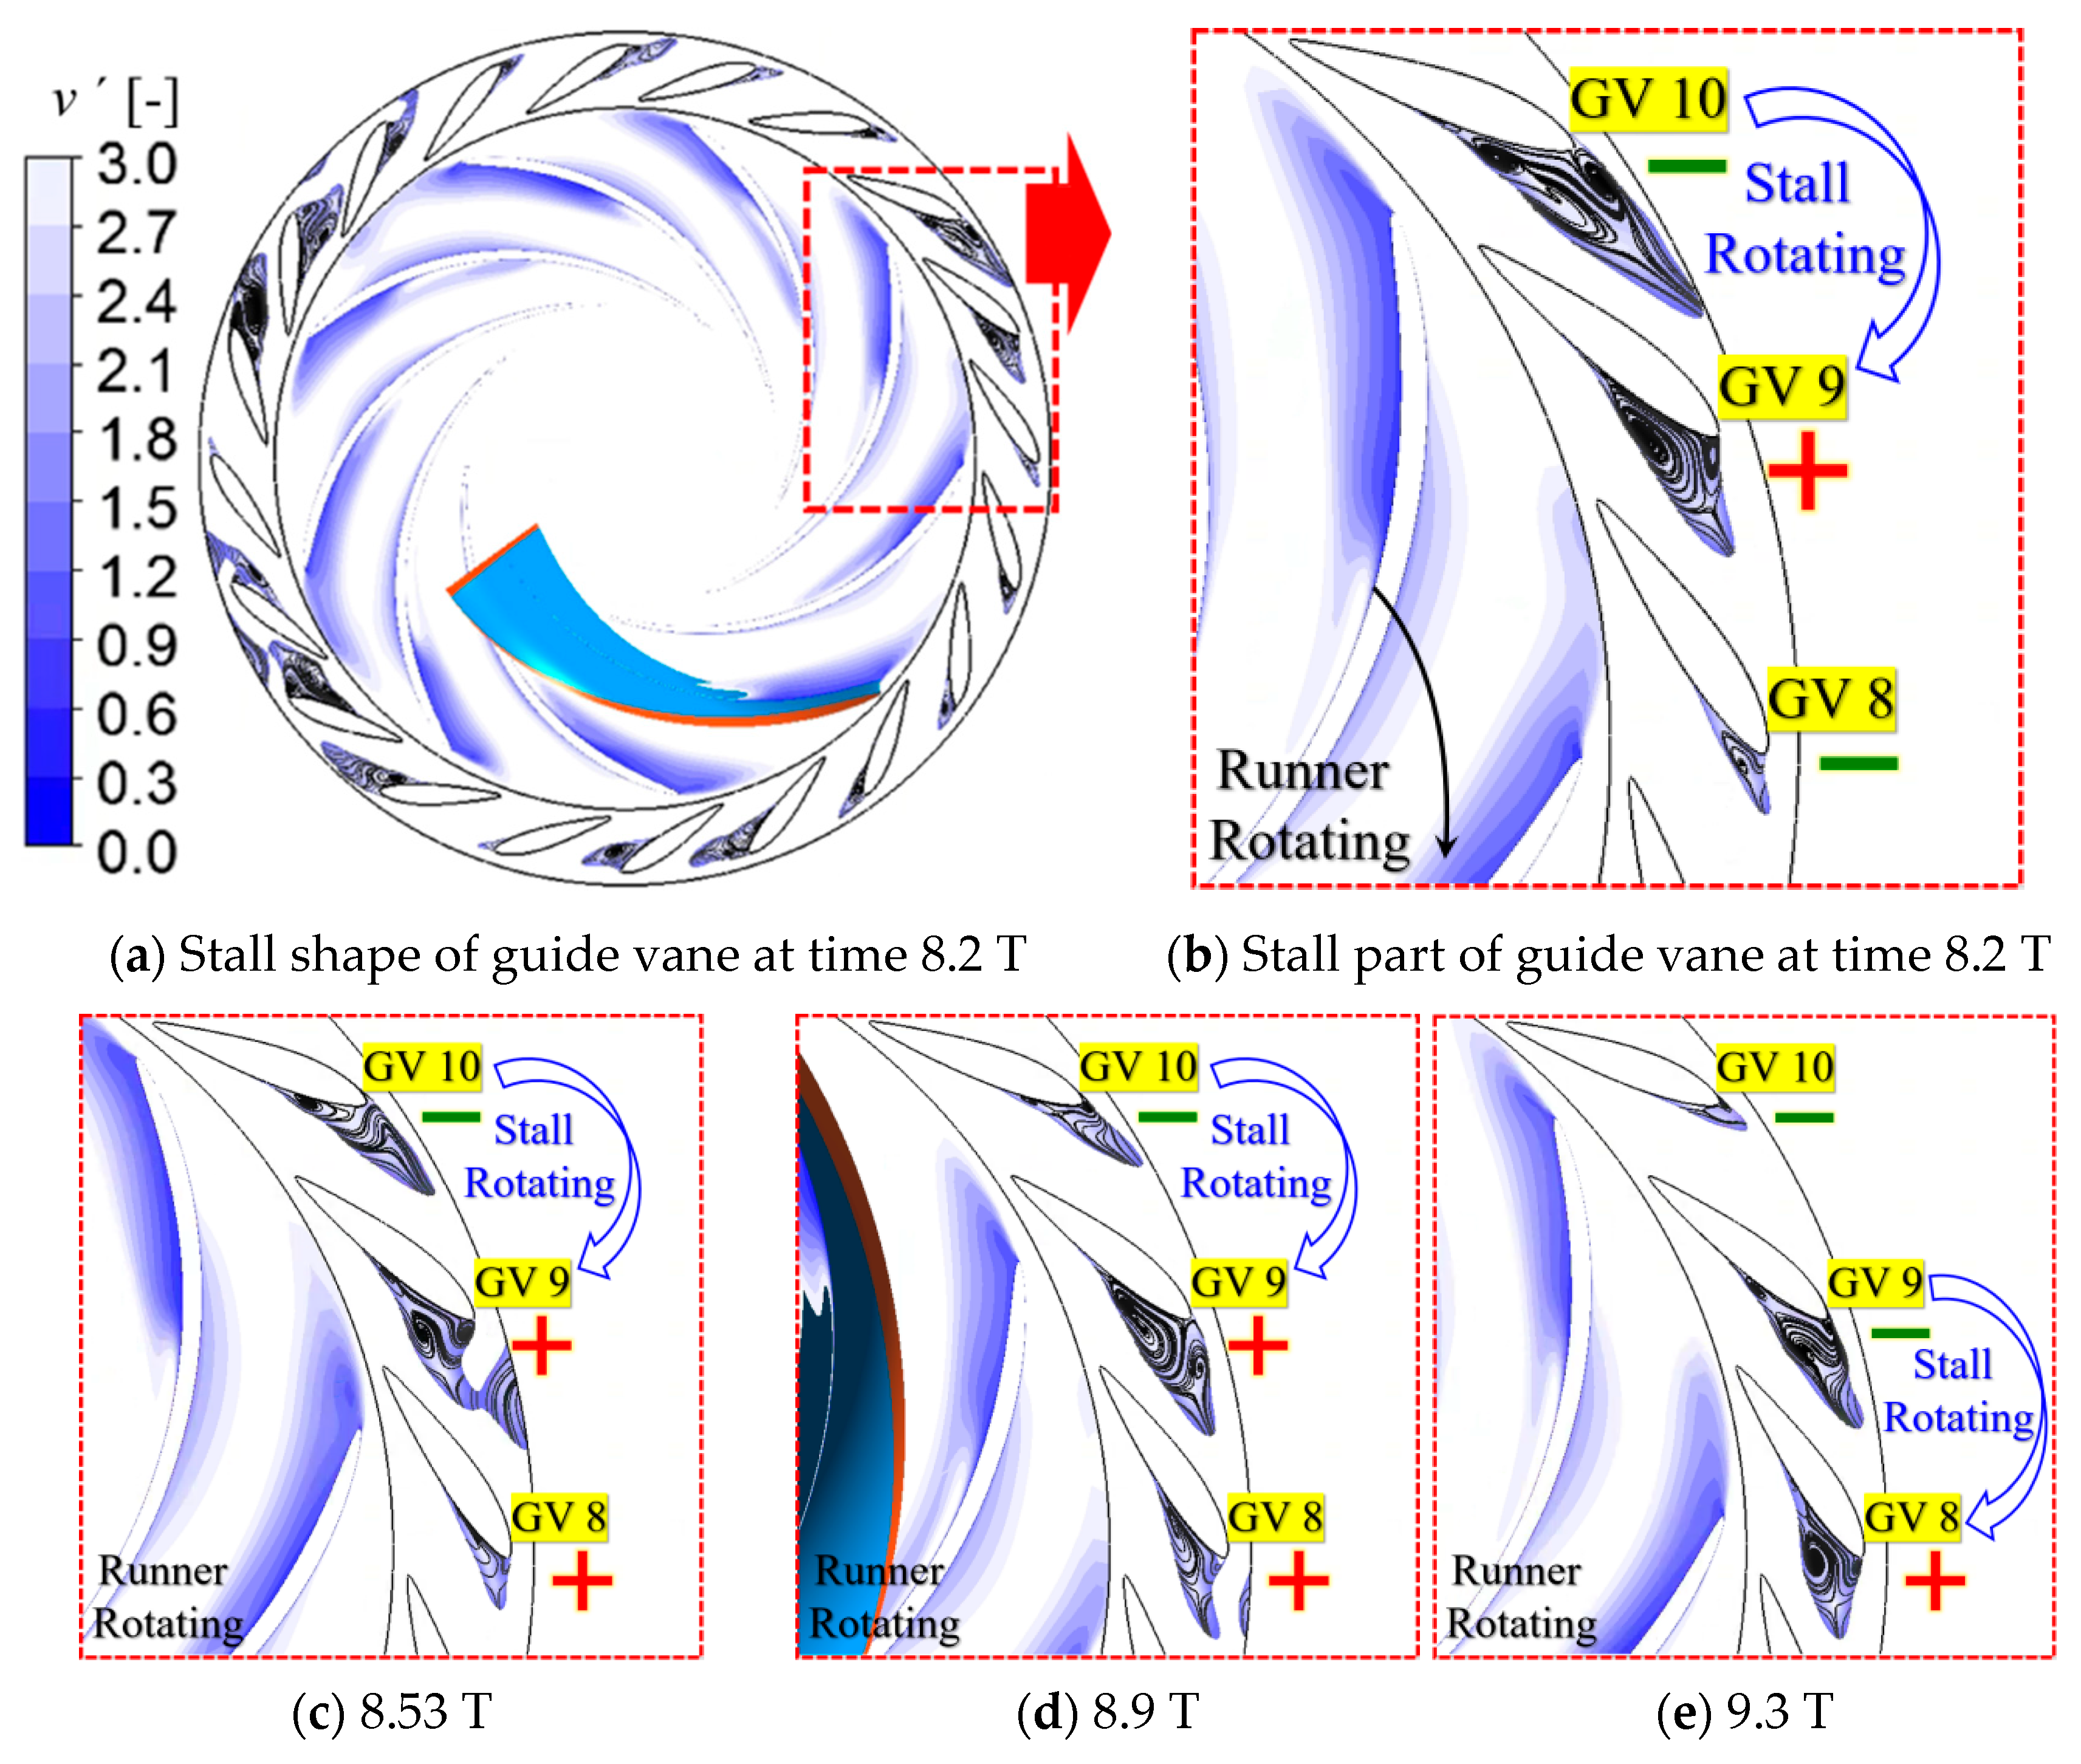
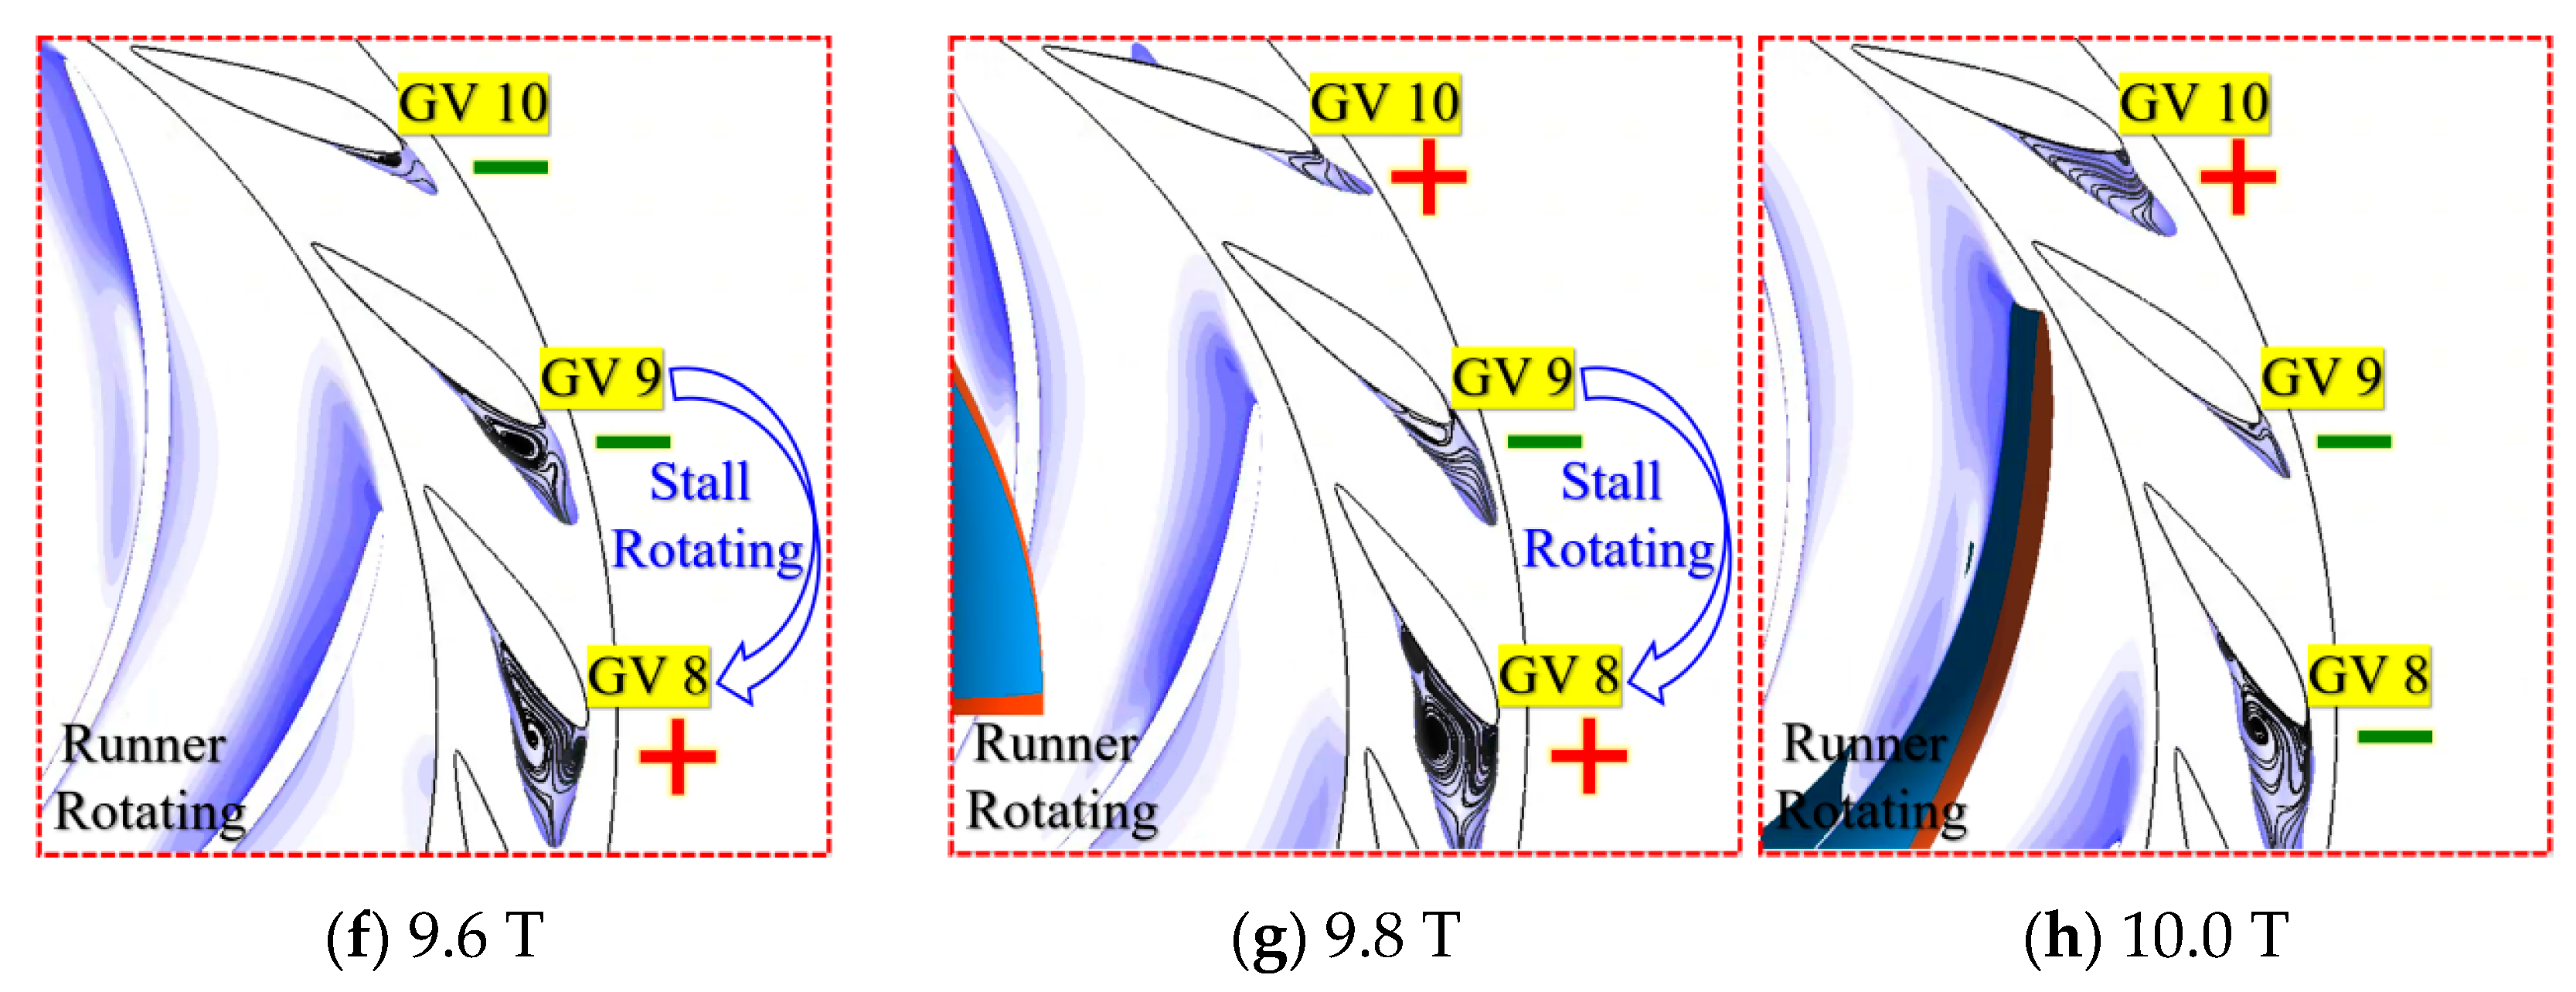
It can be seen that in the period of 8.0–10.0 T, the stall cell in the guide vane weakened in the No. 10 flow channel and strengthened in the No. 9 flow channel to complete the first rotation. After that, the flow weakens in the No. 9 flow channel and strengthens in the No. 8 flow channel, completing the second rotation. Each stall rotation starts with the stall of the downstream flow channel due to the increase in the stall in the upstream flow channel and ends with the stall of the upstream flow channel being weakened and disappearing due to the continuous increase in the stall in the downstream flow channel. Figure 18 describes the specific flow field performance of the two stall rotations of the guide vane No. 8–10 flow channels during this period. In the 8.0–9.0 T period, the 8.2 T, 8.53 T, and 8.9 T moments shown in Figure 18a–d are selected for display. It can be clearly seen that the stall of channel No. 10 rapidly weakens until it disappears, the stall of channel No. 9 continues to increase, and the stall cell completes the first rotation from channel No. 10 to No. 9. Selecting the moments of 9.3 T, 9.6 T, 9.8 T, and 10.0 T shown in Figure 18e–h for display, it can be seen that the changing process of the stall in channel No. 9 gradually weakens and the stall in channel No. 8 gradually strengthens. During this period, the stall cell moves from channel 9 to channel 8 to complete the second rotation.
In the above stall rotation process, RSI plays an important role. Figure 17b shows that under the influence of RSI, the φ of any channel of the guide vane always fluctuates. The previous analysis shows that the φ value is the smallest when the runner wake passes by, and the φ value is the largest when the jet passes by. The complete process of the φ value going through “trough-peak-trough” can be called a fluctuation cycle. It can be seen from the figure that the peak-to-peak value of the φ value in the fluctuation cycle is about 8°, accounting for 50–100% of the average value of the fluctuation cycle. By analyzing the change law of the φ value during the process of flow passage stall enhancement and weakening, it is found that when the minimum φ value formed when the runner wake passes through the guide vane channel entrance is lower than φ′, stall can be induced in the flow passage, and the more this minimum φ value is lower than φ′, the more serious the stall enhancement caused. When the minimum value of φ formed by the runner wake passing over the entrance of the guide vane channel is higher than φ′, the stall in the channel begins to weaken.
As shown in Figure 17b, the stall in the upstream flow channel does not cause the φ value of the downstream adjacent flow channel to be lower than φ′ throughout the entire fluctuation cycle. However, as long as the minimum φ value caused by wake is lower than φ′, the stall can be induced in the downstream flow channel, and it can be continuously strengthened, and finally the stall rotation can be completed. RSI will cause φ to fall periodically, making it easier to complete the stall rotation. When there is no RSI, if the stall in one flow channel is not severe enough, the inflow angle φ of the adjacent flow channel cannot be reduced to below φ′, and the stall will have difficulty completing the rotation. RSI can be considered as an important thrust for stall rotation. It greatly reduces the difficulty of a stall in one flow channel causing a stall in an adjacent flow channel, making it easier to rotate the stall.
4. Conclusions

This article analyzes the formation mechanism of stall formation and stall rotation and reveals the important role of RSI in stall formation and stall rotation:
(1) The runner outlet flow field is composed of alternately distributed jets and wakes, which leads to RSI between the runner and the guide vane. Under the design conditions, the wake is concentrated on one side of the runner cover, and the RSI level is low. As the flow rate decreases, the wake continues to extend to the other side of the runner cover, and the RSI level continues to increase.
(2) RSI is an important reason for the stall formation in the guide vane. The stall in the guide vane is often caused, maintained, and intensified when the runner wake passes by. Since the guide vanes are always in different RSI stages at any time, namely, under different inflow conditions, the stall condition of each guide vane channels is different at any time.
(3) RSI is an important thrust for stall rotation in the guide vane. When a channel of the guide vane stalls, the effect of the stall cell on the inflow angle of its downstream channel is limited and is often insufficient to cause the downstream channel to stall. However, since RSI can further reduce the inflow angle of the downstream channel by a large margin and make it lower than the stall critical inflow angle, the downstream flow passage will stall, and the stall rotation can be completed.
(4) Rotating stall can be limited by various methods of reducing RSI. However, minimizing the impact on the unit’s hydraulic performance and reducing the severity of stall at low flow rates during RSI adjustment is challenging and a topic worthy of further study.

Author Contributions

Original draft, Y.L. (Yong Liu); Analysis, J.Y. and M.F.; Figures and Tables, X.L.; Review, Y.W.; Software, Y.L. (Yonggang Lu) All authors have read and agreed to the published version of the manuscript.

Funding

This work was supported by the National Natural Science Foundation of China (51406170) (51576125).

Data Availability Statement

The data that support the findings of this study are available from the corresponding author upon reasonable request.

Conflicts of Interest

The authors declare no conflicts of interest.

Abbreviations

The following abbreviations are used in this manuscript:
RSIrotor–stator interaction
SBLOCAsmall breach loss of coolant
LDVlaser Doppler velocimeter

References

  1. Zeng, Y.; Qian, Z.; Ye, W.; Geng, C.; Luo, X. Research on pressure pulsation characteristics of a pump-turbine in pump mode with rotating stall: Focus on the broadband frequency. Phys. Fluids 2024, 36, 047135. [Google Scholar] [CrossRef]
  2. Qin, Y.; Li, D.; Wang, H.; Liu, Z.; Wei, X.; Wang, X. Mechanism of runner high-pressure side on stall characteristics at typical unsteady operating points in both modes of a pump turbine. Phys. Fluids 2023, 35, 074102. [Google Scholar] [CrossRef]
  3. Wang, C.; Liu, Z.; Guo, L.; Yang, Y.; Kong, Y.; Li, Z. Comparative studies on the propagation of rotating stall in a liquefied natural gas cryogenic submerged pump-turbine in both pump and turbine mode. Phys. Fluids 2023, 35, 055132. [Google Scholar] [CrossRef]
  4. Tao, R.; Xiao, R.; Liu, W. Investigations of the unstable QH hump characteristic of a nuclear main pump. Proc. Inst. Mech. Eng. Part A J. Power Energy 2018, 232, 856–869. [Google Scholar] [CrossRef]
  5. Yu, J. Reactor Thermal Hydraulics; Tsinghua University Press: Beijing, China, 2011. [Google Scholar]
  6. Emmons, H.W. Compressor surge and stall propagation. Trans. ASME 1955, 77, 455–467. [Google Scholar] [CrossRef]
  7. Byskov, R.K.; Jacobsen, C.B.; Pedersen, N. Flow in a centrifugal pump impeller at design and off-design conditions—Part II:Large eddy simulations. J. Fluids Eng. 2003, 125, 73–83. [Google Scholar] [CrossRef]
  8. Feng, J.; Yang, H.; Wang, C.; Zhu, G.; Lu, J.; Luo, X. Effect of inlet non-uniform flow on stall characteristics of centrifugal pumps. Chin. J. Hydrodyn. 2019, 34, 551–558. [Google Scholar]
  9. Sano, T.; Nakamura, Y.; Yoshida, Y.; Tsujimoto, Y. Alternate blade stall and rotating stall in a vaned diffuser. JSME Int. J. Ser. B Fluids Therm. Eng. 2002, 45, 810–819. [Google Scholar] [CrossRef]
  10. Zuo, Z.; Liu, S. Flow-Induced Instabilities in Pump-Turbines in China. Engineering 2017, 3, 504–511. [Google Scholar] [CrossRef]
  11. Hasemann, H.; Haupt, U.; Jin, D.; Seidel, U.; Chen, J.; Rautenberg, M. Rotating Stall Flow and Dangerous Blade Excitation of Centrifugal Compressor Impeller: Part 2—Case Study of Blade Failure. In Proceedings of the ASME 1991 International Gas Turbine and Aeroengine Congress and Exposition, Orlando, FL, USA, 3–6 June 1991; Volume 78989, p. V001T01A045. [Google Scholar]
  12. Lu, Y. Rotational stall and surge phenomena and separation vortex flow in fans and blade machines. Integr. Intell. Energy 1992, 20–44. [Google Scholar]
  13. Zhang, Z. Rotating stall mechanism and stability control in the pump flows. In IOP Conference Series: Earth and Environmental Science; IOP Publishing: Bristol, UK, 2010; Volume 12, p. 012010. [Google Scholar]
  14. Lennemann, E.; Howard, J.H.G. Unsteady Flow Phenomena in Rotating Centrifugal Impeller Passages. J. Eng. Power. 1970, 92, 65–71. [Google Scholar] [CrossRef]
  15. Krause, N.; Pap, E.; The´venin, D. Influence of the blade geometry on flow instabilities in a radial pump elucidated by time-resolved particle-image velocimetry. In Proceedings of the ASME Turbo Expo 2007: Power for Land, Sea, and Air, Montreal, QC, Canada, 14–17 May 2007; Volume 47950, pp. 1659–1668. [Google Scholar]
  16. Lu, G. Investigations on the Influence of the Flow Separation in Guide Vane Channels on the Positive Slope on the Pump Performance Curve in a Pump-Turbine. Ph.D. Thesis, Tsinghua University, Beijing, China, 2018. [Google Scholar]
  17. Miyabe, M.; Maeda, H.; Umeki, I.; Jittani, Y. Unstable head-flow characteristic generation mechanism of a low specific speed mixed flow pump. J. Therm. Sci. 2006, 15, 115–120. [Google Scholar] [CrossRef]
  18. Berten, S.; Dupont, P.; Fabre, L.; Kayal, M.; Avellan, F.; Farhat, M. Experimental investigation of flow instabilities and rotating stall in a high-energy centrifugal pump stage. In Proceedings of the ASME 2009 Fluids Engineering Division Summer Meeting, Vail, Colorado, USA, 2–6 August 2009; Volume 43727, pp. 505–513. [Google Scholar]
  19. Ye, C.; An, D.; Huang, W.; Heng, Y.; Zheng, Y. Investigation on stall characteristics of centrifugal pump with guide vanes. Water 2023, 15, 21. [Google Scholar] [CrossRef]
  20. Takao, S.; Konno, S.; Ejiri, S.; Miyabe, M. Suppression of diffuser rotating stall in a centrifugal pump by use of slit vane. In Proceedings of the Fluids Engineering Division Summer Meeting, Online, 10–12 August 2021; Volume 85291, p. V002T03A007. [Google Scholar]
  21. Zhang, F.; Lowys, P.Y.; Houdeline, J.B.; Guo, X.D.; Hong, P.; Laurant, Y. Pump-turbine Rotor stator interaction Induced Vibration: Problem Resolution and Experience. In IOP Conference Series: Earth and Environmental Science; IOP Publishing: Bristol, UK, 2021; Volume 774, p. 012124. [Google Scholar]
  22. Li, W.; Ji, L.; Shi, W.; Yang, Y.; Awais, M.; Wang, Y.; Xu, X. Correlation research of rotor–stator interaction and shafting vibration in a mixed-flow pump. J. Low Freq. Noise Vib. Act. Control. 2020, 39, 72–83. [Google Scholar] [CrossRef]
  23. Guo, R.; Li, R.; Zhang, R.; Han, W. The Action Mechanism of Rotor–Stator Interaction on Hydraulic and Hydroacoustic Characteristics of a Jet Centrifugal Pump Impeller and Performance Improvement. Water 2020, 12, 465. [Google Scholar] [CrossRef]
  24. Lenarcic, M.; Gehrer, A. Study on S-shape instabilities and pressure pulsations in reversible pump-turbines: Conflictive mechanisms behind a varying rotor-stator distance and development of a new guide vane design for improving transient behavior during turbine start-up and in case of load-rejection. J. Phys. Conf. Ser. 2021, 1909, 012048. [Google Scholar]
  25. Li, D. Investigation on Flow Mechanism and Transient Characteristics in Hump Region of a Pump-Turbine. Ph.D. Thesis, Harbin Institute of Technology, Harbin, China, 2017. [Google Scholar]
Figure 1. Components of the tested model.
Water 17 02538 g001
Figure 2. The tested model.
Water 17 02538 g002
Figure 3. Test bench introduction.
Water 17 02538 g003
Figure 4. Test results of external characteristic.
Water 17 02538 g004
Figure 5. Meshing of fluid domain.
Water 17 02538 g005
Figure 6. Meshing information.
Water 17 02538 g006
Figure 7. Grid independence test.
Water 17 02538 g007
Figure 8. Comparison of external characteristics results from test and simulation.
Water 17 02538 g008
Figure 9. Velocity triangle analysis at the runner outlet and the guide vane inlet.
Water 17 02538 g009
Figure 10. Jet and Wake distribution at runner outlet under 0.74 QBEP condition.
Water 17 02538 g010
Figure 11. The wake distribution on the runner outlet cross-section.
Water 17 02538 g011
Figure 12. Wake distribution at the runner exit under different working conditions.
Water 17 02538 g012aWater 17 02538 g012b
Figure 13. The influence law of RSI on the guide vane inflow at 0.74 QBEP.
Water 17 02538 g013aWater 17 02538 g013b
Figure 14. The position relationship between the runner wake and the observation point at time t1-t7. (The star in the figure represents the location of the observation point.)
Water 17 02538 g014aWater 17 02538 g014b
Figure 15. Flow regime comparison between different flow angles with flowrate of 5 m/s.
Water 17 02538 g015
Figure 16. q variation law in the guide vane under 0.74 QBEP.
Water 17 02538 g016
Figure 17. q and φ variation law in the guide vane under 0.74 QBEP. (a) Variation in the flow coefficient q of each flow channel of the guide vane during the runner’s two rotations. (b) The variation in the flow angle φ at the inlet of the guide vane flow passage during the runner’s two rotations.
Water 17 02538 g017
Figure 18. The stall rotation process in the guide vane under 0.74 QBEP.
Water 17 02538 g018aWater 17 02538 g018b
Table 1. Geometric parameters of the tested model.
ParameterMarkValue
Runner blade numberZr9
Runner inlet diameterD179.48 mm
Runner outlet diameterD2119.77 mm
Number of guide/stay vanesZg/Zs20
Guide vane openingα26°
Distribution circle diameter of guide vanesD0134.28 mm
Stay vane openingαS17.18°
Specific speedns178
Table 2. Performance parameters of the tested model.
ParameterMarkValue
Rated speednr1300 rev/min
Rated flow rateQBEP25.32 m3/h
Rated headHBEP2.91 m
Disclaimer/Publisher’s Note: The statements, opinions and data contained in all publications are solely those of the individual author(s) and contributor(s) and not of MDPI and/or the editor(s). MDPI and/or the editor(s) disclaim responsibility for any injury to people or property resulting from any ideas, methods, instructions or products referred to in the content.