Article

Water Vulnerability in Dhaka, Narayanganj, and Gazipur Districts of Bangladesh: The Role of Textile Dye Production

by
Kamille Hüttel Rasmussen
1,*,
Martiwi Diah Setiawati
1 and
Kamol Gomes
2
1
Institute for the Advanced Study of Sustainability (UNU-IAS), United Nations University, 5 Chome-53-70 Jingumae, Shibuya, Tokyo 150-0001, Japan
2
Institute for Integrated Management and Material Fluxes and of Resources (UNU FLORES), United Nations University, 74 Ammonstrasse, 01067 Dresden, Germany
*
Author to whom correspondence should be addressed.
Water 2025, 17(16), 2475; https://doi.org/10.3390/w17162475
Submission received: 26 June 2025 / Revised: 3 August 2025 / Accepted: 15 August 2025 / Published: 20 August 2025

Abstract

Water and chemical use in textile dye production are exacerbating water pollution and extraction across Dhaka, Narayanganj, and Gazipur in Bangladesh, where these industries are concentrated. However, the ability to cope with water-related challenges is influenced by multiple factors. This study applies descriptive spatial analysis to map textile dye clusters, river pollution, and water insecurity. As vulnerability is multidimensional and fluctuates across subdistricts, this study develops a Water Vulnerability Index (WVI) consisting of 25 indicators across demographics, socioeconomics, gender, health, WASH, and climate dimensions. The index is based on Multidimensional Vulnerability Assessment (MDVA) and constructed through multicriteria analysis (MCA). The study highlights that the Shitalakhya, Turag-Tongi Khal, Buriganga, and Balu Rivers are highly polluted, with average biochemical oxygen demand (BOD), chemical oxygen demand (COD), and dissolved oxygen (DO) levels exceeding safe limits. Central Dhaka is identified as being extremely water insecure, characterized by significant inequalities in water insecurity across subdistricts. The WVI finds that Gazipur Sadar and Kaliakair subdistricts, housing several textile dye factories, face the highest water vulnerability of the 57 subdistricts. This study furthers the case that Dhaka, Narayanganj, and Gazipur host numerous textile hubs, confront serious water challenges, such as river pollution and water insecurity, and are marked by significant spatial disparities in vulnerability. By exploring anthropogenic pollution alongside multidimensional water vulnerability, this study can inform targeted policy responses, such as stricter regulatory limits, more frequent monitoring and enforcement, and tailored support in high-vulnerability areas.

1. Introduction

Water is one of the world’s most valuable resources. Access to clean and reliable drinking water is essential for economic activity, social equity, and environmental sustainability. Since ground and surface water are interconnected systems and form vital parts of the hydrological cycle, changes to these systems can have various impacts on society [1]. To understand how areas are affected by water-related challenges requires a multidimensional lens, as vulnerability is shaped by socioeconomic, demographic, health, gender, environmental, and climatic conditions [2]. Dhaka is home to a dense, growing, and rapidly urbanizing population, expanding and polluting water-intensive industries, and inadequate water infrastructure to support communities across subdistricts [3,4]. The degree of vulnerability and capacity to cope with increased water challenges depend on many factors, including health, gender, income, and education. Water vulnerability refers to how vulnerable communities, ecosystems, or regions are to water-related challenges and how well they can adapt [5]. As a result, water governance has become increasingly important to help improve communities’ ability to cope as clean water resources become scarcer and water insecurity grows more acute and widespread in many places.
One of the key drivers of water insecurity is chemical pollution from industries, as it poses a significant threat to water systems. In the past two decades, global chemical production almost doubled from 1.2 to 2.3 billion tons and is expected to triple by 2050 [6,7]. As a result, various synthetic chemicals are released into the environment without the scientific ability to effectively assess the volume and toxicity of chemicals that the Earth’s system can tolerate [6,8,9]. Textile dye production is an example of a rapidly growing industry that relies heavily on hazardous chemicals and clean water resources. This translates into high amounts of wastewater released into surrounding river systems, making it a prominent driver of water pollution and scarcity [4,10]. According to UNEP (2022), the textile industry is the second-largest consumer of water worldwide and is responsible for 20% of global wastewater pollution [11]. Many of the world’s textile dye factories are in Bangladesh, where the textile industry represents 89% of the country’s total exports [10,12,13]. These factories are primarily concentrated along the river systems of Dhaka, Narayanganj, and Gazipur Districts, located in the central part of Bangladesh, where between 500 and 700 factories release synthetic dyes and heavy metals, contributing to declining ecosystems, unsafe drinking water, and negative human health implications [4,14]. When chemicals from textile dye production are released into waterways, they contaminate freshwater resources that surrounding communities, in particular marginalized groups, depend on for domestic use [14,15]. Therefore, over-extraction and contamination of water resources in Dhaka have caused the water table to decline three meters per year, contributing to widespread water insecurity and pollution [16].
Several water-related vulnerability indices highlight where people are more exposed to water challenges, and their capacity to cope is limited. These include the WRI Aqueduct, which assesses global water risks based on water-related indicators, including flooding, droughts, and contamination [17]. The UNU-INWEH Global Water Security Index measures water security across 10 components: access, quality, health, governance, safety, and resource stability [5]. The Social Resource Water Stress/Scarcity Index (SWSI) adjusts water availability measurements by incorporating a society’s adaptive capacity, using the human development index to reflect true water stress levels [18]. Garouani et al. (2024) developed a Multidimensional Water Vulnerability Index based on 21 indicators spanning socio-demographic, infrastructure, resource, and environmental components [19]. In addition, the Water Poverty Index (WPI) combines physical water stress measures with socioeconomic factors and integrates five components: resources, access, capacity, use, and environment. This framework finds a strong relationship between water poverty and economic poverty, which has been applied to several contexts [20]. Jaren and Mondal (2021) applied the WPI to different livelihood groups in peri-urban Dhaka and found that economically inactive women are the most water-poor group [21]. Other Dhaka-based studies conducted a groundwater vulnerability assessment [22,23] and waterlogging hazards mapping [24]. In addition, some studies assessed socioeconomic and livelihood vulnerability [25], drought vulnerability zones [26], and drinking water vulnerability [27] in rural coastal areas of Bangladesh. The frameworks show that various factors shape water vulnerability. However, global frameworks primarily focus on national-level vulnerability and often overlook the impact of anthropogenic pollution, such as textile dye production. Dhaka-based studies are limited to a narrow range of water-related and vulnerability indicators. Therefore, multidimensional water vulnerability remains underexplored in this context, particularly in acknowledging how anthropogenic pollution degrades water resources.
To address this gap, the study uses Multidimensional Vulnerability Assessment (MDVA), as it offers a holistic approach to understanding water vulnerability [2]. Focusing on Dhaka, Narayanganj, and Gazipur Districts in Bangladesh, the aim is to describe water-related challenges and determine which subdistricts are most vulnerable. To achieve this objective, this study first maps the current state of water quality within five rivers running through Dhaka Division, namely, the Shitalakhya, Turag-Tongi Khal, Buriganga, Dhaleswari, and Balu. This involved using descriptive spatial analysis of river water quality data from 2023, published by the Bangladesh Department of the Environment (DoE) [28]. Second, this paper maps water insecurity across subdistricts in Bangladesh using the indicator “access to basic drinking water”, which stems from the INFORM Dataset 2022 [29]. Third, this paper develops a Water Vulnerability Index (WVI) based on 25 selected indicators from the INFORM Dataset [29]. The WVI includes six key dimensions of water vulnerability—demographics; socioeconomics; gender; health; water, sanitation, and hygiene (WASH); and climate—in which each has several underlying indicators. These dimensions are combined and assessed using multicriteria analysis (MCA) to analyze results. To contextualize water vulnerability, this study maps nine textile dye clusters for descriptive and visualization purposes. This spatial approach highlights areas of industrial concentration without aiming to establish statistical correlation.

2. Existing Literature

The impacts of textile dye production on local water resources and human health are widely explored within the natural sciences literature [30,31,32,33]. Several Bangladesh-based case studies have shown a clear link between textile dye production and the degradation of water resources and aquatic ecosystems [4,10,14,15,34,35,36]. Textile dye production relies on high amounts of synthetic chemicals, finishing salts, and clean water as resource inputs. According to Uddin et al. (2023), dye factories located within the four textile clusters of Savar, Tongi, Narayanganj, and Gazipur use, on average, 164 L of groundwater, 119 L of wastewater, and 449 g of chemicals for every 1 kg of textile [10].

2.1. Textile Dye Contamination of Dhaka’s Rivers

The water resources in Dhaka are heavily impacted by chemicals used in textile dye production, which contributes to widespread surface and groundwater pollution. These chemicals include heavy metals, synthetic dyes, and polyfluoroalkyl substances (PFASs) [33,37,38,39]. According to Islam et al. (2023), approximately 10,000 different synthetic dyes are commercially available; however, azo dyes make up around 50% of all dyes used globally, raising concerns due to their toxicity to human health and ecosystems [30]. Although the synthetic chemicals used in textiles are widely explored, they are less studied in Dhaka. The textile sector also uses PFASs to make water-repellent fabric [11], and these chemicals tend to accumulate in the environment and persist [8,40]. Only one study was found on PFAS concentration in the water and air around Dhaka’s textile factories [40], which showed elevated levels. In contrast, several Dhaka-based case studies focus on heavy metal concentrations, which are often applied in textile dye production to ensure color fastness. These studies illustrate how heavy metals are discharged into the environment from textile wastewater, among other industries, and create various problems for human health and aquatic ecosystems [4,14,15,34,35,36,41,42]. Hossen and Mostafa (2023) discovered that 83.3% of water bodies exceed the national government’s thresholds and found that heavy metal concentrations are highest in Dhaka, where 10 of 11 samples are unsafe for drinking [34]. These results are supported by M. Uddin et al. (2023), who show that Dhaka’s rivers are severely contaminated with heavy metals [36]. Uddin and Alam (2023) also demonstrate that heavy metal pollution in rivers around Dhaka, Narayanganj, and Gazipur is extensive due to untreated textile wastewater [35]. These studies acknowledge other pollution sources of heavy metals, including shipbreaking, pharmaceuticals, and agricultural runoff. However, the textile production industry is the largest in Bangladesh and is identified as a significant source of water pollution in the central region [10,32,33,35,43,44,45]. Taken together, the dyes, PFASs, and heavy metals show very low biodegradability, impacting vital ecosystems and the health, socioeconomic outcomes, and well-being of the surrounding society [35]. While the literature on water pollution in Dhaka focuses on heavy metals, the concentration of synthetic dyes, including PFASs and azo dyes, in the waterways remains underexplored. This is supported by Uddin and Jeong (2021), who state that other pollutants in water have been largely overlooked in Bangladesh [4].
Although the concentration of synthetic dyes in water sources is not widely explored within the context of Dhaka, the broader scientific literature states that the presence of textile dyes in rivers changes the pH, dissolved oxygen (DO), biochemical oxygen demand (BOD), chemical oxygen demand (COD), and total dissolved solids (TDSs) [30,31,32,33]. Textile dye effluent interferes with river light penetration, leading to lower DO and higher BOD and COD levels in water bodies. These changes impair photosynthetic activities and, over time, lead to declining fish stocks, carrying both environmental and social impacts [30,31,32,33]. As a result, some studies measure these indicators to understand river water quality and evaluate the impacts of textile dye effluent on aquatic ecosystems. Shamsuzzaman et al. (2021) measure BOD, COD, and DO levels in wastewater from five denim factories in Dhaka and find that only 20% achieve acceptable DO levels [44]. Whitehead et al. (2019) highlight that the Turag-Tongi-Balu River system in central Dhaka is one of the most polluted in the world, finding very high COD and BOD levels and very low DO levels, indicating substantial industrial discharge [3]. Rashid et al. (2024) find elevated COD values in the Turag River across observation sites, revealing that the pollution is beyond the safe limits in terms of the chemicals in the water [46]. Yin et al. (2021) highlight that DO and BOD levels in all four Dhaka rivers consistently exceeded environmental standards from 2011 to 2018 due to industrial wastewater, particularly from textile dye [47]. As a result, BOD, COD, and DO indicators are commonly used to signal the presence and intensity of anthropogenic pollution in affected water bodies [47].

2.2. Impact on Broader Society

The overuse of clean water and the pollution of water resources have severe consequences for surrounding communities. The direct discharge of wastewater impacts the aquatic environment, particularly algae, fish, and humans [32,33,38,39]. Case studies highlight that Dhaka’s water does not meet basic requirements for domestic, drinking, fishing, and industrial uses [14,34,35,36,38]. According to Sharma et al. (2021), contaminated rivers may enter the food chain when polluted water is used for agricultural irrigation and when the fish are consumed [33]. Chakraborty et al. (2022) highlight that some knit-dye factories in Bangladesh have been forced to close due to a lack of available water [15]. This is supported by Lellis et al. (2019), who illustrate that water is an essential resource for development, and a healthy environment is necessary to sustain economic activity [42]. The Dhaka case studies did not assess fish stock depletion or investigate how textile pollution affects other sectors in Bangladesh, such as agriculture and fishing, which rely on well-functioning ecosystems.
Several reviews show that toxic chemicals in textile dyes have a significant impact on human health [32,38,45,48,49]. For instance, azo dyes cause various diseases in humans, animals, and plants. The azo dye Basic Red 9 is highly toxic and carcinogenic, causing skin irritation, cancer, and allergic reactions [38]. Heavy metals can also cause health problems, such as bone disorders, cancer, kidney failure, brain damage, memory problems, and abnormalities, among others [32]. Shittu et al. (2023) found that children are more sensitive to heavy metals, which can cause cognitive development disorders, lower IQ, and premature death [8]. Palacios-Mateo et al. (2021) discussed the health risks faced by textile workers and the surrounding community [49]. Water insecurity and pollution can drive internal displacement and increase informal settlements, which, in turn, heighten water vulnerability [13,50]. Children in informal settlements are also more likely to be working [51], depriving them of education, exposing them to hazardous conditions, and perpetuating poverty [52]. Child labor is common in slum settlements in Dhaka, which often lack proper sanitation and water sources [51,53]. Hoque et al. (2021) reveal that marginalized groups in Dhaka, particularly women and girls, rely on polluted water for everyday activity and are most exposed to pollution [14]. Housing conditions also indicate how vulnerable people are to water-related challenges. According to Chowdhury et al. (2022), slum-dwellers in Dhaka pay 7–14 times higher water fees than those in formal housing, which translates into around 12–15% of their monthly income [54]. Intersar and Parvez (2024) find that women living in slums in Dhaka are more vulnerable and are often employed in low-paid work, such as in the textile industry [55]. These women are often deprived of water, education, nutrition, and safe shelter [55], form most of the textile workforce [46], experience workplace violence [56], and internalize a greater burden of poverty, water, and food insecurity [57], as well as being responsible for water-related household chores, from collection to waste disposal [58]. Although less explored in the context of Dhaka, violence and water vulnerability are interconnected, as exposure to harm can heighten sensitivity to water-related challenges, while water insecurity can increase the risk of violence [59]. Women are also disproportionately affected by limited WASH services, due to increased needs during menstruation and reproduction [60]. As a result, poverty, housing, violence, and child labor are important when assessing water vulnerability. The broader literature shows that textile dye pollution can have health implications. However, there are limited Dhaka-specific studies that investigate how textile dye impacts the socioeconomic status, health, and well-being of workers, children, and women.

2.3. Research Relevance

Section 2.1 illustrates that previous studies were primarily situated within natural sciences and established a clear link between water pollution and dye factories in Dhaka. However, there is little mention of the surrounding communities, and the interrelationship between the social, economic, and environmental aspects of water vulnerability arising from textile dye pollution. In particular, the case studies state that textile dye factories impact water resources without including the extent to which these industries are contributing to water insecurity, where water insecurity is highest, and which groups in society are most at risk and vulnerable to its impacts [34,35,36,41]. In addition, the literature was primarily quantitative and scientific in nature, neglecting socioeconomic, demographic, climatic, and gender influences. Most literature analyzing the local impact of textile dyes is situated within the natural sciences, such as engineering and chemistry. This is reflected in the methodologies applied, concepts measured, and the relative lack of focus on socioeconomics, gender, and water vulnerability for the surrounding communities. To address some of the research gaps identified, this paper explores water vulnerability across Dhaka, Narayanganj, and Gazipur’s subdistricts by integrating demographic, socioeconomic, gender, health, WASH, and climatic factors, as well as describing water insecurity and river pollution. In addition, this paper links spatial patterns of textile dye activity to potential areas of heightened water vulnerability.

3. Data and Methods

This study uses descriptive spatial analysis and multicriteria analysis (MCA) to identify which subdistricts are most vulnerable to water-related challenges from textile dye. Descriptive spatial analysis is often applied in case studies to examine patterns and trends using various data sources without seeking to establish a causal relationship [61,62]. As outlined in Figure 1, this study maps textile dye clusters based on the academic literature for reference. This study then proceeds in three main steps. First, it maps pollution across five rivers. Second, it visualizes access to basic drinking water across subdistricts. Third, it develops a water vulnerability index based on 25 indicators across six dimensions using multicriteria analysis (MCA). The grey boxes in Figure 1 illustrate water and chemical inputs and declining water tables, which provide background but do not form part of the analysis.
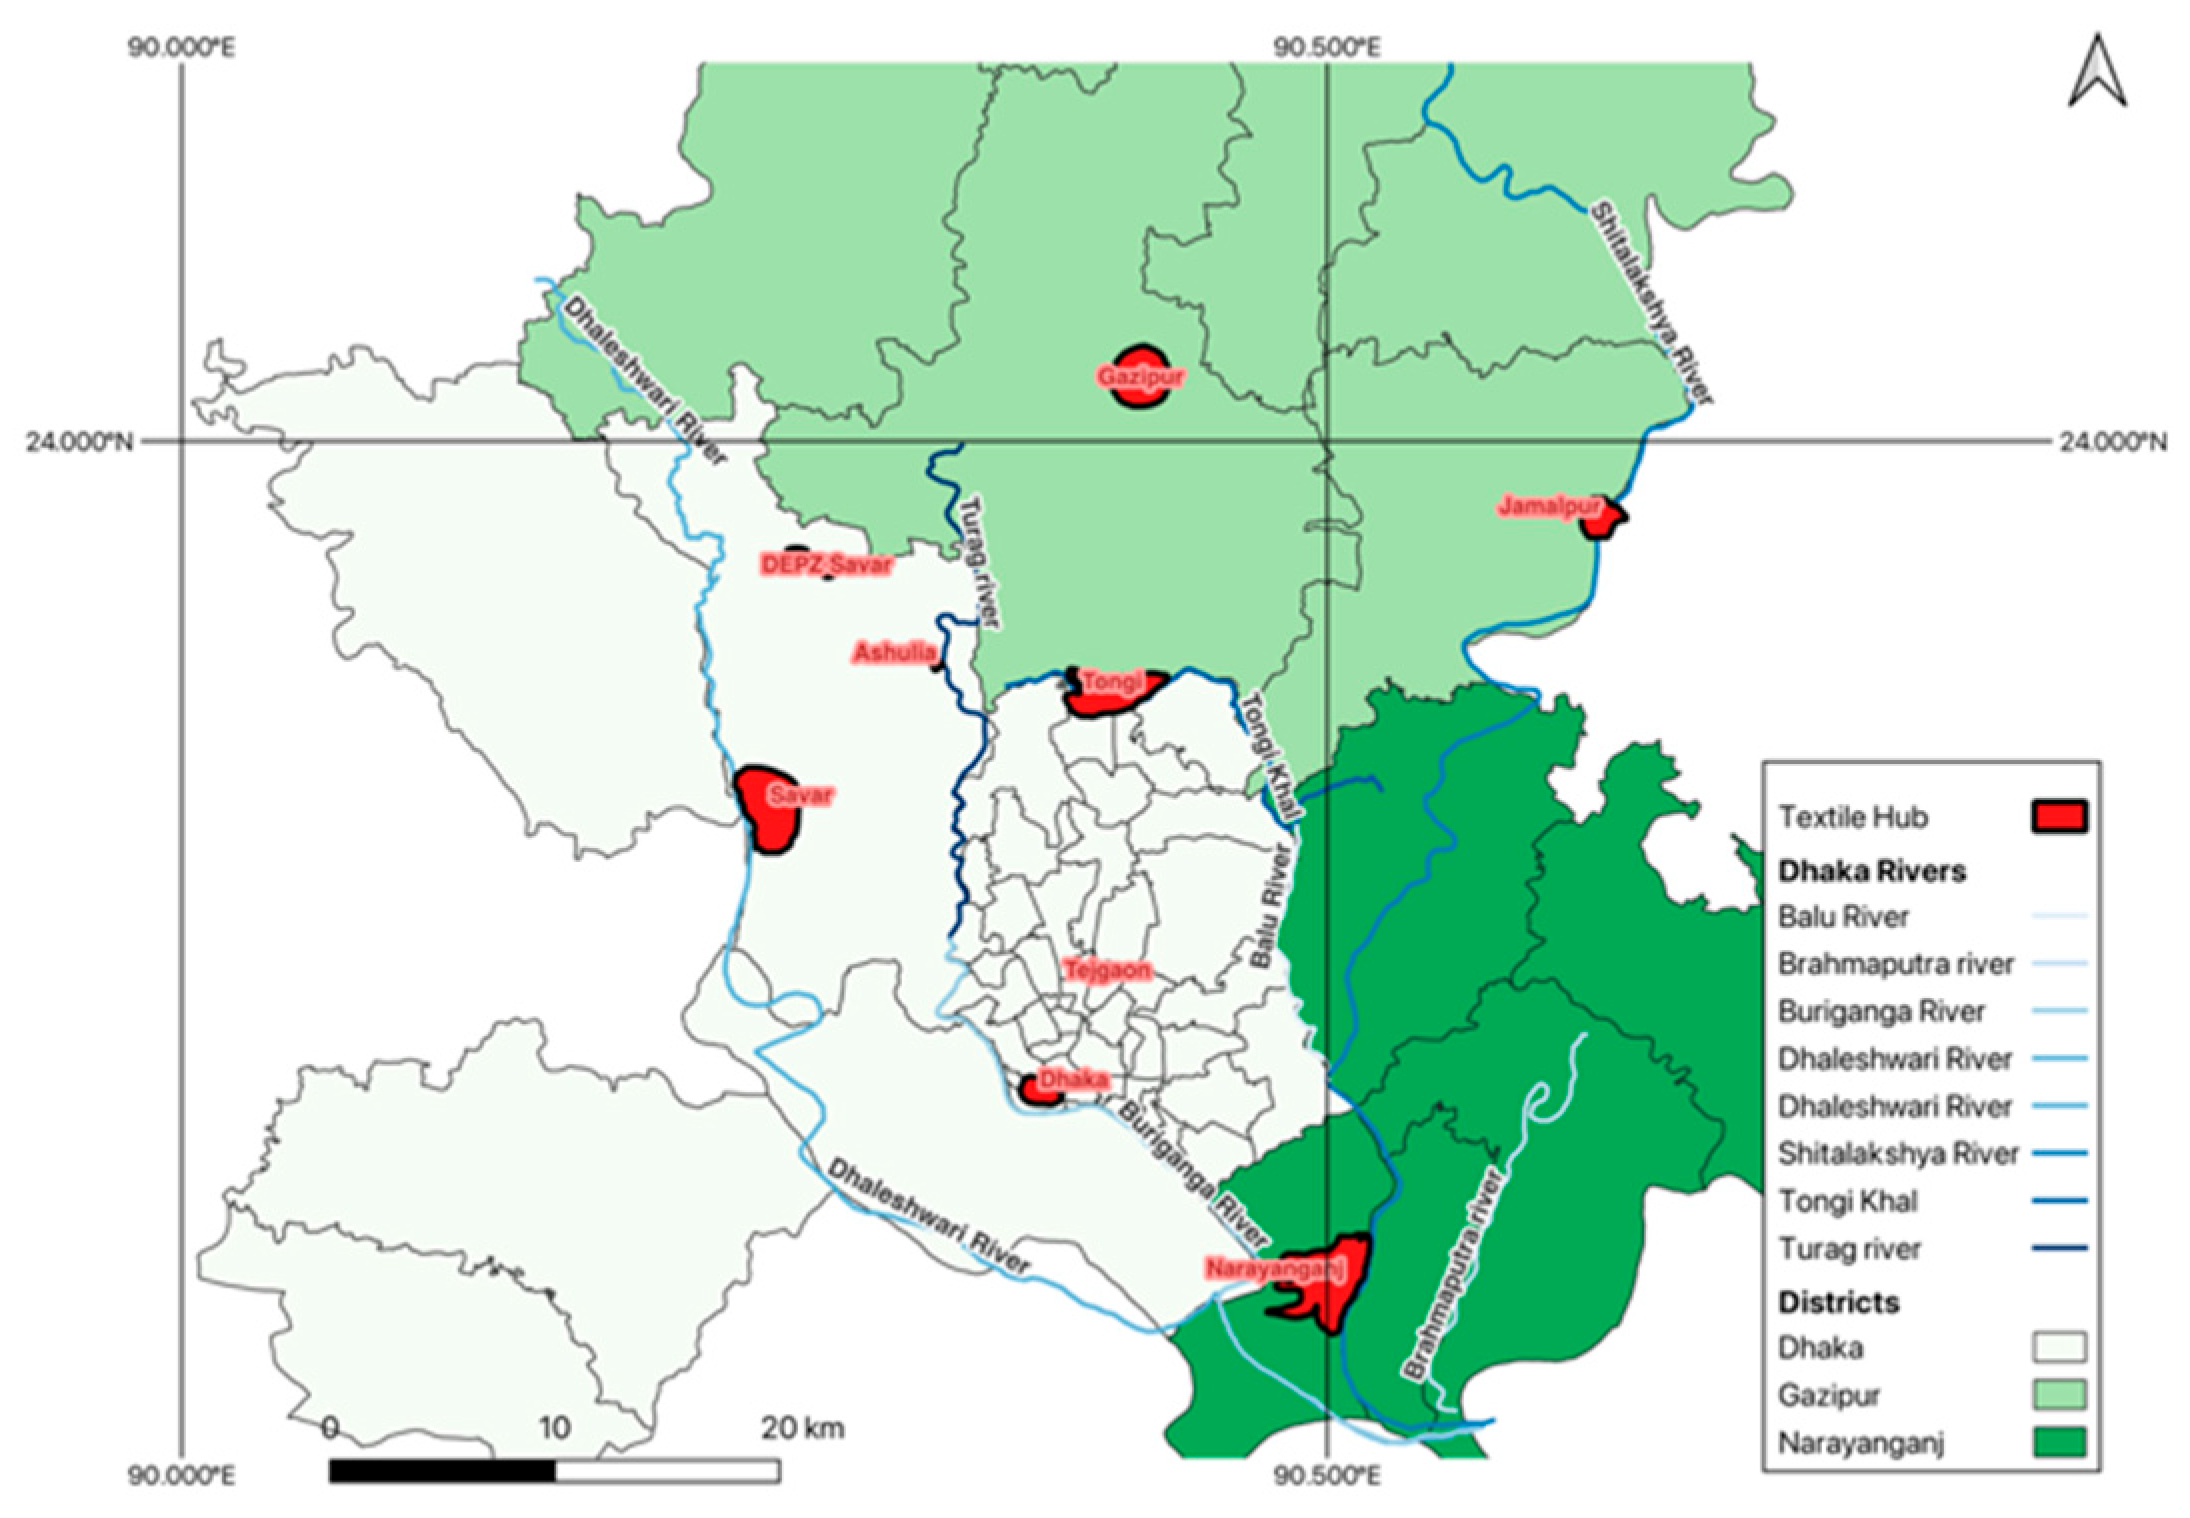
Using descriptive spatial analysis, this study maps nine textile dye clusters as identified in the academic literature [4,43,47,63]. The literature consistently highlights certain areas for textile dyeing within Dhaka, Narayanganj, and Gazipur, as presented in the following maps. The purpose of this layer is illustrative rather than exhaustive and aims to contextualize the spatial distribution of textile dye activity in relation to water vulnerability rather than to quantify factory density or explore statistical relationships. This approach is often applied in data-scarce contexts and is used in this study due to limited information on individual textile dye factory locations. As a result, the mapped clusters offer a spatial overview to help interpret possible connections between water vulnerability and textile dye water pollution. They are not intended to be comprehensive or used for statistical analysis but rather to provide a general descriptive illustration.

3.1. River Water Quality

This study shows river pollution within Shitalakhya, Turag-Tongi Khal, Buriganga, Dhaleswari, and Balu Rivers, which flow through Dhaka Division. The river water quality data used in this study stems from the Surface and Ground Water Quality Report 2023 by the Department of Environment (DoE) in Bangladesh [28]. Although the report measures pH, DO, BOD, COD, and TDS levels across 29 rivers in Bangladesh, this study only includes five, as these rivers run through Dhaka, Gazipur, and Narayanganj Districts. The values were collected every month throughout 2023, except April, May, and June. For this study, the mean values were calculated for each indicator to map and assess the general pollution levels in the selected waterways. The river water quality levels were evaluated based on standards for fisheries as outlined in the Water Quality Report [28]. The average value observed within the five rivers was assessed against the categories outlined in Table 1, which grade river water quality as safe, moderate pollution, or high pollution.
The pH, DO, COD, BOD, and TDS levels are key indicators of river pollution and are influenced by the presence of textile dye effluent. Textile effluent interferes with light penetration, leading to lower DO and higher BOD and COD levels in the rivers [30,31,32,33]. A key limitation in assessing the impact of textile dye on river quality in Dhaka is the lack of large-scale data on synthetic dye, heavy metals, microplastics, and PFAS concentrations. As a result, this study relies on these conventional measures instead. The DoE (2023) data did not include measures on groundwater levels in Dhaka, although the textile industry relies on this water source, and Dhaka Division is facing a rapid decline in water tables [28]. In addition, the values were assessed based on averages, even though these values fluctuate throughout the year, and the original data shows that pollution levels are highest during the dry season (November to March) and lowest in the wet season (June to September) [16].
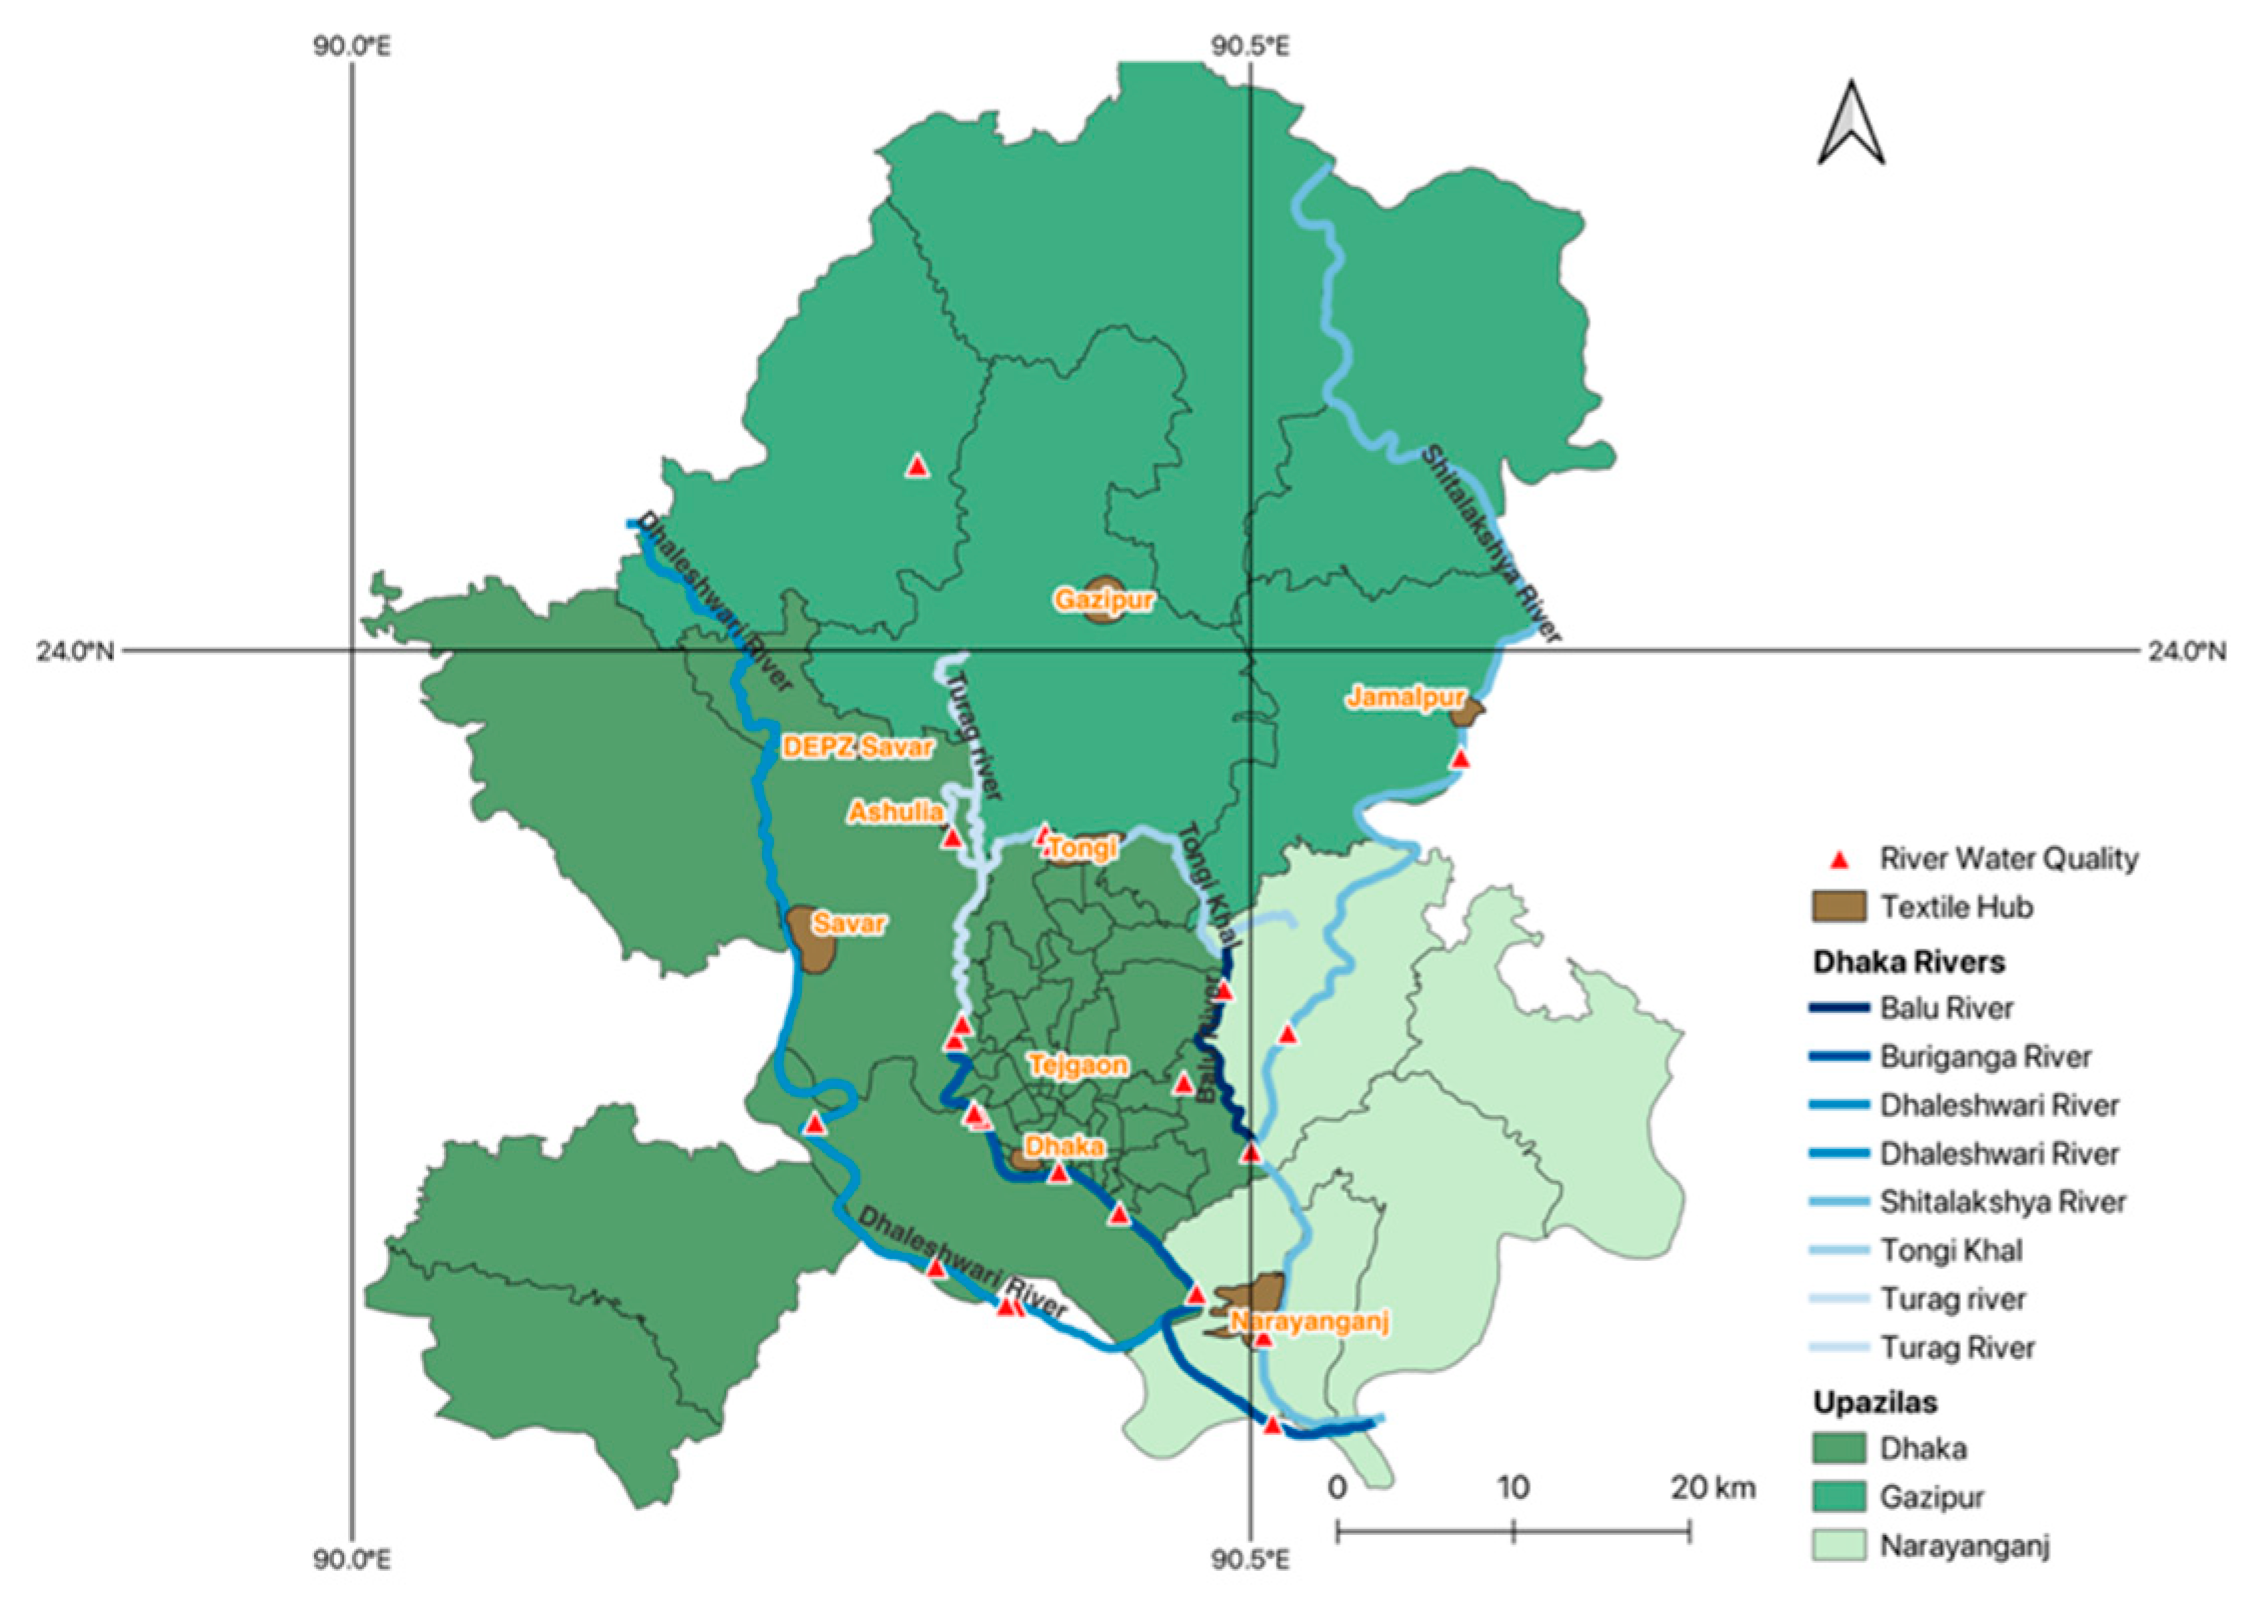
The five rivers included in this study, Shitalakhya, Turag-Tongi Khal, Buriganga, Dhaleswari, and Balu, flow through Dhaka, Gazipur, and Narayanganj Districts, which are known for their many textile dye factories. Figure 2 illustrates where the water quality observations took place in 2023 [28], which included seven observation sites in the Buriganga River, four in the Shitalakhya River, five in the Turag-Tongi Khal, five in the Dhaleswari River, and two in the Balu River. Although this dataset offers observations across multiple rivers, the number of observation sites is limited, and these are not evenly distributed across subdistricts. Therefore, the sampling quantity and distribution limit the ability to accurately represent water quality conditions across subdistricts and integrate these into the WVI.

3.2. Water Insecurity and Vulnerability

The second part of the paper assesses water vulnerability within Dhaka, Gazipur, and Narayanganj Districts. This includes visualizing access to basic drinking water (WI) across these Districts to evaluate where water insecurity is highest, as well as developing a Water Vulnerability Index (WVI) to show which subdistricts are most at risk. The data used to show water insecurity and the WVI stem from the INFORM Risk Index (2022) [29]. This dataset comprises 54 indicators disaggregated by Bangladesh’s 489 subdistricts (Admin Level 3). Bangladesh has three levels of administrative boundaries, with each division comprising several districts, and each district encompassing multiple subdistricts.
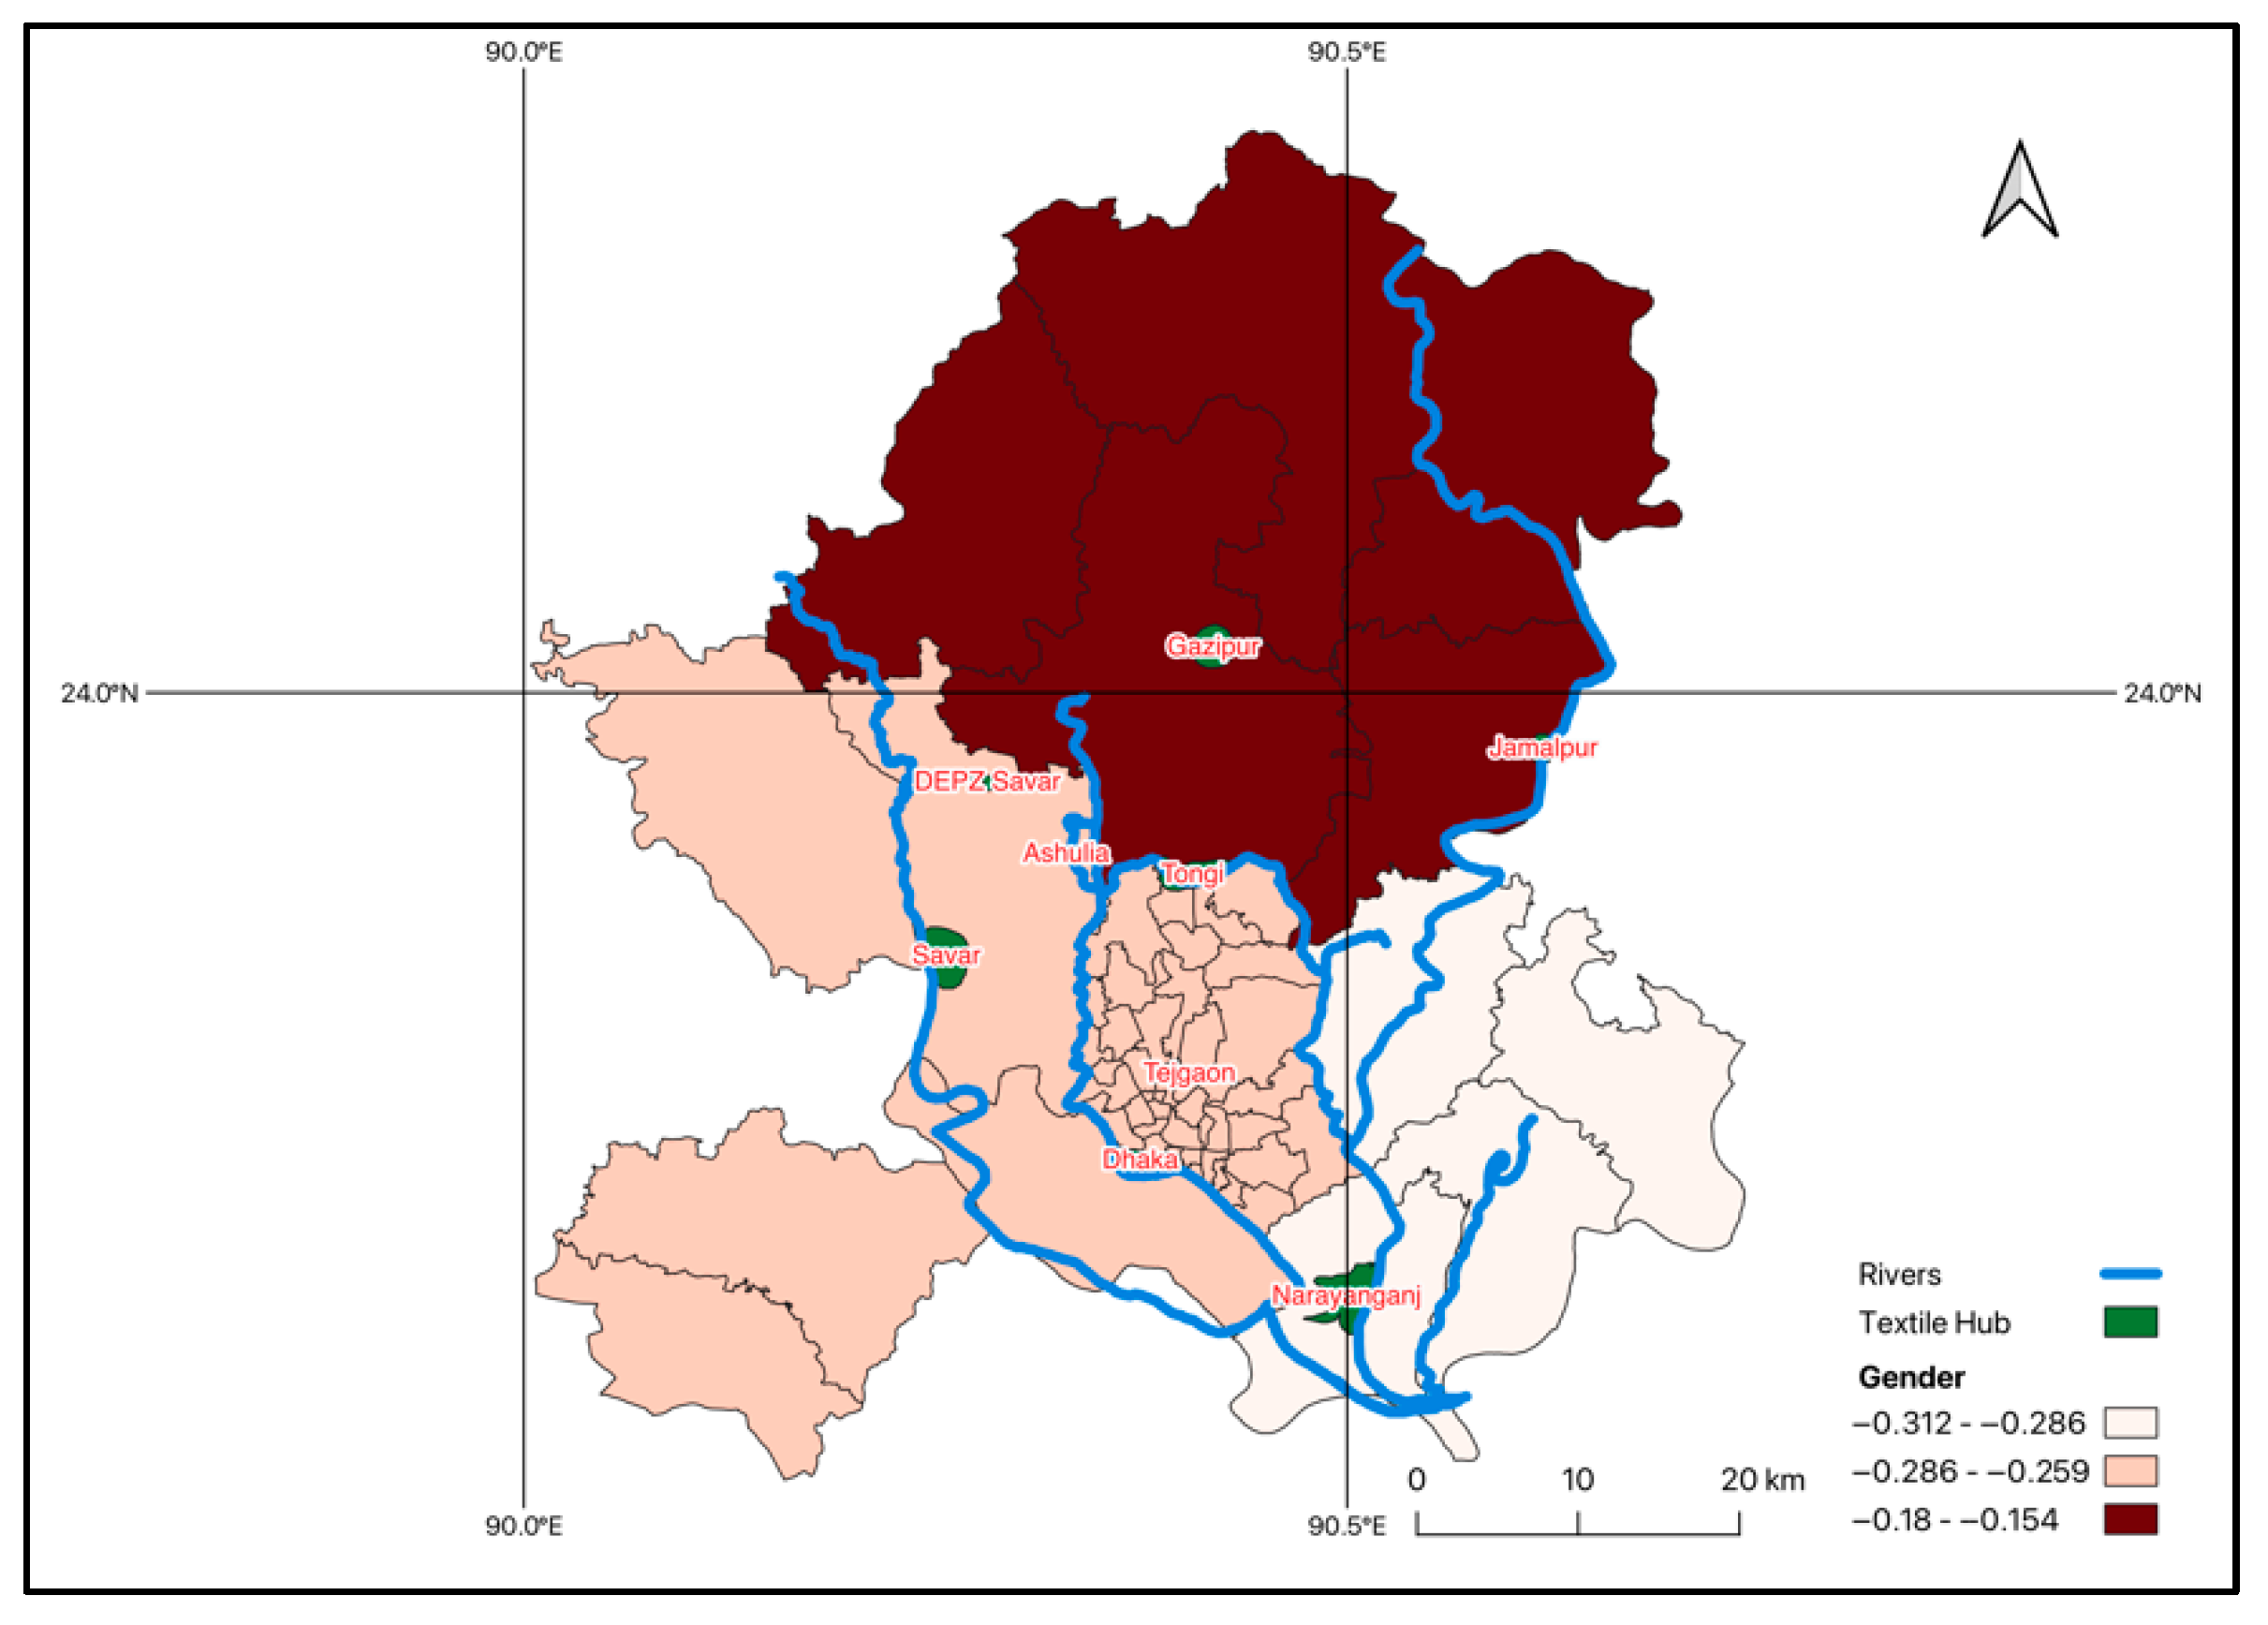
The focus area of this paper includes three of the thirteen districts within the Dhaka Division. These are Gazipur, Dhaka, and Narayanganj, which are known for their textile production, as illustrated in Figure 3 [4]. In addition, Figure 3 shows that these districts include the five rivers described during the first part of this study. The Buriganga River flows through Dhaka and Narayanganj, the Shitalakhya River intersects with Gazipur and Narayanganj, and the Turag-Tongi Khal channels through Gazipur and Dhaka Districts, and is close to the DEPZ, Tongi, and Ashulia textile hubs. The Balu River traverses the borders of Narayanganj and Dhaka, while the Dhaleswari River travels through Dhaka and the Savar textile hub.
Water insecurity was mapped and assessed separately, given its specific importance to water vulnerability. This part includes exploring access to basic drinking water across Dhaka Division and Bangladesh to assess where water insecurity is the most prevalent. This indicator, drawn from the INFORM dataset, encompasses basic and safely managed water services. WI is defined as drinking water from an improved source, with a collection time of less than 30 min for a round trip. Improved water sources include piped water, tube wells, protected springs, and packaged water [29]. This data originally stems from UNICEF and the Bangladesh Bureau of Statistics (BBS) 2019 and includes data across all 489 subdistricts. This informed the second phase, which involved developing a WVI that includes several indicators from the INFORM dataset.

3.3. Water Vulnerability Index

The Water Vulnerability Index (WVI) compiles 25 indicators from the INFORM Dataset. Table 2 lists these indicators including their definition and original sources, as presented in INFORM. As vulnerability is multidimensional and context-specific, there are no standardized criteria for the selected indicators [19]. These indicators were chosen based on relevance to water vulnerability and identified through a review of the existing literature. This WVI is based on a Multidimensional Vulnerability Assessment (MDVA) framework, which defines vulnerability as conditions shaped by physical, social, economic, and environmental factors, as well as processes that heighten sensitivity to the impacts of hazards—in this case, water-related challenges from textile dye production [2]. As a result, the WVI consists of six thematic dimensions, including demographics, socioeconomic, gender, health, WASH, and climate. In addition, each indicator either increases or decreases water vulnerability, which is indicated by the arrows in the table (↑ denotes an increase while ↓ denotes a decrease).
The WVI was assessed using multicriteria analysis (MCA), assigning equal weight to the indicators outlined in Table 2. First, the data for each indicator were normalized using the min-max scaling technique to ensure comparability, which resulted in new indicator values ranging from 0 to 1, where 1 indicates higher vulnerability and 0 indicates lower vulnerability. The formula used is:
N o r m a l i s e d   V a l u e   ( n ) =   X X m i n X m a x X m i n
Given that some indicators lowered vulnerability instead of increased vulnerability, as indicated by ↓↑ in Table 2, this influenced whether the derived values were positive or negative.
Rapid urbanization and increasing population density in Dhaka are placing pressure on current water resources and exacerbating vulnerability [47]. Slum dwellers (PLS) often do not have access to basic drinking water and rely on rivers for domestic use, increasing exposure to pollution and heightening water vulnerability [36,55]. In addition, women-headed households are often at higher risk of water vulnerability, due to lower incomes and higher water prices [55]. As such, the demographic dimension (D) consists of the following indicators: population density (PD), population living in slums (PLS), urban population growth (UPG), and woman-headed household (WHH), which were calculated after indicator normalization:
D =   P D n +   P L S n +   U P G n +   W H H n 4
The textile industry has been critiqued for providing unsustainable livelihoods and poverty salaries [55] and using child labor [14], which deprives children of education, exposes them to hazardous conditions, and perpetuates poverty [52]. Anthropogenic pollution risks internal displacement and a consequent increase in the “floating population” [50]. As a result, the socioeconomic dimension (SE) embedded in the WVI includes the indicators income inequality (II), poverty (P), unsustainable livelihood unemployment (ULU), floating population (FP), and child labor (CL). These indicators are key characteristics that make people more vulnerable to water-related challenges. The formula applied is:
S E =   I I n +   U L U n +   U R n + F P n   C L n   5
Next, the gender dimension (G) is included as women represent the majority of the textile workforce [43], experience workplace violence [55], and internalize a greater burden of poverty, water, and food insecurity [57], as well as being responsible for water-related household chores from collection to waste disposal [58] and are more exposed to unsafe water and sanitation facilities [60,64,65]. These factors contribute to women facing higher risks of water vulnerability, while better menstrual hygiene management and education attainment reduce vulnerability among women by improving health, dignity, and decision-making capacity [66,67]. Therefore, the indicators included are women’s domestic violence attitudes (WDV), GPI for lower secondary school (GPIL), GPI for upper secondary school (GPIU), and menstrual hygiene (MH). The formula applied is:
G =   W D V n   G P I L n   G P I U n M H n   4
The water, sanitation, and hygiene (WASH) dimension (W) is directly linked to water vulnerability. Lack of access to basic sanitation services (BSSs), higher water insecurity (WI), and the prevalence of open defecation (OD) indicate a lack of proper water infrastructure and contribute to water vulnerability [58]. The formula applied is:
W =   B S S n   W I n +   O D n 3
Similar to the other dimensions, health issues make populations more vulnerable to water challenges, and in turn, water challenges increase health problems. Heavy metals released from textile dye production contribute to increased under-five mortality (UFM) [68,69,70] and negatively affect early childhood development (IECD) through contaminated water exposure [8]. In Dhaka, skin diseases and diarrhea are found to be twice as high in areas proximate to textile factory clusters [68]. According to UNICEF (2023), water pollution causes an increase in UFM and increases the risks of underweight and diarrhea among children [7,70]. Access to clinics and doctors is, therefore, important to reduce vulnerability. Accounting for these factors, the health dimension (H) includes under-5 child mortality (UFM), underweight (U), insufficient early child development (IECD), physicians density (PD), and community clinic density (CCD). The formula is:
H =   U F M n +   U n +   I E C D n P D n C C D n   5
The flow and volume of water in Dhaka vary throughout the year due to a monsoon climate, resulting in heavy rainfall from June to October (Kharif) and a dry period from October to March (Rabi). Due to these seasonal patterns, Dhaka relies on rivers to absorb monsoon rain, refill aquifers, and store water for the dry season, a process that is exposed to extreme weather, more intermittent rainfall and droughts, rising temperatures and sea levels, and anthropogenic pollution [3]. As a result, Dhaka’s extensive river system raises the risk of flooding and further threatens water security. These climate-related indicators have a direct impact on water vulnerability. Therefore, the climate dimensions (C) include intensive river flood (IRF), drought risk Rabi (DRR), and drought risk Kharif (DRK). The formula applied is:
C =   I R F n +   D R R n +   D R K n 3
All the indicators with “n” are considered the normalized value. The final step of the MCA involved adding the scores of each dimension together to assess the overall water vulnerability within the subdistricts of Gazipur, Dhaka, and Narayanganj, building on the various dimensions outlined in preceding paragraphs. The formula applied to calculate the WVI is:
W V I =   D + S E + G + W + H + C   6
The Supplementary Materials (Table S1) outline the various dimension scores and rankings across 57 subdistricts in Dhaka, Gazipur, and Narayanganj. This divides the subdistricts into three categories: high (red), moderate (blue), and low (green) vulnerability. The selection of indicators was limited by data availability across subdistricts. Unfortunately, no large-scale or consistent data on textile factories or water quality were available, making it difficult to include these dimensions in the WVI directly. Disaggregated data across the three admin levels is difficult to find, constraining the selection of indicators to those available in the INFORM Dataset. In addition, the selected indicators come from various sources and years; therefore, the data do not reflect the same point in time. Moreover, some indicators, such as GPIL and ULU, provided data only at the district level, resulting in similar values across subdistricts. Given that most indicators within the gender dimension only provided data at the district level, it was not possible to evaluate differences between subdistricts within this dimension.

4. Results

4.1. River Water Pollution in Dhaka, Gazipur, and Narayanganj

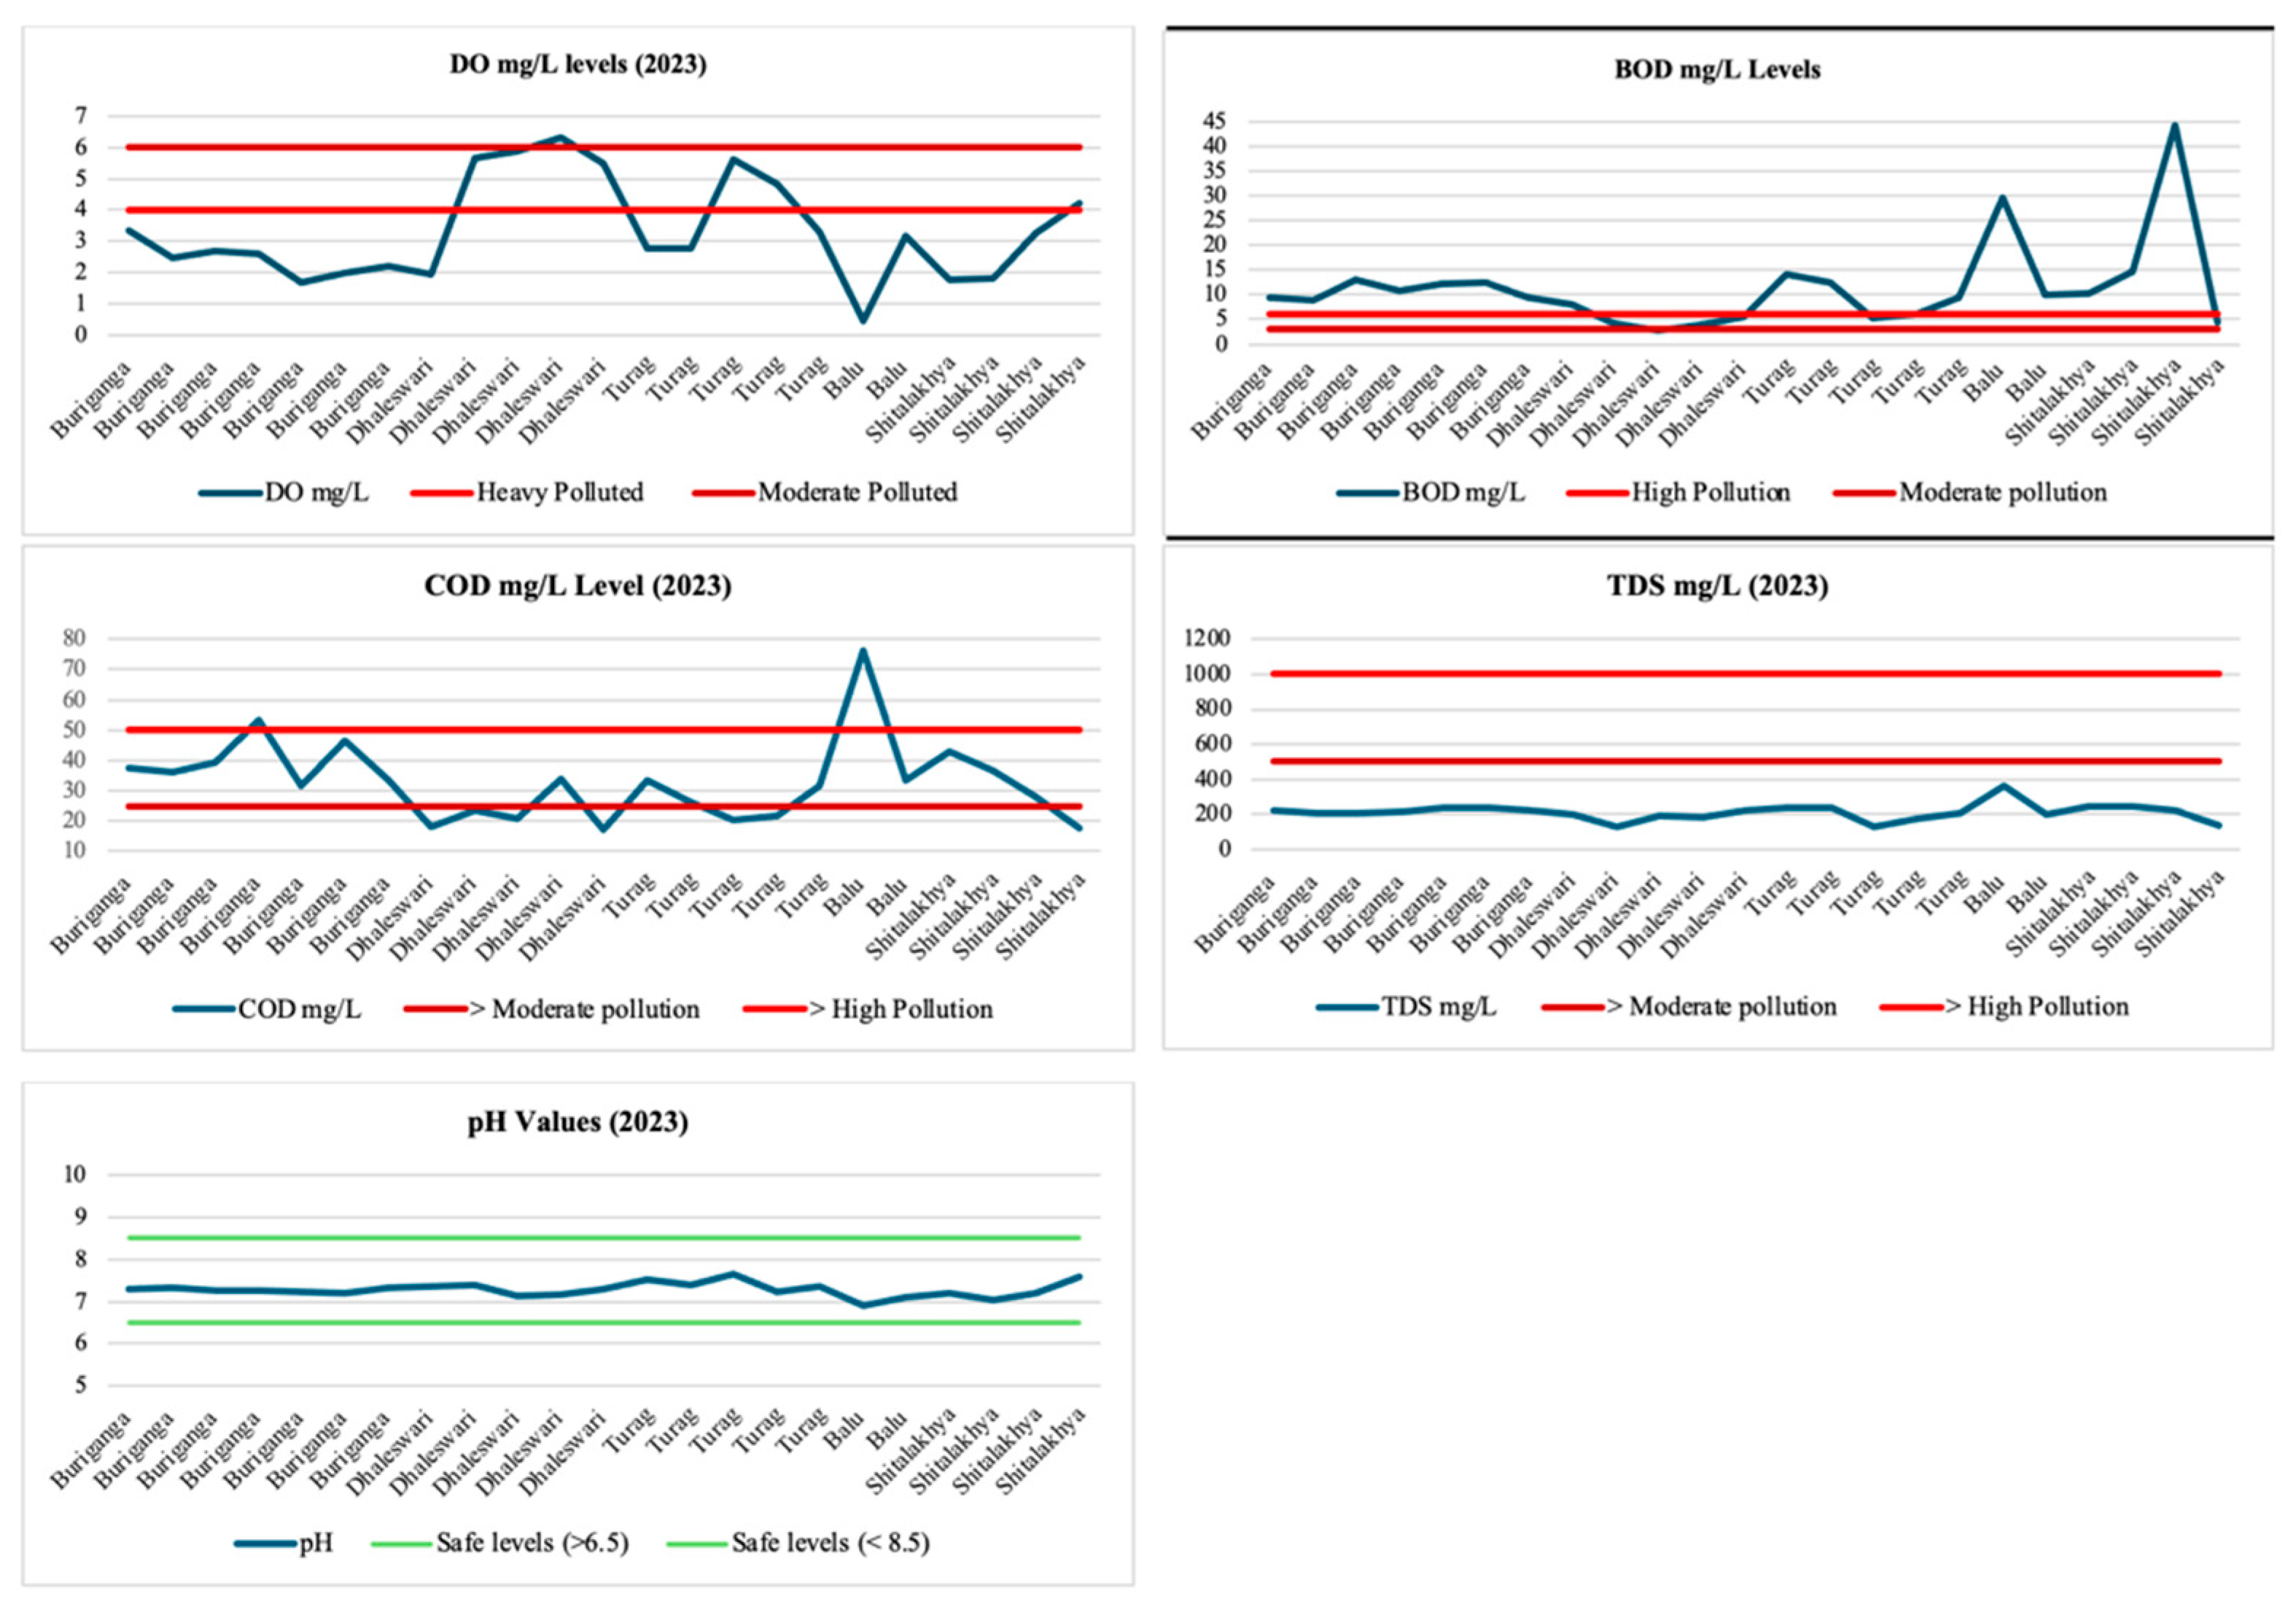
Figure 4 shows the pH, DO, COD, BOD, and TDS levels across the five rivers of observation. The DO measurement indicates that values under 4 mg/L signal high pollution. DO concentrations below this threshold will cause a decline in aquatic fish species over time due to low oxygen levels, which will carry spillover impacts for the fishing industry [30,31]. The graph shows that 17 of the 23 observation sites (Figure 4) have an average DO concentration below 4 mg/L, and only one observation had a safe DO level at 6.31 mg/L, which was at Hazaratpur in the Dhaleswari River. In addition, the results from the Shitalakhya, Buriganga, and Balu Rivers reveal very low DO levels, indicating high pollution, whereas the observations in the Turag and Dhaleswari Rivers demonstrate moderate pollution. The Trimohoni Bridge in the Balu River had the lowest DO observation at 0.47 mg/L, showing very high pollution. Taken together, the average DO levels for all rivers in Dhaka, Gazipur, and Narayanganj in 2023 indicate high pollution levels [28].
The BOD levels across the five rivers indicate poor river health and critical conditions, as values between 4 and 6 mg/L indicate moderate pollution, while those of 6 mg/L and above are classified as high pollution. Figure 4 shows that the Shitalakhya, Turag-Tongi Khal, Buriganga, and Balu Rivers have BOD levels above 6 mg/L across observation sites, while the Dhaleswari River showed BOD levels indicating moderate pollution. The Ruhitpur site in the Dhaleswari River is the only observation with safe BOD Levels at 2.85 mg/L, while Murapara (Rupgonj) in the Shitalakhya River had the most elevated BOD levels at 44.163 mg/L, which show extremely high pollution. Taken together, 17 of the 23 observation sites had an average BOD concentration exceeding 6 mg/l. For instance, the Trimohoni Bridge in the Balu River showed an average BOD concentration of 29.7 mg/l, while the Majira Demra Ghat and Murapara (Rupgonj) in the Shitalakhya River showed an average BOD concentration of 44.16 and 14.56 mg/l, which indicates very high organic pollution levels.
COD is considered a standard textile dye indicator because toxicity positively correlates with COD in different effluents [38,71]. Figure 4 outlines the average COD levels by observation site and shows that values between 25 and 50 mg/L indicate moderate pollution, while values over 50 mg/L are classified as high pollution. The graph indicates that the Shitalakhya and Buriganga Rivers experience moderate pollution, whereas the Dhaleswari and Turag Rivers have low-to-safe pollution levels. However, the Balu River has the highest average pollution levels, since the Trimohoni Bridge had an average COD level of 76.25 mg/L. Therefore, the Balu River and the Buriganga River demonstrate the highest pollution. Taken together, 14 of 23 observations showed an average COD concentration between 25 and 50 mg/L, indicating moderate pollution. Taken together, the Shitalakhya, Turag, Buriganga, Dhaleswari, and Balu Rivers, which flow through Dhaka Division, are experiencing significant pollution, with most DO, BOD, and COD values exceeding safe levels for the surrounding communities and ecosystems.
On the contrary, Figure 4 illustrates that the average TDS values are within safe levels. As the graph shows, all values across the 23 observations are below 500 mg/L. As a result, this implies that the prevalence of dissolved inorganic concentrations, such as salt, is not too high, even though salt is often used in high quantities during textile dye production [10]. Similarly, Figure 4 shows that the average pH values are within safe levels (between 6.5 and 8.5) across all 23 observations in Shitalakhya, Turag, Buriganga, Dhaleswari, and Balu Rivers. The pH scale shows the basic or acidic levels present within the water, in which a pH of less than 7 is acidic and a pH greater than 7 is basic [28]. This suggests that the water is neither too acidic nor too basic; therefore, the river pollution levels are unrelated to this indicator.
The average pH and TDS values across all observation sites are within safe levels. However, the average BOD, COD, and DO levels demonstrate moderate-to-high pollution across most observation sites. This indicates that high organic and chemical pollution levels are present in the rivers included in this analysis, but there are safe levels of dissolved inorganic solids (TDSs) and no significant acidification or alkalinization (pH) of the river water. In conclusion, the Balu River has the highest pollution level, the lowest incidence of DO, and the highest elevated BOD and COD levels. The Buriganga, Turag, and Shitalakhya Rivers also demonstrate significant pollution, with the average DO, BOD, and COD levels exceeding high-pollution classifications. For instance, the Shitalakhya River shows elevated pollution levels within three observation sites. On the contrary, Dhaleswari has the lowest pollution among the five rivers, with DO concentrations within safe levels across four out of five observations, as well as BOD and COD within safe-to-moderate pollution levels across all observation sites.
Only a few water observation points were in proximity to the textile dye clusters mapped in Figure 2. For instance, the Ashulia textile cluster near the Turag River had low DO levels (2.78), high BOD levels (12.35), and moderate COD (26.11) levels. The two observation sites in Tongi Khal near the Tongi textile cluster show high DO (2.80/3.29), high BOD (14.07/9.41), and moderate COD levels (33.2/31.38). The Shitalakhya River is close to Narayanganj and Jamalpur textile clusters and shows contrasting results. Near the Narayanganj textile cluster, the results show low DO (1.76), high BOD (10.36), and high COD (42.67) levels, while near the Jamalpur textile clusters, both DO (4.20), BOD (4.40), and COD (17.75) were within safe levels. All three observation points near the Dhaka textile hub along the Buriganga River show high pollution, as DO (2.68/2.61/1.70), BOD (13/10.67/12.22), and COD (39.1/53.44/31.56) levels exceed safe levels. This shows that water quality near the textile clusters where observations were available generally exceeds pollution thresholds, signaling alarming environmental degradation linked to industrial discharge.

4.2. Access to Basic Drinking Water

Water insecurity is unequally felt across Bangladesh. According to the INFORM data, the average access to clean drinking water is 80% among the subdistricts [29]. However, Figure 5 illustrates that access to drinking water varies extensively across the country’s subdistricts and within Dhaka Division, which indicates insufficient distribution and significant water inequality. The dark blue subdistricts show that over 83% of their population can access reliable drinking water. By contrast, the white-colored subdistricts indicate that less than 17% of their population can access basic drinking water. Figure 5(1) shows that most subdistricts in Bangladesh have over 83% of their population with access to basic drinking water. However, as shown in Figure 5(2), central Dhaka is one of the most water-insecure areas within the country. This is despite the area being the most densely populated and hosting many industrial zones that rely on water for their production, thereby amplifying pressure on existing clean water resources. Figure 5(3) shows that out of Dhaka, Gazipur, and Narayanganj Districts, Dhaka is the most water-insecure area. This also indicates that the textile clusters are in subdistricts that host communities with access to clean water, which falls below the national average. For instance, the Savar, DEPZ, and Ashulia textile hubs are located in Savar, where only 66.9% of the population can access reliable drinking water. Moreover, Tongi and Gazipur textile clusters are situated in Gazipur, with 38.9% of the population having access to basic drinking water. This falls to 19.6% within the Tejgaon industrial area of Dhaka.
Although central Dhaka is experiencing high water insecurity, subdistricts with textile clusters coincide with a high percentage of the population lacking access to basic drinking water. Although water insecurity is amplified by the use of textile dyes and pollution of water resources, other factors also influence water insecurity, including social, economic, and environmental trends. These include changes in surface water, industrial growth, agriculture, urbanization, population density, and droughts. In addition, the subdistricts in central Dhaka that experience high water insecurity are also Bangladesh’s most densely populated subdistricts. This illustrates that the absolute number of people lacking access to water constitutes a significant proportion of the overall national population, indicating that the average access to basic drinking water across the country is much lower when accounting for population size. This is supported by Water.org (2023), which states that 40% of the total population of Bangladesh lacks access to safe and reliable drinking water [72]. Consequently, there is an urgent need to improve access to clean water in the central area of Dhaka.

4.3. Water Vulnerability Index (WVI)

Many factors exacerbate water vulnerability, including demographics, socioeconomics, gender, WASH, health, and climate change. The WVI results include a set of maps disaggregated by each of these dimensions and a combined WVI score and map to show which areas are most vulnerable and less likely to cope with water use and pollution arising from textile dye production. The subdistricts are grouped by low, moderate, and high vulnerability as shown in Table S1.

4.3.1. Demographic Dimension of WVI

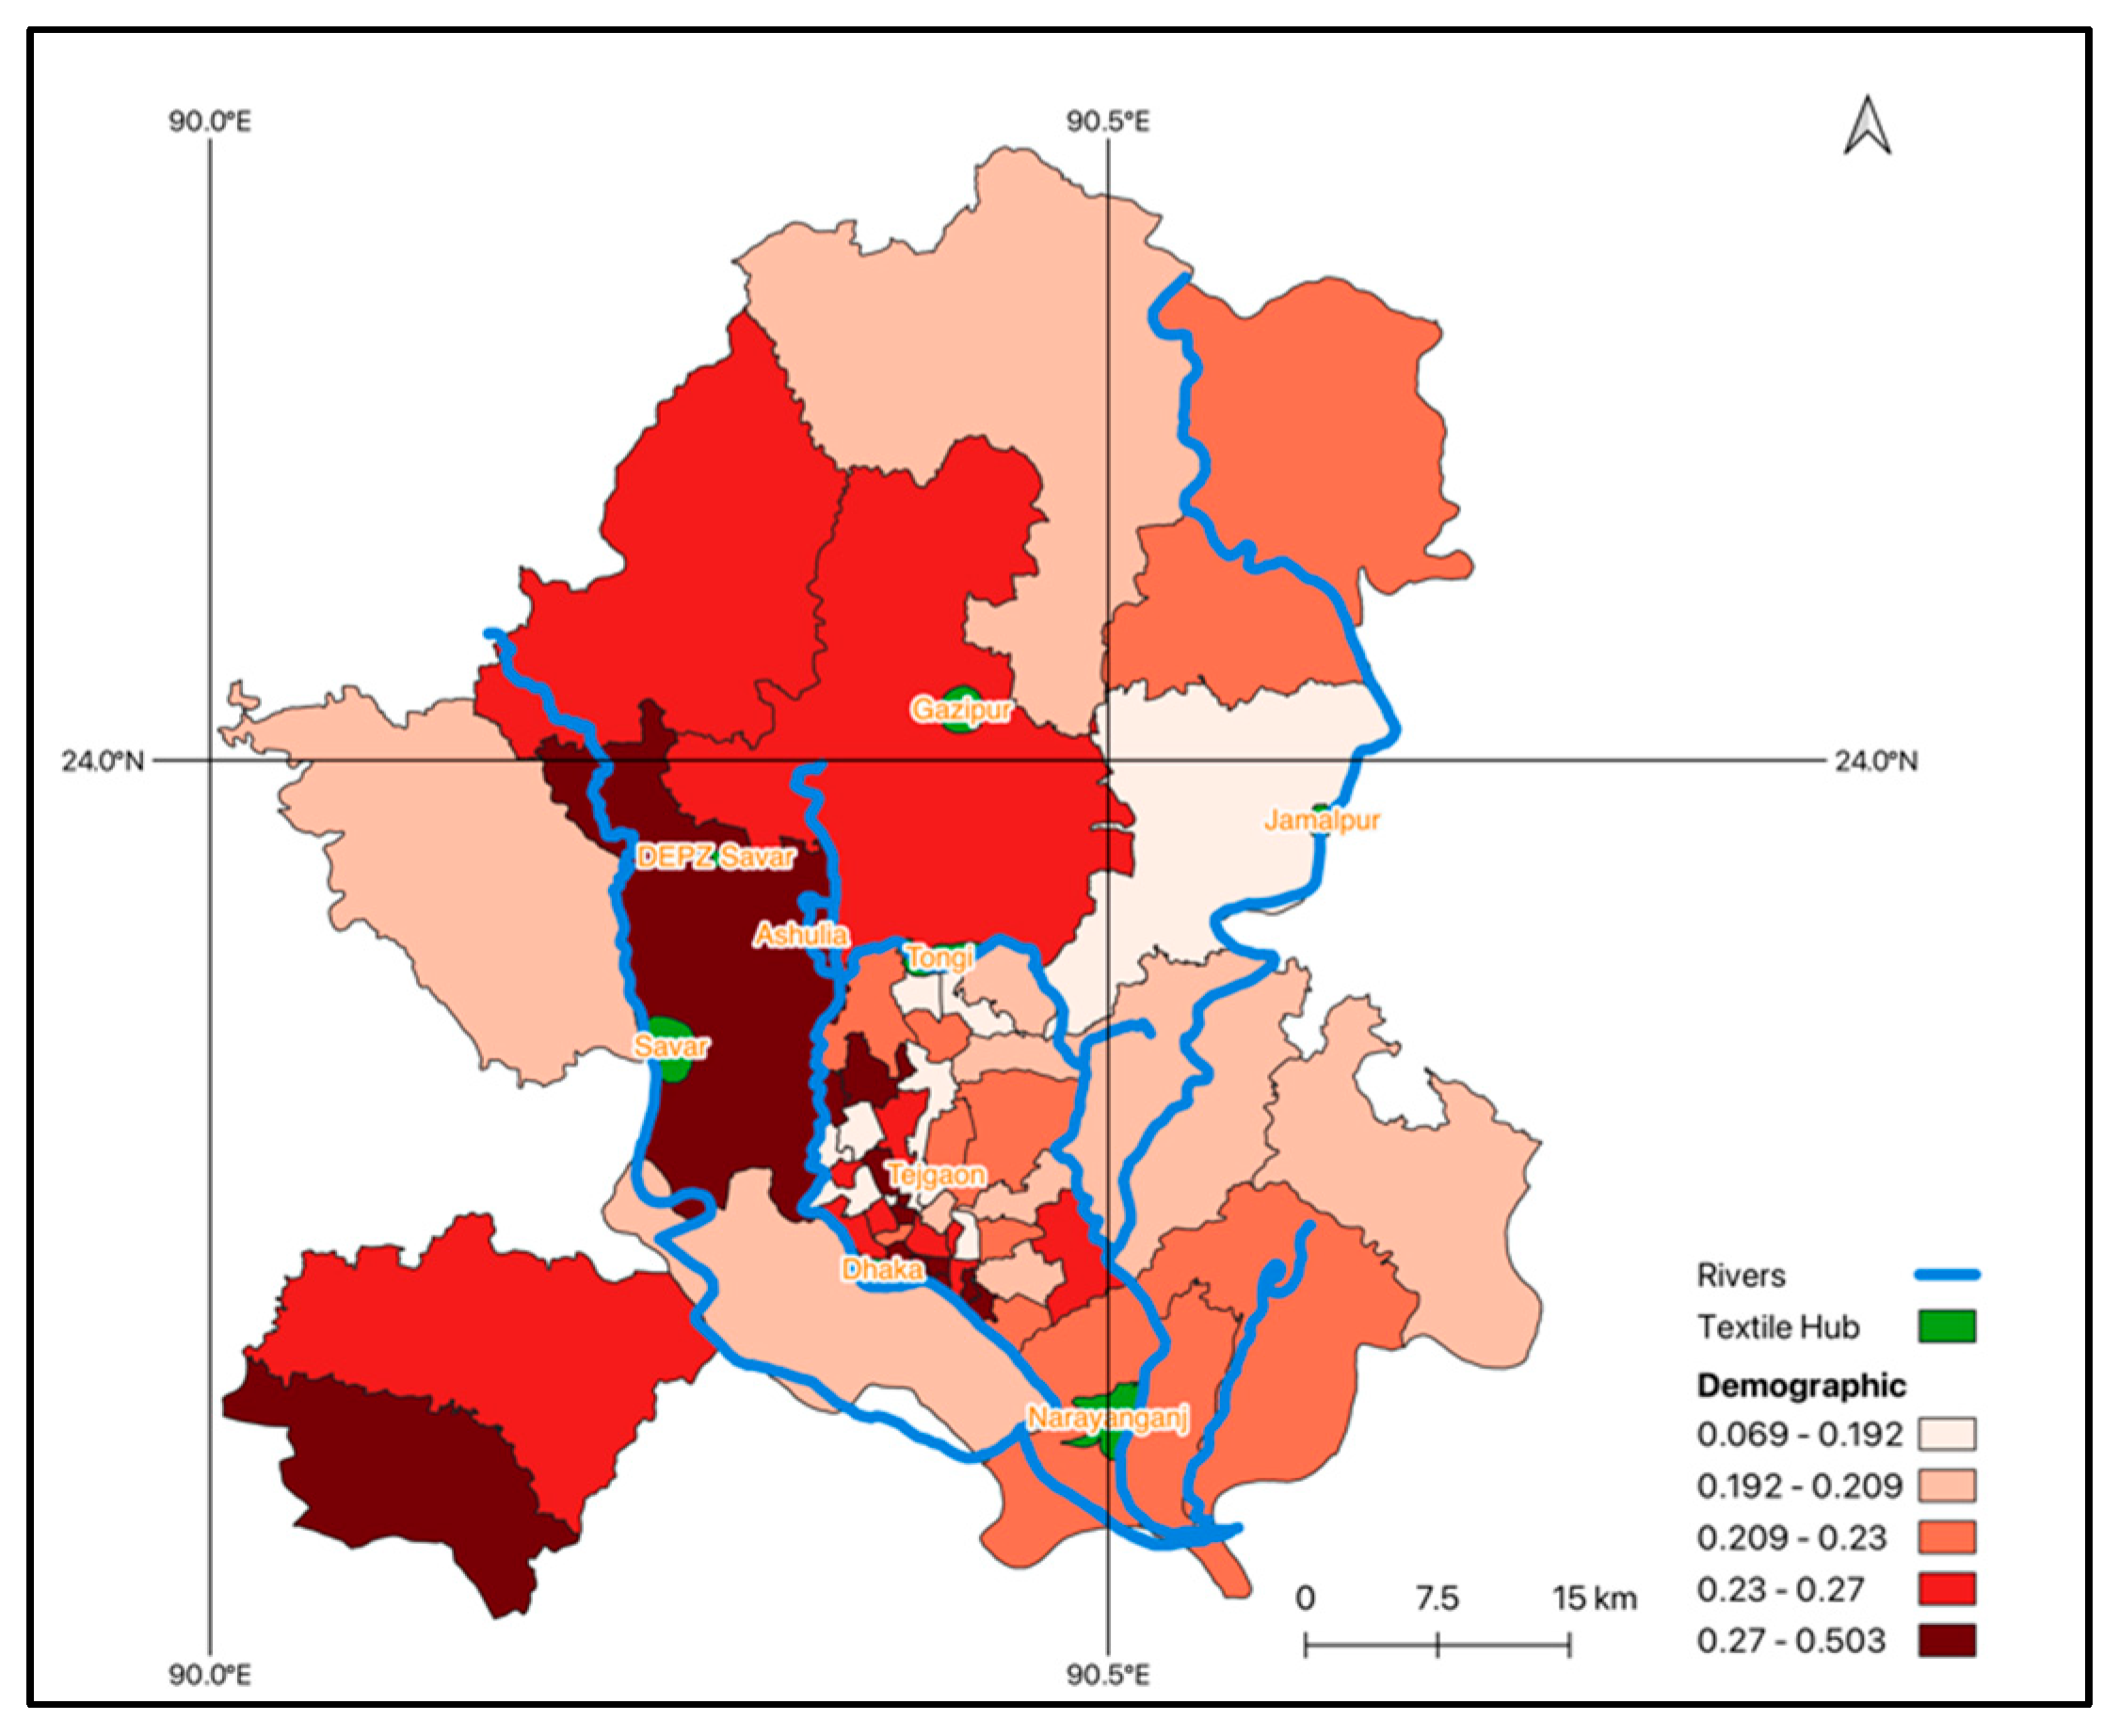
Figure 6 demonstrates the results of the demographic dimension of the WVI and shows that Bangshal (0.50) and Kotwali (0.32) in Dhaka District, which border the Buriganga River and are in proximity to Dhaka’s textile cluster, experience the highest demographic vulnerability. Savar (0.28) and Gazipur Sadar (0.26), which also host a lot of textile factories, experience high demographic vulnerability. As shown in Table S1 and Figure 6, Tejgaon Ind. Area (0.088) and Uttara (0.069) in central Dhaka show the lowest levels of demographic vulnerability.
The PD indicator shows that Bangshal, Lalbagh, and Chak Bazar in Dhaka are the most densely populated subdistricts on the map. UPG reveals that Kotwali (13%) has the highest urban population growth, while Gazipur Sadar and Savar are experiencing annual increases of 8% and 9%. In contrast, Tejgaon Ind. Area in Dhaka (−7%) experienced the highest degrowth among the subdistricts. The PLS indicator reveals that Gazipur Sadar (27%) in Gazipur, as well as Kadamtali (19%), Adabor (18%), and Pallabi (17%) in Dhaka, host the largest proportions of urban dwellers living in slums. It is worth noting that Gazipur Sadar is home to significant textile clusters, including Tongi and Gazipur, with the highest number of people living in slums among the subdistricts depicted on the map. Women-headed households are one of the most vulnerable groups [29]. The WHH indicator shows that Dohar in Dhaka had the highest level of women-headed households at 29.7%, while Savar, Gazipur Sadar, and Kaliganj had rates of 12.4%, 11.5%, and 9.3%, respectively. Female-headed households are one of the most water-vulnerable groups and are generally marked by the absence of an adult male earner, lower incomes, and greater exposure to other socioeconomic risks and disadvantages [29]. Taken together, Figure 6 shows that when the results of the four indicators are combined, the textile hubs of Savar and Dhaka are characterized by a greater incidence of demographic vulnerability.

4.3.2. Socioeconomic Dimension of WVI

Figure 7 shows the socioeconomic dimensions of the WVI, and Tejgaon Ind. Area (0.317), Paltan (0.324), and Shahbagh (0.374) in Dhaka had the highest socioeconomic (SE) vulnerability. In addition, Kaliganj (0.250), home to the Jamalpur textile area, showed high levels of SE vulnerability. For income inequality (II), data were only available at the district level and show that Gazipur (0.349), Dhaka (0.38), and Narayanganj (0.396) have similar income inequality levels. By contrast, poverty (P) was more widely calculated and was substantially differentiated across the subdistricts. For instance, Cantonment and Adabor in Dhaka had the highest poverty levels at 35.2% and 28.6%, while Gulshan and Nawabganj had the lowest levels at 0.4% and 0.7%. Savar (3.1%), Tejgaon Ind. Area (4.3%), and Gazipur Sadar (8.8%) showed relatively low levels compared to other subdistricts. In addition, unsustainable livelihood unemployment (ULU) was highest in Narayanganj District at 36.14%, while Gazipur and Dhaka had 18.36% and 20.5%. In addition, child labor (CL) rates in Narayanganj and Dhaka were 5.8% and 5.6%, respectively, while in Gazipur, the rate was 9.6%. Moreover, Shahbagh and Tejgaon Ind. Area have the highest proportion of the population with no permanent home (FP), while Savar had the fourth lowest among the subdistricts on the map. Taken together, water-related challenges can deepen SE vulnerability, while SE conditions, such as livelihood, poverty, inequality, informal settlements, and child labor, shape the ability to cope with increased water challenges.

4.3.3. Gender Dimension of WVI

Figure 8 displays the gender dimension of the WVI. For all indicators, the data was only provided at a district level, resulting in the same values for the subdistricts. In addition, most indicators in this dimension reflect a decrease in vulnerability, which is why the collective score is negative. Narayanganj District had the lowest levels of gender vulnerability at −0.312, while Dhaka scored −0.263, and Gazipur scored −0.1544. The results from each indicator showed that in Dhaka, 20.3% of women believe domestic violence is justifiable (WADV), while this is 24.3% for Gazipur and 28.6% in Narayanganj. The GPIL and GPIU indicators show that Narayanganj (1.41 and 1.45) had a higher proportion of girls enrolled in lower and upper secondary school compared to boys. Although these results were lower for Gazipur (0.95 and 1.11) and Dhaka (1.14 and 1.25), the measures still show that more girls than boys are enrolled in upper secondary schools, contributing to lower gender vulnerability. The results from the MH indicator show that 94.8% of people in Gazipur, 97.2% in Dhaka, and 95% in Narayanganj have access to menstrual hygiene. As a result, the gender vulnerability is low across the three districts considered, and although the map presents different colors, the difference is small across the three districts. Taken together, gender vulnerability to water-related challenges is influenced by various factors, including women’s education levels, exposure to violence, and access to menstrual hygiene.

4.3.4. WASH Dimension of WVI

Figure 9 outlines the WASH dimension of the WVI and shows that the most WASH-vulnerable subdistricts are in central Dhaka, particularly Shah Ali (−0.110), Kotwali (−0.130), and the Tejgaon Ind. Area (−0.166), which house textile dye factories and exhibit elevated levels of WASH vulnerability. In contrast, Dohar (−0.52) and Nawabganj (−0.50) in Dhaka had the lowest WASH vulnerability, as shown in Table S1. When separating the results by indicators, access to basic sanitation and drinking water varies significantly across the subdistricts. For instance, the Bangladesh Bureau of Statistics (BBS) reports that only 6.51% of the population in Araihazar and 6.64% in Rupganj within Narayanganj District have access to basic sanitation, rising to 97.52% in Mohammadpur and 90.24% in Lalbagh, both in Dhaka. Subdistricts known for textile dye production, such as Tejgaon Industrial Area, Gazipur Sadar, and Savar, have access to sanitation at 31.63%, 37.57%, and 31.63% respectively. The situation regarding access to basic drinking water is of concern in New Market, Paltan, and Chak Bazar, where only 0.7%, 1.1%, and 5.5% of the population have access. Although the number is higher, access to drinking water remains low in Tejgaon Industrial Area, Gazipur Sadar, and Savar, where access is reported at 19.6%, 38.9%, and 66.9%. Open defecation practices are low across these subdistricts. In Tejgaon Industrial Area, Savar, and Gazipur Sadar, only 1.15%, 1.15%, and 0.565% of the population engage in open defecation. However, the subdistrict of Dhamrai in Dhaka reports the highest percentage of open defecation at 7.92%.

4.3.5. Health Dimension of WVI

Figure 10 illustrates the health dimension of the WVI. Similar to the gender dimension, some indicator values were only provided at the district level, and therefore, results appear to be the same across subdistricts. The map shows that Savar (0.1628) has the highest health vulnerability. This area hosts many textile dye factories and borders the Dhaleswari River, which connects to the Buriganga River. Both are polluted by industrial effluent.
Tejgaon Ind. Area (0.156) also shows high health vulnerability. Moreover, the indicators illustrate that Dhaka District has 22.9 per 1000 under-5 child mortality, while Narayanganj and Gazipur have 24.2 and 28.3 per 1000. Dhaka has 13.3% of children not on track in at least three development domains (IECD), while Narayanganj and Gazipur have 16.3% and 16.2%. Although there are relatively few differences across districts, Narayanganj and Gazipur demonstrate a higher level of UFM and IECD vulnerability. On the contrary, severe underweight among children under 5 years in Dhaka was 6.6%, more than double that in Narayanganj (2.5%) and Gazipur (3%). Narayanganj Sadar (0.4 and 0.83) and Savar (0.5 and 1) had the lowest numbers of doctors (PDs) and community clinics (CCs) per 1000 people. However, Dohar (4.8) and Nawabganj (6.1) in Dhaka have the highest numbers of doctors, while Kaliganj in Gazipur has the most clinics. Most subdistricts, including Gazipur Sadar, have around 0.94 doctors per 1000 people.

4.3.6. Climate Dimension of WVI

Figure 11 shows the climate dimension of the WVI. The map indicates that the entire Gazipur District, including Kaliganj (0.371) and Gazipur Sadar (0.371), is highly climate-vulnerable. Similarly, Uttar Khan (0.38) in Dhaka, which borders the Tongi textile hub and Savar (0.317), shows high vulnerability. The DRK indicator shows that the subdistricts Uttar Khan, Dakshinkhan, Kaliganj, Gazipur Sadar, and Savar have the highest risks of extensive drought during monsoon seasons, while the DRR indicator shows that the Gazipur Sadar, Kaliakair, Kaliganj, Turag, Uttar Khan, and Savar subdistricts are at high risk of extensive drought during dry seasons. In addition, the IRF indicator illustrates that Dohar (97%), Keraniganj (34%), and Savar (10%), located near the Dhaleswari River, and Narayanganj Sadar (15%), located near the Shitalakshya River, have a high percentage of area exposed to extensive river flooding. Taken together, the climate dimension indicates that the textile hub areas of Kaligangj, Gazipur, and Savar are more climate-vulnerable than other subdistricts presented on the map. Climate and water vulnerability are closely linked, as climate impacts floods and droughts, worsens water scarcity and quality, and makes people more vulnerable to water-related challenges.

4.3.7. WVI

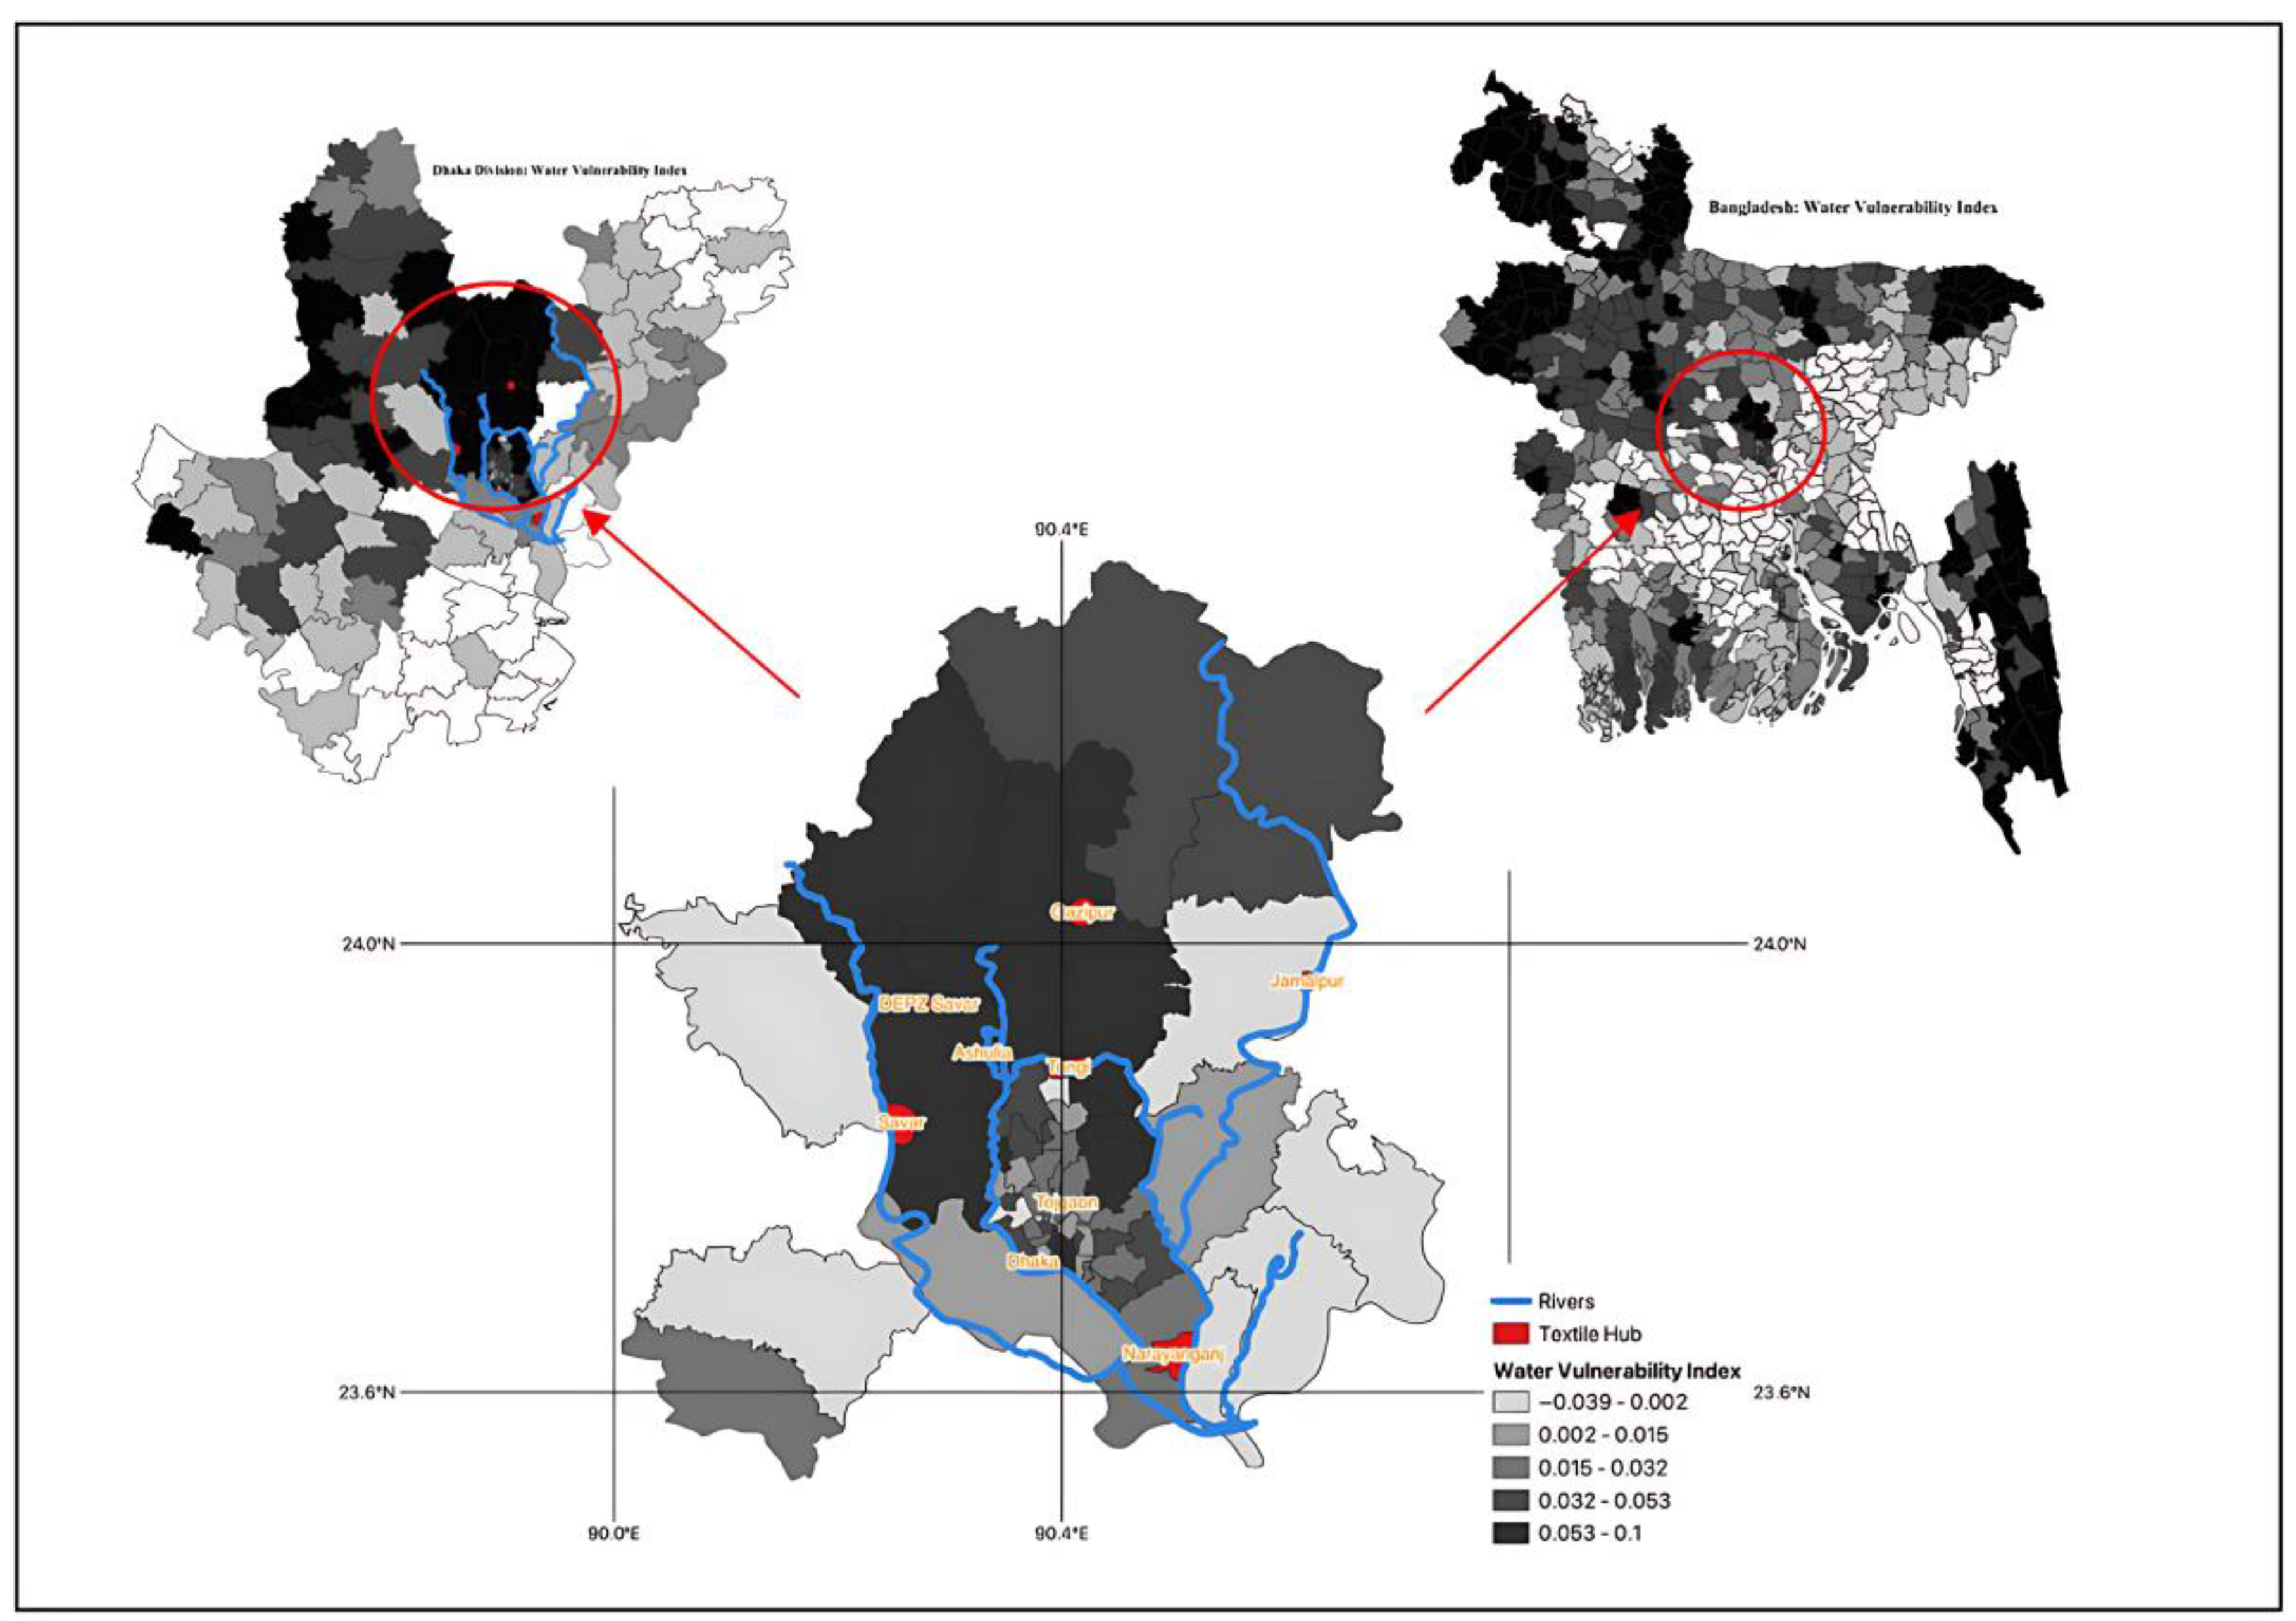
The WVI results combine the values of all six dimensions and are visualized in Figure 12 and Table S1. The main map covers Gazipur, Dhaka, and Narayanganj Districts, including the textile dye hubs and the rivers of interest. These three districts comprise 57 subdistricts (Upazilas), in which Gazipur Sadar (0.10) and Kaliakair (0.078) in Gazipur are the most water-vulnerable, followed by Dakshinkhan (0.072), Uttar Khan (0.071), Kotwali (0.062), and Savar (0.061) in Dhaka. Gazipur Sadar hosts Gazipur and Tongi textile hubs and has the highest water vulnerability. In addition, the Dakshinkhan and Uttar Khan subdistricts border the Tongi textile hub and are situated near the Tongi Khal River. Savar subdistrict encompasses the Dhaleswari and Turag Rivers and features multiple textile hubs, including Savar, DEPZ, and Ashulia. The Dhaka Export Processing Zone (DEPZ) was established in 1993 and is 35 km from Dhaka’s city center [73]. As a result, the map shows that Gazipur and parts of Dhaka have a higher level of water vulnerability compared to Narayanganj District. On the contrary, the subdistricts Kaliganj (−0.039) in Gazipur, Nawabganj (−0.037), and Dhamrai (−0.014) in Dhaka, as well as Sonargaon (−0.017), Araihazar (−0.011), and Bandar (−0.008) in Narayanganj, show the lowest levels of water vulnerability on the map.
As shown in Table S1, the vulnerability levels change when disaggregated by each dimension and show that subdistricts with the highest overall vulnerability are not necessarily the most vulnerable within each dimension. For instance, within demographics, Bangshal (0.50), Kotwali (0.32), Savar (0.28), and Sadar (0.26) demonstrate high vulnerability. The socioeconomic dimension highlights heightened vulnerability within Tejgaon Ind. Area (0.317), Paltan (0.324), and Shahbagh (0.374) in Dhaka, as well as in Kaliganj (0.250), home to the Jamalpur textile area. On the gender dimension, Gazipur (−0.1544), followed by Dhaka (−0.263), and then Narayanganj (−0.312), have the most elevated vulnerability. Central Dhaka has the most WASH-vulnerable subdistricts, including Shah Ali (−0.110), Kotwali (−0.130), and Tejgaon Ind. Area (−0.166). Savar (0.1628) has the highest health vulnerability, followed by Kotwali (0.156) and Tejgaon Ind. Area (0.156). Finally, the results indicate that Savar, Gazipur Sadar, Kaliganj, Uttar Khan, and Dakshinkhan are the most climate-vulnerable subdistricts and are known for their textile dye production.

5. Discussion

5.1. River Pollution, Water Insecurity, and Water Vulnerability Index

Textile dye production relies on significant amounts of clean water and toxic chemicals, which impact local water resources and are, therefore, found to be a major driver of water-related challenges. This paper reveals that the quality and quantity of the existing water resources in Dhaka, Gazipur, and Narayanganj are increasingly scarce and highly polluted. The average BOD, COD, and DO levels indicate moderate-to-high pollution across observation sites (Figure 4). This suggests elevated levels of organic and chemical pollution in the rivers analyzed, affecting ecosystems and communities that depend on these rivers. The Balu River exhibits the highest levels of pollution, characterized by the lowest DO and the highest BOD and COD levels (Figure 4). The Buriganga, Turag, and Shitalakhya Rivers also show high pollution, while the Dhaleswari River shows safe-to-moderate pollution (Figure 4). These results confirm the findings in existing studies, which reveal that these rivers are heavily polluted by anthropogenic activity [14,34,35,36,41,42]. As a result, the high level of river pollution in Dhaka, Gazipur, and Narayanganj renders the water unsuitable for basic uses, including domestic consumption, drinking, fishing, irrigation, and industrial purposes.
Although textile dye production in these areas has contributed to robust economic growth, not every community and subdistrict is benefiting from this trend [10]. As shown in Figure 5, this study identifies central Dhaka as the most water-insecure area in Bangladesh, with some subdistricts showing that only 17% have access to basic drinking water. The findings indicate that access to basic drinking water in Dhaka, Gazipur, and Narayanganj is below the national average. Notably, only 0.7% of New Market has access to basic drinking water, contrasting with the 96% access rate in the Nawabganj subdistrict (Figure 5). This shows high water inequality across Bangladesh and within Dhaka District. In Gazipur Sadar, which includes the Tongi and Gazipur textile hubs, 38.9% of the population has access to basic drinking water, which increases to 66.9% in Savar, with both below the national average. This suggests that existing clean water resources may be prioritized for industry use over domestic needs and that the textile dye industry significantly contributes to water insecurity in the region due to substantial pollution of rivers and groundwater depletion [10].
The ability to cope with water-related challenges is determined by many factors, including demographics, socioeconomics, health, WASH, gender, and climate change. The WVI illustrates that vulnerability fluctuates across subdistricts and dimensions. Figure 12 shows that Gazipur Sadar has the highest water vulnerability levels within Dhaka Division, with a combined WVI score of 0.1. However, this subdistrict scores only moderately high on demographic (0.256), gender (−0.154), socioeconomic (0.25), health (0.134), WASH (−0.25), and climate (0.37) vulnerability (see Table S1). This suggests that no single dimension is critical, but a combination of factors contributes to overall water vulnerability. Dakshinkhan (0.072) and Uttar Khan (0.071) near the Tongi Textile Cluster and Tongi-Khal River also show a high risk of water vulnerability. Like Gazipur Sadar, these subdistricts scored above average across the six dimensions, while only Dakshinkhan showed very high WASH vulnerability levels. Savar (0.061) in Dhaka, home to many textile dye industries and situated between the Turag and the Dhaleswari River, also exhibits significant water vulnerability. This is influenced by having the second-highest health vulnerability levels. In contrast, Kaliganj (−0.039) in Gazipur and Nawabganj (−0.037) and Dhamrai (−0.014) in Dhaka, as well as Araihazar (−0.011) and Bandar (−0.008) in Narayanganj, have among the lowest levels of water vulnerability. As a result, while Gazipur and parts of Dhaka are found to be at the highest risk of water vulnerability, Narayanganj District exhibits the lowest overall risk. Taken together, when disaggregating by vulnerability dimensions, the findings indicate that lowering water vulnerability cannot be resolved through a singular solution but instead demands multi-faceted responses that address several factors at once.
Given the range of chemicals used in textile dye production and the limited data available, there is a need to observe a broader range of water quality indicators, including synthetic dyes, heavy metals, microplastics, and PFAS concentrations. This will enable a more direct and statistical assessment of the impact of textile dye on water quality. Similarly, large-scale water quality observations across subdistricts would allow future WVIs to include a water quality dimension. These techniques could be applied in other South Asian countries or to countries such as China with high levels of textile dye production [12].

5.2. Policy Recommendations

The primary benefit of the WVI under the MDVA approach is to support the identification of the most vulnerable areas and inform targeted policy responses. To reduce water pollution, minimize inequalities of water access across subdistricts, and strengthen communities’ resilience to cope with future water challenges in Dhaka, this paper proposes the following recommendations: Based on the spatial distribution of water pollution and insecurity outlined in this paper, stricter pollution limits and more frequent monitoring and enforcement could be imposed in high-risk areas around textile dye clusters, such as Savar, Gazipur, and central Dhaka. The introduction of Pollution Control Priority Areas (PCPAs) around the Buriganga, Balu, Shitalakhya, and Turag-Tongi Khal Rivers would safeguard citizens’ health and well-being. Within these zones, stricter pollution standards, mandatory monitoring, and targeted enforcement actions could be implemented to optimize the allocation of governments’ regulatory and financial resources. In addition, given that clean water is scarce and declining, this paper proposes a pro-poor water allocation model where the most water-vulnerable and water-insecure subdistricts are prioritized.
The PCPAs can be supported by a tiered pricing system where water use beyond a certain amount is charged at a higher rate, which would target industry use and improve water efficiency while ensuring that local communities are not overcharged for domestic water use. The revenues generated could be used for water infrastructure and WASH facilities in areas like the Tejgaon Ind. Area in Dhaka due to its high water scarcity and SE vulnerability. In addition, to tackle vulnerability across subdistricts, the WVI highlights the need for more targeted investments in Gazipur Sadar, Dakshinkhan, and Uttar Khan, among others. It also shows that vulnerabilities differentiate across dimensions within each subdistrict, and efforts in each subdistrict should be tailored to dimensions with the highest vulnerability levels, as shown in Table S1.
However, improving the quality and quantity of water resources in Dhaka will demand various policy interventions, including chemical regulations in textile dye production to minimize pollution. Given that the textile supply chains operate globally, more international efforts are needed to monitor, regulate, and ban toxic chemicals to improve the quality and quantity of local water resources around production sites. The Bangladesh Government has introduced several attempts to minimize industrial pollution and protect the natural resources that producers depend on for their continued operation and existence. The Bangladesh Environment Conservation Act 1995 mandated measures to regulate discharge and promote safer waste disposal [74]. In 2009, the Department of Environment declared Dhaka’s rivers ecologically critical [14]. A decade later, the High Court of Bangladesh ruled that these rivers are “legal entities” with similar rights to living things [14]. Despite these efforts to minimize pollution and protect water resources, the issue remains critical and unresolved, which underscores the need for both global, national, and local policy efforts. Therefore, further research on how anthropogenic pollution impacts various aspects of vulnerability in Dhaka could be explored to reveal the local impact of global textile supply chains and support the need for stronger international action. More water quality data and pollution monitoring are needed across subdistricts beyond the conventional measures used in this study to assess multidimensional water vulnerability adequately. Currently, limited synthetic dyes, PFASs, and microplastics, among others, remain to be assessed in Dhaka.

6. Conclusions

Textile dye factories are concentrated in Dhaka, Gazipur, and Narayanganj. Due to their high use of clean water and chemicals, these factories contribute to river pollution and groundwater depletion. Based on data from Bangladesh’s Department of Environment, this paper finds that four of the five rivers are highly polluted. Balu River has the highest pollution, with the lowest DO concentration and the highest BOD and COD levels. Buriganga, Turag-Tongi Khal, and Shitalakhya Rivers were also highly polluted. By contrast, the Dhaleswari River has the lowest pollution level, with safe DO levels across four out of five observations, as well as BOD and COD levels within safe-to-moderate pollution levels across all sites. In addition, this paper evaluates access to basic drinking water and finds significant disparities across Bangladesh and within Dhaka Division. The results show that access to basic drinking water within many Dhaka, Gazipur, and Narayanganj subdistricts is below the national average. For instance, in Gazipur Sadar, which includes the Tongi and Gazipur textile hubs, 38.9% of the population has access to basic drinking water, which increases to 66.9% in Savar. In addition, this study identifies central Dhaka as the most water-insecure part of Bangladesh and the most densely populated, with many subdistricts only showing 17% having access to basic drinking water. Subdistricts with textile dye production show high water insecurity, which may suggest that existing clean water resources are prioritized for industry use over domestic needs.
After assessing water-related challenges in the study area, this paper developed and mapped a WVI based on six dimensions—demographics, socioeconomics, gender, WASH, health, and climate—including 25 indicators from the INFORM Risk Index. As many factors shape the ability to cope with water challenges, this helps identify which subdistricts are more vulnerable and which drivers contribute to this vulnerability. Gazipur Sadar has the highest water vulnerability within Dhaka Division, with a combined WVI score of 0.1. Dakshinkhan (0.072) and Uttar Khan (0.071) near the Tongi Textile Cluster and Tongi-Khal River also show a high risk of water vulnerability. Savar (0.061) in Dhaka, home to textile dye industries and situated between the Turag and Dhaleswari Rivers, also exhibits significant water vulnerability. When disaggregated, no single dimension was found to be critical within the most vulnerable subdistricts. Rather, a combination of factors collectively contributes to water vulnerability in these areas.
Taken together, this paper finds that four out of five of the main rivers are experiencing high water pollution, that there is high water inequality across Dhaka, Gazipur, and Narayanganj’s subdistricts, and that many subdistricts in central Dhaka are extremely water-insecure as well as being densely populated. Lastly, this paper highlights that Gazipur Sadar is the most at-risk subdistrict for water vulnerability and that all subdistricts known for their textile production face higher risks of water insecurity and vulnerability than Dhaka Division’s surrounding subdistricts. As a result, more policy efforts are needed to minimize anthropogenic pollution in Dhaka, Gazipur, and Narayanganj while strengthening resilience in the most vulnerable subdistricts.

Supplementary Materials

The following supporting information can be downloaded at: https://www.mdpi.com/article/10.3390/w17162475/s1, Table S1: WVI normalized values by dimension and subdistrict.

Author Contributions

K.H.R.: conceptualization, investigation, methodology, analysis, visualization, writing—original draft, writing—review and editing; M.D.S.: conceptualization, supervision, writing—review and editing; K.G.: review and verification. All authors have read and agreed to the published version of the manuscript.

Funding

This research received no external funding.

Data Availability Statement

Data will be available upon request.

Acknowledgments

The authors of this paper would like to acknowledge the Department of Environment (2023) in Bangladesh and the EU Commission’s INFORM Subnational Data (2022) for providing the necessary data to conduct this study. The authors would also like to express their gratitude to the Otsuka Toshimi Foundation for scholarship support and the review committee for their valuable guidance and feedback throughout this process.

Conflicts of Interest

The authors would like to declare that there have been no conflicts of interest that would have influenced this research.

References

  1. IPCC. Climate Change 2022—Impacts, Adaptation and Vulnerability. In Summary for Policymakers; Pörtner, H.-O., Roberts, D.C., Poloczanska, E.S., Mintenbeck, K., Tignor, M., Alegría, A., Craig, M., Langsdorf, S., Löschke, S., Möller, V., et al., Eds.; Cambridge University Press: Cambridge, UK, 2023; pp. 3–34. [Google Scholar]
  2. Ramli, M.W.A.; Alias, N.E.; Yusof, H.M.; Yusop, Z.; Taib, S.M.; Wahab, Y.F.A.; Hassan, S.A. Spatial multidimensional vulnerability assessment index in urban area—A case study Selangor, Malaysia. Prog. Disaster Sci. 2023, 20, 100296. [Google Scholar] [CrossRef]
  3. Whitehead, P.G.; Bussi, G.; Peters, R.; Hossain, M.A.; Softley, L.; Shawal, S.; Jin, L.; Rampley, C.P.N.; Holdship, P.; Hope, R.; et al. Modelling heavy metals in the Buriganga River System, Dhaka, Bangladesh: Impacts of tannery pollution control. Sci. Total Environ. 2019, 697, 134090. [Google Scholar] [CrossRef] [PubMed]
  4. Uddin, M.d.J.; Jeong, Y.K. Urban river pollution in Bangladesh during last 40 years: Potential public health and ecological risk, present policy, and future prospects toward smart water management. Heliyon 2021, 7, e06107. [Google Scholar] [CrossRef] [PubMed]
  5. MacAlister, C.; Baggio, G.; Perera, D.; Qadir, M.; Taing, L.; Smakhtin, V. Global Water Security 2023 Assessment. 2023. UNU-INWEH. Available online: https://collections.unu.edu/eserv/UNU:9107/n23-116_UNU_Water_Security_WEB_Final_updated.pdf (accessed on 31 July 2025).
  6. Persson, L.; Carney Almroth, B.M.; Collins, C.D.; Cornell, S.; de Wit, C.A.; Diamond, M.L.; Fantke, P.; Hassellöv, M.; MacLeod, M.; Ryberg, M.W.; et al. Outside the Safe Operating Space of the Planetary Boundary for Novel Entities. Environ. Sci. Technol. 2022, 56, 1510–1521. [Google Scholar] [CrossRef]
  7. UNEP. Global Chemicals Outlook II: From Legacies to Innovative Solutions: Implementing the 2030 Agenda for Sustainable Development. 2019. Available online: https://wedocs.unep.org/2050011822/34184 (accessed on 3 June 2025).
  8. Shittu, E.; Lakhanpaul, M.; Vigurs, C.; Sarkar, K.; Koch, M.; Parikh, P.; Campos, L.C. A rapid systematic scoping review of research on the impacts of water contaminated by chemicals on very young children. Sci. Total Environ. 2023, 891, 164604. [Google Scholar] [CrossRef]
  9. Richardson, K.; Steffen, W.; Lucht, W.; Bendtsen, J.; Cornell, S.E.; Donges, J.F.; Drüke, M.; Fetzer, I.; Bala, G.; von Bloh, W.; et al. Earth beyond six of nine planetary boundaries. Sci. Adv. 2023, 9, eadh2458. [Google Scholar] [CrossRef]
  10. Uddin, M.A.; Begum, M.S.; Ashraf, M.; Azad, A.K.; Adhikary, A.C.; Hossain, M.S. Water and chemical consumption in the textile processing industry of Bangladesh. PLOS Sustain. Transform. 2023, 2, e0000072. [Google Scholar] [CrossRef]
  11. UNEP. Textile-Producing Nations Unite to Reduce Chemical Waste. 2022. Available online: https://www.unep.org/news-and-stories/press-release/textile-producing-nations-unite-reduce-chemical-waste (accessed on 4 June 2025).
  12. Quantis. Measuring Fashion. Environmental Impact of the Global Apparel and Footwear Industries Study. 2018. Available online: https://quantis.com/wp-content/uploads/2018/03/measuringfashion_globalimpactstudy_full-report_quantis_cwf_2018a.pdf (accessed on 27 May 2025).
  13. OEC. Textiles in Bangladesh. 2025. Available online: https://oec.world/en/profile/bilateral-product/textiles/reporter/bgd?redirect=true (accessed on 28 May 2025).
  14. Hoque, S.F.; Peters, R.; Whitehead, P.; Hope, R.; Hossain, M.A. River pollution and social inequalities in Dhaka, Bangladesh. Environ. Res. Commun. 2021, 3, 095003. [Google Scholar] [CrossRef]
  15. Chakraborty, R.; Ahmad, F. Economical use of water in cotton knit dyeing industries of Bangladesh. J. Clean. Prod. 2022, 340, 130825. [Google Scholar] [CrossRef]
  16. Water Aid. Water. 2025. Available online: https://www.wateraid.org/bd/the-crisis/water (accessed on 2 June 2025).
  17. Kuzma, S.; Bierkens, M.F.P.; Lakshman, S.; Luo, T.; Saccoccia, L.; Sutanudjaja, E.H.; Van Beek, R. Aqueduct 4.0: Updated Decision-Relevant Global Water Risk Indicators; World Resources Institute (WRI): Washington, DC, USA, 2023. [Google Scholar]
  18. OhIsson, L. Water conflicts and social resource scarcity. Phys. Chem. Earth Part B Hydrol. Ocean. Atmos. 2000, 25, 213–220. [Google Scholar] [CrossRef]
  19. El Garouani, M.; Radoine, H.; Lahrach, A.; Oulidi, H.J.; Chaabane, M.S. An integrated and multidimensional approach for analyzing vulnerability of water resources under territorial climate conditions. Environ. Sustain. Indic. 2024, 22, 100383. [Google Scholar] [CrossRef]
  20. Sullivan, C. Calculating a Water Poverty Index. World Dev. 2002, 30, 1195–1210. [Google Scholar] [CrossRef]
  21. Jaren, L.S.; Mondal, M.S. Assessing Water Poverty of Livelihood Groups in Peri-Urban Areas around Dhaka under a Changing Environment. Water 2021, 13, 2674. [Google Scholar] [CrossRef]
  22. Ahsan, A.; Ahmed, T.; Uddin, M.A.; Al-Sulttani, A.O.; Shafiquzzaman, M.; Islam, M.R.; Ahmed, M.S.; Alamin; Mohadesh, M.; Haque, M.N.; et al. Evaluation of Water Quality Index (WQI) in and around Dhaka City Using Groundwater Quality Parameters. Water 2023, 15, 2666. [Google Scholar] [CrossRef]
  23. Hasan, M.; Islam, M.d.A.; Aziz Hasan, M.; Alam, M.d.J.; Peas, M.H. Groundwater vulnerability assessment in Savar upazila of Dhaka district, Bangladesh—A GIS-based DRASTIC modeling. Groundw. Sustain. Dev. 2019, 9, 100220. [Google Scholar] [CrossRef]
  24. Alam, R.; Quayyum, Z.; Moulds, S.; Radia, M.A.; Sara, H.H.; Hasan, M.T.; Butler, A. Dhaka city water logging hazards: Area identification and vulnerability assessment through GIS-remote sensing techniques. Environ. Monit. Assess. 2023, 195, 543. [Google Scholar] [CrossRef] [PubMed]
  25. Chowdhury, K.J.; Ali, M.R.; Chowdhury, M.A.; Islam, S.L.U. Climate change induced risks assessment of a coastal area: A “socioeconomic and livelihood vulnerability index” based study in coastal Bangladesh. Nat. Hazards Res. 2025, 5, 75–87. [Google Scholar] [CrossRef]
  26. Sarkar, S.K.; Das, S.; Rudra, R.R.; Ekram, K.M.M.; Haydar, M.; Alam, E.; Islam, K.; Islam, A.R.M.T. Delineating the drought vulnerability zones in Bangladesh. Sci. Rep. 2024, 14, 25564. [Google Scholar] [CrossRef] [PubMed]
  27. Sarkar, R.; Vogt, J. Drinking water vulnerability in rural coastal areas of Bangladesh during and after natural extreme events. Int. J. Disaster Risk Reduct. 2015, 14, 411–423. [Google Scholar] [CrossRef]
  28. Bangladesh Department of Environment. Surface and Ground Water Quality Report 2023. 2023. Available online: https://doe.portal.gov.bd/sites/default/files/files/doe.portal.gov.bd/publications/edc0f4f2_8346_4f58_bdd1_72978984ba3e/2024-08-27-08-00-a698975451058b1fc83366d454942747.pdf (accessed on 25 May 2025).
  29. European Commission DRMKC—INFORM. Bangladesh: INFORM Subnational Model of Bangladesh. 2024. Available online: https://drmkc.jrc.ec.europa.eu/inform-index/INFORM-Subnational-Risk/Bangladesh (accessed on 16 May 2025).
  30. Dutta, S.; Adhikary, S.; Bhattacharya, S.; Roy, D.; Chatterjee, S.; Chakraborty, A.; Banerjee, D.; Ganguly, A.; Nanda, S.; Rajak, P. Contamination of textile dyes in aquatic environment: Adverse impacts on aquatic ecosystem and human health, and its management using bioremediation. J. Environ. Manag. 2024, 353, 120103. [Google Scholar] [CrossRef]
  31. Al-Tohamy, R.; Ali, S.S.; Li, F.; Okasha, K.M.; Mahmoud, Y.A.G.; Elsamahy, T.; Jiao, H.; Fu, Y.; Sun, J. A critical review on the treatment of dye-containing wastewater: Ecotoxicological and health concerns of textile dyes and possible remediation approaches for environmental safety. Ecotoxicol. Environ. Saf. 2022, 231, 113160. [Google Scholar] [CrossRef] [PubMed]
  32. Islam, T.; Repon, M.R.; Islam, T.; Sarwar, Z.; Rahman, M.M. Impact of textile dyes on health and ecosystem: A review of structure, causes, and potential solutions. Environ. Sci. Pollut. Res. 2023, 30, 9207–9242. [Google Scholar] [CrossRef] [PubMed]
  33. Sharma, J.; Sharma, S.; Soni, V. Classification and impact of synthetic textile dyes on Aquatic Flora: A review. Reg. Stud. Mar. Sci. 2021, 45, 101802. [Google Scholar] [CrossRef]
  34. Hossen, M.d.A.; Mostafa, M.G. Assessment of heavy metal pollution in surface water of Bangladesh. Environ. Chall. 2023, 13, 100783. [Google Scholar] [CrossRef]
  35. Uddin, M.; Alam, F.B. Health risk assessment of the heavy metals at wastewater discharge points of textile industries in Tongi, Shitalakkhya, and Dhaleshwari, Bangladesh. J. Water Health 2023, 21, 586–600. [Google Scholar] [CrossRef] [PubMed]
  36. Uddin, M.; Kormoker, T.; Siddique, M.d.A.B.; Billah, M.M.; Rokonuzzaman, M.; Al Ragib, A.; Proshad, R.; Hossain, Y.; Haque, K.; Ibrahim, K.A.; et al. An overview on water quality, pollution sources, and associated ecological and human health concerns of the lake water of megacity: A case study on Dhaka city lakes in Bangladesh. Urban Water J. 2023, 20, 261–277. [Google Scholar] [CrossRef]
  37. Yaseen, D.A.; Scholz, M. Textile dye wastewater characteristics and constituents of synthetic effluents: A critical review. Int. J. Environ. Sci. Technol. 2019, 16, 1193–1226. [Google Scholar] [CrossRef]
  38. Shindhal, T.; Rakholiya, P.; Varjani, S.; Pandey, A.; Ngo, H.H.; Guo, W.; Yong, H.; Taherzadeh, M.J. A critical review on advances in the practices and perspectives for the treatment of dye industry wastewater. Bioengineered 2021, 12, 70–87. [Google Scholar] [CrossRef]
  39. Mehra, S.; Singh, M.; Chadha, P. Adverse impact of textile dyes on the aquatic environment as well as on human beings. Toxicol. Int. 2021, 28, 165–176. [Google Scholar] [CrossRef]
  40. Morales-McDevitt, M.E.; Dunn, M.; Habib, A.; Vojta, S.; Becanova, J.; Lohmann, R. Poly- and Perfluorinated Alkyl Substances in Air and Water from Dhaka, Bangladesh. Environ. Toxicol. Chem. 2022, 41, 334–342. [Google Scholar] [CrossRef]
  41. Hossain, L.; Sarker, S.K.; Khan, M.S. Evaluation of present and future wastewater impacts of textile dyeing industries in Bangladesh. Environ. Dev. 2018, 26, 23–33. [Google Scholar] [CrossRef]
  42. Lellis, B.; Fávaro-Polonio, C.Z.; Pamphile, J.A.; Polonio, J.C. Effects of textile dyes on health and the environment and bioremediation potential of living organisms. Biotechnol. Res. Innov. 2019, 3, 275–290. [Google Scholar] [CrossRef]
  43. Nahar, N.; Haque, M.d.S.; Haque, S.E. Groundwater conservation, and recycling and reuse of textile wastewater in a denim industry of Bangladesh. Water Resour. Ind. 2024, 31, 100249. [Google Scholar] [CrossRef]
  44. Shamsuzzaman, M.; Kashem, M.d.A.; Muhammad Sayem, A.S.; Khan, A.M.; Shamsuddin, S.M.d.; Islam, M.M. Quantifying environmental sustainability of denim garments washing factories through effluent analysis: A case study in Bangladesh. J. Clean. Prod. 2021, 290, 125740. [Google Scholar] [CrossRef]
  45. Hussain, T.; Wahab, A. A critical review of the current water conservation practices in textile wet processing. J. Clean. Prod. 2018, 198, 806–819. [Google Scholar] [CrossRef]
  46. Rashid, H.; Rahman, M.; Rahman, M.; Talha, M. Determination of Water Quality Beside the Industrial Area of Turag River in Dhaka, Bangladesh. 2024. Available online: https://eartharxiv.org/repository/view/8019/ (accessed on 30 July 2025).
  47. Yin, H.; Islam, M.S.; Ju, M. Urban river pollution in the densely populated city of Dhaka, Bangladesh: Big picture and rehabilitation experience from other developing countries. J. Clean. Prod. 2021, 321, 129040. [Google Scholar] [CrossRef]
  48. Khan, W.U.; Ahmed, S.; Dhoble, Y.; Madhav, S. A critical review of hazardous waste generation from textile industries and associated ecological impacts. J. Indian Chem. Soc. 2023, 100, 100829. [Google Scholar] [CrossRef]
  49. Palacios-Mateo, C.; van der Meer, Y.; Seide, G. Analysis of the polyester clothing value chain to identify key intervention points for sustainability. Environ. Sci. Eur. 2021, 33, 2. [Google Scholar] [CrossRef] [PubMed]
  50. Sarkar, A. Minimalonomics: A novel economic model to address environmental sustainability and earth’s carrying capacity. J. Clean. Prod. 2022, 371, 133663. [Google Scholar] [CrossRef]
  51. Quattri, M.; Watkins, K. Child labour and education—A survey of slum settlements in Dhaka (Bangladesh). World Dev. Perspect. 2019, 13, 50–66. [Google Scholar] [CrossRef]
  52. International Labour Organization (ILO). Vulnerabilities to Child Labour. 2022. Available online: https://www.ilo.org/sites/default/files/wcmsp5/groups/public/%40ed_norm/%40ipec/documents/publication/wcms_845129.pdf (accessed on 1 August 2025).
  53. Caleo, G.; Sadique, S.; Yuce, D.; Dada, M.; Benvenuti, B.; Joseph, J.; Malden, D.; Velivela, K.; Chowdhury, S.M.; Mayienga, C.; et al. A Public health wound: Health and work among children engaged in the worst forms of child labour in the informal sector in Dhaka, Bangladesh: A retrospective analysis of Médecins Sans Frontières occupational health data from 2014 to 2023. BMC Public Health 2025, 25, 1420. [Google Scholar] [CrossRef] [PubMed]
  54. Chowdhury, M.d.A.; Nowreen, S.; Tarin, N.J.; Hasan, M.d.R.; Zzaman, R.U.; Amatullah, N.I. WASH and MHM experiences of disabled females living in Dhaka slums of Bangladesh. J. Water Sanit. Hyg. Dev. 2022, 12, 683–697. [Google Scholar] [CrossRef]
  55. Intesar, A.; Parvez, M.S. Living with vulnerability: Triple burden through the eyes of urban slum women in Bangladesh. Soc. Sci. Humanit. Open 2024, 10, 101014. [Google Scholar] [CrossRef]
  56. Gibbs, A.; Jewkes, R.; Willan, S.; Al Mamun, M.; Parvin, K.; Yu, M.; Naved, R. Workplace violence in Bangladesh’s garment industry. Soc. Sci. Med. 2019, 235, 112383. [Google Scholar] [CrossRef]
  57. Hossain, M.; Asadullah, M.N.; Kambhampati, U. Empowerment and life satisfaction: Evidence from Bangladesh. World Dev. 2019, 122, 170–183. [Google Scholar] [CrossRef]
  58. Brouwer, R.; Sharmin, D.F.; Elliott, S.; Liu, J.; Khan, M.R. Costs and benefits of improving water and sanitation in slums and non-slum neighborhoods in Dhaka, a fast-growing mega-city. Ecol. Econ. 2023, 207, 107763. [Google Scholar] [CrossRef]
  59. Cole, S.; Tallman, P.; Salmon-Mulanovich, G.; Rusyidi, B. Water insecurity is associated with gender-based violence: A mixed-methods study in Indonesia. Soc. Sci. Med. 2024, 344, 116507. [Google Scholar] [CrossRef]
  60. Kayser, G.; Rao, N.; Jose, R.; Raj, A. Water, sanitation and hygiene: Measuring gender equality and empowerment. Bull. World Health Organ. 2019, 97, 438–440. [Google Scholar] [CrossRef]
  61. Cope, M.; Elwood, S. Qualitative GIS: A Mixed Methods Approach; SAGE: Chatswood, Australia, 2009. [Google Scholar]
  62. Rucks-Ahidiana, Z.; Bierbaum, A.H. Qualitative Spaces: Integrating Spatial Analysis for a Mixed Methods Approach. Int. J. Qual. Methods 2015, 14, 92–103. [Google Scholar] [CrossRef]
  63. Sakamoto, M.; Ahmed, T.; Begum, S.; Huq, H. Water Pollution and the Textile Industry in Bangladesh: Flawed Corporate Practices or Restrictive Opportunities? Sustainability 2019, 11, 1951. [Google Scholar] [CrossRef]
  64. UN Women. State of Gender Equality and Climate Change in Bangladesh. 2023. Available online: https://asiapacific.unwomen.org/sites/default/files/2023-06/final-bangladesh-brief-for-policymakers-022022b319.pdf (accessed on 31 July 2025).
  65. UN Women. From Commodity to Common Good: A Feminist Agenda to Tackle the World’s Water Crisis. 2023. Available online: https://www.unwomen.org/sites/default/files/2023-07/from-commodity-to-common-good-a-feminist-agenda-to-tackle-the-worlds-water-crisis-en.pdf (accessed on 31 July 2025).
  66. Al-Mamun, M.d.; Kalam, A.; Karim, M.d.Z.; Alam, M.; Khan, T.H. Menstrual hygiene management in flood-affected Bangladesh: Addressing socio-cultural barriers, infrastructure gaps, and policy responses. Front. Public Health 2025, 13, 1538447. [Google Scholar] [CrossRef] [PubMed]
  67. Mou, S.N. Women’s Empowerment through Higher Education and Employment in Bangladesh. J. Gend. Cult. Soc. 2024, 4, 39–66. [Google Scholar]
  68. Hussein, S. Reconciling industrialization and environmental protection for sustainable development in Bangladesh: The textile and apparel industry case. Eur. J. Sustain. Dev. Res. 2024, 8, em0245. [Google Scholar] [CrossRef] [PubMed]
  69. UNICEF. A Third of the World’s Children Poisoned by Lead, Bangladesh Fourth Most Seriously Hit in Terms of Number of Children Affected. 2020. Available online: https://www.unicef.org/bangladesh/en/press-releases/third-worlds-children-poisoned-lead-bangladesh-fourth-most-seriously-hit-terms (accessed on 2 June 2025).
  70. UNICEF. Triple Threat: How Disease, Climate Risks, and Unsafe Water, Sanitation and Hygiene Create a Deadly Combination for Children. 2023. Available online: https://www.unicef.org/media/137206/file/triple-threat-wash-EN.pdf (accessed on 4 June 2025).
  71. Liang, J.; Ning, X.-A.; Sun, J.; Song, J.; Lu, J.; Cai, H.; Hong, Y. Toxicity evaluation of textile dyeing effluent and its possible relationship with chemical oxygen demand. Ecotoxicol. Environ. Saf. 2018, 166, 56–62. [Google Scholar] [CrossRef] [PubMed]
  72. Water.org. Bangladesh’s Water and Sanitation Crisis. 2023. Available online: https://water.org/our-impact/where-we-work/bangladesh/ (accessed on 24 May 2025).
  73. BEPZA. About BEPZA. 2025. Available online: https://www.bepza.gov.bd/ (accessed on 30 May 2025).
  74. Bangladesh Government. The Bangladesh Environment Conservation Act. 1995. Available online: https://bangladeshbiosafety.org/wp-content/uploads/2017/05/Bangladesh_Environmental_Conservation_Act_1995.pdf (accessed on 26 May 2025).
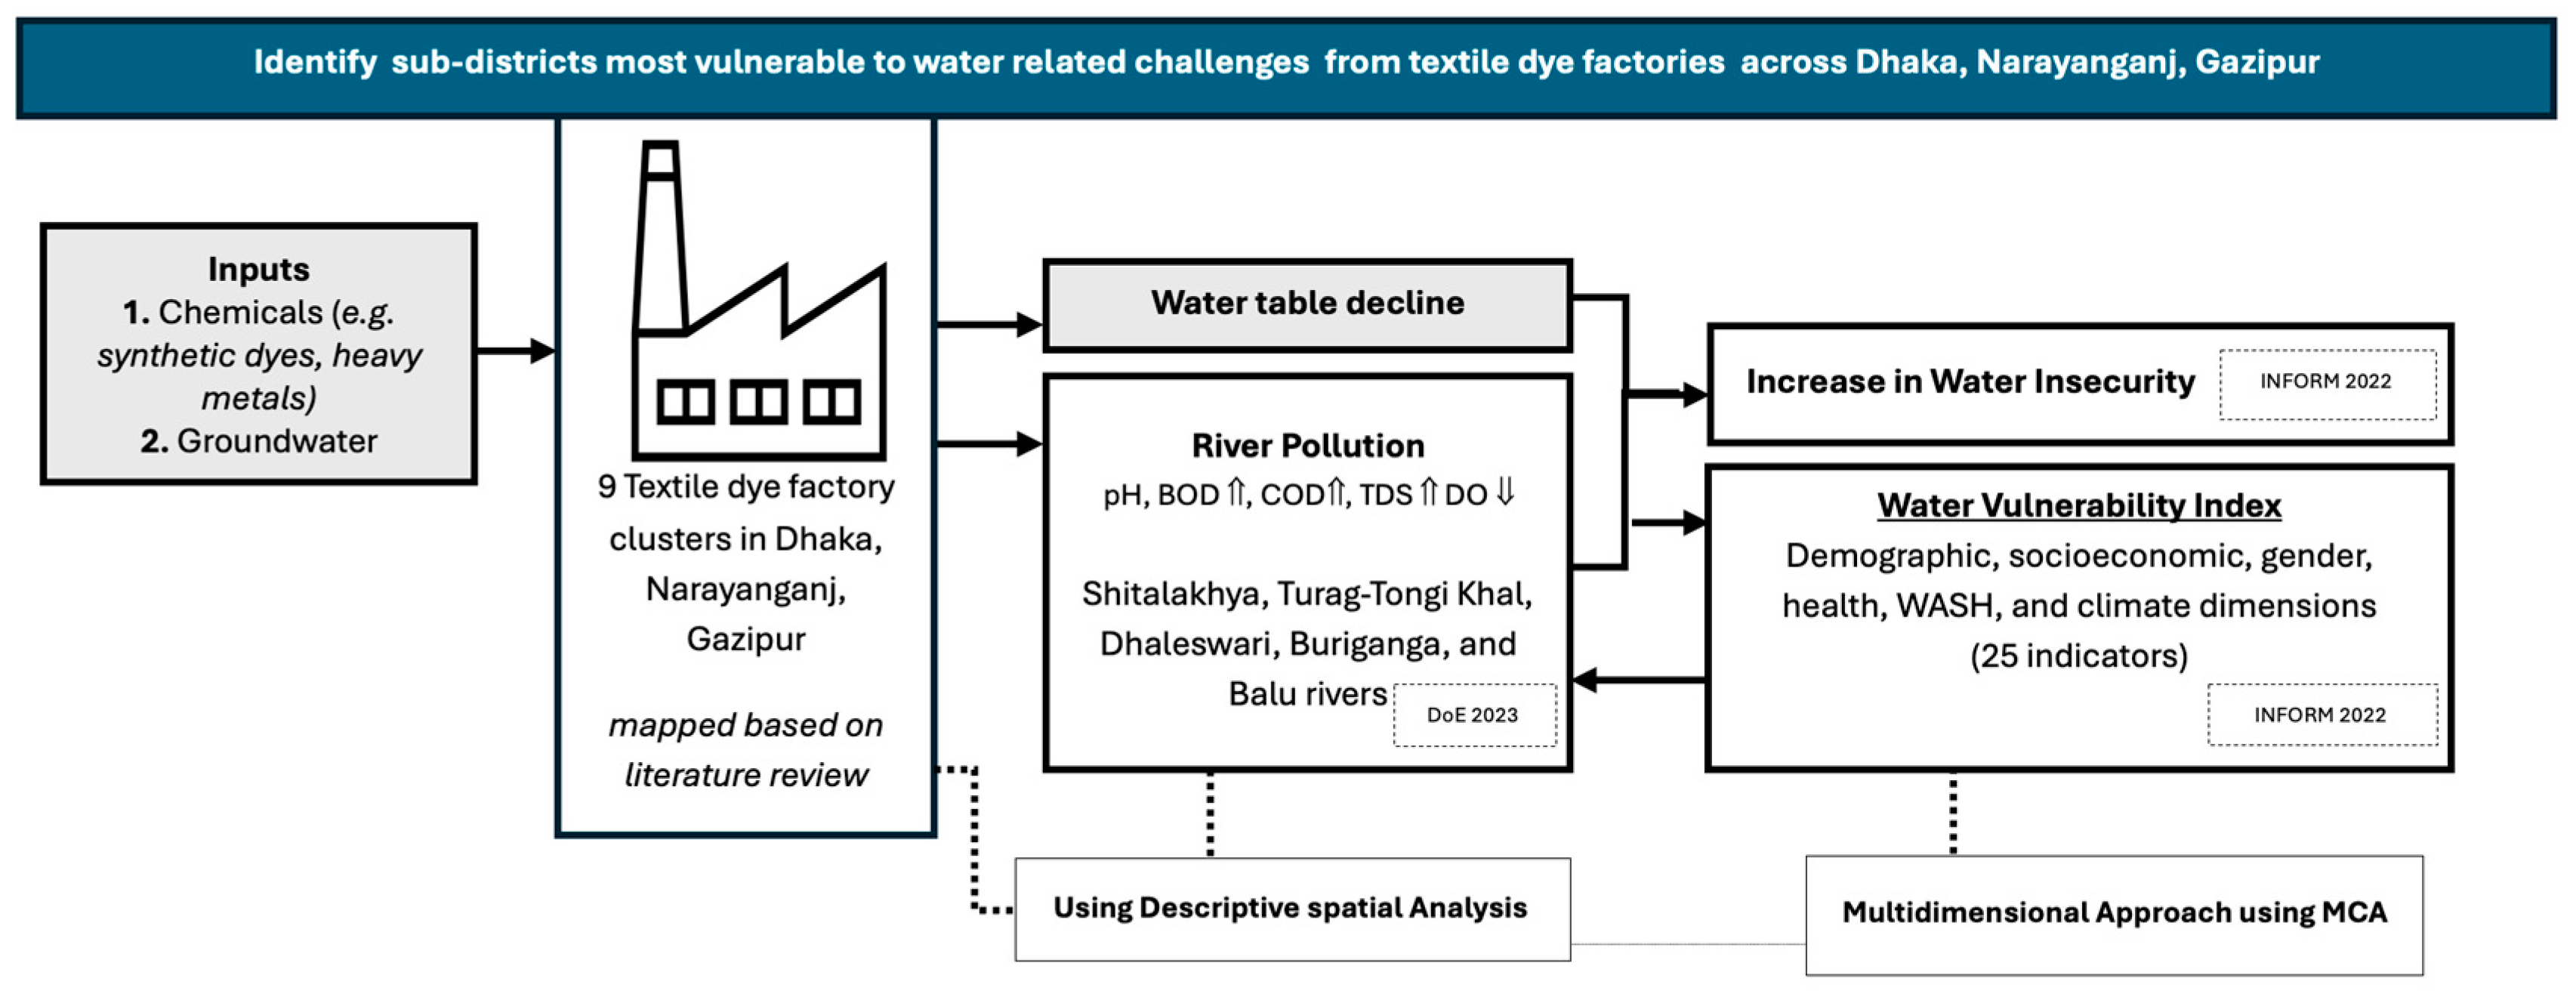
Figure 1. Conceptual framework.
Water 17 02475 g001
Figure 2. River quality observation sites in Dhaka, Gazipur, and Narayanganj.
Water 17 02475 g002
Figure 3. Study area, rivers, sub-districts, and textile clusters.
Water 17 02475 g003
Figure 4. DO, BOD, COD, TDS, and pH Levels in Shitalakhya, Turag, Buriganga, Dhaleswari, and Balu Rivers.
Water 17 02475 g004
Figure 5. Access to basic drinking water across Bangladesh (1), central area of Bangladesh (2), Dhaka, Gazipur, and Narayanganj (3).
Water 17 02475 g005
Figure 6. Demographic dimension of Dhaka, Gazipur, and Narayanganj.
Water 17 02475 g006
Figure 7. Socioeconomic dimension of Dhaka, Gazipur, and Narayanganj.
Water 17 02475 g007
Figure 8. Gender dimension of Dhaka, Gazipur, and Narayanganj.
Water 17 02475 g008
Figure 9. WASH dimension of Dhaka, Gazipur, and Narayanganj.
Water 17 02475 g009
Figure 10. Health dimension of Dhaka, Gazipur, and Narayanganj.
Water 17 02475 g010
Figure 11. Climate dimension of Dhaka, Gazipur, and Narayanganj.
Water 17 02475 g011
Figure 12. Water Vulnerability Index results of Dhaka and Bangladesh.
Water 17 02475 g012
Table 1. Standard water quality classifications [28].
SafeModerate PollutionHigh Pollution
pH6.5–8.5Higher or lower than 6.5–8.5
DOAbove 6 mg/L6–4 mg/L<4 mg/L
COD<25 mg/L25–50 mg/L>50 mg/L
BOD<3 mg/L3–6 mg/L>6 mg/L
TDS<500 mg/L500–1000 mg/L>1000 mg/L
Table 2. Water Vulnerability Index (↑ increases vulnerability and ↓ decreases vulnerability).
NoIndicator Measurement/DefinitionSource/Year
Demographics1Population DensityPopulation/km2BBS 2021
2Population Living in SlumsThe percentage (%) of urban dwellers living in slums ↑BBS 2014
3Urban Population GrowthAnnual % of urban population growth ↑BBS 2011-21
4Woman-head household% of women-headed households ↑BBS 2021
Socioeconomics5Income inequalityThe ratio of the Gini from the income distribution ↑BBS 2020
6Poverty% of poor households ↑BBS, WB 2017
7Unsustainable Livelihood% of population who live on unsustainable livelihood (Agri and non-Agri day labor) ↑BBS-HIES 2016
8Unemployment RateA portion of the workforce is not employed ↑LFS-BBS 2022
9Child Labor % of children 5–17 years involved in child labor ↑MICS, 2019
10Floating Population% of the population with no permanent home ↑BBS, 2021
Gender 11Domestic Violence Attitude% of women’s (15–49) attitudes towards domestic violence ↑BBS 2019
12/13Gender Parity Index (GPI) for Secondary SchoolNet attendance for girls divided by net attendance for boys (secondary school) ↓MICS-BBS and UNICEF 2022
14Menstrual Hygiene % of women aged 15 to 49 years of the total population ↓MICS 2019
WASH15Basic Sanitation Services% of population using basic sanitation services ↓WHO and UNICEF 2019
16Water insecurity% of people having access to basic water services ↓BBS and UNICEF 2019
17Open Defecation% of population practicing open defecation ↑BBS 2021
Health18Under-5 child mortality Per 1000 live births ↑BBS 2019
19Underweight % of underweight children under 5 years ↑UNICEF 2019
20Insufficient Early Child Development Index % of children (36–59 months) not on track in three domains: literacy–numeracy, physical, social–emotional, and learning ↑UNICEF 2019
21Physicians DensityThe number of doctors per 100,000 population ↓DGHS 2022
22Community Clinic DensityNumber of community clinics per 100,000 people ↓DGHS 2022
Climate 23Intensive River Flood% of total area exposed to extensive river flood ↑BARC and BBS 2022
24/25Drought RiskPhysical exposure to extensive drought (Rabi and Kharip) (relative) ↑Inform 2022
Disclaimer/Publisher’s Note: The statements, opinions and data contained in all publications are solely those of the individual author(s) and contributor(s) and not of MDPI and/or the editor(s). MDPI and/or the editor(s) disclaim responsibility for any injury to people or property resulting from any ideas, methods, instructions or products referred to in the content.