4.1. Comparison and Analysis of Pareto Solution Sets
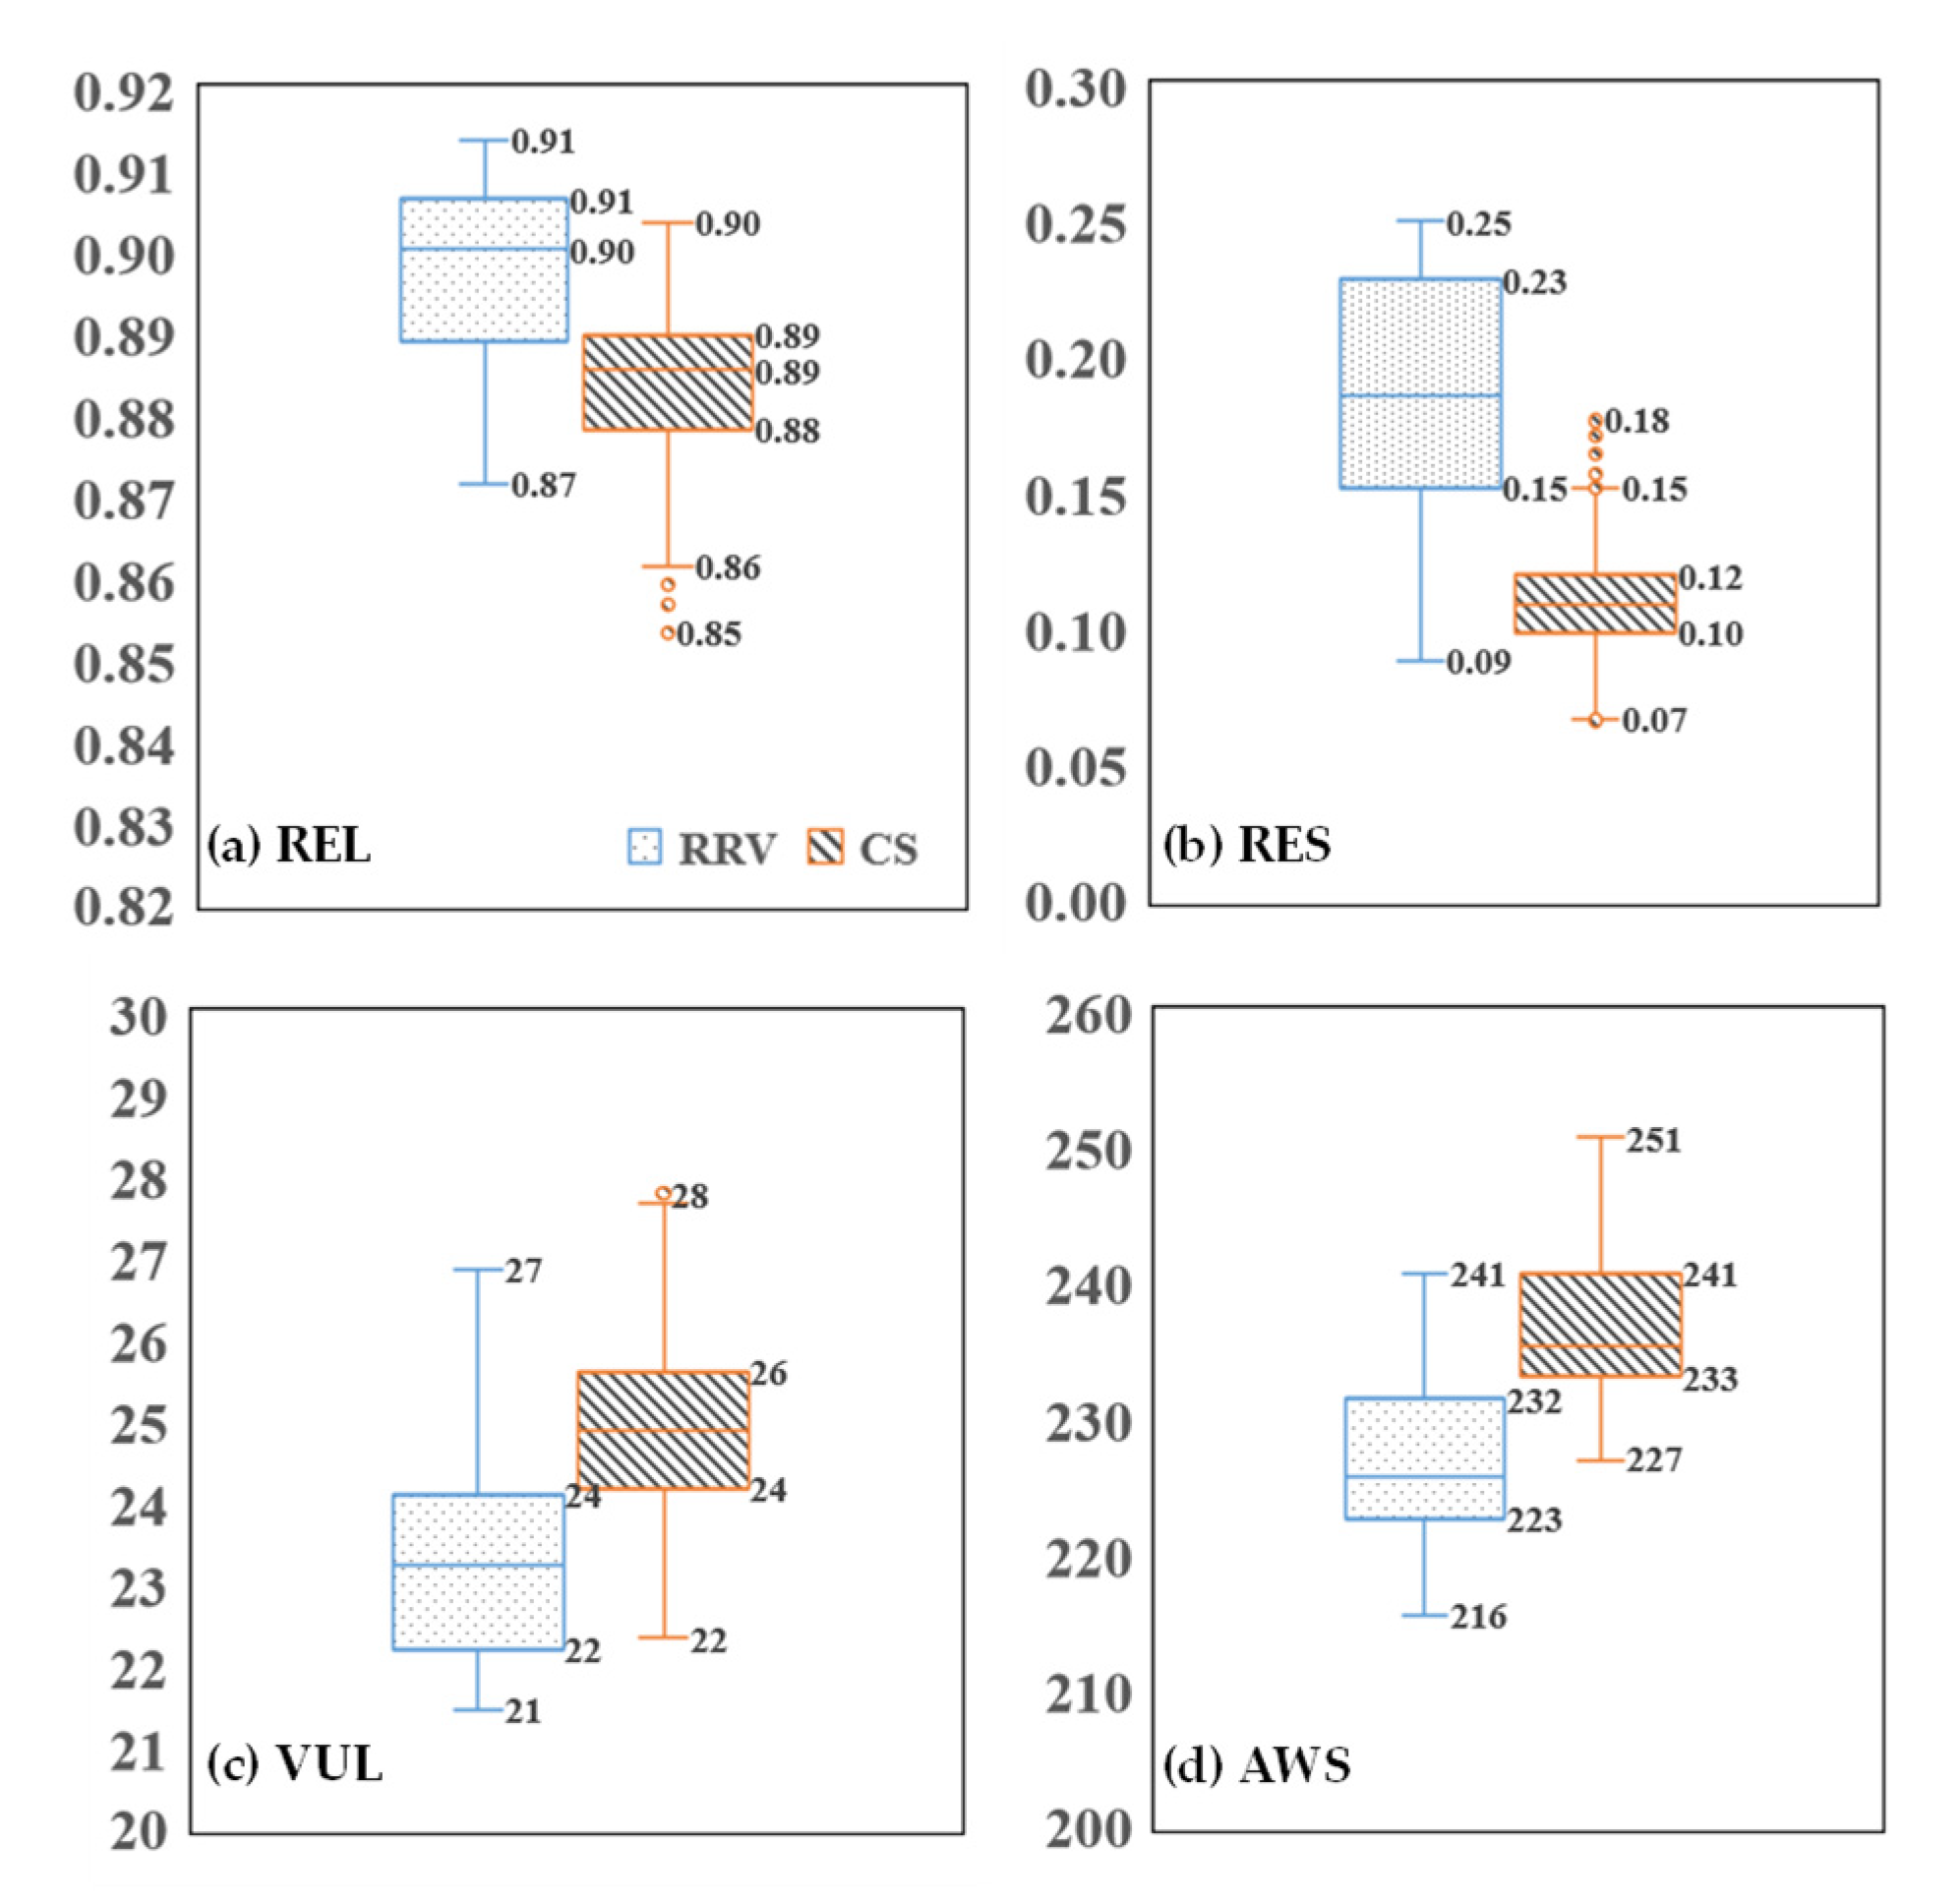
Figure 2 presents a comprehensive comparison between the solution sets derived from the scheduling model proposed in this study and those from a conventional scheduling model, both of which are evaluated under identical water demand scenarios. The comparison focusses on four critical objectives: reliability, resilience, vulnerability, and the multiyear average water shortage. The visualized results clearly demonstrate that the proposed model, which explicitly incorporates drought-period water supply risk indicators, consistently outperforms the conventional scheduling model, which neglects these risk-based objectives, across all four evaluation criteria.
More specifically, the proposed model achieves higher reliability, indicating a greater frequency of meeting water demand. It also demonstrates significantly stronger resilience, reflecting an increased ability to recover from water supply disruptions. Additionally, it results in lower vulnerability, meaning that the consequences of water shortages are less severe, and it reduces the system water shortage, thereby improving the overall efficiency and sustainability of water use. These improvements confirm the added value of integrating risk-based performance metrics into the reservoir operation optimization process, especially under prolonged or severe drought conditions.
A particularly notable advantage lies in the resilience.
Figure 2b shows that the resilience index values in the optimized solution set that includes drought-period risk indicators are predominantly concentrated in the range of 0.15 to 0.23. This range corresponds to a significantly improved average duration of water supply disruption of only 4 to 6 ten-day intervals, demonstrating the model’s ability to ensure faster recovery. In contrast, the conventional scheduling model yields resilience index values in the lower range of 0.10 to 0.12, with associated average disruption durations ranging from 8 to 10 ten-day intervals. This stark contrast highlights the conventional model’s limited capacity to handle prolonged droughts, as it results in longer periods of water supply interruption and delayed system recovery.
These findings underscore the practical importance of incorporating reliability, resilience, and vulnerability indicators into reservoir scheduling models, particularly in the context of increasing drought frequency and intensity due to climate change. By explicitly addressing water supply risk, the proposed model not only improves operational performance across multiple dimensions but also provides a more robust and adaptive decision-making framework. This ability can help water managers better prepare for and respond to extreme hydrological conditions, thereby safeguarding critical water demands and reducing socioeconomic and ecological losses during drought events.
In terms of reliability, as shown in
Figure 2a, the scheduling model that integrates drought-period water supply risk indicators demonstrates a slight but consistent improvement over the conventional scheduling model. This improvement is attributed to the explicit inclusion of reliability as an optimization objective, which encourages solutions that reduce the overall frequency of water supply disruptions throughout the simulation period. By proactively managing supply reliability, the model ensures that demand is met more consistently, which is especially critical during prolonged dry periods.
In terms of vulnerability, the scheduling model also exhibits superior performance. The multiyear average of the single-period maximum disruption depth, a key measure of vulnerability, is noticeably lower than that of the conventional model. This finding indicates that water supply failures not only occur less frequently but also result in less severe shortages. In other words, the average maximum annual water shortage is smaller in the risk-informed model, demonstrating the model’s capacity to limit the magnitude of failure events and mitigate their potential impact on socioeconomic and ecological systems.
Figure 3 further compares the two models in terms of sector-specific water shortages and power generation and offers a more granular view of how trade-offs are distributed among different water users. This figure includes five key components: power generation (E, in 10
6 kWh), industrial and domestic water shortages (IND, in 10
6 m
3), environmental water shortages (ENV, in 10
6 m
3), agricultural water shortages (AGR, in 10
6 m
3), and wetland water shortages (WET, in 10
6 m
3).
Overall, the model that considers water supply risk indicators achieves a lower multiyear average water shortage than the conventional model does. This outcome demonstrates the former model’s improved ability to balance supply across sectors under constrained drought conditions. Agricultural water shortages, in particular, are significantly reduced in the risk-informed model, as shown in
Figure 3d. This reduction reflects a strategic prioritization of agricultural demand, likely due to its volume and impact on food security and rural livelihoods.
However, this improved performance comes at a notable cost to other sectors. Specifically, industrial and domestic water shortages, as well as environmental flow deficits, are greater in the proposed model than in the conventional model, as shown in
Figure 3b,c. This trade-off suggests that to maintain higher reliability and resilience for the overall system—particularly through enhanced recovery capacity and reduced vulnerability—certain sectors may experience greater shortages. In contrast, wetland water shortages show minimal variation between the two models, indicating that wetland requirements were maintained at a relatively stable level or deprioritized uniformly across scenarios.
In terms of power generation, the model developed in this study tends to sacrifice a portion of hydropower output to accommodate the operational adjustments necessary for meeting the enhanced water supply risk objectives. This tendency is a direct consequence of modifying reservoir release patterns to favour a more consistent and equitable water supply, even during periods of low inflow, rather than maximizing energy production. Although this approach may slightly reduce energy benefits, it reflects a strategic shift towards risk-informed water resource management that prioritizes system stability, user reliability, and rapid recovery over purely economic gains.
In summary, the scheduling model that incorporates drought period water supply risk indicators offers a more balanced and resilient water allocation strategy. Optimizing reliability, resilience, and vulnerability considerably improves the water system’s capacity to withstand and recover from droughts, even though this improvement is associated with sector-specific trade-offs in industrial, environmental, and energy outputs. These findings highlight the need for integrated decision-making frameworks that consider technical performance and socioeconomic priorities under conditions of increasing climate variability.
4.2. Analysis of the Pareto Solution Set Considering Drought Period Water Supply Risk
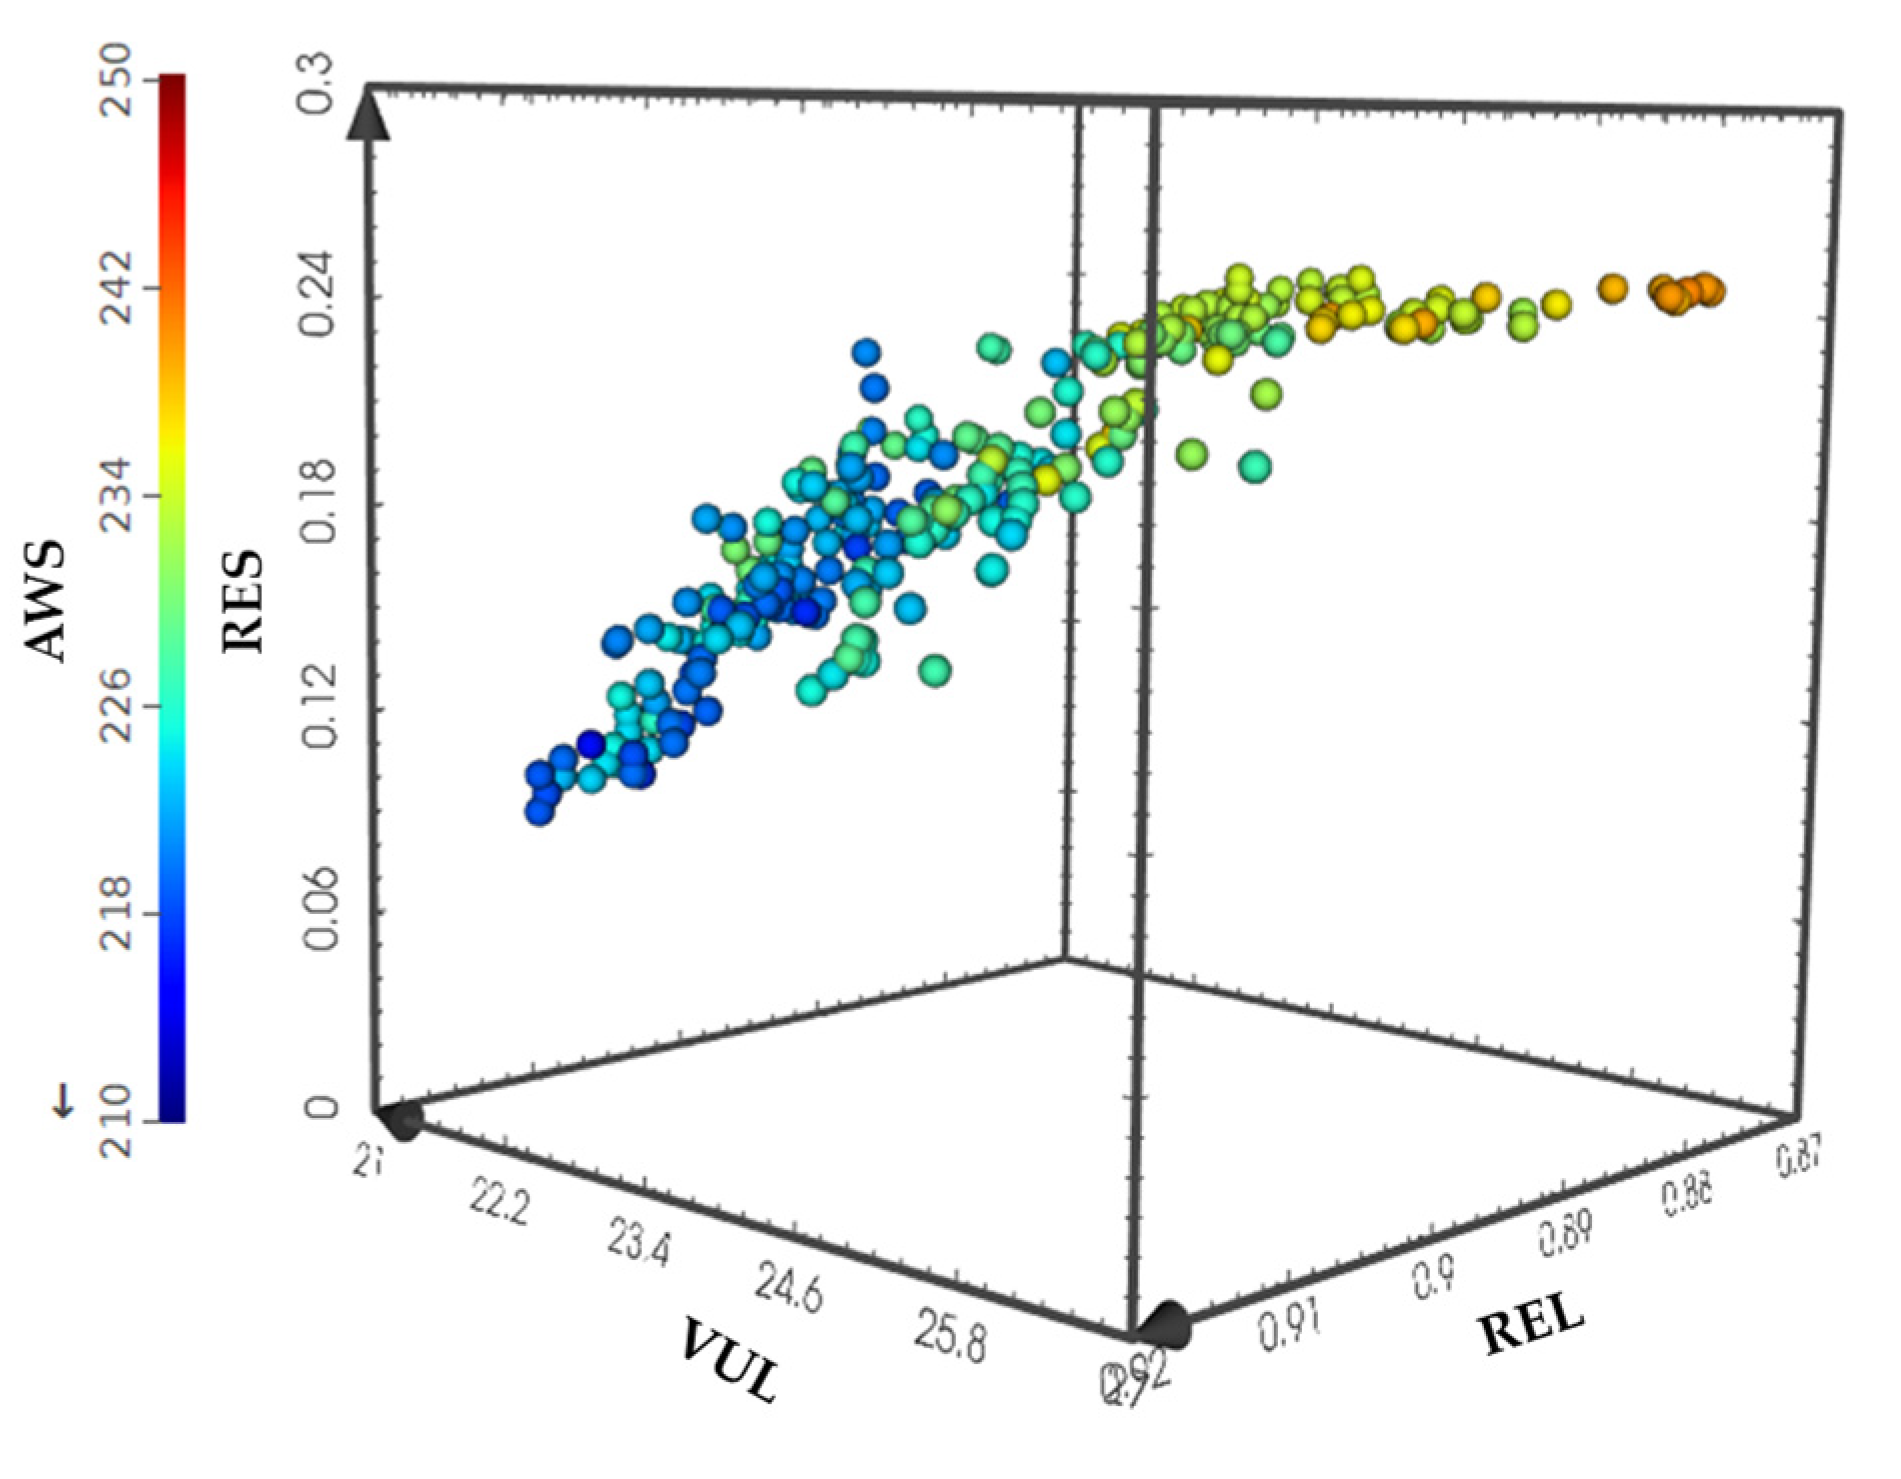
Figure 4 presents a multidimensional visualization of the Pareto-optimal solution set derived from the scheduling model that incorporates water supply risk indicators—namely, reliability, resilience, vulnerability, and average water shortage. This visualization provides an intuitive understanding of the distribution and interrelationships among these multiple objectives. Similarly,
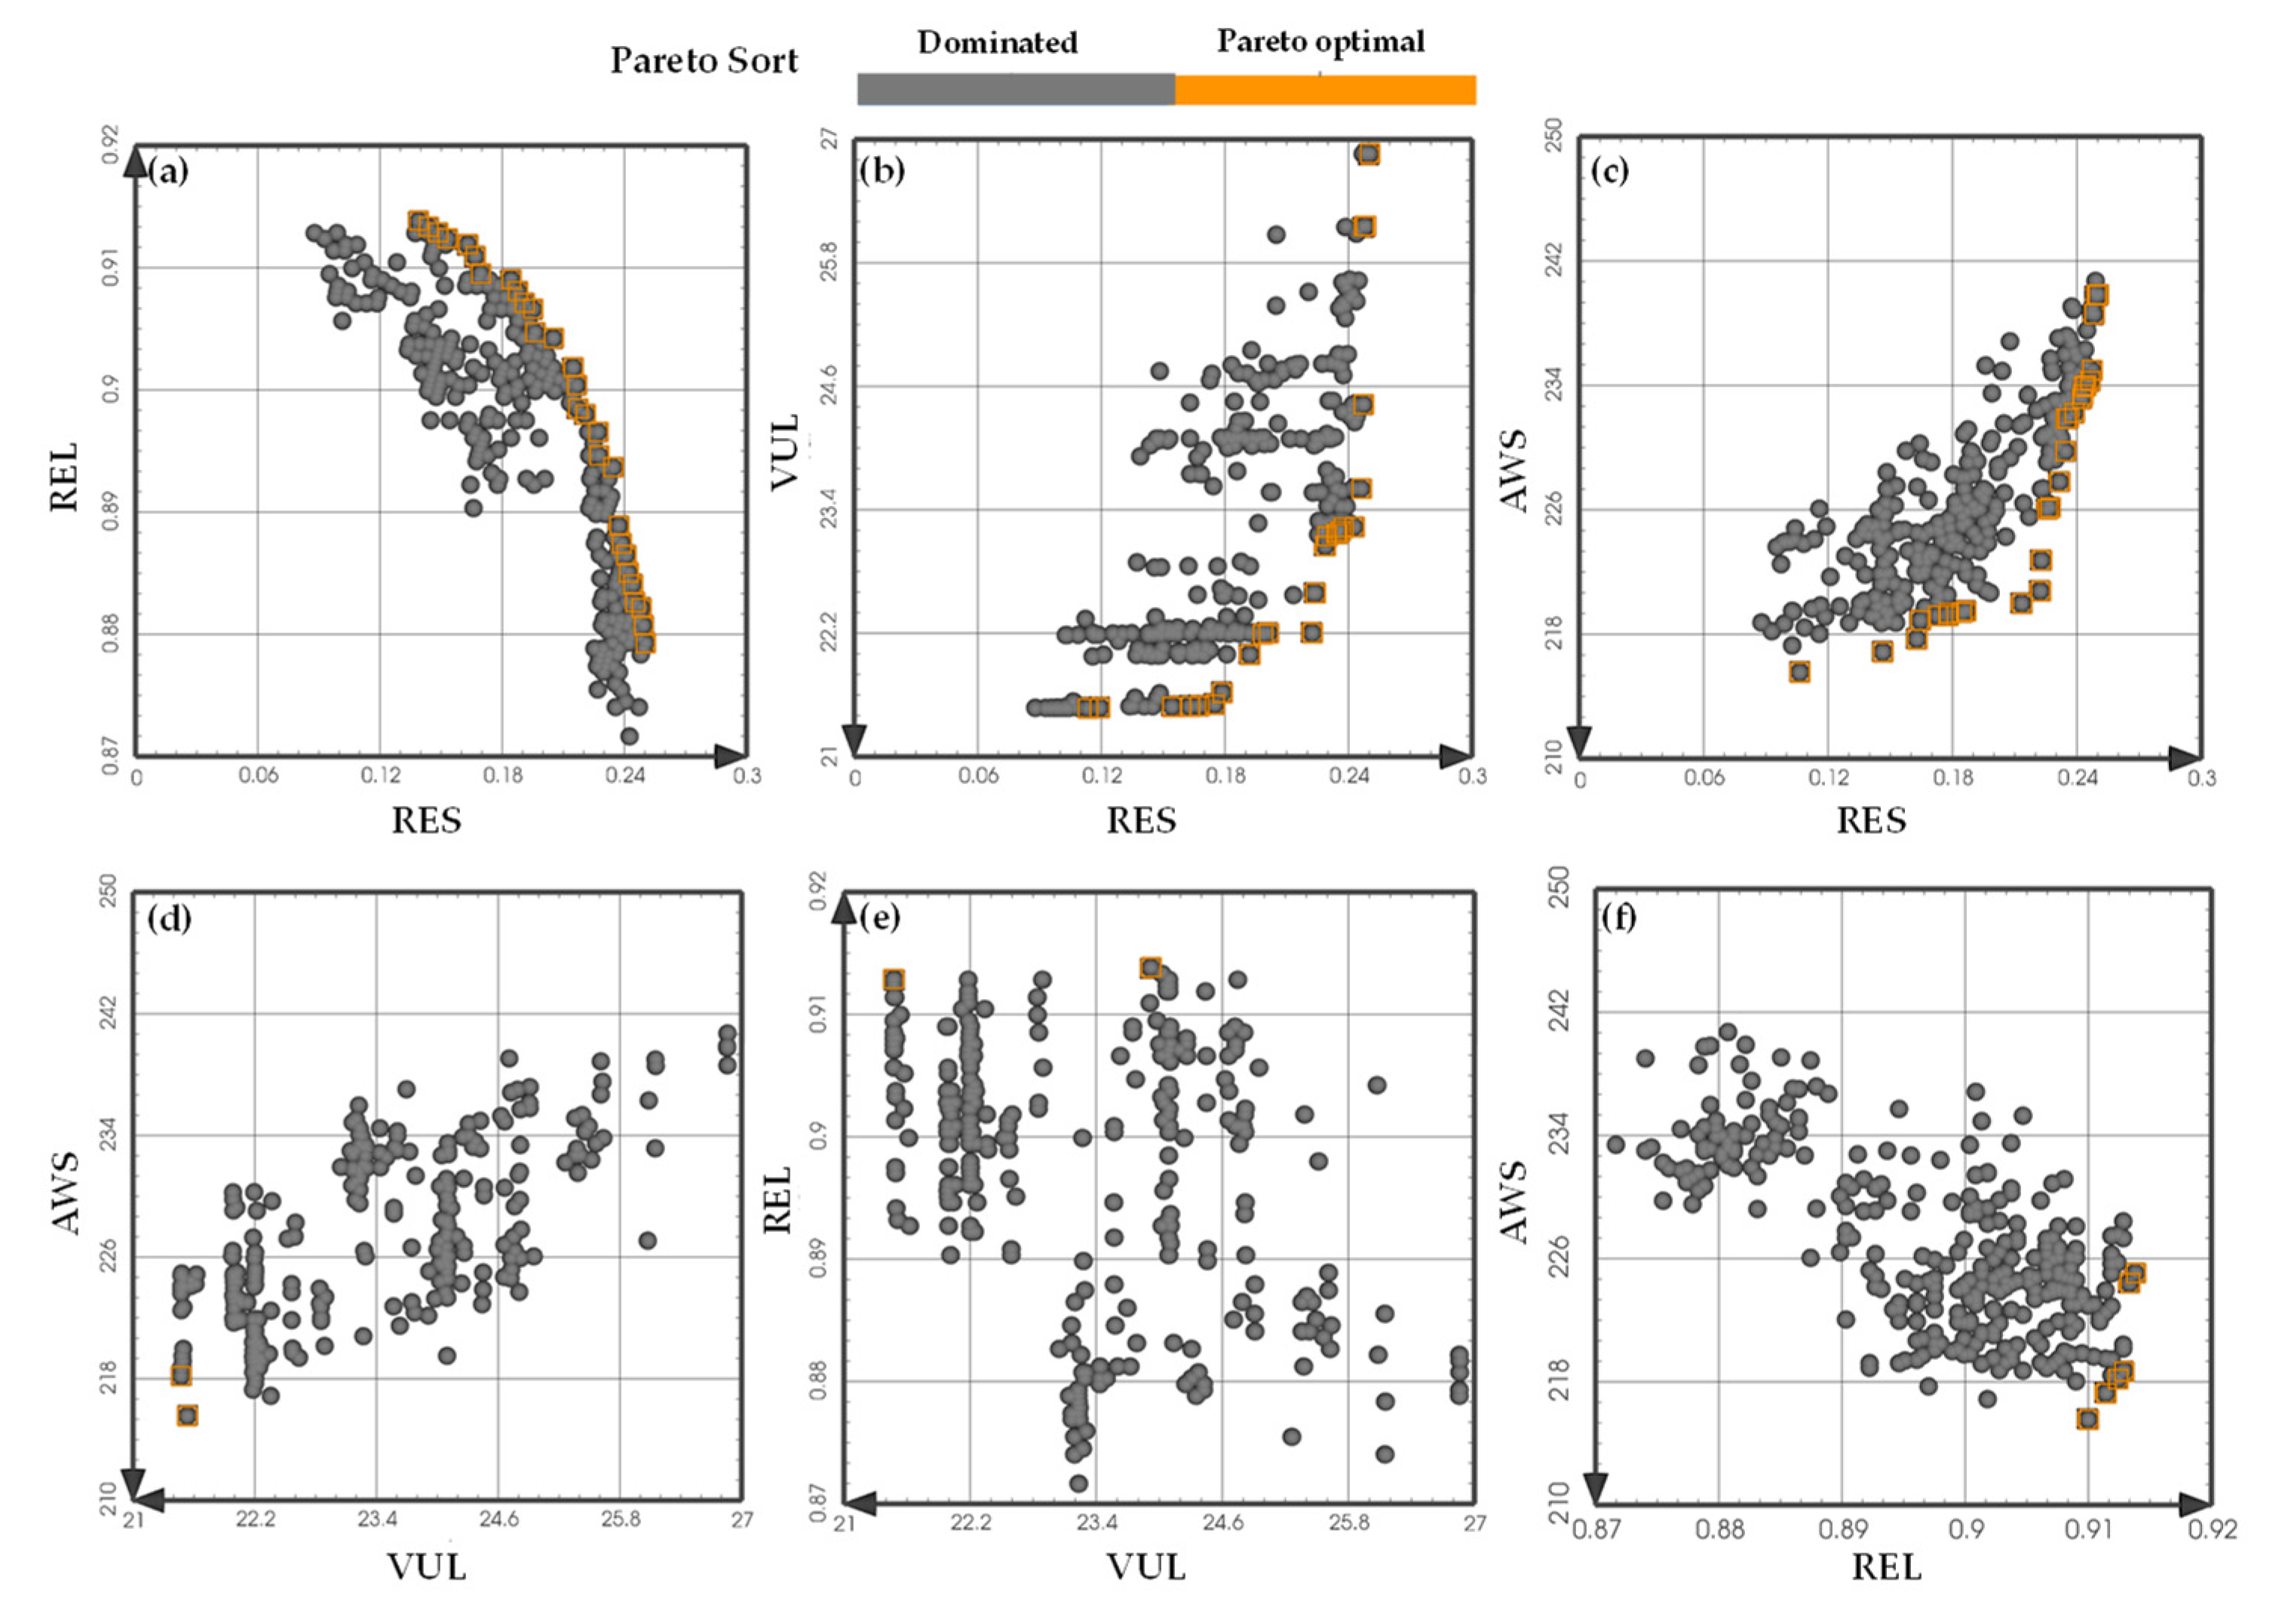
Figure 5 displays the pairwise trade-off curves between each of the four objectives, offering deeper insight into the nature and intensity of conflicts or compatibilities among them.
Together, these figures reveal a critical feature of the model: resilience emerges as the most strongly competing objective among the four. Specifically, enhancements in the resilience index are generally associated with decreases in water supply reliability, increases in system vulnerability, and increases in water shortages. For example, as shown in
Figure 5a–c, efforts to improve the system’s capacity to recover quickly after supply disruptions tend to compromise other aspects of system performance. These compromises include a reduction in the frequency with which demand is fully met, an increase in the severity of supply failure, and a higher overall volume of unmet water demand.
Despite the pronounced trade-offs between resilience and the other three objectives, the interactions among the remaining indicators are relatively modest. For example, the trade-offs between vulnerability and reliability or water shortage are notably weaker, indicating that these objectives can be improved concurrently to a certain extent. Similarly, reliability shows limited competition with vulnerability and water shortage, in addition to its strong inverse relationship with resilience.
Overall, resilience clearly stands out as the most dominant and competitive objective in the multiobjective framework. Its inclusion or exclusion considerably shifts the structure of the solution space. When resilience is excluded from the model formulation, further improvements in reliability, reductions in system vulnerability, and minimization of water shortages can be achieved. However, if rapid recovery after water supply failure is deemed a priority, such as in regions with limited emergency response capacity or high socioeconomic sensitivity to water disruptions, the model should be constructed with a primary focus on optimizing resilience.
In practical decision making, this inherent trade-off structure highlights the need for stakeholders and planners to explicitly define their drought response priorities. Since resilience has the strongest influence on the performance of the other indicators, it should be carefully analysed and appropriately weighted when selecting the final scheduling strategy. These findings underscore the importance of a flexible, scenario-dependent approach to reservoir operation that balances short-term supply reliability with long-term system robustness and recovery capacity.
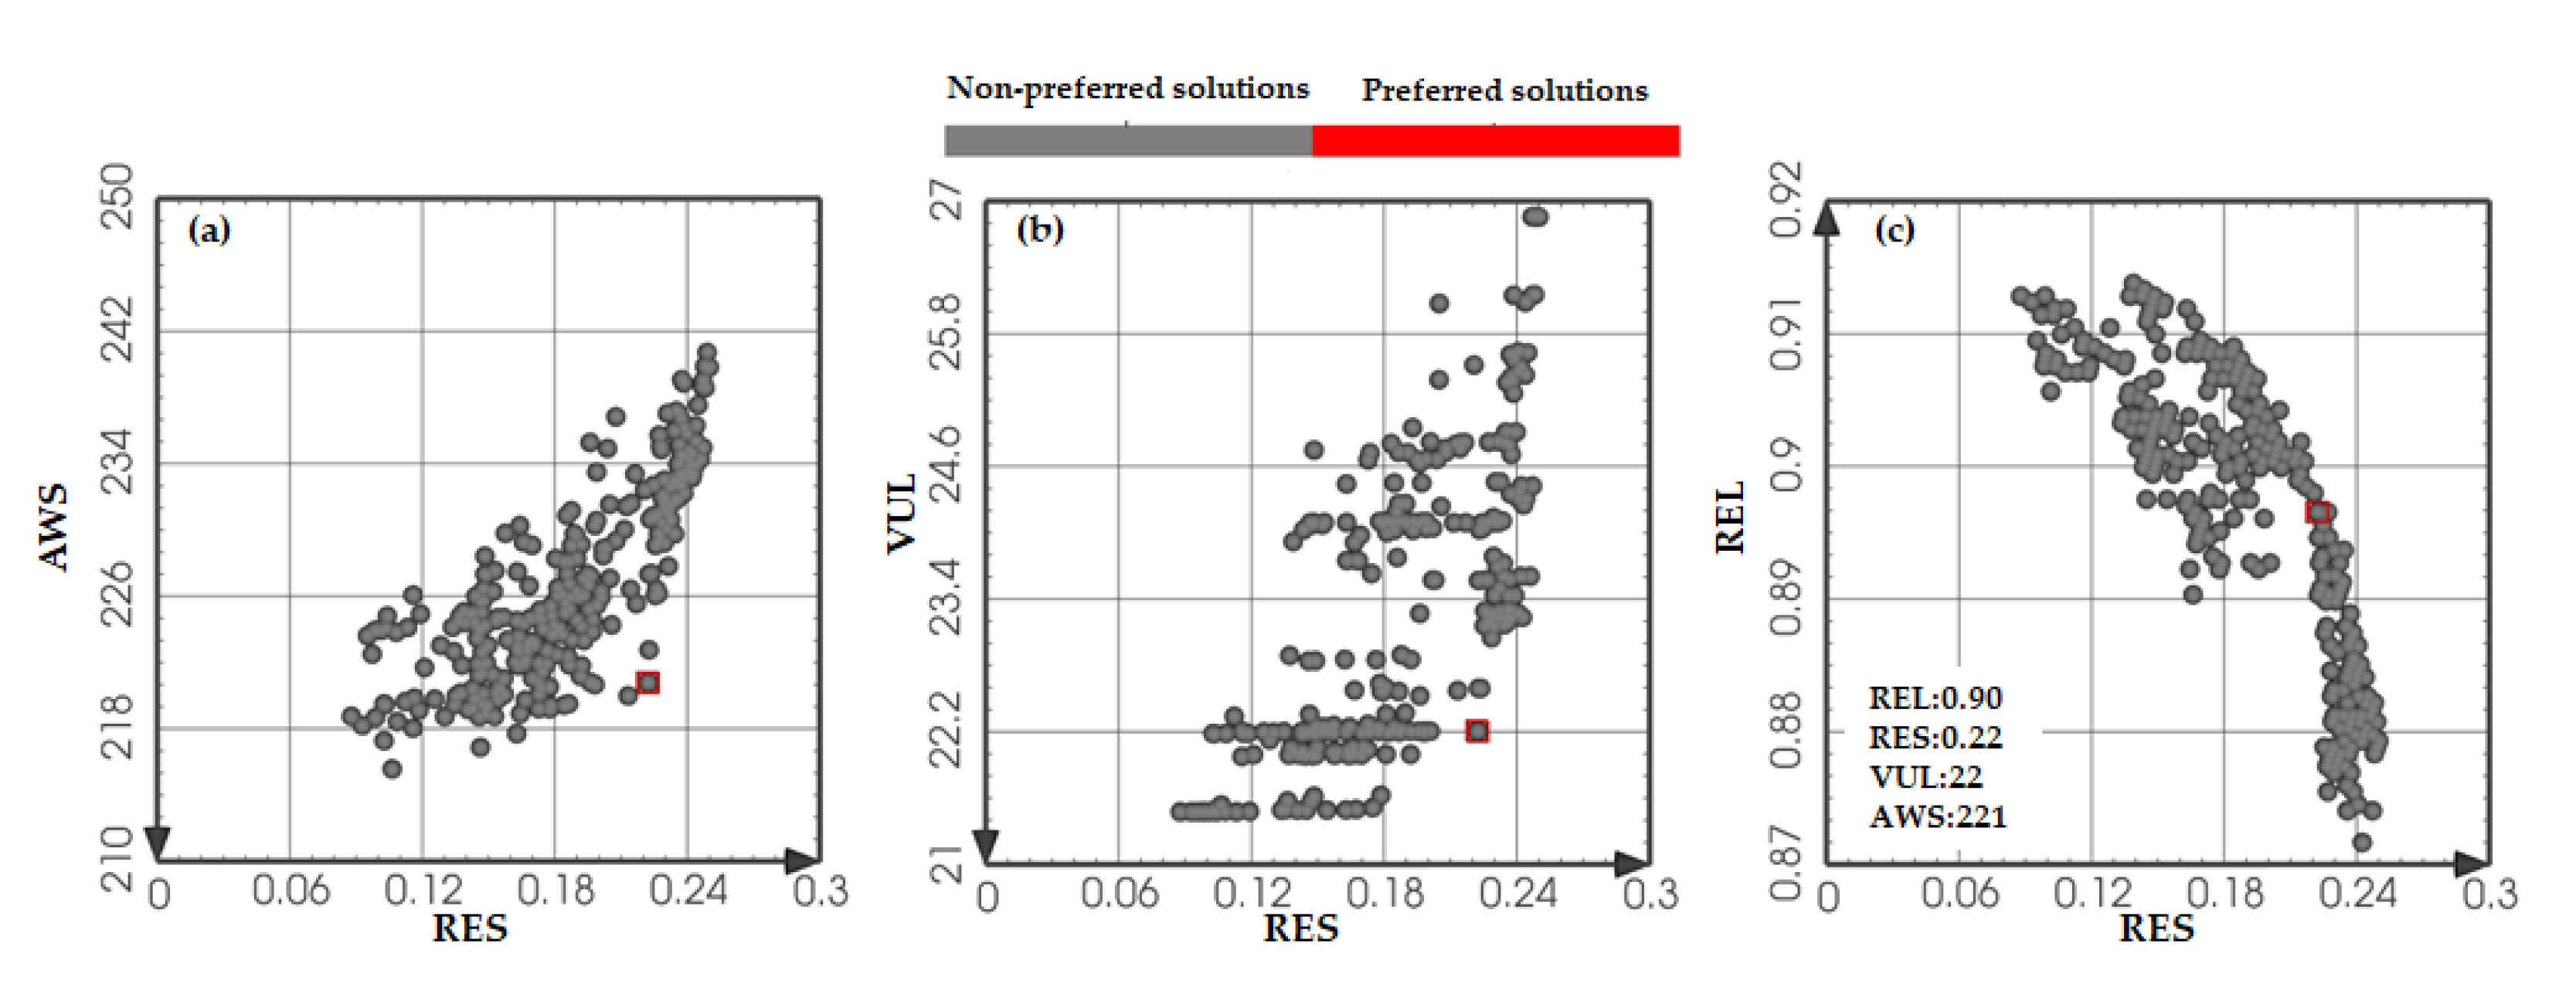
On the basis of the comprehensive analysis of the trade-offs among the multiple objectives, the resilience index is selected as the primary entry point for identifying and evaluating optimal solutions. This choice is grounded in the observation that resilience exerts the strongest influence on the performance of other key indicators, i.e., reliability, vulnerability, and water shortage, and serves as a critical determinant of the system’s ability to respond to and recover from drought-induced disruptions.
As shown in
Figure 6, a clear nonlinear relationship exists between resilience and the other objective values. When the resilience index is less than 0.22, the corresponding degradation in REL, VUL, and AWS is relatively modest, suggesting that small gains in resilience do not significantly compromise the overall system performance. However, once the resilience index exceeds the threshold of 0.22, a sharp and accelerated deterioration occurs in the other three indicators. This inflection point signifies a trade-off boundary beyond which the pursuit of higher resilience leads to disproportionately high costs in terms of water supply reliability, increased vulnerability, and greater system-wide water shortages. Therefore, this threshold value of RES = 0.22 can be considered a critical decision-making reference for identifying balanced and cost-effective solutions that accommodate recovery capability and general supply performance.
Under this selected threshold, the performance metrics of the system are as follows: the average duration from water supply disruption to full recovery is reduced to approximately 5 ten-day intervals, indicating a strong capacity for prompt response and restoration. The water supply reliability remains high, and the system is able to meet demand 90% of the time. The multiyear average of the single maximum disruption depth, which represents the most severe water deficit experienced in a single disruption event, stands at 22 × 106 m3, reflecting a moderate level of impact. Moreover, the multiyear average water shortage is 221 × 106 m3, suggesting that the system, although resilient, still maintains a reasonable balance between supply and demand across all water-user sectors.
In summary, the identification of this resilience threshold enables decision makers to select operation schemes that achieve a practical compromise between competing objectives, improving the drought-response performance of the reservoir system without incurring unacceptable losses in reliability or efficiency. This insight offers valuable guidance for developing more robust and adaptive reservoir scheduling strategies under climate variability and prolonged drought scenarios.
4.3. Drought Scenario Comparative Analysis
4.3.1. Comparison of Consecutive Dry Years
Using the preferred solution identified earlier, which is characterized by a resilience index of approximately 0.22 and a reliability of 90%, as a reference, we selected a solution from the conventional scheduling model with the same reliability level (REL = 90%) to ensure comparability under drought conditions. To assess the models’ performance under a realistic and severe drought scenario, we selected the historical inflow sequence from 1974 to 1979 at the Nierji Reservoir, a period recognized as one of prolonged and consecutive dry years. The initial water level of the reservoir was set at 199.0 m, corresponding to the 90% frequency level obtained via long-term simulation, which accurately reflects the severity of initial drought stress at the start of the scheduling period.
A detailed comparative analysis was then conducted between the scheduling results of the drought risk-aware model and the conventional scheduling model during this six-year drought window. The results of the comparison are shown in
Figure 7 and summarized in
Table 1. These results show that the model that incorporates water supply risk indicators outperforms the conventional approach in terms of the total water supply provided and the severity of shortages experienced by users.
Specifically, the average annual water shortage over the six-year period under the risk-aware model is 979 × 106 m3, which is 42 × 106 m3 less than the 1021 × 106 m3 observed in the conventional model. Although the overall reduction may appear modest in absolute terms, it reflects a more efficient and equitable allocation of limited water resources during multiyear droughts, which can considerably reduce the negative impacts on critical sectors, especially agriculture and domestic use.
In addition, the reservoir water levels under the risk-aware model are consistently lower than those under the conventional model, as shown in
Figure 7. This outcome is primarily due to the model’s strategy of prioritizing water release to meet user demand and minimize service disruption during critical periods, even at the cost of maintaining lower reservoir storage levels. This proactive operation style helps avoid extended dry-out periods for users and increases the short-term adaptability of the system.
In terms of supply continuity, the average duration of consecutive water supply disruptions is 5 ten-day intervals under the risk-informed scheduling model, whereas it is 9 ten-day intervals under the conventional model. This substantial reduction in the duration of the disruption is a clear indicator of the enhanced resilience of the proposed model, which enables faster recovery from shortage events and more stable service provision. In
Figure 7, the conventional model shows that multiple prolonged periods of water shortage can lead to cascading effects across sectors, resulting in greater economic, social, and ecological losses.
In conclusion, the simulation of this consecutive drought scenario confirms the practical advantages of incorporating reliability, resilience, and vulnerability indicators into reservoir operation models. The proposed model not only reduces system water shortages but also shortens the duration of disruptions, ensuring faster recovery and better support for critical water users. This effect highlights the importance of risk-based and adaptive scheduling strategies in addressing long-duration droughts and reinforces the model’s value as a robust tool for drought resilience planning.
4.3.2. Comparison of Single Dry Years
Using historical inflow data from the Nierji Reservoir, a Pearson Type III (P-III) distribution curve was fitted to characterize the runoff frequency. On the basis of this analysis, the runoff volume corresponding to the 75% exceedance probability, which represents a typical dry year condition, was estimated at approximately 7.15 billion m3. To select a representative single dry year for detailed study, the year 2002 was chosen because its annual runoff closely matches this 75% frequency runoff value. The intra-annual runoff distribution for the 75% frequency dry year was derived using the proportional method, which allocates the total annual runoff into smaller time intervals proportionally on the basis of historical flow patterns. To simulate realistic drought conditions, the initial reservoir water level was set according to the 90% frequency water level determined from long-term operation data, reflecting a relatively low and stressed reservoir storage status at the start of the dry year. This setup served as the basis for a detailed comparative analysis of scheduling results between the drought risk-aware scheduling model proposed in this study and the conventional scheduling model without explicit consideration of drought risk indicators.
As shown in
Figure 8, under the representative dry year scenario, the model that incorporates drought period water supply risk indicators consistently produces water shortage levels that are less than or equal to those observed in the conventional scheduling model throughout all time periods. This finding indicates that the risk-aware model is more effective at managing scarce water resources during drought conditions, maintaining better supply reliability, and reducing the severity and frequency of shortages. Moreover, the risk-informed scheduling model achieves this improved performance by optimizing reservoir releases with a focus on enhancing system resilience and minimizing vulnerability rather than solely maximizing the short-term water supply or economic benefits. This approach results in a more balanced allocation that protects key water users and sustains environmental flows, even under limited inflow conditions.
Overall, the results demonstrate that explicitly integrating reliability, resilience, and vulnerability indicators into reservoir operation models can considerably enhance drought management capabilities during single dry years. The model’s improved ability to mitigate shortages and maintain a stable water supply under adverse hydrological conditions highlights its practical value for reservoir operation planning and decision making in water-scarce regions facing increasing drought risk.
