Abstract
Droughts present persistent and severe challenges to the security of regional water supplies, particularly in arid and semiarid regions such as northern China. Traditional reservoir operation models that prioritize water supply reliability or economic efficiency often fail to adequately address the risks posed by extreme drought events. In this study, we develop a novel risk-informed multiobjective reservoir operation model that incorporates three key performance indicators: reliability, resilience, and vulnerability (RRV). This model aims to improve drought response and enhance the overall stability of the water supply system. It is applied to a multisource water supply system composed of the Nierji Reservoir and various water-user sectors. Unlike traditional models, this approach explicitly balances the trade-offs among supply reliability, recovery capability, and water shortage during drought periods. Comparative analyses with conventional strategies (CSs) under both a six-year consecutive dry period and a representative single dry year demonstrate the superior performance of the RRV-based model in drought management. Specifically, the model reduces the average supply disruption duration from 8–10 to 4–6 ten-day intervals, increases water supply reliability to 90%, decreases the maximum single-event shortage depth to 22 × 106 m3, and lowers the average water shortage to 221 × 106 m3. Agricultural water shortages are reduced, although slight increases occur in other sectors. The results highlight resilience as the most influential objective in the model, and its inclusion or exclusion can be adjusted based on different drought response priorities. This study presents a novel and adaptive framework for reservoir operation under drought conditions, offering practical implications for improving the resilience and efficiency of regional water resource systems in the context of climate change.
1. Introduction
Drought is one of the most destructive natural disasters and is characterized by its long duration, wide-ranging impacts, and difficulty in prediction and management, causing considerable damage to the social economy and ecosystems [1,2]. Recently, driven by global climate warming, many regions worldwide have exhibited a “warming and drying” trend, leading to significant increases in the frequency, duration, and intensity of drought events [3,4]. Water shortages during droughts directly threaten regional urban and rural water supply security, agricultural irrigation efficiency, and ecosystem health, especially in northern China’s North China Plain, northwestern inland basins, and some seasonally water-scarce areas in southern China [5].
Under the backdrop of drought, the reasonable operation of reservoir systems, which have multiple objectives, is especially critical [6,7]. Although reservoirs need to ensure daily production and domestic water supply, during droughts, they must have good risk resistance and recovery capabilities [8]. During drought periods, owing to the severe shortage of inflow, the supply‒demand contradiction intensifies, and traditional operation strategies focused on maximizing water supply or benefits are insufficient to cope with the challenges of extreme scenarios [9]. Therefore, the national water resources comprehensive planning technical guidelines emphasize the need for emergency-oriented reservoir operation plans during droughts, with multidimensional scheduling strategies aimed at maximizing water supply reliability, minimizing water shortages, and minimizing recovery time.
Recently, with the continuous in-depth study of water supply system operation risks, quantitative evaluation indicators for water supply performance have gradually increased. Hashimoto et al. (1982) proposed a three-dimensional framework centred on water supply reliability, resilience, and vulnerability [10], which has since been widely adopted and applied to assess the operational stability of water supply systems under extreme droughts and other disturbances [11,12]. Among these objectives, reliability reflects the frequency with which the water supply system meets demand, resilience describes the system’s ability to recover from failure, and vulnerability measures the average loss caused by a failure event [13]. This performance indicator system has been widely used in water supply security assessments and water resource system resilience analyses and has gradually expanded towards reservoir operation optimization [14,15].
The construction of reservoir models is fundamental for achieving effective and reasonable reservoir operation. However, there is currently no unified theoretical framework for defining objective functions in reservoir operation models. For reservoirs serving multiple users, model development often involves simplifying multiple user demands into a single objective for single-objective optimization or empirically converting multiple demands into quantifiable benefit functions used as objectives in multiobjective optimization. These approaches frequently generate thousands of solutions, effectively shifting the challenge from multiobjective optimization to complex decision making and selection among numerous alternatives. Moreover, these model construction methods leave unresolved questions about how different objective function formulations influence reservoir operation outcomes, and uncertainty remains about which objectives best capture the practical requirements of reservoir scheduling. With the intensification of drought issues, a growing and urgent need exists to develop reservoir scheduling models that are specifically tailored to address drought conditions.
Nevertheless, most current reservoir operation studies continue to focus primarily on maximizing water supply reliability or economic benefits, often giving limited attention to critical factors such as resilience and vulnerability in the decision-making process [16,17]. This oversight neglects the enhancement of the system’s overall risk resistance, especially under extreme drought conditions [18]. In particular, during prolonged droughts or exceptionally dry years, models that fail to incorporate recovery capabilities and system vulnerability risk causing severe imbalances in the water supply, potentially leading to profound economic and social consequences [19].
On this basis, this study aims to introduce the perspective of water supply risk during droughts; incorporate key indicators such as reliability, resilience, and vulnerability into the conventional reservoir operation framework; and develop a multiobjective optimization model for drought period operation. This model not only aims to ensure regular water supply needs but also emphasizes the system’s disaster resistance and recovery mechanisms in drought or dry years. Specifically, the study includes the following: first, a systematic review of the definitions and quantification methods of the three performance indicators of water supply systems is performed; second, a multiobjective optimization model based on reliability, resilience, vulnerability, and water shortage for a multisource water supply system composed of reservoirs and multiple water users is constructed; and finally, this model is compared with traditional operation models that neglect water supply risk indicators. The robustness and practicality of the proposed model are validated through simulations of typical drought scenarios. This study provides a more forward-looking and risk-resistant decision-making framework for reservoir operation management in the context of climate change and has considerable theoretical and practical value for improving the resilience and safety of regional water supply systems during droughts.
2. Methodology
2.1. Reservoir Water Supply Risk Index
2.1.1. Reliability
Water supply reliability is generally defined as the probability or frequency with which the water supply remains in a normal condition (i.e., no supply disruption) during the operational analysis period of the reservoir. It is typically calculated by dividing the number of periods with no supply disruption by the total number of periods in the reservoir operation analysis period [20,21]. Let denote the system’s output state in period t. In general, the possible values of can be classified into two sets: S, representing all satisfactory outputs, and F, representing all unsatisfactory (failure) outputs. Specially, in this study, the focus is on water supply systems, and, therefore, the S state occurs when water supply is able to meet water demand, ensuring that there are no disruptions; hence, the F state is when supply cannot meet demand.
The reliability α of the system can be calculated as the proportion of periods where the water supply remains satisfactory:
where α represents the water supply reliability, is the indicator variable expressing the water supply status of the reservoir in period t, represents the event of the reservoir being in a normal water supply state, T represents the total number of simulation periods, = 1 if ∈ S, and = 0 if ∈ F.
However, it is important to note that the current model adopts a binary treatment of supply status, without differentiating between the magnitude of failure events. This could lead to oversimplified reliability estimates, as the severity of disruptions is not taken into account. Future work could incorporate error analysis to assess the impact of model assumptions and data uncertainties while also exploring methods to better account for the severity of disruptions. These enhancements would improve the model’s ability to capture the effects of varying imbalance values more accurately.
2.1.2. Resilience
Resilience refers to the likelihood of the system recovering from a disrupted state to a normal state within a given operational period [22]. The degree of resilience reflects the system’s ability to transition from a disrupted state to a normal state, which can be expressed using conditional probability:
where represents the resilience of the water supply system.
The state transition variable is introduced:
Expanding Equation (2) using the total probability formula and substituting Equation (3), the system resilience can be expressed as
The reciprocal of resilience can be considered the average duration of disruption, meaning that resilience reflects the duration of the disruption. A larger resilience coefficient indicates that after the system is disrupted, the duration of the disruption is shorter, and the system recovers to normal operation more quickly, i.e., the system’s resilience is better.
2.1.3. Vulnerability
Vulnerability reflects the severity of the consequences caused by water supply disruptions in the system, which is often expressed by the maximum disruption depth in a single period. For some systems, although the duration of the disruption may not be long, the depth of the disruption is too great (i.e., concentrated disruption), which exceeds the system’s capacity and can lead to very adverse consequences.
The maximum disruption depth in a single period () is generally defined as the maximum water shortage in a single period during the reservoir operation analysis period [23]:
where represents the water shortage in period t, denotes the total water demand across all sectors, and represents the actual water supply to all sectors.
2.2. Reservoir Multiobjective Scheduling Model Considering Water Supply Risk
For reservoirs that are focused primarily on the water supply, traditional scheduling strategies often fail to comprehensively balance water supply security with the system’s risk resistance when facing extreme hydrological scenarios such as droughts. To increase the operational resilience and water supply security of reservoirs during drought periods, the model incorporates three performance indicators, i.e., water supply reliability (), resilience (), and vulnerability (), along with the multiyear average water shortage () as core objectives in a multiobjective optimization scheduling model. To reflect the distribution characteristics of diverse water demands and system risks, the model further breaks down the water shortage into components for different typical water use sectors, including industrial and domestic water shortages, environmental flow shortages, agricultural irrigation shortages, and wetland ecosystem shortages. By quantifying the shortage risks of different water use types and performing collaborative optimization, the model can dynamically balance supply and demand under limited water resources, achieving efficient scheduling across multiple objectives, uses, and time periods. This approach provides a systematic, risk-oriented optimization solution to support scientific reservoir scheduling during drought periods.
where , , , and represent the system’s water supply reliability, resilience, vulnerability, and the multiyear average water shortage, respectively. represents the total number of periods over the entire reservoir operation scheduling horizon, where is the number of years, and J is the number of periods per year. represents the water shortage in the period j of the year i.
The main constraints include water balance constraints, reservoir capacity constraints, maximum flow capacity constraints, output constraints, and reliability constraints.
- 1.
- Water balance constraints:
- 2.
- Reservoir capacity constraints:
- 3.
- Maximum flow capacity constraints:
- 4.
- Electricity generation capacity constraint:
3. Case Study
This study takes the Nierji Reservoir (Figure 1) as the research object and constructs and applies a multiobjective scheduling model for drought periods to assess its scheduling effectiveness and water supply security under extreme hydrological conditions [24]. This study compiles daily inflow runoff data for the reservoir from 1956 to 2015, covering 60 years. For missing data before the construction of the reservoir, observation data from the nearby Ayan shallow hydrological station upstream are used for reasonable supplementation and correction to ensure the completeness and continuity of the flow data. Furthermore, this study adopts a ten-day time interval for reservoir operation and divides the year into 36 ten-day periods.
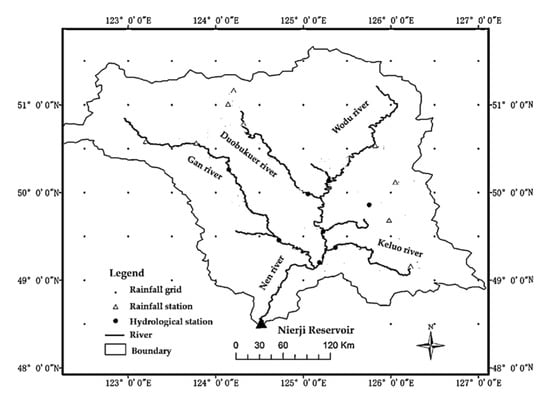
Figure 1.
Location map of the Nierji Reservoir.
In the model construction and application process, the scheduling optimization requirements for the drought period water supply risk index are considered, and the benchmark water demand for various water use categories is clearly defined. The hydropower station of Nierji Reservoir is a run-of-river type, equipped with four ZZA833-LH-640 hydro-turbine generator units, each with a capacity of 62.5 MW, resulting in a total installed capacity of 250 MW and a guaranteed output of 35 MW. Specifically, the industrial and domestic water demand is set at 32.5 × 10⁸ m3 annually, assumed to be constant throughout each period. Agricultural water demand, totalling 16.46 × 10⁸ m3, is allocated based on typical year usage, with the peak irrigation period from late April to early October. Wetland ecological water demand is 3.28 × 10⁸ m3, with replenishment scheduled between late August and late September to avoid conflicts with peak agricultural use and crane breeding season, ensuring optimal wetland water replenishment. Environmental water demand is assumed to be 13.65 × 10⁸ m3, based on minimum ecological flow requirements calculated using the Tennant method, derived from historical inflow data on a bi-weekly basis, to meet the ecological and environmental flow needs of the downstream river and wetland habitats. Furthermore, the water supply reliability for industrial and domestic users (IND), environmental requirements (ENV), and power generation (E) is evaluated based on the ratio of user-satisfaction periods to the total number of scheduling periods. In contrast, the reliability for agricultural users (AGR) and wetland needs (WET) is assessed based on the number of user-satisfaction years relative to the total scheduling years. These water demand objectives constitute a multisource demand system that must be balanced during the reservoir operation process, providing a clear foundation for model evaluation and optimization. The minimum required water supply reliability is set at 95% for industrial and domestic users, 90% for environmental requirements, and 75% for both agricultural users and wetland needs. The minimum reliability requirement for electricity generation is set at 85%.
The reservoir scheduling chart adopts an independent scheduling chart as the basic form with a power generation constraint requiring a guarantee of 35 MW output. The method for extracting the operation rule curves in this study is the widely used parameter–simulation–optimization framework, in which the optimal operation rules are derived on the basis of a predefined rule curve structure using an efficient intelligent optimization approach. The decision variable for the scheduling model is the location parameter of each control point on the scheduling curve. By adjusting these control points, the multiobjective scheduling strategy is optimized. To achieve efficient solving and global optimal solution search under multiobjective conditions, this study uses the nondominated sorting genetic algorithm II (NSGA-II) with an elitism retention strategy as the optimization solving tool. This algorithm has strong global search capability and multiobjective balance that enable the acquisition of a Pareto optimal solution set among multiple objective functions, which provides an effective numerical solution to the complex reservoir scheduling problem during drought periods. In this framework, the RRV indicators—reliability, resilience, and vulnerability—are treated as equally important and independent objectives, with no explicit weighting or prioritization assigned to any of them.
4. Results
4.1. Comparison and Analysis of Pareto Solution Sets
Figure 2 presents a comprehensive comparison between the solution sets derived from the scheduling model proposed in this study and those from a conventional scheduling model, both of which are evaluated under identical water demand scenarios. The comparison focusses on four critical objectives: reliability, resilience, vulnerability, and the multiyear average water shortage. The visualized results clearly demonstrate that the proposed model, which explicitly incorporates drought-period water supply risk indicators, consistently outperforms the conventional scheduling model, which neglects these risk-based objectives, across all four evaluation criteria.
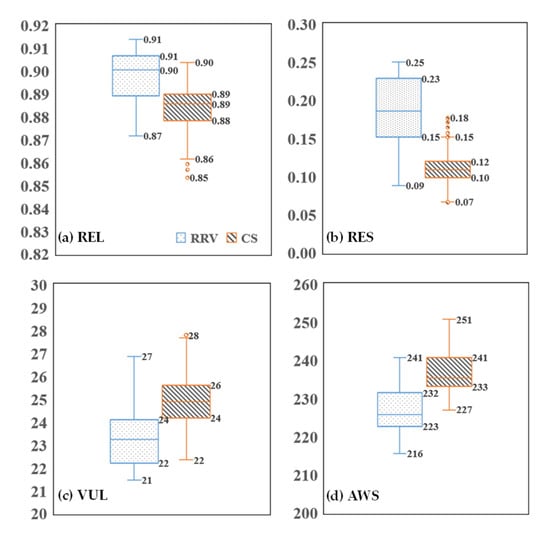
Figure 2.
Comparison of the model incorporating water supply risk indicators with the conventional scheduling model under the same water demand conditions, with a focus on the objectives reliability, resilience, vulnerability, and water shortage. (a), (b), (c), and (d) correspond to REL, RES, VUL, and AWS, respectively. The units of VUL and AWS are 106 m3.
More specifically, the proposed model achieves higher reliability, indicating a greater frequency of meeting water demand. It also demonstrates significantly stronger resilience, reflecting an increased ability to recover from water supply disruptions. Additionally, it results in lower vulnerability, meaning that the consequences of water shortages are less severe, and it reduces the system water shortage, thereby improving the overall efficiency and sustainability of water use. These improvements confirm the added value of integrating risk-based performance metrics into the reservoir operation optimization process, especially under prolonged or severe drought conditions.
A particularly notable advantage lies in the resilience. Figure 2b shows that the resilience index values in the optimized solution set that includes drought-period risk indicators are predominantly concentrated in the range of 0.15 to 0.23. This range corresponds to a significantly improved average duration of water supply disruption of only 4 to 6 ten-day intervals, demonstrating the model’s ability to ensure faster recovery. In contrast, the conventional scheduling model yields resilience index values in the lower range of 0.10 to 0.12, with associated average disruption durations ranging from 8 to 10 ten-day intervals. This stark contrast highlights the conventional model’s limited capacity to handle prolonged droughts, as it results in longer periods of water supply interruption and delayed system recovery.
These findings underscore the practical importance of incorporating reliability, resilience, and vulnerability indicators into reservoir scheduling models, particularly in the context of increasing drought frequency and intensity due to climate change. By explicitly addressing water supply risk, the proposed model not only improves operational performance across multiple dimensions but also provides a more robust and adaptive decision-making framework. This ability can help water managers better prepare for and respond to extreme hydrological conditions, thereby safeguarding critical water demands and reducing socioeconomic and ecological losses during drought events.
In terms of reliability, as shown in Figure 2a, the scheduling model that integrates drought-period water supply risk indicators demonstrates a slight but consistent improvement over the conventional scheduling model. This improvement is attributed to the explicit inclusion of reliability as an optimization objective, which encourages solutions that reduce the overall frequency of water supply disruptions throughout the simulation period. By proactively managing supply reliability, the model ensures that demand is met more consistently, which is especially critical during prolonged dry periods.
In terms of vulnerability, the scheduling model also exhibits superior performance. The multiyear average of the single-period maximum disruption depth, a key measure of vulnerability, is noticeably lower than that of the conventional model. This finding indicates that water supply failures not only occur less frequently but also result in less severe shortages. In other words, the average maximum annual water shortage is smaller in the risk-informed model, demonstrating the model’s capacity to limit the magnitude of failure events and mitigate their potential impact on socioeconomic and ecological systems.
Figure 3 further compares the two models in terms of sector-specific water shortages and power generation and offers a more granular view of how trade-offs are distributed among different water users. This figure includes five key components: power generation (E, in 106 kWh), industrial and domestic water shortages (IND, in 106 m3), environmental water shortages (ENV, in 106 m3), agricultural water shortages (AGR, in 106 m3), and wetland water shortages (WET, in 106 m3).
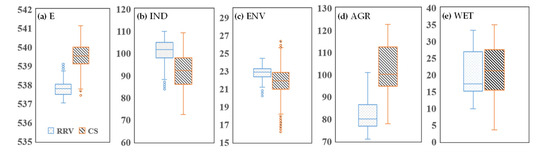
Figure 3.
Comparison of scheduling models under identical water demands: power generation and sectoral water shortages. (a), (b), (c), (d) and (e) correspond to E, IND, ENV, AGR and WET, respectively. E is in units of 106 kWh; IND, ENV, AGR, and WET are in units of 106 m3.
Overall, the model that considers water supply risk indicators achieves a lower multiyear average water shortage than the conventional model does. This outcome demonstrates the former model’s improved ability to balance supply across sectors under constrained drought conditions. Agricultural water shortages, in particular, are significantly reduced in the risk-informed model, as shown in Figure 3d. This reduction reflects a strategic prioritization of agricultural demand, likely due to its volume and impact on food security and rural livelihoods.
However, this improved performance comes at a notable cost to other sectors. Specifically, industrial and domestic water shortages, as well as environmental flow deficits, are greater in the proposed model than in the conventional model, as shown in Figure 3b,c. This trade-off suggests that to maintain higher reliability and resilience for the overall system—particularly through enhanced recovery capacity and reduced vulnerability—certain sectors may experience greater shortages. In contrast, wetland water shortages show minimal variation between the two models, indicating that wetland requirements were maintained at a relatively stable level or deprioritized uniformly across scenarios.
In terms of power generation, the model developed in this study tends to sacrifice a portion of hydropower output to accommodate the operational adjustments necessary for meeting the enhanced water supply risk objectives. This tendency is a direct consequence of modifying reservoir release patterns to favour a more consistent and equitable water supply, even during periods of low inflow, rather than maximizing energy production. Although this approach may slightly reduce energy benefits, it reflects a strategic shift towards risk-informed water resource management that prioritizes system stability, user reliability, and rapid recovery over purely economic gains.
In summary, the scheduling model that incorporates drought period water supply risk indicators offers a more balanced and resilient water allocation strategy. Optimizing reliability, resilience, and vulnerability considerably improves the water system’s capacity to withstand and recover from droughts, even though this improvement is associated with sector-specific trade-offs in industrial, environmental, and energy outputs. These findings highlight the need for integrated decision-making frameworks that consider technical performance and socioeconomic priorities under conditions of increasing climate variability.
4.2. Analysis of the Pareto Solution Set Considering Drought Period Water Supply Risk
Figure 4 presents a multidimensional visualization of the Pareto-optimal solution set derived from the scheduling model that incorporates water supply risk indicators—namely, reliability, resilience, vulnerability, and average water shortage. This visualization provides an intuitive understanding of the distribution and interrelationships among these multiple objectives. Similarly, Figure 5 displays the pairwise trade-off curves between each of the four objectives, offering deeper insight into the nature and intensity of conflicts or compatibilities among them.
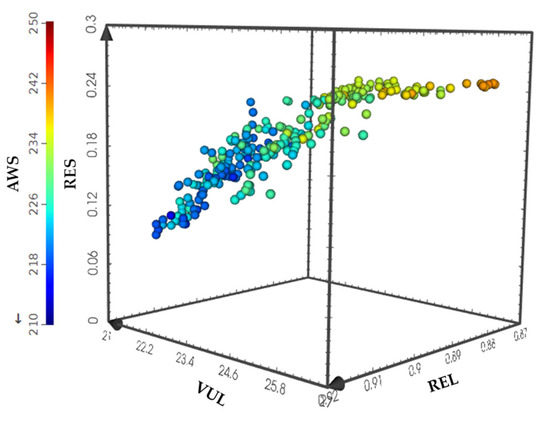
Figure 4.
Multidimensional visualization of the solution set for the scheduling model considering water supply risk indicators.
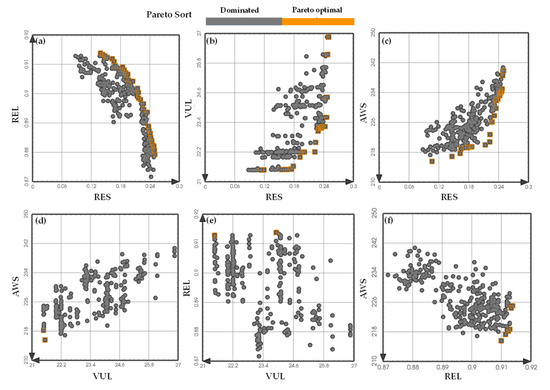
Figure 5.
Pairwise trade-off curves between objectives in the scheduling model considering water supply risk indicators. (a) RES and REL, (b) RES and VUL, (c) RES and AWS, (d) VUL and AWS, (e) VUL and REL, (f) REL and AWS. “Dominated” refers to solutions dominated during nondominated sorting for the two selected objectives, whereas “Pareto optimal” refers to the nondominated solutions for the two selected objectives. The direction of the arrows indicates the direction of optimization.
Together, these figures reveal a critical feature of the model: resilience emerges as the most strongly competing objective among the four. Specifically, enhancements in the resilience index are generally associated with decreases in water supply reliability, increases in system vulnerability, and increases in water shortages. For example, as shown in Figure 5a–c, efforts to improve the system’s capacity to recover quickly after supply disruptions tend to compromise other aspects of system performance. These compromises include a reduction in the frequency with which demand is fully met, an increase in the severity of supply failure, and a higher overall volume of unmet water demand.
Despite the pronounced trade-offs between resilience and the other three objectives, the interactions among the remaining indicators are relatively modest. For example, the trade-offs between vulnerability and reliability or water shortage are notably weaker, indicating that these objectives can be improved concurrently to a certain extent. Similarly, reliability shows limited competition with vulnerability and water shortage, in addition to its strong inverse relationship with resilience.
Overall, resilience clearly stands out as the most dominant and competitive objective in the multiobjective framework. Its inclusion or exclusion considerably shifts the structure of the solution space. When resilience is excluded from the model formulation, further improvements in reliability, reductions in system vulnerability, and minimization of water shortages can be achieved. However, if rapid recovery after water supply failure is deemed a priority, such as in regions with limited emergency response capacity or high socioeconomic sensitivity to water disruptions, the model should be constructed with a primary focus on optimizing resilience.
In practical decision making, this inherent trade-off structure highlights the need for stakeholders and planners to explicitly define their drought response priorities. Since resilience has the strongest influence on the performance of the other indicators, it should be carefully analysed and appropriately weighted when selecting the final scheduling strategy. These findings underscore the importance of a flexible, scenario-dependent approach to reservoir operation that balances short-term supply reliability with long-term system robustness and recovery capacity.
On the basis of the comprehensive analysis of the trade-offs among the multiple objectives, the resilience index is selected as the primary entry point for identifying and evaluating optimal solutions. This choice is grounded in the observation that resilience exerts the strongest influence on the performance of other key indicators, i.e., reliability, vulnerability, and water shortage, and serves as a critical determinant of the system’s ability to respond to and recover from drought-induced disruptions.
As shown in Figure 6, a clear nonlinear relationship exists between resilience and the other objective values. When the resilience index is less than 0.22, the corresponding degradation in REL, VUL, and AWS is relatively modest, suggesting that small gains in resilience do not significantly compromise the overall system performance. However, once the resilience index exceeds the threshold of 0.22, a sharp and accelerated deterioration occurs in the other three indicators. This inflection point signifies a trade-off boundary beyond which the pursuit of higher resilience leads to disproportionately high costs in terms of water supply reliability, increased vulnerability, and greater system-wide water shortages. Therefore, this threshold value of RES = 0.22 can be considered a critical decision-making reference for identifying balanced and cost-effective solutions that accommodate recovery capability and general supply performance.
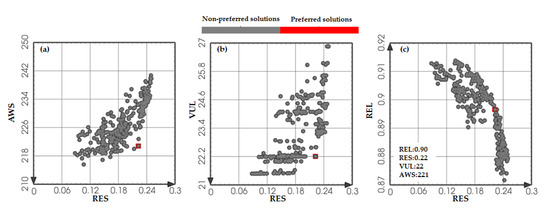
Figure 6.
Preferred solutions of the scheduling model considering water supply risk indicators (preferred solutions are marked with red squares). (a) RES and AWS, (b) RES and VUL, (c) RES and REL.
Under this selected threshold, the performance metrics of the system are as follows: the average duration from water supply disruption to full recovery is reduced to approximately 5 ten-day intervals, indicating a strong capacity for prompt response and restoration. The water supply reliability remains high, and the system is able to meet demand 90% of the time. The multiyear average of the single maximum disruption depth, which represents the most severe water deficit experienced in a single disruption event, stands at 22 × 106 m3, reflecting a moderate level of impact. Moreover, the multiyear average water shortage is 221 × 106 m3, suggesting that the system, although resilient, still maintains a reasonable balance between supply and demand across all water-user sectors.
In summary, the identification of this resilience threshold enables decision makers to select operation schemes that achieve a practical compromise between competing objectives, improving the drought-response performance of the reservoir system without incurring unacceptable losses in reliability or efficiency. This insight offers valuable guidance for developing more robust and adaptive reservoir scheduling strategies under climate variability and prolonged drought scenarios.
4.3. Drought Scenario Comparative Analysis
4.3.1. Comparison of Consecutive Dry Years
Using the preferred solution identified earlier, which is characterized by a resilience index of approximately 0.22 and a reliability of 90%, as a reference, we selected a solution from the conventional scheduling model with the same reliability level (REL = 90%) to ensure comparability under drought conditions. To assess the models’ performance under a realistic and severe drought scenario, we selected the historical inflow sequence from 1974 to 1979 at the Nierji Reservoir, a period recognized as one of prolonged and consecutive dry years. The initial water level of the reservoir was set at 199.0 m, corresponding to the 90% frequency level obtained via long-term simulation, which accurately reflects the severity of initial drought stress at the start of the scheduling period.
A detailed comparative analysis was then conducted between the scheduling results of the drought risk-aware model and the conventional scheduling model during this six-year drought window. The results of the comparison are shown in Figure 7 and summarized in Table 1. These results show that the model that incorporates water supply risk indicators outperforms the conventional approach in terms of the total water supply provided and the severity of shortages experienced by users.
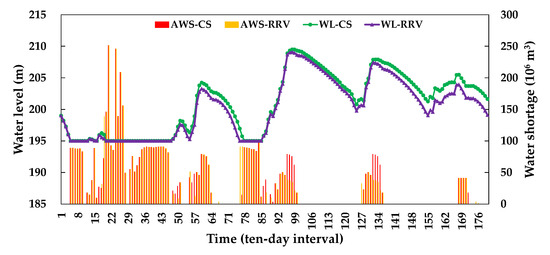
Figure 7.
Comparison of scheduling results during consecutive dry years.

Table 1.
Statistical comparison of the scheduling results during consecutive dry years.
Specifically, the average annual water shortage over the six-year period under the risk-aware model is 979 × 106 m3, which is 42 × 106 m3 less than the 1021 × 106 m3 observed in the conventional model. Although the overall reduction may appear modest in absolute terms, it reflects a more efficient and equitable allocation of limited water resources during multiyear droughts, which can considerably reduce the negative impacts on critical sectors, especially agriculture and domestic use.
In addition, the reservoir water levels under the risk-aware model are consistently lower than those under the conventional model, as shown in Figure 7. This outcome is primarily due to the model’s strategy of prioritizing water release to meet user demand and minimize service disruption during critical periods, even at the cost of maintaining lower reservoir storage levels. This proactive operation style helps avoid extended dry-out periods for users and increases the short-term adaptability of the system.
In terms of supply continuity, the average duration of consecutive water supply disruptions is 5 ten-day intervals under the risk-informed scheduling model, whereas it is 9 ten-day intervals under the conventional model. This substantial reduction in the duration of the disruption is a clear indicator of the enhanced resilience of the proposed model, which enables faster recovery from shortage events and more stable service provision. In Figure 7, the conventional model shows that multiple prolonged periods of water shortage can lead to cascading effects across sectors, resulting in greater economic, social, and ecological losses.
In conclusion, the simulation of this consecutive drought scenario confirms the practical advantages of incorporating reliability, resilience, and vulnerability indicators into reservoir operation models. The proposed model not only reduces system water shortages but also shortens the duration of disruptions, ensuring faster recovery and better support for critical water users. This effect highlights the importance of risk-based and adaptive scheduling strategies in addressing long-duration droughts and reinforces the model’s value as a robust tool for drought resilience planning.
4.3.2. Comparison of Single Dry Years
Using historical inflow data from the Nierji Reservoir, a Pearson Type III (P-III) distribution curve was fitted to characterize the runoff frequency. On the basis of this analysis, the runoff volume corresponding to the 75% exceedance probability, which represents a typical dry year condition, was estimated at approximately 7.15 billion m3. To select a representative single dry year for detailed study, the year 2002 was chosen because its annual runoff closely matches this 75% frequency runoff value. The intra-annual runoff distribution for the 75% frequency dry year was derived using the proportional method, which allocates the total annual runoff into smaller time intervals proportionally on the basis of historical flow patterns. To simulate realistic drought conditions, the initial reservoir water level was set according to the 90% frequency water level determined from long-term operation data, reflecting a relatively low and stressed reservoir storage status at the start of the dry year. This setup served as the basis for a detailed comparative analysis of scheduling results between the drought risk-aware scheduling model proposed in this study and the conventional scheduling model without explicit consideration of drought risk indicators.
As shown in Figure 8, under the representative dry year scenario, the model that incorporates drought period water supply risk indicators consistently produces water shortage levels that are less than or equal to those observed in the conventional scheduling model throughout all time periods. This finding indicates that the risk-aware model is more effective at managing scarce water resources during drought conditions, maintaining better supply reliability, and reducing the severity and frequency of shortages. Moreover, the risk-informed scheduling model achieves this improved performance by optimizing reservoir releases with a focus on enhancing system resilience and minimizing vulnerability rather than solely maximizing the short-term water supply or economic benefits. This approach results in a more balanced allocation that protects key water users and sustains environmental flows, even under limited inflow conditions.
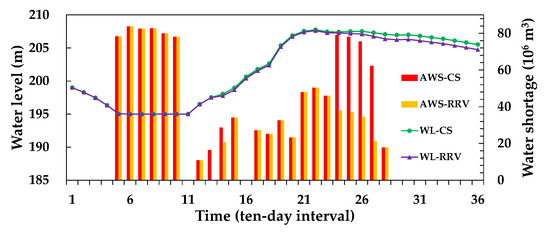
Figure 8.
Comparison of scheduling results during a dry year.
Overall, the results demonstrate that explicitly integrating reliability, resilience, and vulnerability indicators into reservoir operation models can considerably enhance drought management capabilities during single dry years. The model’s improved ability to mitigate shortages and maintain a stable water supply under adverse hydrological conditions highlights its practical value for reservoir operation planning and decision making in water-scarce regions facing increasing drought risk.
5. Conclusions
To better manage reservoir operations and reduce the impact of droughts on water users, this study introduces three water supply risk indicators—reliability, resilience, and vulnerability—into the scheduling model and constructs a reservoir operation model that considers drought response. A comparative analysis is conducted between the optimized solution sets of the scheduling model incorporating drought period water supply risk indicators and the conventional model without these considerations as well as their scheduling performance during consecutive dry years and a representative dry year. On the basis of analyses of water supply reliability, recovery capacity after supply disruption, and the severity of supply failures, the results demonstrate the effectiveness of the proposed model in drought period reservoir operations. The main conclusions of this study are as follows.
(1) The proposed scheduling model, incorporating drought period water supply risk indicators, significantly reduces the duration of supply disruptions, from 8–10 ten-day intervals in conventional scheduling to 4–6 intervals, thereby enhancing recovery and improving water supply resilience. It also moderately improves reliability and vulnerability while reducing overall water shortages, particularly for agricultural users. However, industrial, domestic, and environmental sectors experience slight increases in shortages.
(2) A strong trade-off exists between resilience and other indicators like reliability, vulnerability, and water shortage. Increasing resilience decreases reliability, worsens vulnerability, and raises water shortages. While excluding resilience improves the other indicators, prioritizing rapid recovery requires emphasizing resilience. When resilience is below 0.22, system performance deteriorates slowly, but it worsens rapidly above this threshold. The average recovery period is 5 ten-day intervals, with a system reliability of 90%, a maximum disruption depth of 22 × 106 m3, and an average water shortage of 221 × 106 m3.
(3) In comparisons of continuous dry years (1974–1979) and a single dry year (2002), the model incorporating drought water supply risk indicators outperforms the conventional model by significantly reducing shortages and supply disruption periods. During continuous dry years, the average annual water shortage is reduced to 979 × 106 m3 (compared with 1021 × 106 m3 in the conventional model), with disruption periods shortened to 5 ten-day intervals, minimizing economic losses. In the single dry year, the preferred solution consistently results in lower or equal water shortages, demonstrating better drought response capabilities.
Although the proposed reservoir operation model that incorporates water supply risk indicators demonstrates improved performance under drought conditions, several limitations should be acknowledged. First, the model’s effectiveness relies on accurate input data, including inflow forecasts and water demand projections, which are subject to uncertainties in climate and socioeconomic factors. Second, the study focusses primarily on static risk indicators and does not dynamically adjust for evolving drought conditions or user behaviours over time. Third, the model was tested on a specific case study, and its generalizability to other hydrological and management contexts may require further validation. Additionally, trade-offs between water users, particularly the increased shortages for nonagricultural sectors, highlight the need for more refined sectoral prioritization strategies. A further limitation is that the model uses a 10-day time step. The impact of using finer (e.g., daily) or coarser (e.g., monthly) time steps on the Pareto front and resilience results was not explored, which may affect the model’s sensitivity to temporal resolution. Future research should explore the integration of real-time data assimilation, adaptive operation rules, and stakeholder participation to further enhance the model’s practicality and robustness.
Author Contributions
Data collection and analysis were performed by R.T. and Y.W. The first draft of the manuscript was written by R.T. All authors have read and agreed to the published version of the manuscript.
Funding
This work was partially supported by the National Natural Science Foundation of China (Grant Nos: 52209028, 52109001) and Hebei Province’s Provincial Water Conservancy Science and Technology Planning Project (HBSL2025-11).
Data Availability Statement
The datasets generated and/or analysed during the current study are not publicly available owing to an obligation to the data provider, but they are available from the corresponding author upon reasonable request.
Conflicts of Interest
The authors declare no conflict of interest.
References
- Müller, L.M.; Bahn, M. Drought legacies and ecosystem responses to subsequent drought. Global Change Biol. 2022, 28, 5086–5103. [Google Scholar] [CrossRef]
- Naumann, G.; Cammalleri, C.; Mentaschi, L.; Feyen, L. Increased economic drought impacts in europe with anthropogenic warming. Nat. Clim. Change 2021, 11, 485–491. [Google Scholar] [CrossRef]
- Trenberth, K.E.; Fasullo, J.T.; Shepherd, T.G. Attribution of climate extreme events. Nat. Clim. Change 2015, 5, 725–730. [Google Scholar] [CrossRef]
- Dai, A. Increasing drought under global warming in observations and models. Nat. Clim. Change 2013, 3, 52–58. [Google Scholar] [CrossRef]
- Zhao, J.; Zhang, Q.; Zhu, X.; Shen, Z.; Yu, H. Drought risk assessment in China: Evaluation framework and influencing factors. Geogr. Sustain. 2020, 1, 220–228. [Google Scholar] [CrossRef]
- Zeff, H.B.; Kasprzyk, J.R.; Herman, J.D.; Reed, P.M.; Characklis, G.W. Navigating financial and supply reliability tradeoffs in regional drought management portfolios. Water Resour. Res. 2014, 50, 4906–4923. [Google Scholar] [CrossRef]
- Alahdin, S.; Ghafouri, H.R.; Haghighi, A. Multi-reservoir system operation in drought periods with balancing multiple groups of objectives. KSCE J. Civ. Eng. 2019, 23, 914–922. [Google Scholar] [CrossRef]
- Tang, R.; Li, K.; Ding, W.; Wang, Y.; Zhou, H.; Fu, G. Reference point based multi-objective optimization of reservoir operation: A comparison of three algorithms. Water Resour. Manag. 2020, 34, 1005–1020. [Google Scholar] [CrossRef]
- Wu, J.; Liu, Z.; Yao, H.; Chen, X.; Chen, X.; Zheng, Y.; He, Y. Impacts of reservoir operations on multi-scale correlations between hydrological drought and meteorological drought. J. Hydrol. 2018, 563, 726–736. [Google Scholar] [CrossRef]
- Hashimoto, T.; Stedinger, J.R.; Loucks, D.P. Reliability, resiliency, and vulnerability criteria for water resource system performance evaluation. Water Resour. Res. 1982, 18, 14–20. [Google Scholar] [CrossRef]
- Kundzewicz, Z.W. Renewal theory criteria of evaluation of water-resource systems: Reliability and resilience: Paper presented at ICWRS-workshop on risk and uncertainty in hydrologic design Oslo, Norway, february-1989. Hydrol. Res. 1989, 20, 215–230. [Google Scholar] [CrossRef]
- Rodak, C.; Silliman, S.; Bolster, D. Reliability, resilience and vulnerability criteria for the evaluation of time-dependent health risks: A hypothetical case study of wellhead protection. AGU Fall Meet. Abstr. 2012, 2012, H33I-1447. [Google Scholar]
- Myers, J.R.; Yeghiazarian, L. Systems reliability framework for surface water sustainability and risk management. AGU Fall Meet. Abstr. 2016, 2016, H41J-08. [Google Scholar]
- Zhang, C.; Xu, B.; Li, Y.; Fu, G. Exploring the relationships among reliability, resilience, and vulnerability of water supply using many-objective analysis. J. Water Resour. Plan. Manag. ASCE 2017, 143, 04017044. [Google Scholar] [CrossRef]
- Ren, K.; Huang, S.; Huang, Q.; Wang, H.; Leng, G.; Fang, W.; Li, P. Assessing the reliability, resilience and vulnerability of water supply system under multiple uncertain sources. J. Clean. Prod. 2020, 252, 119806. [Google Scholar] [CrossRef]
- Shenava, N.; Shourian, M. Optimal reservoir operation with water supply enhancement and flood mitigation objectives using an optimization-simulation approach. Water Resour. Manag. 2018, 32, 4393–4407. [Google Scholar] [CrossRef]
- Bayesteh, M.; Azari, A. Stochastic optimization of reservoir operation by applying hedging rules. J. Water Resour. Plan. Manag. ASCE 2021, 147, 04020099. [Google Scholar] [CrossRef]
- Giuliani, M.; Lamontagne, J.R.; Reed, P.; Castelletti, A. A state-of-the-art review of optimal reservoir control for managing conflicting demands in a changing world. Water Resour. Res. 2021, 57, e2021WR029927. [Google Scholar] [CrossRef]
- Tang, R.; Ding, W.; Ye, L.; Wang, Y.; Zhou, H. Tradeoff analysis index for many-objective reservoir optimization. Water Resour. Manag. 2019, 33, 4637–4651. [Google Scholar] [CrossRef]
- Moy, W.S.; Cohon, J.L.; ReVelle, C.S. A programming model for analysis of the reliability, resilience, and vulnerability of a water supply reservoir. Water Resour. Res. 1986, 22, 489–498. [Google Scholar] [CrossRef]
- Mondal, M.S.; Wasimi, S.A. Evaluation of risk-related performance in water management for the ganges delta of bangladesh. J. Water Resour. Plan. Manag. ASCE 2007, 133, 179–187. [Google Scholar] [CrossRef]
- Chanda, K.; Maity, R.; Sharma, A.; Mehrotra, R. Spatiotemporal variation of long-term drought propensity through reliability-resilience-vulnerability based drought management index. Water Resour. Res. 2014, 50, 7662–7676. [Google Scholar] [CrossRef]
- Srinivasan, K.; Neelakantan, T.; Narayan, P.S.; Nagarajukumar, C. Mixed-integer programming model for reservoir performance optimization. J. Water Resour. Plan. Manag. ASCE 1999, 125, 298–301. [Google Scholar] [CrossRef]
- Tang, R.; Zhang, J.; Wang, Y.; Zhang, X. Study on the basic form of reservoir operation rule curves for water supply and power generation. Water 2024, 16, 276. [Google Scholar] [CrossRef]
Disclaimer/Publisher’s Note: The statements, opinions and data contained in all publications are solely those of the individual author(s) and contributor(s) and not of MDPI and/or the editor(s). MDPI and/or the editor(s) disclaim responsibility for any injury to people or property resulting from any ideas, methods, instructions or products referred to in the content. |
© 2025 by the authors. Licensee MDPI, Basel, Switzerland. This article is an open access article distributed under the terms and conditions of the Creative Commons Attribution (CC BY) license (https://creativecommons.org/licenses/by/4.0/).