Article

Research on the Zoning of Watershed Aquatic Ecological Functions Based on a Distributed Hydrological Model

1
School of Resource and Environment Sciences, Quanzhou Normal University, Quanzhou 362000, China
2
School of Geographical Science, Fujian Normal University, Fuzhou 350117, China
3
College of Geography and Oceanography, Minjiang University, Fuzhou 350007, China
4
School of Computer and Information Engineering, Chuzhou University, Chuzhou 239000, China
*
Authors to whom correspondence should be addressed.
Water 2025, 17(16), 2464; https://doi.org/10.3390/w17162464
Submission received: 17 July 2025 / Revised: 17 August 2025 / Accepted: 18 August 2025 / Published: 20 August 2025

Abstract

This study aims to enhance the aquatic eco-functional zoning by incorporating the spatial variability of hydrological processes during the zoning process. We propose a method for watershed eco-functional zoning based on distributed hydrological modeling. Using the Jinjiang Basin in Southeast China as a case study, we applied the Soil Water and Assessment Tool (SWAT) model to delineate the basic zoning units and simulate their hydrological processes. We integrated natural environmental indicators—specifically topography, vegetation, meteorology, and hydrology—with land use as a measure of human activity, while accounting for their spatial variability. This approach enabled us to conduct both first-level and second-level eco-functional zoning of the watershed. The results indicated that (1) the Jinjiang Basin can be categorized into three main groups consisting of six first-level aquatic ecological zones, which reflect the spatial variability of terrestrial natural environmental factors and their influence on aquatic ecosystems; (2) building on this categorization, the first-level aquatic ecological regions were further divided into five categories comprising 18 second-level aquatic ecological functional zones, emphasizing the impact of human activities on aquatic ecosystems and their associated first-level ecological service functions; and (3) the application of hydrological simulation techniques allows for a comprehensive assessment of the spatial variability of hydrological processes, thereby enhancing the validity of the ecological function zoning results and providing robust technical support for watershed ecological function zoning.

1. Introduction

The concept of watershed aquatic ecological zoning is predicated on the spatial distribution patterns of watershed ecosystems, with the objective of enhancing the management of water resources, aquatic environments, and ecological systems [1]. Since the introduction of the ecoregion concept in 1967 [2], the delineation of aquatic ecosystems has become a critical foundation for the management and conservation of water environments. In 1987, the United States Environmental Protection Agency (EPA) proposed a framework for aquatic ecological zoning that was based on land use, soil type, vegetation, and hydrology, aimed at guiding water resource management and protection [3]. Biggs et al. (1990) [4] classified New Zealand into five aquatic ecological zones using indicators such as flow, water quality, benthic invertebrates, periphyton, and salmon, which were subsequently refined into 25 aquatic ecological zones by the country’s environmental protection agency [5]. In 2000, the European Commission introduced the Water Framework Directive (WFD), which categorized surface water bodies into four types of aquatic ecosystems: rivers, lakes, transitional waters, and coastal waters [6]. Austria delineated four categories of aquatic ecological zones nationwide based on river landscape characteristics, further subdividing them into 15 aquatic biogeographic regions according to benthic community structure [7]. Lorenz et al. [8] and Tison et al. [9] classified rivers in countries such as the UK, Germany, and France based on the spatial differences in macroinvertebrate, benthic algae, and aquatic plant communities. Rivers act as essential conduits for the transfer of materials, energy flow, and species information, providing significant ecological and social services [10,11]. Different aquatic ecosystems not only exhibit variability in ecological factors but also in their functional services. Therefore, it is crucial to account for differences in service functions in studies of water ecological zoning, although relevant research remains relatively sparse.
Currently, some researchers have begun to investigate the functional zoning of aquatic ecosystems [12,13,14]. The characteristics of river ecosystems and their service functions are closely linked to the physical conditions of the surrounding environment; thus, aquatic functional zoning should incorporate both aquatic ecological factors and the spatial variability of terrestrial environmental factors [15,16]. Among various terrestrial environmental factors, hydrological processes serve as a critical link between aquatic ecosystems and terrestrial environments, facilitating significant energy and information exchange, which determines the spatial distribution patterns of aquatic ecosystems [16,17]. Researchers have identified hydrological indicators for watershed zoning, including river network density, river curvature, channel width, and lake–reservoir ratio [14,18,19,20]. While these indicators provide some indirect insight into watershed hydrological processes, they are insufficient for objectively reflecting the characteristics of hydrological processes within watersheds. Therefore, how to fully account for the spatial heterogeneity of hydrological processes in the zoning of watershed aquatic ecological functions requires further investigation.
In the context of aquatic functional zoning, sub-watersheds are typically employed as the fundamental spatial units [16]. However, the sparse distribution of hydrological monitoring stations presents a significant challenge in acquiring hydrological process data for individual sub-watersheds. The Soil and Water Assessment Tool (SWAT), which utilizes sub-watersheds as its primary simulation units and effectively captures the spatial variability of water yield, sediment transport, and water quality throughout the watershed. Its simulation outputs for each sub-watershed have established the SWAT as a valuable tool for watershed management [21,22,23,24]. Consequently, additional research can be pursued regarding the application of the SWAT model in the functional zoning of watershed aquatic ecological functions.
The Jinjiang watershed, located in Quanzhou City on the southeastern coast of China, is one of the regions in Fujian Province most significantly affected by human activities, which have substantially altered the hydrological characteristics of its rivers [25,26]. This study utilizes the Jinjiang watershed as a case study to propose a watershed-scale ecological function zoning scheme based on hydrological modeling. The objective is to provide a scientific foundation for decision-making in the ecological management of the watershed while also offering methodological guidance for similar studies in other watersheds. The specific components of the research include the following: first, the development of an indicator system suitable for ecological function zoning of the watershed; second, the establishment of a SWAT model for daily runoff simulation to derive the basic units and runoff indicators necessary for ecological function zoning; and finally, the delineation of first-level and secondary ecological function zones within the watershed.

2. Study Area Overview and Data

2.1. Study Area Overview

The Jinjiang Basin, located in the southeastern coast of China, is the third largest river in Fujian Province, with a basin area of 5629 km2. The Jinjiang River is fed by two primary tributaries: the eastern tributary, which flows through the Shanmei Reservoir, and the western tributary, which passes by the Anxi Station. These tributaries converge 2.5 km upstream of the Shilong Station. The drainage area located upstream of Shilong encompasses 5042 km2, which constitutes our study area (see Figure 1). The Shanmei Reservoir, the largest reservoir in Quanzhou City, has a total storage capacity of 655 million m3. It plays a crucial role in agricultural irrigation, domestic water supply, power generation, and flood control for the Quanzhou region. The study area is characterized by subtropical monsoon climate, with an average annual temperature and precipitation of 20 °C and 1686 mm, respectively. Due to its location in Quanzhou City, the towns within the basin have a developed private economy and a high level of urbanization, with relatively active human activities that have significantly altered the underlying surface conditions of the basin [25] and have had a significant impact on the basin’s water resources, water environment, and aquatic ecology.

2.2. Data Sources

Spatial Data: This includes include a Digital Elevation Model (DEM), Normalized Difference Vegetation Index (NDVI, in 2005), soil types, and land use (in 2010). Considering the relatively short duration of the study, we assume that human activities have had minimal impact on land use changes; therefore, we treated the data as static. For the Normalized Difference Vegetation Index (NDVI), we selected the midpoint of the study period, specifically the year 2005, to represent the average conditions throughout the entire study duration. Both the DEM and NDVI data were obtained from the Resource and Environment Data Cloud Platform (https://www.resdc.cn/). Among them, the spatial resolution of the DEM is 30 × 30 m, and the NDVI is 1 × 1 km. The map of soil types was obtained by digitizing the soil type map (1:500,000) generated by the Fertilization Experiment Station of Fujian Province. The land use data were derived from the interpretation of the TM remote sensing images in 2010.
Hydrometeorological Data: Meteorological data (2001–2010) for driving the SWAT model, including 38 daily rainfall stations and two detailed weather elements gauges, were obtained from Fujian Provincial Meteorological Bureau. For hydrological model calibration, records of daily runoff (2001–2010) in Anxi, Shilong, were provided by Fujian Provincial Hydrological and Water Resources Survey Bureau. Additionally, daily inflow and outflow data from 2001 to 2010 for the Shanmei Reservoir were obtained from the Quanzhou Shanmei Reservoir Administration Bureau. Daily inflow data were utilized for the calibration of parameters in the runoff simulation for the catchment area of the Shanmei Reservoir. In contrast, daily outflow data were directly incorporated into the reservoir module of the model to simulate the outflow runoff from the reservoir.

3. Research Methods

3.1. Subdivision and Hydrological Simulation Based on the SWAT Model

The SWAT model is a distributed hydrological model with a strong physical mechanism [27], which has been widely applied to simulate the hydrological response in changing environment. Firstly, the model divides the basin into multiple sub-basins based on the DEM, and then each sub-basin further was divided into different hydrological response units (HRUs), with each HRU comprising the same land use and soil. Based on the principle of water balance, the hillslope water generation is simulated in each HRU; then the results of all the HRUs are summarized as the hillslope water generation within the sub-basin.
Previous research has shown that simulation outputs of model were seriously affected by watershed subdivision levels [28,29]. In order to ensure that the hydrological simulation indicators could reflect the spatial differences in the hydrological process as truly as possible, this paper refers to our existing research results and divides the Jinjiang Basin into 127 sub-basins [30]. In this study, the delineation of hydrological response units (HRUs) is based on four slope categories: 3.5%, 10.5%, 26.8%, and 46.6%. The thresholds for land use, soil, and slope are set at 5%, 10%, and 10%, respectively. Furthermore, to enhance the accuracy of spatial hydrological process simulations, a multi-site calibration approach is utilized [31]. This involves calibrating and validating daily runoff data at three hydrological stations: Anxi Station, Shanmei Station, and Shilong Station. The year 2001 was used as the model warm-up period, 2002–2006 as the calibration period, and 2007–2010 as the validation period. Three evaluation indicators, Nash–Sutcliffe efficiency coefficient (NSE), coefficient of determination (R2), and relative error (Re), were used to determine the goodness-of-fit performance of the model’s simulation [32].

3.2. Construction of the Regional Indicator System

In order to better reflect the spatial difference in natural environmental factors and human activities, as well as their impacts on the spatial differentiation of aquatic ecological system, this paper constructed an index system of regionalization with two different spatial scale levels. The first-level indexes mainly reflect the impact of large-scale natural environmental factors on aquatic ecological system, featuring relatively similar topographic, climatic, vegetation, and hydrological characteristics. Therefore, the specific indexes include the elevation, rainfall, NDVI. and runoff production. The secondary level indexes focus on the impact of human activities on the river ecosystem at a smaller spatial scale, which is a further subdivision of the first-level area. This study selects land use as the secondary level index reflecting the characteristics of human activities. The aquatic ecological significance of each indicator is shown in Table 1.

3.3. Aquatic Eco-Functional Zoning

The 127 sub-basins delineated by the SWAT model form the foundational units for the eco-functional zoning of the Jinjiang Basin. Utilizing the developed indicator system (Table 1), we calculated the first-level zoning indicator values for each sub-basin. Initially, we derived annual averages of hydrological parameters—total water yield, evapotranspiration, surface runoff, lateral flow, and groundwater flow—from the simulation results of the SWAT model for the years 2002 to 2010. Total water yield was selected as the first-level zoning indicator, as it effectively reflects the spatial distribution characteristics of hydrology within the basin. The other hydrological parameters were utilized to validate the rationality of the zoning.
Subsequently, a spatial overlay analysis was conducted using measured data on elevation, precipitation, and vegetation, in conjunction with the sub-basin layers. This analysis provided the average elevation, annual average precipitation (2001–2010), and average Normalized Difference Vegetation Index (NDVI) for 2005 for each sub-basin. These metrics served as zoning indicators that reflect the spatial distribution characteristics of topography, climate, and vegetation within the basin.
Building on this foundation, we employed a bottom-up agglomerative clustering method to classify the first-level aquatic ecological zones. In this approach, each classification sample was treated as an independent class, and hierarchical merging was performed based on the similarity between samples until all samples were consolidated into a single class. In this study, each sub-basin was treated as an independent classification sample. The classification variables included the previously mentioned statistical indicators: elevation, precipitation, NDVI, and total water yield. Prior to conducting the cluster analysis, we standardized the data to scale them within the range of −1 to 1. Subsequently, the Euclidean distance method was employed to calculate the distance between each pair of sub-basins based on their zoning indicator values, thereby quantifying their similarity. The between-groups linkage method was applied to merge the two classes with the smallest average distance into a single class. This iterative process facilitated the hierarchical clustering of the sub-basins within the Jinjiang Basin. In the final classification results, if any ecological zone exhibited spatial discontinuity, manual fine-tuning were made in accordance with the principle of regional contiguity to ensure spatial continuity within the same ecological functional zone. In the process of manual fine-tuning, full consideration should be given to the physical connections between sub-watersheds, such as river connections. The first-level ecological zones represent spatial variations in natural environmental factors and their effects on aquatic ecosystems, which are inherently associated with topography. Consequently, the nomenclature for this level adheres to the format: “Topography + Aquatic Ecological Zone”.
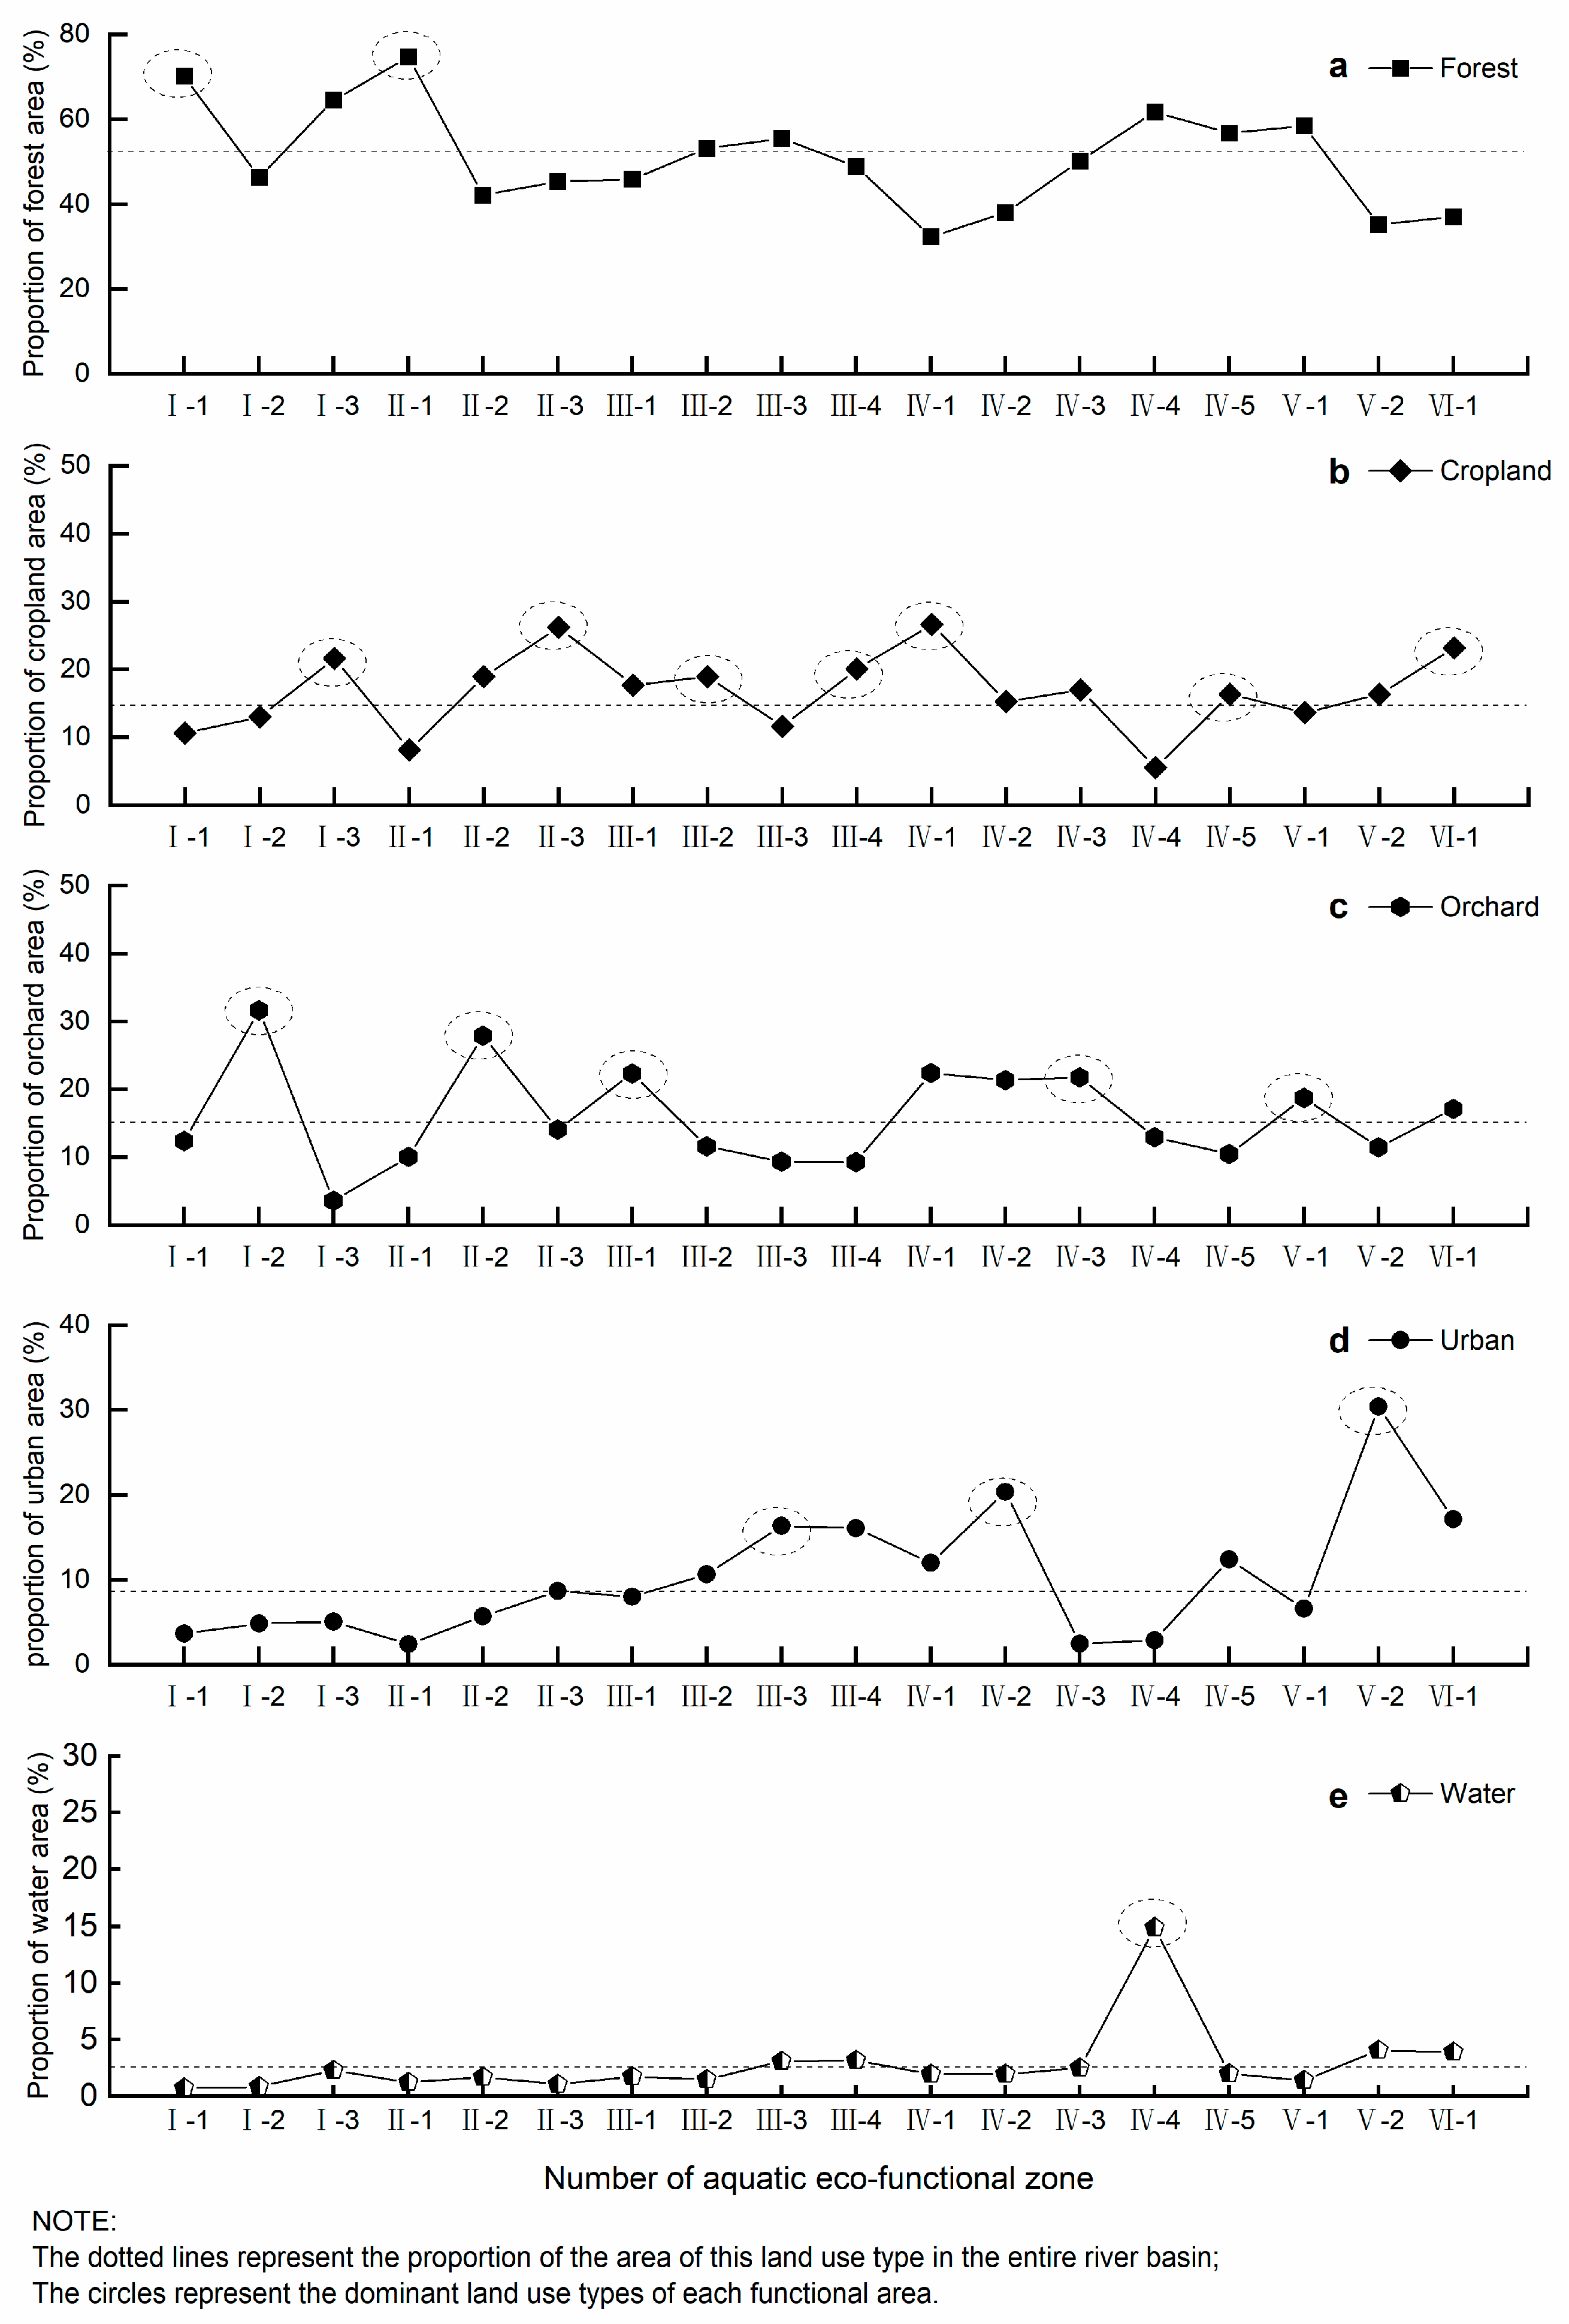
The secondary aquatic eco-functional zones primarily reflect the impact of human activities on aquatic ecosystems at a smaller spatial scale. Based on the secondary zoning indicators (Table 1), this study proposes a zoning method based on the dominant land use types. First, the area proportions of each land use type are calculated at the watershed scale, representing the average land use conditions. Second, the area proportions of each land use type are computed at the sub-watershed scale and compared with the average land use conditions. If only one type of land use exceeds the average land use conditions, that type is designated as the dominant land use type within the sub-watershed. In cases where two or more land use types exceed the average conditions, a comparative analysis of their proportions is required to identify the type that most significantly surpasses the average state of the entire watershed, which will then be classified as the dominant land use type for the sub-watershed. Subsequently, sub-watersheds exhibiting the same dominant land use type within the primary water ecological zone are combined to form secondary water ecological functional zones that reflect similar impacts of human activities. The secondary aquatic eco-functional zones primarily represent the dominant functions of river ecosystems; therefore, their nomenclature follows the format: “Dominant Function of Aquatic Ecosystem Service + Functional Zone”.

4. Results

4.1. Daily Runoff Simulation Results

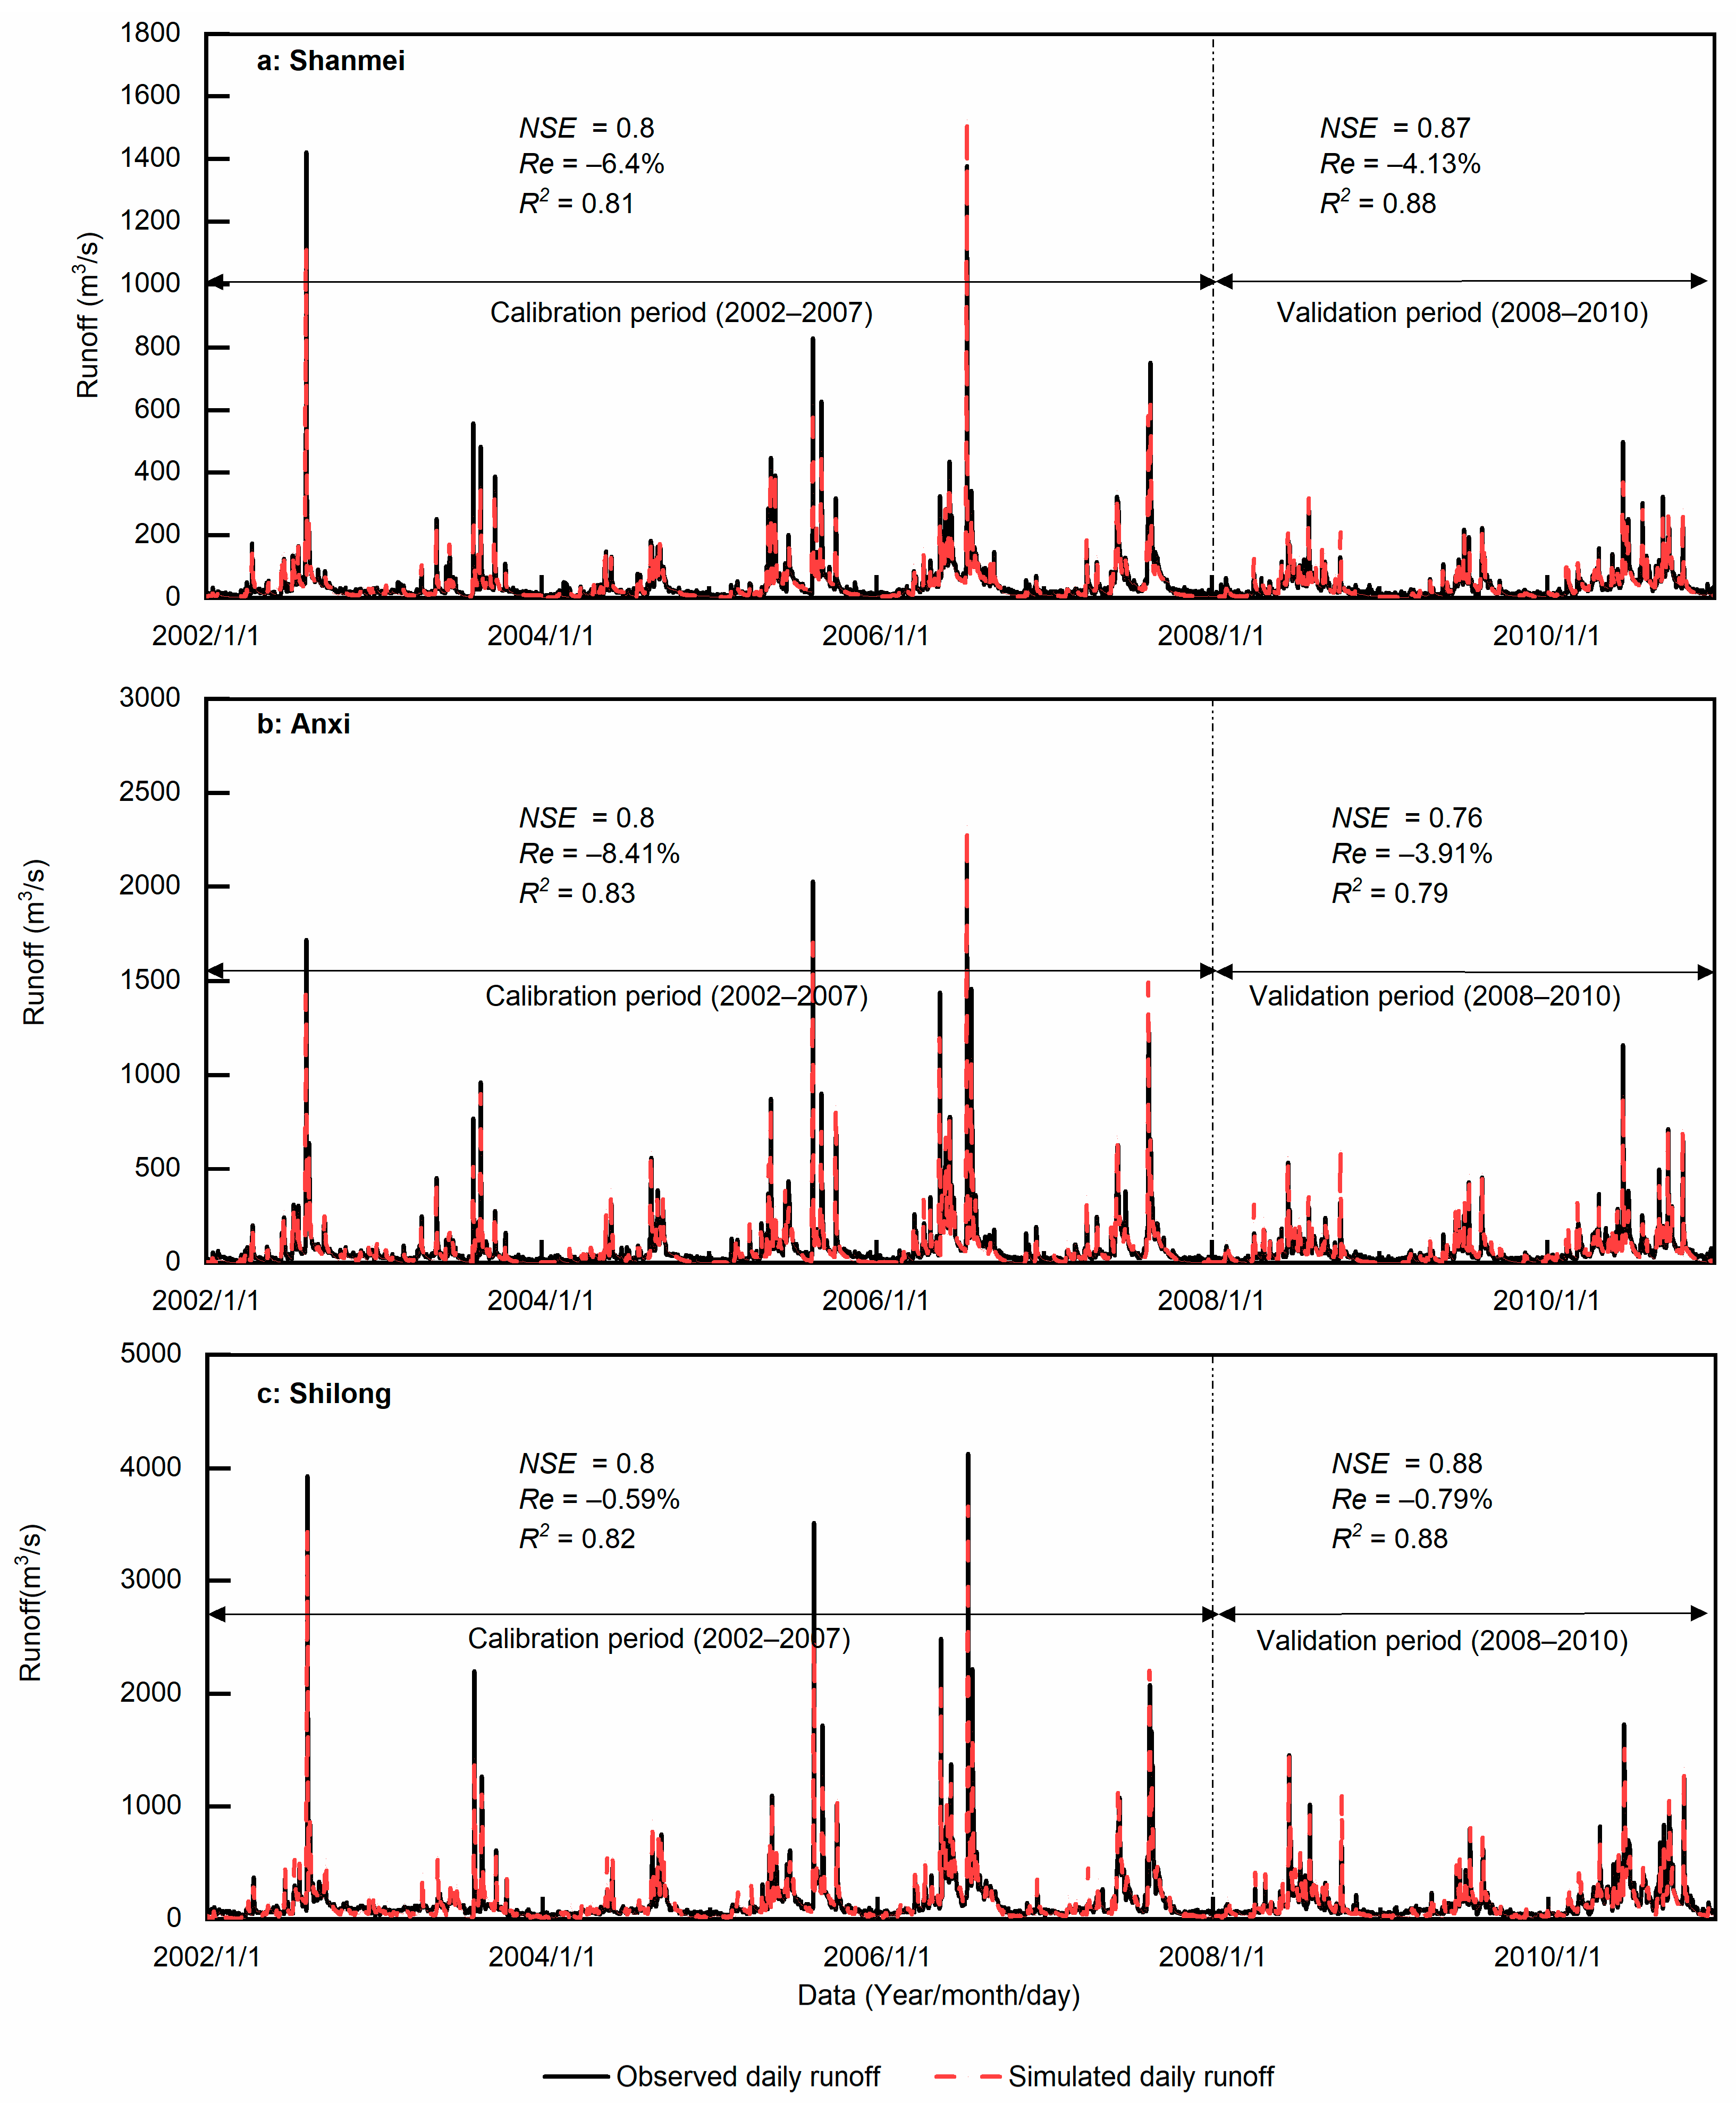
Seven sensitive model parameters (RCHRG_DP, SOL_AWC, CN2, GWQMIN, SOL_K, GW_DELAY, CH_K2, GW_REVAP) were manually calibrated, and the optimal values of the parameters were listed in Table 2. The results of the daily runoff simulation for the Jinjiang Basin are illustrated in Figure 2. The simulated daily runoff values for both the calibration and validation periods at the three hydrological stations closely match the observed data (Figure 2). An evaluation of the simulation performance metrics indicates that, with the exception of the Anxi station during the validation period (NSE = 0.76), the NSE values for the three stations during both calibration and validation periods reached 0.8, while the R2 values also approached 0.8. The absolute Re remained within 10%, satisfying the accuracy requirements for model simulations. This suggests that the model effectively captures the spatial distribution of hydrological processes in the Jinjiang Basin, making the simulation results suitable for studies on watershed water ecological functional zoning.
Using the model simulation results, the multi-year average water yield (2002–2010) for each sub-watershed was calculated, as depicted in Figure 3. The statistical analysis reveals significant spatial variability in the hydrological characteristics of the Jinjiang Basin. The headwaters of the basin are characterized by abundant water resources, with an average annual water yield ranging from 850 to 1400 mm during the period from 2002 to 2010. In contrast, the upper and middle valley regions of Xixi, the downstream plain area, and the region below the Shanmei Reservoir in Dongxi are predominantly classified as low runoff areas, exhibiting a multi-year average water yield of only 600 to 800 mm. This highlights the importance of considering the spatial variability of hydrological processes when evaluating the impacts on aquatic ecosystems during the functional zoning process.

4.2. First-Level Aquatic Zones and Their Characteristics

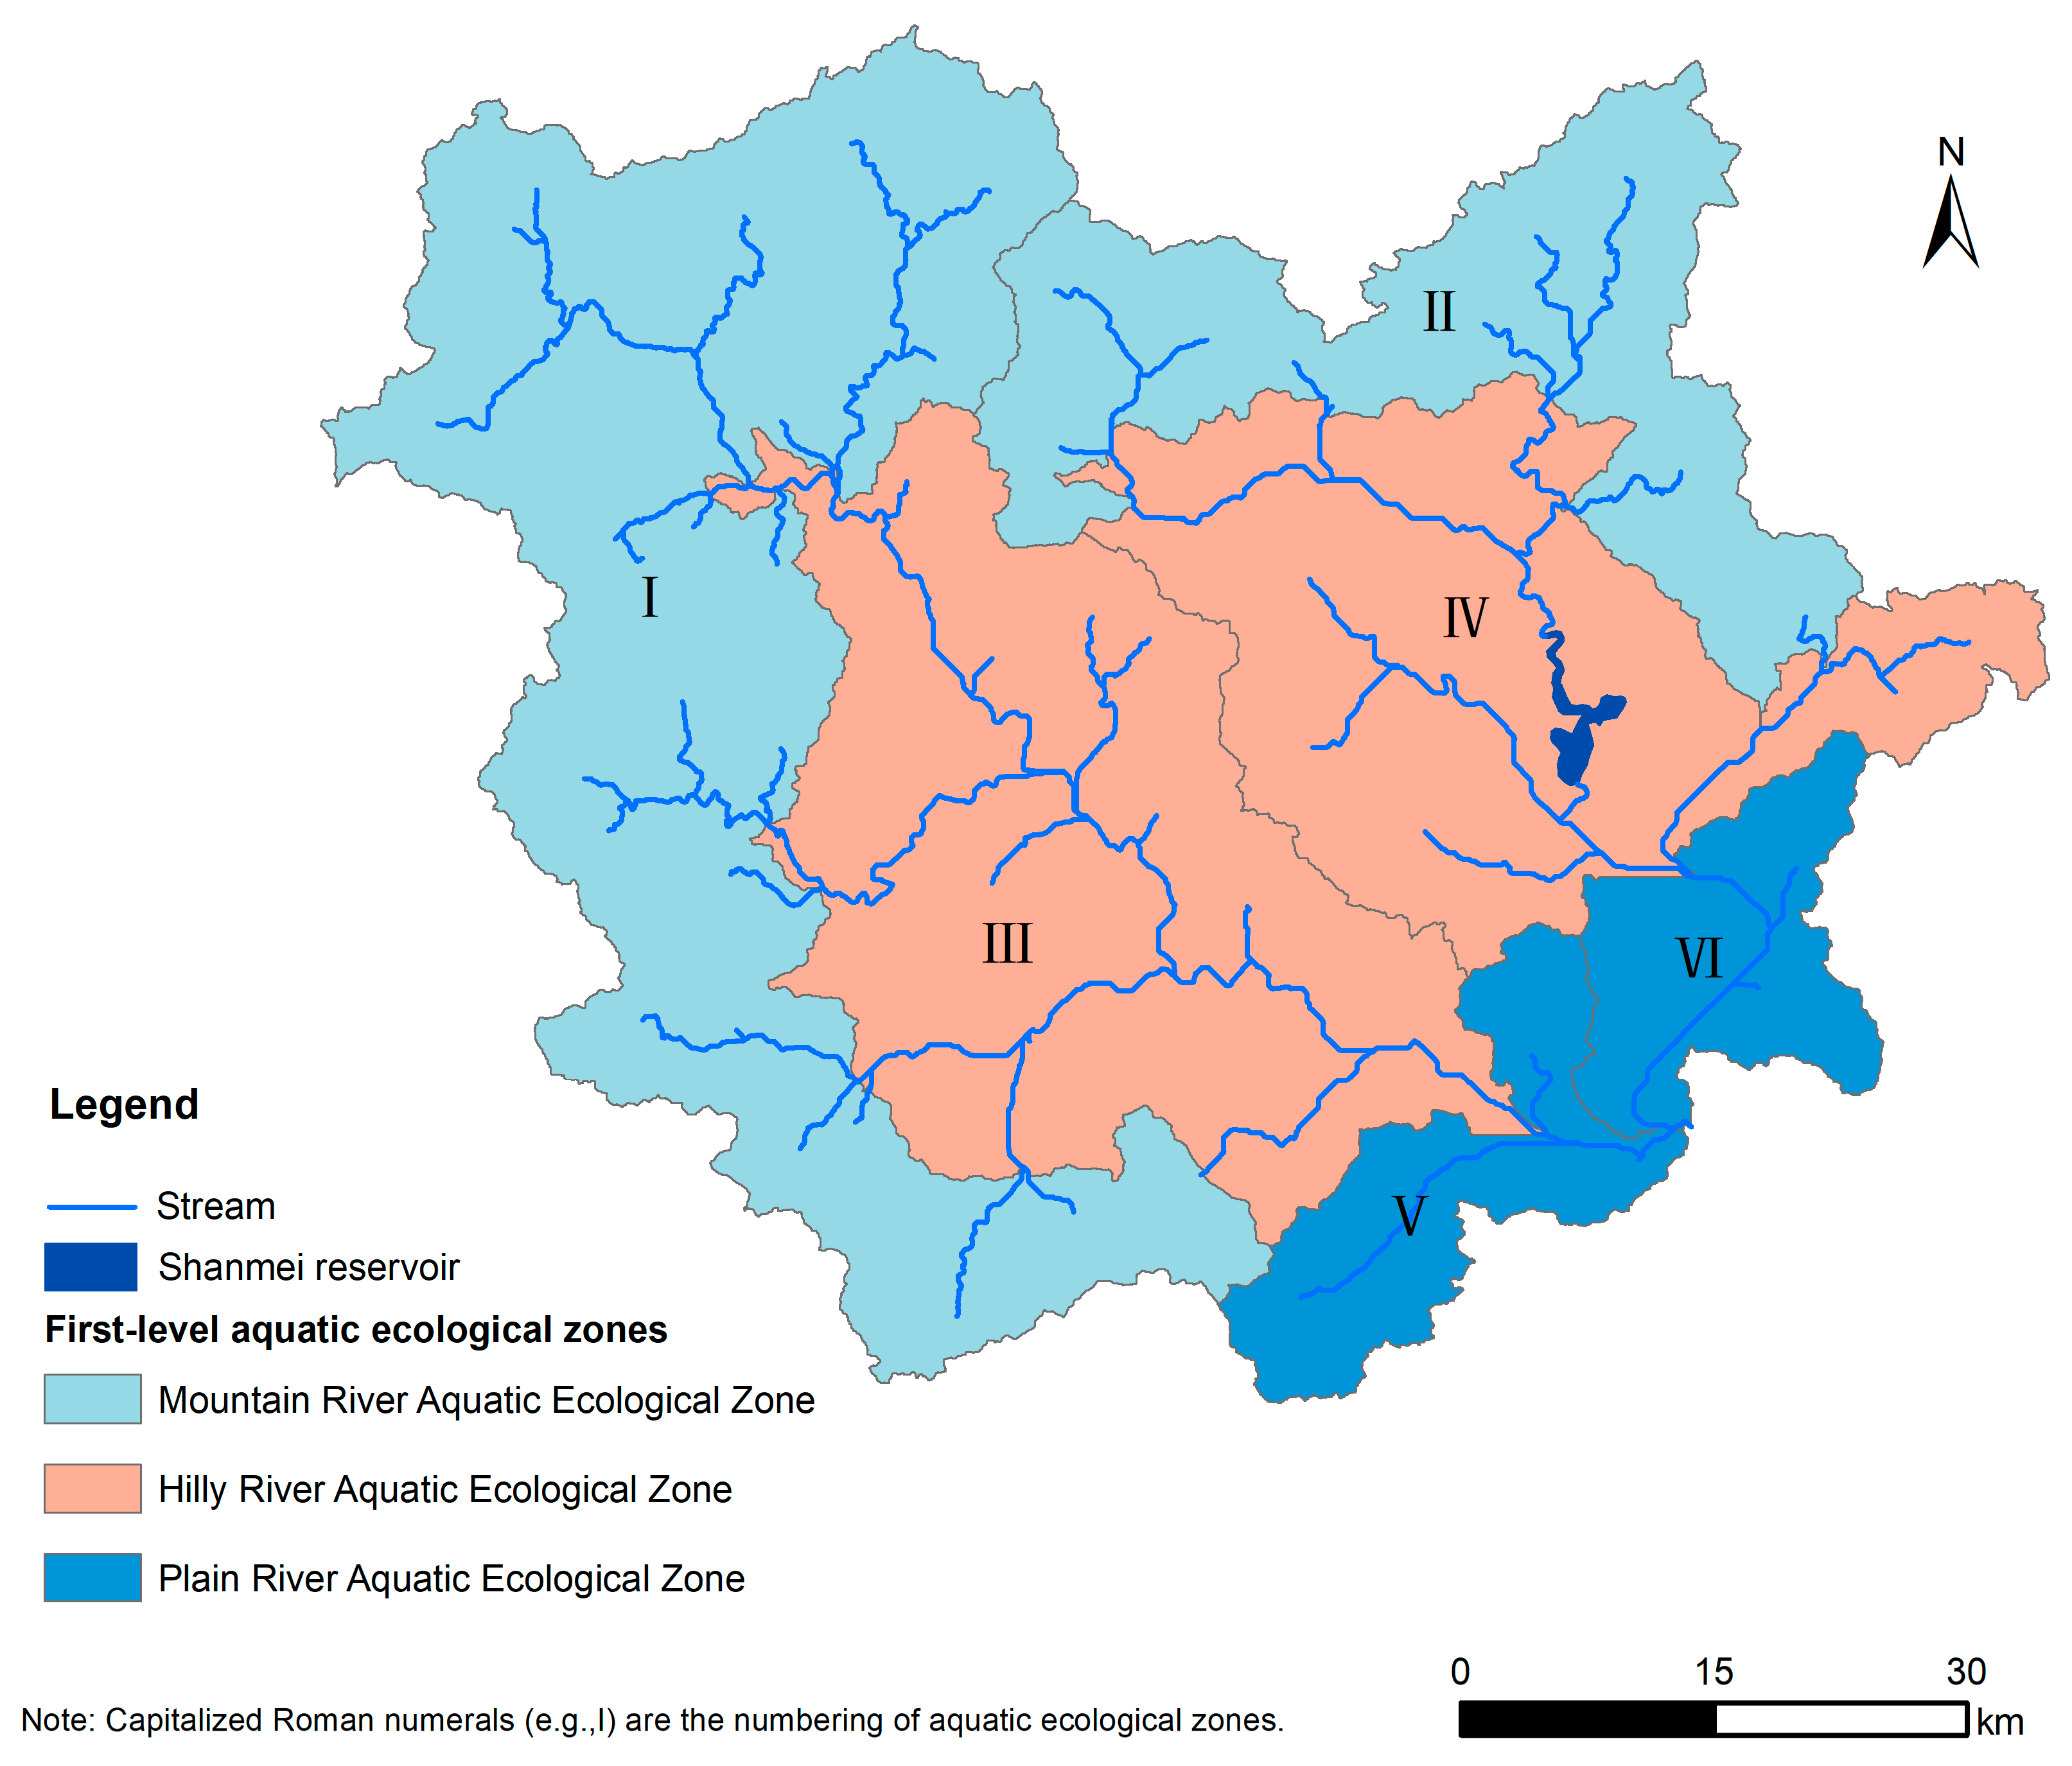
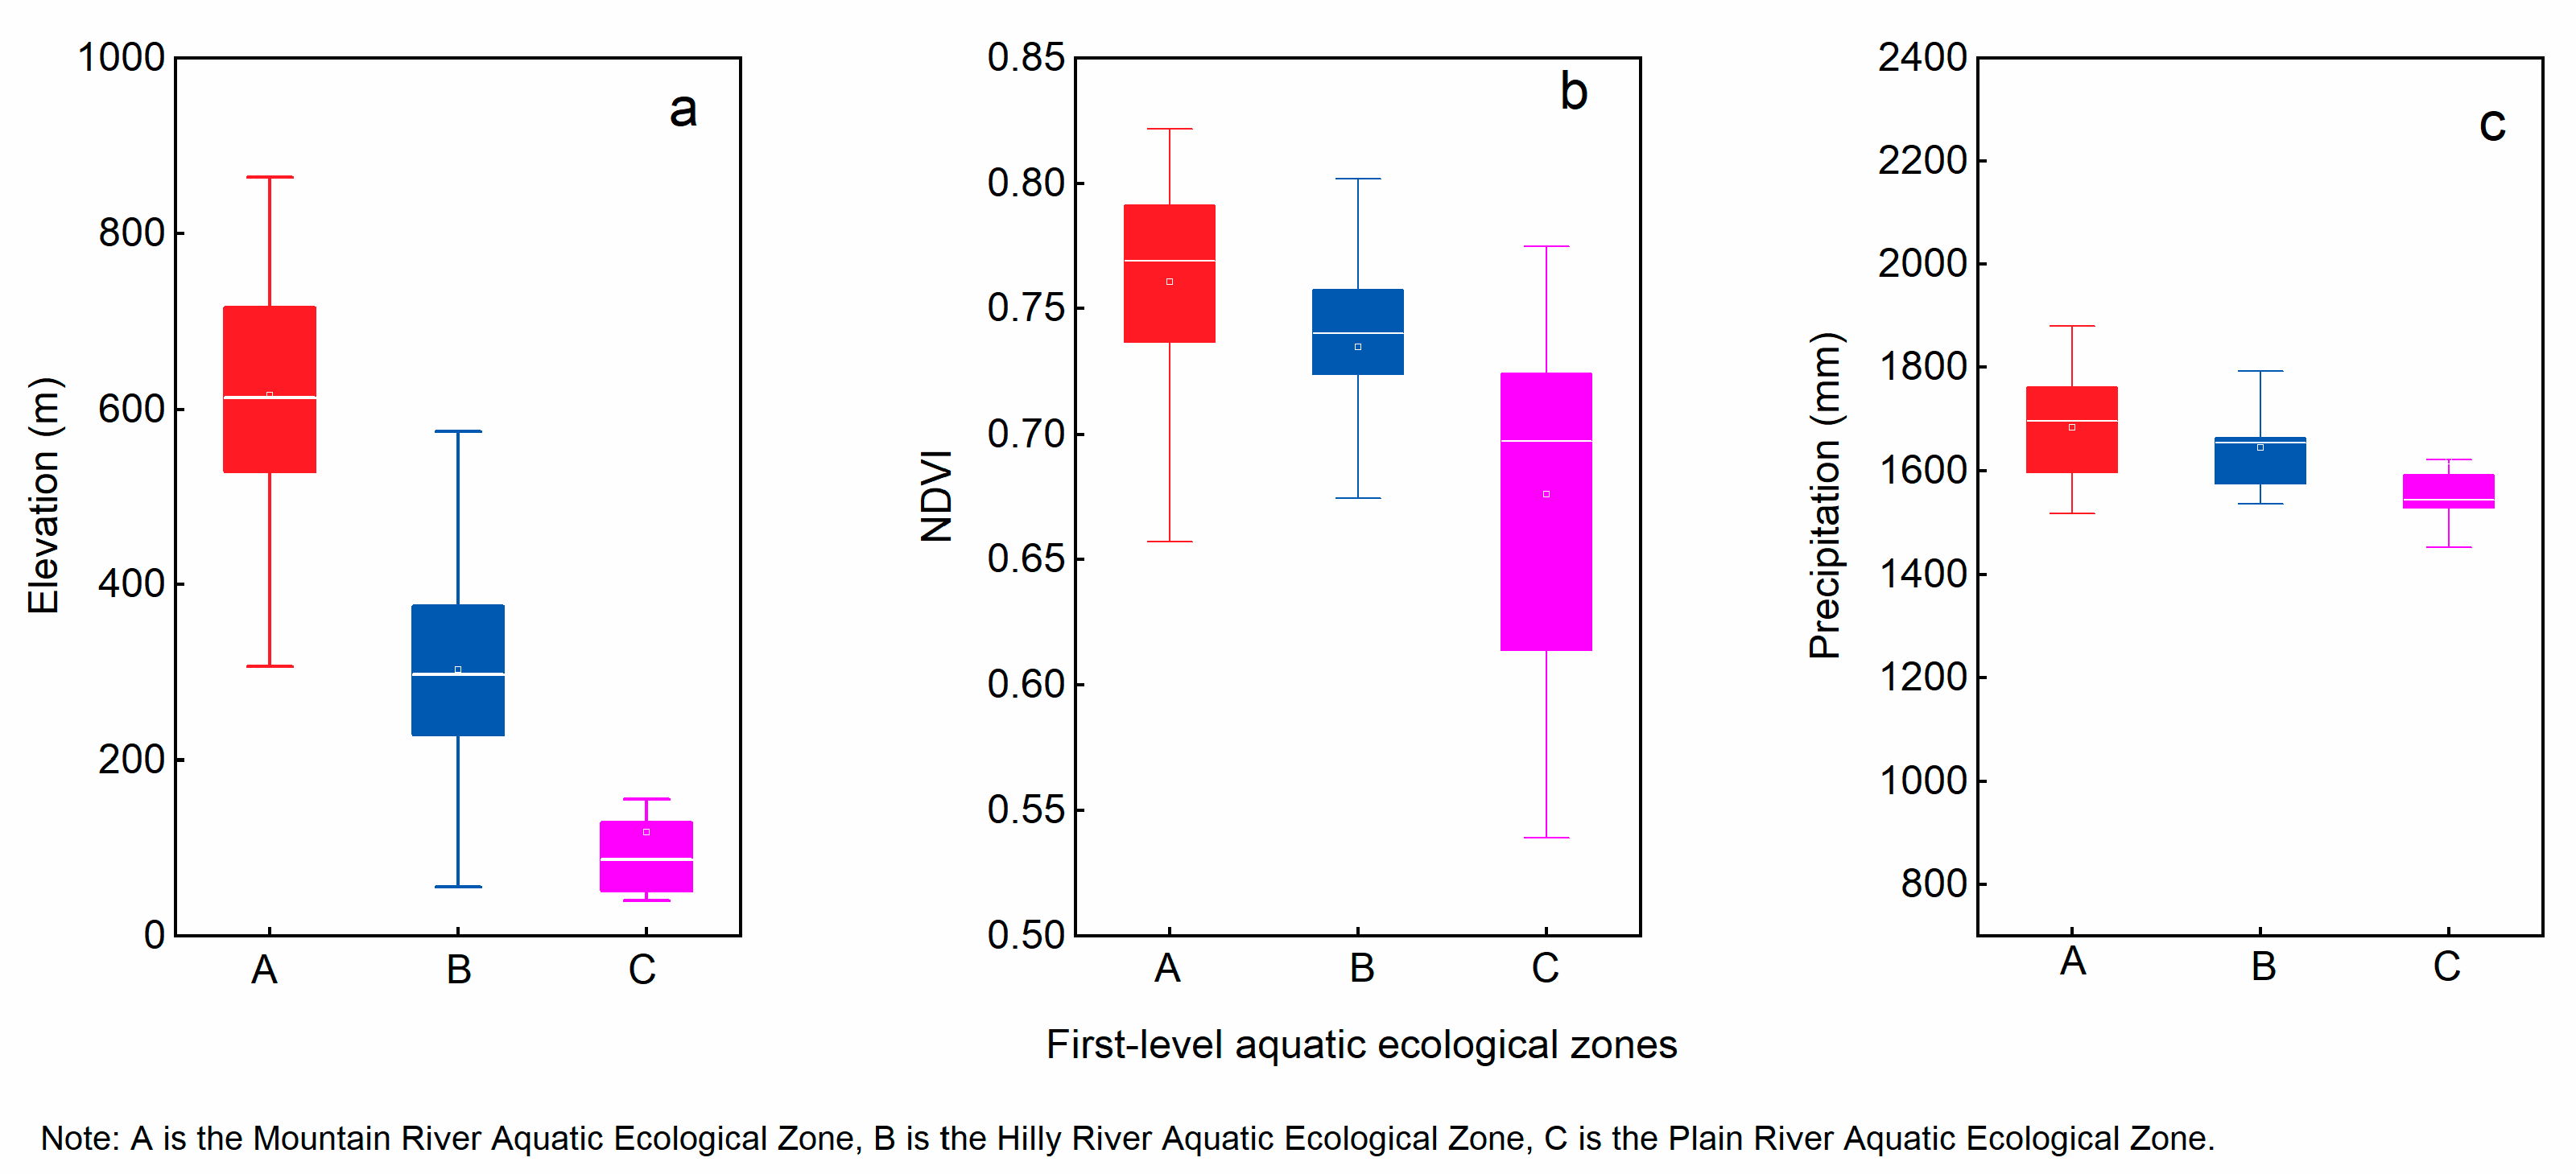
Utilizing statistical data on the average elevation, average Normalized Difference Vegetation Index (NDVI), annual water yield, and precipitation from 2002 to 2010 for each sub-basin, we conducted a hierarchical clustering analysis of the Jinjiang Basin. This analysis led to the classification of the Jinjiang Basin into three categories of first-level aquatic ecological zones: the Mountainous River Aquatic Ecological Zone, the Hilly River Aquatic Ecological Zone, and the Plain River Ecological Zone (Figure 4). Additionally, considering the independence of the Dongxi and Xixi tributaries, we further subdivided the same type of aquatic ecological zone that spans both tributaries into two distinct aquatic ecological zones. Consequently, we delineated a total of six first-level aquatic ecological zones for the entire watershed (Figure 4). The statistical characteristics of the natural environment for each first-level zone are summarized in Figure 5.
The first category is the Mountainous River Ecological Zone, which includes the I. Upper Xixi—Mountainous River—Aquatic Ecological Zone and (Figure 4) II. Upper Dongxi—Mountainous River—Aquatic Ecological Zone. This category is situated in high-altitude regions (average elevation of 616 m, Figure 5a) and is characterized by high vegetation coverage (average NDVI of 0.76, Figure 5b). Furthermore, this type of aquatic ecological zone also has the most abundant precipitation, with an annual rainfall of up to 1684 mm (Figure 5c).
The second category is the Hilly River Ecological Zone, which comprises the III. Midstream Xixi—Hilly River—Aquatic Ecological Zone and (Figure 4) IV. Midstream Dongxi—Hilly River—Aquatic Ecological Zone. Compared with the Mountainous River Ecological Zone, this type of aquatic ecological zone has a lower altitude and less vegetation coverage and precipitation, with average values of 303.5 m, 0.73, and 1646.7 mm, respectively (Figure 5).
The third category is the Plain River Ecological Zone, which includes the V. Downstream Xixi—Piedmont Plain River—Aquatic Ecological Zone and VI. Downstream Dongxi—Piedmont Plain River—Aquatic Ecological Zone (Figure 4). This category is located in downstream plain areas and is characterized by the least vegetation coverage and precipitation (Figure 5).
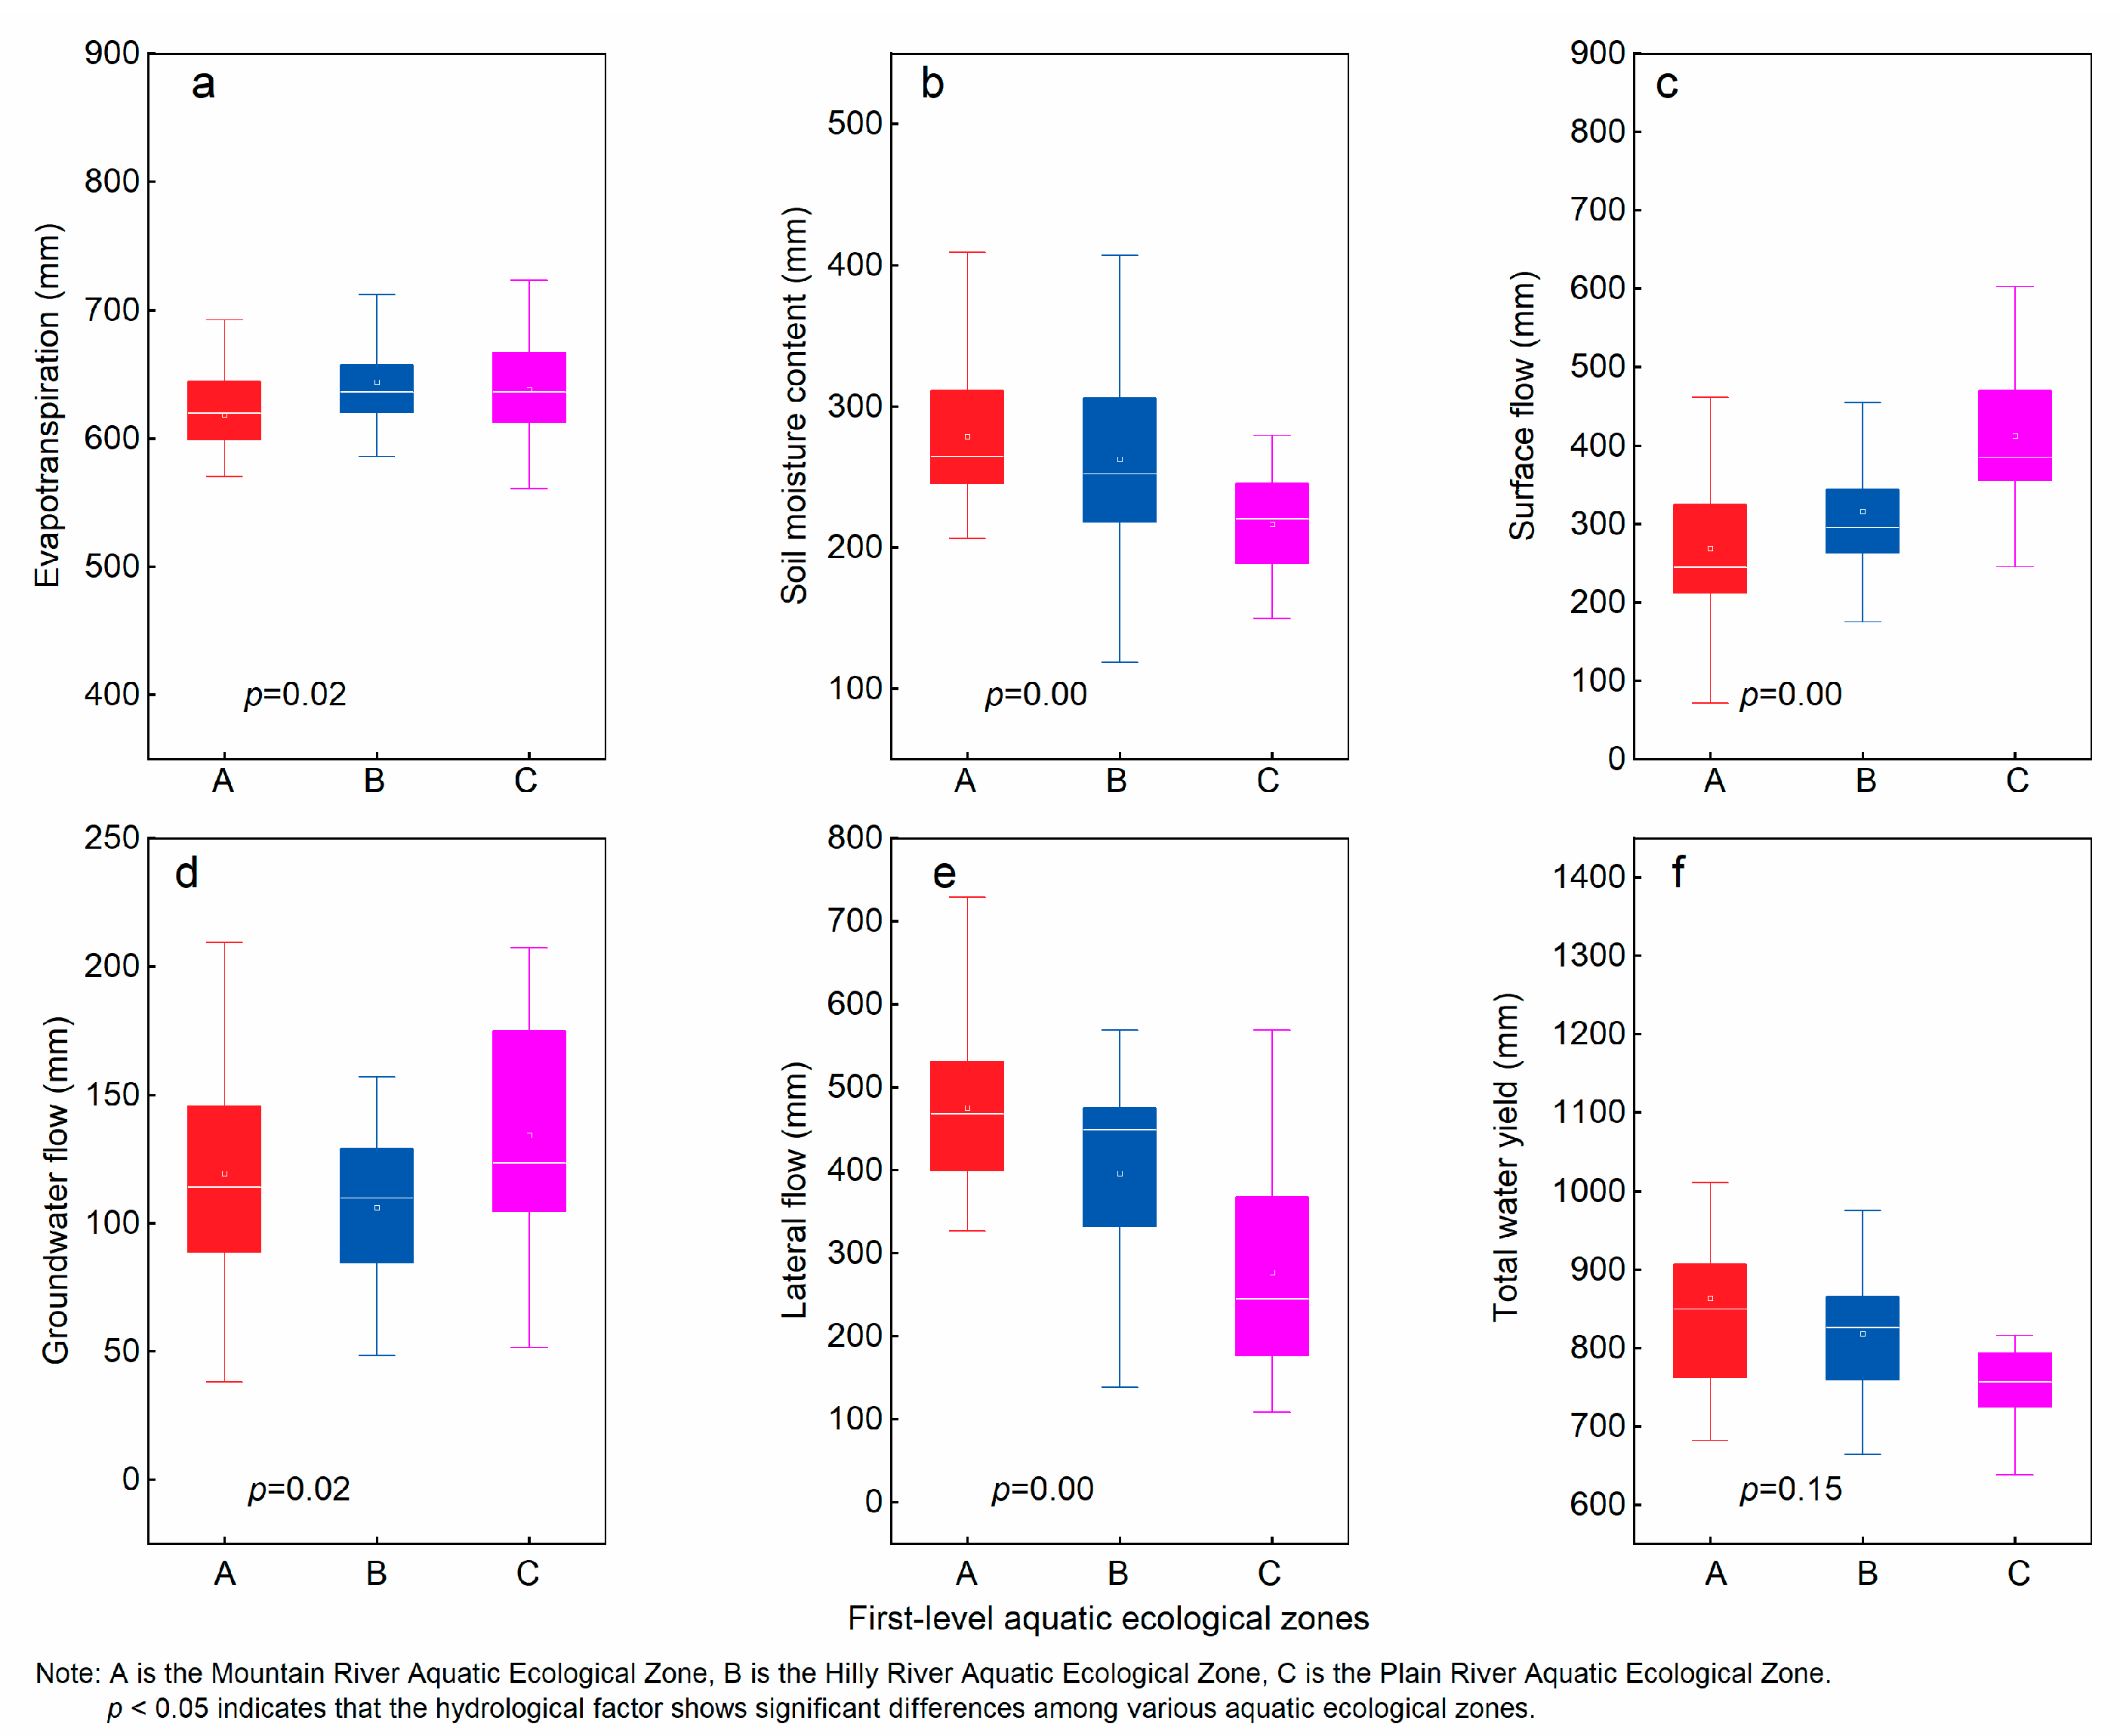
Figure 6 presents boxplots illustrating the hydrological factors, including evapotranspiration, soil moisture content, surface flow, groundwater flow, soil lateral flow, and total water yield, across the different aquatic ecological zones. An ANOVA test conducted to assess the differences in these hydrological elements among the three aquatic ecological zones revealed that the majority of p-values were less than 0.05, indicating significant differences in the hydrological elements across the various aquatic ecological zones. As illustrated in Figure 6a, there is minimal variation in evapotranspiration from the upstream Mountainous River Ecological Zone to the downstream Plain River Ecological Zone, with a slight increasing trend observed. In contrast, surface runoff exhibits a marked increase, with an average multi-year surface runoff of 268.4 mm in the upstream mountainous zone, escalating to 412.5 mm in the downstream zone (Figure 6c). Conversely, soil moisture content (Figure 6b), soil lateral flow (Figure 6e) and total water yield (Figure 6f) are substantially greater in the upstream mountainous river ecological zone (278.6 mm, 475.6 mm, 863.3 mm) compared to the midstream hilly ecological zones (262.4 mm, 396 mm, 817.5 mm) and downstream piedmont plain ecological zones (216.3 mm, 277 mm, 823.5 mm). From the upstream to the downstream, only the groundwater flow has no obvious pattern of change (Figure 6d).
These findings indicate that the upstream mountainous river ecological zone plays a vital role in water conservation, significantly regulating runoff and protecting aquatic habitats in the middle and lower reaches of the basin. This observation also underscores the validity of the first-level aquatic ecological zoning to a considerable extent.

4.3. Secondary Aquatic Eco-Functional Zoning and Their Characteristics

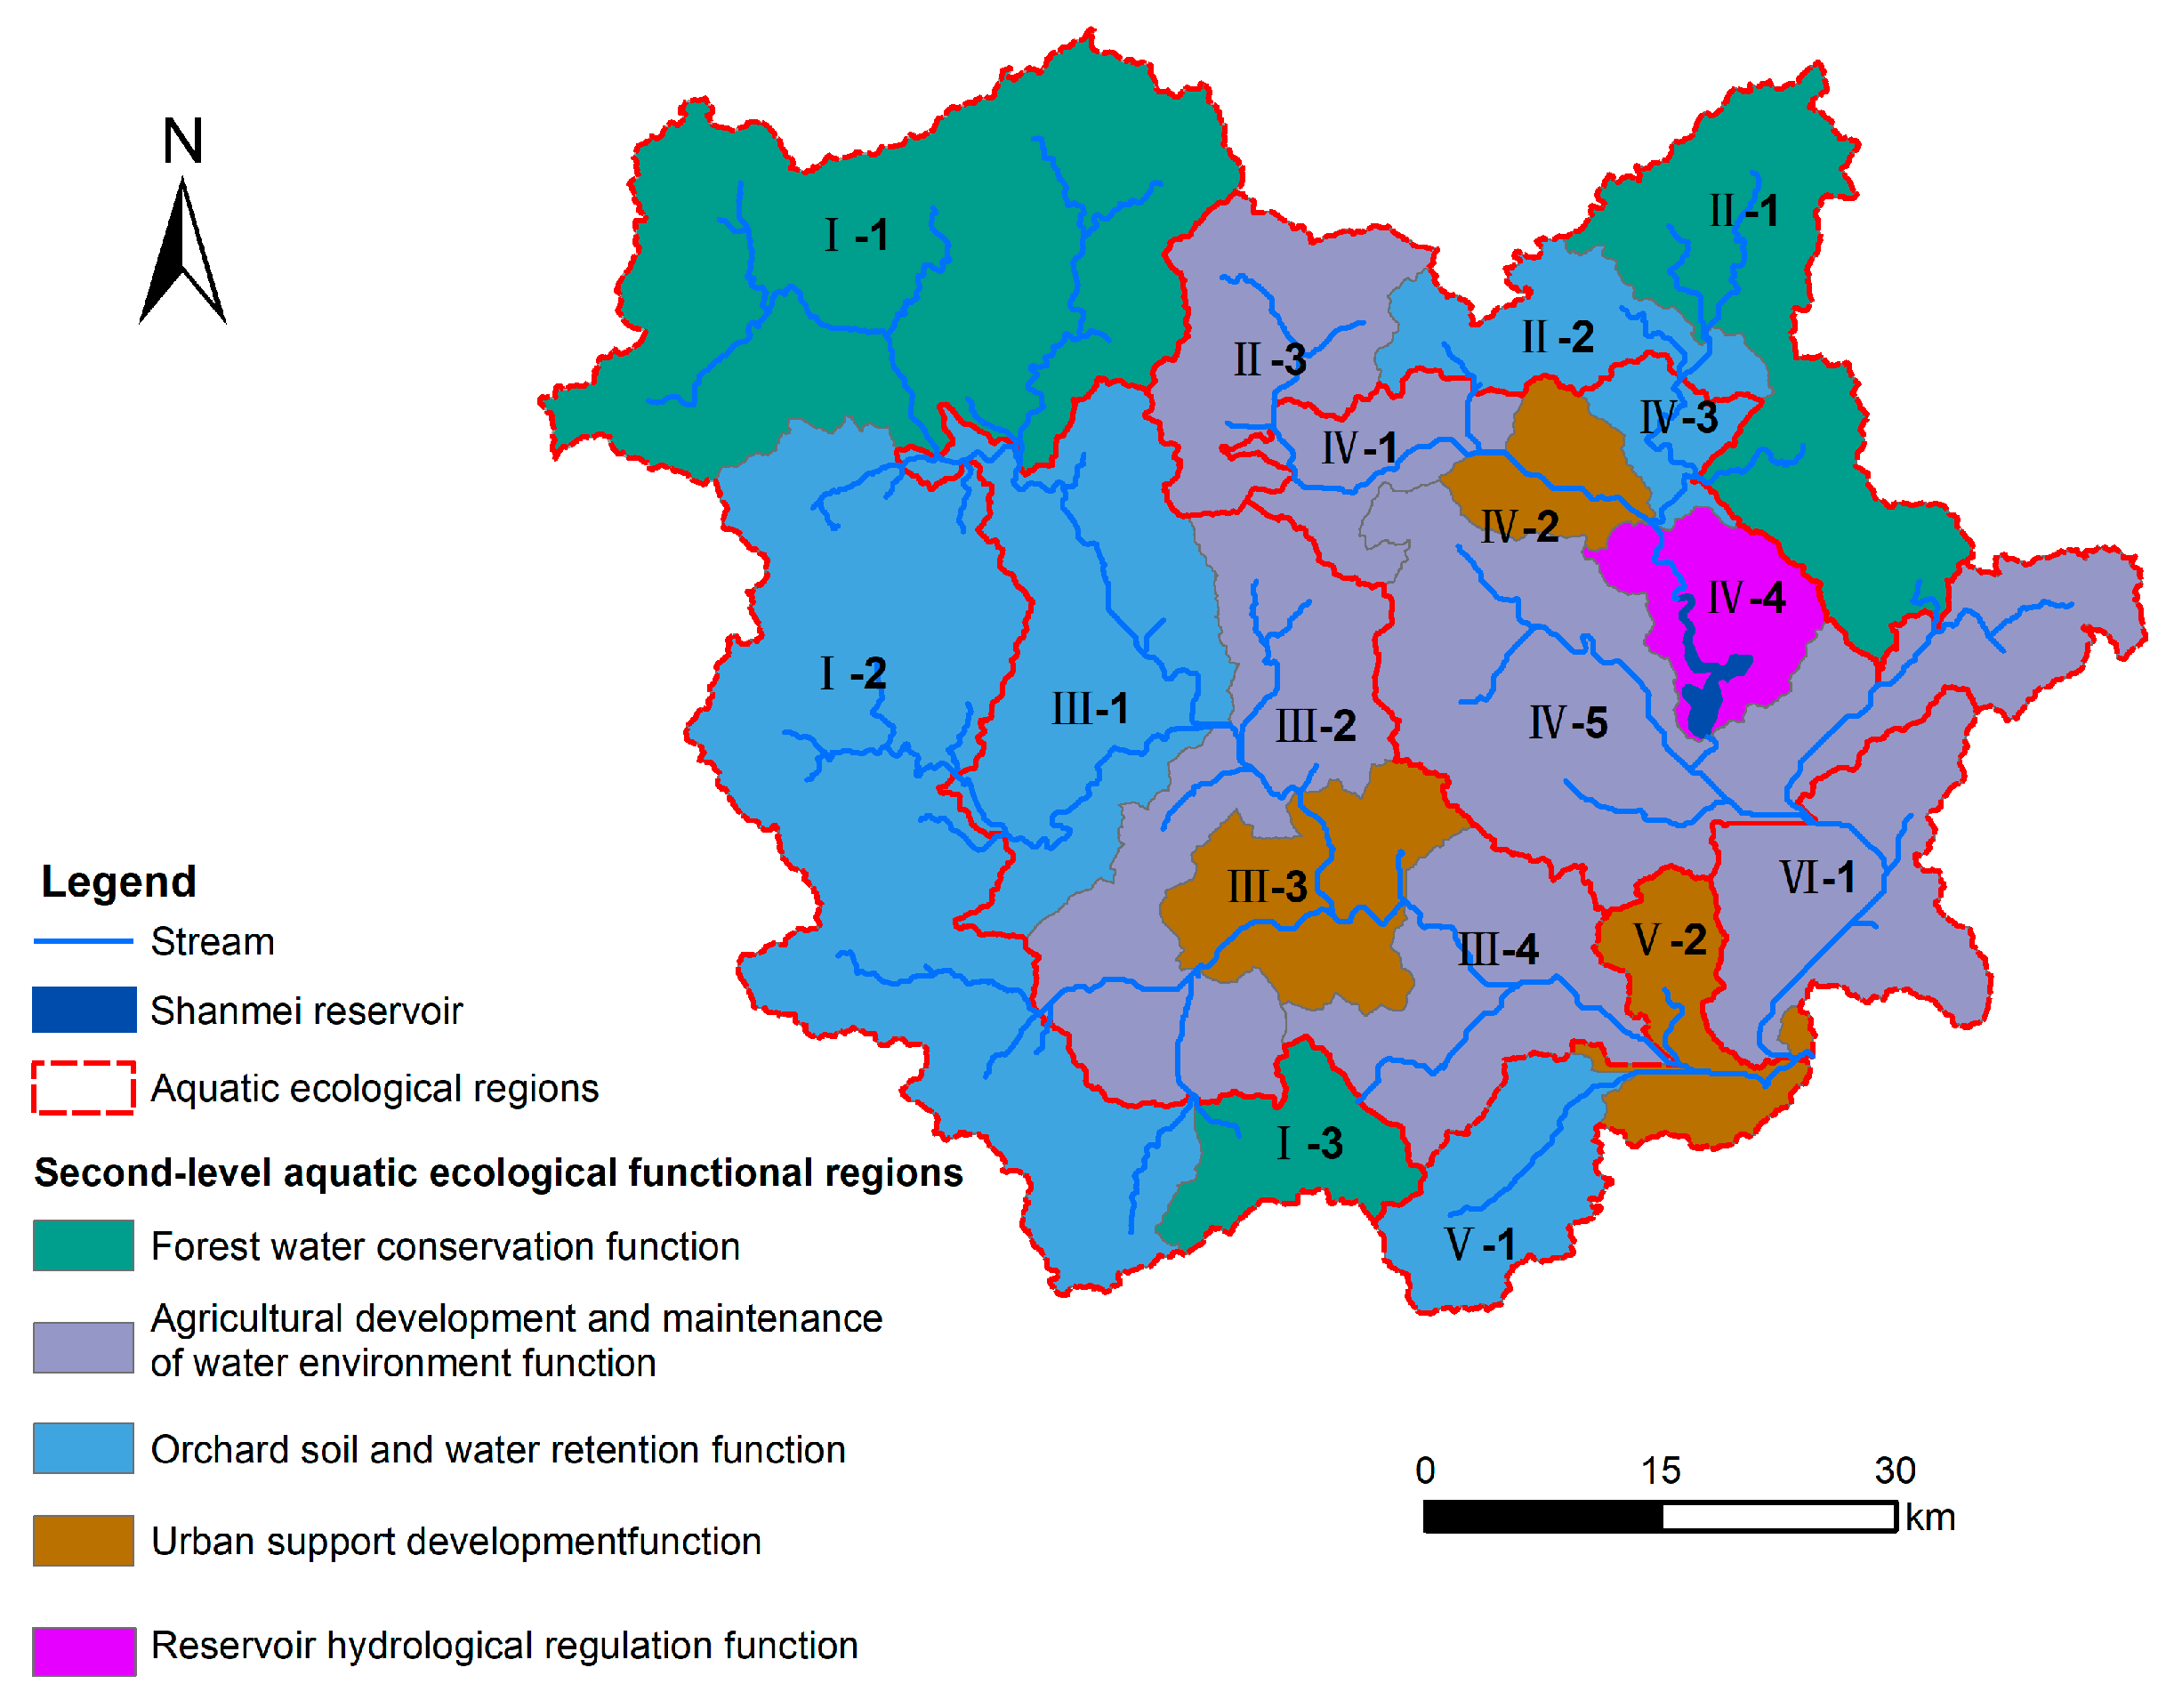
Building upon the delineation of first-level water ecological zones, the Jinjiang Basin has been subdivided into 18 secondary water ecological functional zones. These zones are categorized into five distinct types based on indicators for secondary water ecological functional zoning, specifically the predominant land use types. The categories are as follows: (1) Forest Water Conservation Functional Zone, (2) Agricultural Development and Maintenance of Water Environment Functional Zone, (3) Orchard Soil and Water Retention Functional Zone, (4) Reservoir Hydrological Regulation Functional Zone, and (5) Urban Support Development Functional Zone (Figure 7).
The Forest Water Conservation Functional Zone encompasses three areas (I-1, I-3, II-1) (Figure 7), where forest land constitutes over 64.5% of the total area, significantly surpassing the basin-wide average of 54% (Figure 8a). These zones are situated within the mountainous river ecological regions of the first-level zones, characterized by high forest cover, minimal human disturbance, and abundant water resources. Their first-level ecological functions include runoff regulation and water source conservation.
The Agricultural Development and Maintenance of Water Environment Functional Zone consists of six areas: II-3, III-2, III-4, IV-1, IV-5, and VI-1 (Figure 7). A notable feature of these regions is the substantial area of arable land, with cultivated land surpassing the average proportion of arable land across the entire watershed, which is 16.87% (Figure 8b). Agricultural activities not only require significant water resources but also contribute to serious non-point source pollution challenges. The first-level ecological functions of these areas are centered on agricultural water supply and water quality enhancement.
The Orchard Soil and Water Retention Functional Zone consists of five areas (I-2, II-2, III-1, IV-3, V-1) (Figure 7), which have experienced extensive development of orchards and tea gardens. The proportion of orchard area in the upper, middle, and lower reaches is 27.9%, 21.8%, and 16.8% (Figure 8c), respectively. The large-scale development of these agricultural lands has raised significant concerns regarding soil erosion, leading to the first-level function of this zone being the control of soil erosion.
The Urban Support Development Functional Zone are primarily situated in the middle reaches of Yongchun County (IV-2) and Anxi County (III-3), as well as in the downstream region of Nanan City (V-2) (Figure 7), where the proportions of urban construction land are 16.37%, 20.35%, and 30.42% (Figure 8d), respectively. These ecological function areas are characterized by elevated levels of socio-economic activities. Their main functions include facilitating human habitation, providing recreational water landscapes, and treating urban wastewater generated from both industrial production and daily activities.
The Reservoir Hydrological Regulation Functional Zone (IV-4) encompasses the Shanmei Reservoir, the only large reservoir within the Jinjiang watershed and the largest in the region (Figure 7), and the aquatic eco-function zone has the largest proportion of water area (Figure 8e). This reservoir, often referred to as the “Lifeblood of Quanzhou,” plays a vital role in hydrological regulation. It ensures a continuous water supply for downstream agricultural irrigation, industrial activities, and residential drinking water through effective management. Additionally, it functions as a flood control mechanism by regulating water levels during flood seasons, thereby protecting the lives and properties of downstream residents. During dry seasons, it also provides ecological flow to downstream rivers.

5. Discussion

Water is a fundamental and dynamic component of ecosystems, serving as the essential medium for life. Hydrological processes are key drivers of material cycling and energy flow within these systems. Various environmental factors, including climate change within the watershed, surface characteristics, and anthropogenic activities, significantly influence the composition, structure, and function of aquatic ecosystems primarily by altering hydrological processes [16].
In this study, the Jinjiang watershed is delineated into five distinct water ecological functional zones, each defined by unique environmental factors and hydrological processes, resulting in diverse ecological functions. The extensive forest cover in the Forest Water Conservation Functional Zone facilitates the accumulation of precipitation during wet periods, thereby mitigating surface runoff. During dry periods, this forest cover contributes to river flow replenishment through soil moisture retention and groundwater recharge [24,33]. Additionally, this type of aquatic eco-function zone is mainly located in the upper reaches of the river basin, with the most abundant precipitation (Figure 5c) and water yield (Figure 6d). Therefore, it plays a crucial role in water conservation and the regulation of river runoff throughout the watershed.
In contrast, the extensive tea plantations established in the watershed, while providing significant economic benefits, have been shown to severely disrupt natural surface vegetation. This disruption reduces the surface’s capacity to intercept rainfall, resulting in increased surface runoff, exacerbated topsoil erosion, and enhanced transport of soil particles, leading to serious soil erosion issues [34,35,36]. The Orchard Soil and Water Retention Functional Zone is mainly located in the upper and middle reaches of the river basin, with relatively high rainfall (Figure 5c) and water yield (Figure 6d). Soil erosion also has a significant impact on the aquatic ecosystem. Therefore, the first-level function of the aquatic ecological system in this region is to control soil erosion and safeguard soil resources. Conversely, in terraced farming areas, a considerable amount of rainfall is captured and infiltrated by the terraces during runoff events, ultimately reducing runoff efficiency [37,38].
The extensive use of chemical fertilizers and pesticides in agricultural practices can lead to non-point source pollution, particularly as a result of rainfall runoff. Research has demonstrated that agricultural runoff is a significant contributor to the elevated concentrations of nitrogen and phosphorus compounds in rivers [39,40]. In this region, the aquatic ecosystem is heavily dependent on agricultural water supply and the maintenance of water quality. Reservoirs, which are hydraulic engineering structures designed for flood control and runoff regulation, play a crucial role in the temporal and spatial redistribution of natural water resources. This is especially important for large reservoirs, as their hydrological regulation functions are vital for flood prevention, drought mitigation, and the efficient utilization of water resources within the watershed [41,42,43]. For instance, the construction of the Shanmei Reservoir in Jinjiang has led to a reduction in the average duration of droughts and a significant decrease in drought intensity at the Shilang hydrological station [26].
Urban development typically occurs in low-lying plain areas adjacent to major rivers, which are characterized by high flow and stable water volumes. The aquatic ecosystems in these regions can meet substantial water demands for urban industrial and agricultural production, residential needs, and urban landscaping, while also exhibiting strong capabilities for purifying wastewater generated by urban activities. Overall, it is imperative to recognize that hydrological processes not only connect and transmit elements of the natural environment and human activities but also serve as significant influencing factors themselves. Therefore, the spatial variability of these processes must be carefully considered in the functional zoning of aquatic ecosystems.
The SWAT model, a distributed hydrological model designed for watershed analysis, accounts for the spatial heterogeneity of meteorological variables and underlying surface conditions. This capability enhances the accuracy of simulating spatial variability in hydrological processes. Its application in delineating water ecological function zones effectively addresses the challenge of insufficient spatial distribution density of hydrological monitoring stations. This study has implications for future research, primarily in two areas. First, the SWAT model has demonstrated its ability to accurately simulate the spatial variability of water yield, sediment transport, and water quality at the watershed scale. This capability effectively addresses the challenge of obtaining hydrological process-related indicators for aquatic eco-functional zoning. Additionally, given the increasing focus on river health assessments across various aquatic ecoregions [44,45], the use of hydrological models in eco-functional zoning can provide comprehensive simulated data for evaluating river health in different zones. Furthermore, it facilitates the assessment and prediction of the impacts of human activities and climate change on river health through scenario modeling. Thus, this methodology serves as a valuable scientific reference for future research on river ecosystem health management.
However, this study also has certain limitations. First, due to the insufficient quantitative analysis of the relationships between hydrological processes and aquatic ecosystems, we relied solely on total water yield as the zoning indicator for hydrological processes. This approach may result in an inadequate representation of these processes and increase uncertainty. Future research should aim to quantify these relationships further to identify more representative hydrological indicators for zoning purposes. Second, the current lack of aquatic biological observation data limits the validation of zoning results. Subsequent studies should incorporate biological data (e.g., aquatic fauna, flora, and algae) to analyze biodiversity indices, species richness, endemic rarity, and biological integrity indices. Such data would not only enhance the zoning indicators but also provide a more robust foundation for verifying zoning results.

6. Conclusions

(1)
The Jinjiang Basin can be categorized into three categories and six first-level aquatic ecological zones based on natural environmental factors such as topography, precipitation, vegetation, and hydrology. This classification reflects the spatial variability of these factors and their effects on river ecosystems.
(2)
By incorporating predominant land use types, the Jinjiang Basin can be subdivided into five categories and eighteen second-level aquatic eco-functional zones, which build upon the first-level aquatic ecological zones. This subdivision highlights the extent to which human activities influence river ecosystems and the services they provide.
(3)
The sub-basins delineated using the SWAT model serve as critical spatial units for the eco-functional zoning of the basin, thereby preserving the integrity of river ecosystems. By integrating hydrological simulation data from each sub-basin, this methodology effectively addresses the challenges associated with obtaining hydrological zoning indicators, thereby providing reliable technical support for the ecological functional zoning of the basin.
The zoning process primarily considers terrestrial environmental factors, encompassing both natural and anthropogenic influences. However, it does not analyze the spatial variability within river ecosystems nor does it investigate the relationship between terrestrial and riverine ecosystems. Future research should focus on enhancing the analysis of spatial differences in aquatic ecosystems and assessing the validity of the zoning outcomes.

Author Contributions

Data curation, M.L.; Formal analysis, B.L.; Funding acquisition, B.L. and L.Y.; Investigation, M.C.; Methodology, B.L. and Y.C.; Writing—original draft, B.L.; Writing—review and editing, B.L., Y.C., M.L., L.Y. and M.C. All authors have read and agreed to the published version of the manuscript.

Funding

This research was funded by the [Natural Science Foundation of Fujian Province] grant number [2024J01791], [Fujian Provincial Education and Scientific Research Project for Middle-aged and Young Teachers] grant number [JAT210301], [Key Project of the Education Department of Anhui Province] grant number [2022AH051108], and [Third Batch of “Integration of Specialties and Innovation” Demonstration Course Construction Project of Chuzhou University] grant number [2024zckc002].

Data Availability Statement

The raw data supporting the conclusions of this article will be made available by the authors on request.

Conflicts of Interest

The authors declare no conflicts of interest.

References

  1. Omernik, J.M.; Bailey, G.B. Distinguishing between watersheds and ecoregions. J. Am. Water Resour. Assoc. 1997, 33, 935–949. [Google Scholar] [CrossRef]
  2. Crowly, J.M. Biogeography. Cannadian Geogr. 1967, 11, 312–326. [Google Scholar] [CrossRef]
  3. Omemik, J.M. Ecoregions of the conterminous United Stated. Ann. Am. Assoc. Geogr. 1987, 77, 118–125. [Google Scholar]
  4. Biggs, B.J.; Duncan, M.J.; Jowett, I.G.; Quinn, J.M.; Hickey, C.W.; Davies-Colley, R.J.; Close, M.E. Ecological characterisation, classification, and modelling of New Zealand rivers: An introduction and synthesis. N. Zealand J. Mar. Freshw. Res. 1990, 24, 277–304. [Google Scholar] [CrossRef]
  5. Harding, J.; Winterbourn, M. New Zealand Ecoregions: A Classification for Use in Stream Conservation and Management; Department of Conservation: Wellington, New Zealand, 1997; Volume 11. [Google Scholar]
  6. Logan, P.; Furse, M. Preparing for the European Water Framework Directive making the links between habitat and aquatic biota. Aquat. Conserv. Mar. Freshw. Ecosyst. 2002, 12, 425–437. [Google Scholar] [CrossRef]
  7. Moog, O.; Kloiber, A.S.; Thomas, O.; Gerritsen, J. Does the ecoregion approach support the typological demands of the EU “Water Frame Directive”. Hydrobiologia 2004, 516, 21–33. [Google Scholar] [CrossRef]
  8. Lorenz, A.; Feld, C.; Hering, D. Typology of streams in Germany based on benthic invertebrates: Ecoregions, zonation, geology and substrate. Limnologica 2004, 34, 379–389. [Google Scholar] [CrossRef]
  9. Tison, J.; Park, Y.S.; Coste, M.; Wasson, J.G.; Ector, L.; Rimet, F.; Delmas, F. Typology of diatom communities and the influence of hydro-ecoregions: A study on the French hydrosystem scale. Water Res. 2005, 39, 3177–3188. [Google Scholar] [CrossRef]
  10. Meyer, J.L. Stream health: Incorporating the human dimension to advance stream ecology. J. N. Am. Benthol. Soc. 1997, 16, 439–447. [Google Scholar] [CrossRef]
  11. Meng, W.; Zhang, N.; Zhang, Y.; Zheng, B. Integrated assessment of river health based on water quality, aquatic life and physical habitat. J. Environ. Sci. 2009, 8, 1017–1027. [Google Scholar] [CrossRef]
  12. Schroeder, W.; Pesch, R. Synthesizeing bioaccumulation data from the German metals in mosses surveys and relating them to ecoregions. Sci. Total Environ. 2007, 374, 311–327. [Google Scholar] [CrossRef]
  13. Sheng, S.; Xu, C.; Wen, T.; Wan, Y.; An, S. Division Design of Water Eco-Functioning of the River Basin. CLEAN–Soil Air Water 2015, 43, 1640–1646. [Google Scholar] [CrossRef]
  14. Yang, Y.; Chen, X.; Zhou, Y.; Li, W.; Chen, K. First-level and secondary aquatic ecological function division of the Yellow River Source Zone. J. Hydroecology 2023, 44, 1–9. (In Chinese) [Google Scholar]
  15. Frissell, C.A.; Liss, W.J.; Warren, C.E.; Hurley, M.D. A hierarchical framework for stream habitat classification: Viewing streams in a watershed context. Environ. Manag. 1986, 10, 199–214. [Google Scholar] [CrossRef]
  16. Liu, X.; Xu, Z.; Xu, C. A framework for aquatic ecoregion zoning. Acta. Ecologica. Sinica. 2010, 30, 4804–4814. (In Chinese) [Google Scholar]
  17. Baker, D.B.; Richards, R.P.; Loftus, T.T.; Kramer, J.W. A new flashiness index: Characteristics and applications to midwestern rivers and streams. J. Am. Water Resour. Assoc. 2004, 40, 503–522. [Google Scholar] [CrossRef]
  18. Gao, Y.; Gao, J.; Chen, J.; Xu, Y.; Zhao, J. Regionalizing aquatic ecosystems based on the river subbasin taxonomy concept and spatial clustering techniques. Int. J. Environ. Res. Public Health. 2011, 8, 4367–4385. [Google Scholar] [CrossRef] [PubMed]
  19. Ma, B.R.; Ma, A.Q.; Chen, S.; Li, Z.; Wang, Z.K. Function regionalization of water ecosystem for the Daliaohe Drainage Area. Period. Ocean Univ. China 2014, 44, 093–099. (In Chinese) [Google Scholar]
  20. Gao, Z.; Cao, X.; Huang, Y.; Li, F. Research of level I and II aquatic ecological function regionalization in Lake Dianchi basin. J. Lake Sci. 2015, 27, 175–182. (In Chinese) [Google Scholar]
  21. Krysanova, V.; Arnold, J.G. Advances in ecohydrological modelling with SWAT-a review. Hydrolog. Sci. J. 2008, 53, 939–947. [Google Scholar] [CrossRef]
  22. Zhang, D.; Chen, X.; Yao, H. Development of a prototype web-based decision support system for watershed management. Water 2015, 7, 780–793. [Google Scholar] [CrossRef]
  23. Ricci, G.F.; Girolamo, A.M.D.; Abdelwahab, O.M.M.; Gentile, F. Identifying sediment source areas in a mediterranean watershed using the swat model. Land Degrad. Dev. 2018, 29, 1233–1248. [Google Scholar] [CrossRef]
  24. Lin, F.; Chen, X.; Yao, H.; Lin, F. SWAT model-based quantification of the impact of land-use change on forest-regulated water flow. Catena 2022, 211, 105975. [Google Scholar] [CrossRef]
  25. Lin, B.; Chen, X.; Yao, H.; Chen, Y.; Liu, M.; Gao, L.; James, A. Analyses of landuse change impacts on catchment runoff using different time indicators based on SWAT mode. Ecol. Indic. 2015, 58, 55–63. [Google Scholar] [CrossRef]
  26. Wu, J.; Chen, X.; Yao, H.; Gao, L.; Chen, Y.; Liu, M. Non-linear relationship of hydrological drought responding to meteorological drought and impacts of a large reservoir. J. Hydrol. 2017, 551, 495–507. [Google Scholar] [CrossRef]
  27. Arnold, J.G.; Srinivasan, R.; Muttiah, R.S.; Williams, J.R. Lager area hydrologic modeling and assessment part I: Modeling development. JAWRA J. Am. Water Resour. Assoc. 1998, 34, 91–101. [Google Scholar] [CrossRef]
  28. Chaplot, V. Impact of spatial input data resolution on hydrological and erosion modeling: Recommendations from a global assessment. Phys. Chem. Earth. 2014, 67–69, 23–35. [Google Scholar] [CrossRef]
  29. Tan, M.L.; Ramli, H.P.; Tam, T.H. Effect of DEM resolution, source, resampling technique and area threshold on SWAT outputs. Water Resour. Manage. 2018, 32, 4591–4606. [Google Scholar] [CrossRef]
  30. Lin, B.; Chen, X.; Yao, H. Threshold of sub-watersheds for SWAT to simulate hillslope sediment generation and its spatial variations. Ecol. Indic. 2020, 111, 106040. [Google Scholar] [CrossRef]
  31. Zhang, D.; Chen, X.; Yao, H.; Lin, B. Improved calibration scheme of SWAT by separating wet and dry seasons. Ecol. Model. 2015, 301, 54–61. [Google Scholar] [CrossRef]
  32. Moriasi, D.N.; Arnold, J.G.; Van Liew, M.W.; Bingner, R.L.; Harmel, R.D.; Veith, T.L. Model evaluation guidelines for systematic quantification of accuracy in watershed simulation. Trans. ASABE 2007, 50, 885–900. [Google Scholar] [CrossRef]
  33. Rabbai, A.; Wendt, D.E.; Curioni, G.; Quick, S.E.; MacKenzie, A.R.; Hannah, D.M.; Kettridge, N.; Ullah, S.; Hart, K.M.; Krause, S. Soil moisture and temperature dynamics in juvenile and mature forest as a result of tree growth, hydrometeorological forcings, and drought. Hydrol. Process. 2023, 37, e14919. [Google Scholar] [CrossRef]
  34. Gharibreza, M.; Bahrami Samani, A.; Arabkhedri, M.; Zaman, M.; Porto, P.; Kamali, K.; Sobh-Zahedi, S. Investigation of on-site implications of tea plantations on soil erosion in Iran using 137Cs method and RUSLE. Environ. Earth Sci. 2021, 80, 34. [Google Scholar] [CrossRef]
  35. Chit, T.; Díaz-Pinés, E.; Butterbach-Bahl, K.; Marzaioli, F.; Valentini, F. Soil organic carbon changes following degradation and conversion to cypress and tea plantations in a tropical mountain forest in Kenya. Plant Soil. 2017, 422, 527–539. [Google Scholar] [CrossRef]
  36. Hamzah, Z.; Amirudin, C.Y.; Saat, A.; Wood, A.K. Quantifying soil erosion and deposition rates in tea plantation area, Cameron Highlands, Malaysia using 137Cs. Malays. J. Anal. Sci. 2014, 18, 94–106. [Google Scholar]
  37. Arnáez, J.; Lana-Renault, N.; Lasanta, T.; Ruiz-Flaño, P.; Castroviejo, J. Effects of farming terraces on hydrological and geomorphological processes. A review. Catena 2015, 128, 122–134. [Google Scholar] [CrossRef]
  38. Meng, X.; Zhu, Y.; Shi, R.; Yin, M.; Liu, D. Rainfall–runoff process and sediment yield in response to different types of terraces and their characteristics: A case study of runoff plots in Zhangjiachong watershed, China. Land Degrad. Dev. 2024, 35, 1449–1465. [Google Scholar] [CrossRef]
  39. Srinivas, R.; Singh, A.P.; Dhadse, K.; Garg, C. An evidence based integrated watershed modeling system to assess the impact of non-point source pollution in the riverine ecosystem. J. Clean. Prod. 2020, 246, 118963. [Google Scholar] [CrossRef]
  40. Chang, R.; Wang, Y.; Liu, H.; Wang, Z.; Ma, L.; Zhang, J.; Li, J.; Yan, Z.; Zhang, Y.; Li, D. Optimizing Non-Point Source Pollution Management: Evaluating Cost-Effective Strategies in a Small Watershed within the Three Gorges Reservoir Area, China. Land 2024, 13, 742. [Google Scholar] [CrossRef]
  41. Van Loon, A.F.V.; Gleeson, T.; Clark, J.; Van Dijk, A.I.J.M.; Stahl, K.; Hannaford, J.; Baldassarre, G.D.; Teuling, A.J.; Tallaksen, L.M.; Uijlenhoet, R.; et al. Drought in the anthropocene. Nat. Geosci. 2016, 9, 89–91. [Google Scholar] [CrossRef]
  42. Gudmundsson, L.; Boulange, J.; Do, H.X.; Gosling, S.N.; Grillakis, M.G.; Koutroulis, A.G.; Leonard, M.; Liu, J.; Schmied, H.M.; Papadimitriou, L.; et al. Globally observed trends in mean and extreme river flow attributed to climate change. Science 2021, 371, 1159–1162. [Google Scholar] [CrossRef] [PubMed]
  43. Wei, J.; Dong, N.; Fersch, B.; Arnault, J.; Wagner, S.; Laux, P.; Zhang, Z.; Yang, Q.; Yang, C.; Shang, S.; et al. Role of reservoir regulation and groundwater feedback in a simulated ground-soil-vegetation continuum: A long-term regional scale analysis. Hydrol. Process. 2021, 35, e14341. [Google Scholar] [CrossRef]
  44. Growns, I.; Rourke, M.; Gilligan, D. Toward river health assessment using species distributional modeling. Ecol. Indic. 2013, 29, 138–144. [Google Scholar] [CrossRef]
  45. Zhang, X.; Meng, Y.; Xia, J.; Wu, B.; She, D. A combined model for river health evaluation based upon the physical, chemical, and biological elements. Ecol. Indic. 2018, 84, 416–424. [Google Scholar] [CrossRef]
Figure 1. The overview of the Jinjiang Basin.
Water 17 02464 g001
Figure 2. Performances in daily outlet runoff simulation in Jinjiang Basin.
Water 17 02464 g002
Figure 3. Average annual water yield (2002–2010) of each sub-basin in Jinjiang Basin.
Water 17 02464 g003
Figure 4. The first-level aquatic ecological regions in Jinjiang Basin.
Water 17 02464 g004
Figure 5. Characteristics of elevation (a), NDVI (b) and precipitation (c) in three types of first-level aquatic ecological zones.
Water 17 02464 g005
Figure 6. Comparison of evapotranspiration (a), soil moisture content (b), surface flow (c), groundwater flow (d), lateral flow (e) and total water yield (f) in three types of first-level aquatic ecological zones.
Water 17 02464 g006
Figure 7. The secondary aquatic eco-functional regions in Jinjiang Basin.
Water 17 02464 g007
Figure 8. Proportions of forest (a), cropland (b), orchard (c), urban (d) and water (e) for the aquatic eco-functional regions in Jinjiang Basin.
Water 17 02464 g008
Table 1. The indices and their meaning of aquatic eco-function regionalization.
Classification Level Indicator Type Indicator Ecological Significance
First levelTopographyElevationReflect the morphological characteristics of rivers
ClimatePrecipitationReflect the status of water resources in rivers
VegetationNDVIReflect the capacity for material production and water conservation
HydrologyWater yieldReflect hydrological regulation capacity, and the ability of rivers to transport materials, energy, and sediment
Secondary levelHuman ActivityLand UseReflect the impact of human activities on river ecosystems
Table 2. Optimal values of the sensitive parameters for Jinjiang Basin.
ParametersDescriptionSensitivity (t Values)RangeOptimal Value
RCHRG_DPDeep aquifer percolation fraction−5.750–10.25
SOL_AWCAvailable water capacity of the soil layer5.460–10.11–0.34
CN2Initial SCS curve number for moisture3.9635–9845–92
GWQMINThreshold depth of water in the shallow
aquifer acquired for return flow to occur, mm
−1.850–50026
SOL_KSaturated hydraulic conductivity, mm/h1.660–20000.2–79.2
GW_DELAYDelay time for aquifer recharge, days−1.580–50031
CH_K2Effective hydraulic conductivity of channel, mm/h−1.04−0.01–5003
GW_REVAPRevap coefficient0.730.02–0.20.18
Note: the t-value reflects parameter sensitivity, with a higher absolute value indicating greater sensitivity.
Disclaimer/Publisher’s Note: The statements, opinions and data contained in all publications are solely those of the individual author(s) and contributor(s) and not of MDPI and/or the editor(s). MDPI and/or the editor(s) disclaim responsibility for any injury to people or property resulting from any ideas, methods, instructions or products referred to in the content.