Article

Spatiotemporal Patterns and Atmospheric Drivers of Anomalous Precipitation in the Taihu Basin, Eastern China

1
College of Hydraulic Science and Engineering, Yangzhou University, Yangzhou 225009, China
2
Modern Rural Water Resources Research Institute, Yangzhou University, Yangzhou 225009, China
3
Department of Civil Engineering, Indian Institute of Technology Roorkee, Roorkee 247667, India
4
Department of Civil and Environmental Engineering, National University of Singapore, Singapore 117576, Singapore
5
Graduate School of Informatics, Kyoto University, Kyoto 606-8225, Japan
6
School of Environment and Society, Institute of Science Tokyo, Yokohama 226-8503, Japan
7
College of Earth and Environmental Sciences, Lanzhou University, Lanzhou 730000, China
*
Author to whom correspondence should be addressed.
Water 2025, 17(16), 2442; https://doi.org/10.3390/w17162442
Submission received: 28 June 2025 / Revised: 14 August 2025 / Accepted: 16 August 2025 / Published: 18 August 2025

Abstract

This study investigates anomalous precipitation patterns in the Taihu Basin, located in the Yangtze River Delta of eastern China, using high-resolution daily data from 1960 to 2019. Leveraging a deep learning autoencoder and self-organizing map, three spatially distinct types are identified—north type (72%), south type (19.7%), and center type (8.3%). The north type exhibits a pronounced upward trend (+0.11 days/year, p < 0.05), indicating intensifying extreme rainfall under climate warming, while the south type displays a bimodal temporal structure, peaking in early summer and autumn. Composite analyses reveal that these patterns are closely associated with the westward extension of the Western North Pacific Subtropical High (WNPSH), meridional shifts of the East Asian Westerly Jet (EAJ), low-level moisture convergence, and SST–OLR anomalies. For instance, north-type events often coincide with strong anticyclonic anomalies and enhanced moisture transport from the Northwest Pacific and South China Sea, forming favorable convergence zones over the basin. For flood management in the Taihu Basin, the identified spatial patterns, particularly the bimodal south type, have clear implications. Their strong link to specific circulation features enables certain flood-prone scenarios to be anticipated 1–2 seasons in advance, supporting proactive measures such as reservoir scheduling. Overall, this classification framework deepens the understanding of atmospheric patterns associated with flood risk and provides practical guidance for storm design and adaptive flood risk management under a changing climate.

1. Introduction

In recent decades, the frequency and intensity of anomalous precipitation events, referring to events usually with unexpected magnitude and spatial patterns, have increased significantly under ongoing global warming, posing severe challenges to forecasting accuracy and disaster preparedness [1,2,3,4]. Such extremes have led to catastrophic impacts worldwide. In July 2018, record-breaking rainfall in western Japan triggered deadly floods and landslides, marking one of the country’s worst natural disasters in 30 years [5]. Similar events occurred in Kerala, India under the influence of ENSO [6], and in July 2021, extreme rainfall in western Germany, with both record-breaking intensity and spatially uneven distribution, caused deadly flash floods in upstream catchments and widespread inundation downstream, resulting in over 220 fatalities and EUR 46 billion in losses [7]. In China, the 2021 Zhengzhou flood and the 2020 Yangtze River flood event resulted in massive social and economic losses [8,9].
The Taihu Basin, situated in the heart of the Yangtze River Delta, ranks among the most densely populated and economically developed regions in China. As of 2020, it accounted for 4.8% of the national population and 9.8% of GDP while occupying only 0.4% of the country’s land area [10]. The basin frequently experiences persistent rainfall during the Meiyu season (mid-June to mid-July) and heavy rainfall from typhoons in late summer and early autumn. Its topography resembles a shallow disk, with elevations decreasing from the western hills to the central and eastern lowlands, which hampers natural drainage and exacerbates flood risk. More than 80% of the basin is covered by plains and water bodies, further amplifying flood susceptibility [11].
Located in the mid-latitudes of East Asia, the basin is strongly influenced by large-scale atmospheric systems such as the Western North Pacific Subtropical High (WNPSH) and the East Asian Westerly Jet (EAJ), leading to significant spatial–temporal heterogeneity in extreme rainfall [12]. Historical records show that the basin has experienced multiple prolonged and intense rainfall events. For example, in 1991, a 55-day-long Meiyu season caused severe flooding and grain losses, while the 1999 summer floods led to record-breaking rainfall and widespread urban inundation in cities such as Suzhou and Wuxi [13]. In recent years, landslides triggered by continuous rainfall in Lishui, Zhejiang, have also resulted in casualties and economic losses [14].
Accurately identifying anomalous precipitation events has become increasingly important under the backdrop of climate change. These events are often linked to severe flooding, yet their complex spatial heterogeneity and nonlinearity make them difficult to detect and classify using traditional approaches. Existing methods, including trend analysis, extreme value theory, and correlation-based diagnostics, typically rely on intensity thresholds or predefined indices [15,16,17,18,19]. While such methods are effective in identifying temporal extremes at individual locations, they often fall short in capturing large-scale spatial anomalies or abrupt shifts in rainfall structure, particularly in data-sparse or hydrologically complex regions. In recent years, deep learning techniques have emerged as powerful alternatives for hydrometeorological modeling. Among them, transformer-based architectures have shown exceptional ability to model long-range dependencies and capture complex spatial features through multi-head self-attention mechanisms [20]. Unlike convolutional networks, which rely on fixed receptive fields and deep hierarchies to extract spatial features, transformers enable global context modeling with fewer parameters and greater flexibility [20,21]. These advantages make them especially suitable for identifying spatially anomalous precipitation events and reconstructing their structures with improved fidelity. Despite these methodological advances, few studies have applied such techniques to the Taihu Basin, a flood-prone and densely populated region in eastern China. Existing research on the basin has primarily focused on statistical trends, seasonal variability, typhoon-driven rainfall, and urbanization effects [22,23,24,25], while limited attention has been given to the spatial distribution of anomalous precipitation or its underlying atmospheric drivers. Moreover, the lack of systematic classification and circulation-based interpretation constrains our ability to anticipate extreme events and adapt flood management strategies. To address these gaps, this study proposes a transformer-based anomaly detection framework to extract dominant spatial types of anomalous precipitation in the Taihu Basin and examine their associated circulation characteristics.
The lack of spatially detailed precipitation analysis is especially problematic in the context of hydrological engineering. Spatial rainfall patterns play a critical role in flood routing, reservoir scheduling, and urban drainage planning. Traditional design storm approaches often assume spatially uniform or idealized rainfall fields [26,27,28,29], which may lead to underestimation of local flood risk and reduced design robustness. For example, rainfall spatial variability was found to account for 20–30% of the variability in flood volumes in the city of Luzern, Switzerland [30]. Emerging evidence suggests that the spatial concentration and extent of rainfall strongly influence flood peak timing and magnitude. For instance, centered high-intensity rainfall can accelerate runoff and elevate flood peaks, while widespread but weaker rainfall produces slower but more prolonged flooding. Beyond engineering design, spatial heterogeneity in rainfall also affects early-warning and flood modeling. Ignoring spatial variability can also cause errors in flood simulations and risk assessments [31]. Under climate change, rainfall patterns are expected to become more uneven [32], increasing the risk of localized flooding even when total rainfall stays the same. Therefore, understanding spatial rainfall differences is essential for improving prediction and planning.
To address these challenges, we adopt a two-stage analytical approach that combines deep-learning-based anomaly detection with circulation-based classification techniques. Daily precipitation anomalies over the Taihu Basin from 1960 to 2019 are first identified using an autoencoder neural network, which effectively captures high-dimensional nonlinear features of rainfall variability. These anomalies are then clustered using self-organizing maps (SOMs) to extract distinct spatial patterns. To explore the underlying atmospheric mechanisms, composite analyses of key variables from ERA5—such as geopotential height, wind vectors, vertically integrated moisture divergence, sea surface temperature (SST), and outgoing longwave radiation (OLR)—are conducted for each precipitation type.
The remainder of this paper is organized as follows. Section 2 introduces the study area and datasets, including high-resolution daily precipitation data and ERA5 reanalysis. Section 3 describes the methodology, including the autoencoder-based detection of anomalous precipitation events, SOM-based spatial classification, and the construction of circulation indices. Section 4 presents the spatial and temporal characteristics of each precipitation type, along with their associated atmospheric drivers. Section 5 discusses the hydrometeorological implications of the classification results and their potential applications in storm design and reservoir operation. Section 6 concludes the paper.

2. Study Area and Datasets

2.1. Study Area

Figure 1a illustrates the geographic setting of the Taihu Basin, located on the southern edge of the Yangtze River Delta. It spans Anhui, Jiangsu, and Zhejiang provinces, as well as Shanghai, covering approximately 36,900 km2. The basin features a bowl-shaped topography—high around the periphery and low in the center—with elevation decreasing from northwest to southeast. Taihu Lake, the third-largest freshwater lake in China, lies at its core. The region is traditionally divided into seven subzones and plays a critical role in regional water security and ecological protection [33].
The basin has a subtropical monsoon climate, with annual precipitation ranging from 1100 to 1400 mm and temperatures between 15 and 17 °C. Rainfall is concentrated from June to September, accounting for over 70% of the annual total. Extreme events, such as the prolonged Meiyu season in 1991 and typhoon-induced rainfall in 2016 [34], have caused significant flooding and water level rises in Taihu Lake. Figure 1b shows that the number of anomalous precipitation days has increased significantly over the past decades. This trend highlights the growing urgency of understanding precipitation extremes and improving flood preparedness in the basin.

2.2. Datasets

This study employs two high-quality datasets to analyze the spatiotemporal trends of anomalous precipitation and the associated atmospheric circulation: the High-Resolution and Long-Term Gridded Precipitation Dataset and the fifth-generation European Centre for Medium-Range Weather Forecasts reanalysis.

2.2.1. Rainfall Dataset

The High-Resolution and Long-Term Gridded Dataset (hereinafter HRLT), released in 2022, provides gridded daily precipitation, maximum temperature, and minimum temperature data across China at a spatial resolution of 1 km × 1 km for the period 1961–2019 [35]. As one of the highest-resolution publicly available datasets, HRLT was generated by downscaling 0.5° × 0.5° CMA observational grids using topographic and geographic covariates (including elevation, slope, wetness index, latitude, and longitude) through a multi-scale spatial interpolation framework. Model parameters were optimized via stratified cross-validation, and residuals were corrected using thin-plate splines to improve spatial consistency. Validation indicates that HRLT performs better than widely used datasets such as China Meteorological Data Service Centre [36,37,38]. Although some biases remain in complex terrain, the high resolution substantially enhances the detection of localized extreme precipitation. The dataset is available from the National Climate Center at https://www.ncdc.ac.cn/portal/metadata/07bf1dde-c0f7-4a7c-ba2d-648843b8a8fc (accessed on 2 March 2025).

2.2.2. RA5 Reanalysis Dataset

ERA5, the fifth-generation global atmospheric reanalysis dataset developed by the European Centre for Medium-Range Weather Forecasts, provides hourly data from 1950 to the present at a spatial resolution of ~0.25° × 0.25° and includes 37 vertical pressure levels from 1000 hPa to 1 hPa [39]. Compared to its predecessor (ERA-Interim), ERA5 offers notable improvements in temporal–spatial continuity, physical consistency, and accuracy. It is widely used in climate research, extreme weather analysis, and as boundary input for numerical models [29]. In this study, key circulation variables were extracted from ERA5 to characterize the atmospheric background of anomalous precipitation events, including 850 hPa zonal and meridional wind components (U850 and V850), 500 hPa geopotential height (GPH), vertically integrated moisture divergence (VIMD), sea surface temperature (SST), outgoing longwave radiation (OLR), and 200 hPa zonal wind (U200).

3. Methodology

To systematically identify and interpret anomalous precipitation events, we developed a three-step analytical framework that integrates deep learning, unsupervised clustering, and composite diagnostic techniques, as shown in Figure S1. First, a convolutional autoencoder was trained to learn the typical spatial structures of daily precipitation fields, enabling the detection of anomalous events based on significant reconstruction errors. These events represent rainfall distributions that deviate markedly from the climatological norm, often linked to unusual meteorological conditions. Second, the spatial characteristics of the detected events were classified using a SOM, which organizes the events into representative spatial patterns while preserving their topological relationships. This step facilitates the interpretation of common structural features among anomalous events. Third, for each precipitation type identified by the SOM, composite analyses of key atmospheric and oceanic variables were conducted to explore the associated circulation anomalies and potential driving mechanisms. This integrated approach allows for both objective identification of anomalous events and systematic diagnosis of their large-scale environmental controls.

3.1. Autoencoder-Based Identification of Anomalous Precipitation Events

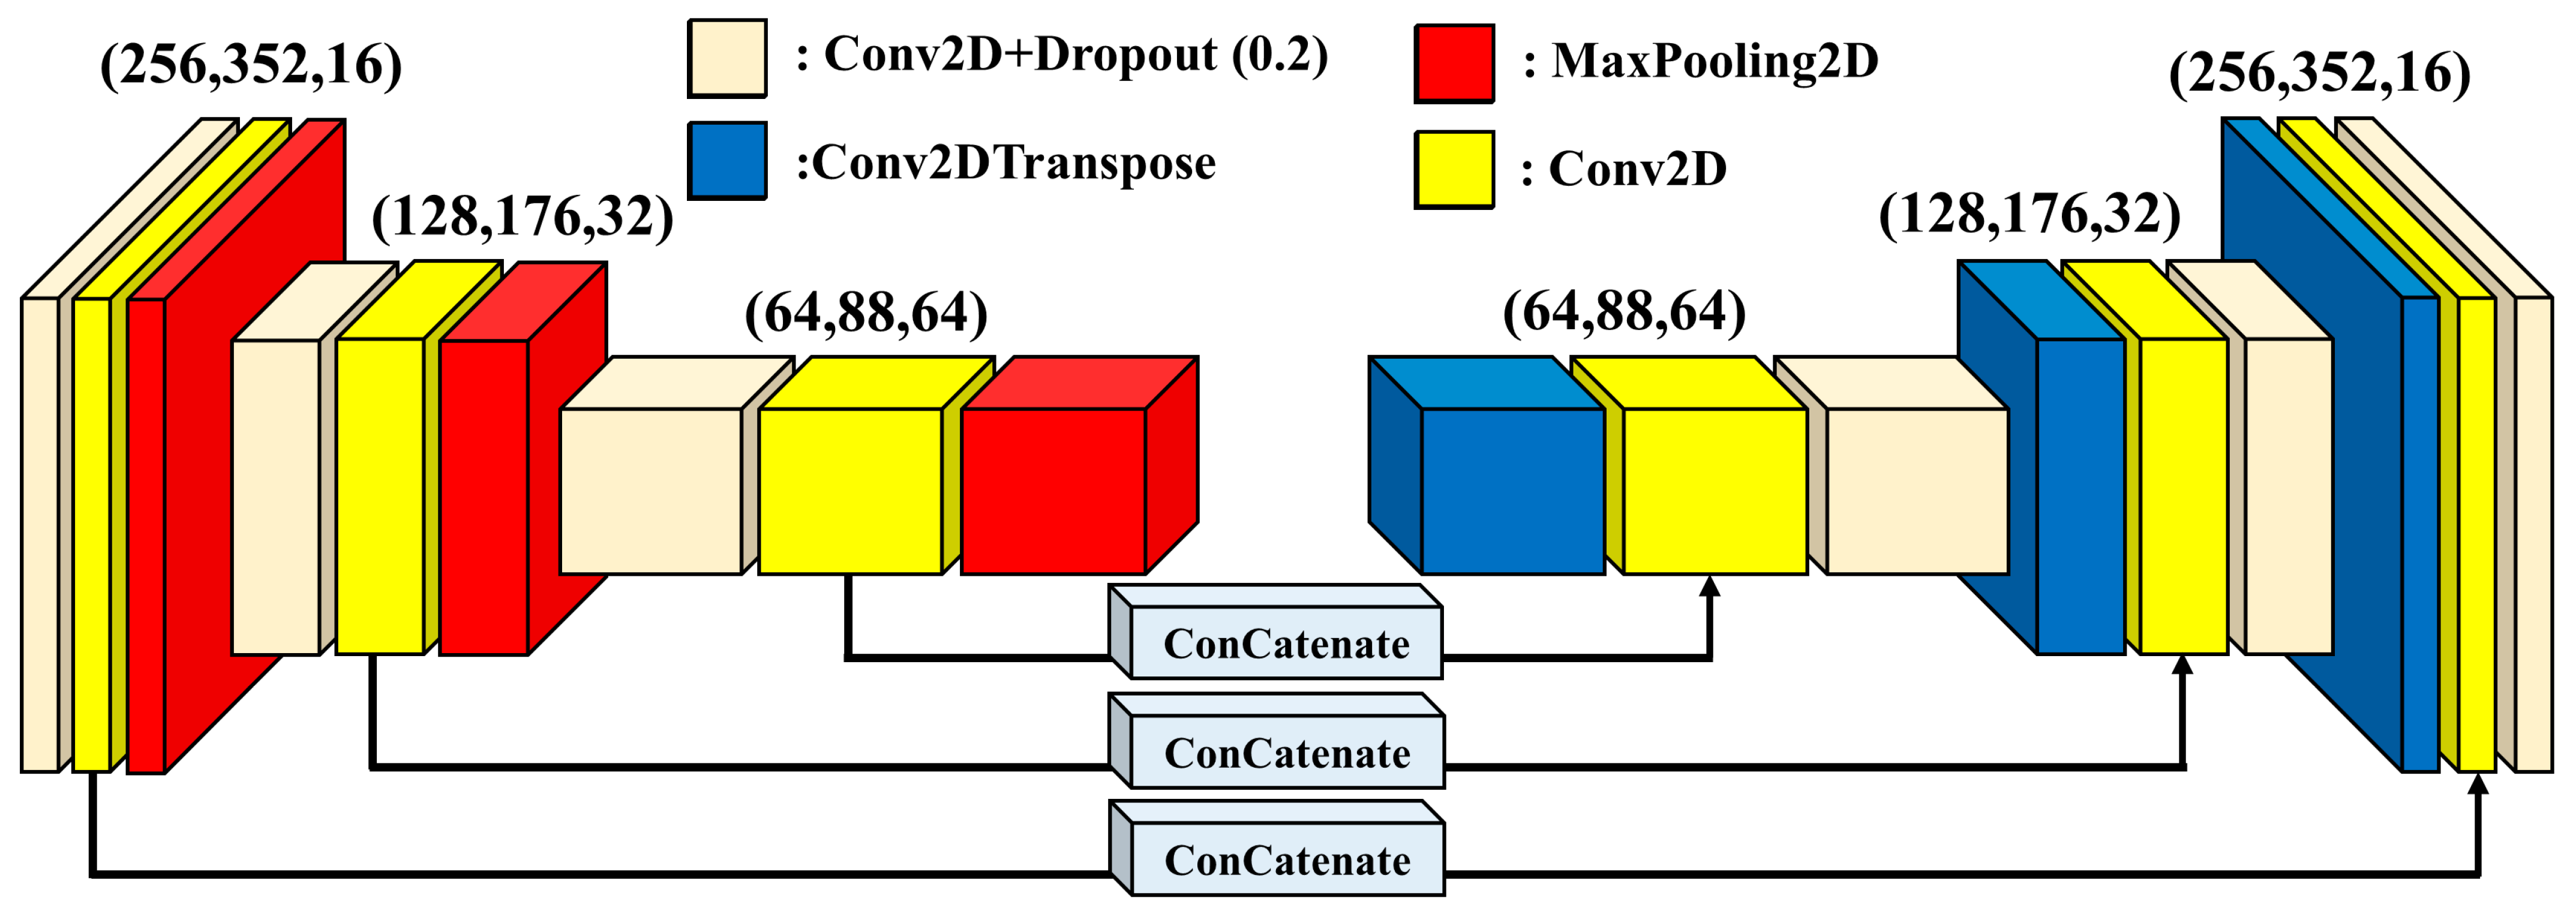
The autoencoder is a typical unsupervised learning architecture widely used for feature learning and anomaly detection across various scientific domains [40]. In this study, an autoencoder model is employed to identify anomalous precipitation events in the Taihu Basin. As illustrated in Figure 2, the model consists of two main components: an encoder and a decoder. The input is a normalized daily precipitation anomaly field with spatial dimensions of 992 × 496 (longitude × latitude). During the encoding phase, the input image is compressed into a 64-dimensional latent feature vector using a convolutional neural network. In the decoding phase, this low-dimensional representation is reconstructed into a high-dimensional output matching the original input. The model was developed and trained on an Ubuntu 23.04 system using TensorFlow 2.17.0, CUDA 12.0, and cuDNN 11.8, running on an Intel Xeon Platinum 8474C processor (Intel Corporation, Santa Clara, CA, USA) and an NVIDIA GeForce RTX 4090 GPU (NVIDIA Corporation, Santa Clara, CA, USA). Daily precipitation data were normalized before training to ensure consistent input scales. The autoencoder employed ReLU as the activation function for all hidden layers. For training, 80% of the HRLT dataset was randomly selected as the training set, with the remaining 20% used for validation. The model was optimized using the Adam optimizer with an initial learning rate of 1 × 10⁻³, a batch size of 16, and early stopping applied when validation accuracy did not improve for 10 consecutive epochs. The loss function was Mean Squared Error (MSE), which measures the discrepancy between original and reconstructed precipitation fields. Following the approach of Huang et al. [41], precipitation fields with reconstruction errors exceeding the 95th percentile of the MSE distribution were classified as anomalous events. In other words, these are events characterized by both unusually high rainfall intensity and irregular spatial distribution, which deviate significantly from typical climatological patterns and thus cannot be well reconstructed by the trained autoencoder.

3.2. SOM-Based Clustering of Precipitation Spatial Patterns

The self-organizing map (SOM) is an unsupervised neural network algorithm that simulates the self-organizing behavior of cortical neurons to map high-dimensional data onto a low-dimensional grid while preserving the topological structure of the original data. SOM is known for its robustness, spatial precision, and insensitivity to outliers, making it well suited for clustering, pattern recognition, and data visualization tasks [42]. In this study, SOM is applied to cluster the spatial structure of the anomalous precipitation events identified by the autoencoder, thereby extracting typical spatial distribution types and aiding in the interpretation of their underlying formation mechanisms. The SOM uses a 1 × 3 map to extract three representative spatial types and is trained for 2000 iterations to ensure convergence.

3.3. WNPSH and EAJ Circulation Indices

The Western North Pacific Subtropical High (WNPSH) is one of the most influential large-scale circulation systems affecting summer climate anomalies over China. Controlled by subtropical subsidence, the WNPSH is characterized by warm, deep, and stable air masses. Its position and intensity exert a strong influence on the location of rain belts and precipitation distribution during the summer. When the WNPSH extends eastward or shifts northward, precipitation tends to concentrate in North and Northeast China, while the Yangtze River Basin tends to experience below-normal rainfall. In contrast, a westward or southward extension of the WNPSH often leads to enhanced rainfall over the Yangtze River Basin [43,44]. The East Asian Westerly Jet (EAJ) is a strong westerly wind belt located in the upper troposphere, generally composed of the subtropical jet and the polar-front jet. As a key component of the East Asian summer monsoon system, the latitudinal shift and intensity of the EAJ directly influence the onset and withdrawal of the rainy season in China. Moreover, the EAJ modulates the formation of extreme precipitation events by regulating moisture transport and convective initiation mechanisms [43,45].
To characterize the WNPSH, we adopt an index based on the 500 hPa GPH field averaged over 10–30° N and 110–150° E, following [44]. The GPH anomalies were obtained by removing the climatological mean, applying a 5-day moving average, and subtracting the seasonal mean. A positive (negative) index reflects a westward (eastward) shift of the system. To further examine air–sea interactions, we performed composite analyses using SST and OLR anomalies. The EAJ index is defined following [45] as the difference in zonal wind anomalies at 200 hPa between 30 and 35° N and 45 and 50° N (110–140° E). The wind data were preprocessed similarly to GPH. Positive values indicate a southward jet displacement, while negative values suggest a northward shift.

4. Results

4.1. Classified Anomalous Precipitation Patterns

Figure 3 presents the spatial classification and frequency distribution of anomalous precipitation events in the Taihu Basin, identified using the autoencoder and clustered via the SOM method. Based on spatial characteristics, these events are categorized into three types: north type, center type, and south type. Their spatial patterns differ significantly from those of general rainfall events (Figure S2). The north type is dominant, accounting for 72% of all anomalous events, with its distribution center generally north of ~31.6° N, primarily concentrated in the canal plain and cities along the Yangtze River. The south type accounts for 19.7%, with its center south of ~30.6° N, mostly occurring in northern Zhejiang, including Huzhou and Jiaxing. The center type is the least frequent (8.3%), with a core distribution around 30.6–31.6° N near the Taihu Lake region and its surrounding areas. The clustering results are validated using PCA projection (Figure S3), confirming clear separation among the three types. Robustness tests (15 repeated SOM runs in Figure S4) show that the north- and south types are consistently identified, whereas the less frequent center type exhibits slight variability, likely due to its small sample size.
Among the three, the north type and south type are the most representative and correspond well to several historical extreme rainfall events. For instance, the heavy rainfall events in the northern basin in 1991 and 2020 closely match the north-type spatial pattern, resulting in severe urban flooding and infrastructure damage [13]. Likewise, the 1999 and 2021 south-type rainstorms show strong spatial agreement with the south-type pattern in Figure 3 and caused widespread waterlogging and agricultural disruption in the Hangjiahu region [11].

4.2. Temporal Variability of Anomalous Precipitation Patterns

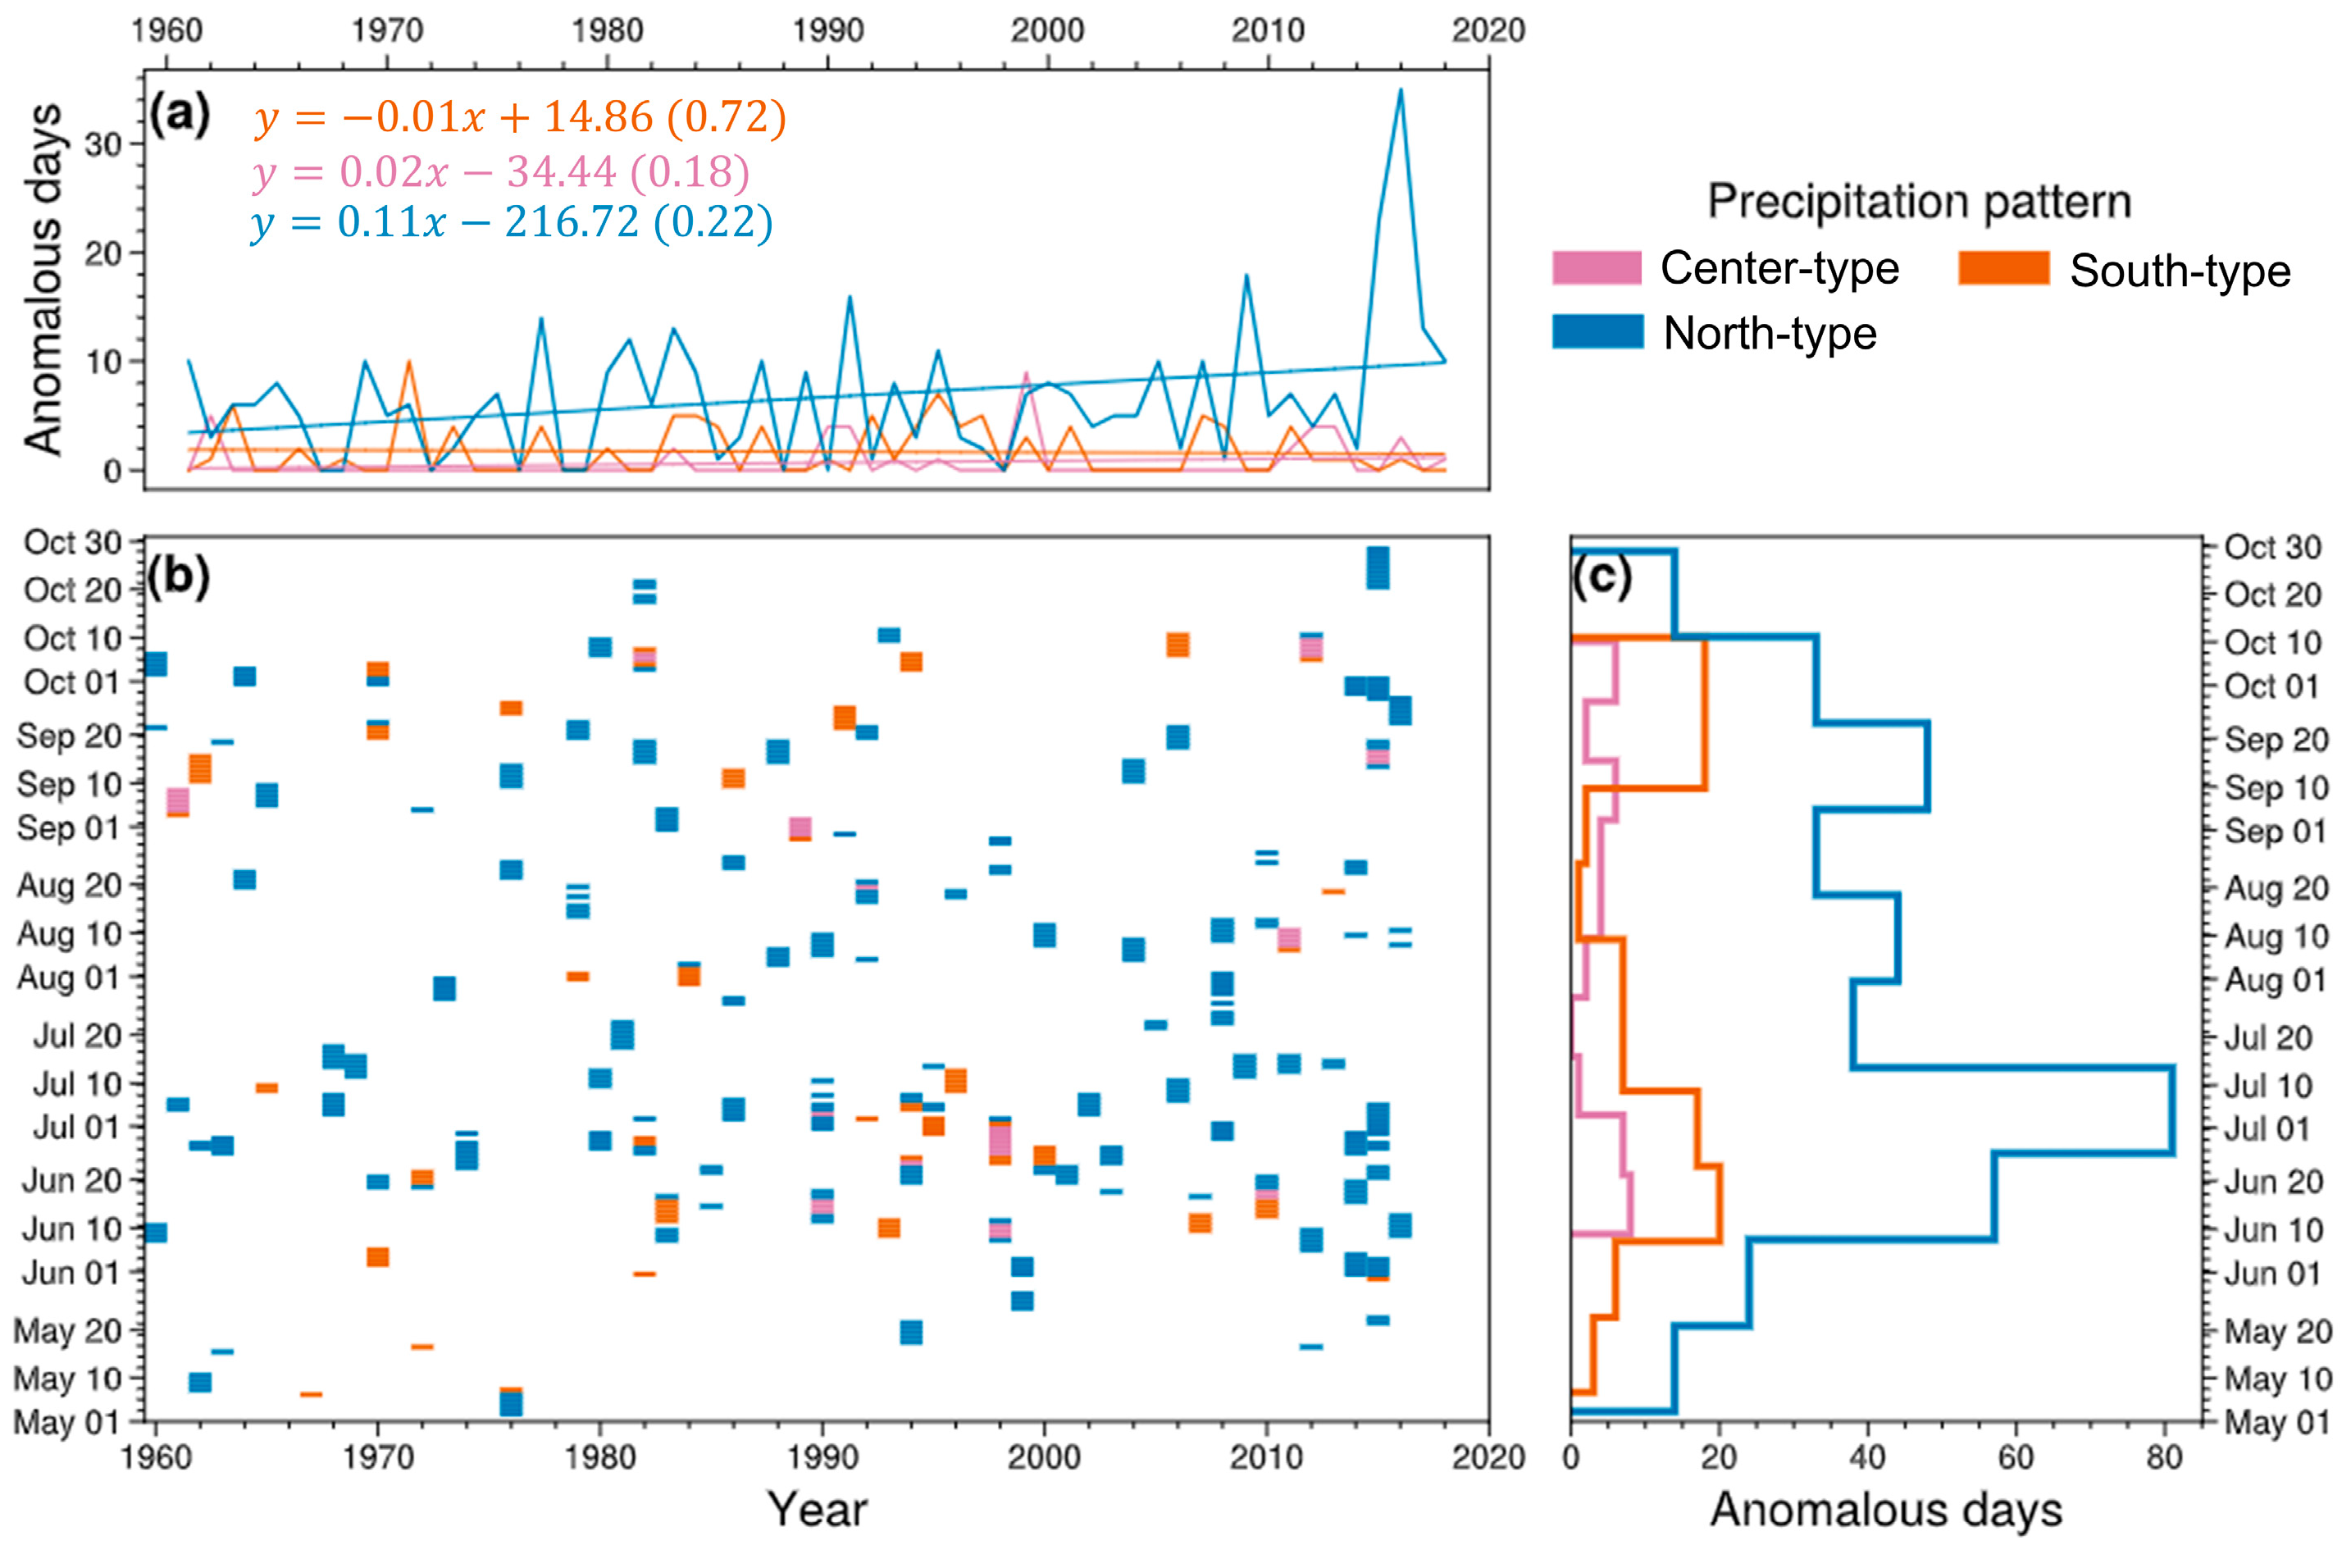
As shown in Figure 4a, the annual frequencies exhibit distinct trends. The north-type events show a statistically significant upward trend, with a linear slope of +0.11 days per year (p < 0.05), indicating intensification under climate warming conditions. In contrast, the center and south types display relatively stable frequencies with no significant trends. Figure 4b reveals the temporal distribution of events. Anomalous events in May, observed sporadically during the 1960s–1980s, have nearly disappeared in the past two decades. Meanwhile, the frequency of October events has increased, suggesting a seasonal delay likely associated with the enhanced autumn typhoon activity [46]. Figure 4c shows that center-type events are evenly distributed throughout the year; south-type events exhibit a bimodal pattern with peaks in June–July and September–October; north-type events are dominated by a July peak, with additional occurrences in August–September. Overall, July and September emerge as peak months for anomalous precipitation in the basin, corresponding closely with the main flood season, active monsoon phases, and typhoon landfall periods [47].

4.3. Underlying Synoptic-Scale Circulation Patterns

All three anomalous precipitation types occur during the westward extension phase of the WNPSH, but their circulation patterns and moisture transport structures differ significantly (Figure 5). For the most frequent north-type events (Figure 5c), a pronounced anticyclonic anomaly is observed at 500 hPa on the northwestern flank of the WNPSH. This anomaly enhances the transport of warm and moist air from the Northwest Pacific and South China Sea into the Taihu Basin and forms a distinct low-level convergence (Figure 6c), creating favorable dynamic and moisture conditions for heavy rainfall. The south type shows a broadly similar circulation structure but with a weaker anticyclone and less evident low-level convergence (Figure 6b), likely due to its typical occurrence in late June (early flood season) and early October (late flood season), when atmospheric conditions tend to be less stable. In contrast, the center type (Figure 5a) exhibits a more prominent mid-latitude positive GPH anomaly. Moisture is primarily transported along the western flank of the WNPSH and forms a cyclonic circulation over the basin, accompanied by marked convergence at low levels (Figure 6a).
The circulation structure identified for the north type is consistent with previous studies. For instance, Yan et al. [48] noted that during the 1999 anomalous rainfall event, the WNPSH ridge shifted northward, forming a northwest–southeast-oriented water vapor corridor over East Asia. This configuration displaced the rain belt toward the Yangtze–Huaihe region and favored the development of a shear line over the Taihu Basin, thereby inducing extreme precipitation. The south-type pattern (Figure 6b) has also been recognized in earlier studies [24,49], although its large-scale circulation drivers have not been systematically verified. Our results further reveal its association with enhanced low-level moisture transport and regional circulation anomalies, providing new insights for its underlying mechanisms.
As shown in Figure 7, SST anomalies within the WNPSH-controlled region exhibit corresponding signals with the high’s positional shifts. For center-type and north-type events, positive SST anomalies are observed, suggesting a warm SST background may contribute to their development. In contrast, SST anomalies for south-type events are weak or absent, implying a limited oceanic influence.
To further assess deep convection responses, OLR anomalies are used as a proxy for convective intensity. OLR is a key indicator of Earth’s radiative output and is widely applied to track deep convection in tropical and subtropical regions [50]. Typically, positive OLR anomalies indicate subsidence and stable conditions near the WNPSH core, while negative anomalies reflect moisture convergence and active convection. During north-type events, the WNPSH is stronger and more westward, expanding the positive OLR region and creating widespread subsidence. In contrast, negative OLR anomalies near the northwest edge of the WNPSH coincide with areas of upward motion and moisture transport, favoring anomalous rainfall. South-type events show a more southerly convective center, with negative OLR anomalies aligning closely with rainfall cores.
The meridional displacement of the EAJ serves as an important indicator of large-scale circulation configuration changes. To investigate its role in modulating anomalous precipitation types, we conduct composite analyses of the 200 hPa zonal wind anomalies (U200) from ERA5. Figure 8 indicates notable differences in jet structures among the three precipitation types: (a) for the center type, the EAJ shifts northward with the jet core displaced westward and northward, while the southern branch weakens significantly; (b) for the south type, the EAJ also migrates northward, accompanied by a pronounced enhancement of the northern branch, forming a stable jet core over the Korean Peninsula and the Sea of Japan; (c) for the north type, the EAJ structure resembles that of the south type but with a slightly more westward jet core and weaker overall enhancement, particularly in the northern branch where the difference in intensity is more pronounced.

5. Discussion and Implication

Based on daily precipitation data from 1960 to 2019, this study identifies three distinct spatial patterns of anomalous precipitation in the Taihu Basin, i.e., north type (72%), south type (19.7%), and center type (8.3%), with the north type emerging as the dominant mode. This classification framework offers a solid foundation for further exploration of underlying circulation mechanisms and practical hydrological applications.
The use of clustering to identify dominant spatial patterns is essential for capturing the inherent heterogeneity of anomalous precipitation events. This approach not only reduces the complexity of high-dimensional precipitation data but also enhances the interpretability of associated atmospheric drivers [41]. More importantly, categorizing events into distinct spatial types enables the development of type-specific early-warning signals based on circulation indicators. From an engineering perspective, the spatial differentiation of anomalous precipitation provides a new basis for defining critical rainfall scenarios in design storm estimation. Unlike traditional approaches that rely on point rainfall or spatially interpolated uniform fields [51], the proposed classification improves spatial representativeness in flood modeling and infrastructure design. All three types are strongly associated with specific atmospheric conditions, particularly the westward extension of the WNPSH, 500 hPa geopotential height anomalies, and the meridional shift of the 200 hPa EAJ. By tracking key indicators, such as positive SST anomalies within the WNPSH domain (notably in north- and center-type events), negative OLR anomalies on the northwest flank of the high, and low-level convergence zones, anomalous spatial rainfall structures can be anticipated in advance. For instance, the north type typically coincides with intensified anticyclonic activity and robust moisture transport from the Northwest Pacific and South China Sea, resulting in strong low-level convergence over the basin. In contrast, the south type tends to occur during early or late flood seasons when circulation systems are weaker and less stable, with diminished anticyclonic influence. This circulation-based prediction framework can enable a 1–2 season lead time for reservoir scheduling, levee reinforcement, and urban drainage optimization.
Furthermore, the south type exhibits a pronounced bimodal temporal structure, with peaks in June–July (main flood season onset) and September–October (typhoon season). This finding has practical implications for floodwater resource utilization. Specifically, by storing early-summer floodwater and intercepting typhoon-related rainfall in early autumn, reservoir systems can be strategically operated to support ecological flows and municipal supply during the subsequent dry period.
Future research will advance the current framework in three directions. First, to enhance physical representativeness, multi-source datasets integrating ground-based observations, satellite products, and reanalysis data will be incorporated. Additional predictors such as wind fields, relative humidity, soil moisture, and terrain features will be considered to improve the model’s ability to capture the atmospheric and land surface controls on precipitation variability [52,53]. Second, under various CMIP6 climate scenarios (e.g., SSP1-2.6, SSP2-4.5, and SSP5-8.5), the spatial structure, frequency, and recurrence of anomalous precipitation patterns will be re-evaluated to support adaptive flood management and future-oriented water resource planning [54]. Coupling the improved precipitation classification with hydrological or hydraulic models will further enhance the realism of rainfall input and improve the accuracy of flood simulations and risk estimation. Lastly, given potential uncertainties from observational bias, spatial interpolation, and model parameterization [37,55], future work will incorporate cross-validation from multiple datasets, compare interpolation schemes, and implement uncertainty quantification and sensitivity analysis during model training. These steps aim to improve the robustness and credibility of the overall framework and its outputs under both historical and future conditions.

6. Conclusions

This study developed a three-step framework combining deep learning, clustering, and circulation diagnosis to identify and interpret anomalous precipitation events in the Taihu Basin during 1960–2019. Through this approach, three spatially distinct types were classified: north type (72%), south type (19.7%), and center type (8.3%). Among them, the north type is most frequent and exhibits a significant upward trend (+0.11 days per year), indicating an increasing flood risk over densely populated northern cities. In contrast, the south type presents a clear bimodal seasonal distribution corresponding to early and late flood seasons, while the center type appears more sporadically near the lake zone. These results provide a new perspective beyond conventional station-based or monthly climatological categorizations.
The underlying circulation features of each type were systematically analyzed. The north type is dominated by a westward-extending WNPSH, enhanced anticyclonic anomalies, and strong low-level moisture convergence. The south type is associated with relatively weaker low-level systems but significant enhancement of the East Asian jet in its northern branch. The center type features midlatitude geopotential height anomalies and cyclonic moisture convergence near the basin. These mechanisms reflect the diversity of atmospheric drivers contributing to extreme rainfall under varying background conditions.
From an application perspective, the identified patterns and their corresponding circulation indicators, such as the WNPSH and EAJ position and OLR and SST anomalies, offer a physically interpretable basis for anticipating the spatial structure of anomalous precipitation events one to two seasons in advance. This contributes to the development of spatially adaptive strategies for flood control design, reservoir operation scheduling, and early-warning systems, particularly in regions with complex hydroclimatic variability like the Taihu Basin.

Supplementary Materials

The following supporting information can be downloaded at: https://www.mdpi.com/article/10.3390/w17162442/s1, Figure S1: Overall framework of the study; Figure S2: Daily mean precipitation during 1960–2019; Figure S3: PCA projection for validating clustering performance; Figure S4. Spatial classification results of anomalous precipitation events in the Taihu Basin obtained from 15 repeated SOM runs using different random seeds.

Author Contributions

Conceptualization, S.M. and W.Z.; Data Curation, Y.X.; Formal Analysis, J.H. and J.Z.; Funding Acquisition, W.Z.; Investigation, J.H., A. and C.Z.; Methodology, J.Z.; Resources, S.L.; Validation, A. and W.Z.; Visualization, J.H. and B.L.; Writing—Original Draft, J.H. and W.Z.; Writing—Review and Editing, J.H., A., J.Z., S.M. and W.Z. All authors have read and agreed to the published version of the manuscript.

Funding

This research was funded by the National Natural Science Foundation of China, grant number 52409045, Natural Science Foundation of Jiangsu Province, grant number BK20240929.

Data Availability Statement

Acknowledgments

The authors thank the model research groups for providing the datasets used in this study.

Conflicts of Interest

The authors declare no conflicts of interest.

References

  1. Murakami, H.; Delworth, T.L.; Cooke, W.F.; Kapnick, S.B.; Hsu, P.-C. Increasing frequency of anomalous precipitation events in Japan detected by a deep learning autoencoder. Earth’s Future 2022, 10, e2021EF002481. [Google Scholar] [CrossRef]
  2. He, X.; Wada, Y.; Wanders, N.; Sheffield, J. Intensification of hydrological drought in California by human water management. Geophys. Res. Lett. 2017, 44, 1777–1785. [Google Scholar] [CrossRef]
  3. Lai, Y.; Li, J.; Lee, T.; Tse, W.P.; Chan, F.; Chen, Y.D.; Gu, X. A 131-year evidence of more extreme and higher total amount of hourly precipitation in Hong Kong. Environ. Res. Lett. 2024, 19, 034008. [Google Scholar] [CrossRef]
  4. Zhao, W.; Kinouchi, T.; Nguyen, H.Q. A framework for projecting future intensity-duration-frequency (IDF) curves based on CORDEX Southeast Asia multi-model simulations: An application for two cities in Southern Vietnam. J. Hydrol. 2021, 598, 126461. [Google Scholar] [CrossRef]
  5. Honda, T.; Miyoshi, T. Predictability of the July 2018 heavy rain event in Japan associated with Typhoon Prapiroon and southern convective disturbances. Sci. Online Lett. Atmos. SOLA 2021, 17, 113–119. [Google Scholar] [CrossRef]
  6. Athira, K.; Singh, S.; Abebe, A. Rising risk and localized patterns of Indian summer monsoon rainfall extremes. Atmos. Res. 2024, 309, 107554. [Google Scholar] [CrossRef]
  7. Erpicum, S.; Poppema, D.; Burghardt, L.; Benet, L.; Wüthrich, D.; Klopries, E.-M.; Dewals, B. A dataset of floating debris accumulation at bridges after July 2021 flood in Germany and Belgium. Sci. Data 2024, 11, 1092. [Google Scholar] [CrossRef]
  8. Zhuang, Y.; Xing, A. History must not repeat itself—Urban geological safety assessment is essential. Nat. Hazards 2022, 111, 2141–2145. [Google Scholar] [CrossRef]
  9. Zhang, S.; Ming, Y.; Gao, L. Distribution characteristics of POC and DOC at the Yangtze River Estuary during the 2020 summer flood. Mar. Environ. Sci. 2022, 41, 653–659. (In Chinese) [Google Scholar] [CrossRef]
  10. Tao, Y.; Tao, Q.; Qiu, J.; Pueppke, S.G.; Gao, G.; Ou, W. Integrating water quantity- and quality-related ecosystem services into water scarcity assessment: A multi-scenario analysis in the Taihu Basin of China. Appl. Geogr. 2023, 160, 103101. [Google Scholar] [CrossRef]
  11. Xu, Y.; Zhang, Y.; Liu, K.; Wu, Y.; Gao, C. Detection of flood trends drivers in the Taihu Basin China. J. Hydrol. Reg. Stud. 2024, 56, 101990. [Google Scholar] [CrossRef]
  12. Zhang, Q.; Guo, H. Circulation differences and mechanisms of summer anomalous precipitation events in the Yangtze-Huaihe River Basin. Chin. J. Atmos. Sci. 2014, 38, 656–669. (In Chinese) [Google Scholar] [CrossRef]
  13. Hu, Q.; Zhu, R.; Wang, Y.; Li, L.; Li, X. Analysis of rainfall and water level elements of typical floods in the Taihu Basin. J. Hydraul. Waterw. Eng. 2022, 40–49. (In Chinese) [Google Scholar] [CrossRef]
  14. Pan, W.; Wang, T.; Li, F. Moisture transport characteristics of anomalous autumn rainfall in Jinhua, Zhejiang. Sci. Bull. 2023, 39, 13–22. (In Chinese) [Google Scholar] [CrossRef]
  15. Li, Y.; Cai, W.; Campbell, E.P. Statistical Modeling of Extreme Rainfall in Southwest Western Australia. J. Clim. 2005, 18, 852–863. [Google Scholar] [CrossRef]
  16. Kam, J.; Sheffield, J.; Wood, E.F. Changes in drought risk over the contiguous United States (1901–2012): The influence of the Pacific and Atlantic Oceans. Geophys. Res. Lett. 2014, 41, 5897–5903. [Google Scholar] [CrossRef]
  17. Hu, W.; Yao, J.; He, Q.; Chen, J. Changes in precipitation amounts and extremes across Xinjiang (northwest China) and their connection to climate indices. PeerJ 2021, 9, e10792. [Google Scholar] [CrossRef] [PubMed]
  18. Zeng, Y.; Huang, C.; Tang, Y.; Peng, J. Precipitation Variations in the Flood Seasons of 1910–2019 in Hunan and Its Association With the PDO, AMO, and ENSO. Earth Sci. 2021, 9, 305–317. [Google Scholar] [CrossRef]
  19. Wu, X.; Guo, S.; Yin, J.; Yang, G.; Zhong, Y.; Liu, D. On the event-based extreme precipitation across China: Time distribution patterns trends return levels. J. Hydrol. 2018, 562, 305–317. [Google Scholar] [CrossRef]
  20. Vaswani, A.; Shazeer, N.; Parmar, N.; Uszkoreit, J.; Jones, L.; Gomez, A.N.; Kaiser, Ł.; Polosukhin, I. Attention is All You Need. In Proceedings of the Advances in Neural Information Processing Systems (NeurIPS), Long Beach, CA, USA, 4–9 December 2017; Volume 30. Available online: https://arxiv.org/abs/1706.03762 (accessed on 1 February 2024).
  21. Luo, W.; Li, Y.; Urtasun, R.; Zemel, R. Understanding the Effective Receptive Field in Deep Convolutional Neural Networks. arXiv 2017, arXiv:1701.04128. Available online: https://arxiv.org/abs/1701.04128 (accessed on 10 March 2025). [CrossRef]
  22. Liu, P.; Zhong, L.; Sha, P.; Wu, X.; Liu, Z. Analysis of typical rainfall and flood characteristics in the western Taihu Basin. Water Resour. Plan. Des. 2024, 53–56+62. (In Chinese) [Google Scholar] [CrossRef]
  23. Yu, W.; Yan, Y.; Zou, X. Spatiotemporal characteristics of heavy rainfall in the Taihu Basin. J. Nat. Resour. 2012, 27, 766–777. (In Chinese) [Google Scholar]
  24. Geng, Y. Analysis of the spatiotemporal distribution of rainfall in the Taihu Basin. Haihe Water Resour. 2003, 33–35. (In Chinese) [Google Scholar]
  25. Hu, J.; Liu, Y.; Sang, Y.F. Precipitation complexity and its spatial difference in the Taihu Lake Basin, China. Entropy 2019, 21, 48. [Google Scholar] [CrossRef] [PubMed]
  26. Zhao, W.; Abhishek, T.; Takhellambam, B.S.; Zhang, J.; Zhao, Y.; Kinouchi, T. Spatiotemporal variability of current and future sub-daily rainfall in Japan using state-of-the-art high-quality data sets. Water Resour. Res. 2023, 59, e2022WR034305. [Google Scholar] [CrossRef]
  27. Zhou, Z. The impact of the spatiotemporal structure of rainfall on flood frequency over a small urban watershed: An approach coupling stochastic storm transposition and hydrologic modeling. Hydrol. Earth Syst. Sci. 2021, 25, 4701–4721. [Google Scholar] [CrossRef]
  28. Wright, D.B.; Smith, J.A.; Baeck, M.L. Flood frequency analysis using radar rainfall fields and stochastic storm transposition. Water Resour. Res. 2014, 50, 1592–1615. [Google Scholar] [CrossRef]
  29. Dai, Y.; Abhishek, L.; Gong, Y.; Wu, X.; Sheng, B.; Zhao, W. Variations in present and future hourly extreme rainfall: Insights from high-resolution data and novel temporal disaggregation model. Water 2024, 16, 3463. [Google Scholar] [CrossRef]
  30. Douinot, A.; Roux, H.; Garambois, P.-A.; Larnier, K.; Labat, D.; Dartus, D. Accounting for rainfall systematic spatial variability in flash flood forecasting. J. Hydrol. 2016, 541, 359–370. [Google Scholar] [CrossRef]
  31. Peleg, N.; Blumensaat, F.; Molnar, P.; Fatichi, S.; Burlando, P. Partitioning the impacts of spatial and climatological rainfall variability in urban drainage modeling. Hydrol. Earth Syst. Sci. 2017, 21, 1559–1572. [Google Scholar] [CrossRef]
  32. Pendergrass, A.G.; Knutti, R.; Lehner, F.; Deser, C.; Sanderson, B.M. Precipitation variability increases in a warmer climate. Sci. Rep. 2017, 7, 17966. [Google Scholar] [CrossRef]
  33. Qi, C.; Lu, J.; Wang, G.; Zhang, L. Integrated protection and restoration of mountains, rivers, forests, farmlands, lakes, and grasslands in the Taihu Basin. Environ. Monit. Manag. Technol. 2024, 36, 1–6. (In Chinese) [Google Scholar] [CrossRef]
  34. Jiang, X.; Du, Q.; Huang, X.; She, D. Spatiotemporal characteristics of water quality and its relationship with landscape patterns in the Jiangsu section of the Taihu Basin. J. Soil Water Conserv. 2025, 39, 361–370. (In Chinese) [Google Scholar] [CrossRef]
  35. Qin, R.; Zhao, Z.; Xu, J.; Ye, J.-S.; Li, F.-M.; Zhang, F. HRLT: A high-resolution (1 d, 1 km) and long-term (1961–2019) gridded dataset for surface temperature and precipitation across China. Earth Syst. Sci. Data 2022, 14, 4793–4812. [Google Scholar] [CrossRef]
  36. Xiong, J.; Guo, S.; Abhishek, Y.; Yin, J.; Xu, C.; Wang, J.; Guo, J. Variation and attribution of probable maximum precipitation of China using a high-resolution dataset in a changing climate. Hydrol. Earth Syst. Sci. 2024, 28, 1873–1895. [Google Scholar] [CrossRef]
  37. Wei, C.; Dong, X.; Ma, Y.; Gou, J.; Li, L.; Bo, H.; Yu, D.; Su, B. Applicability comparison of various precipitation products of long-term hydrological simulations and their impact on parameter sensitivity. J. Hydrol. 2023, 618, 129187. [Google Scholar] [CrossRef]
  38. He, J.; Yang, K.; Tang, W.; Lu, H.; Qin, J.; Chen, Y.; Li, X. The first high-resolution meteorological forcing dataset for land process studies over China. Sci. Data 2020, 7, 25. [Google Scholar] [CrossRef]
  39. Hersbach, H.; Bell, B.; Berrisford, P.; Hirahara, S.; Horányi, A.; Muñoz-Sabater, J.; Nicolas, J.; Peubey, C.; Radu, R.; Schepers, D.; et al. The ERA5 global reanalysis. Q. J. R. Meteorol. Soc. 2020, 146, 1999–2049. [Google Scholar] [CrossRef]
  40. Hu, F.; Wang, J.; Xu, X.; Pu, C.; Peng, T. Batch image encryption using generated deep features based on stacked autoencoder network. Secur. Commun. Netw. 2017, 2017, 3675459. [Google Scholar] [CrossRef]
  41. Huang, Z.; Tan, X.; Wu, X.; Tan, X.; Fu, J.; Liu, B. Long-term changes, synoptic behaviors, and future projections of large-scale anomalous precipitation events in China detected by a deep learning autoencoder. J. Clim. 2023, 36, 1237–1255. [Google Scholar] [CrossRef]
  42. Ang, R.; Kinouchi, T.; Zhao, W. Sediment load estimation using a novel regionalization sediment-response similarity method for ungauged catchments. J. Hydrol. 2023, 618, 129198. [Google Scholar] [CrossRef]
  43. Li, X.; Lu, R.; Li, G. Different configurations of interannual variability of the Western North Pacific Subtropical High and East Asian Westerly Jet in summer. Adv. Atmos. Sci. 2021, 38, 931–942. [Google Scholar] [CrossRef]
  44. Guan, W.; Hu, H.; Ren, X.; Yang, X.-Q. Subseasonal zonal variability of the western Pacific subtropical high in summer: Climate impacts and underlying mechanisms. Clim. Dyn. 2019, 53, 3325–3344. [Google Scholar] [CrossRef]
  45. Yu, J.; Xue, H.; Song, J. Tropical cyclone potential hazard in Southeast China and its linkage with the East Asian westerly jet. Asia-Pac. J. Atmos. Sci. 2017, 53, 295–304. [Google Scholar] [CrossRef]
  46. Basconcillo, J.; Moon, I.J. Increasing activity of tropical cyclones in East Asia during the mature boreal autumn linked to long-term climate variability. Npj Clim. Atmos. Sci. 2022, 5, 4. [Google Scholar] [CrossRef]
  47. Zhang, Y.; Li, P.; Jin, K. Flood and drought disaster prevention in the Taihu Basin in 2024. China Flood Drought Manag. 2024, 34, 32–34. (In Chinese) [Google Scholar] [CrossRef]
  48. Yan, Y. Analysis of rainstorm characteristics and causes in the Taihu Basin. In Proceedings of the S2 Session: Monitoring 2013, Analysis and Forecasting of Severe Weather, China Meteorological Society, Beijing, China, 3 November 2014; Shanxi Meteorological Decision-Making Service Center: Taiyuan, China, 2014; pp. 2757–2766. (In Chinese). [Google Scholar]
  49. Xie, Y.; Liu, M. Spatiotemporal characteristics and heavy rain frequency analysis of precipitation in the Taihu Basin. China Flood Drought Manag. 2025, 35, 24–30. (In Chinese) [Google Scholar] [CrossRef]
  50. Zhang, K.; Randel, J.W.; Fu, R. Relationships between outgoing longwave radiation and diabatic heating in reanalyses. Clim. Dyn. 2017, 49, 2911–2929. [Google Scholar] [CrossRef]
  51. Xu, T. Influence of spatiotemporal distribution of design storms on flood levels in the Taihu Basin. J. Lake Sci. 2022, 34, 1308–1318. (In Chinese) [Google Scholar]
  52. Meng, L.; Yan, C.; Zhuang, W.; Zhang, W.; Yan, X. Reconstruction of Three-Dimensional Temperature Salinity Fields From Satellite Observations. J. Geophys. Res. Ocean. 2021, 126, 17966. [Google Scholar] [CrossRef]
  53. Nguyen, G.V.; Le, X.-H.; Nguyen Van, L.; May, D.T.T.; Jung, S.; Lee, G. Machine learning approaches for reconstructing gridded precipitation based on multiple source products. J. Hydrol. Reg. Stud. 2023, 48, 101475. [Google Scholar] [CrossRef]
  54. Ge, F.; Zhu, S.; Luo, H.; Zhi, X.; Wang, H. Future changes in precipitation extremes over Southeast Asia: Insights from CMIP6 multi-model ensemble. Environ. Res. Lett. 2021, 16, 024013. [Google Scholar] [CrossRef]
  55. Horton, P.; Schaefli, B.; Kauzlaric, M. Why do we have so many different hydrological models? A review based on the case of Switzerland. WIREs Water 2022, 9, 129187. [Google Scholar] [CrossRef]
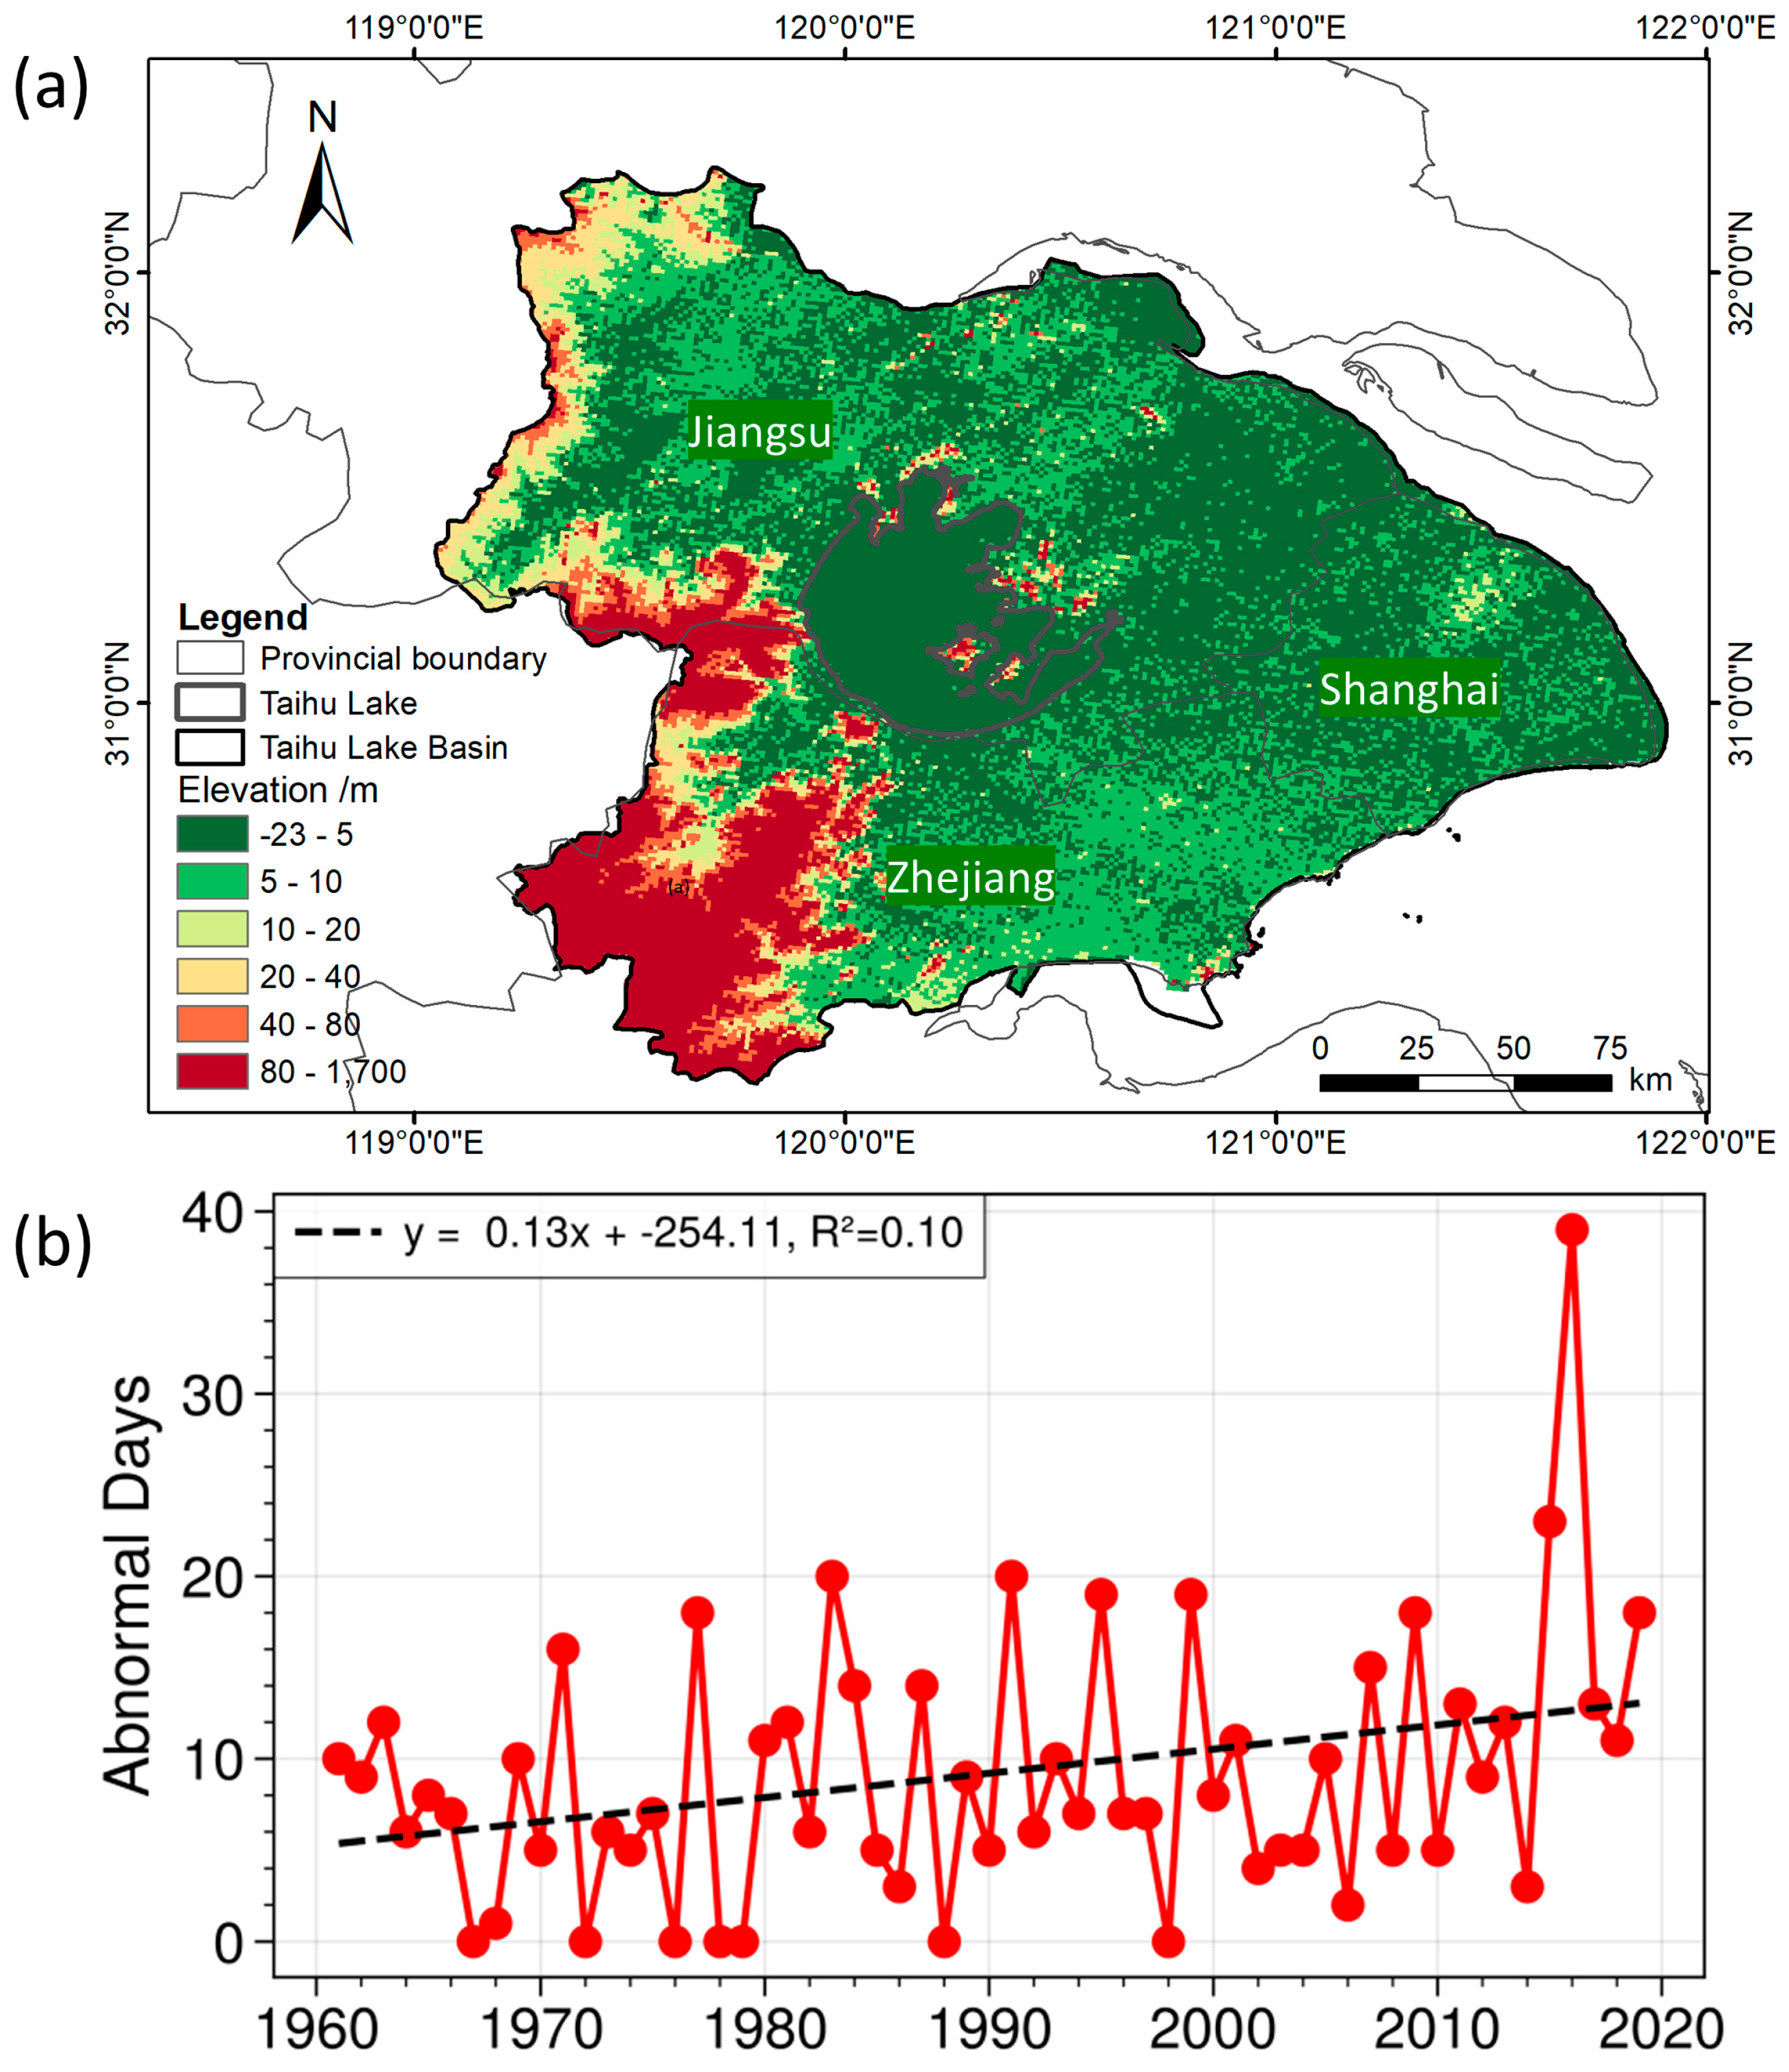
Figure 1. (a) The location of the Taihu Basin and (b) the annual trend of anomalous precipitation days (1961–2019).
Water 17 02442 g001
Figure 2. Architecture of the autoencoder neural network.
Water 17 02442 g002
Figure 3. Spatial classification and frequency distribution of anomalous precipitation patterns in the Taihu Basin.
Water 17 02442 g003
Figure 4. Long-term trends and monthly distributions of anomalous precipitation events in the Taihu Basin (1961–2019). (a) Annual frequency curves for the three precipitation types, with linear trend lines and corresponding p-values indicating statistical significance; (b) temporal distribution of event occurrences by year; (c) monthly histograms showing intra-annual (seasonal) frequency patterns for each type.
Water 17 02442 g004
Figure 5. Composite anomalies of 500 hPa GPH (shading) and 850 hPa wind field (vectors), averaged over days when each type of anomalous precipitation event occurred: (a) Center-type, (b) South-type, and (c) North-type. Shaded and vector areas indicate anomalies significant at the 0.95 confidence level. Gray contours show the climatological mean GPH, and the green line marks the 5880 m contour.
Water 17 02442 g005
Figure 6. Composite anomalies of VIMD (shading) and integrated water vapor flux (vectors), averaged over days when each type of anomalous precipitation event occurred: (a) Center-type, (b) South-type, and (c) North-type. Positive (negative) VIMD indicates moisture divergence (convergence). Shaded and vector anomalies are significant at the 0.95 confidence level.
Water 17 02442 g006
Figure 7. Composite anomalies of SST (shading) and OLR (contours), averaged over days when each type of anomalous precipitation event occurred: (a) Center-type, (b) South-type, and (c) North-type. SST anomalies significant at the 0.95 confidence level are shaded. Positive OLR anomalies (+5, +10, and +20 W/m2) are shown with black dashed contours and negative anomalies (−5, −10, and −20 W/m2) with solid purple contours.
Water 17 02442 g007
Figure 8. Composite anomalies of U200, averaged over days when each type of anomalous precipitation event occurred: (a) Center-type, (b) South-type, and (c) North-type. Shaded areas indicate wind speed anomalies significant at the 0.95 confidence level, highlighting the meridional displacement of the EAJ.
Water 17 02442 g008
Disclaimer/Publisher’s Note: The statements, opinions and data contained in all publications are solely those of the individual author(s) and contributor(s) and not of MDPI and/or the editor(s). MDPI and/or the editor(s) disclaim responsibility for any injury to people or property resulting from any ideas, methods, instructions or products referred to in the content.